Embed Size (px)
DESCRIPTION
draft
Citation preview
PRELIMINARY CRYSTAL INSTRUMENTS VDC SYSTEM USER MANUAL
Vibration Data Collector
User’s Manual for CoCo-80
Preliminary Version 0.94
5/1/2009
Crystal Instruments Corporation
4633 Old Ironsides Drive, Suite 304
Santa Clara, CA 95054, USA

PRELIMINARY CRYSTAL INSTRUMENTS VDC SYSTEM USER MANUAL
This page is left blank intentionally
1 CRYSTAL INSTRUMENTS VDC SYSTEM USER MANUAL
Table of Contents Introduction ........................................................................................................................................................... 1
CoCo Vibration Data Collector ............................................................................................................ 1 On-Line Support ................................................................................................................................. 3 Limited Warranty & Limitation of Liability ............................................................................................. 4 Safety Information: Read First ............................................................................................................ 5
Installation of Engineering Data Management Software ...................................................................................... 7 What You Will Need ............................................................................................................................ 7 Software Included on Installation CD .................................................................................................. 7 EDM Software CD .............................................................................................................................. 7 MySQL Database Server Installation................................................................................................... 8 EDM Software Installation Wizard ..................................................................................................... 13 Where is My License Key? ............................................................................................................... 13 USB Device Driver ............................................................................................................................ 14 EDM Software Update ...................................................................................................................... 15 EDM Software Licensing Keys .......................................................................................................... 15
General Theory of Operation .............................................................................................................................. 16 Typical Workflow for Vibration Data Collection .................................................................................. 17 Create/Maintain Database ................................................................................................................ 17 Data Collection Route ....................................................................................................................... 17 Upload Route from PC to CoCo ........................................................................................................ 18 Make Measurements ........................................................................................................................ 18 Download Data from CoCo to PC ..................................................................................................... 19 Analyze, Report and Archive Data .................................................................................................... 19 Types of Measurements ................................................................................................................... 19 Readings .......................................................................................................................................... 20 Waveforms ....................................................................................................................................... 20 Spectra............................................................................................................................................. 20 Demodulated Waveforms.................................................................................................................. 21 Demodulated Spectra ....................................................................................................................... 21 Tachometer ...................................................................................................................................... 21
EDM User Interface in VDC Mode ...................................................................................................................... 22 Page Views ...................................................................................................................................... 22 Toolbar Ribbons ............................................................................................................................... 23 Customizing the Toolbar Ribbon ....................................................................................................... 23 Home Page ...................................................................................................................................... 24 Start Button ...................................................................................................................................... 25 Home Page Ribbon .......................................................................................................................... 27 VDC Ribbon ..................................................................................................................................... 27 Database Toolbar ............................................................................................................................. 28 VDC Item Backup Options ................................................................................................................ 31 Devices Toolbar ................................................................................................................................ 33 Library Toolbar .................................................................................................................................. 33 Sensor Set Command ...................................................................................................................... 37 Alarm Toolbar ................................................................................................................................... 39 Plot Toolbar ...................................................................................................................................... 39 Report Toolbar .................................................................................................................................. 39 System Settings Toolbar ................................................................................................................... 40 CoCo Recovery ................................................................................................................................ 45 License Key Toolbar ......................................................................................................................... 46
2 CRYSTAL INSTRUMENTS VDC SYSTEM USER MANUAL
Setting Up a Route ........................................................................................................................... 46 Database Management .................................................................................................................... 47 Creating Database Items: Factories, Machines, Points, Entries and Routes ...................................... 48 Adding Factory Notes ....................................................................................................................... 51 Adding Machine Entries .................................................................................................................... 53 Adding Measurement Points ............................................................................................................. 54 Adding Measurement Entries ............................................................................................................ 55 Expected RPM ................................................................................................................................. 55 Placement ........................................................................................................................................ 57 Parameter Sets ................................................................................................................................ 58 Sensor Set ....................................................................................................................................... 59 Tacho Set ......................................................................................................................................... 60 Tag ................................................................................................................................................... 61 Adding Routes .................................................................................................................................. 62 Downloading Data ............................................................................................................................ 63 Download ......................................................................................................................................... 63
VDC Home Page ................................................................................................................................................ 64 Analysis Pane................................................................................................................................... 64 Plots: Waveforms, Spectrums, Trends .............................................................................................. 65
Upload Database To CoCo ................................................................................................................................. 70 Upload and Download Options ......................................................................................................... 72 Replace Mode .................................................................................................................................. 72 Combine Mode ................................................................................................................................. 73 Download from VDC to EDM with New Machine Added .................................................................... 74
Report Ribbon ..................................................................................................................................................... 75 Report Options ................................................................................................................................. 76 Reports ............................................................................................................................................ 76 Templates ......................................................................................................................................... 77 Preview ............................................................................................................................................ 77 HTML View ....................................................................................................................................... 77 Export To: ......................................................................................................................................... 77 E-Mail As: ......................................................................................................................................... 77 Style and About Tabs ........................................................................................................................ 78 Style Tab .......................................................................................................................................... 78 About Tab ......................................................................................................................................... 79
How to Set Baselines, Alarms and Trending....................................................................................................... 79 Setting a Baseline Measurement ...................................................................................................... 80 How to Create Alarms ....................................................................................................................... 82 Setting Alarm Levels ......................................................................................................................... 83 Setting Alarms Based on ISO Standards ........................................................................................... 89 Display Alarms for Readings ............................................................................................................. 97 Display Alarms for Spectra and Waveforms ...................................................................................... 98 Creating Trends and Alarms............................................................................................................ 102
CoCo-80 User Interface .................................................................................................................................... 108 CoCo User Interface Front Panel .................................................................................................... 108 Summary of Buttons ........................................................................................................................110 Status Bar .......................................................................................................................................112 Menu Navigation .............................................................................................................................112 Startup ............................................................................................................................................112 Power Down ....................................................................................................................................113 Arrow Buttons ..................................................................................................................................113
3 CRYSTAL INSTRUMENTS VDC SYSTEM USER MANUAL
Enter Button ....................................................................................................................................113 Shift Button ......................................................................................................................................113 Back/Forward Button .......................................................................................................................114 Soft Buttons .....................................................................................................................................114 Text and Number Keypad ................................................................................................................114 Text Soft Buttons .............................................................................................................................115 Analysis Button ................................................................................................................................115 Display Button ................................................................................................................................ 120 Display Preference ......................................................................................................................... 121 Vibration Data Collector Setup Button ............................................................................................. 130 File Button ...................................................................................................................................... 136 Rec./Stop Button ............................................................................................................................ 137 Save Button .................................................................................................................................... 137
Setting up the Hardware ................................................................................................................................... 138 Connecting Sensors ....................................................................................................................... 138 Single Channel Operation ............................................................................................................... 139 Tachometers ................................................................................................................................... 139 Single Channel with Tachometer Operation ..................................................................................... 139 Tri-axis Accelerometer with Tachometer Operation .......................................................................... 139
Making Measurements with the CoCo VDC ..................................................................................................... 140 CoCo Startup and Shutdown ............................................................................................................................ 140
Power on and off the CoCo ............................................................................................................. 140 System Reset ................................................................................................................................. 141 Reset the system by Pushing the Reset Pin .................................................................................... 141 Reset the system using the Power Button ....................................................................................... 141 CoCo Software Disaster Recovery through EDM ............................................................................ 141 Keypad Lock .................................................................................................................................. 141
CoCo Input Connections ................................................................................................................................... 142 System Calibration ......................................................................................................................... 142 DC-Differential ................................................................................................................................ 142 DC-Single End................................................................................................................................ 142 AC-Differential ................................................................................................................................ 143 AC-Single End ................................................................................................................................ 143 IEPE ............................................................................................................................................... 143
CoCo Output Connections ................................................................................................................................ 143 CoCo Peripherals and Accessories .................................................................................................................. 143
Ethernet ......................................................................................................................................... 145 USB Ports ...................................................................................................................................... 146 Mouse Support ............................................................................................................................... 146 SD Card Interface ........................................................................................................................... 147 Audio Devices ................................................................................................................................ 147 Battery............................................................................................................................................ 147
CoCo On-Line Updates .................................................................................................................................... 148 Connection Methods ....................................................................................................................... 149 USB Connection ............................................................................................................................. 151 Cross-Over Ethernet Cable Connection .......................................................................................... 152 Wired Local Area Network Connection ............................................................................................ 154 Network Connection Diagnosis ....................................................................................................... 155 Diagnosis from the CoCo side ........................................................................................................ 156 Advanced Audio Functions ............................................................................................................. 156 Hardware Audio Peripherals ........................................................................................................... 157
4 CRYSTAL INSTRUMENTS VDC SYSTEM USER MANUAL
Audio Functions .............................................................................................................................. 158 Headphone Listening ...................................................................................................................... 159 Record Voice Annotations ............................................................................................................... 160 Playback the Voice Annotations on CoCo ....................................................................................... 160
Dynamic Balancing Program Option ................................................................................................................ 162 Field Dynamic Balancing ................................................................................................................ 162 Rotor Balancing Measurement Setup .............................................................................................. 164 Rotor Balancing Program Step-by-Step .......................................................................................... 167 Preparation For Rotor Balancing Project ......................................................................................... 167 Parameter setup ............................................................................................................................. 168 Tachometer Setup .......................................................................................................................... 169 Advanced Parameter Setup ............................................................................................................ 169 Original Run ................................................................................................................................... 170 Trial Weight: Plane 1....................................................................................................................... 171 Trial Weight: Run 1 ......................................................................................................................... 172 Trial Weight: Plane 2....................................................................................................................... 172 Calculate Correction Weight Mass And Phase ................................................................................ 173 Run After Adding Correction Weight ................................................................................................ 174 Trim Run ........................................................................................................................................ 175 End run .......................................................................................................................................... 175 Rotor Balancing Tools ..................................................................................................................... 175 Trial Weight Calculation Tool ........................................................................................................... 175 Weight Splitting Tool ....................................................................................................................... 176 Weight Combination Tool ................................................................................................................ 177 Appendix: Influence Coefficient Method of Dynamic Balancing ........................................................ 177
Appendix 1: Dynamic Signal Analysis in Vibration Data Collector .................................................................... 179 General Theory of Spectral Analysis ............................................................................................... 179 Time Domain Waveform ................................................................................................................. 179 The Fourier Transform .................................................................................................................... 181 Spectrum ........................................................................................................................................ 182 Spectrum Type ............................................................................................................................... 184 Data Window Selection ................................................................................................................... 186 Leakage Effect ............................................................................................................................... 186 Averaging Techniques..................................................................................................................... 189 Linear Averaging, Exponential Averaging, and Peak-Hold ............................................................... 189 Overlap Processing ........................................................................................................................ 190 Built-In Digital Integration And Filtering ........................................................................................... 191 Introduction to Digital Integration..................................................................................................... 191 Sensor Considerations ................................................................................................................... 193 Calculation Errors in Digital Integration ........................................................................................... 193 Digital High-Pass Filter ................................................................................................................... 195 Readings in a Vibration Data Collector ............................................................................................ 196 Readings ........................................................................................................................................ 196 Peak and Peak-Peak ...................................................................................................................... 196 Overall RMS ................................................................................................................................... 197 True RMS ....................................................................................................................................... 197 Demodulation Spectrum ................................................................................................................. 198 A Bearing Detection Example of Demodulation ............................................................................... 200
Appendix 2: Using Accelerometers and Tachometer ........................................................................................ 204 Accelerometers for Industrial Applications ....................................................................................... 204 Mounting Accelerometers ............................................................................................................... 204

5 CRYSTAL INSTRUMENTS VDC SYSTEM USER MANUAL
Choose the Sensitivity .................................................................................................................... 205 Integral Electronics Piezoelectric (IEPE) Sensor ............................................................................. 206 Tachometer .................................................................................................................................... 206 Typical Connections of CoCo with Accelerometers and Tachometer ................................................ 207 Case 1: Single Channel Vibration Measurement ............................................................................. 207 Case 2: Tri-axis Vibration Measurement .......................................................................................... 208 Case 3: Single Channel Vibration Measurement + Tacho ................................................................ 208
6 CRYSTAL INSTRUMENTS VDC SYSTEM USER MANUAL
Table 1: Alarm Types ............................................................................................................................................ 82 Table 2: CoCo Function Buttons ......................................................................................................................... 112 Table 3: Peripherals and Accessories for CoCo ................................................................................................... 145 Table 4: Connection Method and Configurations for CoCo and Host PC ............................................................. 151
Figure 1: CoCo Hardware ....................................................................................................................................... 1 Figure 2: Crystal Instruments CoCo Support Website ............................................................................................. 4 Figure 3: Welcome Screen for EDM Installation CD. ............................................................................................... 8 Figure 4: EDM Software Installation Wizard ......................................................................................................... 13 Figure 5: Email Shipping Confirmation ................................................................................................................. 14 Figure 6: Example of License Key .......................................................................................................................... 14 Figure 7: EDM Auto Update Screen ...................................................................................................................... 15 Figure 8: The CoCo interfaces with EDM software ................................................................................................ 16 Figure 9: Typical route hierarchy. ......................................................................................................................... 18 Figure 10: EDM in VDC Mode, Signal Analysis Display .......................................................................................... 19 Figure 11: Reading display. ................................................................................................................................... 20 Figure 12: Time Waveform ................................................................................................................................... 20 Figure 13: FFT Spectrum ....................................................................................................................................... 21 Figure 14: EDM User Interface view for VDC mode .............................................................................................. 22 Figure 15: Page tabs can be used to change between the VDC and Report Pages ................................................. 23 Figure 16: Analysis Page Ribbon and Pop-Up Menu ............................................................................................. 23 Figure 17: Quick Access Toolbar with several commands added .......................................................................... 24 Figure 18: Customize Quick Access Toolbar Dialog ............................................................................................... 24 Figure 19: EDM Home Page .................................................................................................................................. 25 Figure 20: Start Button ......................................................................................................................................... 26 Figure 21: Remote Display ................................................................................................................................... 27 Figure 22: Home Page VDC Ribbon ....................................................................................................................... 27 Figure 23: Database Toolbar ................................................................................................................................. 28 Figure 24: Database Access Wizard, switch database ........................................................................................... 28 Figure 25: Database Access Wizard, Create a new database................................................................................. 29 Figure 26: Advanced tab for the Database Access Wizard .................................................................................... 29 Figure 27: Help tab for the Database Access Wizard............................................................................................. 30 Figure 28: Database Management screen ............................................................................................................ 31 Figure 29: Devices Toolbar ................................................................................................................................... 33 Figure 30: Library Toolbar .................................................................................................................................... 33 Figure 31: Parameter Set List Dialog ..................................................................................................................... 34 Figure 32: Parameter Set Dialog ........................................................................................................................... 34 Figure 33: Tacho Parameter Set List dialog ........................................................................................................... 36 Figure 34: Tacho Parameter Set Dialog ................................................................................................................. 36 Figure 35: Sensor Set Manager............................................................................................................................. 38 Figure 36: Sensor Parameter dialog ...................................................................................................................... 38 Figure 37: Alarm Toolbar ...................................................................................................................................... 39 Figure 38: Plot Toolbar ......................................................................................................................................... 39 Figure 39: Report Toolbar ..................................................................................................................................... 40 Figure 40: System Settings Toobar ........................................................................................................................ 40 Figure 41: EDM Settings Screen ............................................................................................................................ 40 Figure 42: Signal Export Dialog ............................................................................................................................. 42 Figure 43: MAT-File Preference Dialog ................................................................................................................. 42 Figure 44: Default Display Format Dialog ............................................................................................................. 43
7 CRYSTAL INSTRUMENTS VDC SYSTEM USER MANUAL
Figure 45: Local File Type Filter dialog box ........................................................................................................... 44 Figure 46: Connection Dialog box ......................................................................................................................... 44 Figure 47. CoCo Recovery. .................................................................................................................................... 45 Figure 48: VDC Engineering Units Dialog .............................................................................................................. 46 Figure 49: License Key Toolbar ............................................................................................................................. 46 Figure 50: Database Access Wizard ...................................................................................................................... 47 Figure 51: Database Access Wizard creating new database .................................................................................. 47 Figure 52: Database Explorer ............................................................................................................................... 49 Figure 53. Database Explorer buttons. ................................................................................................................. 49 Figure 54: Database with 2 Factories and 4 Machines .......................................................................................... 50 Figure 55: Database Explorer popup menu. ......................................................................................................... 51 Figure 56: Factory Information dialog .................................................................................................................. 52 Figure 57: Factory Notes dialog ............................................................................................................................ 53 Figure 58: Machine Note dialog ........................................................................................................................... 54 Figure 59: Measurement Point Parameter dialog ................................................................................................. 55 Figure 60: Measurement Entry Wizard, Measurement Pattern dialog .................................................................. 56 Figure 61. Measurement Entry Wizard, Parameter Set dialog .............................................................................. 56 Figure 62: Measurement Entry Wizard, Sensor Set dialog .................................................................................... 57 Figure 63: Measurement Entry Wizard, Name and Description dialog ................................................................. 58 Figure 64: Parameter Set list ................................................................................................................................ 59 Figure 65: Sensor Set list ...................................................................................................................................... 60 Figure 66: Tachometer Set list .............................................................................................................................. 61 Figure 67: Tag Manager ........................................................................................................................................ 62 Figure 68: Edit Route dialog ................................................................................................................................. 63 Figure 69: Vibration Data Collector Synchronization Wizard, downloading data .................................................. 64 Figure 70: Trend Plot Example .............................................................................................................................. 65 Figure 71: Peak Value Alarm display example ...................................................................................................... 66 Figure 72: Display of Vibration Signals of Points in Alarm .................................................................................... 67 Figure 73: Trend of Readings with Alarm Bands ................................................................................................... 68 Figure 74: Peak vibration alarm bands ................................................................................................................. 69 Figure 75: Analysis Pane with 2 x 2 Display .......................................................................................................... 70 Figure 76: VDC Synchronization Wizard................................................................................................................ 71 Figure 77: VDC Synchronization Wizard, select route ........................................................................................... 71 Figure 78: VDC Synchronization Wizard, disconnect ............................................................................................. 72 Figure 79: EDM Upload in Replace Mode ............................................................................................................. 73 Figure 80: EDM Upload in Combine Mode ........................................................................................................... 74 Figure 81: Download Database from VDC with New Machine Added ................................................................... 75 Figure 82: VDC Toolbar Ribbon ............................................................................................................................. 75 Figure 83: Report Ribbon ..................................................................................................................................... 76 Figure 84: EDM Report Template Setting .............................................................................................................. 77 Figure 85: Default Signal Analysis Report in PDF Format ...................................................................................... 78 Figure 86. Style Tab. ............................................................................................................................................. 79 Figure 87. About Box displays software version and contact information. ........................................................... 79 Figure 88: Selecting Spectrum Measurement for Baseline ................................................................................... 80 Figure 89: Selecting Waveform for Baseline ......................................................................................................... 81 Figure 90: Setting a Reading as a Baseline ............................................................................................................ 82 Figure 91: Menu Options for Creating Alarms ...................................................................................................... 83 Figure 92: Reading Alarm Dialog Box ................................................................................................................... 84 Figure 93: Reading Alarm Dialog Box for Tri Axis Sensor Entry ............................................................................. 85 Figure 94: Waveform Alarm Dialog Box ................................................................................................................ 86
8 CRYSTAL INSTRUMENTS VDC SYSTEM USER MANUAL
Figure 95: Waveform Alarm Dialog Box for Triaxial Sensor ................................................................................... 87 Figure 96: Spectrum Band Alarm Dialog Box ........................................................................................................ 88 Figure 97: ISO Standards Supported by EDM for Alarms ...................................................................................... 90 Figure 98: ISO Alarm Wizard, Select Standard ...................................................................................................... 91 Figure 99: Selecting the Class of machinery for ISO 2372 ..................................................................................... 91 Figure 100: Alarm Level Selection ........................................................................................................................ 92 Figure 101: ISO 10816 Machinery Classifications .................................................................................................. 93 Figure 102: Select Shaft Rotational Speed ............................................................................................................ 94 Figure 103: Entering Machinery Classification Information .................................................................................. 95 Figure 104: ISO 10816-4 Alarm Wizard Shaft Speed ............................................................................................. 96 Figure 105: ISO Alarms for Group 4 ...................................................................................................................... 96 Figure 106: ISO Alarm Creation Choices ............................................................................................................... 97 Figure 107: Right Click on Reading to Display Alarms ........................................................................................... 98 Figure 108: Alarm Levels for Readings Displayed.................................................................................................. 98 Figure 109: Dragging and Dropping Alarms into Recording Panes ........................................................................ 99 Figure 110: Display of Spectrum and Waveform with Alarms ............................................................................. 100 Figure 111: Adjusting Band Alarm Levels Graphically ......................................................................................... 101 Figure 112: Adjusting Alarm Frequency Band Graphically .................................................................................. 102 Figure 113: Creating a Trend Chart ..................................................................................................................... 103 Figure 114: Create a Trend Chart Based on Readings .......................................................................................... 104 Figure 115: Create a Trend Chart Based on Frequency Band............................................................................... 105 Figure 116: Trend Alarm Adjustment ................................................................................................................. 106 Figure 117: Multiple Trend Plot Display ............................................................................................................. 107 Figure 118: Right Click on Pane for Menu Options ............................................................................................. 107 Figure 119: CoCo Front Layout ........................................................................................................................... 109 Figure 120: Button layout on the CoCo front panel. ........................................................................................... 109 Figure 121: CoCo display Status Bar. ................................................................................................................... 112 Figure 122: Startup screen is shown during startup sequence ............................................................................ 113 Figure 123: Soft Buttons change function depending on the current screen. ..................................................... 114 Figure 124: Text and numbers can be entered in the input screen...................................................................... 115 Figure 125: VDC Onsite Measurement function choices ..................................................................................... 116 Figure 126: Waveform & Spectrum .................................................................................................................... 116 Figure 127: Using Enter Button to Navigate CoCo Display and Adjust Parameters .............................................. 117 Figure 128: Editing RPM Settings in CoCo ........................................................................................................... 117 Figure 129: Highlighting Display Preferences for Engineering Units .................................................................... 118 Figure 130: Adjusting Display Preferences .......................................................................................................... 118 Figure 131: Window and Trace Menu ................................................................................................................. 119 Figure 132: VDC Analysis Parameter setup ......................................................................................................... 119 Figure 133: VDC Analysis Parameter options ...................................................................................................... 120 Figure 134: VDC Analysis Parameter RPM .......................................................................................................... 120 Figure 135: Display Preference Menu ................................................................................................................. 121 Figure 136: VDC Analysis Parameters Input Channel & Sensor ........................................................................... 122 Figure 137: VDC Analysis Input Channel and Sensor Setup ................................................................................. 123 Figure 138: VDC Analysis Input Channel Sensor Setup ....................................................................................... 123 Figure 139: Input Channel & Sensor Setup, adjusting sensitivity in CoCo ........................................................... 124 Figure 140: Input Status Screen .......................................................................................................................... 124 Figure 141: Set sensor parameter for a channel ................................................................................................. 125 Figure 142: Select measurement quantity for a channel .................................................................................... 125 Figure 143: Output Channel screen. ................................................................................................................... 126 Figure 144: Arbitrary Waveform Setup. .............................................................................................................. 126
9 CRYSTAL INSTRUMENTS VDC SYSTEM USER MANUAL
Figure 145: Route Data Collection, signal display parameters options window .................................................. 127 Figure 146: Cursors can be added to a trace ....................................................................................................... 128 Figure 147: Cursor Added to Trace ..................................................................................................................... 128 Figure 148: Cursor setup, Move Cursor Display Location .................................................................................... 129 Figure 149: Multiple Cursors, Calculation of RMS value ..................................................................................... 129 Figure 150: Onsite Measurement, Start Meas. ................................................................................................... 130 Figure 151: Onsite Measurement, Save .............................................................................................................. 130 Figure 152: VDC Main Setup............................................................................................................................... 131 Figure 153: VDC System Setup ........................................................................................................................... 131 Figure 154: About CoCo screen .......................................................................................................................... 132 Figure 155: Software Options ............................................................................................................................. 132 Figure 156: Audio Settings including Voice Annotation ...................................................................................... 133 Figure 157: Memory and DSP CPU usage ........................................................................................................... 133 Figure 158: CoCo Network Connection ............................................................................................................... 134 Figure 159: Power Status Screen ........................................................................................................................ 134 Figure 160: Digit Notation Settings..................................................................................................................... 135 Figure 161: Theme Settings: Black or White Style .............................................................................................. 135 Figure 162: Start Page, VDC or DSA Mode .......................................................................................................... 136 Figure 163: VDC File-Factory 1............................................................................................................................ 136 Figure 164: CoCo Signal View ............................................................................................................................. 137 Figure 165: Onsite Measurement, Save and Select Entry ................................................................................... 138 Figure 166: VDC Main Setup screen ................................................................................................................... 139 Figure 167: Two LEDs showing power and recharge status ................................................................................. 141 Figure 168: Reset pin hole can be used to shutdown the CoCo........................................................................... 141 Figure 169: BNC input connectors, output and ground connector. ..................................................................... 142 Figure 170: CoCo Peripherals and Accessories .................................................................................................... 144 Figure 171: CoCo peripheral connections ........................................................................................................... 145 Figure 172: Ethernet connection ........................................................................................................................ 146 Figure 173: CoCo has two USB ports: client for PC connection and host for peripheral connection .................... 146 Figure 174: CoCo Battery.................................................................................................................................... 148 Figure 175: Network connection for CoCo update .............................................................................................. 148 Figure 176: On-line update detection status screen ........................................................................................... 149 Figure 177: Device Search and Connection window ........................................................................................... 150 Figure 178: Connection Wizard .......................................................................................................................... 152 Figure 179: USB Connection Wizard ................................................................................................................... 152 Figure 180: Cross-Over Ethernet Cable Connection Step 1 ................................................................................. 153 Figure 181: Cross-Over Ethernet Cable Connection Step 2 ................................................................................. 153 Figure 182: Cross-Over Ethernet Cable Connection Step 3 ................................................................................. 154 Figure 183: Wired LAN Connection Wizard Step 1 .............................................................................................. 154 Figure 184: Wired LAN Connection Wizard Step 2 .............................................................................................. 155 Figure 185: Wired LAN Connection Wizard Step 3 .............................................................................................. 155 Figure 186: Ethernet connection status screen ................................................................................................... 156 Figure 187: Built-in Speaker ............................................................................................................................... 157 Figure 188: An example of headphone ............................................................................................................... 158 Figure 189: Connectors ...................................................................................................................................... 158 Figure 190: Microphone with push button (part # CoCo-A12) ............................................................................ 158 Figure 191: Audio Setting page .......................................................................................................................... 159 Figure 192: Select the Channel for Headphone Listening.................................................................................... 160 Figure 193: Monitor the volume of the microphone input ................................................................................. 160 Figure 194: Play back voice annotations from the File View ............................................................................... 161
10 CRYSTAL INSTRUMENTS VDC SYSTEM USER MANUAL
Figure 195: Play all annotations using Next and Previous buttons...................................................................... 161 Figure 196: Illustration of Static and Force Couple Unbalance ............................................................................ 162 Figure 197: Two Plane Balancing Setup on Rotor Kit .......................................................................................... 163 Figure 198: Dynamic Balancing Flow Chart......................................................................................................... 164 Figure 199: Input Channel & Sensor icon............................................................................................................ 165 Figure 200: Input Channel Information .............................................................................................................. 166 Figure 201: Input Channel Setup ........................................................................................................................ 166 Figure 202: Input Channel Sensor Setup............................................................................................................. 166 Figure 203: Onsite Measurement/Rotor Balancing Option ................................................................................. 167 Figure 204: Rotor Balancing Project Screen ........................................................................................................ 167 Figure 205: Rotor Balancing Parameter Setup Screen ......................................................................................... 168 Figure 206: Balancing Tachometer Setup............................................................................................................ 169 Figure 207: Balancing Display Preference Screen ............................................................................................... 170 Figure 208: Balancing Program Original Run Display .......................................................................................... 171 Figure 209: Balancing Trial Weight Plane 1 ......................................................................................................... 172 Figure 210: Trial Weight Run 1 Results ............................................................................................................... 172 Figure 211: Balancing Trial Weight Plane 2 ......................................................................................................... 173 Figure 212: Trial Weight Run 2 Results ............................................................................................................... 173 Figure 213: Correction Weight Displays .............................................................................................................. 174 Figure 214: Balancing Correction Run Display .................................................................................................... 174 Figure 215: Balancing Project Summary of Results ............................................................................................. 175 Figure 216: Balancing Trial Weight Tool .............................................................................................................. 176 Figure 217: Balancing Weight Splitting Tool........................................................................................................ 177 Figure 218: Balancing Weight Combining Tool .................................................................................................... 177 Figure 219: Time Domain Waveform .................................................................................................................. 180 Figure 220: Parameter Setup in CoCo ................................................................................................................. 180 Figure 221: Display Preference Setup ................................................................................................................. 184 Figure 222: Time Domain Waveform in CoCo ..................................................................................................... 184 Figure 223: FFT Spectrum in CoCo, in/s Peak ...................................................................................................... 185 Figure 224: FFT Spectrum in CoCo, in/s RMS ...................................................................................................... 185 Figure 225. Illustration of a non-periodic signal resulting from sampling ........................................................... 187 Figure 226. Sine spectrum with no leakage. ....................................................................................................... 188 Figure 227. Sine spectrum with significant leakage. ........................................................................................... 188 Figure 228. Illustration of overlap processing. .................................................................................................... 191 Figure 229: Signal Processing Sequence in CoCo ................................................................................................ 192 Figure 230. A 1 kHz sine wave sampled at 8 kHz (top) and also sampled at 5.12 kHz (bottom). .......................... 194 Figure 231. A small error in acceleration results in a DC offset in velocity and a huge drift in displacement. ..... 195 Figure 232: CoCo Input Channel Setup Table ...................................................................................................... 195 Figure 233: Onsite Measurement Display ........................................................................................................... 196 Figure 234: Illustration of Time Domain Peak, Peak-Peak................................................................................... 196 Figure 235: CoCo Display, Setting Fmax .............................................................................................................. 198 Figure 236: Demodulation Process Flow Chart ................................................................................................... 199 Figure 237: Acceleration Time Waveform with Fault .......................................................................................... 199 Figure 238: Acceleration Time Waveform after High Pass Filter ......................................................................... 199 Figure 239: Signal after Enveloping .................................................................................................................... 200 Figure 240: Demodulated Spectrum ................................................................................................................... 200 Figure 241: CH1 Time Waveform and FFT with slight bearing defect .................................................................. 201 Figure 242: CH1 Time Waveform and Demodulation Spectrum with slight bearing defect ................................. 202 Figure 243: CH1 Time Waveform and Demodulation Spectrum with slightly deteriorated bearing .................... 202 Figure 244: CH1 Time Waveform and FFT Spectrum with deteriorated bearing .................................................. 203

11 CRYSTAL INSTRUMENTS VDC SYSTEM USER MANUAL
Figure 245: Frequency Response of a Typical Accelerometer ............................................................................. 205 Figure 246: Accelerometer Mounting vs Maximum Frequency Response ........................................................... 205 Figure 247: Monarch PLT200 Tachometer ........................................................................................................... 207 Figure 248: Connecting Channel 1 to Accelerometer .......................................................................................... 207 Figure 249: Connecting Tri-axis Accelerometer................................................................................................... 208 Figure 250: Connecting Tachometer and Accelerometer .................................................................................... 208 Figure 251: Connecting Tachometer and Tri-axis Accelerometer ........................................................................ 209
1 CRYSTAL INSTRUMENTS VDC SYSTEM USER MANUAL
Introduction
Crystal Instruments’ system consists of the CoCo Vibration Data Collector (VDC) and its
Engineering Data Management (EDM) software, designed specifically for use in industrial
and manufacturing plants to acquire, analyze and maintain data related to improving and
optimizing the reliability and performance of rotating machinery.
CoCo Vibration Data Collector
CoCo-80 (CoCo) is a handheld data recorder, dynamic signal analyzer and vibration data
collector that is ideal for a wide range of industries including machine conditioning monitoring,
automotive, aviation, aerospace, electronics and military applications that demand easy,
quick and accurate data recording and real-time processing in the field. CoCo is a low-cost,
light-weight, battery powered handheld system with unparalleled performance and accuracy.
The user interface of CoCo is specifically designed for easy and simple operation while it
maintains the capability of providing a wide variety of analysis functions.
The CoCo hardware platform supports two different software working modes: Dynamic Signal
Analyzer (DSA) and Vibration Data Collector (VDC). Each working mode has its own user
interface and operation navigation structure. The DSA working mode is designed for
mechanical structure analysis, testing and optimization, for electrical, geophysics and a wide
range of applications. The VDC mode is dedicated to machine vibration data collection,
analysis and trending. The user will select one of the working modes to execute. This manual
will focus on the CoCo as a VDC in conjunction with EDM in VDC mode.
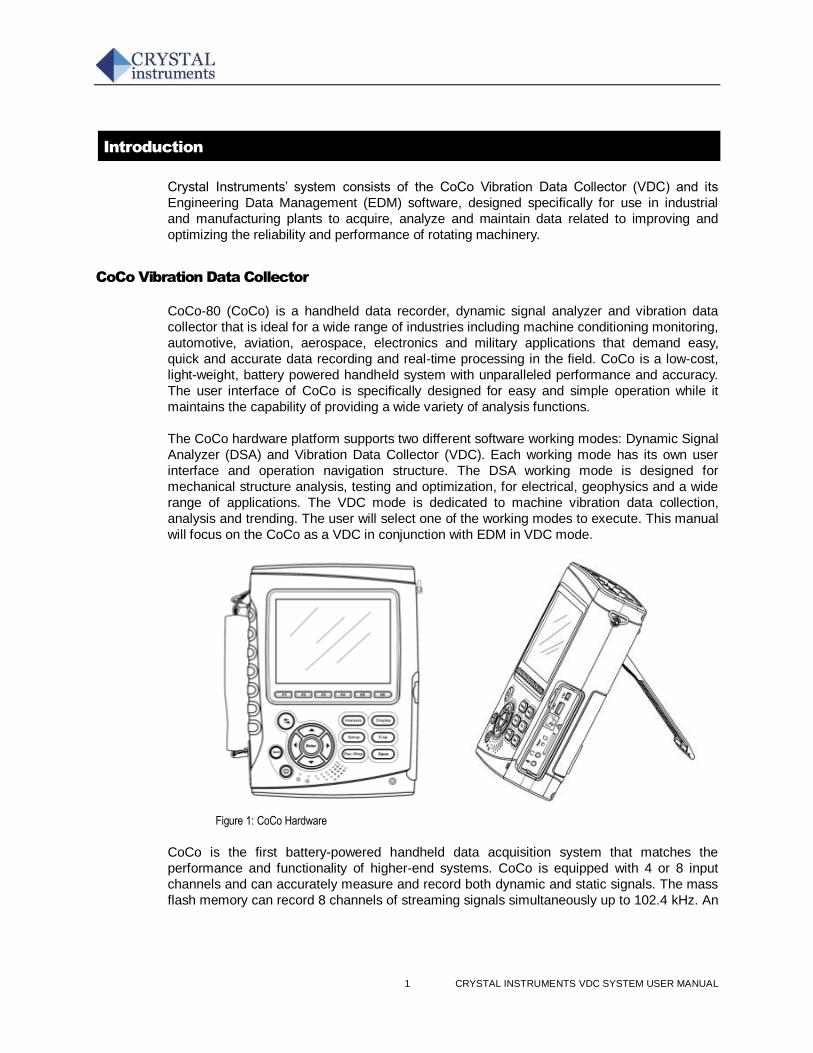
Figure 1: CoCo Hardware
CoCo is the first battery-powered handheld data acquisition system that matches the
performance and functionality of higher-end systems. CoCo is equipped with 4 or 8 input
channels and can accurately measure and record both dynamic and static signals. The mass
flash memory can record 8 channels of streaming signals simultaneously up to 102.4 kHz. An
2 CRYSTAL INSTRUMENTS VDC SYSTEM USER MANUAL
embedded signal source channel provides various signal output waveforms that are
synchronized with the input sampling rate.
CoCo hardware uses dual CPU architecture. An XScale CPU handles the user interface,
project configuration, power management, network communication as well as all the
peripherals. A high-speed floating point DSP manages the data input/output and real-time
processing. CoCo is also configured with large RAM and NAND flash memory for mass data
storage. Special thermal and low power design eliminates the need for a cooling fan and
increases the battery operating time. Proprietary hardware technology delivers more than 130
dB dynamic range. The extremely high dynamic range eliminates the need for multiple front
end gain settings.
The CoCo can also be operated from a DC power source (which will also simultaneously
charge the battery). This can be achieved with either the CoCo AC-DC Adapter (P/N 40-115)
or an Automotive Cigarette Lighter Adapter.
Revolutionary 24-bit A/D converters, digital technology and unique hardware designed for
CoCo offers more than 130 dB dynamic range, as much as 10~100 times higher than
competitive products. The high dynamic range and fidelity of the CoCo enables measurement
of a wide range of signals, regardless of the input signal magnitude.
CoCo excels in both dynamic and static measurements. When used for dynamic
measurements, the input channels offer extremely high-quality dynamic range, signal to noise
ratio, cross channel gain match, phase match, and spectrum flatness over an analysis
frequency range up to 45 kHz. When it is used to measure static or quasi-static signals, it
offers very high accuracy at DC or near DC frequency.
For VDC applications the CoCo data is stored and managed by an SQL relational database.
For DSA applications the CoCo software stores and organizes the data in the popular ASAM-
ODS standard. Data may be exchanged with other data formats such as UFF, BUFF, NI-
TDM, ASCII, MATLAB or Excel. The ASAM-ODS data standard provides ultimate flexibility
and version compatibility. ASAM-ODS data standard is widely supported by the automotive
industry and is expanding to aerospace and other areas.
The handheld system is equipped with two USB ports, 100 BaseT Ethernet, SD-card
interface, audio input/output, 5.7 inch color LCD display and a keypad. You can connect the
CoCo to a PC, download files and upgrade the software through several means of network
connection. The user interface of CoCo is specifically designed for easy and simple operation
while it maintains the capability of providing a wide variety of analysis functions.
The CoCo weighs less than 1.7 kg. Advanced thermal design eliminates the need for a
cooling fan reducing operating noise. The fully charged battery life is up to 6 hours,
depending on configuration and usage. An AC adapter can be used any time to charge the
device and supports unlimited hours of operation.
Compared to handheld data acquisition systems and signal analyzers from the other
providers, CoCo delivers higher measurement dynamic range and accuracy, recording
throughput rate and real-time analysis performance. It also provides more powerful
communication peripherals.
3 CRYSTAL INSTRUMENTS VDC SYSTEM USER MANUAL
On-Line Support
To access product information about your CoCo, please go to the product page of the Crystal
Instruments (CI) website at: http://www.go-ci.com/support.asp, log in with the serial number of
the CoCo and the password included in your shipping documents. After you log-in, you will be
able to review and download the latest information, restricted to CoCo users, including:
Product Information
New CSA projects
User’s Manual
Shipping and Repair History
User Forum
Technical Support
Software Updates
Technical Issues
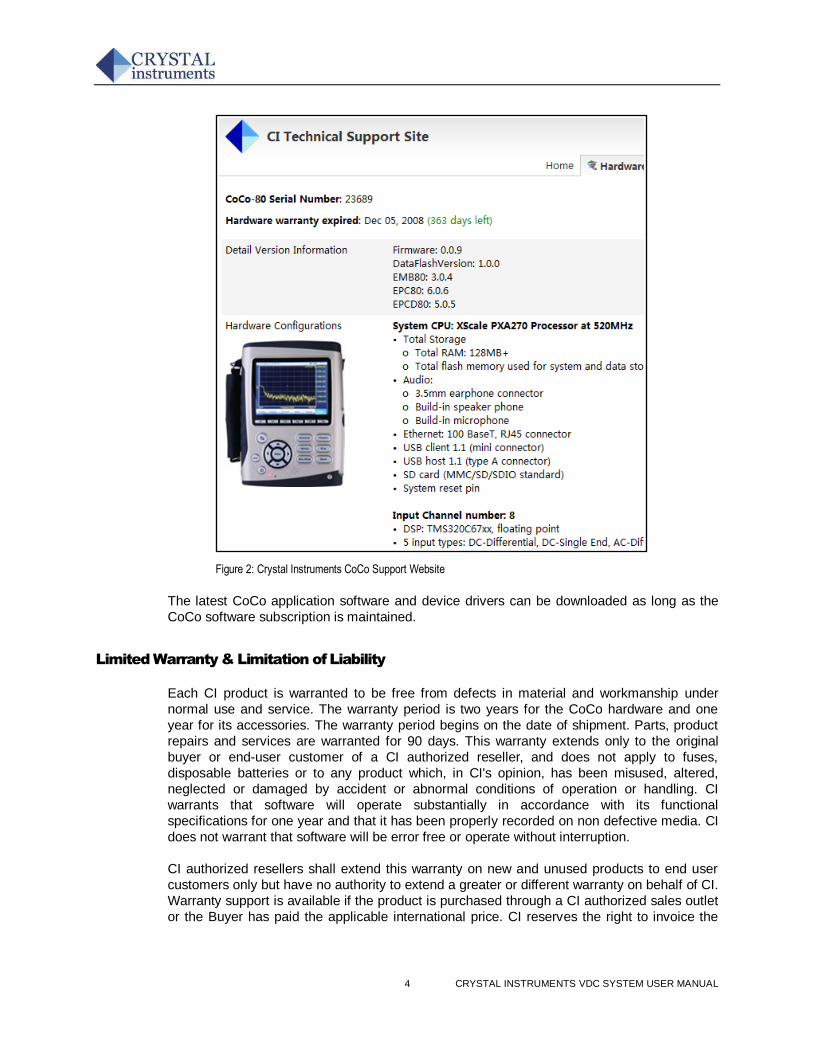
A typical page of CI Technical Support website is shown below:
4 CRYSTAL INSTRUMENTS VDC SYSTEM USER MANUAL
Figure 2: Crystal Instruments CoCo Support Website
The latest CoCo application software and device drivers can be downloaded as long as the
CoCo software subscription is maintained.
Limited Warranty & Limitation of Liability
Each CI product is warranted to be free from defects in material and workmanship under
normal use and service. The warranty period is two years for the CoCo hardware and one
year for its accessories. The warranty period begins on the date of shipment. Parts, product
repairs and services are warranted for 90 days. This warranty extends only to the original
buyer or end-user customer of a CI authorized reseller, and does not apply to fuses,
disposable batteries or to any product which, in CI's opinion, has been misused, altered,
neglected or damaged by accident or abnormal conditions of operation or handling. CI
warrants that software will operate substantially in accordance with its functional
specifications for one year and that it has been properly recorded on non defective media. CI
does not warrant that software will be error free or operate without interruption.
CI authorized resellers shall extend this warranty on new and unused products to end user
customers only but have no authority to extend a greater or different warranty on behalf of CI.
Warranty support is available if the product is purchased through a CI authorized sales outlet
or the Buyer has paid the applicable international price. CI reserves the right to invoice the

5 CRYSTAL INSTRUMENTS VDC SYSTEM USER MANUAL
Buyer for importation costs of repair/replacement parts when product purchased in one
country is submitted for repair in another country.
CI's warranty obligation is limited, at CI's option, to refund of the purchase price, free of
charge repair, or replacement of a defective product which is returned to a CI authorized
service center within the warranty period.
To obtain warranty service, contact your nearest CI authorized service center or send the
product, with a description of the difficulty, postage and insurance prepaid (FOB Destination),
to the nearest CI authorized service center. CI assumes no risk for damage in transit.
Following warranty repair, the product will be returned to Buyer, transportation prepaid (FOB
Destination). If CI determines that the failure was caused by misuse, alteration, accident or
abnormal condition of operation or handling, CI will provide an estimate of repair costs and
obtain authorization before commencing the work. Following repair, the product will be
returned to the Buyer transportation prepaid and the Buyer will be billed for the repair and
return transportation charges.
THIS WARRANTY IS THE BUYER'S SOLE AND EXCLUSIVE REMEDY AND IS IN LIEU OF
ALL OTHER WARRANTIES, EXPRESS OR IMPLIED, INCLUDING BUT NOT LIMITED TO
ANY IMPLIED WARRANTY OF MERCHANTABILITY OR FITNESS FOR A PARTICULAR
PURPOSE. CI SHALL NOT BE LIABLE FOR ANY SPECIAL, INDIRECT, INCIDENTAL OR
CONSEQUENTIAL DAMAGES OR LOSSES, INCLUDING LOSS OF DATA, WHETHER
ARISING FROM BREACH OF WARRANTY OR BASED ON CONTRACT, TORT, RELIANCE
OR ANY OTHERTHEORY.
Since some countries or states do not allow limitation of the term of an implied warranty, or
exclusion or limitation of incidental or consequential damages, the limitations and exclusions
of this warranty may not apply to every buyer. If any provision of this Warranty is held invalid
or unenforceable by a court of competent jurisdiction, such holding will not affect the validity
or enforceability of any other provision.
Crystal Instruments Corporation, www.go-ci.com
Safety Information: Read First
The CI CoCo Handheld Data Acquisition System complies with:
EN 61326:1997+A1:1998+A2:2001
EN61000-3-2: 2000 & EN61000-3-3: 1995+A1:2001
Use the CoCo and its accessories only as specified in the User’s Manual. Otherwise, the
protection provided by the Instrument and its accessories might be impaired.
Condensation may form on the circuit boards when the device is moved from a cold
environment to a warm one. In these situations, always wait until the device warms up to
room temperature and is completely dry before turning it on. The acclimatization period
should take about 2 hours.
For the most accurate measurements a warm-up phase of 20 min is recommended.
6 CRYSTAL INSTRUMENTS VDC SYSTEM USER MANUAL
The devices have been designed for use in clean and dry environments. It is not to be
operated in 1) exceedingly dusty and/or wet environments, 2) in environments where danger
of explosion exists nor 3) in environments containing aggressive chemical agents.
Lay cables in a manner to avoid hazards (tripping) and damage.
A Warning identifies conditions and actions that pose hazard(s) to the user. A Caution
identifies conditions and actions that may damage the Instrument.
To avoid electrical shock or fire:
Realize that the CoCo is a low voltage measurement instrument.
Do not apply input voltages above the rating of the Instrument. You should never apply a
voltage that potentially exceeds +/-40V to the Instrument.
Review the entire manual before use of the Instrument and its accessories.
Do not operate the Instrument around explosive gas or vapor.
Before use, inspect the instrument, BNC connectors and accessories for mechanical damage
and replace when damaged. Look for cracks or missing plastic. Pay special attention to the
insulation surrounding the connectors.
Remove the cables and accessories that are not in use.
Use the ground input only to ground the Instrument and do not apply any voltage.
Do not insert metal objects into connectors.
Use only the wall-mount power supply provided by the Crystal Instruments.
AC Adapter Voltage Range
For external power source CoCo uses a wall-mount AC Adapter. The AC Power range is:
100Vac ~ 240Vac.
Maximum Measurement Input Voltage
Maximum Working Input Voltage: 10 V peak. Voltage ratings are given as “working voltage”. They
should be read as Vpeak for dynamic applications and as V dc for DC applications.
Max. Input Range without damaging the hardware: 40Vpeak.
If Safety Features are Impaired
If the instrument is used in a manner not specified by the manufacturer, the protection
provided by the instrument may be impaired. Before use, inspect the test leads for
mechanical damage and replace damaged test leads! If the instrument or its accessories
appear to be impaired or not functioning properly, do not use it and send it in for repair.
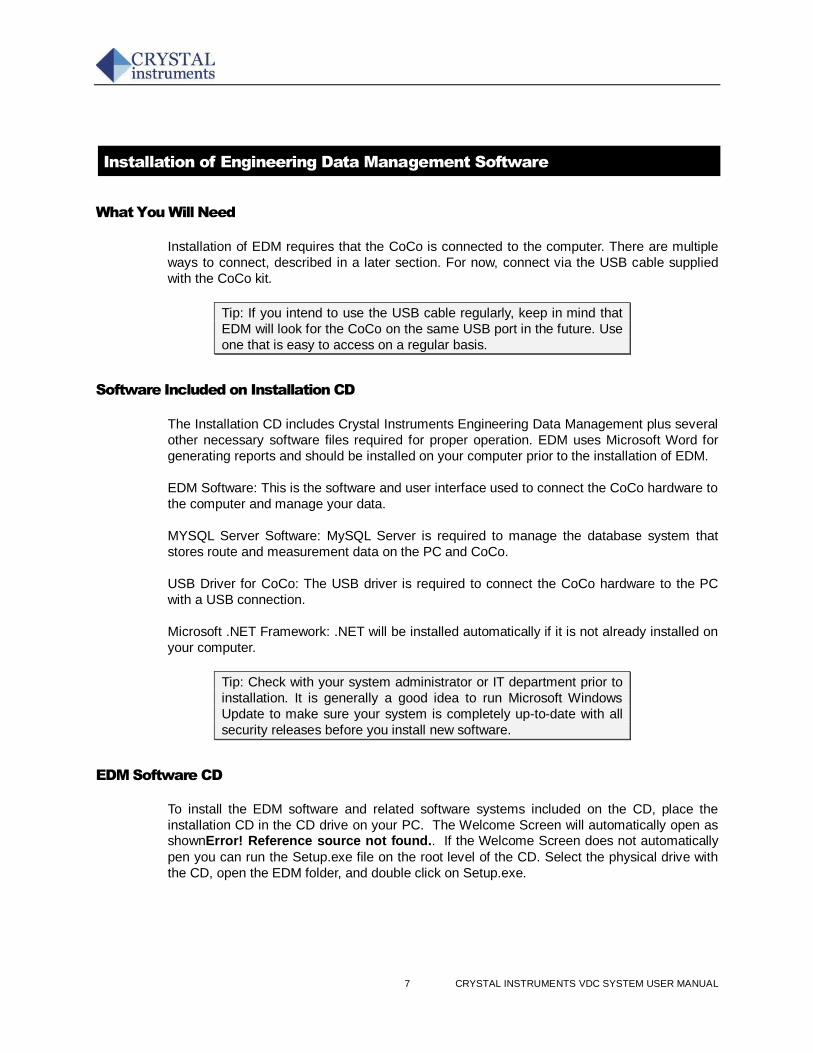
7 CRYSTAL INSTRUMENTS VDC SYSTEM USER MANUAL
Installation of Engineering Data Management Software
What You Will Need
Installation of EDM requires that the CoCo is connected to the computer. There are multiple
ways to connect, described in a later section. For now, connect via the USB cable supplied
with the CoCo kit.
Tip: If you intend to use the USB cable regularly, keep in mind that
EDM will look for the CoCo on the same USB port in the future. Use
one that is easy to access on a regular basis.
Software Included on Installation CD
The Installation CD includes Crystal Instruments Engineering Data Management plus several
other necessary software files required for proper operation. EDM uses Microsoft Word for
generating reports and should be installed on your computer prior to the installation of EDM.
EDM Software: This is the software and user interface used to connect the CoCo hardware to
the computer and manage your data.
MYSQL Server Software: MySQL Server is required to manage the database system that
stores route and measurement data on the PC and CoCo.
USB Driver for CoCo: The USB driver is required to connect the CoCo hardware to the PC
with a USB connection.
Microsoft .NET Framework: .NET will be installed automatically if it is not already installed on
your computer.
Tip: Check with your system administrator or IT department prior to
installation. It is generally a good idea to run Microsoft Windows
Update to make sure your system is completely up-to-date with all
security releases before you install new software.
EDM Software CD
To install the EDM software and related software systems included on the CD, place the
installation CD in the CD drive on your PC. The Welcome Screen will automatically open as shownError! Reference source not found.. If the Welcome Screen does not automatically
pen you can run the Setup.exe file on the root level of the CD. Select the physical drive with
the CD, open the EDM folder, and double click on Setup.exe.
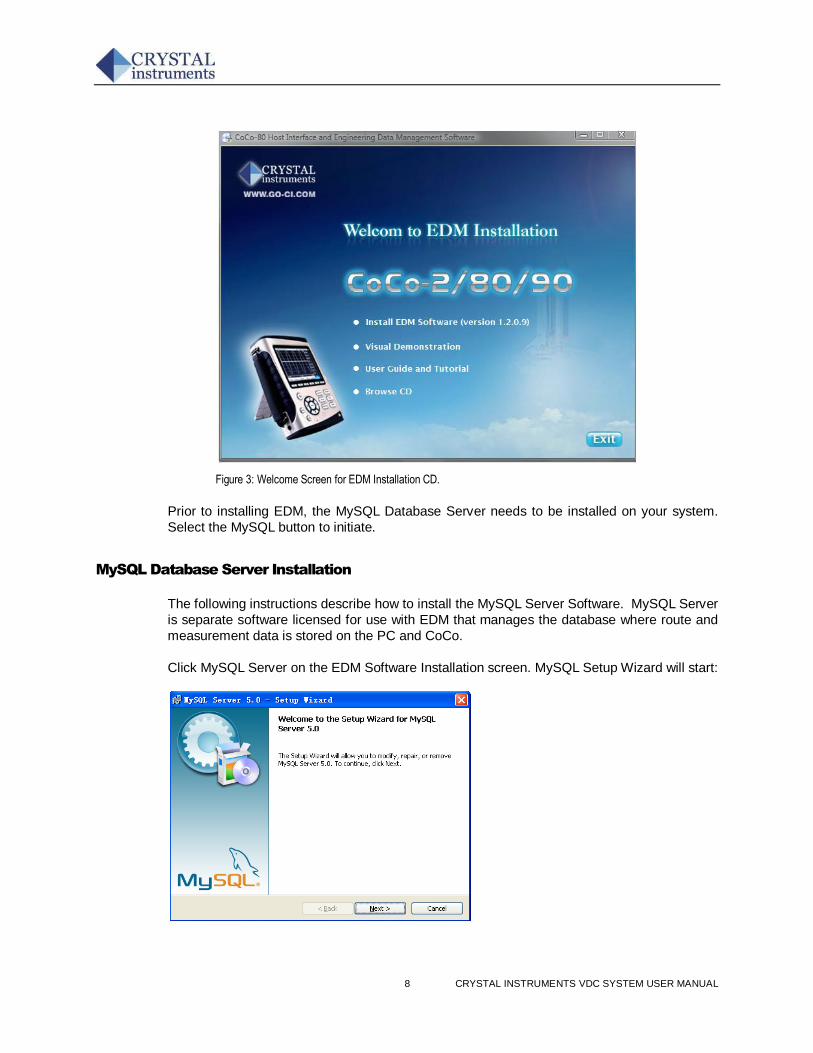
8 CRYSTAL INSTRUMENTS VDC SYSTEM USER MANUAL
Figure 3: Welcome Screen for EDM Installation CD.
Prior to installing EDM, the MySQL Database Server needs to be installed on your system.
Select the MySQL button to initiate.
MySQL Database Server Installation
The following instructions describe how to install the MySQL Server Software. MySQL Server
is separate software licensed for use with EDM that manages the database where route and
measurement data is stored on the PC and CoCo.
Click MySQL Server on the EDM Software Installation screen. MySQL Setup Wizard will start:
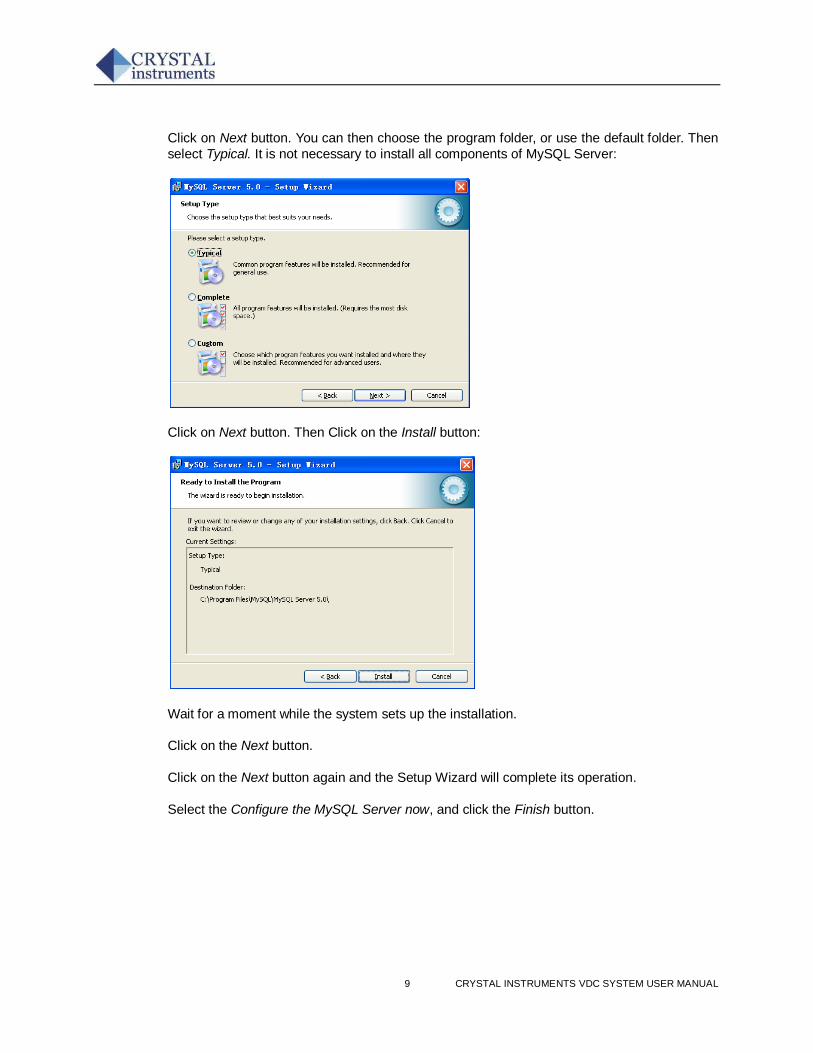
9 CRYSTAL INSTRUMENTS VDC SYSTEM USER MANUAL
Click on Next button. You can then choose the program folder, or use the default folder. Then
select Typical. It is not necessary to install all components of MySQL Server:
Click on Next button. Then Click on the Install button:
Wait for a moment while the system sets up the installation.
Click on the Next button.
Click on the Next button again and the Setup Wizard will complete its operation.
Select the Configure the MySQL Server now, and click the Finish button.
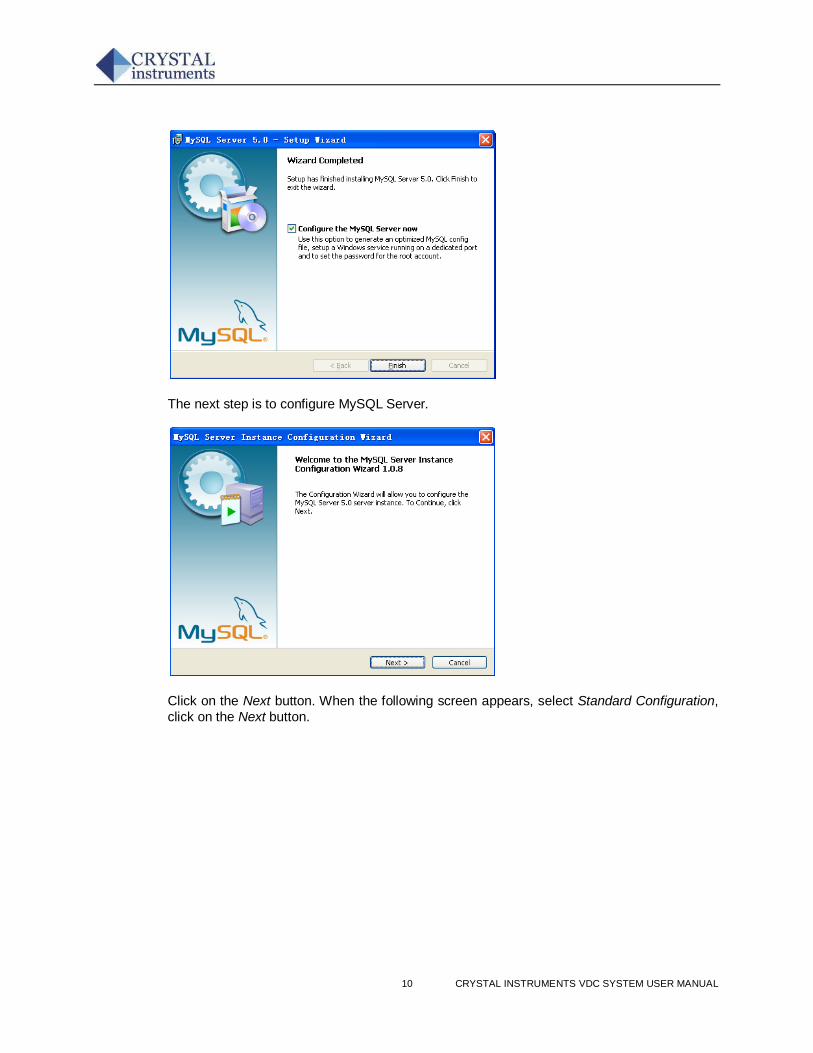
10 CRYSTAL INSTRUMENTS VDC SYSTEM USER MANUAL
The next step is to configure MySQL Server.
Click on the Next button. When the following screen appears, select Standard Configuration,
click on the Next button.
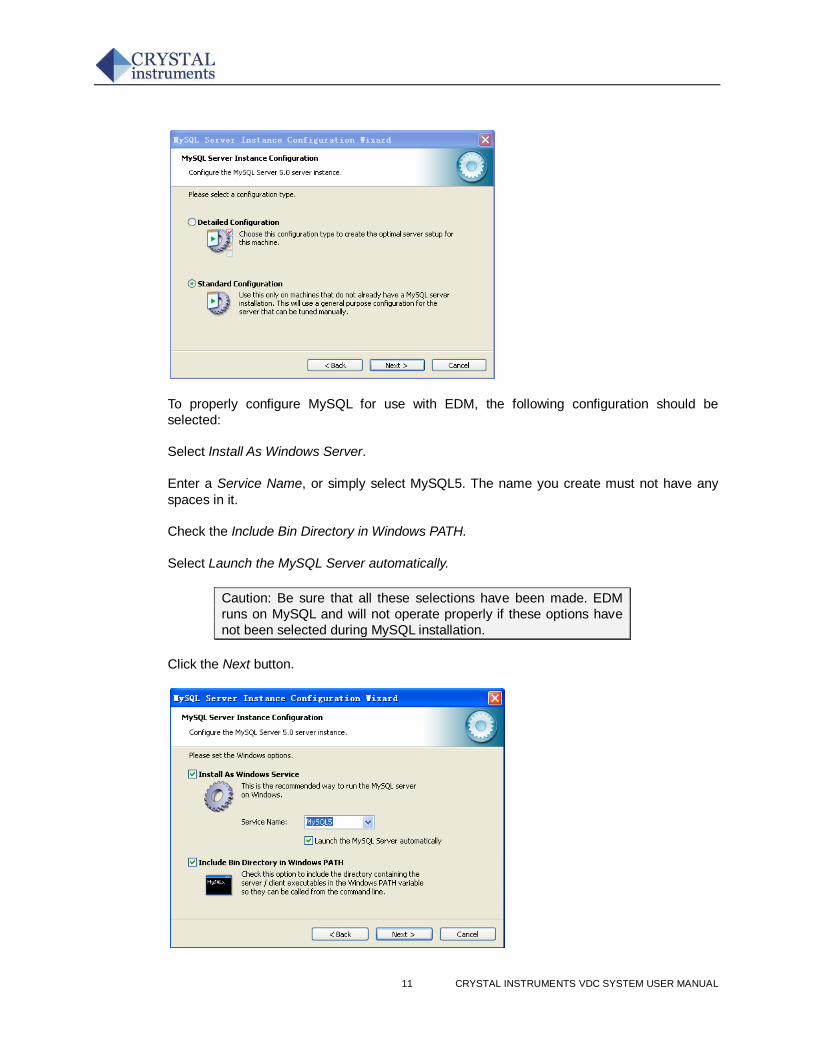
11 CRYSTAL INSTRUMENTS VDC SYSTEM USER MANUAL
To properly configure MySQL for use with EDM, the following configuration should be
selected:
Select Install As Windows Server.
Enter a Service Name, or simply select MySQL5. The name you create must not have any
spaces in it.
Check the Include Bin Directory in Windows PATH.
Select Launch the MySQL Server automatically.
Caution: Be sure that all these selections have been made. EDM
runs on MySQL and will not operate properly if these options have
not been selected during MySQL installation.
Click the Next button.
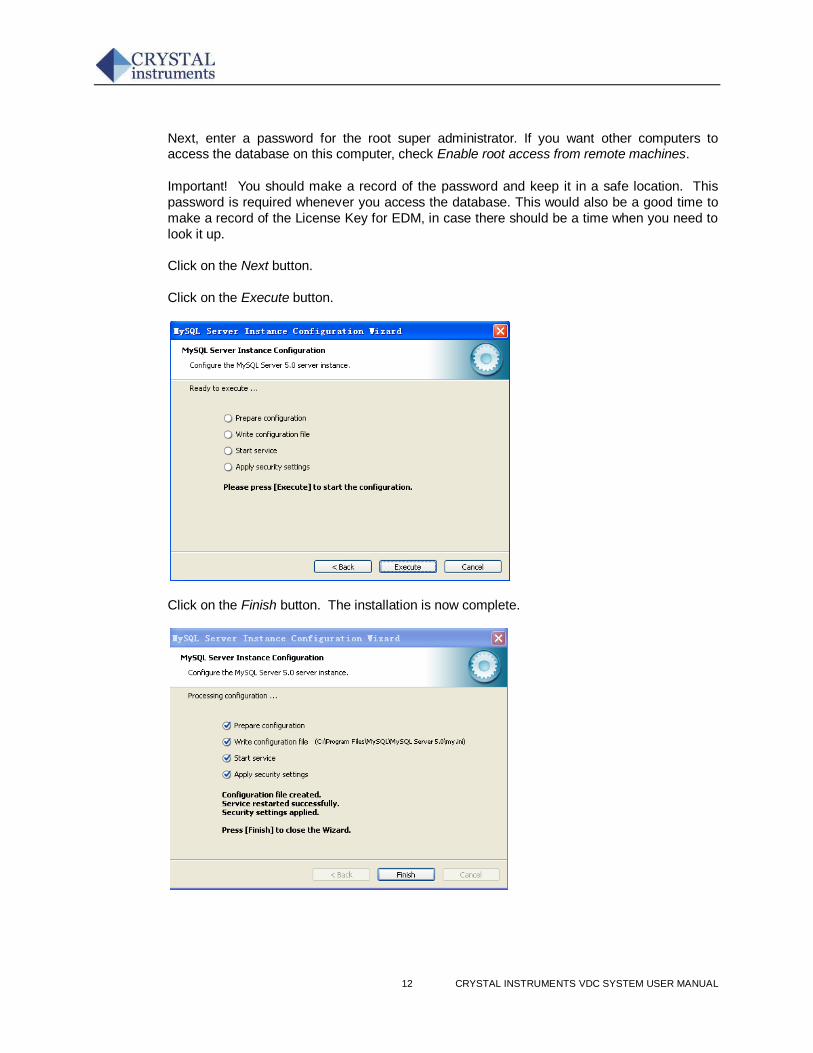
12 CRYSTAL INSTRUMENTS VDC SYSTEM USER MANUAL
Next, enter a password for the root super administrator. If you want other computers to access the database on this computer, check Enable root access from remote machines.
Important! You should make a record of the password and keep it in a safe location. This
password is required whenever you access the database. This would also be a good time to
make a record of the License Key for EDM, in case there should be a time when you need to
look it up.
Click on the Next button.
Click on the Execute button.
Click on the Finish button. The installation is now complete.
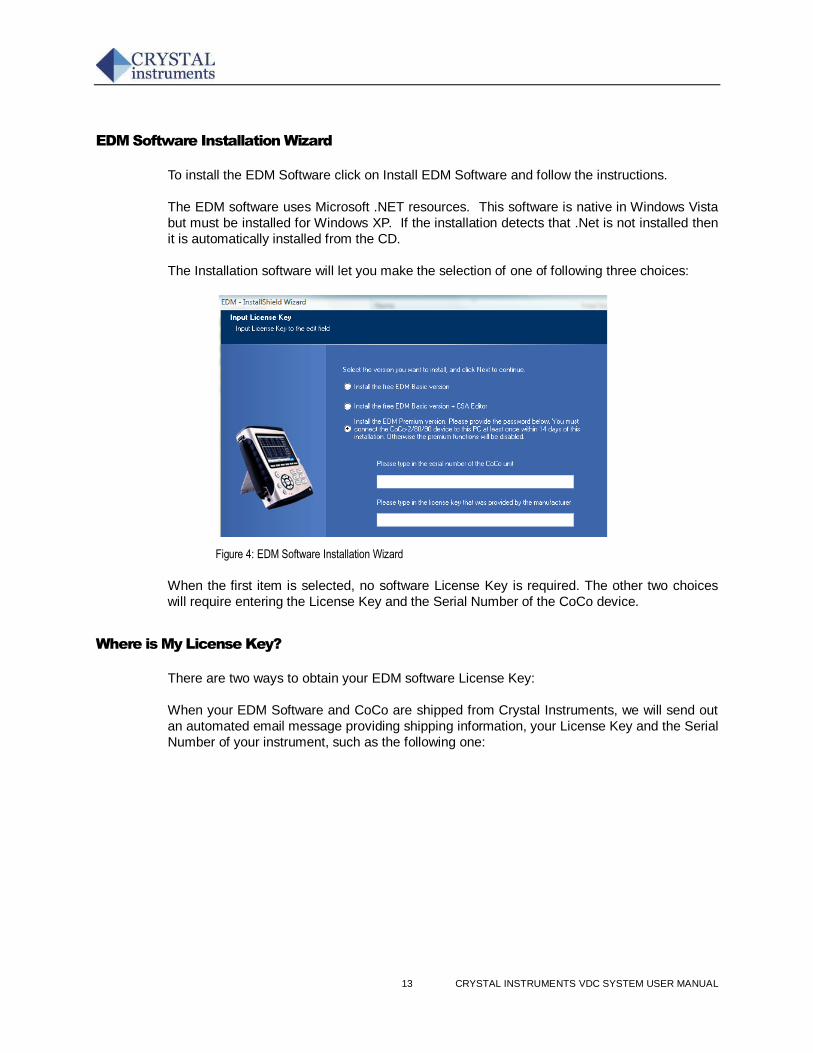
13 CRYSTAL INSTRUMENTS VDC SYSTEM USER MANUAL
EDM Software Installation Wizard
To install the EDM Software click on Install EDM Software and follow the instructions.
The EDM software uses Microsoft .NET resources. This software is native in Windows Vista
but must be installed for Windows XP. If the installation detects that .Net is not installed then
it is automatically installed from the CD.
The Installation software will let you make the selection of one of following three choices:
Figure 4: EDM Software Installation Wizard
When the first item is selected, no software License Key is required. The other two choices
will require entering the License Key and the Serial Number of the CoCo device.
Where is My License Key?
There are two ways to obtain your EDM software License Key:
When your EDM Software and CoCo are shipped from Crystal Instruments, we will send out
an automated email message providing shipping information, your License Key and the Serial
Number of your instrument, such as the following one:
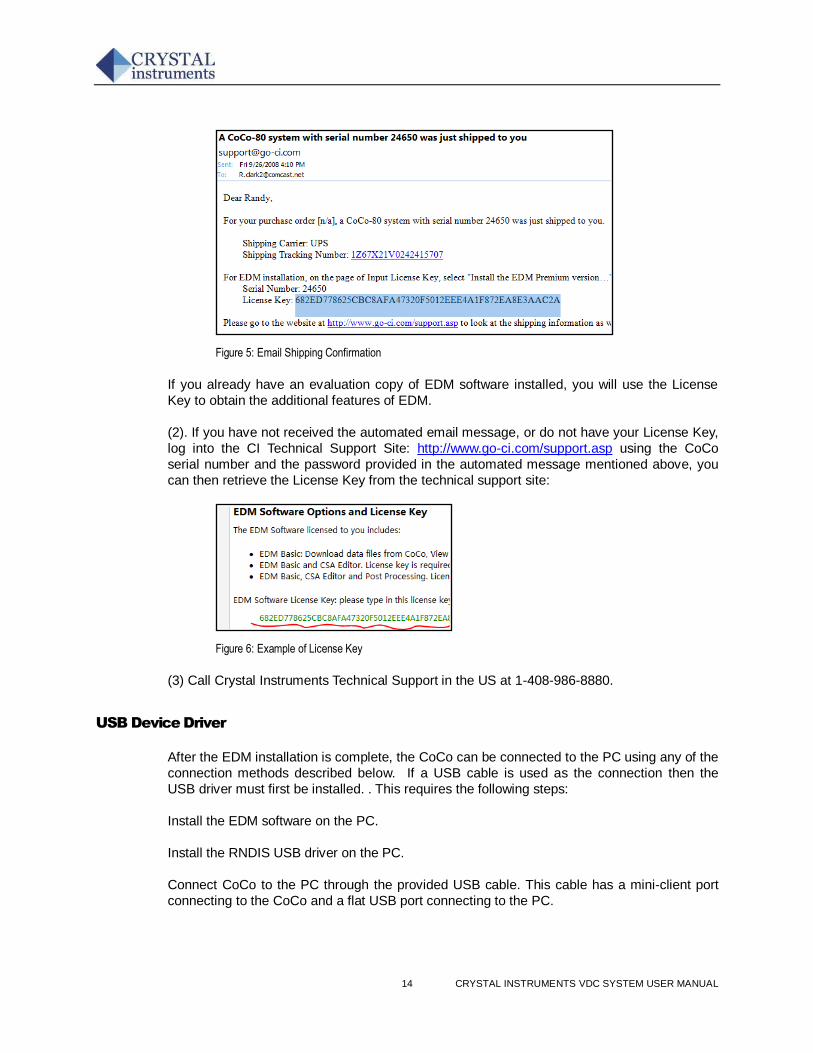
14 CRYSTAL INSTRUMENTS VDC SYSTEM USER MANUAL
Figure 5: Email Shipping Confirmation
If you already have an evaluation copy of EDM software installed, you will use the License
Key to obtain the additional features of EDM.
(2). If you have not received the automated email message, or do not have your License Key,
log into the CI Technical Support Site: http://www.go-ci.com/support.asp using the CoCo
serial number and the password provided in the automated message mentioned above, you
can then retrieve the License Key from the technical support site:
Figure 6: Example of License Key
(3) Call Crystal Instruments Technical Support in the US at 1-408-986-8880.
USB Device Driver
After the EDM installation is complete, the CoCo can be connected to the PC using any of the
connection methods described below. If a USB cable is used as the connection then the
USB driver must first be installed. . This requires the following steps:
Install the EDM software on the PC.
Install the RNDIS USB driver on the PC.
Connect CoCo to the PC through the provided USB cable. This cable has a mini-client port
connecting to the CoCo and a flat USB port connecting to the PC.
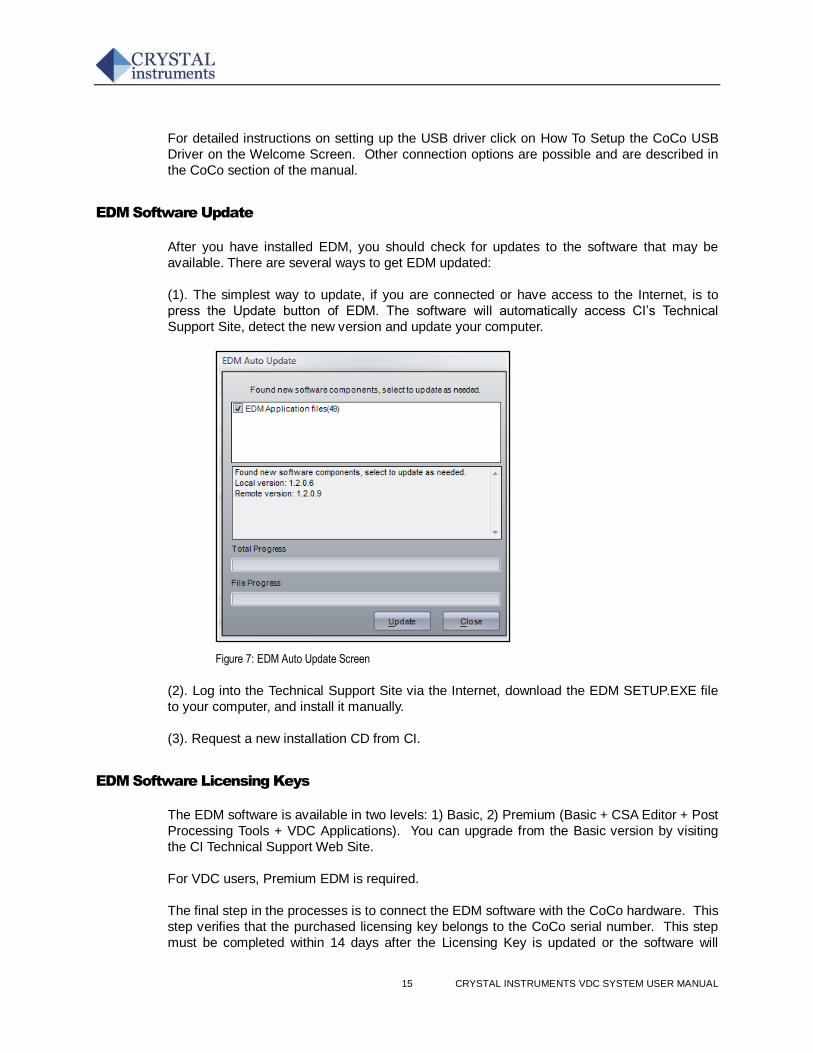
15 CRYSTAL INSTRUMENTS VDC SYSTEM USER MANUAL
For detailed instructions on setting up the USB driver click on How To Setup the CoCo USB
Driver on the Welcome Screen. Other connection options are possible and are described in
the CoCo section of the manual.
EDM Software Update
After you have installed EDM, you should check for updates to the software that may be
available. There are several ways to get EDM updated:
(1). The simplest way to update, if you are connected or have access to the Internet, is to
press the Update button of EDM. The software will automatically access CI’s Technical
Support Site, detect the new version and update your computer.
Figure 7: EDM Auto Update Screen
(2). Log into the Technical Support Site via the Internet, download the EDM SETUP.EXE file
to your computer, and install it manually.
(3). Request a new installation CD from CI.
EDM Software Licensing Keys
The EDM software is available in two levels: 1) Basic, 2) Premium (Basic + CSA Editor + Post
Processing Tools + VDC Applications). You can upgrade from the Basic version by visiting
the CI Technical Support Web Site.
For VDC users, Premium EDM is required.
The final step in the processes is to connect the EDM software with the CoCo hardware. This
step verifies that the purchased licensing key belongs to the CoCo serial number. This step
must be completed within 14 days after the Licensing Key is updated or the software will
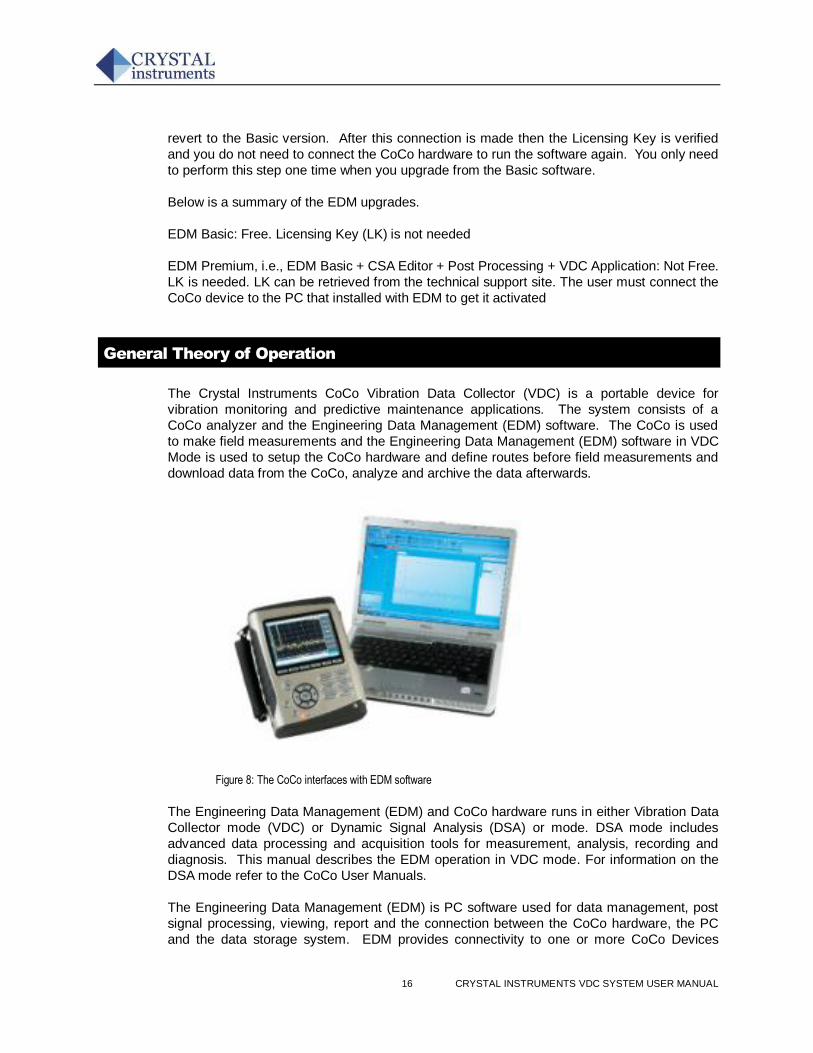
16 CRYSTAL INSTRUMENTS VDC SYSTEM USER MANUAL
revert to the Basic version. After this connection is made then the Licensing Key is verified
and you do not need to connect the CoCo hardware to run the software again. You only need
to perform this step one time when you upgrade from the Basic software.
Below is a summary of the EDM upgrades.
EDM Basic: Free. Licensing Key (LK) is not needed
EDM Premium, i.e., EDM Basic + CSA Editor + Post Processing + VDC Application: Not Free.
LK is needed. LK can be retrieved from the technical support site. The user must connect the
CoCo device to the PC that installed with EDM to get it activated
General Theory of Operation
The Crystal Instruments CoCo Vibration Data Collector (VDC) is a portable device for
vibration monitoring and predictive maintenance applications. The system consists of a
CoCo analyzer and the Engineering Data Management (EDM) software. The CoCo is used
to make field measurements and the Engineering Data Management (EDM) software in VDC
Mode is used to setup the CoCo hardware and define routes before field measurements and
download data from the CoCo, analyze and archive the data afterwards.
Figure 8: The CoCo interfaces with EDM software
The Engineering Data Management (EDM) and CoCo hardware runs in either Vibration Data
Collector mode (VDC) or Dynamic Signal Analysis (DSA) or mode. DSA mode includes
advanced data processing and acquisition tools for measurement, analysis, recording and
diagnosis. This manual describes the EDM operation in VDC mode. For information on the
DSA mode refer to the CoCo User Manuals.
The Engineering Data Management (EDM) is PC software used for data management, post
signal processing, viewing, report and the connection between the CoCo hardware, the PC
and the data storage system. EDM provides connectivity to one or more CoCo Devices
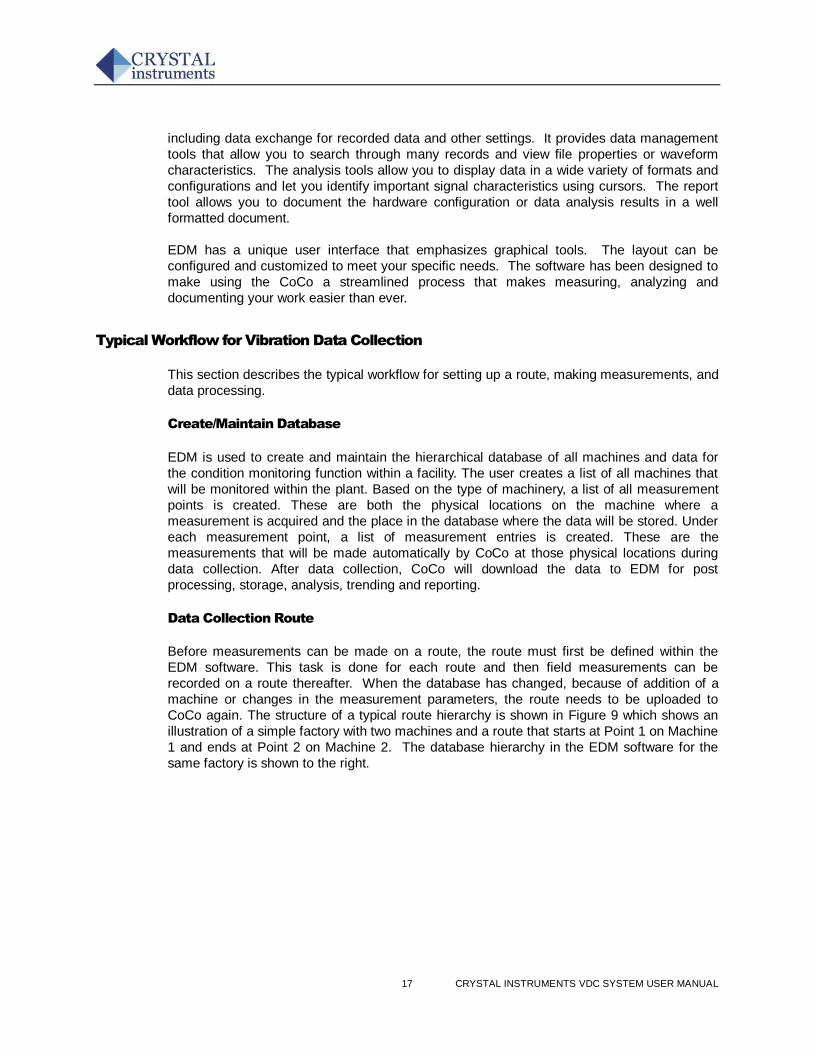
17 CRYSTAL INSTRUMENTS VDC SYSTEM USER MANUAL
including data exchange for recorded data and other settings. It provides data management
tools that allow you to search through many records and view file properties or waveform
characteristics. The analysis tools allow you to display data in a wide variety of formats and
configurations and let you identify important signal characteristics using cursors. The report
tool allows you to document the hardware configuration or data analysis results in a well
formatted document.
EDM has a unique user interface that emphasizes graphical tools. The layout can be
configured and customized to meet your specific needs. The software has been designed to
make using the CoCo a streamlined process that makes measuring, analyzing and
documenting your work easier than ever.
Typical Workflow for Vibration Data Collection
This section describes the typical workflow for setting up a route, making measurements, and
data processing.
Create/Maintain Database
EDM is used to create and maintain the hierarchical database of all machines and data for
the condition monitoring function within a facility. The user creates a list of all machines that
will be monitored within the plant. Based on the type of machinery, a list of all measurement
points is created. These are both the physical locations on the machine where a
measurement is acquired and the place in the database where the data will be stored. Under
each measurement point, a list of measurement entries is created. These are the
measurements that will be made automatically by CoCo at those physical locations during
data collection. After data collection, CoCo will download the data to EDM for post
processing, storage, analysis, trending and reporting.
Data Collection Route
Before measurements can be made on a route, the route must first be defined within the
EDM software. This task is done for each route and then field measurements can be
recorded on a route thereafter. When the database has changed, because of addition of a
machine or changes in the measurement parameters, the route needs to be uploaded to
CoCo again. The structure of a typical route hierarchy is shown in Figure 9 which shows an
illustration of a simple factory with two machines and a route that starts at Point 1 on Machine
1 and ends at Point 2 on Machine 2. The database hierarchy in the EDM software for the
same factory is shown to the right.
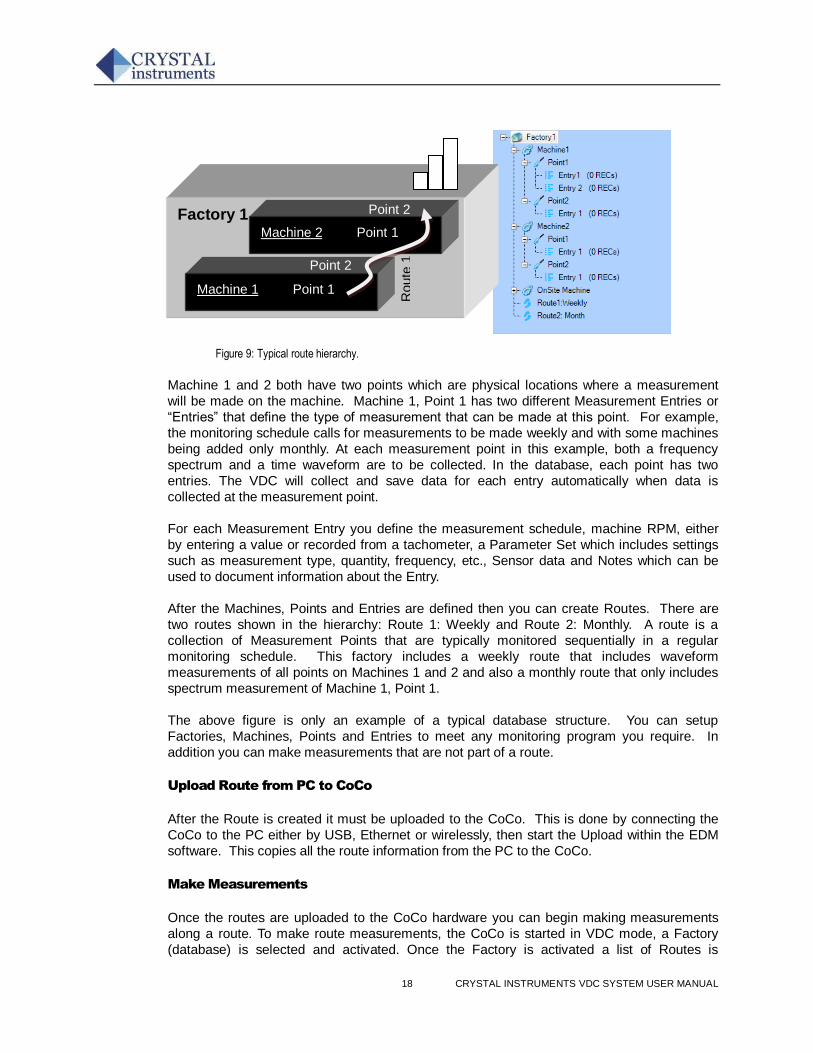
18 CRYSTAL INSTRUMENTS VDC SYSTEM USER MANUAL
Figure 9: Typical route hierarchy.
Machine 1 and 2 both have two points which are physical locations where a measurement
will be made on the machine. Machine 1, Point 1 has two different Measurement Entries or
“Entries” that define the type of measurement that can be made at this point. For example,
the monitoring schedule calls for measurements to be made weekly and with some machines
being added only monthly. At each measurement point in this example, both a frequency
spectrum and a time waveform are to be collected. In the database, each point has two
entries. The VDC will collect and save data for each entry automatically when data is
collected at the measurement point.
For each Measurement Entry you define the measurement schedule, machine RPM, either
by entering a value or recorded from a tachometer, a Parameter Set which includes settings
such as measurement type, quantity, frequency, etc., Sensor data and Notes which can be
used to document information about the Entry.
After the Machines, Points and Entries are defined then you can create Routes. There are
two routes shown in the hierarchy: Route 1: Weekly and Route 2: Monthly. A route is a
collection of Measurement Points that are typically monitored sequentially in a regular
monitoring schedule. This factory includes a weekly route that includes waveform
measurements of all points on Machines 1 and 2 and also a monthly route that only includes
spectrum measurement of Machine 1, Point 1.
The above figure is only an example of a typical database structure. You can setup
Factories, Machines, Points and Entries to meet any monitoring program you require. In
addition you can make measurements that are not part of a route.
Upload Route from PC to CoCo
After the Route is created it must be uploaded to the CoCo. This is done by connecting the
CoCo to the PC either by USB, Ethernet or wirelessly, then start the Upload within the EDM
software. This copies all the route information from the PC to the CoCo.
Make Measurements
Once the routes are uploaded to the CoCo hardware you can begin making measurements
along a route. To make route measurements, the CoCo is started in VDC mode, a Factory
(database) is selected and activated. Once the Factory is activated a list of Routes is
Factory 1
Machine 1 Point 1
Machine 2 Point 1
Point 2
Point 2
Route
1
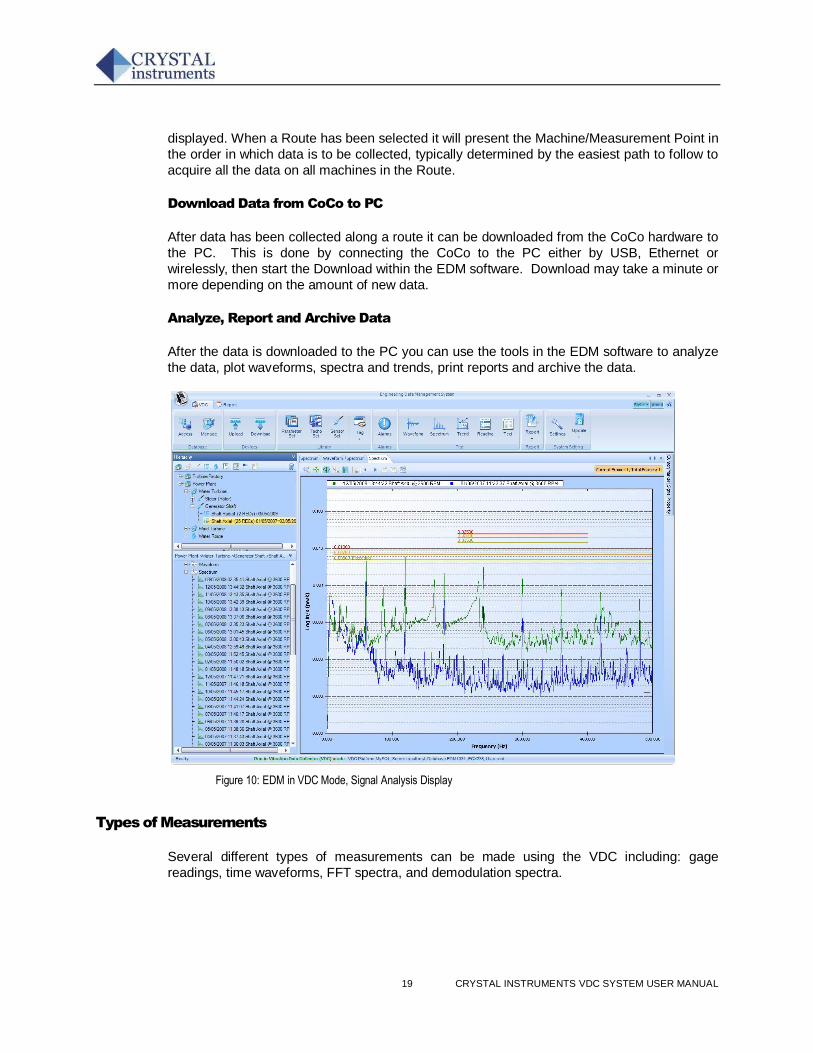
19 CRYSTAL INSTRUMENTS VDC SYSTEM USER MANUAL
displayed. When a Route has been selected it will present the Machine/Measurement Point in
the order in which data is to be collected, typically determined by the easiest path to follow to
acquire all the data on all machines in the Route.
Download Data from CoCo to PC
After data has been collected along a route it can be downloaded from the CoCo hardware to
the PC. This is done by connecting the CoCo to the PC either by USB, Ethernet or
wirelessly, then start the Download within the EDM software. Download may take a minute or
more depending on the amount of new data.
Analyze, Report and Archive Data
After the data is downloaded to the PC you can use the tools in the EDM software to analyze
the data, plot waveforms, spectra and trends, print reports and archive the data.
Figure 10: EDM in VDC Mode, Signal Analysis Display
Types of Measurements
Several different types of measurements can be made using the VDC including: gage
readings, time waveforms, FFT spectra, and demodulation spectra.
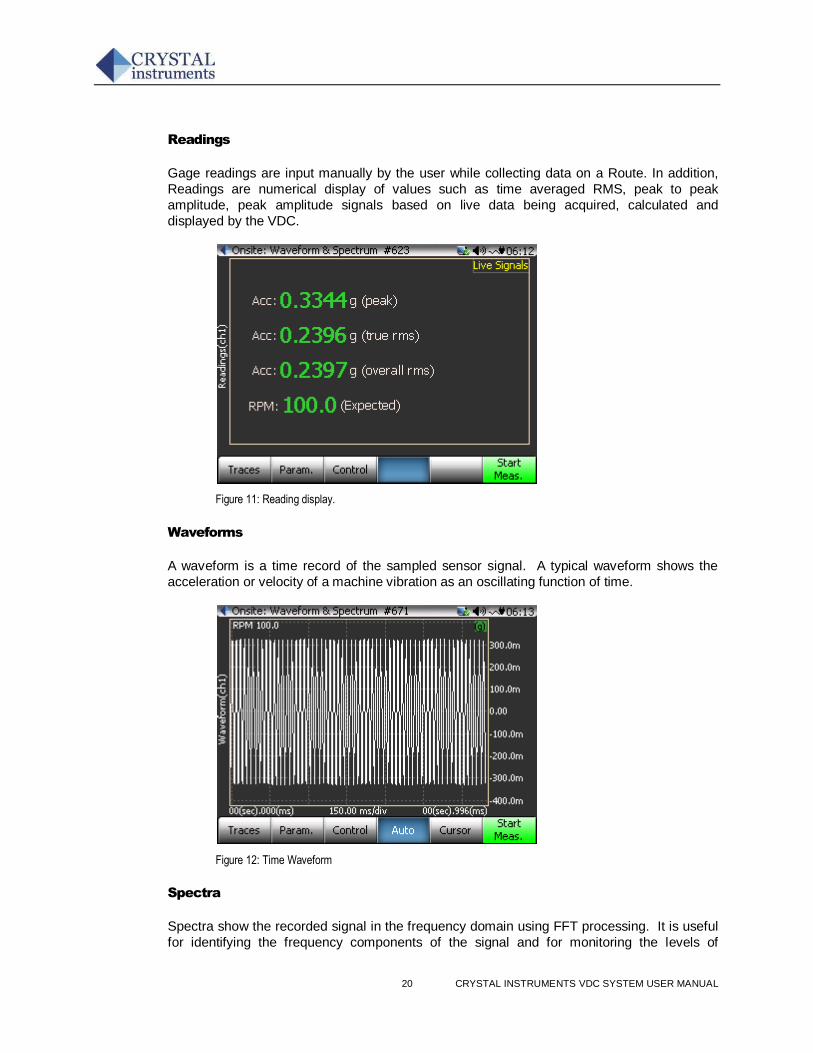
20 CRYSTAL INSTRUMENTS VDC SYSTEM USER MANUAL
Readings
Gage readings are input manually by the user while collecting data on a Route. In addition,
Readings are numerical display of values such as time averaged RMS, peak to peak
amplitude, peak amplitude signals based on live data being acquired, calculated and
displayed by the VDC.
Figure 11: Reading display.
Waveforms
A waveform is a time record of the sampled sensor signal. A typical waveform shows the
acceleration or velocity of a machine vibration as an oscillating function of time.
Figure 12: Time Waveform
Spectra
Spectra show the recorded signal in the frequency domain using FFT processing. It is useful
for identifying the frequency components of the signal and for monitoring the levels of
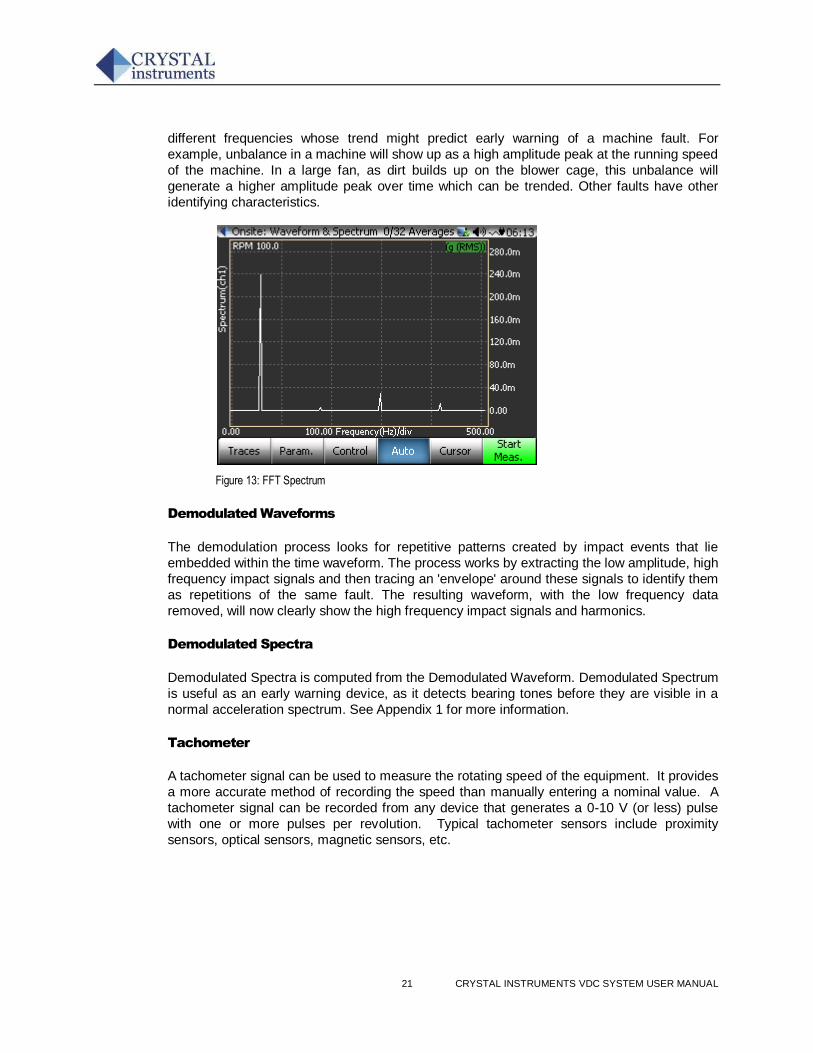
21 CRYSTAL INSTRUMENTS VDC SYSTEM USER MANUAL
different frequencies whose trend might predict early warning of a machine fault. For
example, unbalance in a machine will show up as a high amplitude peak at the running speed
of the machine. In a large fan, as dirt builds up on the blower cage, this unbalance will
generate a higher amplitude peak over time which can be trended. Other faults have other
identifying characteristics.
Figure 13: FFT Spectrum
Demodulated Waveforms
The demodulation process looks for repetitive patterns created by impact events that lie
embedded within the time waveform. The process works by extracting the low amplitude, high
frequency impact signals and then tracing an 'envelope' around these signals to identify them
as repetitions of the same fault. The resulting waveform, with the low frequency data
removed, will now clearly show the high frequency impact signals and harmonics.
Demodulated Spectra
Demodulated Spectra is computed from the Demodulated Waveform. Demodulated Spectrum
is useful as an early warning device, as it detects bearing tones before they are visible in a
normal acceleration spectrum. See Appendix 1 for more information.
Tachometer
A tachometer signal can be used to measure the rotating speed of the equipment. It provides
a more accurate method of recording the speed than manually entering a nominal value. A
tachometer signal can be recorded from any device that generates a 0-10 V (or less) pulse
with one or more pulses per revolution. Typical tachometer sensors include proximity
sensors, optical sensors, magnetic sensors, etc.
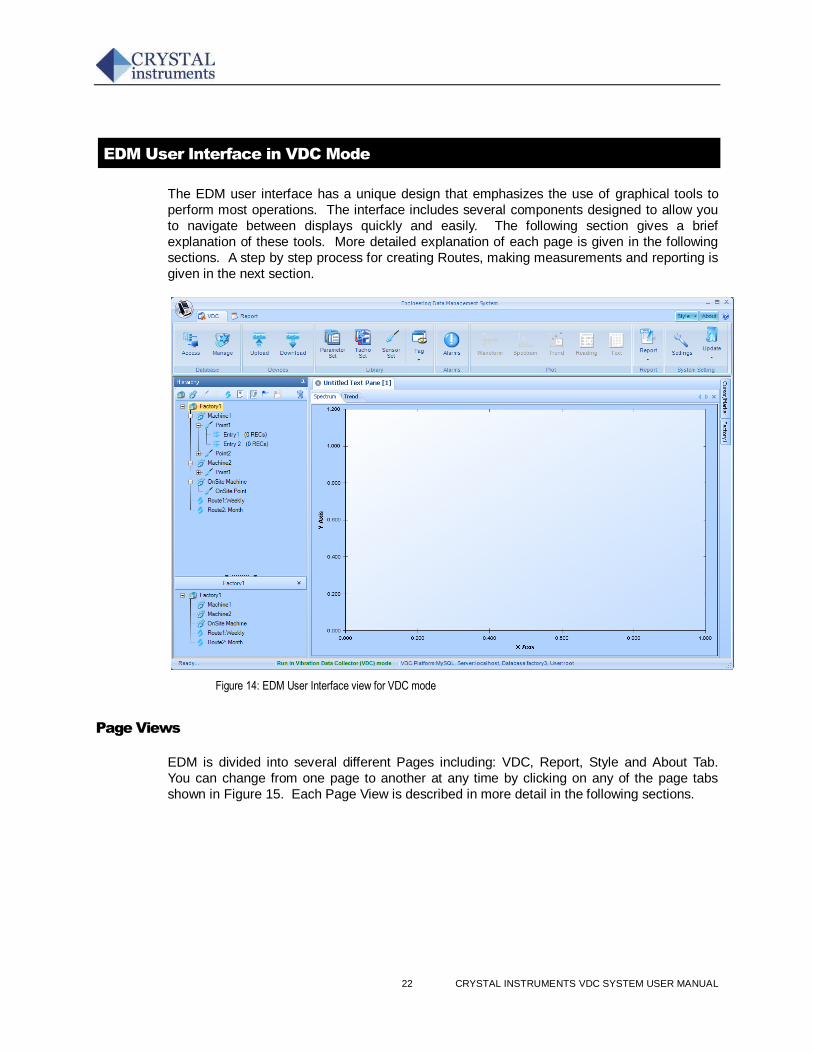
22 CRYSTAL INSTRUMENTS VDC SYSTEM USER MANUAL
EDM User Interface in VDC Mode
The EDM user interface has a unique design that emphasizes the use of graphical tools to
perform most operations. The interface includes several components designed to allow you
to navigate between displays quickly and easily. The following section gives a brief
explanation of these tools. More detailed explanation of each page is given in the following
sections. A step by step process for creating Routes, making measurements and reporting is
given in the next section.
Figure 14: EDM User Interface view for VDC mode
Page Views
EDM is divided into several different Pages including: VDC, Report, Style and About Tab.
You can change from one page to another at any time by clicking on any of the page tabs
shown in Figure 15. Each Page View is described in more detail in the following sections.
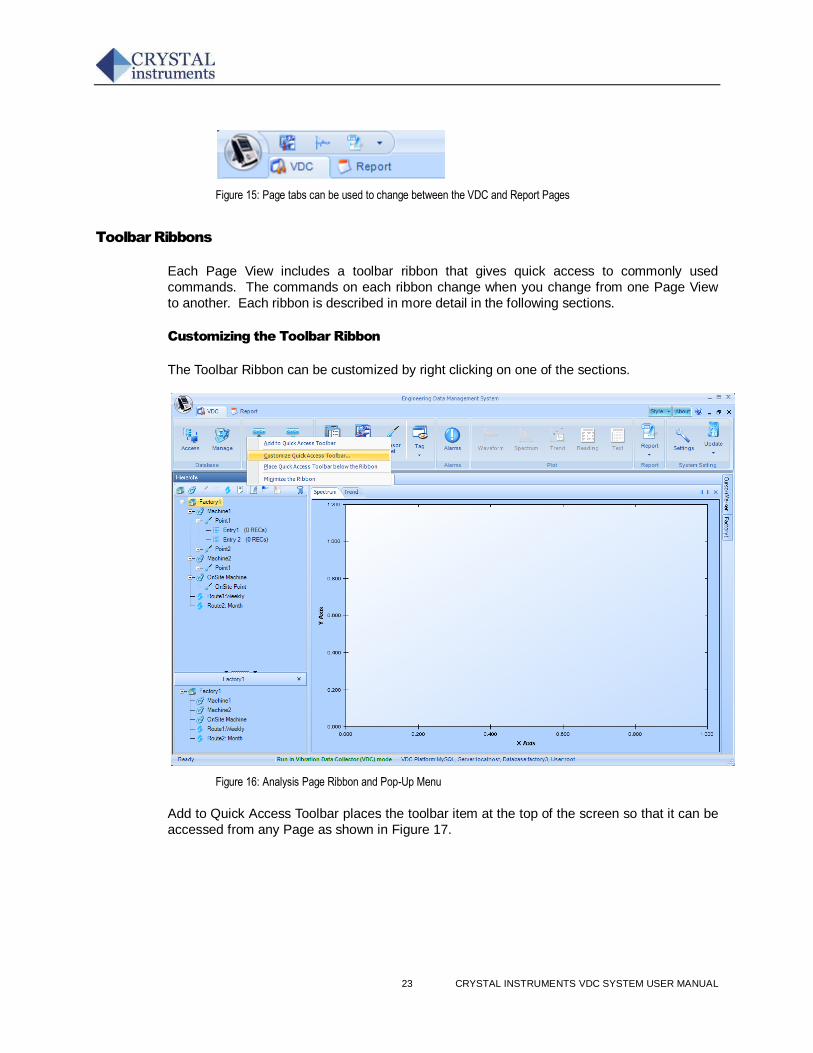
23 CRYSTAL INSTRUMENTS VDC SYSTEM USER MANUAL
Figure 15: Page tabs can be used to change between the VDC and Report Pages
Toolbar Ribbons
Each Page View includes a toolbar ribbon that gives quick access to commonly used
commands. The commands on each ribbon change when you change from one Page View
to another. Each ribbon is described in more detail in the following sections.
Customizing the Toolbar Ribbon
The Toolbar Ribbon can be customized by right clicking on one of the sections.
Figure 16: Analysis Page Ribbon and Pop-Up Menu
Add to Quick Access Toolbar places the toolbar item at the top of the screen so that it can be
accessed from any Page as shown in Figure 17.
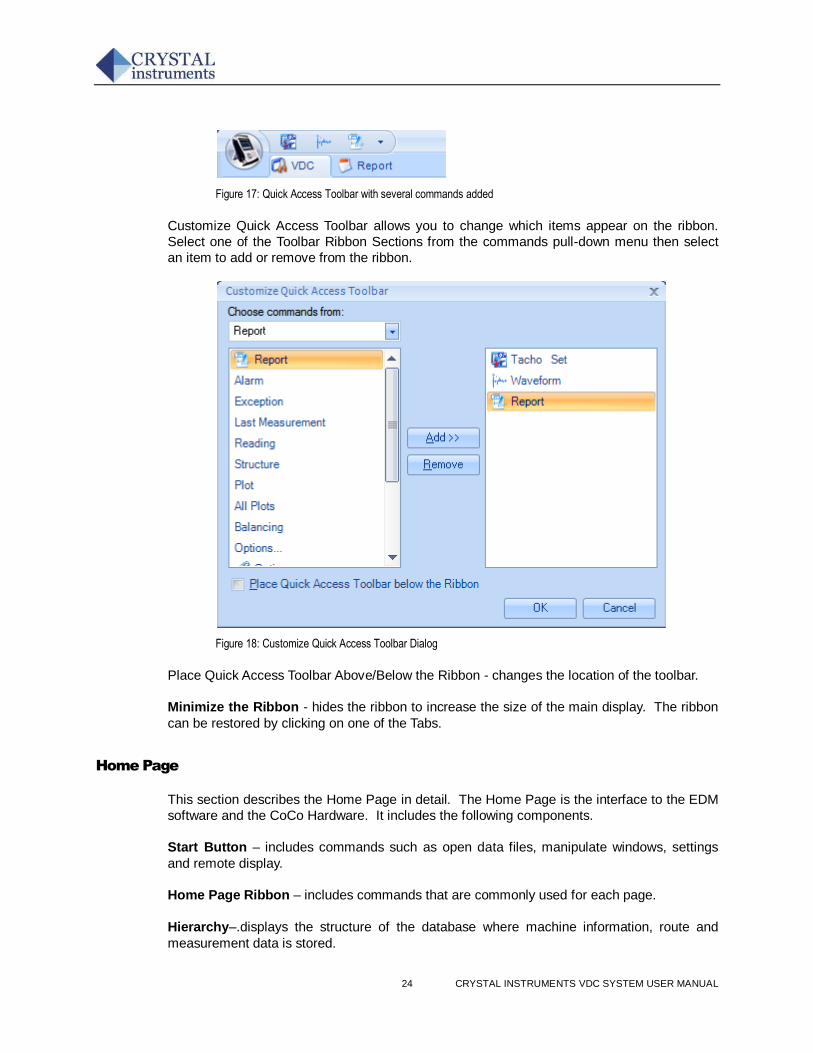
24 CRYSTAL INSTRUMENTS VDC SYSTEM USER MANUAL
Figure 17: Quick Access Toolbar with several commands added
Customize Quick Access Toolbar allows you to change which items appear on the ribbon.
Select one of the Toolbar Ribbon Sections from the commands pull-down menu then select
an item to add or remove from the ribbon.
Figure 18: Customize Quick Access Toolbar Dialog
Place Quick Access Toolbar Above/Below the Ribbon - changes the location of the toolbar.
Minimize the Ribbon - hides the ribbon to increase the size of the main display. The ribbon
can be restored by clicking on one of the Tabs.
Home Page
This section describes the Home Page in detail. The Home Page is the interface to the EDM
software and the CoCo Hardware. It includes the following components.
Start Button – includes commands such as open data files, manipulate windows, settings
and remote display.
Home Page Ribbon – includes commands that are commonly used for each page.
Hierarchy–.displays the structure of the database where machine information, route and
measurement data is stored.
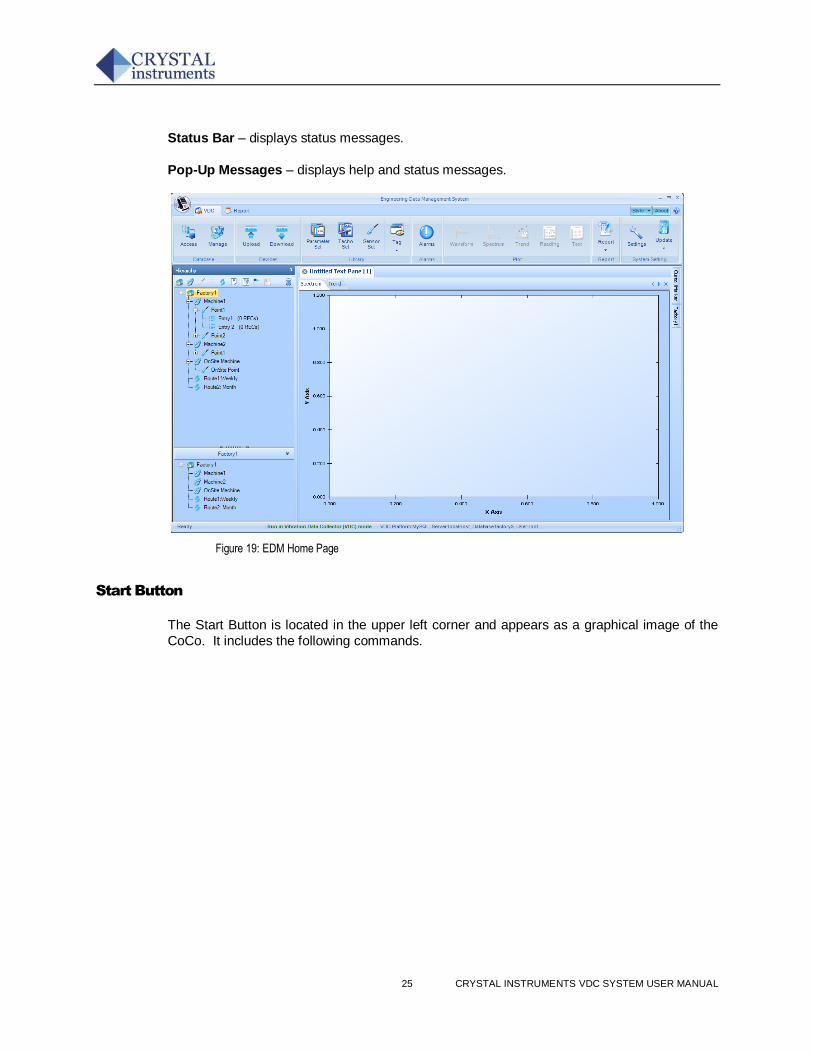
25 CRYSTAL INSTRUMENTS VDC SYSTEM USER MANUAL
Status Bar – displays status messages.
Pop-Up Messages – displays help and status messages.
Figure 19: EDM Home Page
Start Button
The Start Button is located in the upper left corner and appears as a graphical image of the
CoCo. It includes the following commands.
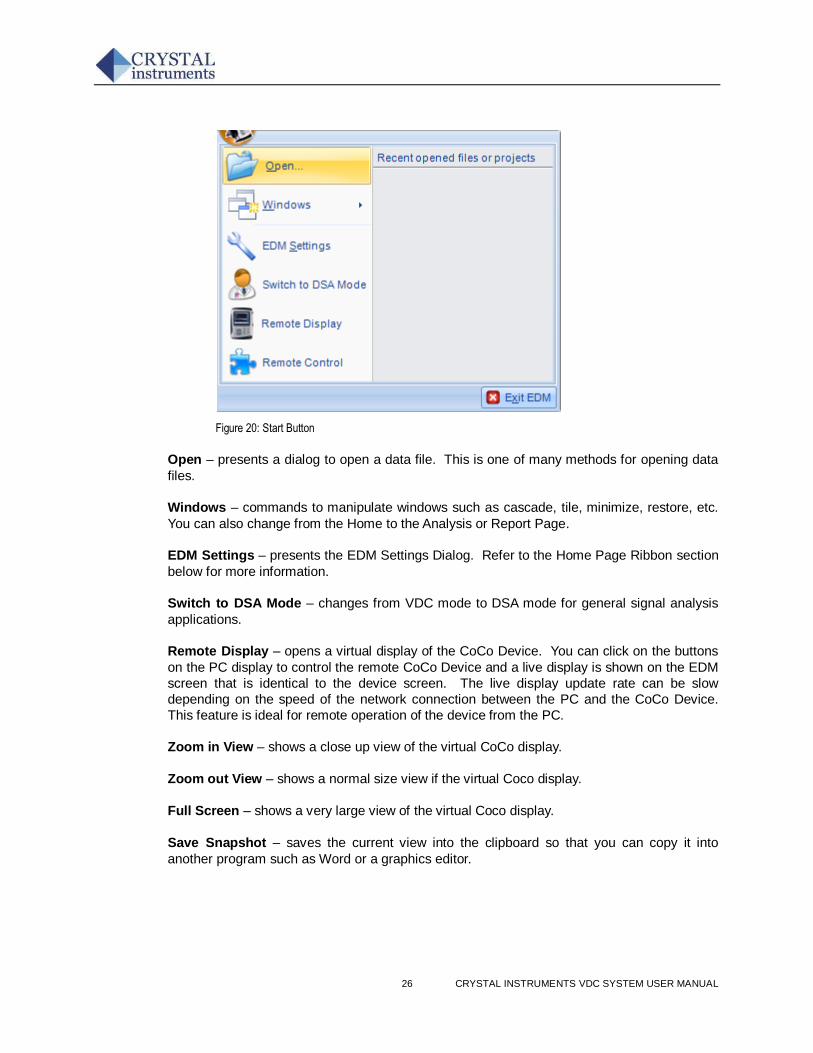
26 CRYSTAL INSTRUMENTS VDC SYSTEM USER MANUAL
Figure 20: Start Button
Open – presents a dialog to open a data file. This is one of many methods for opening data
files.
Windows – commands to manipulate windows such as cascade, tile, minimize, restore, etc.
You can also change from the Home to the Analysis or Report Page.
EDM Settings – presents the EDM Settings Dialog. Refer to the Home Page Ribbon section
below for more information.
Switch to DSA Mode – changes from VDC mode to DSA mode for general signal analysis
applications.
Remote Display – opens a virtual display of the CoCo Device. You can click on the buttons
on the PC display to control the remote CoCo Device and a live display is shown on the EDM
screen that is identical to the device screen. The live display update rate can be slow
depending on the speed of the network connection between the PC and the CoCo Device.
This feature is ideal for remote operation of the device from the PC.
Zoom in View – shows a close up view of the virtual CoCo display.
Zoom out View – shows a normal size view if the virtual Coco display.
Full Screen – shows a very large view of the virtual Coco display.
Save Snapshot – saves the current view into the clipboard so that you can copy it into
another program such as Word or a graphics editor.
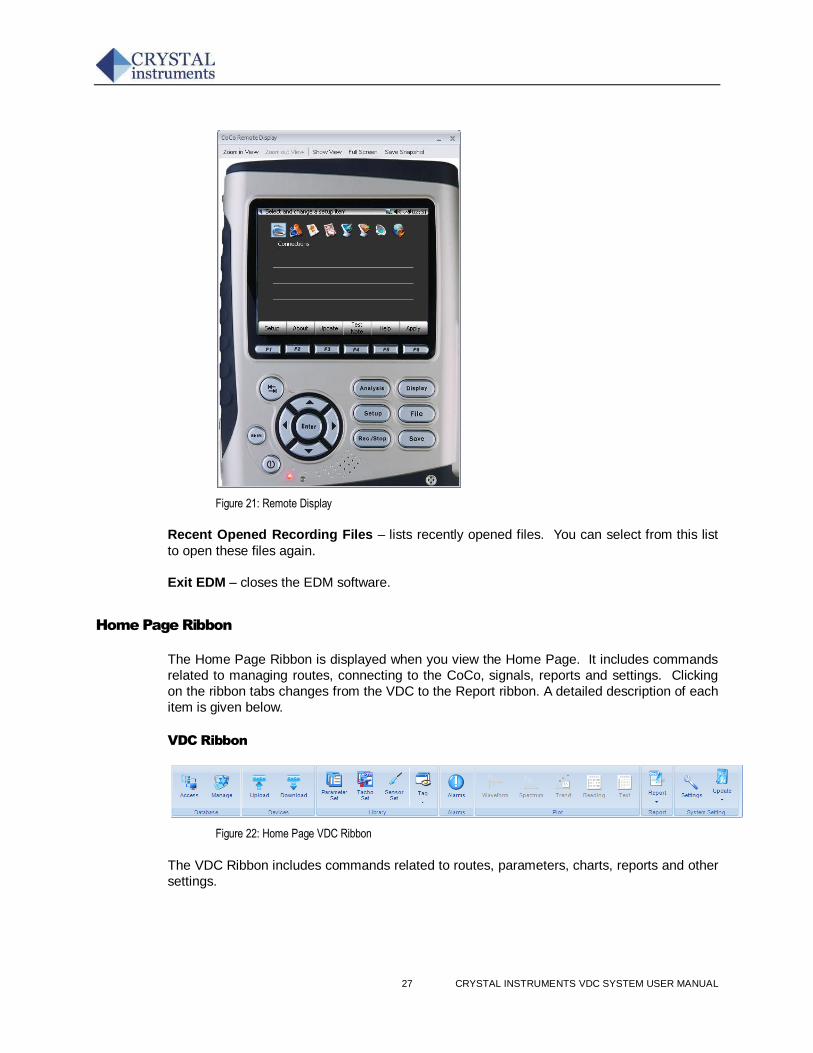
27 CRYSTAL INSTRUMENTS VDC SYSTEM USER MANUAL
Figure 21: Remote Display
Recent Opened Recording Files – lists recently opened files. You can select from this list
to open these files again.
Exit EDM – closes the EDM software.
Home Page Ribbon
The Home Page Ribbon is displayed when you view the Home Page. It includes commands
related to managing routes, connecting to the CoCo, signals, reports and settings. Clicking
on the ribbon tabs changes from the VDC to the Report ribbon. A detailed description of each
item is given below.
VDC Ribbon
Figure 22: Home Page VDC Ribbon
The VDC Ribbon includes commands related to routes, parameters, charts, reports and other
settings.
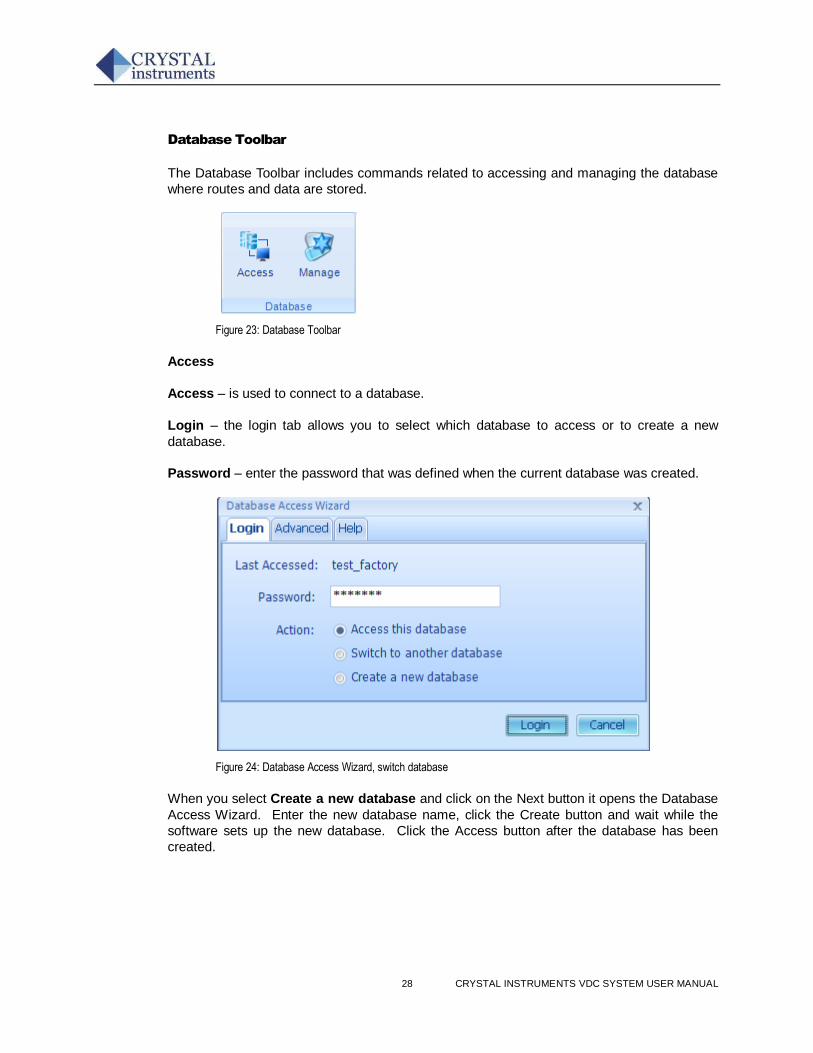
28 CRYSTAL INSTRUMENTS VDC SYSTEM USER MANUAL
Database Toolbar
The Database Toolbar includes commands related to accessing and managing the database
where routes and data are stored.
Figure 23: Database Toolbar
Access
Access – is used to connect to a database.
Login – the login tab allows you to select which database to access or to create a new
database.
Password – enter the password that was defined when the current database was created.
Figure 24: Database Access Wizard, switch database
When you select Create a new database and click on the Next button it opens the Database
Access Wizard. Enter the new database name, click the Create button and wait while the
software sets up the new database. Click the Access button after the database has been
created.
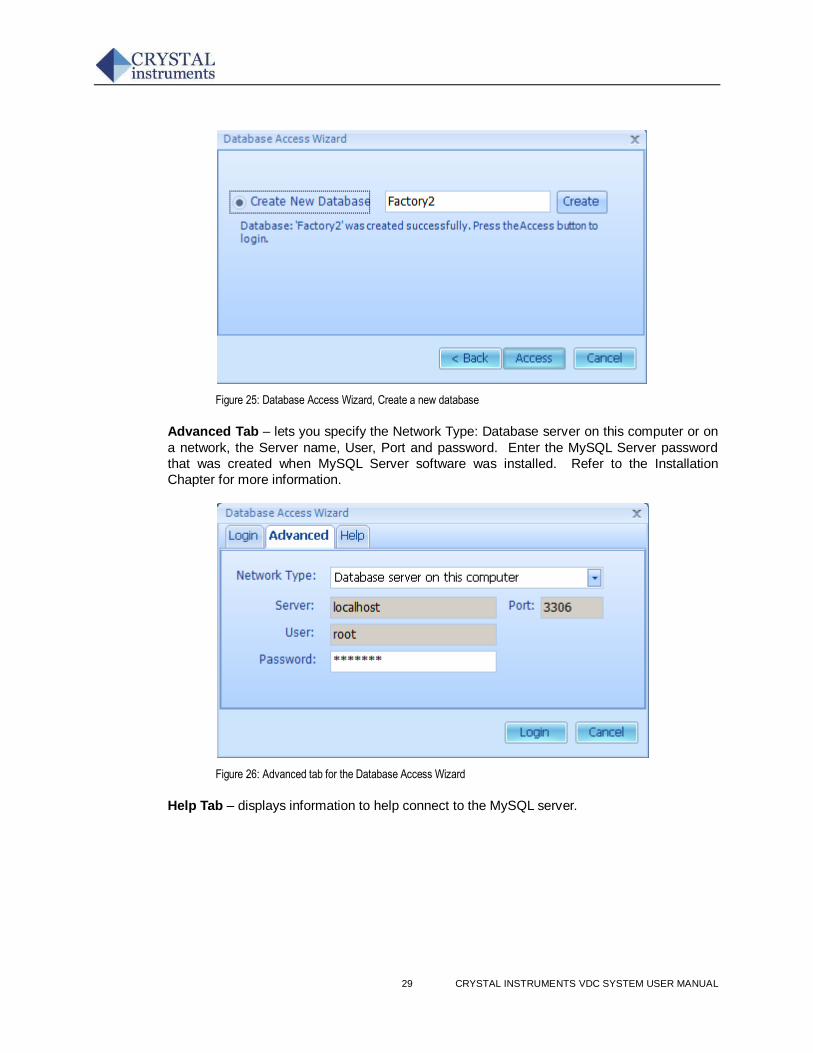
29 CRYSTAL INSTRUMENTS VDC SYSTEM USER MANUAL
Figure 25: Database Access Wizard, Create a new database
Advanced Tab – lets you specify the Network Type: Database server on this computer or on
a network, the Server name, User, Port and password. Enter the MySQL Server password
that was created when MySQL Server software was installed. Refer to the Installation
Chapter for more information.
Figure 26: Advanced tab for the Database Access Wizard
Help Tab – displays information to help connect to the MySQL server.
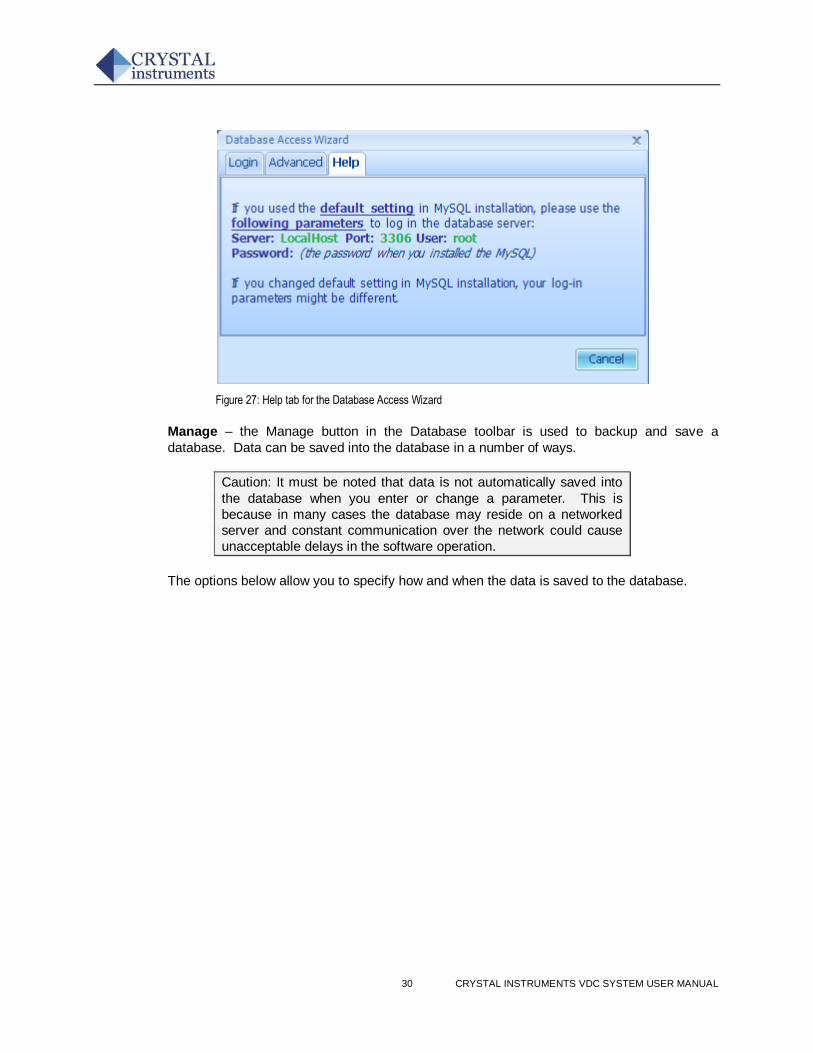
30 CRYSTAL INSTRUMENTS VDC SYSTEM USER MANUAL
Figure 27: Help tab for the Database Access Wizard
Manage – the Manage button in the Database toolbar is used to backup and save a
database. Data can be saved into the database in a number of ways.
Caution: It must be noted that data is not automatically saved into
the database when you enter or change a parameter. This is
because in many cases the database may reside on a networked
server and constant communication over the network could cause
unacceptable delays in the software operation.
The options below allow you to specify how and when the data is saved to the database.
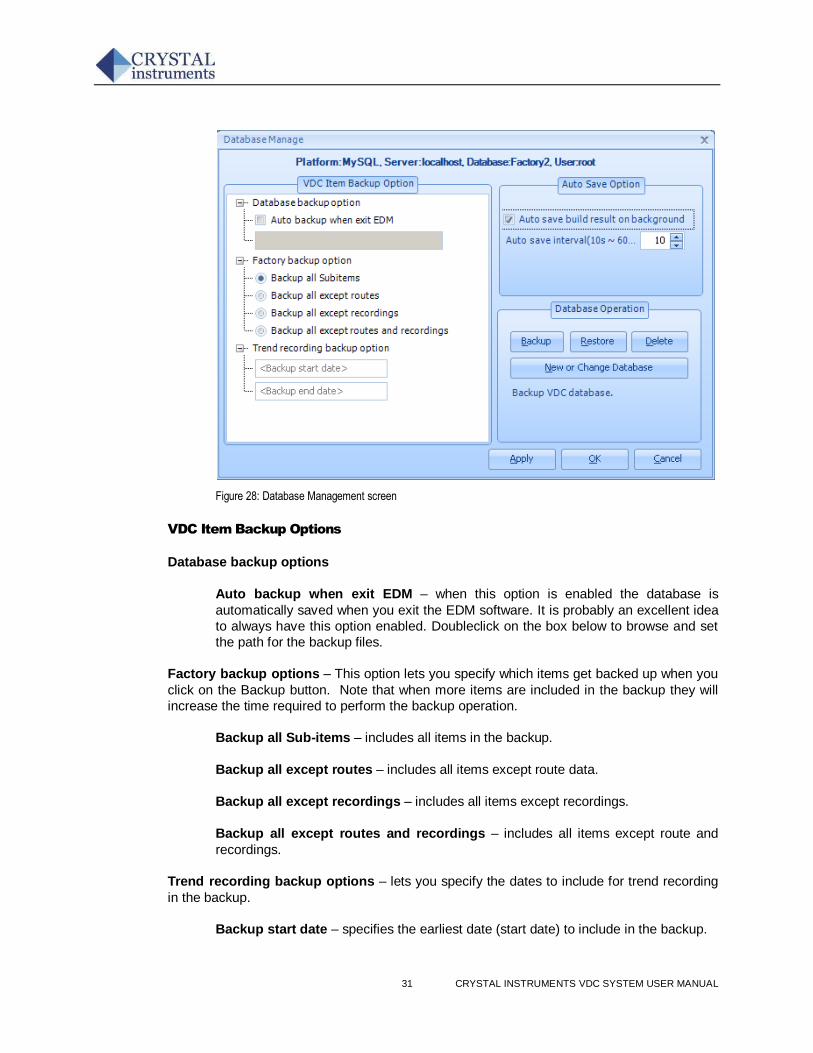
31 CRYSTAL INSTRUMENTS VDC SYSTEM USER MANUAL
Figure 28: Database Management screen
VDC Item Backup Options
Database backup options
Auto backup when exit EDM – when this option is enabled the database is
automatically saved when you exit the EDM software. It is probably an excellent idea
to always have this option enabled. Doubleclick on the box below to browse and set
the path for the backup files.
Factory backup options – This option lets you specify which items get backed up when you
click on the Backup button. Note that when more items are included in the backup they will
increase the time required to perform the backup operation.
Backup all Sub-items – includes all items in the backup.
Backup all except routes – includes all items except route data.
Backup all except recordings – includes all items except recordings.
Backup all except routes and recordings – includes all items except route and
recordings.
Trend recording backup options – lets you specify the dates to include for trend recording
in the backup.
Backup start date – specifies the earliest date (start date) to include in the backup.
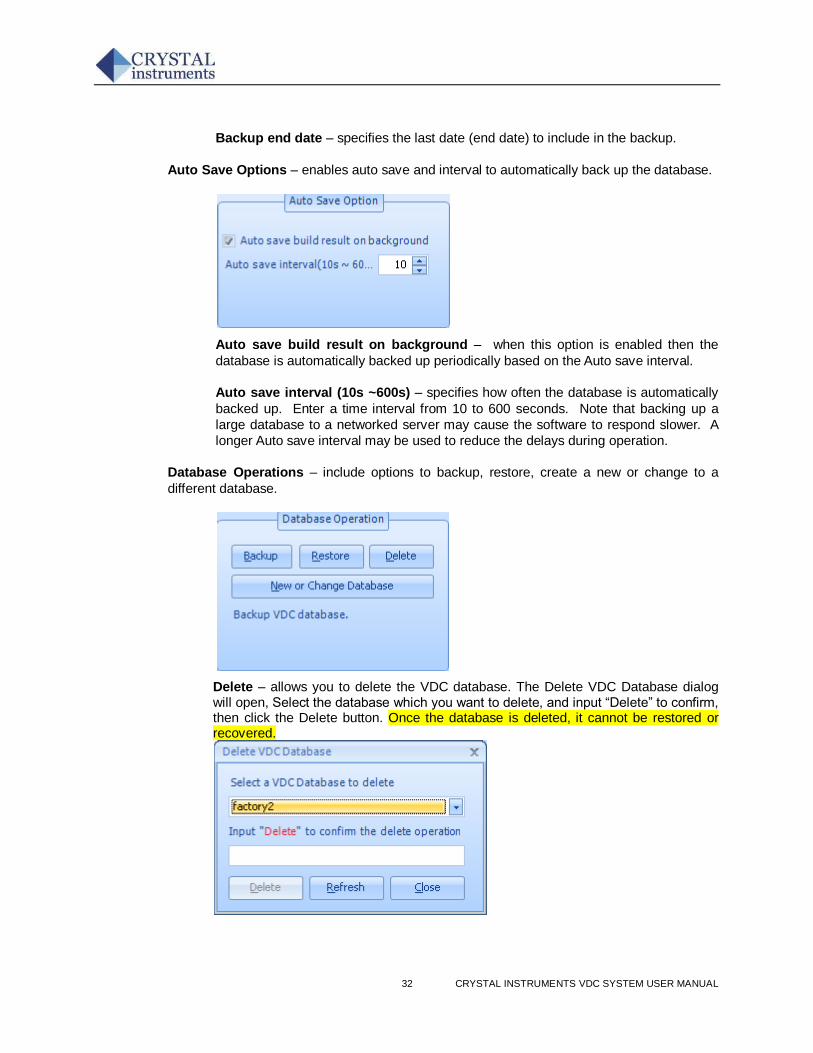
32 CRYSTAL INSTRUMENTS VDC SYSTEM USER MANUAL
Backup end date – specifies the last date (end date) to include in the backup.
Auto Save Options – enables auto save and interval to automatically back up the database.
Auto save build result on background – when this option is enabled then the
database is automatically backed up periodically based on the Auto save interval.
Auto save interval (10s ~600s) – specifies how often the database is automatically
backed up. Enter a time interval from 10 to 600 seconds. Note that backing up a
large database to a networked server may cause the software to respond slower. A
longer Auto save interval may be used to reduce the delays during operation.
Database Operations – include options to backup, restore, create a new or change to a
different database.
Delete – allows you to delete the VDC database. The Delete VDC Database dialog will open, Select the database which you want to delete, and input “Delete” to confirm, then click the Delete button. Once the database is deleted, it cannot be restored or recovered.
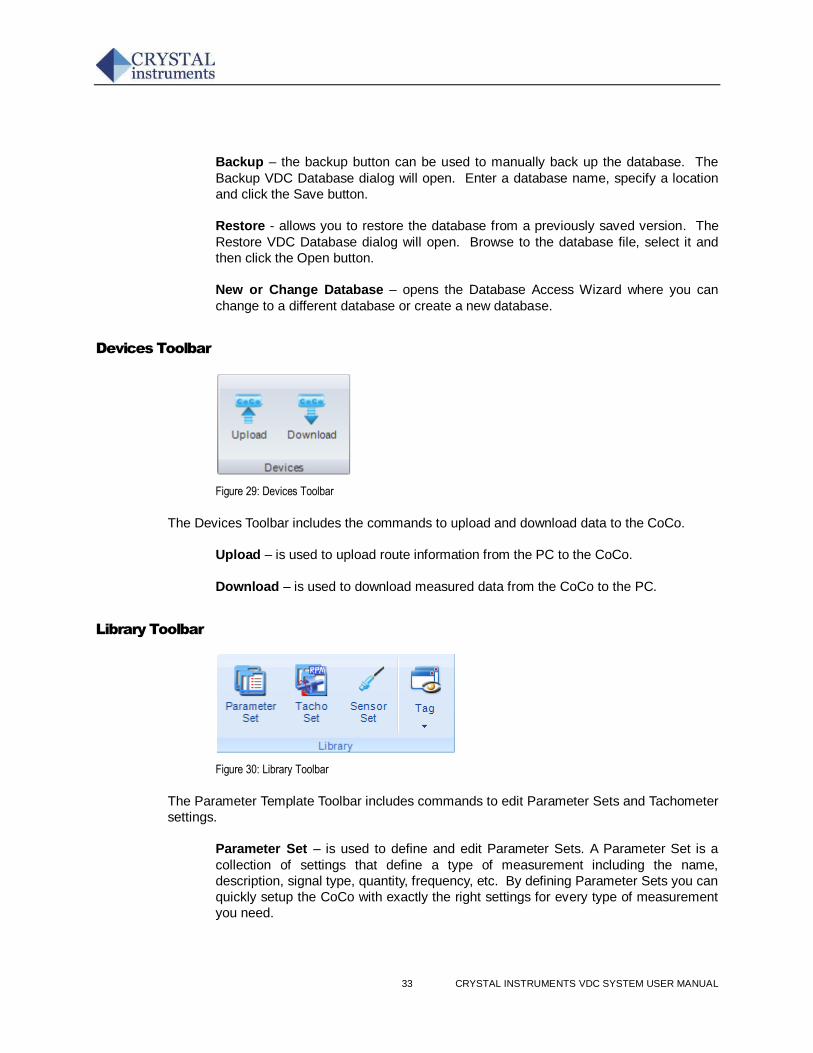
33 CRYSTAL INSTRUMENTS VDC SYSTEM USER MANUAL
Backup – the backup button can be used to manually back up the database. The
Backup VDC Database dialog will open. Enter a database name, specify a location
and click the Save button.
Restore - allows you to restore the database from a previously saved version. The
Restore VDC Database dialog will open. Browse to the database file, select it and
then click the Open button.
New or Change Database – opens the Database Access Wizard where you can
change to a different database or create a new database.
Devices Toolbar
Figure 29: Devices Toolbar
The Devices Toolbar includes the commands to upload and download data to the CoCo.
Upload – is used to upload route information from the PC to the CoCo.
Download – is used to download measured data from the CoCo to the PC.
Library Toolbar
Figure 30: Library Toolbar
The Parameter Template Toolbar includes commands to edit Parameter Sets and Tachometer
settings.
Parameter Set – is used to define and edit Parameter Sets. A Parameter Set is a
collection of settings that define a type of measurement including the name,
description, signal type, quantity, frequency, etc. By defining Parameter Sets you can
quickly setup the CoCo with exactly the right settings for every type of measurement
you need.
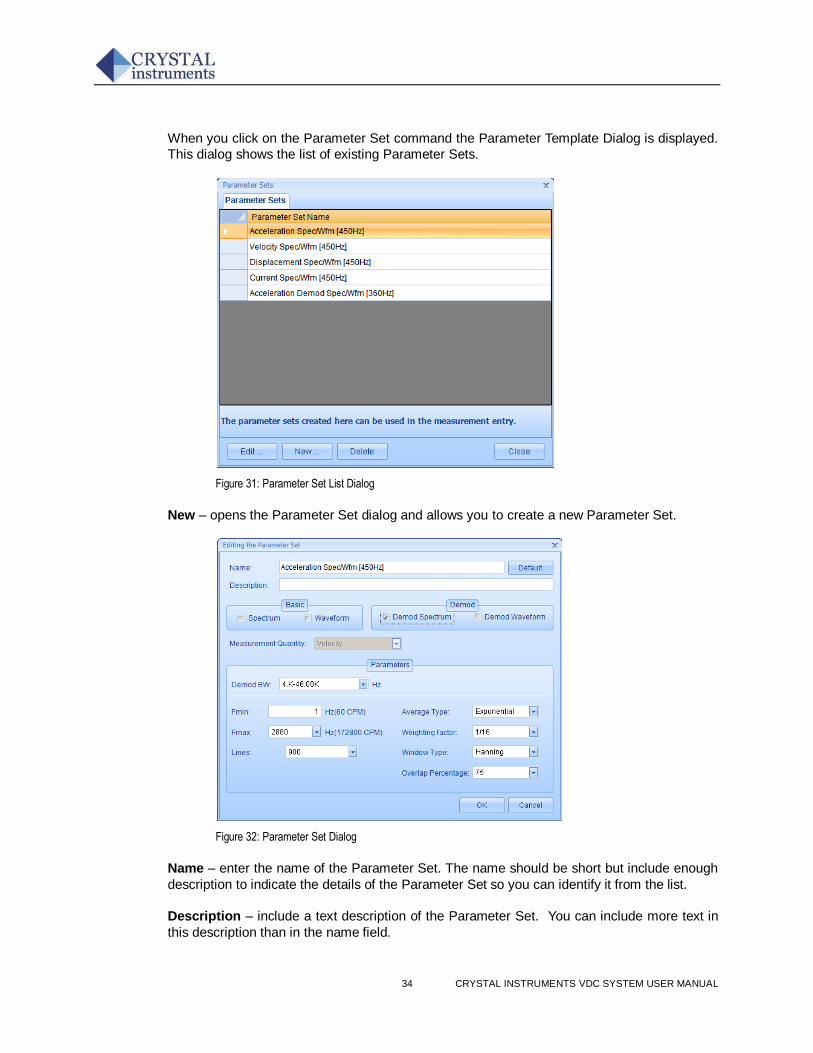
34 CRYSTAL INSTRUMENTS VDC SYSTEM USER MANUAL
When you click on the Parameter Set command the Parameter Template Dialog is displayed.
This dialog shows the list of existing Parameter Sets.
Figure 31: Parameter Set List Dialog
New – opens the Parameter Set dialog and allows you to create a new Parameter Set.
Figure 32: Parameter Set Dialog
Name – enter the name of the Parameter Set. The name should be short but include enough
description to indicate the details of the Parameter Set so you can identify it from the list.
Description – include a text description of the Parameter Set. You can include more text in
this description than in the name field.
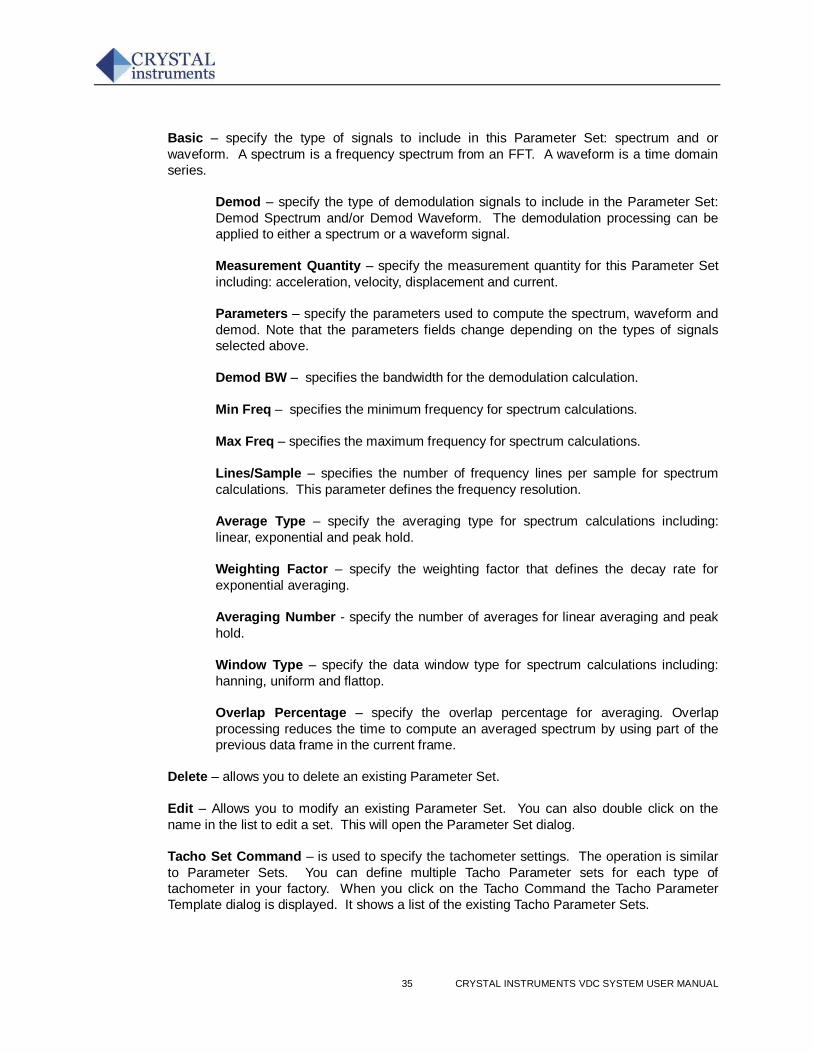
35 CRYSTAL INSTRUMENTS VDC SYSTEM USER MANUAL
Basic – specify the type of signals to include in this Parameter Set: spectrum and or
waveform. A spectrum is a frequency spectrum from an FFT. A waveform is a time domain
series.
Demod – specify the type of demodulation signals to include in the Parameter Set:
Demod Spectrum and/or Demod Waveform. The demodulation processing can be
applied to either a spectrum or a waveform signal.
Measurement Quantity – specify the measurement quantity for this Parameter Set
including: acceleration, velocity, displacement and current.
Parameters – specify the parameters used to compute the spectrum, waveform and
demod. Note that the parameters fields change depending on the types of signals
selected above.
Demod BW – specifies the bandwidth for the demodulation calculation.
Min Freq – specifies the minimum frequency for spectrum calculations.
Max Freq – specifies the maximum frequency for spectrum calculations.
Lines/Sample – specifies the number of frequency lines per sample for spectrum
calculations. This parameter defines the frequency resolution.
Average Type – specify the averaging type for spectrum calculations including:
linear, exponential and peak hold.
Weighting Factor – specify the weighting factor that defines the decay rate for
exponential averaging.
Averaging Number - specify the number of averages for linear averaging and peak
hold.
Window Type – specify the data window type for spectrum calculations including:
hanning, uniform and flattop.
Overlap Percentage – specify the overlap percentage for averaging. Overlap
processing reduces the time to compute an averaged spectrum by using part of the
previous data frame in the current frame.
Delete – allows you to delete an existing Parameter Set.
Edit – Allows you to modify an existing Parameter Set. You can also double click on the
name in the list to edit a set. This will open the Parameter Set dialog.
Tacho Set Command – is used to specify the tachometer settings. The operation is similar
to Parameter Sets. You can define multiple Tacho Parameter sets for each type of
tachometer in your factory. When you click on the Tacho Command the Tacho Parameter
Template dialog is displayed. It shows a list of the existing Tacho Parameter Sets.
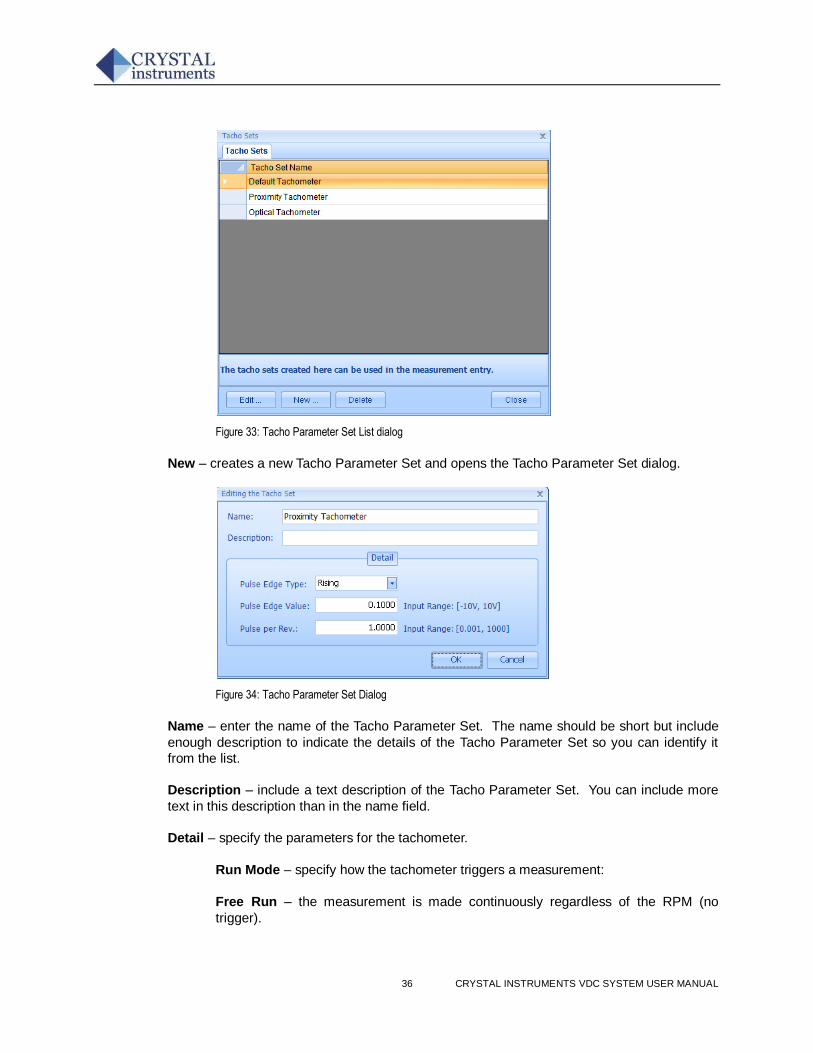
36 CRYSTAL INSTRUMENTS VDC SYSTEM USER MANUAL
Figure 33: Tacho Parameter Set List dialog
New – creates a new Tacho Parameter Set and opens the Tacho Parameter Set dialog.
Figure 34: Tacho Parameter Set Dialog
Name – enter the name of the Tacho Parameter Set. The name should be short but include
enough description to indicate the details of the Tacho Parameter Set so you can identify it
from the list.
Description – include a text description of the Tacho Parameter Set. You can include more
text in this description than in the name field.
Detail – specify the parameters for the tachometer.
Run Mode – specify how the tachometer triggers a measurement:
Free Run – the measurement is made continuously regardless of the RPM (no
trigger).
37 CRYSTAL INSTRUMENTS VDC SYSTEM USER MANUAL
Run Up – the measurement is triggered when the RPM starts below and increases
above the minimum RPM value. The measurement stops when the RPM increases
above the maximum RPM value.
Run Down – the measurement is triggered when the RPM starts above and
decreases below the maximum RPM value. The measurement stops when the RPM
decreases below the minimum RPM value.
Run Up and Down – the measurement is triggered when the RPM increases above
the minimum RPM value, pauses when the RPM increases above the maximum
RPM value but starts again if the RPM decreases below the maximum RPM value.
The measurement stops when the RPM decreases below the minimum RPM value.
Run Down and Up – the measurement is triggered when the RPM decreases below
above the maximum RPM value, pauses when the RPM decreases below the
minimum RPM value but starts again if the RPM increases above the minimum RPM
value. The measurement stops when the RPM increases above the maximum RPM
value.
Pulse Edge Type – specifies when the tachometer should record a pulse from the
tachometer sensor: leading edge or falling edge.
Pulse Edge Value – specifies the voltage that must be exceed to detect a tachometer pulse.
Pulse per Rev – specifies the number of pulses that the tachometer generates with one
revolution of the machine.
Edit – highlight an existing Tacho Parameter Set and click the Edit button. This opens the
Tacho Parameter Set dialog and allows you to modify the parameters. You can also double
click on an existing Tacho Parameter Set from the list to edit it.
Delete – highlight an existing Tacho Parameter Set and click the Delete button to remove
(delete) it from the list.
Sensor Set Command
The Sensor Set Toolbar is used to define Sensor Parameter Sets. You can define multiple
Sensor Parameter Sets for each type of sensor you use in your factory.
Click on the Sensor Set Toolbar button to open the Sensor Manager dialog. A list of the
existing Sensor Sets is shown.
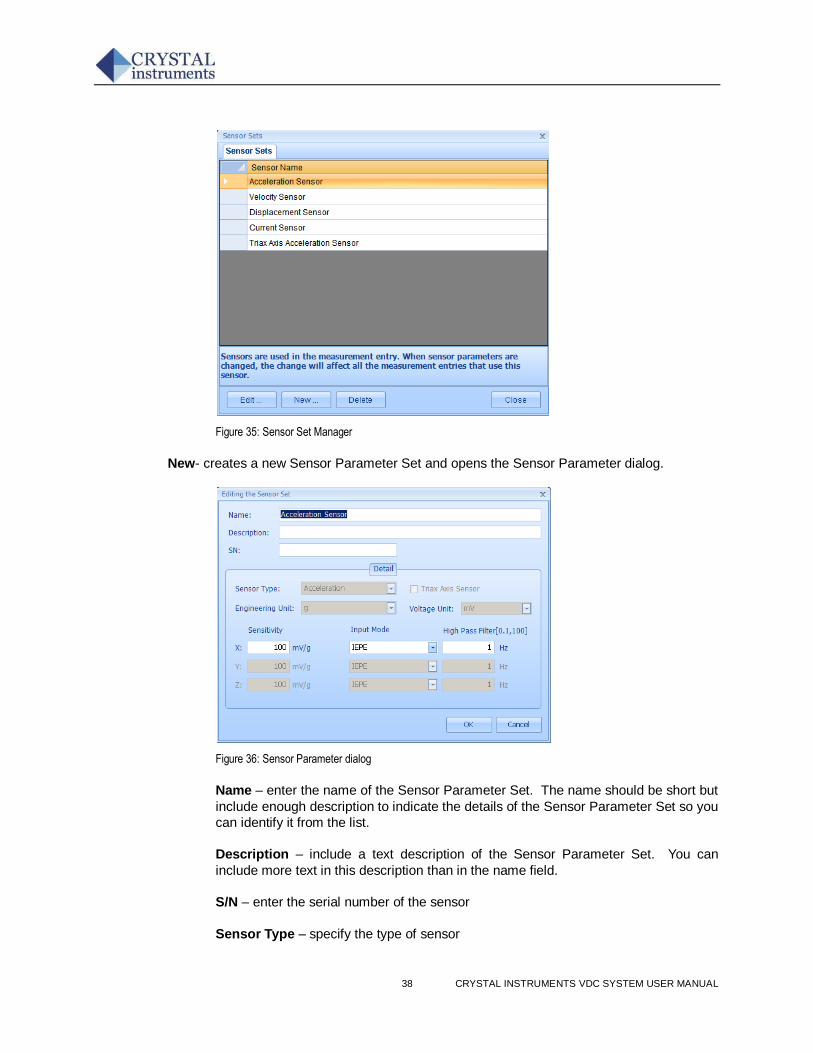
38 CRYSTAL INSTRUMENTS VDC SYSTEM USER MANUAL
Figure 35: Sensor Set Manager
New- creates a new Sensor Parameter Set and opens the Sensor Parameter dialog.
Figure 36: Sensor Parameter dialog
Name – enter the name of the Sensor Parameter Set. The name should be short but
include enough description to indicate the details of the Sensor Parameter Set so you
can identify it from the list.
Description – include a text description of the Sensor Parameter Set. You can
include more text in this description than in the name field.
S/N – enter the serial number of the sensor
Sensor Type – specify the type of sensor
39 CRYSTAL INSTRUMENTS VDC SYSTEM USER MANUAL
Tri Axis Sensor – indicate if the sensor is a tri axial sensor. When this option is
enabled then the Y and Z axis parameters are enabled.
Engineering Unit – specify the engineering units for the sensor.
Voltage Unit – specify the voltage units
Sensitivity – specify the sensor sensitivity or gain in mv/engineering unit.
Input Mode – specify the input mode including: AD-Differential, DC-Differential, AC-
Single End, DC-Single End and IEPE (loop powered).
High Pass Filter – specify the transition frequency for high pass filtering: 0.1 to 100
Hz. This parameter is used for AC Input Mode and IEPE.
Edit – highlight an existing Sensor Parameter Set and click the Edit button. This opens the
Sensor Parameter Set dialog and allows you to modify the parameters. You can also double
click on an existing Set from the list to edit it.
Delete – highlight an existing Sensor Parameter Set and click the Delete button to remove
(delete) it from the list.
Alarm Toolbar
Figure 37: Alarm Toolbar
Plot Toolbar
Figure 38: Plot Toolbar
The Plot Toolbar includes commands for viewing waveforms, spectra, trends and text.
Report Toolbar
The Report Toolbar includes commands to define settings for different types of reports. This
is used to define what information appears in a report.
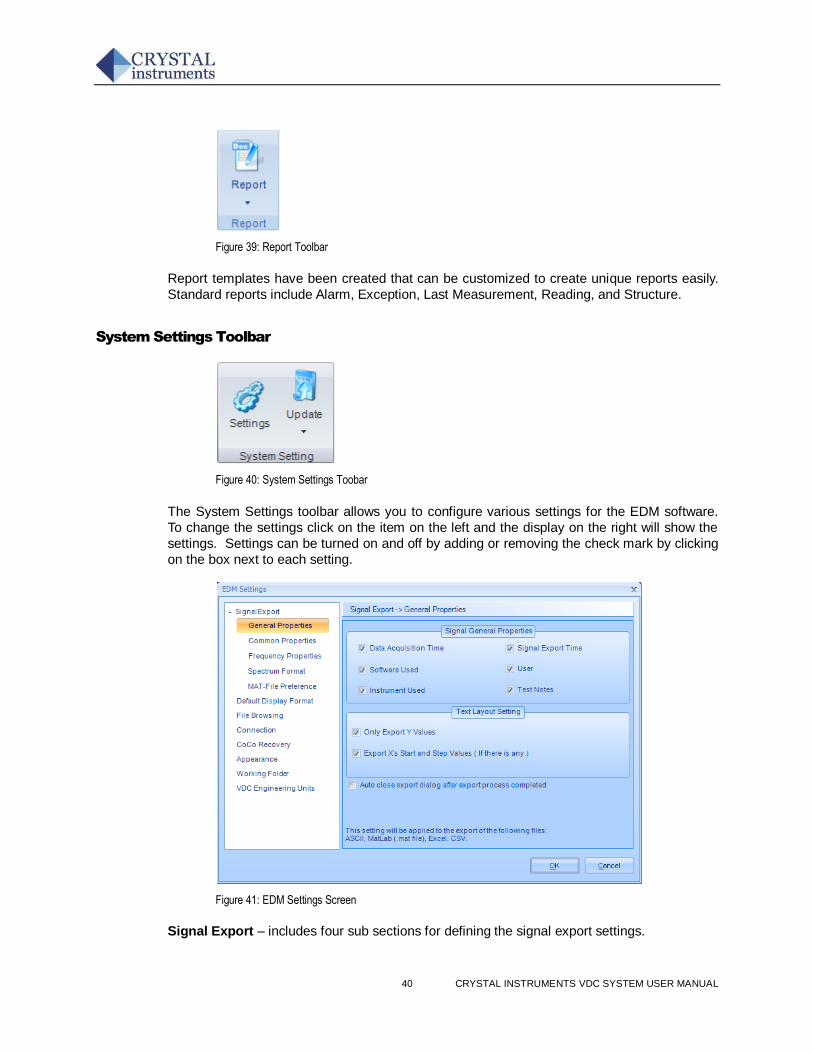
40 CRYSTAL INSTRUMENTS VDC SYSTEM USER MANUAL
Figure 39: Report Toolbar
Report templates have been created that can be customized to create unique reports easily.
Standard reports include Alarm, Exception, Last Measurement, Reading, and Structure.
System Settings Toolbar
Figure 40: System Settings Toobar
The System Settings toolbar allows you to configure various settings for the EDM software.
To change the settings click on the item on the left and the display on the right will show the
settings. Settings can be turned on and off by adding or removing the check mark by clicking
on the box next to each setting.
Figure 41: EDM Settings Screen
Signal Export – includes four sub sections for defining the signal export settings.
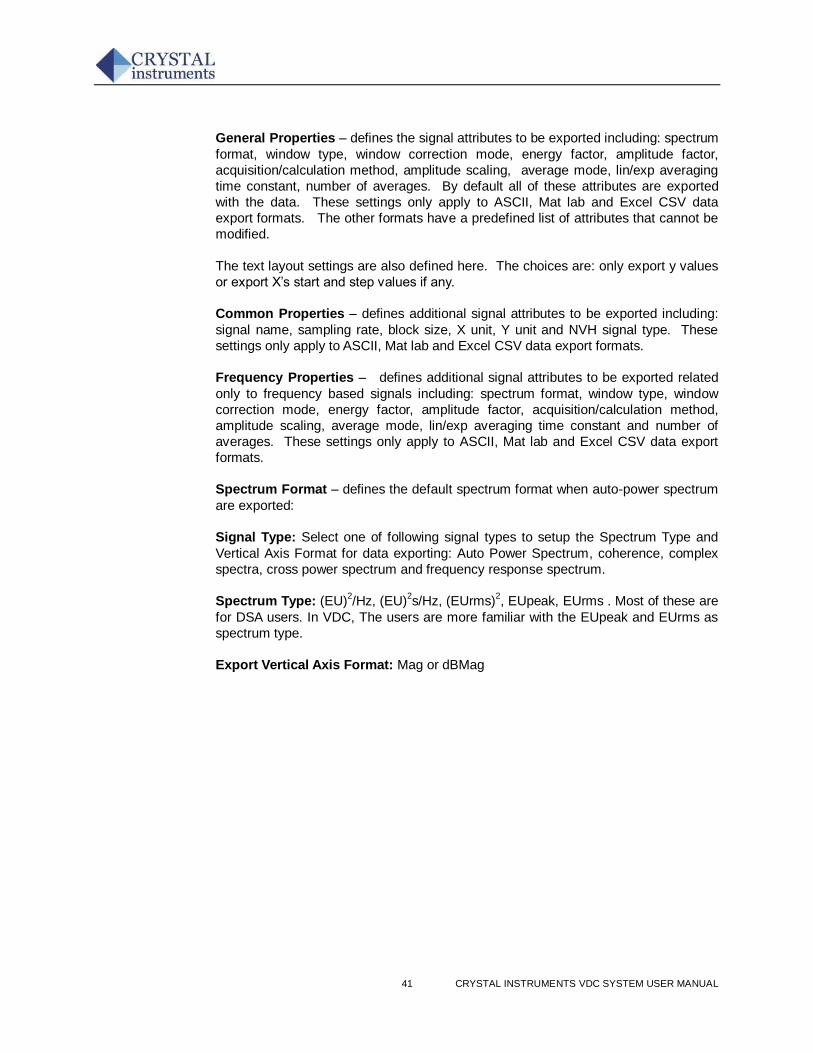
41 CRYSTAL INSTRUMENTS VDC SYSTEM USER MANUAL
General Properties – defines the signal attributes to be exported including: spectrum
format, window type, window correction mode, energy factor, amplitude factor,
acquisition/calculation method, amplitude scaling, average mode, lin/exp averaging
time constant, number of averages. By default all of these attributes are exported
with the data. These settings only apply to ASCII, Mat lab and Excel CSV data
export formats. The other formats have a predefined list of attributes that cannot be
modified.
The text layout settings are also defined here. The choices are: only export y values
or export X’s start and step values if any.
Common Properties – defines additional signal attributes to be exported including:
signal name, sampling rate, block size, X unit, Y unit and NVH signal type. These
settings only apply to ASCII, Mat lab and Excel CSV data export formats.
Frequency Properties – defines additional signal attributes to be exported related
only to frequency based signals including: spectrum format, window type, window
correction mode, energy factor, amplitude factor, acquisition/calculation method,
amplitude scaling, average mode, lin/exp averaging time constant and number of
averages. These settings only apply to ASCII, Mat lab and Excel CSV data export
formats.
Spectrum Format – defines the default spectrum format when auto-power spectrum
are exported:
Signal Type: Select one of following signal types to setup the Spectrum Type and
Vertical Axis Format for data exporting: Auto Power Spectrum, coherence, complex
spectra, cross power spectrum and frequency response spectrum.
Spectrum Type: (EU)2/Hz, (EU)
2s/Hz, (EUrms)
2, EUpeak, EUrms . Most of these are
for DSA users. In VDC, The users are more familiar with the EUpeak and EUrms as
spectrum type.
Export Vertical Axis Format: Mag or dBMag
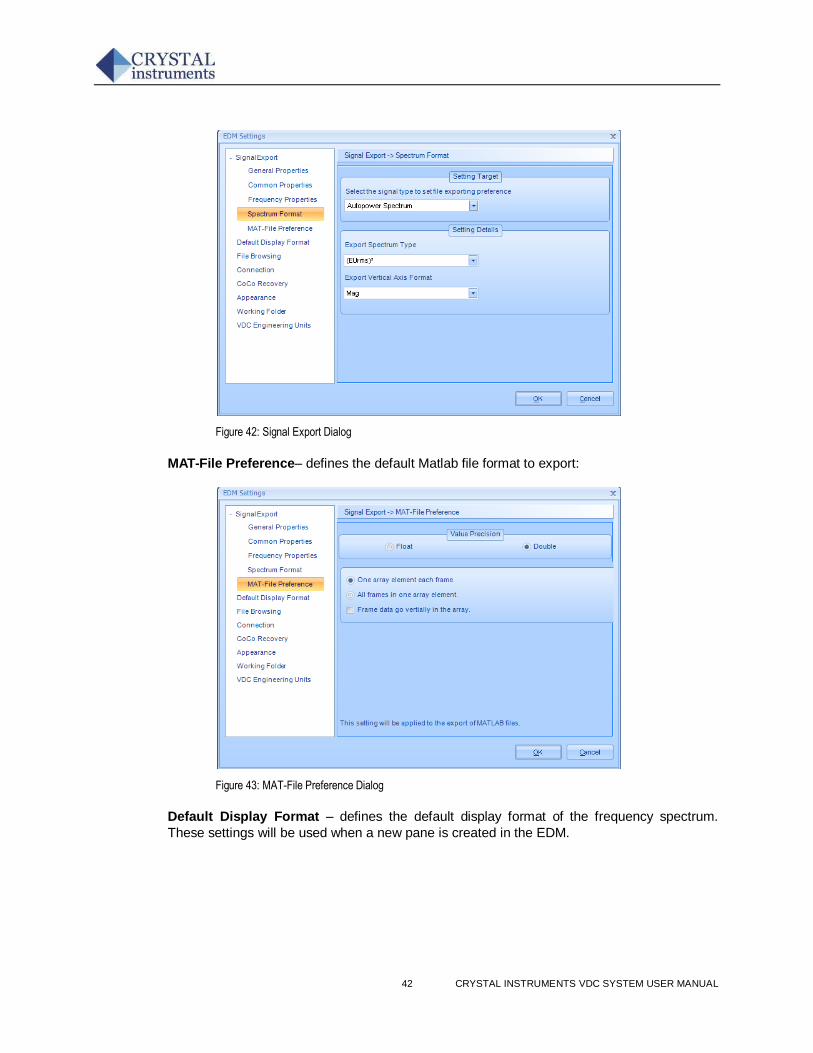
42 CRYSTAL INSTRUMENTS VDC SYSTEM USER MANUAL
Figure 42: Signal Export Dialog
MAT-File Preference– defines the default Matlab file format to export:
Figure 43: MAT-File Preference Dialog
Default Display Format – defines the default display format of the frequency spectrum.
These settings will be used when a new pane is created in the EDM.
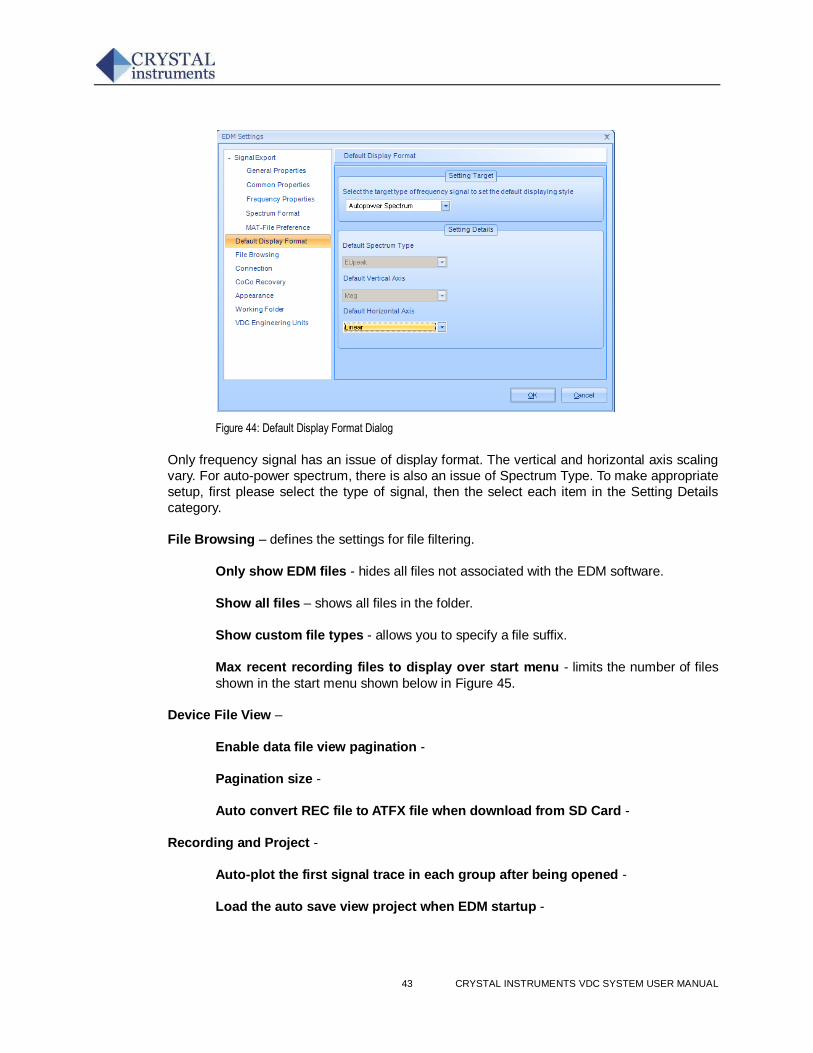
43 CRYSTAL INSTRUMENTS VDC SYSTEM USER MANUAL
Figure 44: Default Display Format Dialog
Only frequency signal has an issue of display format. The vertical and horizontal axis scaling
vary. For auto-power spectrum, there is also an issue of Spectrum Type. To make appropriate
setup, first please select the type of signal, then the select each item in the Setting Details
category.
File Browsing – defines the settings for file filtering.
Only show EDM files - hides all files not associated with the EDM software.
Show all files – shows all files in the folder.
Show custom file types - allows you to specify a file suffix.
Max recent recording files to display over start menu - limits the number of files
shown in the start menu shown below in Figure 45.
Device File View –
Enable data file view pagination -
Pagination size -
Auto convert REC file to ATFX file when download from SD Card -
Recording and Project -
Auto-plot the first signal trace in each group after being opened -
Load the auto save view project when EDM startup -
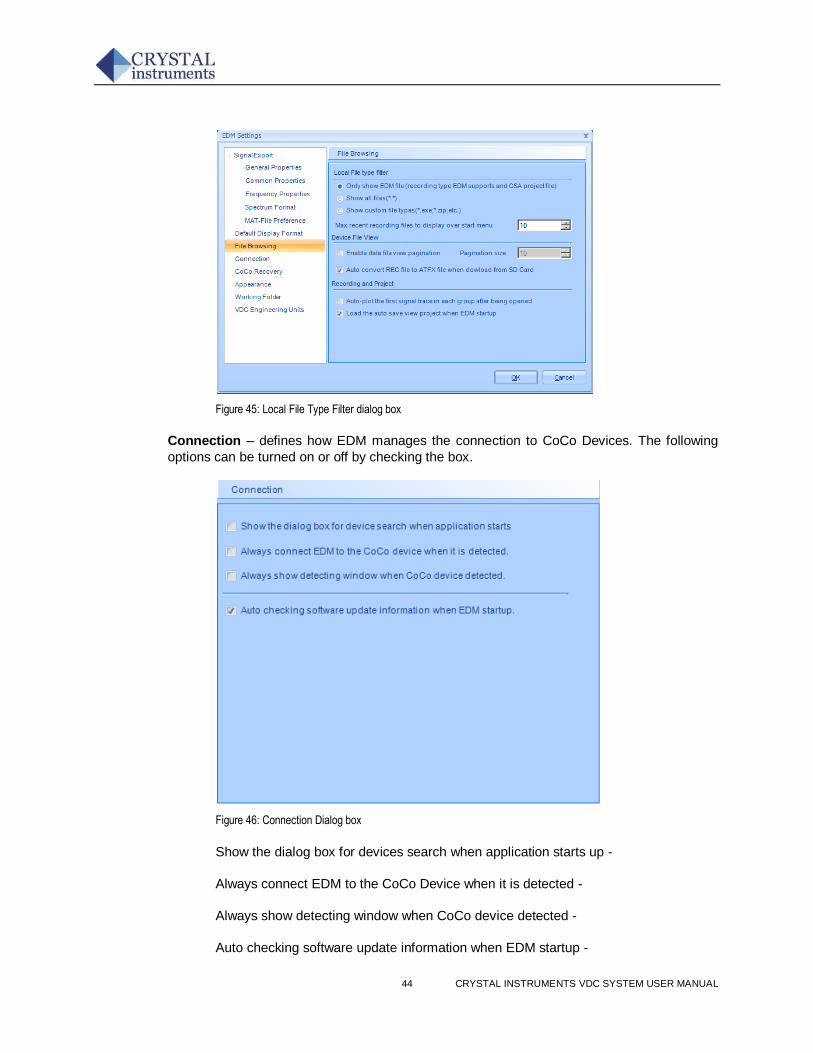
44 CRYSTAL INSTRUMENTS VDC SYSTEM USER MANUAL
Figure 45: Local File Type Filter dialog box
Connection – defines how EDM manages the connection to CoCo Devices. The following
options can be turned on or off by checking the box.
Figure 46: Connection Dialog box
Show the dialog box for devices search when application starts up -
Always connect EDM to the CoCo Device when it is detected -
Always show detecting window when CoCo device detected -
Auto checking software update information when EDM startup -
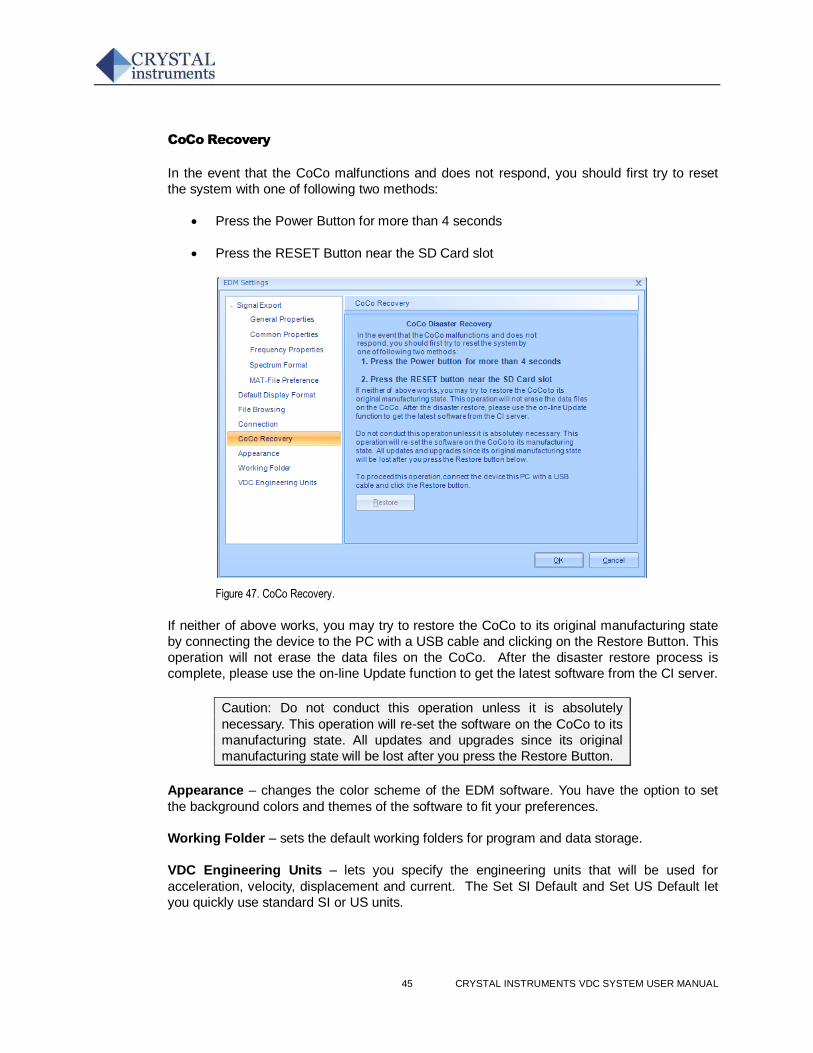
45 CRYSTAL INSTRUMENTS VDC SYSTEM USER MANUAL
CoCo Recovery
In the event that the CoCo malfunctions and does not respond, you should first try to reset
the system with one of following two methods:
Press the Power Button for more than 4 seconds
Press the RESET Button near the SD Card slot
Figure 47. CoCo Recovery.
If neither of above works, you may try to restore the CoCo to its original manufacturing state
by connecting the device to the PC with a USB cable and clicking on the Restore Button. This
operation will not erase the data files on the CoCo. After the disaster restore process is
complete, please use the on-line Update function to get the latest software from the CI server.
Caution: Do not conduct this operation unless it is absolutely
necessary. This operation will re-set the software on the CoCo to its
manufacturing state. All updates and upgrades since its original
manufacturing state will be lost after you press the Restore Button.
Appearance – changes the color scheme of the EDM software. You have the option to set
the background colors and themes of the software to fit your preferences.
Working Folder – sets the default working folders for program and data storage.
VDC Engineering Units – lets you specify the engineering units that will be used for
acceleration, velocity, displacement and current. The Set SI Default and Set US Default let
you quickly use standard SI or US units.
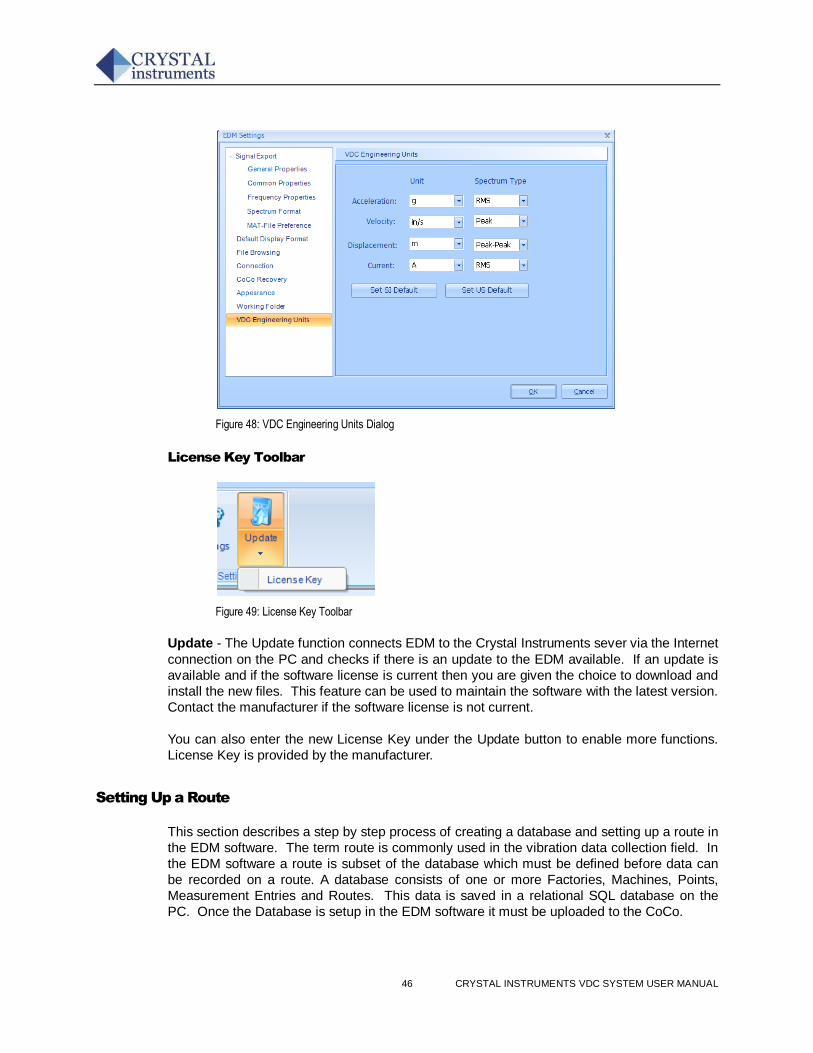
46 CRYSTAL INSTRUMENTS VDC SYSTEM USER MANUAL
Figure 48: VDC Engineering Units Dialog
License Key Toolbar
Figure 49: License Key Toolbar
Update - The Update function connects EDM to the Crystal Instruments sever via the Internet
connection on the PC and checks if there is an update to the EDM available. If an update is
available and if the software license is current then you are given the choice to download and
install the new files. This feature can be used to maintain the software with the latest version.
Contact the manufacturer if the software license is not current.
You can also enter the new License Key under the Update button to enable more functions.
License Key is provided by the manufacturer.
Setting Up a Route
This section describes a step by step process of creating a database and setting up a route in
the EDM software. The term route is commonly used in the vibration data collection field. In
the EDM software a route is subset of the database which must be defined before data can
be recorded on a route. A database consists of one or more Factories, Machines, Points,
Measurement Entries and Routes. This data is saved in a relational SQL database on the
PC. Once the Database is setup in the EDM software it must be uploaded to the CoCo.
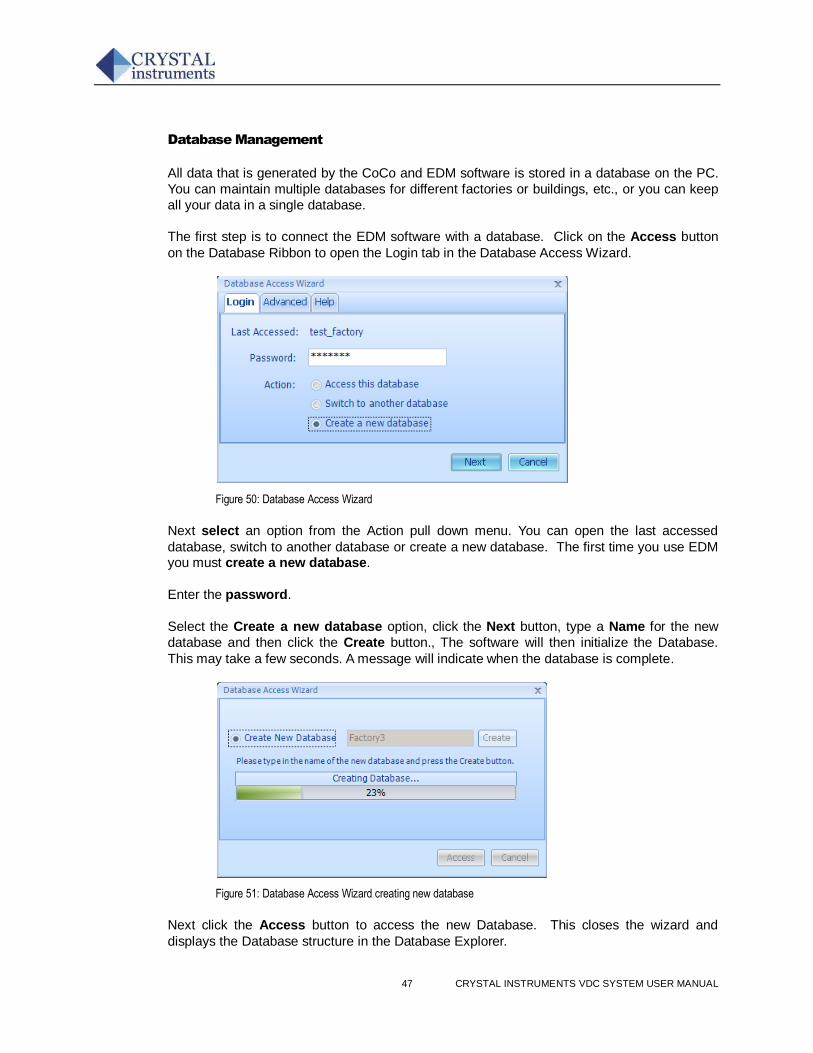
47 CRYSTAL INSTRUMENTS VDC SYSTEM USER MANUAL
Database Management
All data that is generated by the CoCo and EDM software is stored in a database on the PC.
You can maintain multiple databases for different factories or buildings, etc., or you can keep
all your data in a single database.
The first step is to connect the EDM software with a database. Click on the Access button
on the Database Ribbon to open the Login tab in the Database Access Wizard.
Figure 50: Database Access Wizard
Next select an option from the Action pull down menu. You can open the last accessed
database, switch to another database or create a new database. The first time you use EDM you must create a new database.
Enter the password.
Select the Create a new database option, click the Next button, type a Name for the new
database and then click the Create button., The software will then initialize the Database.
This may take a few seconds. A message will indicate when the database is complete.
Figure 51: Database Access Wizard creating new database
Next click the Access button to access the new Database. This closes the wizard and
displays the Database structure in the Database Explorer.
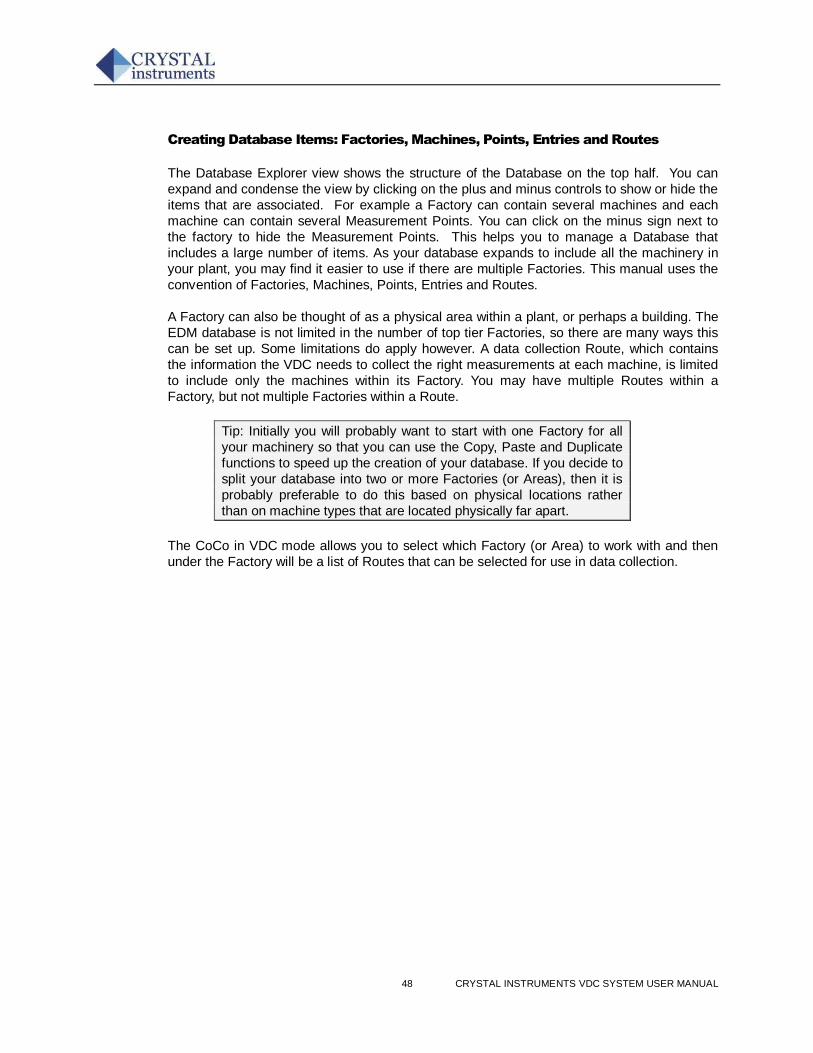
48 CRYSTAL INSTRUMENTS VDC SYSTEM USER MANUAL
Creating Database Items: Factories, Machines, Points, Entries and Routes
The Database Explorer view shows the structure of the Database on the top half. You can
expand and condense the view by clicking on the plus and minus controls to show or hide the
items that are associated. For example a Factory can contain several machines and each
machine can contain several Measurement Points. You can click on the minus sign next to
the factory to hide the Measurement Points. This helps you to manage a Database that
includes a large number of items. As your database expands to include all the machinery in
your plant, you may find it easier to use if there are multiple Factories. This manual uses the
convention of Factories, Machines, Points, Entries and Routes.
A Factory can also be thought of as a physical area within a plant, or perhaps a building. The
EDM database is not limited in the number of top tier Factories, so there are many ways this
can be set up. Some limitations do apply however. A data collection Route, which contains
the information the VDC needs to collect the right measurements at each machine, is limited
to include only the machines within its Factory. You may have multiple Routes within a
Factory, but not multiple Factories within a Route.
Tip: Initially you will probably want to start with one Factory for all
your machinery so that you can use the Copy, Paste and Duplicate
functions to speed up the creation of your database. If you decide to
split your database into two or more Factories (or Areas), then it is
probably preferable to do this based on physical locations rather
than on machine types that are located physically far apart.
The CoCo in VDC mode allows you to select which Factory (or Area) to work with and then
under the Factory will be a list of Routes that can be selected for use in data collection.
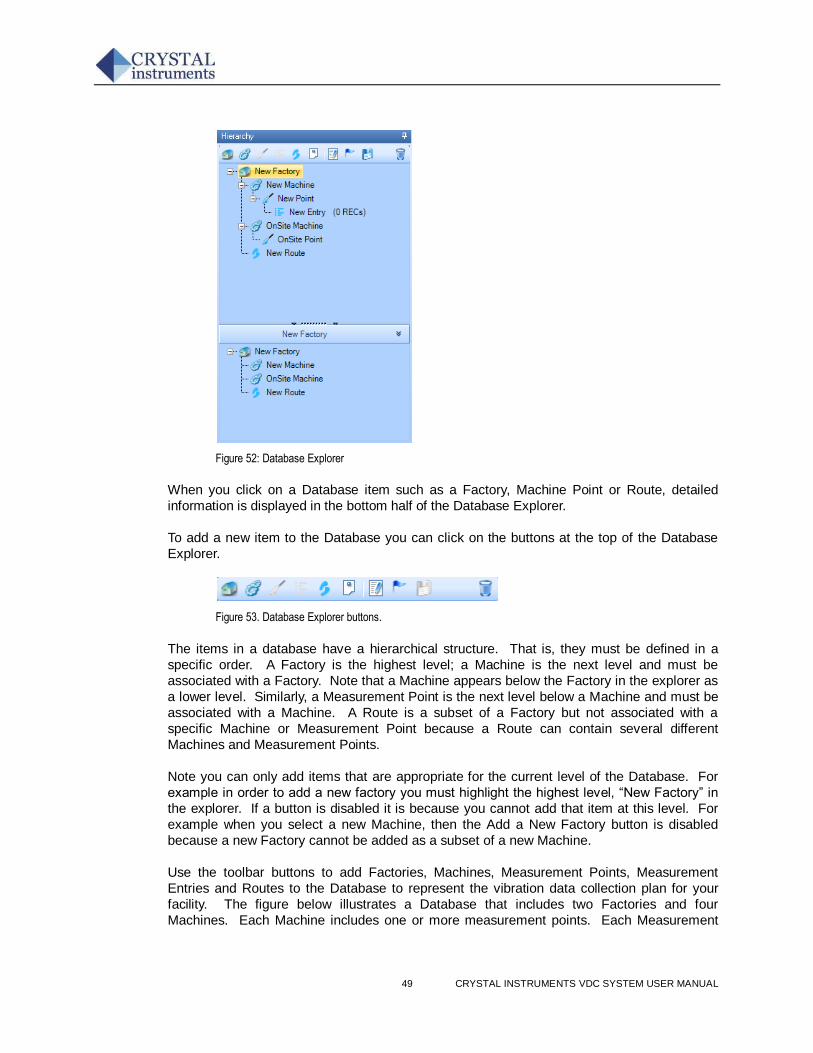
49 CRYSTAL INSTRUMENTS VDC SYSTEM USER MANUAL
Figure 52: Database Explorer
When you click on a Database item such as a Factory, Machine Point or Route, detailed
information is displayed in the bottom half of the Database Explorer.
To add a new item to the Database you can click on the buttons at the top of the Database
Explorer.
Figure 53. Database Explorer buttons.
The items in a database have a hierarchical structure. That is, they must be defined in a
specific order. A Factory is the highest level; a Machine is the next level and must be
associated with a Factory. Note that a Machine appears below the Factory in the explorer as
a lower level. Similarly, a Measurement Point is the next level below a Machine and must be
associated with a Machine. A Route is a subset of a Factory but not associated with a
specific Machine or Measurement Point because a Route can contain several different
Machines and Measurement Points.
Note you can only add items that are appropriate for the current level of the Database. For
example in order to add a new factory you must highlight the highest level, “New Factory” in
the explorer. If a button is disabled it is because you cannot add that item at this level. For
example when you select a new Machine, then the Add a New Factory button is disabled
because a new Factory cannot be added as a subset of a new Machine.
Use the toolbar buttons to add Factories, Machines, Measurement Points, Measurement
Entries and Routes to the Database to represent the vibration data collection plan for your
facility. The figure below illustrates a Database that includes two Factories and four
Machines. Each Machine includes one or more measurement points. Each Measurement
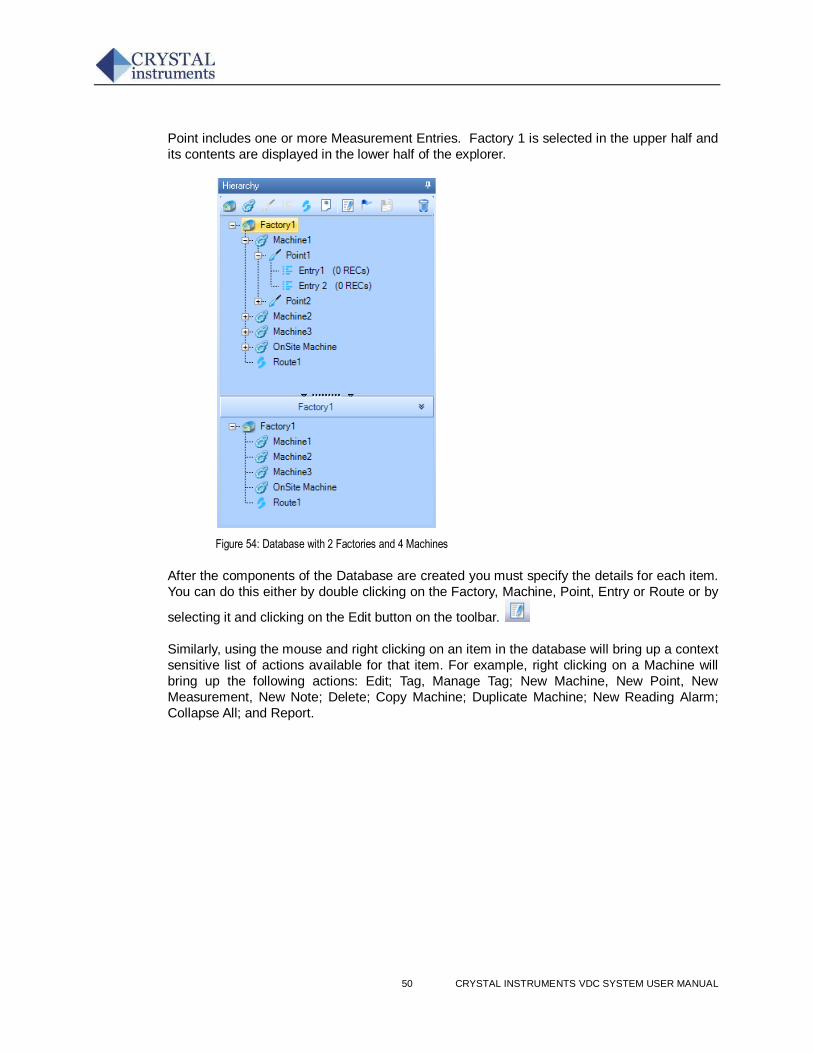
50 CRYSTAL INSTRUMENTS VDC SYSTEM USER MANUAL
Point includes one or more Measurement Entries. Factory 1 is selected in the upper half and
its contents are displayed in the lower half of the explorer.
Figure 54: Database with 2 Factories and 4 Machines
After the components of the Database are created you must specify the details for each item.
You can do this either by double clicking on the Factory, Machine, Point, Entry or Route or by
selecting it and clicking on the Edit button on the toolbar.
Similarly, using the mouse and right clicking on an item in the database will bring up a context
sensitive list of actions available for that item. For example, right clicking on a Machine will
bring up the following actions: Edit; Tag, Manage Tag; New Machine, New Point, New
Measurement, New Note; Delete; Copy Machine; Duplicate Machine; New Reading Alarm;
Collapse All; and Report.
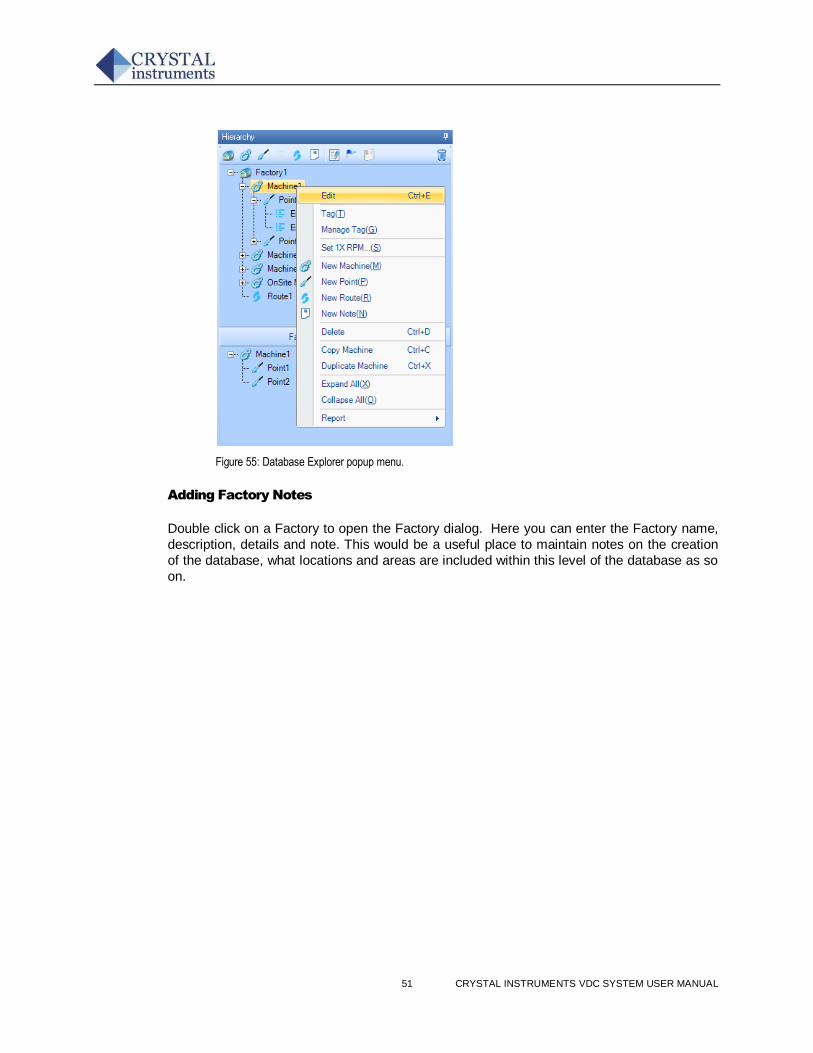
51 CRYSTAL INSTRUMENTS VDC SYSTEM USER MANUAL
Figure 55: Database Explorer popup menu.
Adding Factory Notes
Double click on a Factory to open the Factory dialog. Here you can enter the Factory name,
description, details and note. This would be a useful place to maintain notes on the creation
of the database, what locations and areas are included within this level of the database as so
on.
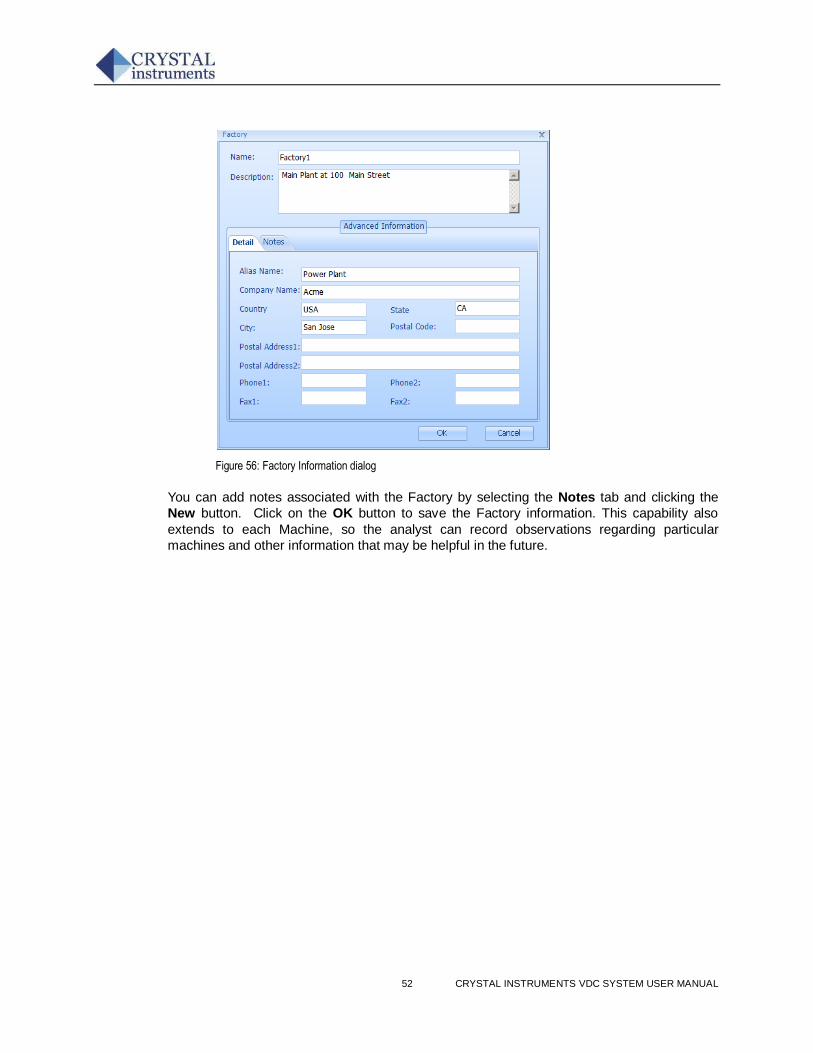
52 CRYSTAL INSTRUMENTS VDC SYSTEM USER MANUAL
Figure 56: Factory Information dialog
You can add notes associated with the Factory by selecting the Notes tab and clicking the
New button. Click on the OK button to save the Factory information. This capability also
extends to each Machine, so the analyst can record observations regarding particular
machines and other information that may be helpful in the future.
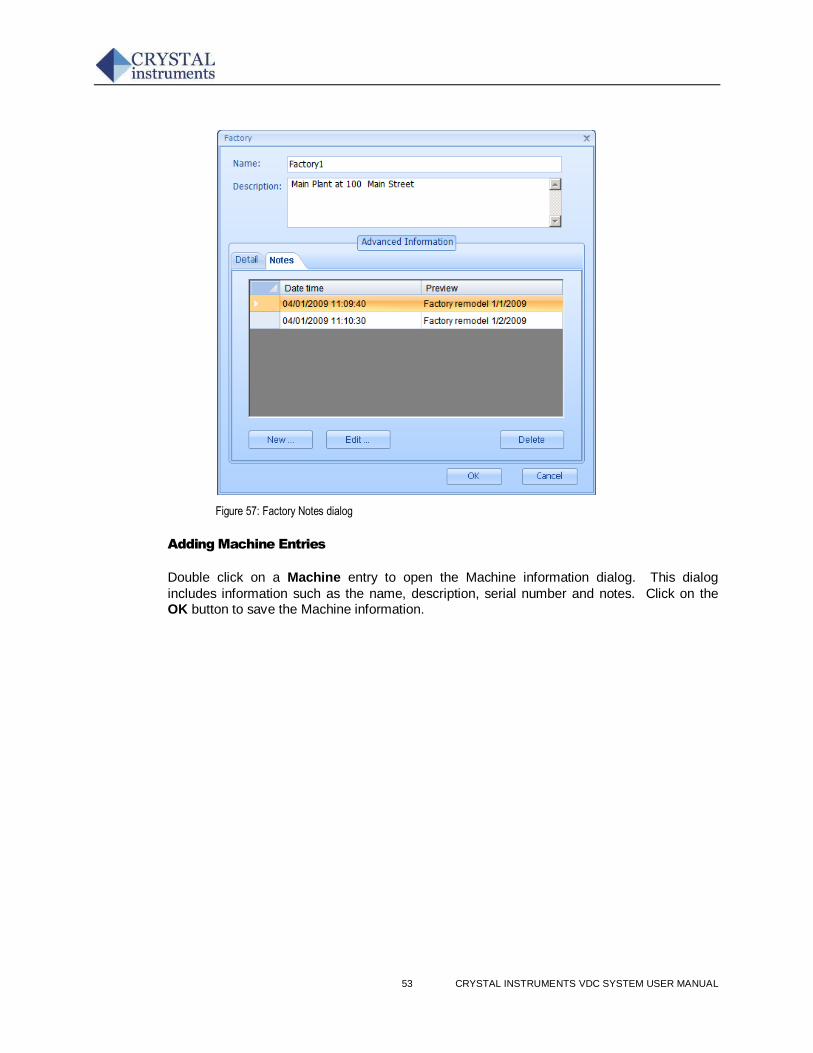
53 CRYSTAL INSTRUMENTS VDC SYSTEM USER MANUAL
Figure 57: Factory Notes dialog
Adding Machine Entries
Double click on a Machine entry to open the Machine information dialog. This dialog
includes information such as the name, description, serial number and notes. Click on the OK button to save the Machine information.
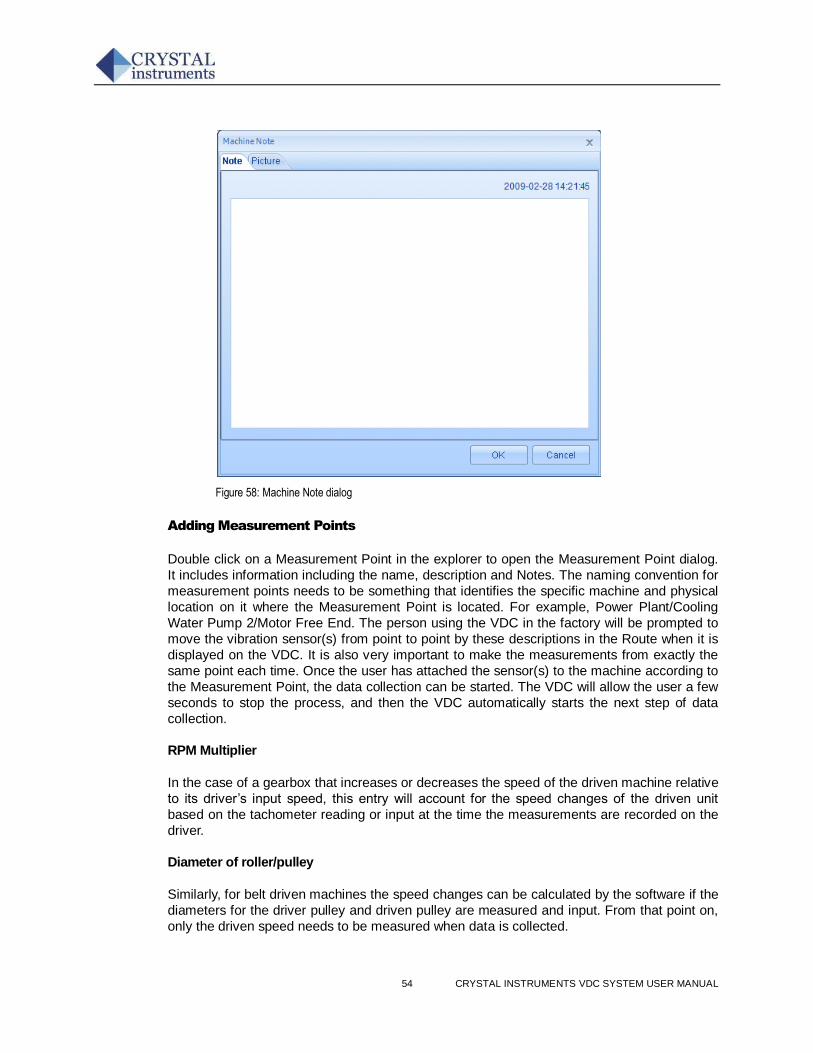
54 CRYSTAL INSTRUMENTS VDC SYSTEM USER MANUAL
Figure 58: Machine Note dialog
Adding Measurement Points
Double click on a Measurement Point in the explorer to open the Measurement Point dialog.
It includes information including the name, description and Notes. The naming convention for
measurement points needs to be something that identifies the specific machine and physical
location on it where the Measurement Point is located. For example, Power Plant/Cooling
Water Pump 2/Motor Free End. The person using the VDC in the factory will be prompted to
move the vibration sensor(s) from point to point by these descriptions in the Route when it is
displayed on the VDC. It is also very important to make the measurements from exactly the
same point each time. Once the user has attached the sensor(s) to the machine according to
the Measurement Point, the data collection can be started. The VDC will allow the user a few
seconds to stop the process, and then the VDC automatically starts the next step of data
collection.
RPM Multiplier
In the case of a gearbox that increases or decreases the speed of the driven machine relative
to its driver’s input speed, this entry will account for the speed changes of the driven unit
based on the tachometer reading or input at the time the measurements are recorded on the
driver.
Diameter of roller/pulley
Similarly, for belt driven machines the speed changes can be calculated by the software if the
diameters for the driver pulley and driven pulley are measured and input. From that point on,
only the driven speed needs to be measured when data is collected.
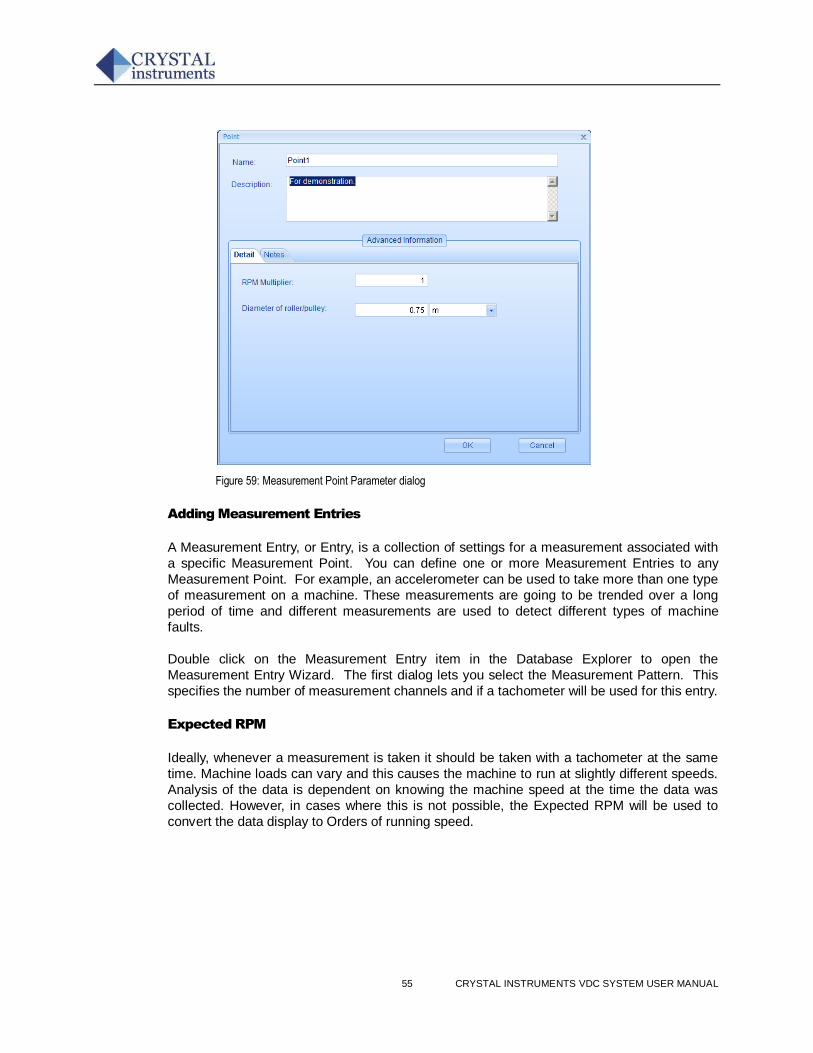
55 CRYSTAL INSTRUMENTS VDC SYSTEM USER MANUAL
Figure 59: Measurement Point Parameter dialog
Adding Measurement Entries
A Measurement Entry, or Entry, is a collection of settings for a measurement associated with
a specific Measurement Point. You can define one or more Measurement Entries to any
Measurement Point. For example, an accelerometer can be used to take more than one type
of measurement on a machine. These measurements are going to be trended over a long
period of time and different measurements are used to detect different types of machine
faults.
Double click on the Measurement Entry item in the Database Explorer to open the
Measurement Entry Wizard. The first dialog lets you select the Measurement Pattern. This
specifies the number of measurement channels and if a tachometer will be used for this entry.
Expected RPM
Ideally, whenever a measurement is taken it should be taken with a tachometer at the same
time. Machine loads can vary and this causes the machine to run at slightly different speeds.
Analysis of the data is dependent on knowing the machine speed at the time the data was
collected. However, in cases where this is not possible, the Expected RPM will be used to
convert the data display to Orders of running speed.
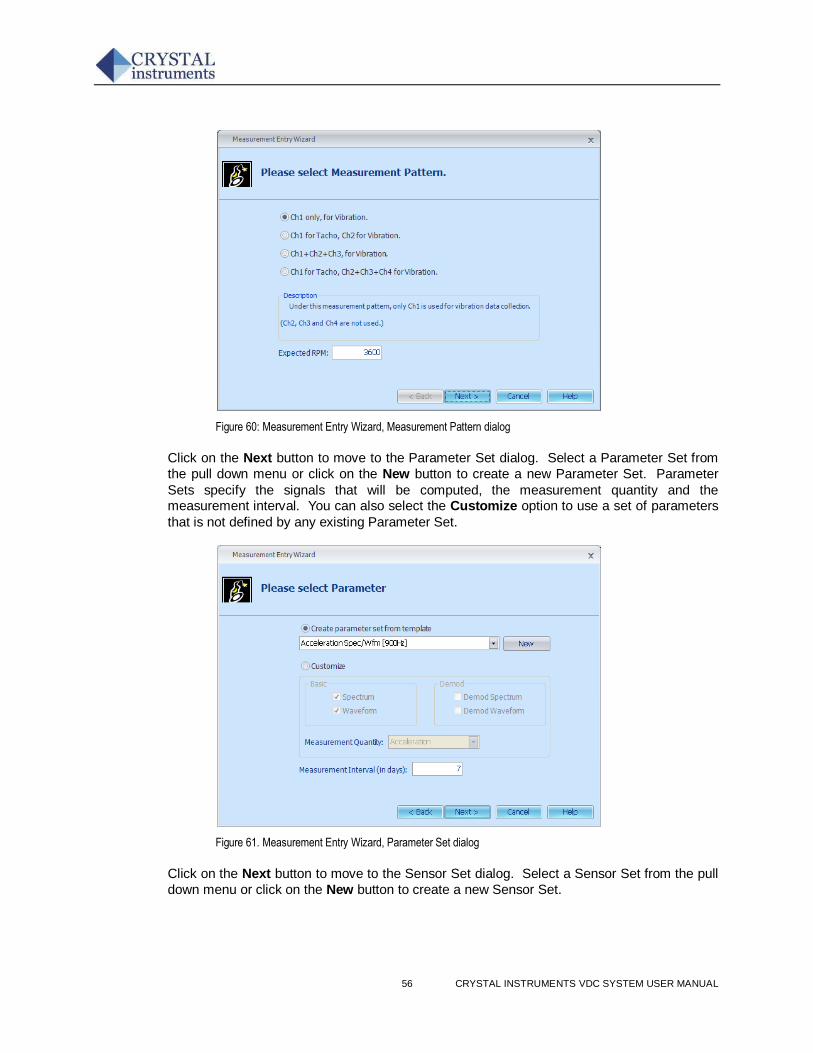
56 CRYSTAL INSTRUMENTS VDC SYSTEM USER MANUAL
Figure 60: Measurement Entry Wizard, Measurement Pattern dialog
Click on the Next button to move to the Parameter Set dialog. Select a Parameter Set from
the pull down menu or click on the New button to create a new Parameter Set. Parameter
Sets specify the signals that will be computed, the measurement quantity and the measurement interval. You can also select the Customize option to use a set of parameters
that is not defined by any existing Parameter Set.
Figure 61. Measurement Entry Wizard, Parameter Set dialog
Click on the Next button to move to the Sensor Set dialog. Select a Sensor Set from the pull
down menu or click on the New button to create a new Sensor Set.
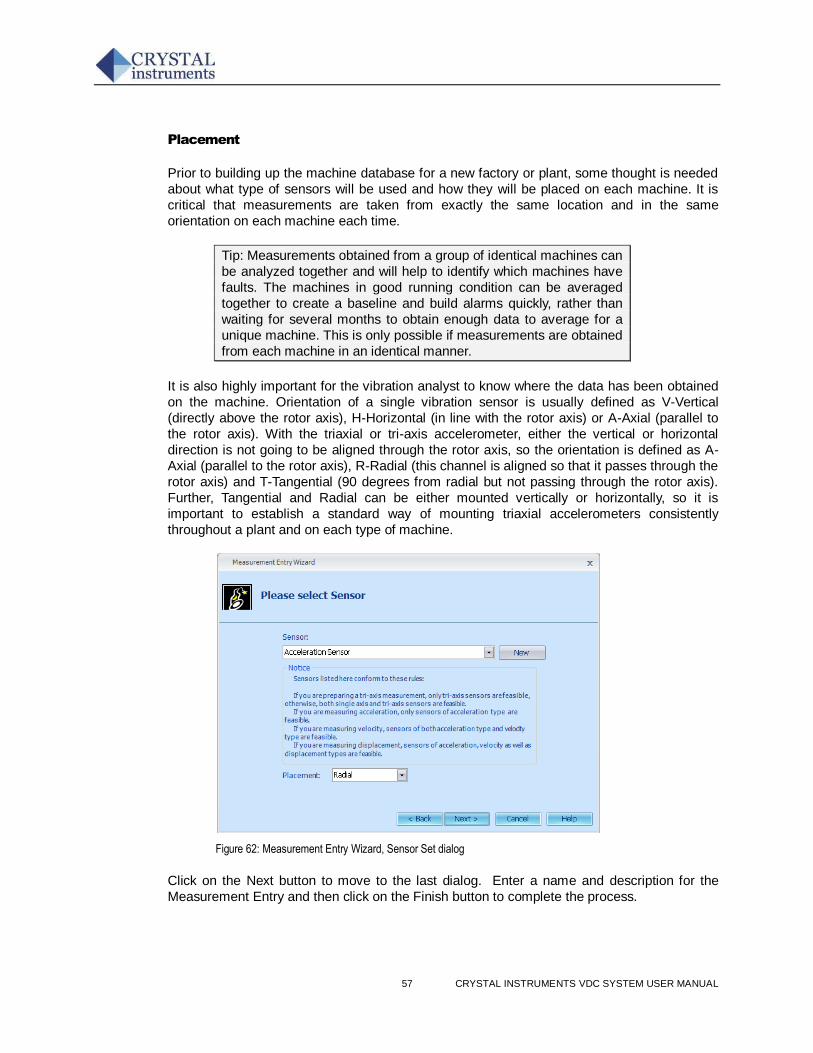
57 CRYSTAL INSTRUMENTS VDC SYSTEM USER MANUAL
Placement
Prior to building up the machine database for a new factory or plant, some thought is needed
about what type of sensors will be used and how they will be placed on each machine. It is
critical that measurements are taken from exactly the same location and in the same
orientation on each machine each time.
Tip: Measurements obtained from a group of identical machines can
be analyzed together and will help to identify which machines have
faults. The machines in good running condition can be averaged
together to create a baseline and build alarms quickly, rather than
waiting for several months to obtain enough data to average for a
unique machine. This is only possible if measurements are obtained
from each machine in an identical manner.
It is also highly important for the vibration analyst to know where the data has been obtained
on the machine. Orientation of a single vibration sensor is usually defined as V-Vertical
(directly above the rotor axis), H-Horizontal (in line with the rotor axis) or A-Axial (parallel to
the rotor axis). With the triaxial or tri-axis accelerometer, either the vertical or horizontal
direction is not going to be aligned through the rotor axis, so the orientation is defined as A-
Axial (parallel to the rotor axis), R-Radial (this channel is aligned so that it passes through the
rotor axis) and T-Tangential (90 degrees from radial but not passing through the rotor axis).
Further, Tangential and Radial can be either mounted vertically or horizontally, so it is
important to establish a standard way of mounting triaxial accelerometers consistently
throughout a plant and on each type of machine.
Figure 62: Measurement Entry Wizard, Sensor Set dialog
Click on the Next button to move to the last dialog. Enter a name and description for the
Measurement Entry and then click on the Finish button to complete the process.
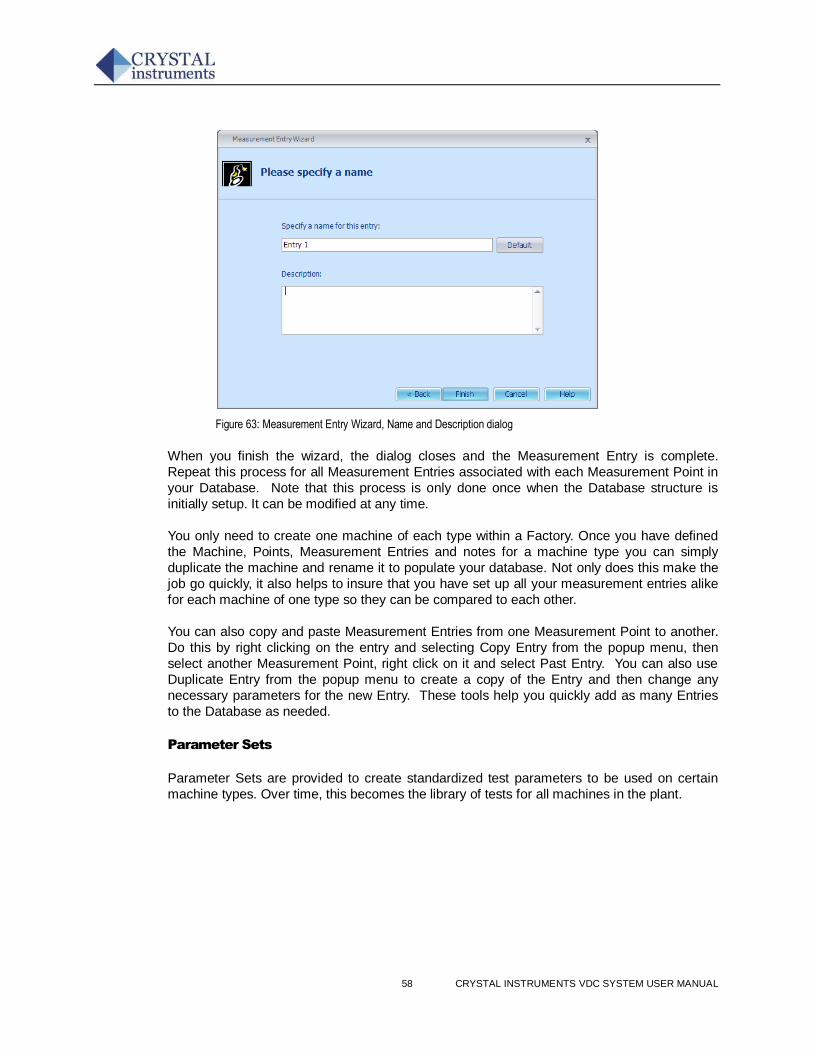
58 CRYSTAL INSTRUMENTS VDC SYSTEM USER MANUAL
Figure 63: Measurement Entry Wizard, Name and Description dialog
When you finish the wizard, the dialog closes and the Measurement Entry is complete.
Repeat this process for all Measurement Entries associated with each Measurement Point in
your Database. Note that this process is only done once when the Database structure is
initially setup. It can be modified at any time.
You only need to create one machine of each type within a Factory. Once you have defined
the Machine, Points, Measurement Entries and notes for a machine type you can simply
duplicate the machine and rename it to populate your database. Not only does this make the
job go quickly, it also helps to insure that you have set up all your measurement entries alike
for each machine of one type so they can be compared to each other.
You can also copy and paste Measurement Entries from one Measurement Point to another.
Do this by right clicking on the entry and selecting Copy Entry from the popup menu, then
select another Measurement Point, right click on it and select Past Entry. You can also use
Duplicate Entry from the popup menu to create a copy of the Entry and then change any
necessary parameters for the new Entry. These tools help you quickly add as many Entries
to the Database as needed.
Parameter Sets
Parameter Sets are provided to create standardized test parameters to be used on certain
machine types. Over time, this becomes the library of tests for all machines in the plant.
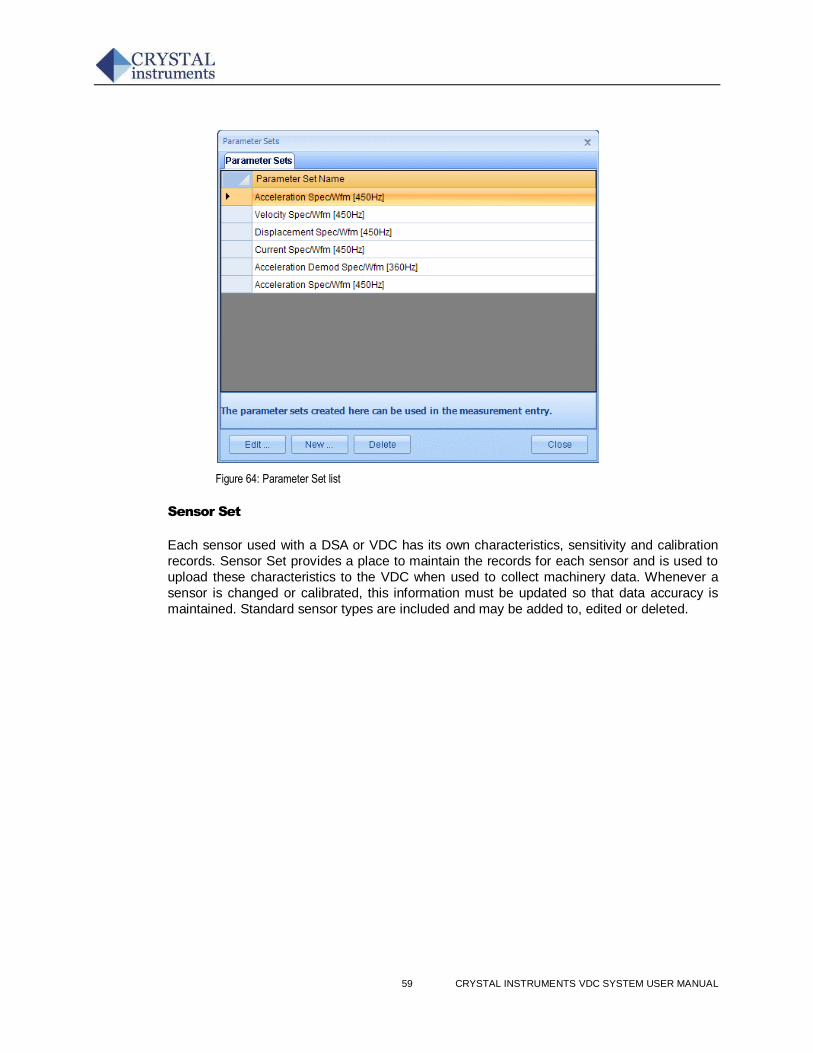
59 CRYSTAL INSTRUMENTS VDC SYSTEM USER MANUAL
Figure 64: Parameter Set list
Sensor Set
Each sensor used with a DSA or VDC has its own characteristics, sensitivity and calibration
records. Sensor Set provides a place to maintain the records for each sensor and is used to
upload these characteristics to the VDC when used to collect machinery data. Whenever a
sensor is changed or calibrated, this information must be updated so that data accuracy is
maintained. Standard sensor types are included and may be added to, edited or deleted.
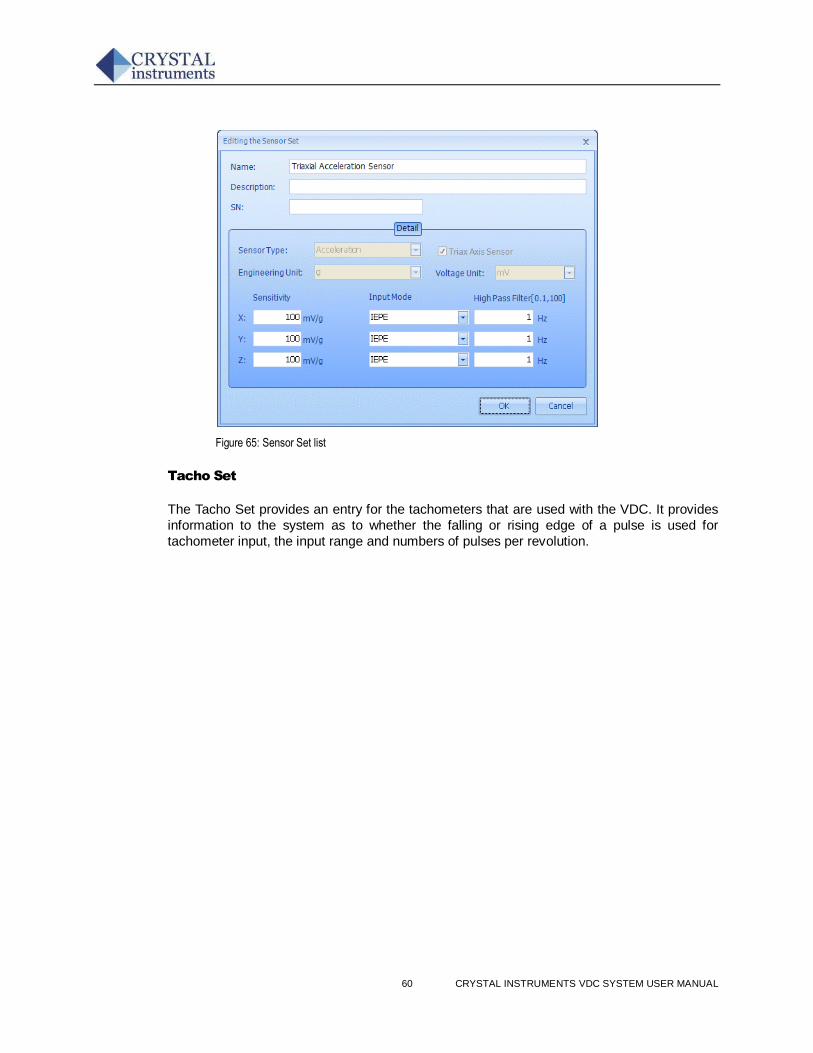
60 CRYSTAL INSTRUMENTS VDC SYSTEM USER MANUAL
Figure 65: Sensor Set list
Tacho Set
The Tacho Set provides an entry for the tachometers that are used with the VDC. It provides
information to the system as to whether the falling or rising edge of a pulse is used for
tachometer input, the input range and numbers of pulses per revolution.
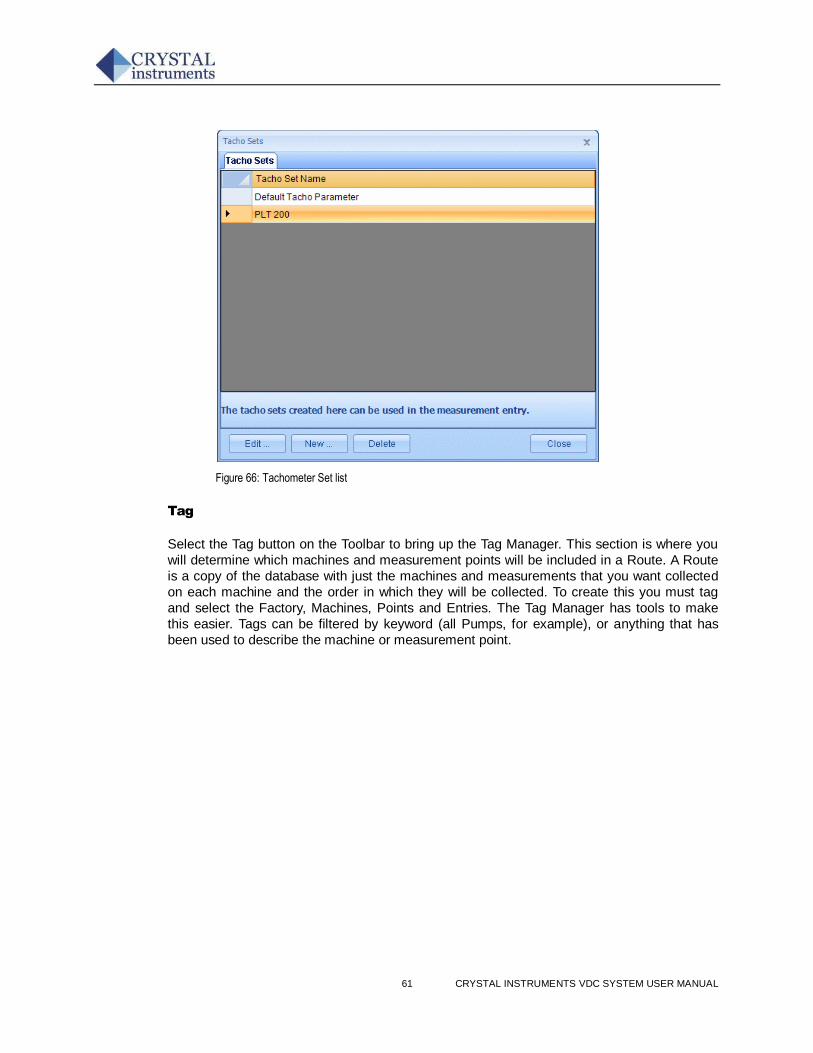
61 CRYSTAL INSTRUMENTS VDC SYSTEM USER MANUAL
Figure 66: Tachometer Set list
Tag
Select the Tag button on the Toolbar to bring up the Tag Manager. This section is where you
will determine which machines and measurement points will be included in a Route. A Route
is a copy of the database with just the machines and measurements that you want collected
on each machine and the order in which they will be collected. To create this you must tag
and select the Factory, Machines, Points and Entries. The Tag Manager has tools to make
this easier. Tags can be filtered by keyword (all Pumps, for example), or anything that has
been used to describe the machine or measurement point.
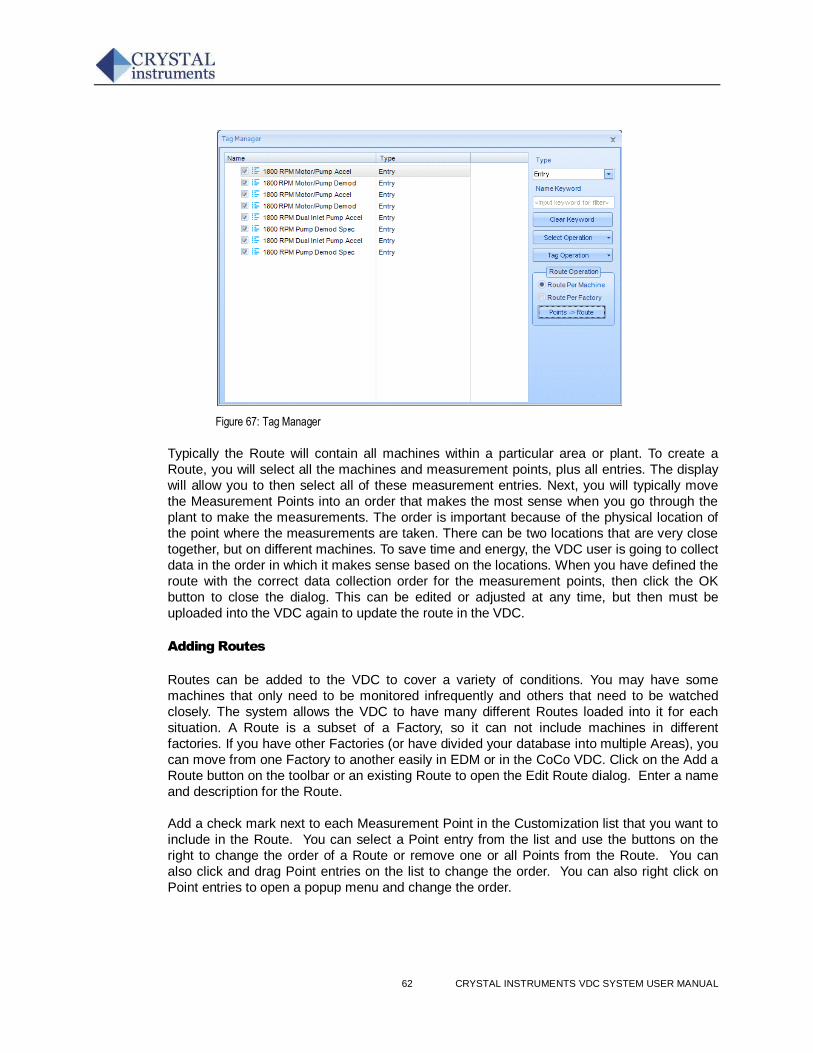
62 CRYSTAL INSTRUMENTS VDC SYSTEM USER MANUAL
Figure 67: Tag Manager
Typically the Route will contain all machines within a particular area or plant. To create a
Route, you will select all the machines and measurement points, plus all entries. The display
will allow you to then select all of these measurement entries. Next, you will typically move
the Measurement Points into an order that makes the most sense when you go through the
plant to make the measurements. The order is important because of the physical location of
the point where the measurements are taken. There can be two locations that are very close
together, but on different machines. To save time and energy, the VDC user is going to collect
data in the order in which it makes sense based on the locations. When you have defined the
route with the correct data collection order for the measurement points, then click the OK
button to close the dialog. This can be edited or adjusted at any time, but then must be
uploaded into the VDC again to update the route in the VDC.
Adding Routes
Routes can be added to the VDC to cover a variety of conditions. You may have some
machines that only need to be monitored infrequently and others that need to be watched
closely. The system allows the VDC to have many different Routes loaded into it for each
situation. A Route is a subset of a Factory, so it can not include machines in different
factories. If you have other Factories (or have divided your database into multiple Areas), you
can move from one Factory to another easily in EDM or in the CoCo VDC. Click on the Add a
Route button on the toolbar or an existing Route to open the Edit Route dialog. Enter a name
and description for the Route.
Add a check mark next to each Measurement Point in the Customization list that you want to
include in the Route. You can select a Point entry from the list and use the buttons on the
right to change the order of a Route or remove one or all Points from the Route. You can
also click and drag Point entries on the list to change the order. You can also right click on
Point entries to open a popup menu and change the order.
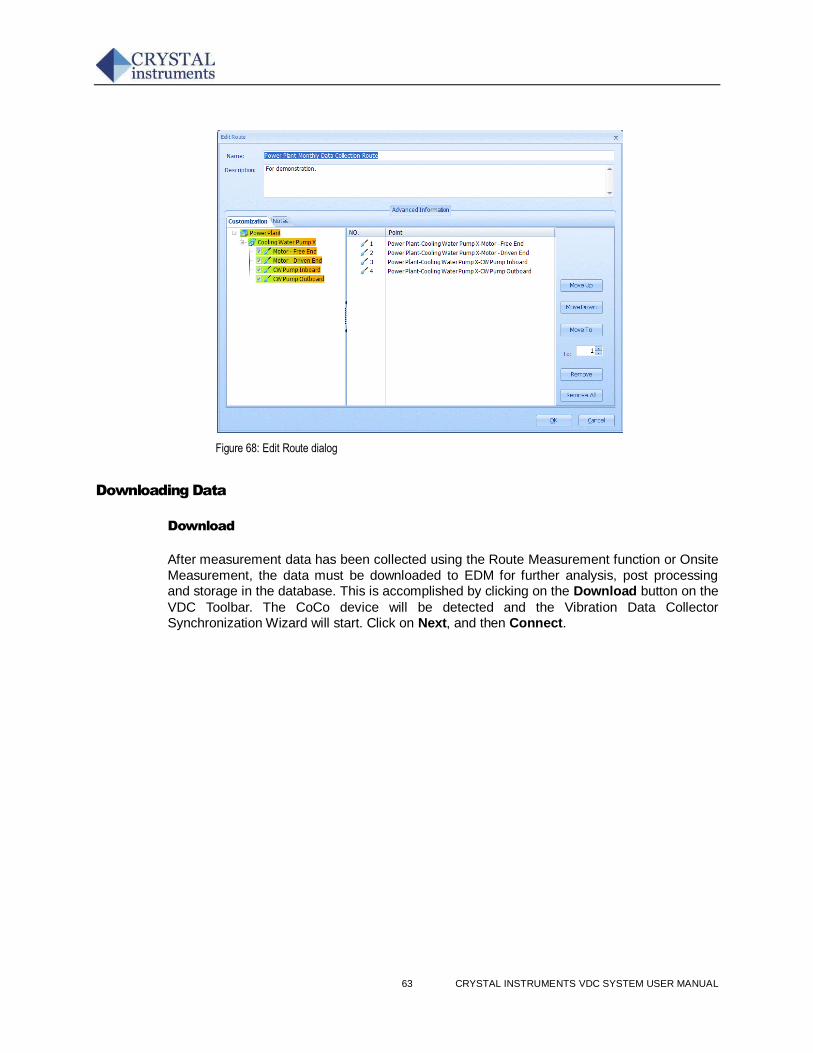
63 CRYSTAL INSTRUMENTS VDC SYSTEM USER MANUAL
Figure 68: Edit Route dialog
Downloading Data
Download
After measurement data has been collected using the Route Measurement function or Onsite
Measurement, the data must be downloaded to EDM for further analysis, post processing and storage in the database. This is accomplished by clicking on the Download button on the
VDC Toolbar. The CoCo device will be detected and the Vibration Data Collector Synchronization Wizard will start. Click on Next, and then Connect.
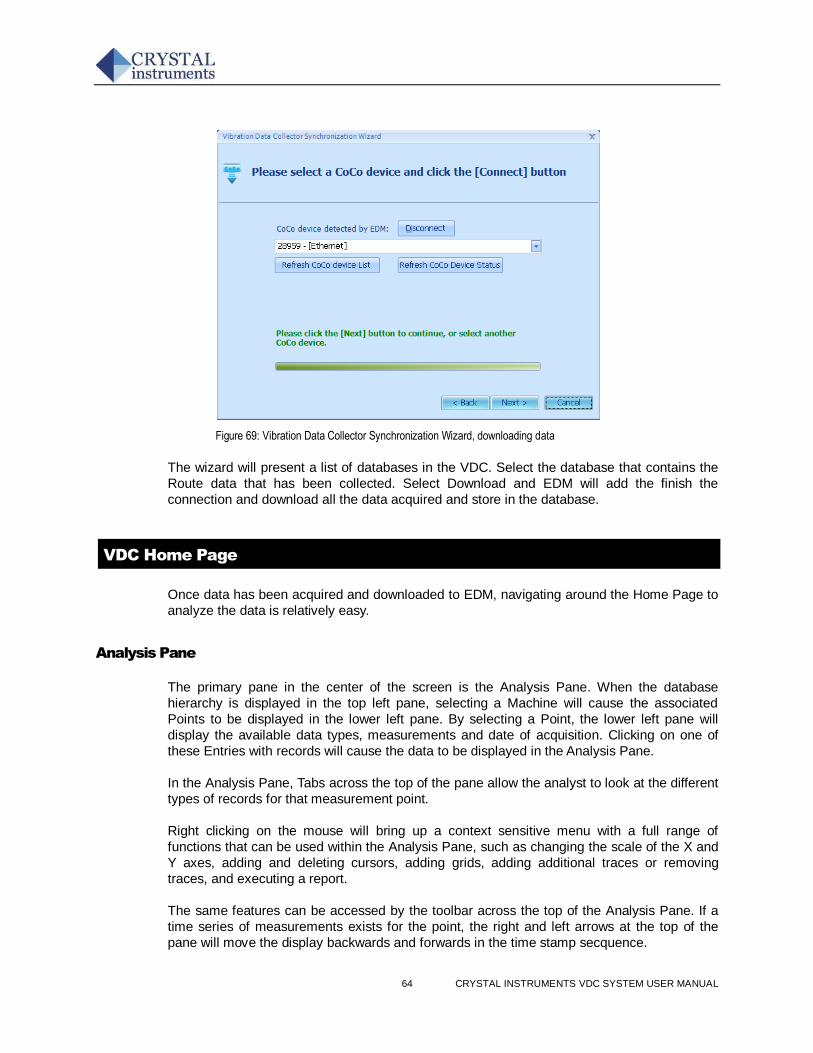
64 CRYSTAL INSTRUMENTS VDC SYSTEM USER MANUAL
Figure 69: Vibration Data Collector Synchronization Wizard, downloading data
The wizard will present a list of databases in the VDC. Select the database that contains the
Route data that has been collected. Select Download and EDM will add the finish the
connection and download all the data acquired and store in the database.
VDC Home Page
Once data has been acquired and downloaded to EDM, navigating around the Home Page to
analyze the data is relatively easy.
Analysis Pane
The primary pane in the center of the screen is the Analysis Pane. When the database
hierarchy is displayed in the top left pane, selecting a Machine will cause the associated
Points to be displayed in the lower left pane. By selecting a Point, the lower left pane will
display the available data types, measurements and date of acquisition. Clicking on one of
these Entries with records will cause the data to be displayed in the Analysis Pane.
In the Analysis Pane, Tabs across the top of the pane allow the analyst to look at the different
types of records for that measurement point.
Right clicking on the mouse will bring up a context sensitive menu with a full range of
functions that can be used within the Analysis Pane, such as changing the scale of the X and
Y axes, adding and deleting cursors, adding grids, adding additional traces or removing
traces, and executing a report.
The same features can be accessed by the toolbar across the top of the Analysis Pane. If a
time series of measurements exists for the point, the right and left arrows at the top of the
pane will move the display backwards and forwards in the time stamp secquence.
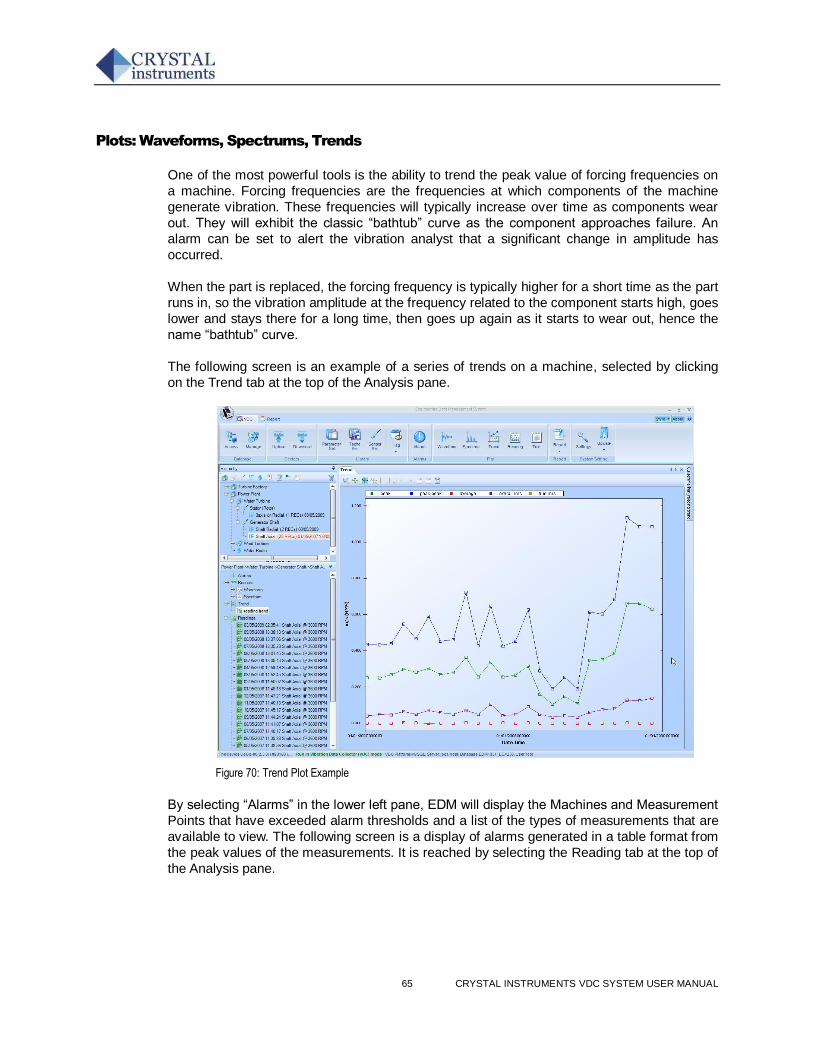
65 CRYSTAL INSTRUMENTS VDC SYSTEM USER MANUAL
Plots: Waveforms, Spectrums, Trends
One of the most powerful tools is the ability to trend the peak value of forcing frequencies on
a machine. Forcing frequencies are the frequencies at which components of the machine
generate vibration. These frequencies will typically increase over time as components wear
out. They will exhibit the classic “bathtub” curve as the component approaches failure. An
alarm can be set to alert the vibration analyst that a significant change in amplitude has
occurred.
When the part is replaced, the forcing frequency is typically higher for a short time as the part
runs in, so the vibration amplitude at the frequency related to the component starts high, goes
lower and stays there for a long time, then goes up again as it starts to wear out, hence the
name “bathtub” curve.
The following screen is an example of a series of trends on a machine, selected by clicking
on the Trend tab at the top of the Analysis pane.
Figure 70: Trend Plot Example
By selecting “Alarms” in the lower left pane, EDM will display the Machines and Measurement
Points that have exceeded alarm thresholds and a list of the types of measurements that are
available to view. The following screen is a display of alarms generated in a table format from
the peak values of the measurements. It is reached by selecting the Reading tab at the top of
the Analysis pane.
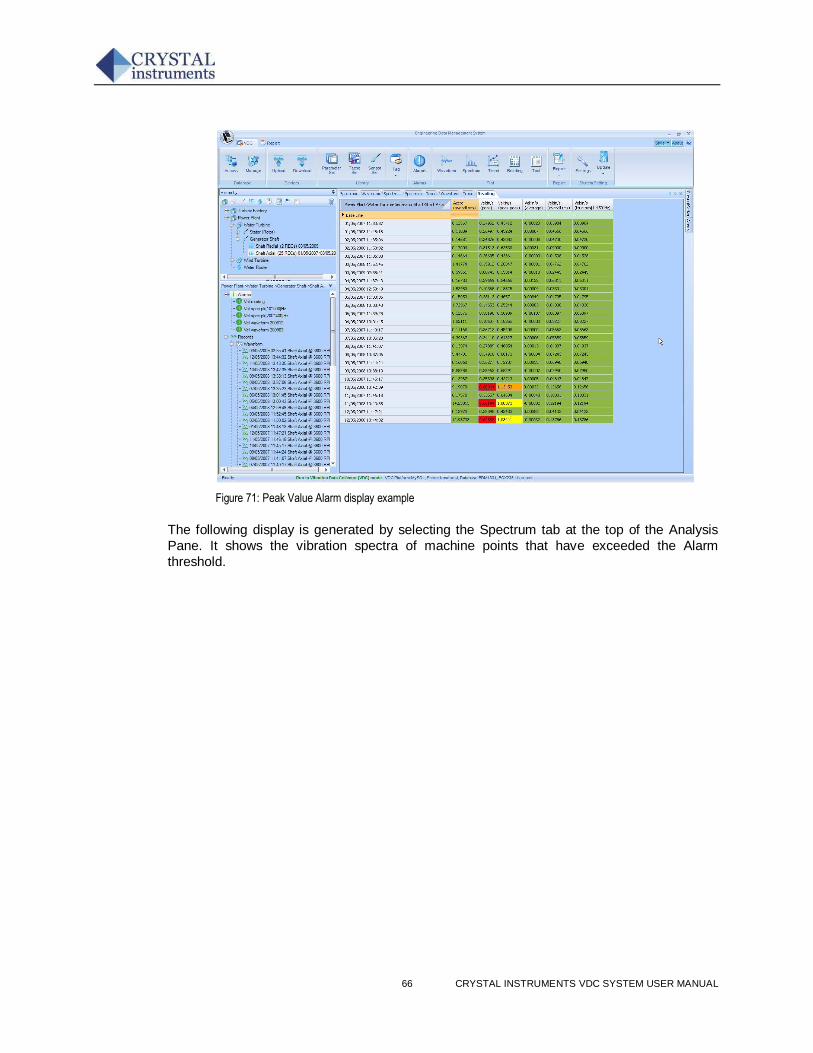
66 CRYSTAL INSTRUMENTS VDC SYSTEM USER MANUAL
Figure 71: Peak Value Alarm display example
The following display is generated by selecting the Spectrum tab at the top of the Analysis
Pane. It shows the vibration spectra of machine points that have exceeded the Alarm
threshold.
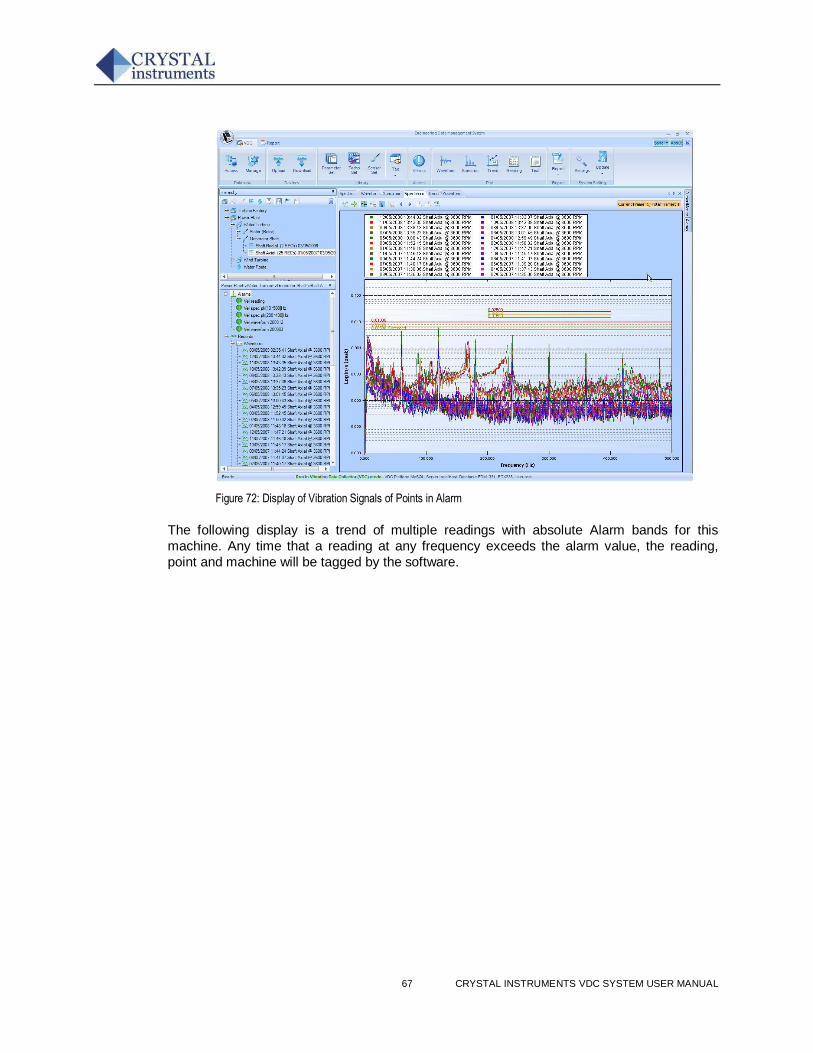
67 CRYSTAL INSTRUMENTS VDC SYSTEM USER MANUAL
Figure 72: Display of Vibration Signals of Points in Alarm
The following display is a trend of multiple readings with absolute Alarm bands for this
machine. Any time that a reading at any frequency exceeds the alarm value, the reading,
point and machine will be tagged by the software.
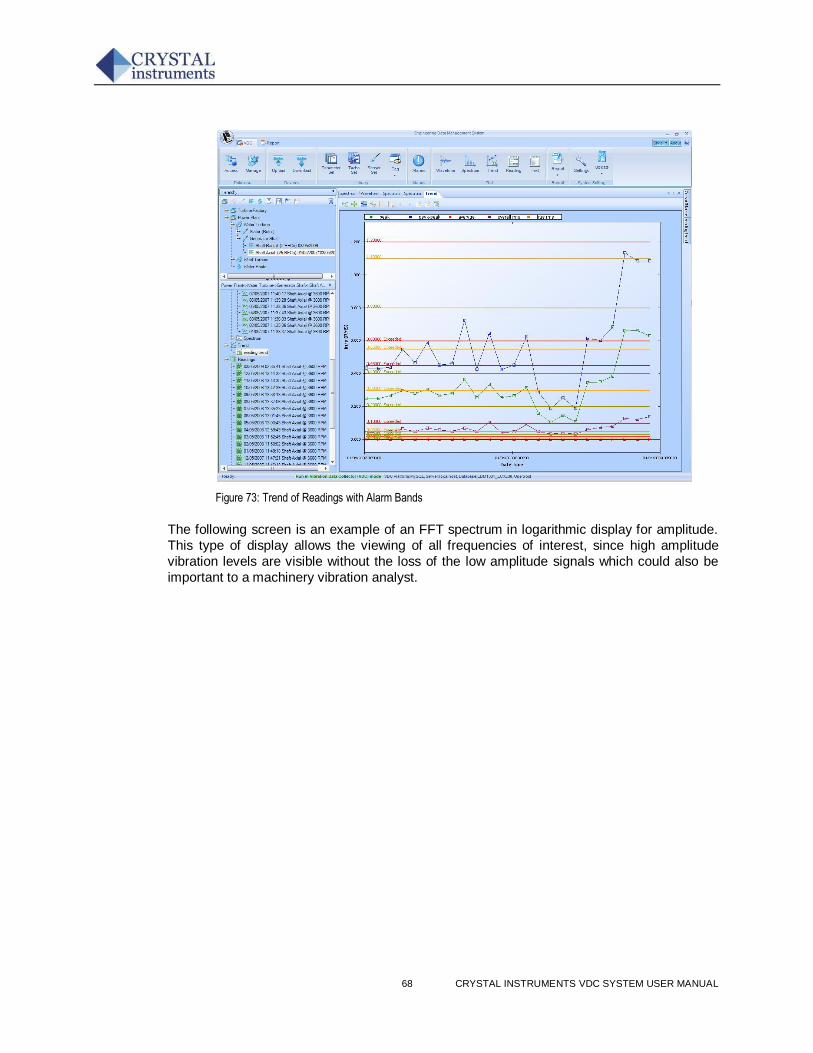
68 CRYSTAL INSTRUMENTS VDC SYSTEM USER MANUAL
Figure 73: Trend of Readings with Alarm Bands
The following screen is an example of an FFT spectrum in logarithmic display for amplitude.
This type of display allows the viewing of all frequencies of interest, since high amplitude
vibration levels are visible without the loss of the low amplitude signals which could also be
important to a machinery vibration analyst.
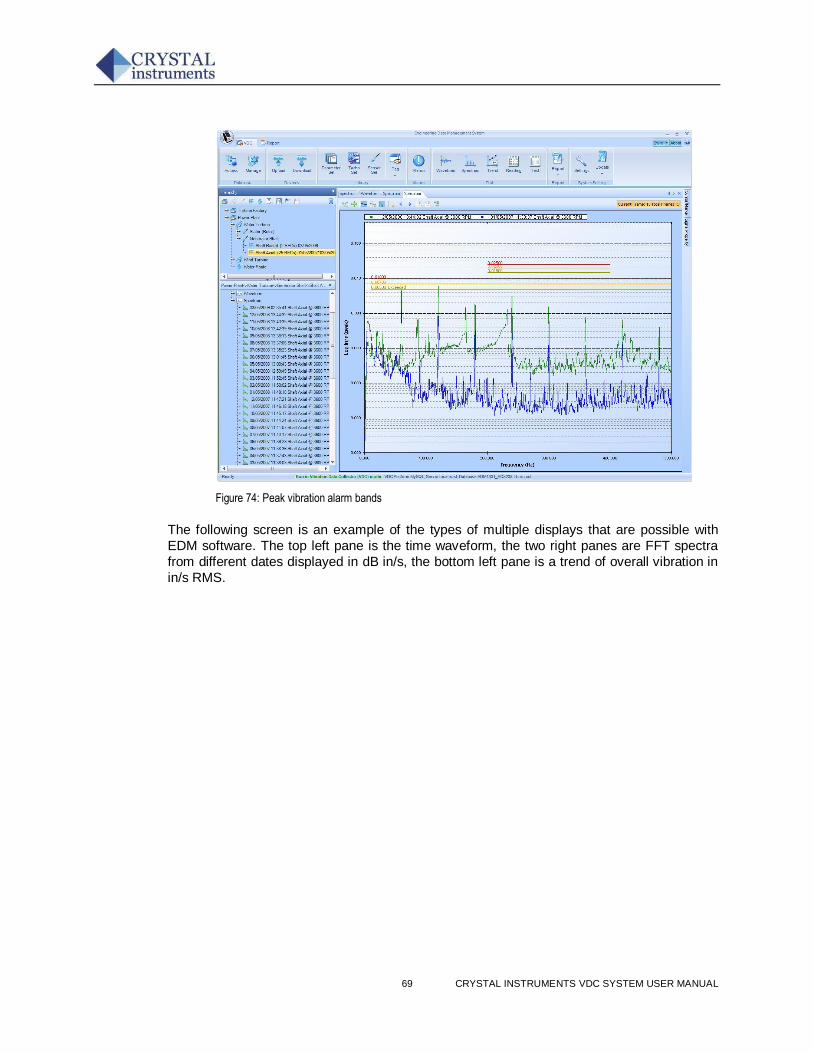
69 CRYSTAL INSTRUMENTS VDC SYSTEM USER MANUAL
Figure 74: Peak vibration alarm bands
The following screen is an example of the types of multiple displays that are possible with
EDM software. The top left pane is the time waveform, the two right panes are FFT spectra
from different dates displayed in dB in/s, the bottom left pane is a trend of overall vibration in
in/s RMS.
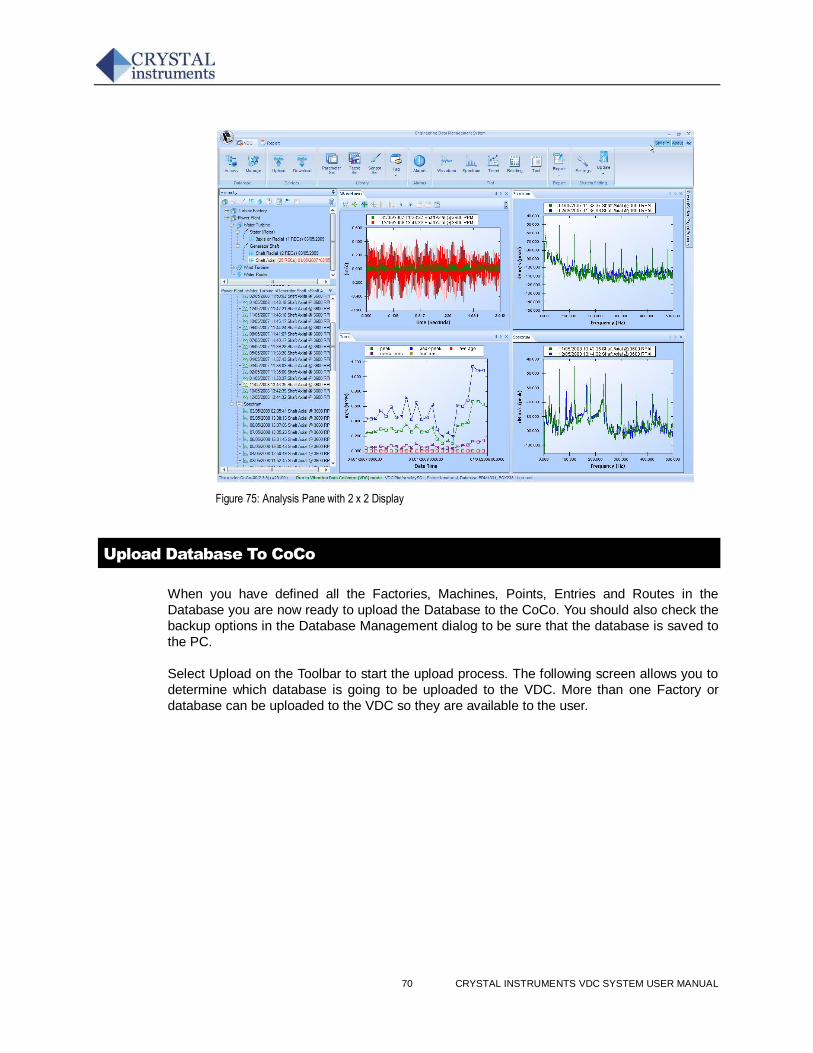
70 CRYSTAL INSTRUMENTS VDC SYSTEM USER MANUAL
Figure 75: Analysis Pane with 2 x 2 Display
Upload Database To CoCo
When you have defined all the Factories, Machines, Points, Entries and Routes in the
Database you are now ready to upload the Database to the CoCo. You should also check the
backup options in the Database Management dialog to be sure that the database is saved to
the PC.
Select Upload on the Toolbar to start the upload process. The following screen allows you to
determine which database is going to be uploaded to the VDC. More than one Factory or
database can be uploaded to the VDC so they are available to the user.
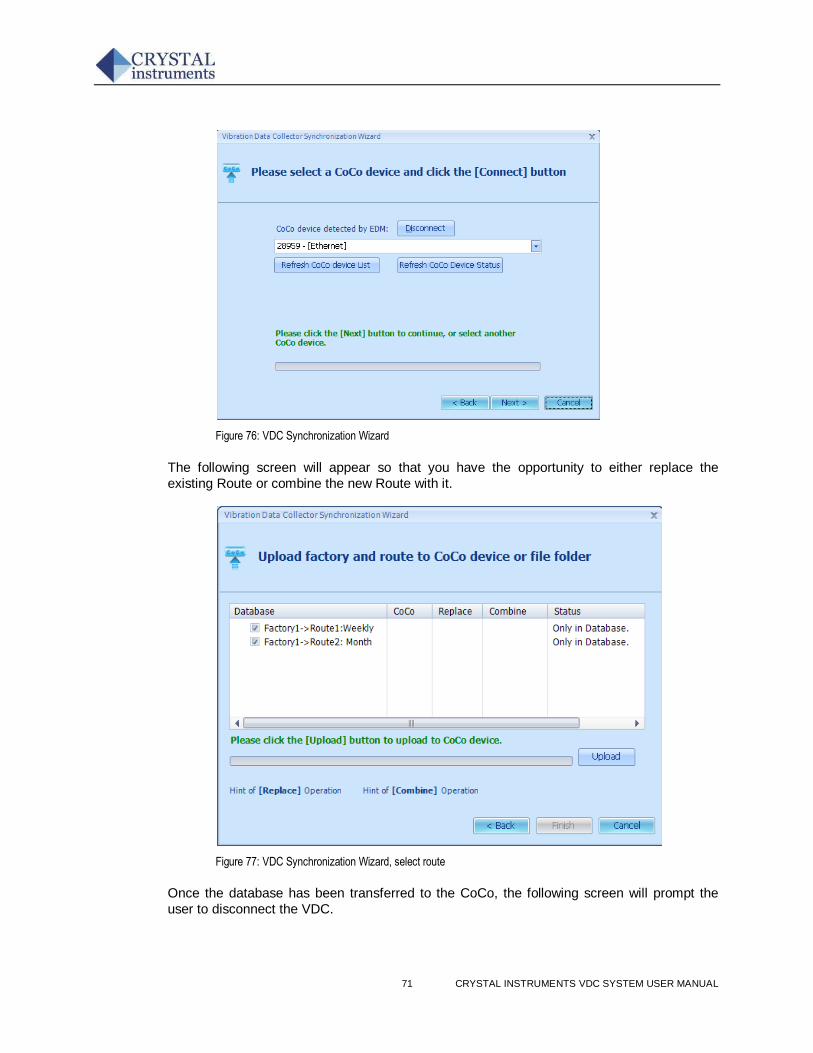
71 CRYSTAL INSTRUMENTS VDC SYSTEM USER MANUAL
Figure 76: VDC Synchronization Wizard
The following screen will appear so that you have the opportunity to either replace the
existing Route or combine the new Route with it.
Figure 77: VDC Synchronization Wizard, select route
Once the database has been transferred to the CoCo, the following screen will prompt the
user to disconnect the VDC.
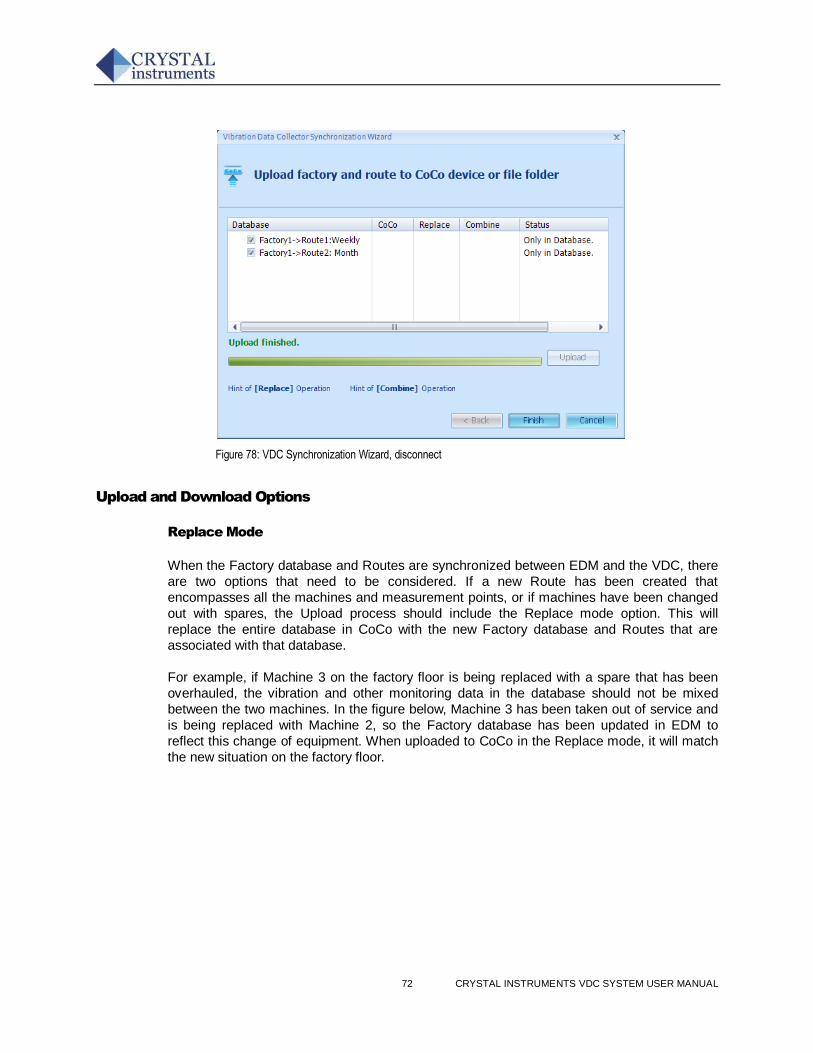
72 CRYSTAL INSTRUMENTS VDC SYSTEM USER MANUAL
Figure 78: VDC Synchronization Wizard, disconnect
Upload and Download Options
Replace Mode
When the Factory database and Routes are synchronized between EDM and the VDC, there
are two options that need to be considered. If a new Route has been created that
encompasses all the machines and measurement points, or if machines have been changed
out with spares, the Upload process should include the Replace mode option. This will
replace the entire database in CoCo with the new Factory database and Routes that are
associated with that database.
For example, if Machine 3 on the factory floor is being replaced with a spare that has been
overhauled, the vibration and other monitoring data in the database should not be mixed
between the two machines. In the figure below, Machine 3 has been taken out of service and
is being replaced with Machine 2, so the Factory database has been updated in EDM to
reflect this change of equipment. When uploaded to CoCo in the Replace mode, it will match
the new situation on the factory floor.
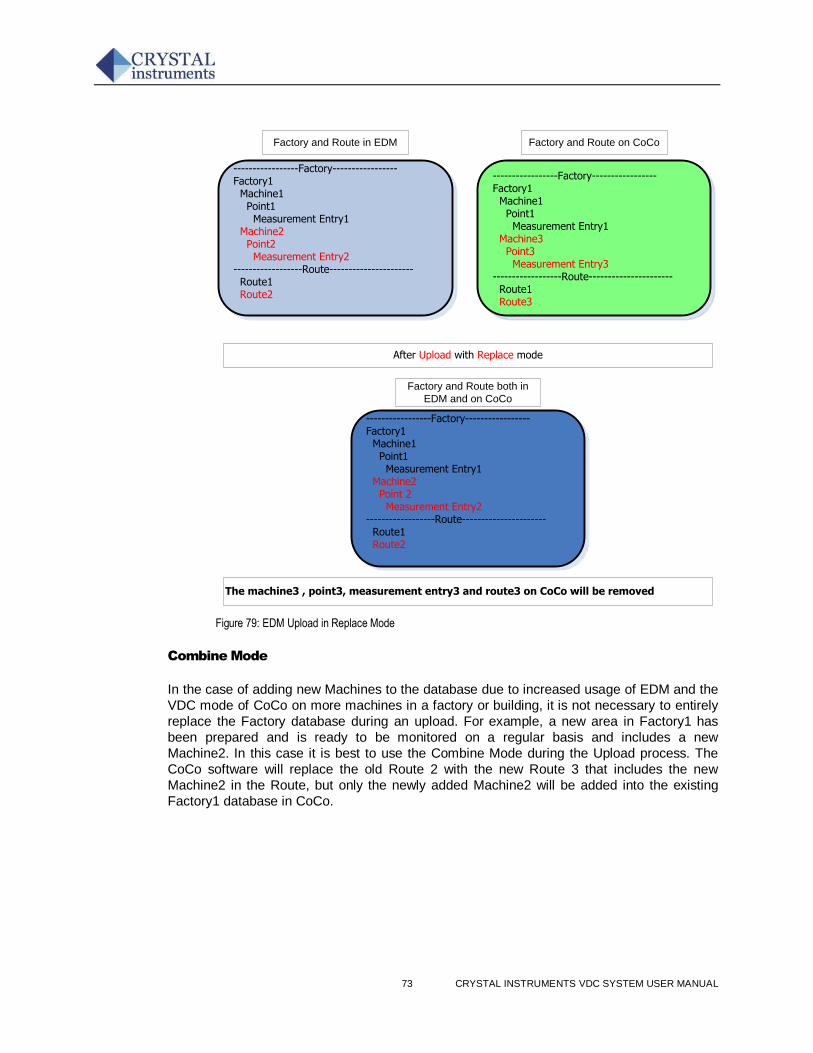
73 CRYSTAL INSTRUMENTS VDC SYSTEM USER MANUAL
-----------------Factory----------------- Factory1 Machine1 Point1 Measurement Entry1 Machine2 Point2 Measurement Entry2 ------------------Route---------------------- Route1 Route2
-----------------Factory----------------- Factory1 Machine1 Point1 Measurement Entry1 Machine3 Point3 Measurement Entry3 ------------------Route---------------------- Route1 Route3
-----------------Factory----------------- Factory1 Machine1 Point1 Measurement Entry1 Machine2 Point 2 Measurement Entry2 ------------------Route---------------------- Route1 Route2
After Upload with Replace mode
Factory and Route in EDM Factory and Route on CoCo
The machine3 , point3, measurement entry3 and route3 on CoCo will be removed
Factory and Route both in
EDM and on CoCo
Figure 79: EDM Upload in Replace Mode
Combine Mode
In the case of adding new Machines to the database due to increased usage of EDM and the
VDC mode of CoCo on more machines in a factory or building, it is not necessary to entirely
replace the Factory database during an upload. For example, a new area in Factory1 has
been prepared and is ready to be monitored on a regular basis and includes a new
Machine2. In this case it is best to use the Combine Mode during the Upload process. The
CoCo software will replace the old Route 2 with the new Route 3 that includes the new
Machine2 in the Route, but only the newly added Machine2 will be added into the existing
Factory1 database in CoCo.
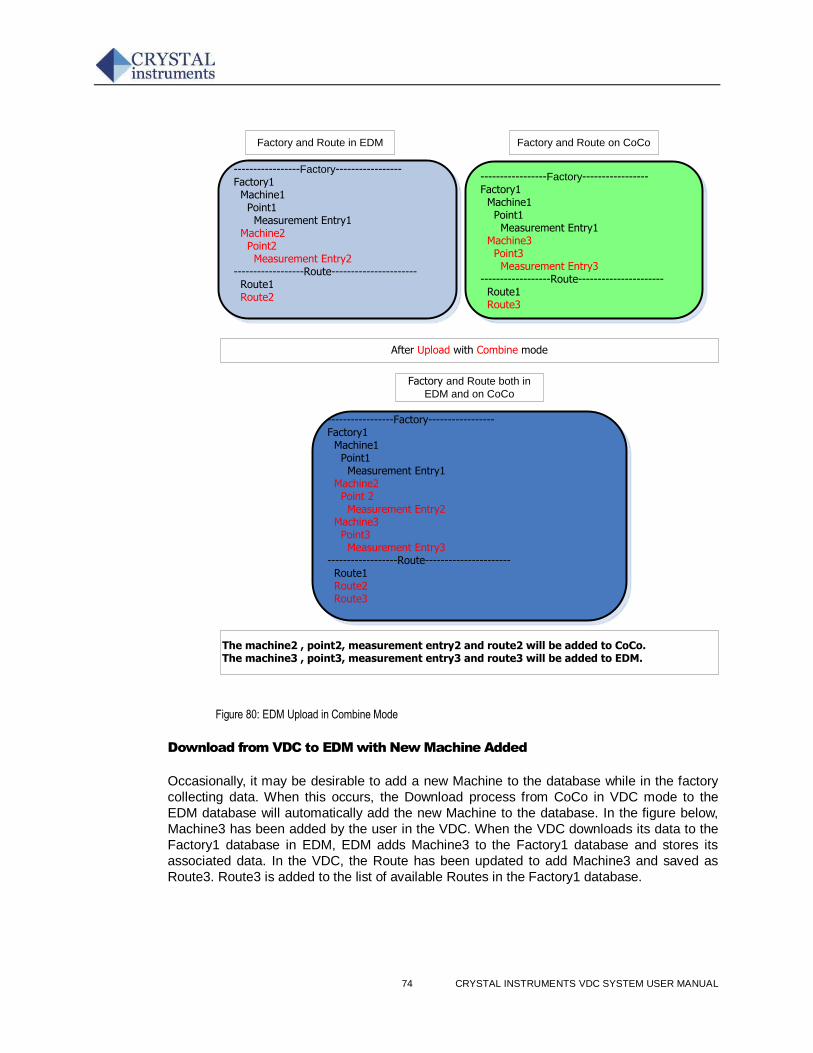
74 CRYSTAL INSTRUMENTS VDC SYSTEM USER MANUAL
-----------------Factory----------------- Factory1 Machine1 Point1 Measurement Entry1 Machine2 Point2 Measurement Entry2 ------------------Route---------------------- Route1 Route2
-----------------Factory----------------- Factory1 Machine1 Point1 Measurement Entry1 Machine3 Point3 Measurement Entry3 ------------------Route---------------------- Route1 Route3
-----------------Factory----------------- Factory1 Machine1 Point1 Measurement Entry1 Machine2 Point 2 Measurement Entry2 Machine3 Point3 Measurement Entry3 ------------------Route---------------------- Route1 Route2 Route3
After Upload with Combine mode
Factory and Route in EDM Factory and Route on CoCo
The machine2 , point2, measurement entry2 and route2 will be added to CoCo.The machine3 , point3, measurement entry3 and route3 will be added to EDM.
Factory and Route both in
EDM and on CoCo
Figure 80: EDM Upload in Combine Mode
Download from VDC to EDM with New Machine Added
Occasionally, it may be desirable to add a new Machine to the database while in the factory
collecting data. When this occurs, the Download process from CoCo in VDC mode to the
EDM database will automatically add the new Machine to the database. In the figure below,
Machine3 has been added by the user in the VDC. When the VDC downloads its data to the
Factory1 database in EDM, EDM adds Machine3 to the Factory1 database and stores its
associated data. In the VDC, the Route has been updated to add Machine3 and saved as
Route3. Route3 is added to the list of available Routes in the Factory1 database.
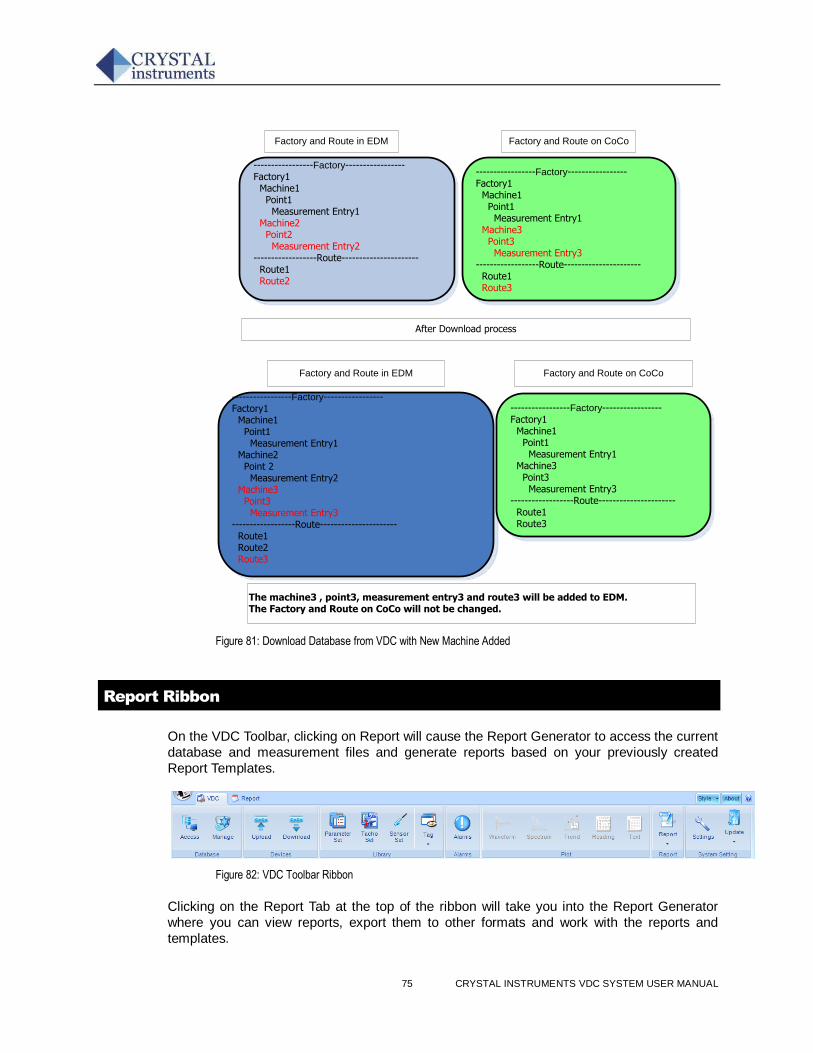
75 CRYSTAL INSTRUMENTS VDC SYSTEM USER MANUAL
-----------------Factory----------------- Factory1 Machine1 Point1 Measurement Entry1 Machine2 Point2 Measurement Entry2 ------------------Route---------------------- Route1 Route2
-----------------Factory----------------- Factory1 Machine1 Point1 Measurement Entry1 Machine3 Point3 Measurement Entry3 ------------------Route---------------------- Route1 Route3
-----------------Factory----------------- Factory1 Machine1 Point1 Measurement Entry1 Machine2 Point 2 Measurement Entry2 Machine3 Point3 Measurement Entry3 ------------------Route---------------------- Route1 Route2 Route3
After Download process
Factory and Route in EDM Factory and Route on CoCo
The machine3 , point3, measurement entry3 and route3 will be added to EDM.The Factory and Route on CoCo will not be changed.
Factory and Route in EDM
-----------------Factory----------------- Factory1 Machine1 Point1 Measurement Entry1 Machine3 Point3 Measurement Entry3 ------------------Route---------------------- Route1 Route3
Factory and Route on CoCo
Figure 81: Download Database from VDC with New Machine Added
Report Ribbon
On the VDC Toolbar, clicking on Report will cause the Report Generator to access the current
database and measurement files and generate reports based on your previously created
Report Templates.
Figure 82: VDC Toolbar Ribbon
Clicking on the Report Tab at the top of the ribbon will take you into the Report Generator
where you can view reports, export them to other formats and work with the reports and
templates.
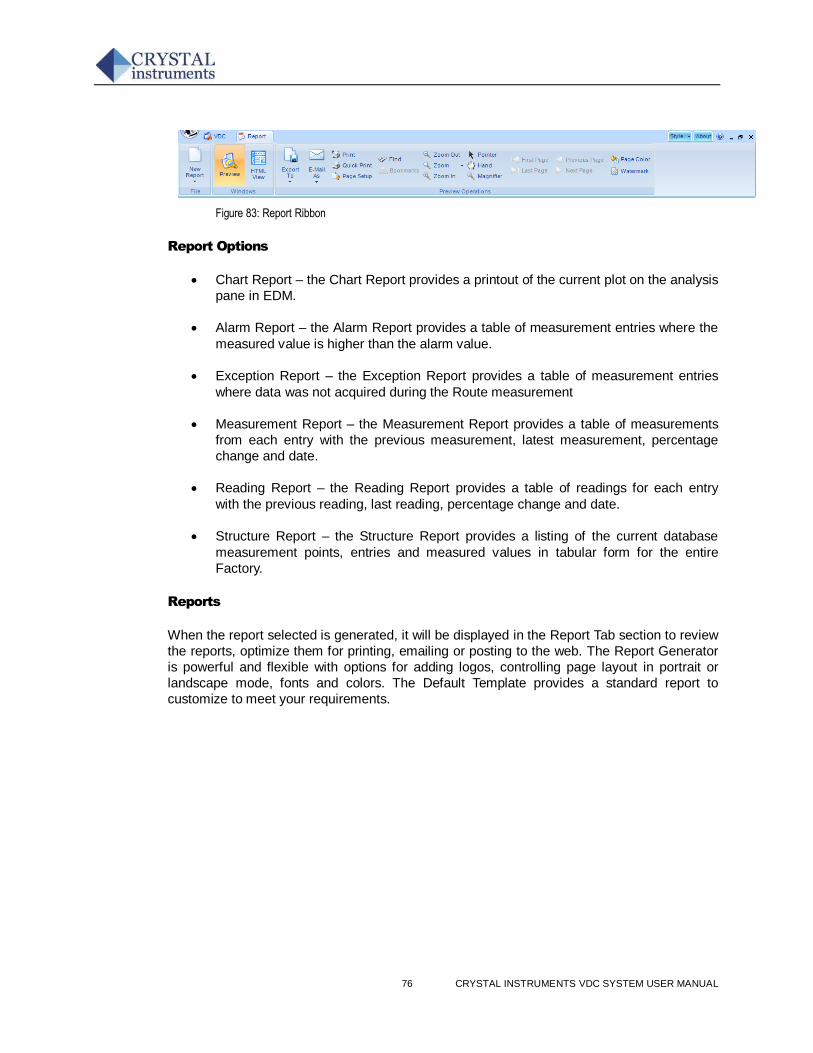
76 CRYSTAL INSTRUMENTS VDC SYSTEM USER MANUAL
Figure 83: Report Ribbon
Report Options
Chart Report – the Chart Report provides a printout of the current plot on the analysis
pane in EDM.
Alarm Report – the Alarm Report provides a table of measurement entries where the
measured value is higher than the alarm value.
Exception Report – the Exception Report provides a table of measurement entries
where data was not acquired during the Route measurement
Measurement Report – the Measurement Report provides a table of measurements
from each entry with the previous measurement, latest measurement, percentage
change and date.
Reading Report – the Reading Report provides a table of readings for each entry
with the previous reading, last reading, percentage change and date.
Structure Report – the Structure Report provides a listing of the current database
measurement points, entries and measured values in tabular form for the entire
Factory.
Reports
When the report selected is generated, it will be displayed in the Report Tab section to review
the reports, optimize them for printing, emailing or posting to the web. The Report Generator
is powerful and flexible with options for adding logos, controlling page layout in portrait or
landscape mode, fonts and colors. The Default Template provides a standard report to
customize to meet your requirements.
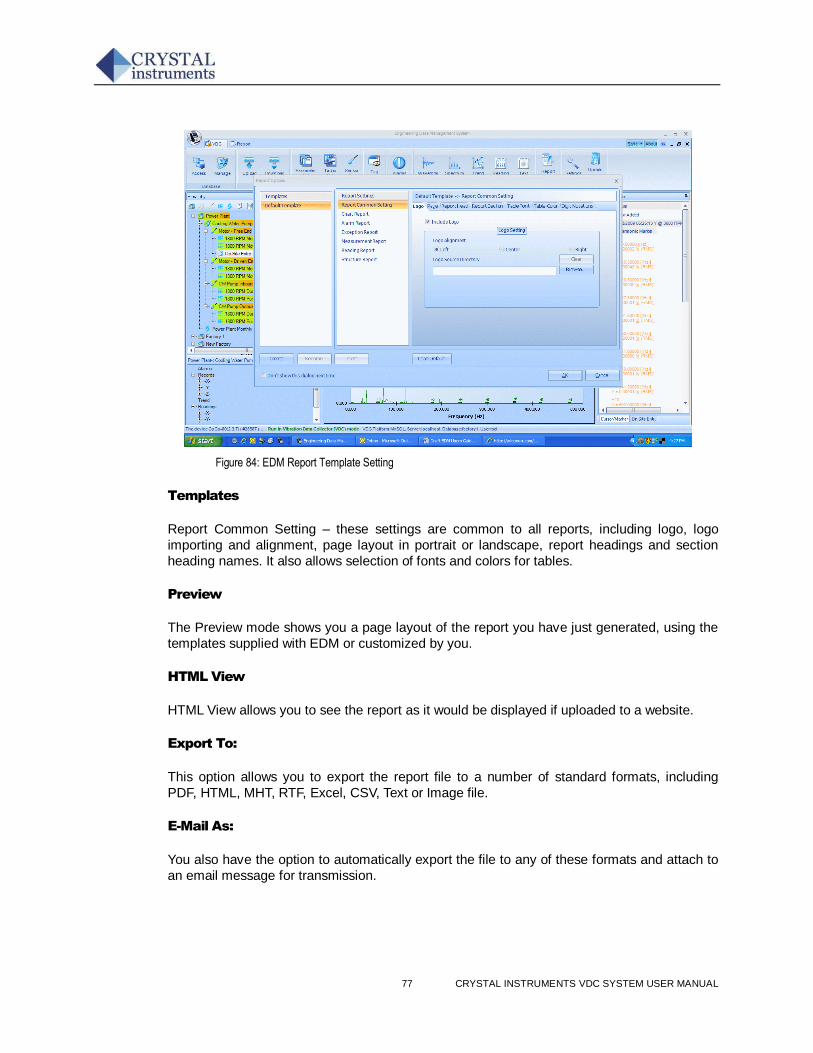
77 CRYSTAL INSTRUMENTS VDC SYSTEM USER MANUAL
Figure 84: EDM Report Template Setting
Templates
Report Common Setting – these settings are common to all reports, including logo, logo
importing and alignment, page layout in portrait or landscape, report headings and section
heading names. It also allows selection of fonts and colors for tables.
Preview
The Preview mode shows you a page layout of the report you have just generated, using the
templates supplied with EDM or customized by you.
HTML View
HTML View allows you to see the report as it would be displayed if uploaded to a website.
Export To:
This option allows you to export the report file to a number of standard formats, including
PDF, HTML, MHT, RTF, Excel, CSV, Text or Image file.
E-Mail As:
You also have the option to automatically export the file to any of these formats and attach to
an email message for transmission.
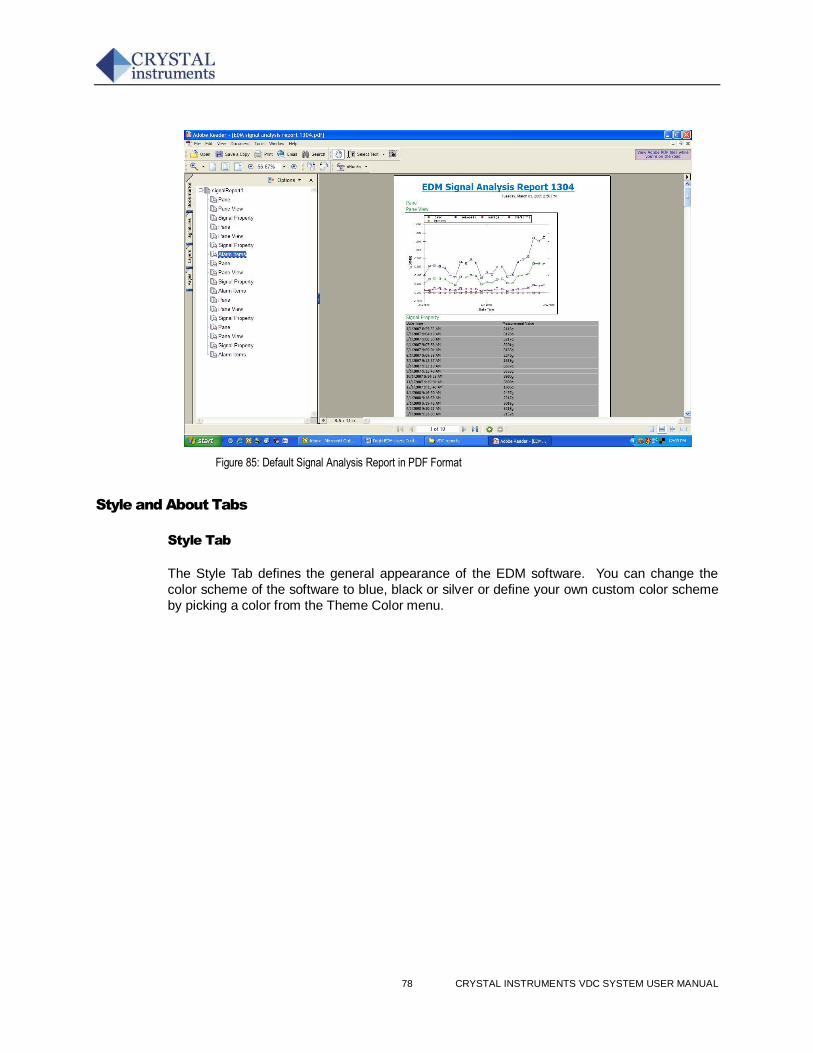
78 CRYSTAL INSTRUMENTS VDC SYSTEM USER MANUAL
Figure 85: Default Signal Analysis Report in PDF Format
Style and About Tabs
Style Tab
The Style Tab defines the general appearance of the EDM software. You can change the
color scheme of the software to blue, black or silver or define your own custom color scheme
by picking a color from the Theme Color menu.
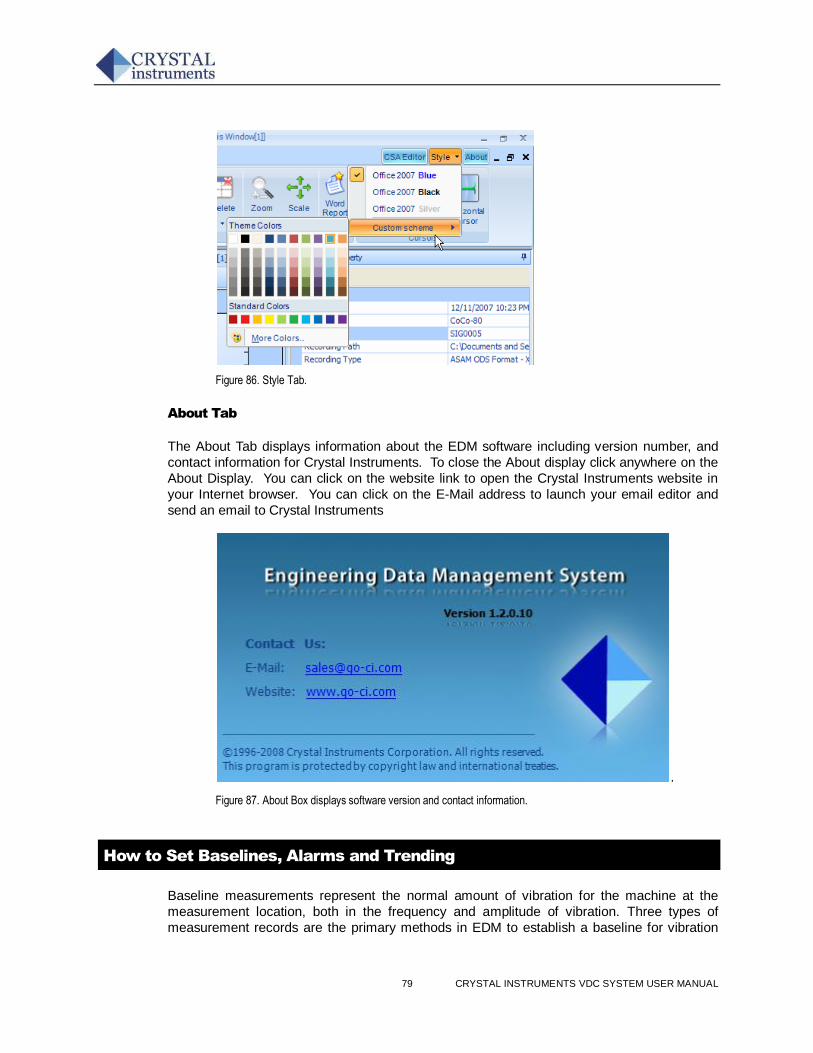
79 CRYSTAL INSTRUMENTS VDC SYSTEM USER MANUAL
Figure 86. Style Tab.
About Tab
The About Tab displays information about the EDM software including version number, and
contact information for Crystal Instruments. To close the About display click anywhere on the
About Display. You can click on the website link to open the Crystal Instruments website in
your Internet browser. You can click on the E-Mail address to launch your email editor and
send an email to Crystal Instruments
.
Figure 87. About Box displays software version and contact information.
How to Set Baselines, Alarms and Trending
Baseline measurements represent the normal amount of vibration for the machine at the
measurement location, both in the frequency and amplitude of vibration. Three types of
measurement records are the primary methods in EDM to establish a baseline for vibration
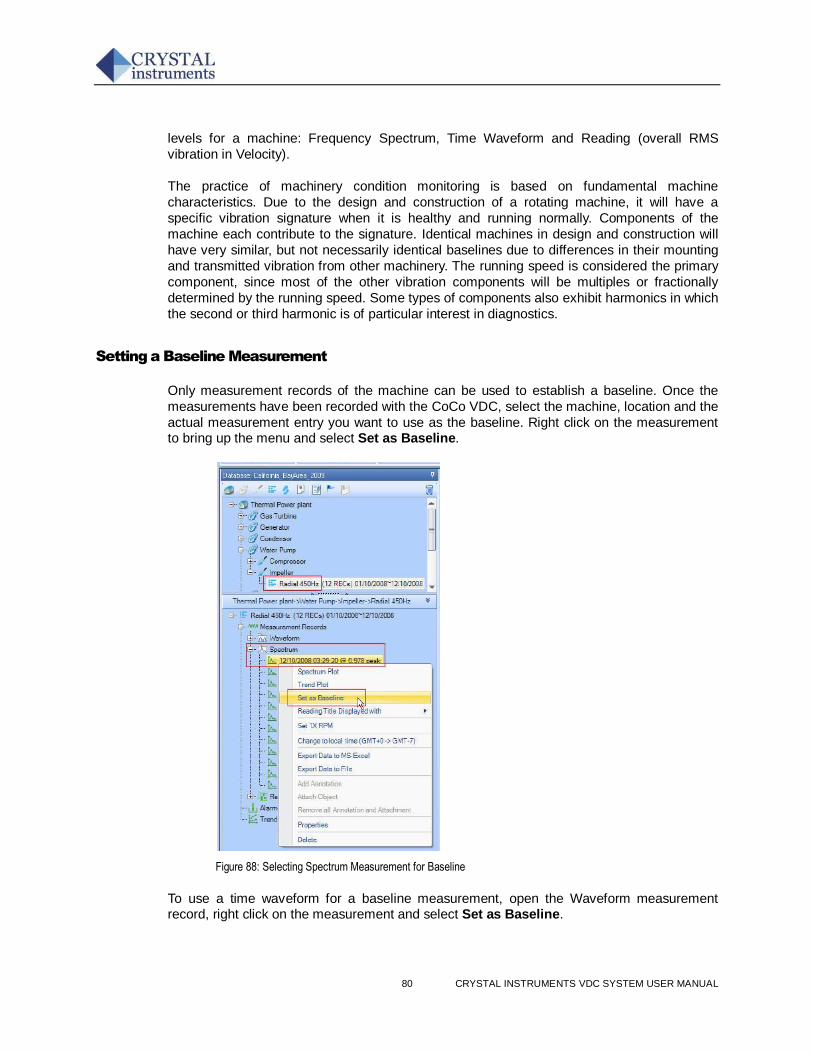
80 CRYSTAL INSTRUMENTS VDC SYSTEM USER MANUAL
levels for a machine: Frequency Spectrum, Time Waveform and Reading (overall RMS
vibration in Velocity).
The practice of machinery condition monitoring is based on fundamental machine
characteristics. Due to the design and construction of a rotating machine, it will have a
specific vibration signature when it is healthy and running normally. Components of the
machine each contribute to the signature. Identical machines in design and construction will
have very similar, but not necessarily identical baselines due to differences in their mounting
and transmitted vibration from other machinery. The running speed is considered the primary
component, since most of the other vibration components will be multiples or fractionally
determined by the running speed. Some types of components also exhibit harmonics in which
the second or third harmonic is of particular interest in diagnostics.
Setting a Baseline Measurement
Only measurement records of the machine can be used to establish a baseline. Once the
measurements have been recorded with the CoCo VDC, select the machine, location and the
actual measurement entry you want to use as the baseline. Right click on the measurement to bring up the menu and select Set as Baseline.
Figure 88: Selecting Spectrum Measurement for Baseline
To use a time waveform for a baseline measurement, open the Waveform measurement record, right click on the measurement and select Set as Baseline.
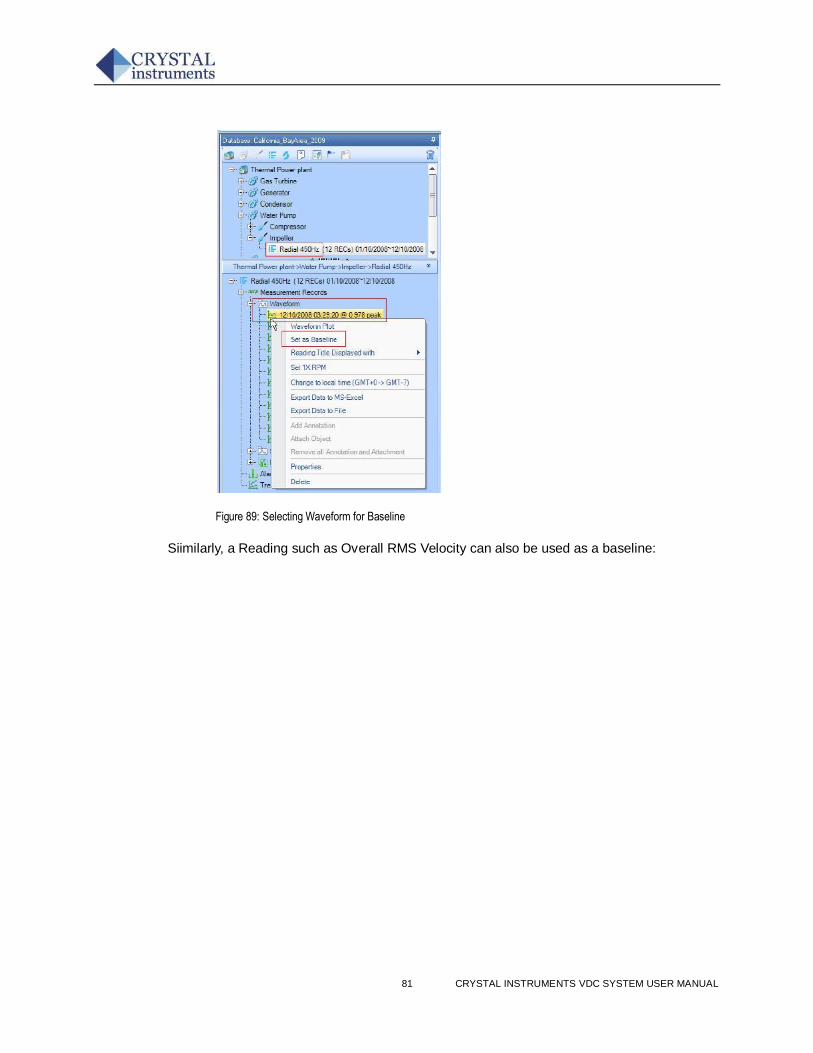
81 CRYSTAL INSTRUMENTS VDC SYSTEM USER MANUAL
Figure 89: Selecting Waveform for Baseline
Siimilarly, a Reading such as Overall RMS Velocity can also be used as a baseline:
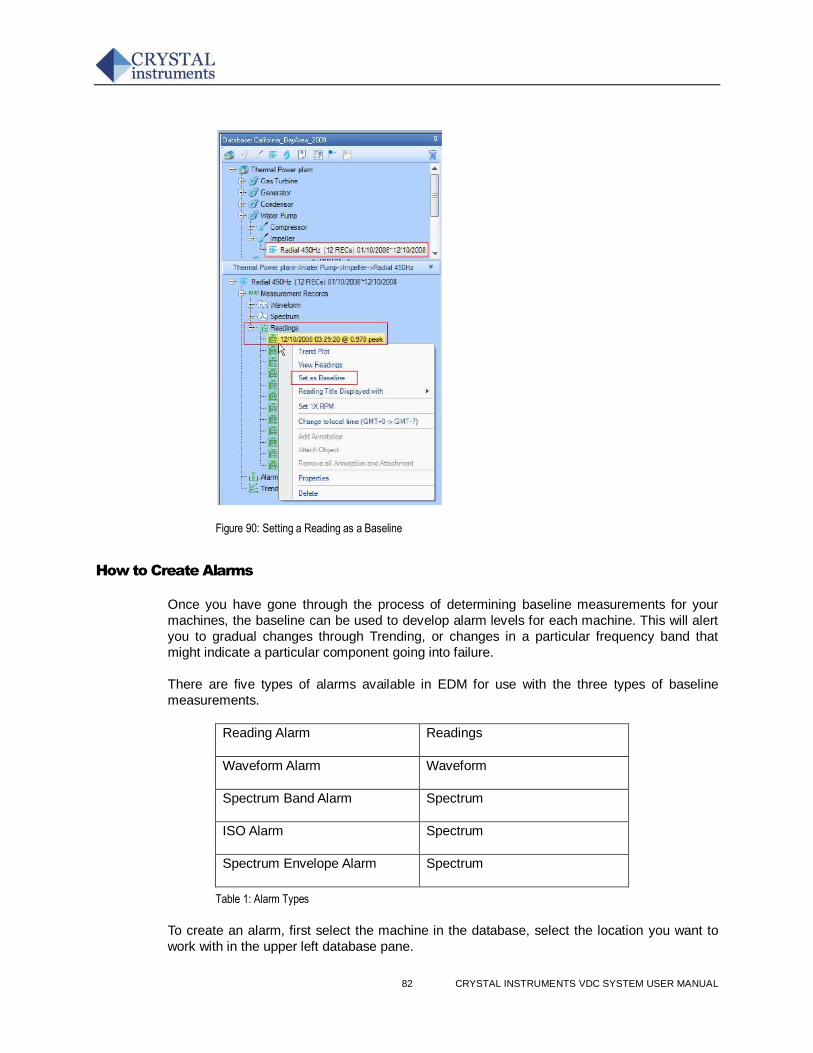
82 CRYSTAL INSTRUMENTS VDC SYSTEM USER MANUAL
Figure 90: Setting a Reading as a Baseline
How to Create Alarms
Once you have gone through the process of determining baseline measurements for your
machines, the baseline can be used to develop alarm levels for each machine. This will alert
you to gradual changes through Trending, or changes in a particular frequency band that
might indicate a particular component going into failure.
There are five types of alarms available in EDM for use with the three types of baseline
measurements.
Reading Alarm Readings
Waveform Alarm Waveform
Spectrum Band Alarm Spectrum
ISO Alarm Spectrum
Spectrum Envelope Alarm Spectrum
Table 1: Alarm Types
To create an alarm, first select the machine in the database, select the location you want to
work with in the upper left database pane.
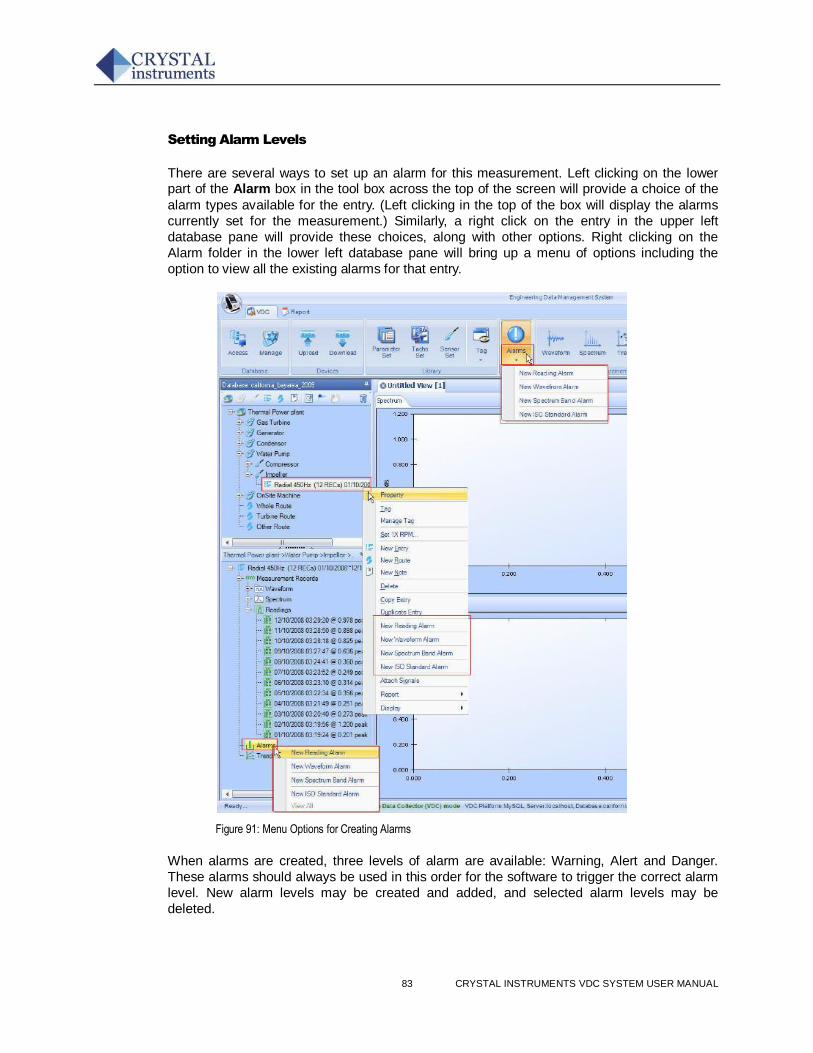
83 CRYSTAL INSTRUMENTS VDC SYSTEM USER MANUAL
Setting Alarm Levels
There are several ways to set up an alarm for this measurement. Left clicking on the lower part of the Alarm box in the tool box across the top of the screen will provide a choice of the
alarm types available for the entry. (Left clicking in the top of the box will display the alarms
currently set for the measurement.) Similarly, a right click on the entry in the upper left
database pane will provide these choices, along with other options. Right clicking on the
Alarm folder in the lower left database pane will bring up a menu of options including the
option to view all the existing alarms for that entry.
Figure 91: Menu Options for Creating Alarms
When alarms are created, three levels of alarm are available: Warning, Alert and Danger.
These alarms should always be used in this order for the software to trigger the correct alarm
level. New alarm levels may be created and added, and selected alarm levels may be
deleted.
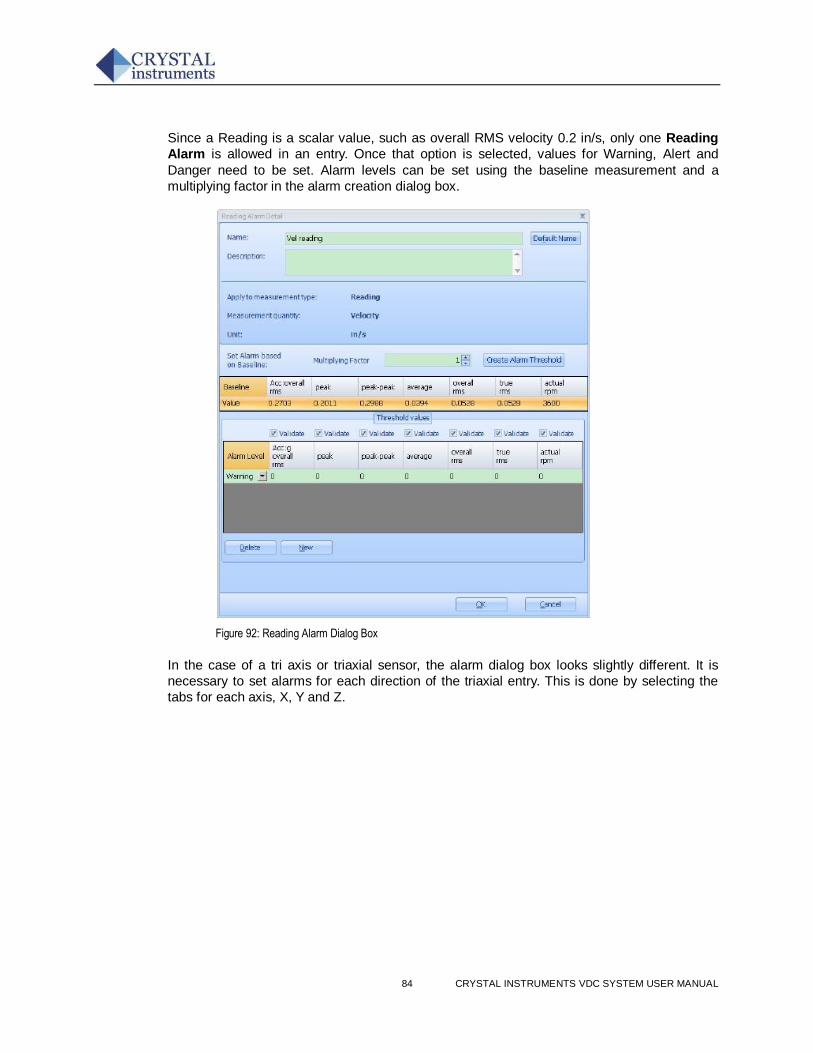
84 CRYSTAL INSTRUMENTS VDC SYSTEM USER MANUAL
Since a Reading is a scalar value, such as overall RMS velocity 0.2 in/s, only one Reading
Alarm is allowed in an entry. Once that option is selected, values for Warning, Alert and
Danger need to be set. Alarm levels can be set using the baseline measurement and a
multiplying factor in the alarm creation dialog box.
Figure 92: Reading Alarm Dialog Box
In the case of a tri axis or triaxial sensor, the alarm dialog box looks slightly different. It is
necessary to set alarms for each direction of the triaxial entry. This is done by selecting the
tabs for each axis, X, Y and Z.
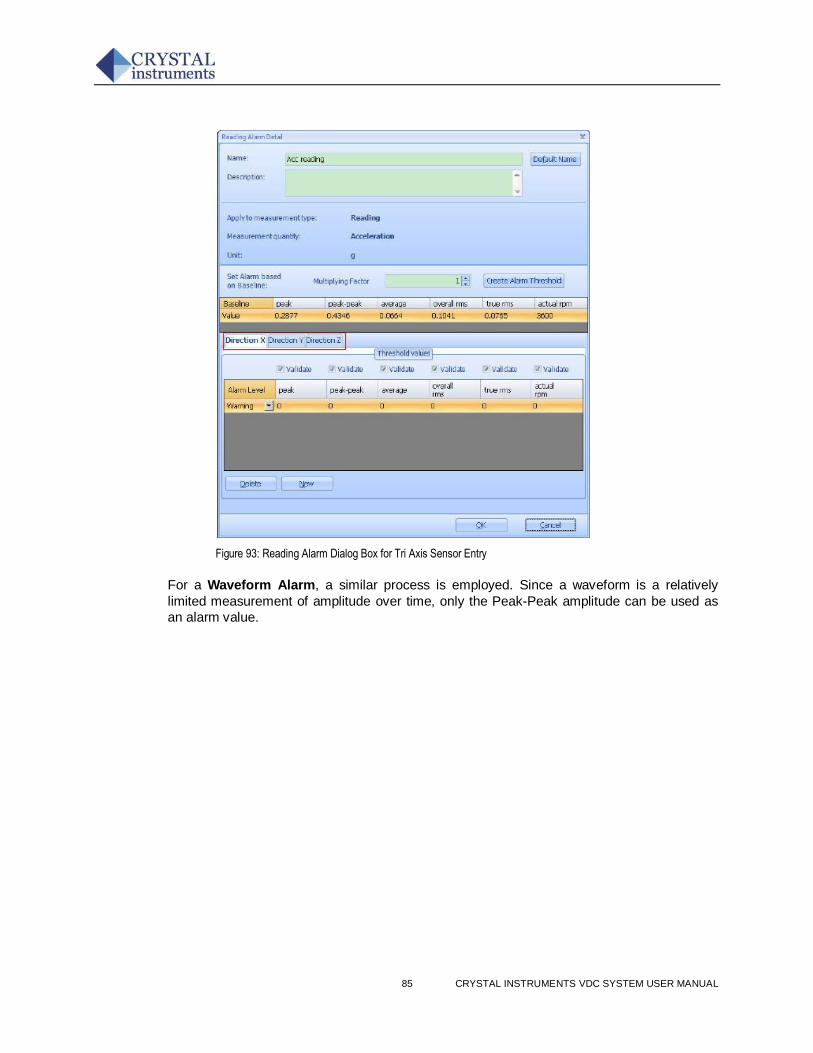
85 CRYSTAL INSTRUMENTS VDC SYSTEM USER MANUAL
Figure 93: Reading Alarm Dialog Box for Tri Axis Sensor Entry
For a Waveform Alarm, a similar process is employed. Since a waveform is a relatively
limited measurement of amplitude over time, only the Peak-Peak amplitude can be used as
an alarm value.
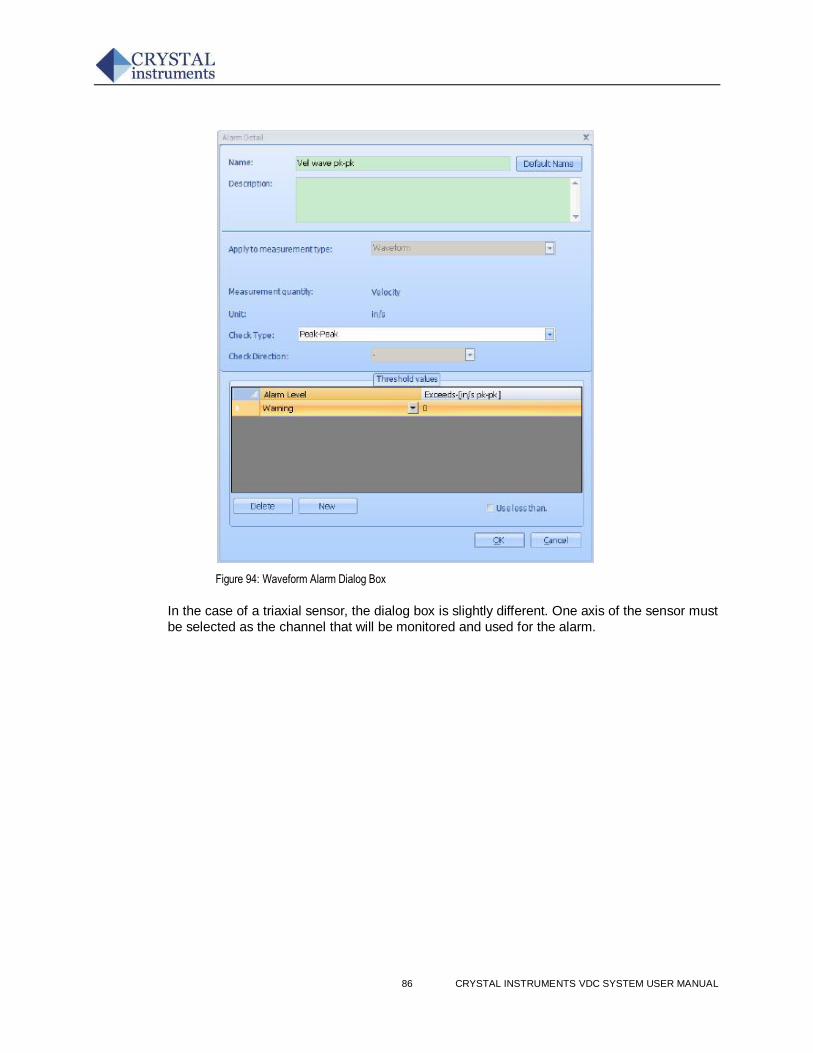
86 CRYSTAL INSTRUMENTS VDC SYSTEM USER MANUAL
Figure 94: Waveform Alarm Dialog Box
In the case of a triaxial sensor, the dialog box is slightly different. One axis of the sensor must
be selected as the channel that will be monitored and used for the alarm.
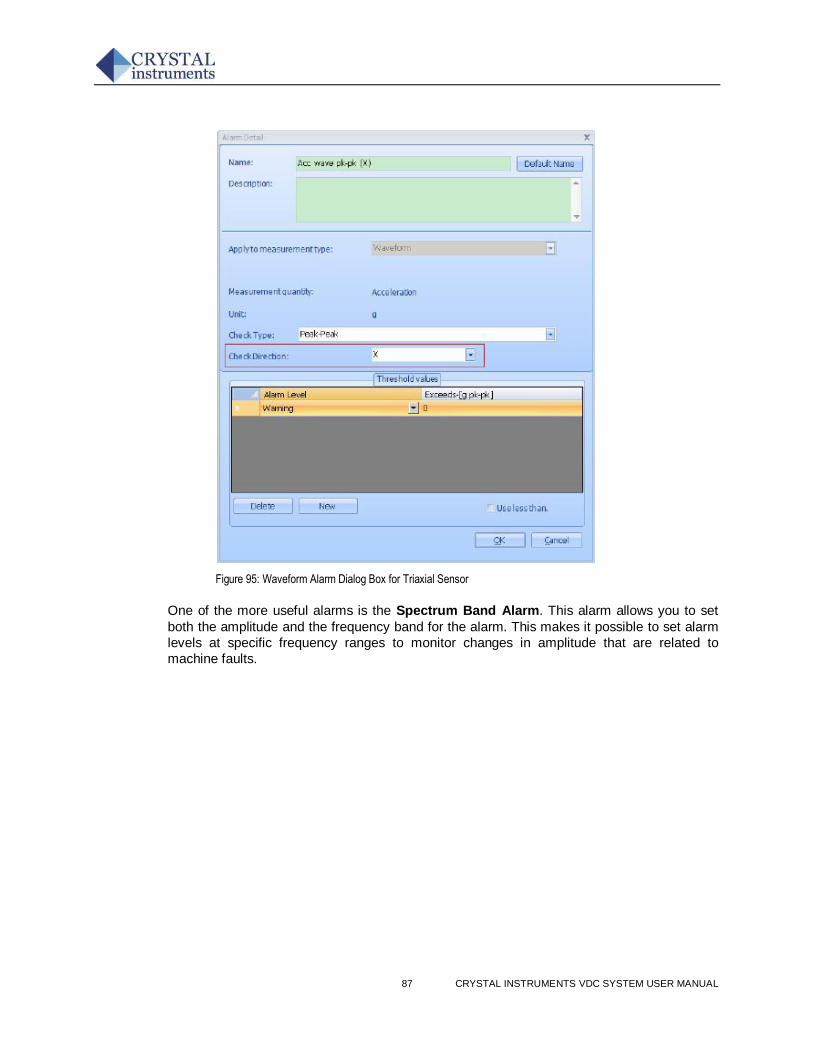
87 CRYSTAL INSTRUMENTS VDC SYSTEM USER MANUAL
Figure 95: Waveform Alarm Dialog Box for Triaxial Sensor
One of the more useful alarms is the Spectrum Band Alarm. This alarm allows you to set
both the amplitude and the frequency band for the alarm. This makes it possible to set alarm
levels at specific frequency ranges to monitor changes in amplitude that are related to
machine faults.
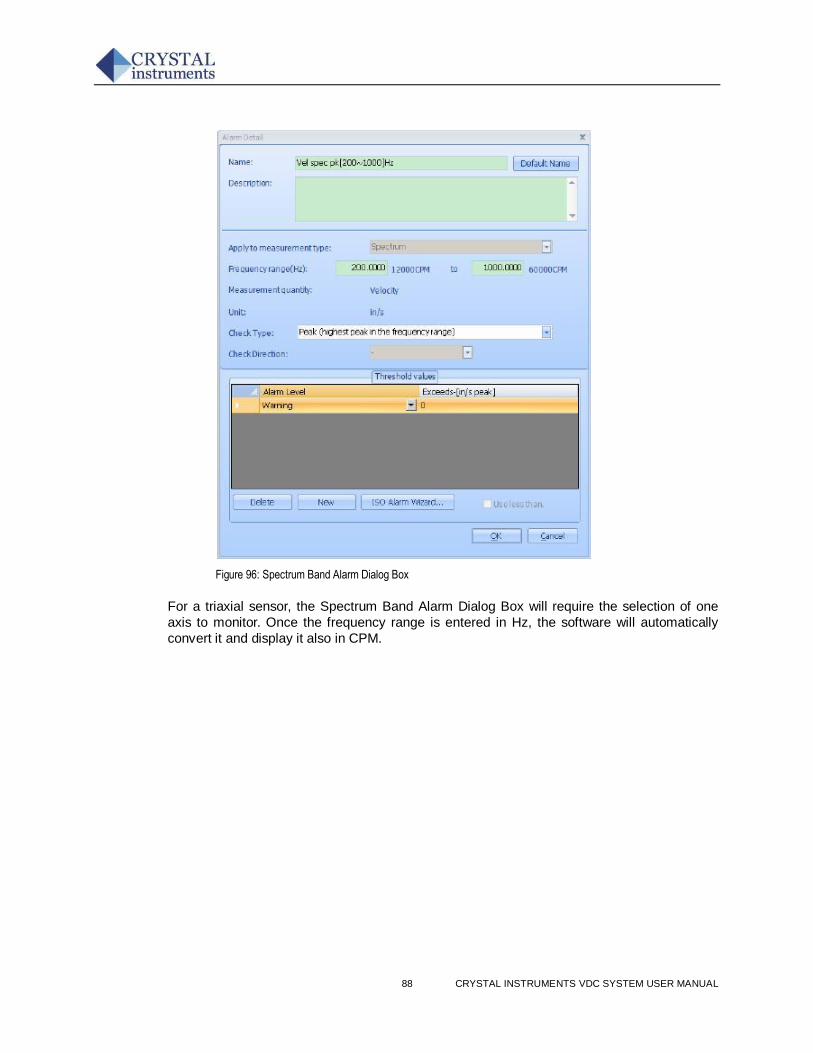
88 CRYSTAL INSTRUMENTS VDC SYSTEM USER MANUAL
Figure 96: Spectrum Band Alarm Dialog Box
For a triaxial sensor, the Spectrum Band Alarm Dialog Box will require the selection of one
axis to monitor. Once the frequency range is entered in Hz, the software will automatically
convert it and display it also in CPM.
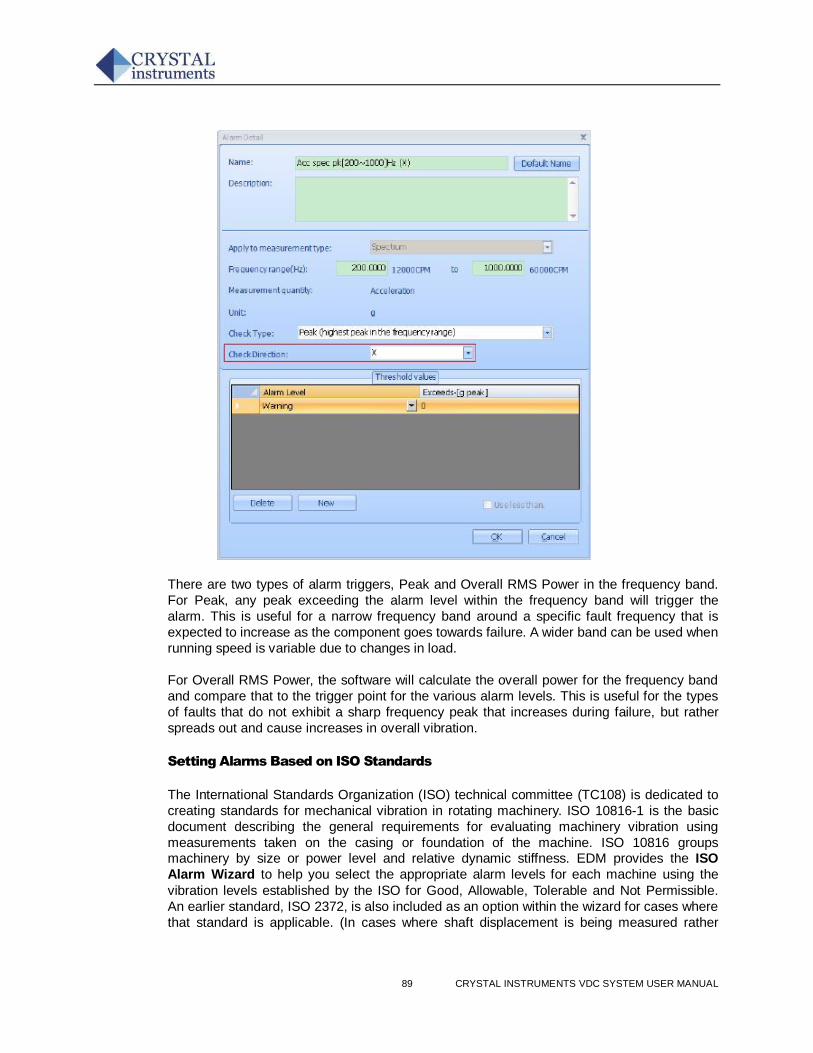
89 CRYSTAL INSTRUMENTS VDC SYSTEM USER MANUAL
There are two types of alarm triggers, Peak and Overall RMS Power in the frequency band.
For Peak, any peak exceeding the alarm level within the frequency band will trigger the
alarm. This is useful for a narrow frequency band around a specific fault frequency that is
expected to increase as the component goes towards failure. A wider band can be used when
running speed is variable due to changes in load.
For Overall RMS Power, the software will calculate the overall power for the frequency band
and compare that to the trigger point for the various alarm levels. This is useful for the types
of faults that do not exhibit a sharp frequency peak that increases during failure, but rather
spreads out and cause increases in overall vibration.
Setting Alarms Based on ISO Standards
The International Standards Organization (ISO) technical committee (TC108) is dedicated to
creating standards for mechanical vibration in rotating machinery. ISO 10816-1 is the basic
document describing the general requirements for evaluating machinery vibration using
measurements taken on the casing or foundation of the machine. ISO 10816 groups machinery by size or power level and relative dynamic stiffness. EDM provides the ISO
Alarm Wizard to help you select the appropriate alarm levels for each machine using the
vibration levels established by the ISO for Good, Allowable, Tolerable and Not Permissible.
An earlier standard, ISO 2372, is also included as an option within the wizard for cases where
that standard is applicable. (In cases where shaft displacement is being measured rather
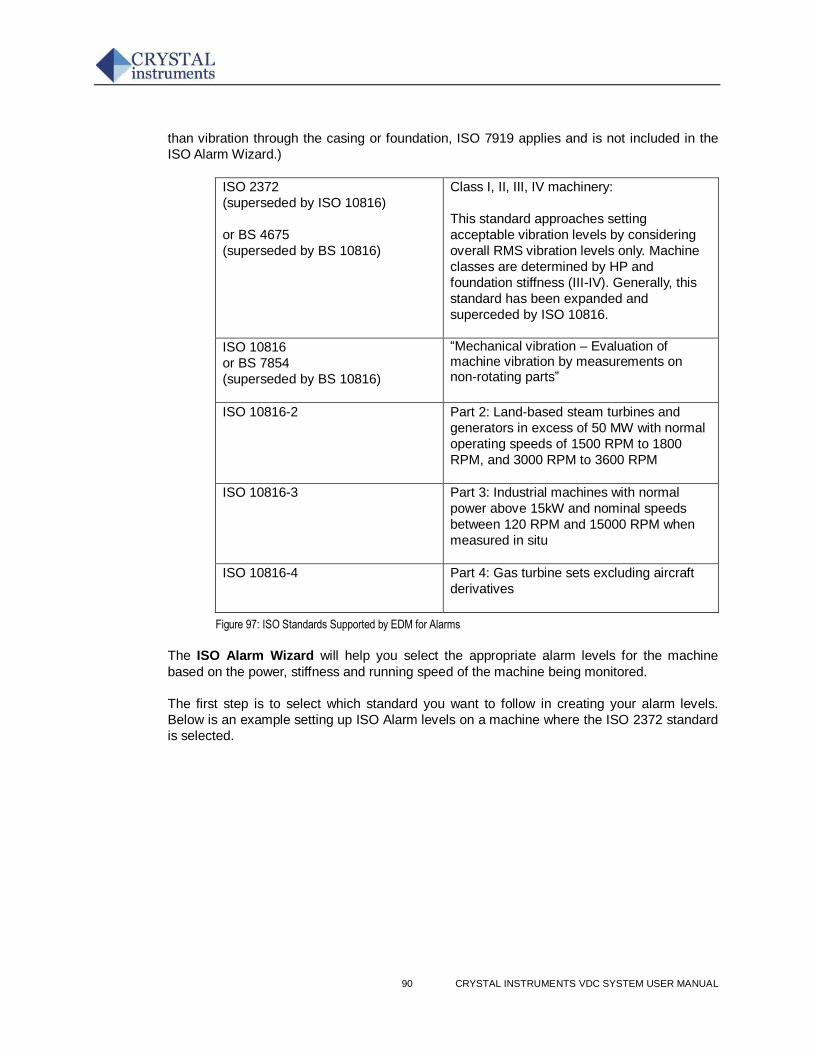
90 CRYSTAL INSTRUMENTS VDC SYSTEM USER MANUAL
than vibration through the casing or foundation, ISO 7919 applies and is not included in the
ISO Alarm Wizard.)
ISO 2372
(superseded by ISO 10816)
or BS 4675
(superseded by BS 10816)
Class I, II, III, IV machinery:
This standard approaches setting
acceptable vibration levels by considering
overall RMS vibration levels only. Machine
classes are determined by HP and
foundation stiffness (III-IV). Generally, this
standard has been expanded and
superceded by ISO 10816.
ISO 10816
or BS 7854
(superseded by BS 10816)
“Mechanical vibration – Evaluation of machine vibration by measurements on non-rotating parts”
ISO 10816-2 Part 2: Land-based steam turbines and
generators in excess of 50 MW with normal
operating speeds of 1500 RPM to 1800
RPM, and 3000 RPM to 3600 RPM
ISO 10816-3 Part 3: Industrial machines with normal
power above 15kW and nominal speeds
between 120 RPM and 15000 RPM when
measured in situ
ISO 10816-4 Part 4: Gas turbine sets excluding aircraft
derivatives
Figure 97: ISO Standards Supported by EDM for Alarms
The ISO Alarm Wizard will help you select the appropriate alarm levels for the machine
based on the power, stiffness and running speed of the machine being monitored.
The first step is to select which standard you want to follow in creating your alarm levels.
Below is an example setting up ISO Alarm levels on a machine where the ISO 2372 standard
is selected.
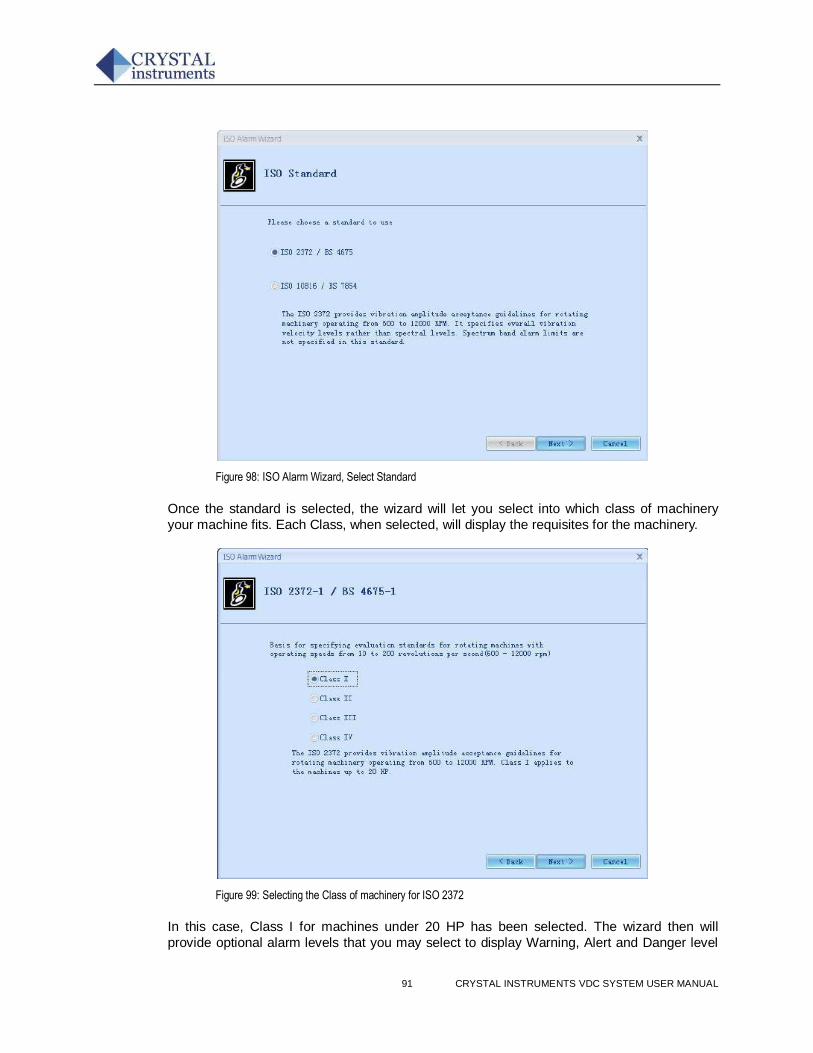
91 CRYSTAL INSTRUMENTS VDC SYSTEM USER MANUAL
Figure 98: ISO Alarm Wizard, Select Standard
Once the standard is selected, the wizard will let you select into which class of machinery
your machine fits. Each Class, when selected, will display the requisites for the machinery.
Figure 99: Selecting the Class of machinery for ISO 2372
In this case, Class I for machines under 20 HP has been selected. The wizard then will
provide optional alarm levels that you may select to display Warning, Alert and Danger level
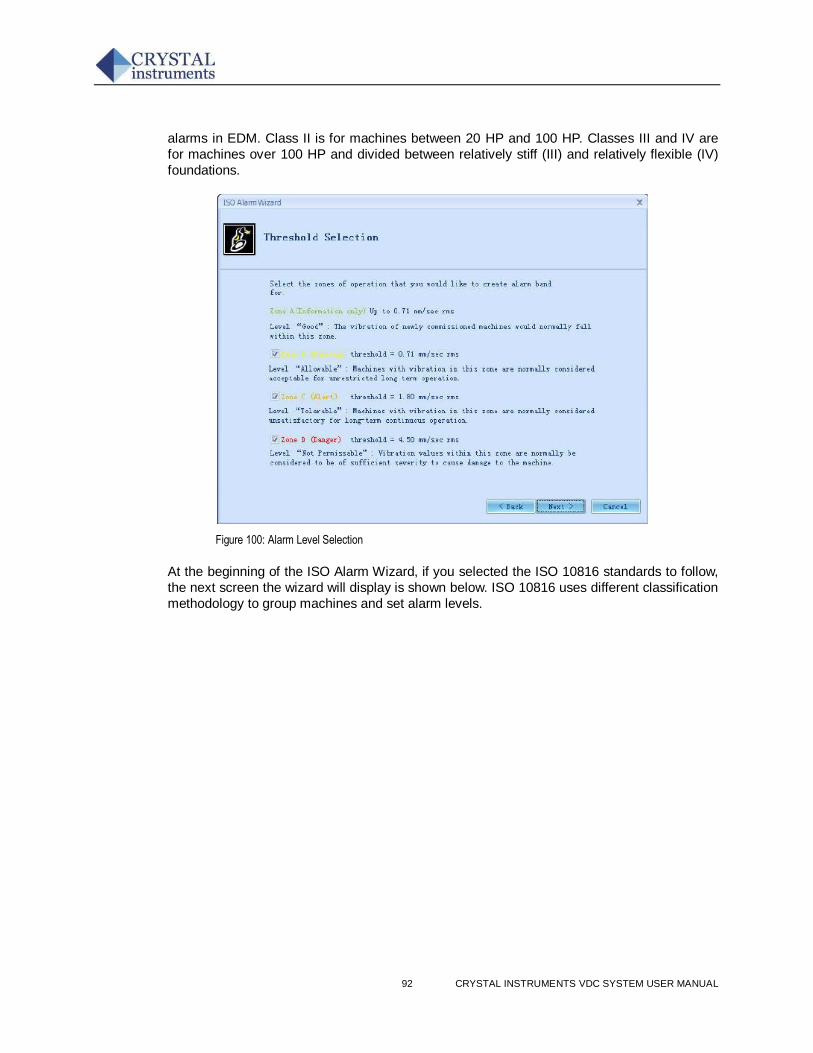
92 CRYSTAL INSTRUMENTS VDC SYSTEM USER MANUAL
alarms in EDM. Class II is for machines between 20 HP and 100 HP. Classes III and IV are
for machines over 100 HP and divided between relatively stiff (III) and relatively flexible (IV)
foundations.
Figure 100: Alarm Level Selection
At the beginning of the ISO Alarm Wizard, if you selected the ISO 10816 standards to follow,
the next screen the wizard will display is shown below. ISO 10816 uses different classification
methodology to group machines and set alarm levels.

93 CRYSTAL INSTRUMENTS VDC SYSTEM USER MANUAL
Figure 101: ISO 10816 Machinery Classifications
For example, if you selected ISO 10816-2 for large land based steam turbines and
generators in excess of 50 MW, the wizard will then ask you to select the nominal shaft
rotational speed.
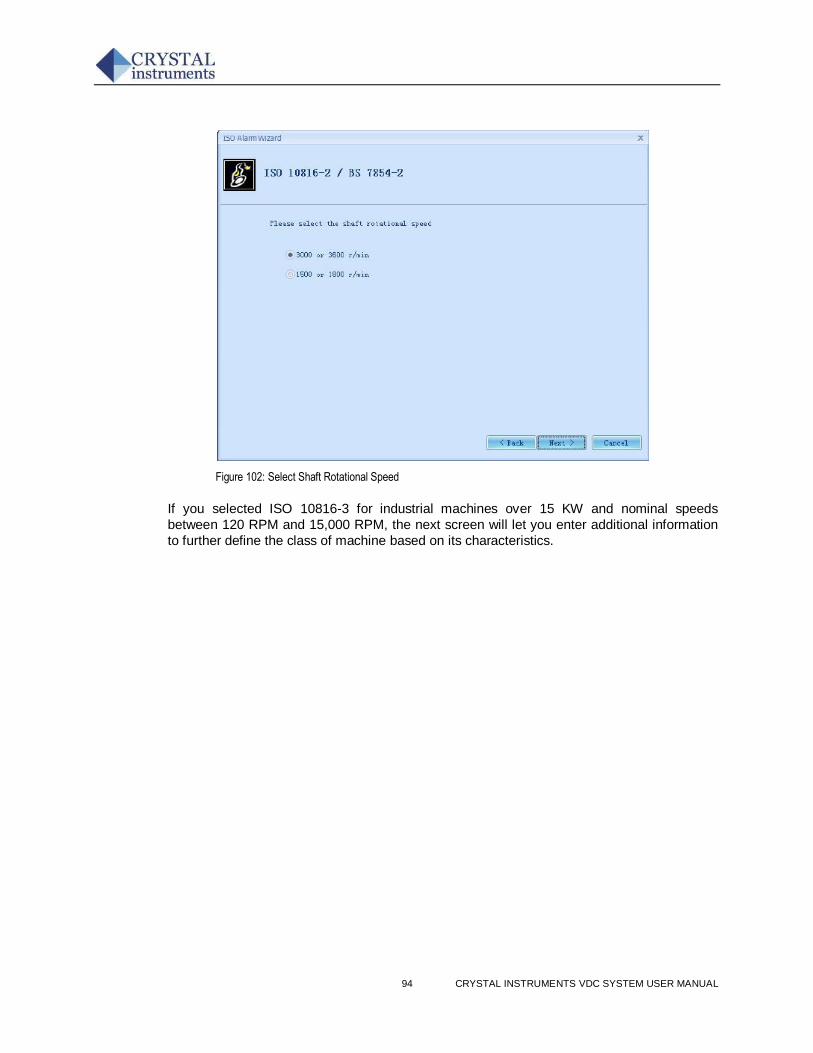
94 CRYSTAL INSTRUMENTS VDC SYSTEM USER MANUAL
Figure 102: Select Shaft Rotational Speed
If you selected ISO 10816-3 for industrial machines over 15 KW and nominal speeds
between 120 RPM and 15,000 RPM, the next screen will let you enter additional information
to further define the class of machine based on its characteristics.
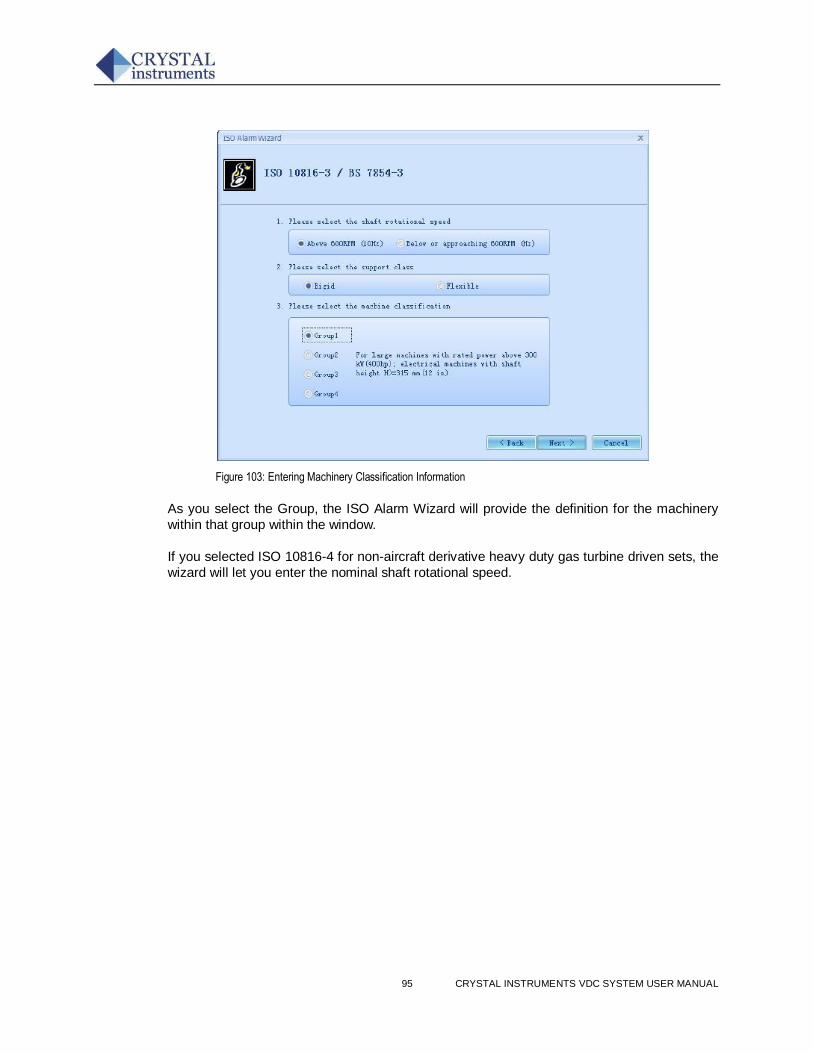
95 CRYSTAL INSTRUMENTS VDC SYSTEM USER MANUAL
Figure 103: Entering Machinery Classification Information
As you select the Group, the ISO Alarm Wizard will provide the definition for the machinery
within that group within the window.
If you selected ISO 10816-4 for non-aircraft derivative heavy duty gas turbine driven sets, the
wizard will let you enter the nominal shaft rotational speed.
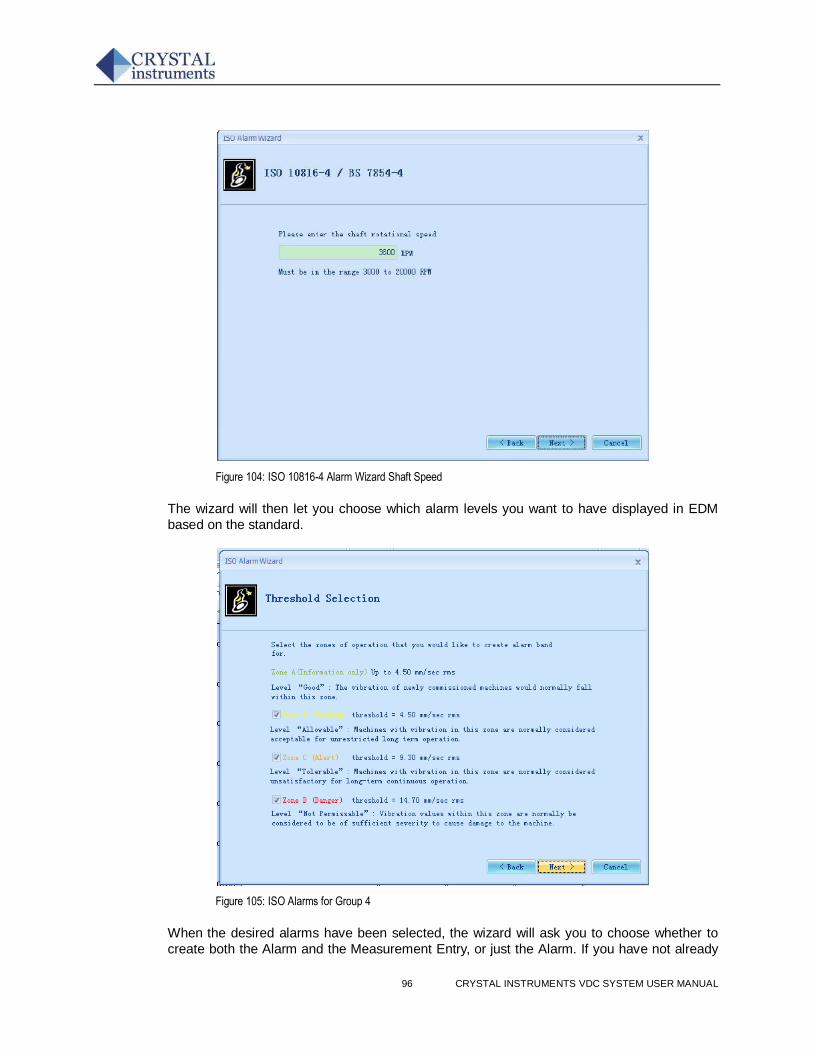
96 CRYSTAL INSTRUMENTS VDC SYSTEM USER MANUAL
Figure 104: ISO 10816-4 Alarm Wizard Shaft Speed
The wizard will then let you choose which alarm levels you want to have displayed in EDM
based on the standard.
Figure 105: ISO Alarms for Group 4
When the desired alarms have been selected, the wizard will ask you to choose whether to
create both the Alarm and the Measurement Entry, or just the Alarm. If you have not already
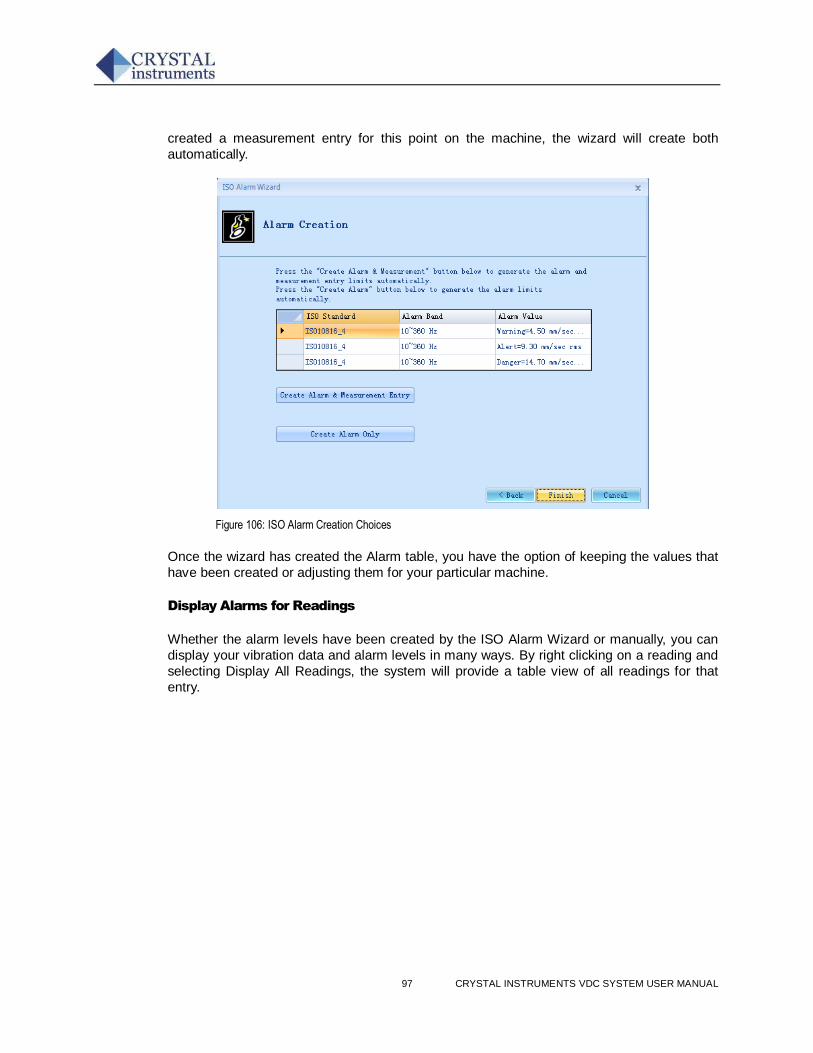
97 CRYSTAL INSTRUMENTS VDC SYSTEM USER MANUAL
created a measurement entry for this point on the machine, the wizard will create both
automatically.
Figure 106: ISO Alarm Creation Choices
Once the wizard has created the Alarm table, you have the option of keeping the values that
have been created or adjusting them for your particular machine.
Display Alarms for Readings
Whether the alarm levels have been created by the ISO Alarm Wizard or manually, you can
display your vibration data and alarm levels in many ways. By right clicking on a reading and
selecting Display All Readings, the system will provide a table view of all readings for that
entry.
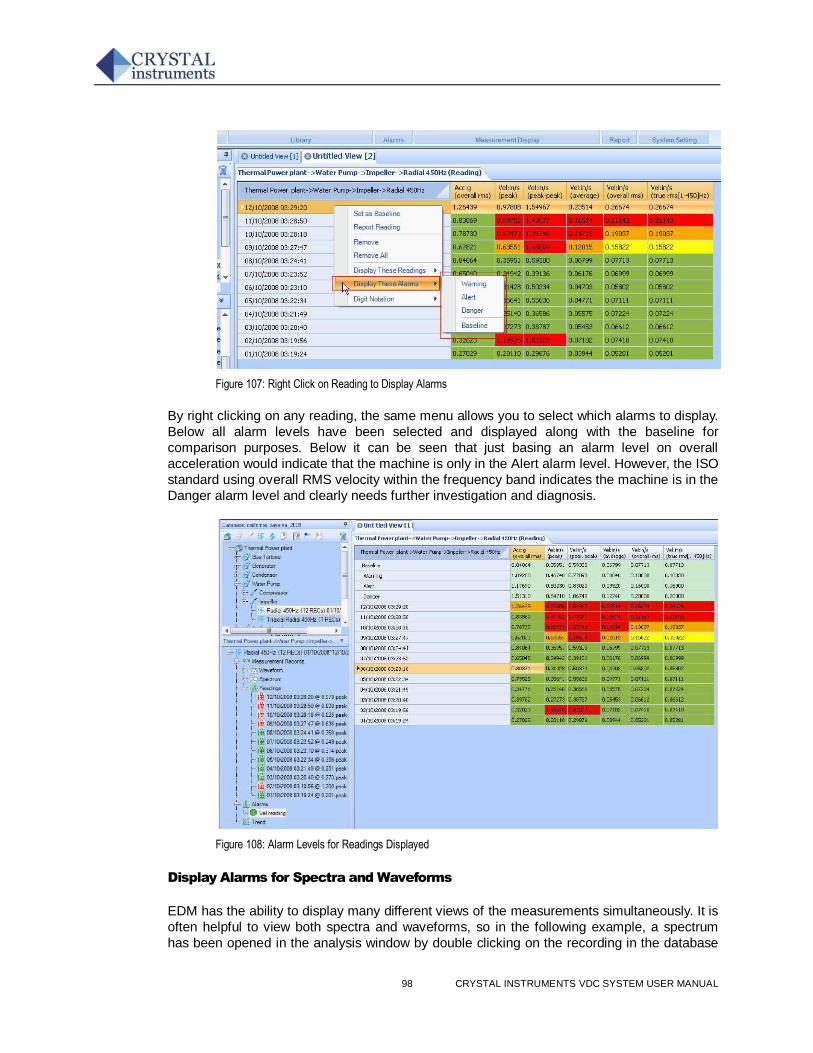
98 CRYSTAL INSTRUMENTS VDC SYSTEM USER MANUAL
Figure 107: Right Click on Reading to Display Alarms
By right clicking on any reading, the same menu allows you to select which alarms to display.
Below all alarm levels have been selected and displayed along with the baseline for
comparison purposes. Below it can be seen that just basing an alarm level on overall
acceleration would indicate that the machine is only in the Alert alarm level. However, the ISO
standard using overall RMS velocity within the frequency band indicates the machine is in the
Danger alarm level and clearly needs further investigation and diagnosis.
Figure 108: Alarm Levels for Readings Displayed
Display Alarms for Spectra and Waveforms
EDM has the ability to display many different views of the measurements simultaneously. It is
often helpful to view both spectra and waveforms, so in the following example, a spectrum
has been opened in the analysis window by double clicking on the recording in the database
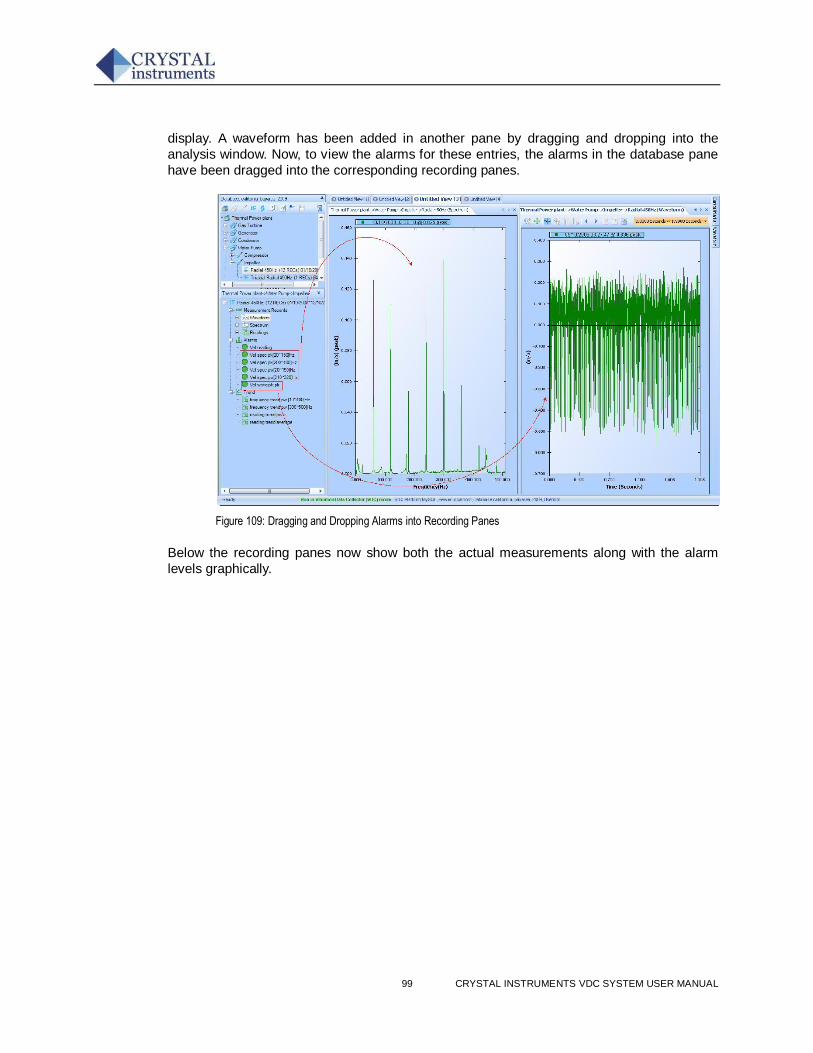
99 CRYSTAL INSTRUMENTS VDC SYSTEM USER MANUAL
display. A waveform has been added in another pane by dragging and dropping into the
analysis window. Now, to view the alarms for these entries, the alarms in the database pane
have been dragged into the corresponding recording panes.
Figure 109: Dragging and Dropping Alarms into Recording Panes
Below the recording panes now show both the actual measurements along with the alarm
levels graphically.
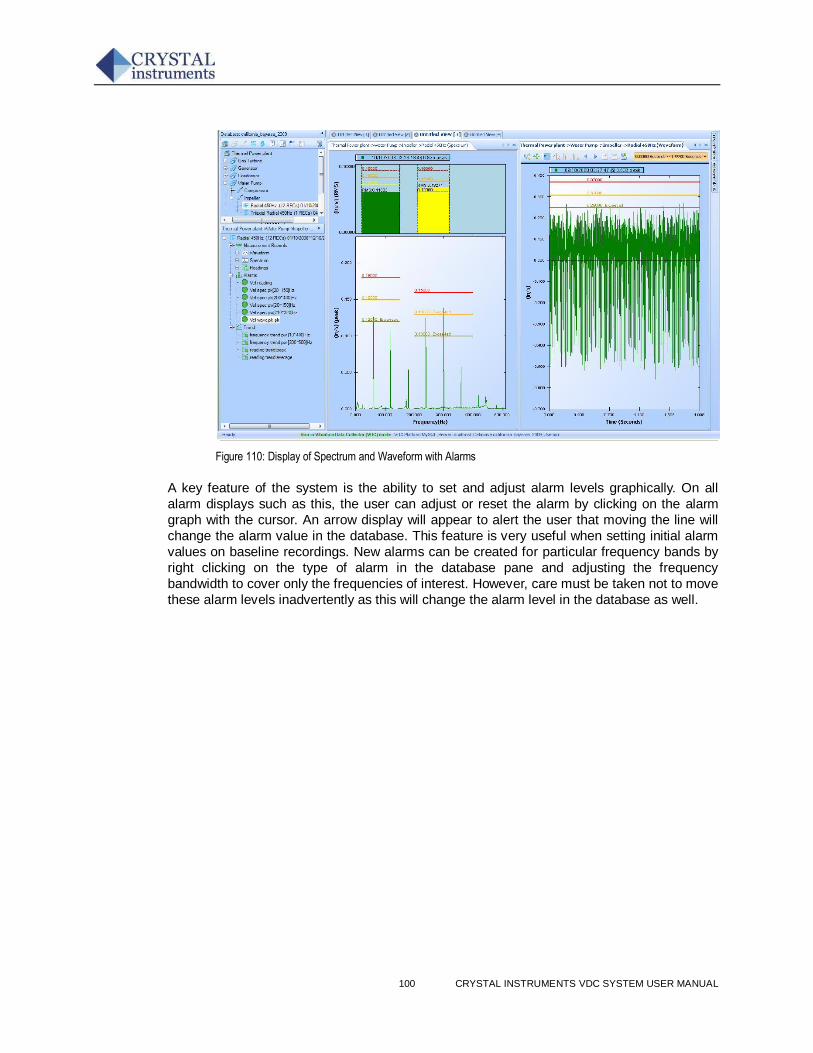
100 CRYSTAL INSTRUMENTS VDC SYSTEM USER MANUAL
Figure 110: Display of Spectrum and Waveform with Alarms
A key feature of the system is the ability to set and adjust alarm levels graphically. On all
alarm displays such as this, the user can adjust or reset the alarm by clicking on the alarm
graph with the cursor. An arrow display will appear to alert the user that moving the line will
change the alarm value in the database. This feature is very useful when setting initial alarm
values on baseline recordings. New alarms can be created for particular frequency bands by
right clicking on the type of alarm in the database pane and adjusting the frequency
bandwidth to cover only the frequencies of interest. However, care must be taken not to move
these alarm levels inadvertently as this will change the alarm level in the database as well.
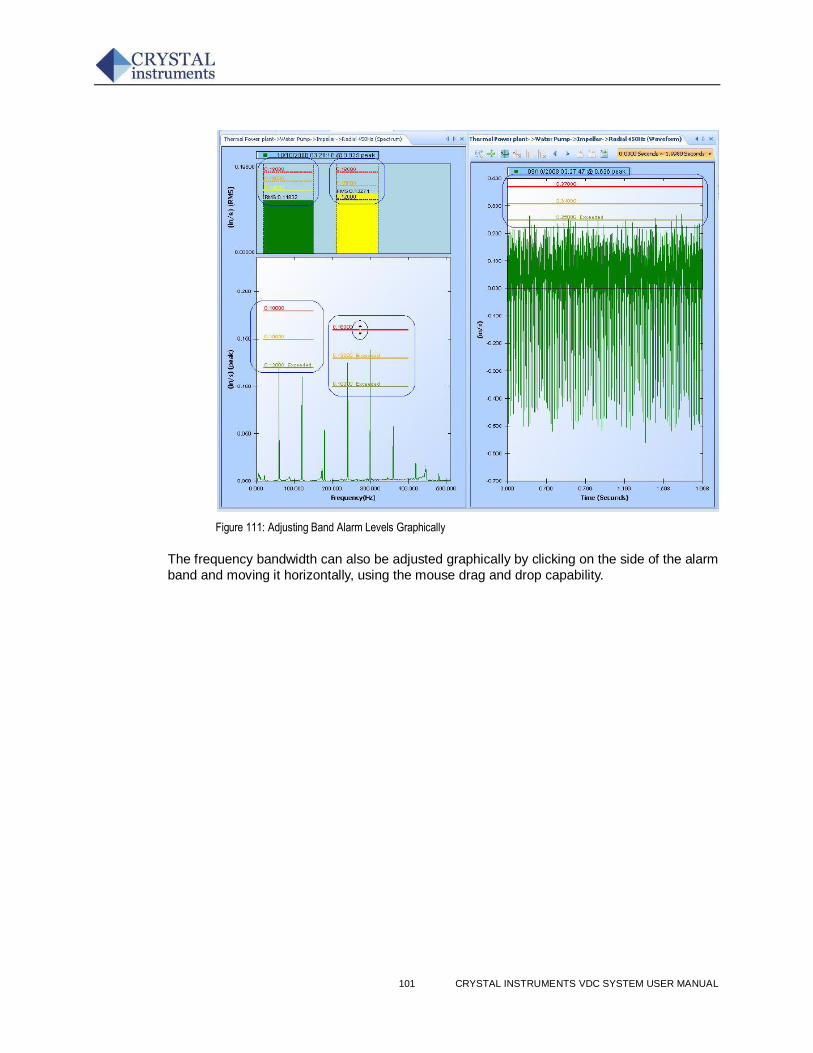
101 CRYSTAL INSTRUMENTS VDC SYSTEM USER MANUAL
Figure 111: Adjusting Band Alarm Levels Graphically
The frequency bandwidth can also be adjusted graphically by clicking on the side of the alarm
band and moving it horizontally, using the mouse drag and drop capability.
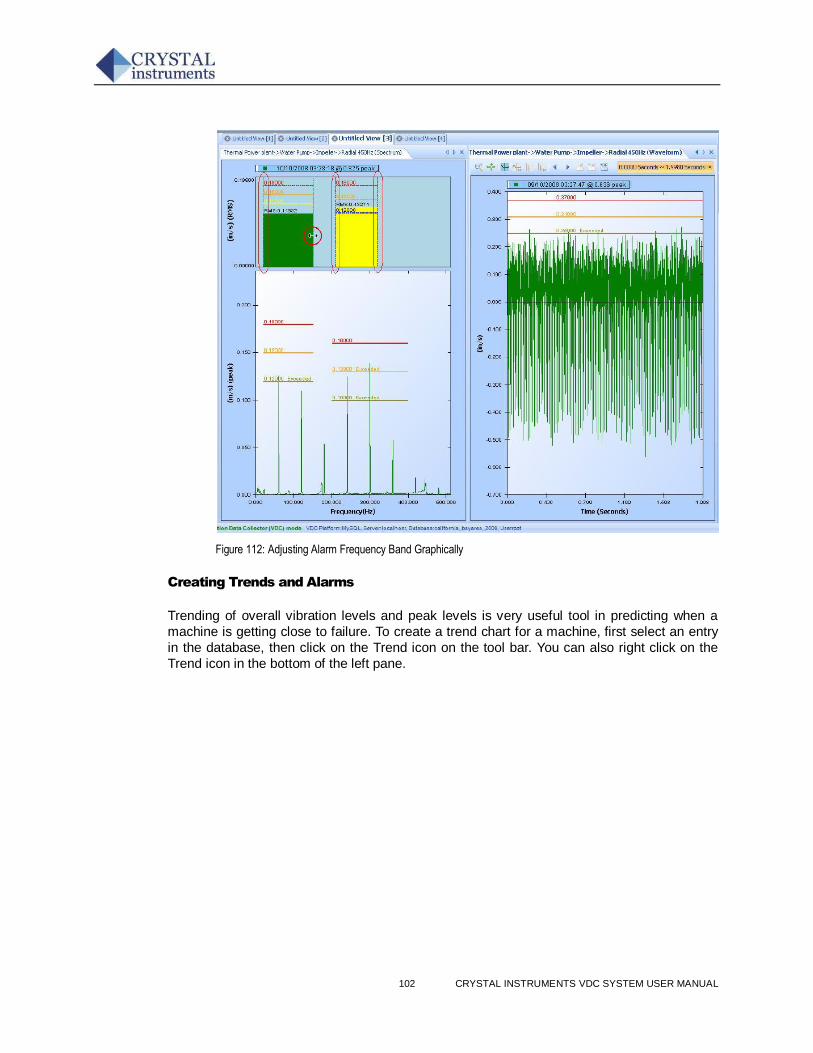
102 CRYSTAL INSTRUMENTS VDC SYSTEM USER MANUAL
Figure 112: Adjusting Alarm Frequency Band Graphically
Creating Trends and Alarms
Trending of overall vibration levels and peak levels is very useful tool in predicting when a
machine is getting close to failure. To create a trend chart for a machine, first select an entry
in the database, then click on the Trend icon on the tool bar. You can also right click on the
Trend icon in the bottom of the left pane.
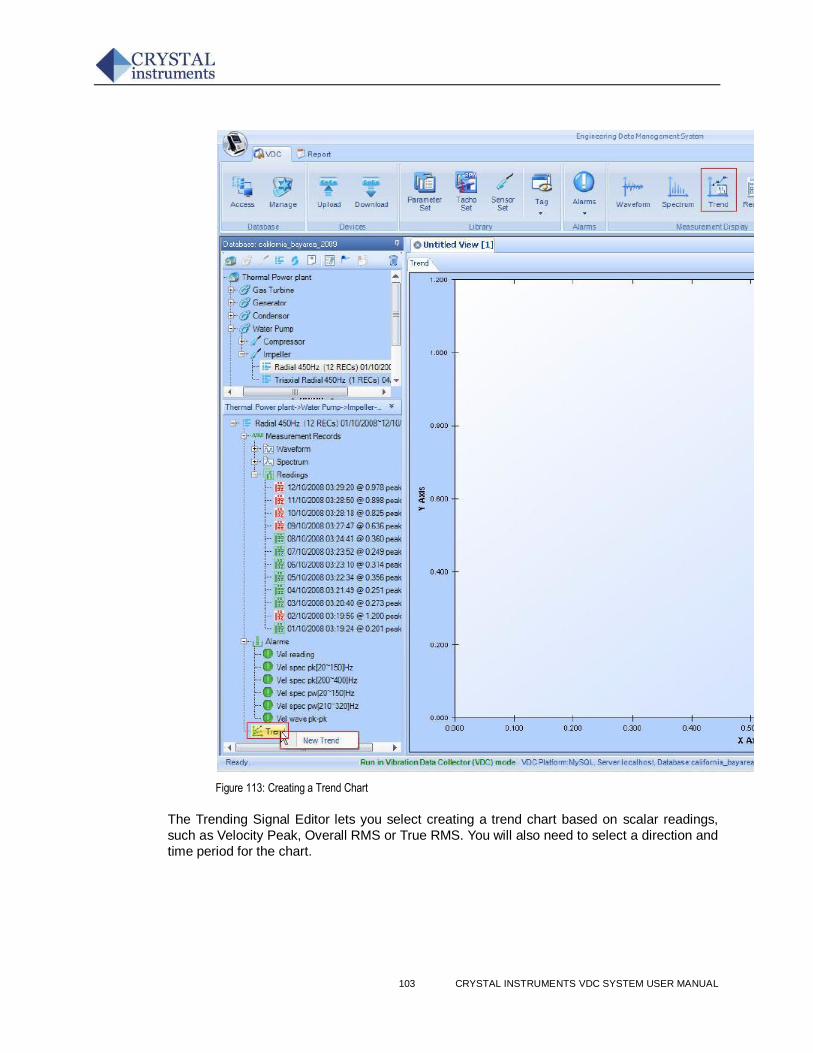
103 CRYSTAL INSTRUMENTS VDC SYSTEM USER MANUAL
Figure 113: Creating a Trend Chart
The Trending Signal Editor lets you select creating a trend chart based on scalar readings,
such as Velocity Peak, Overall RMS or True RMS. You will also need to select a direction and
time period for the chart.
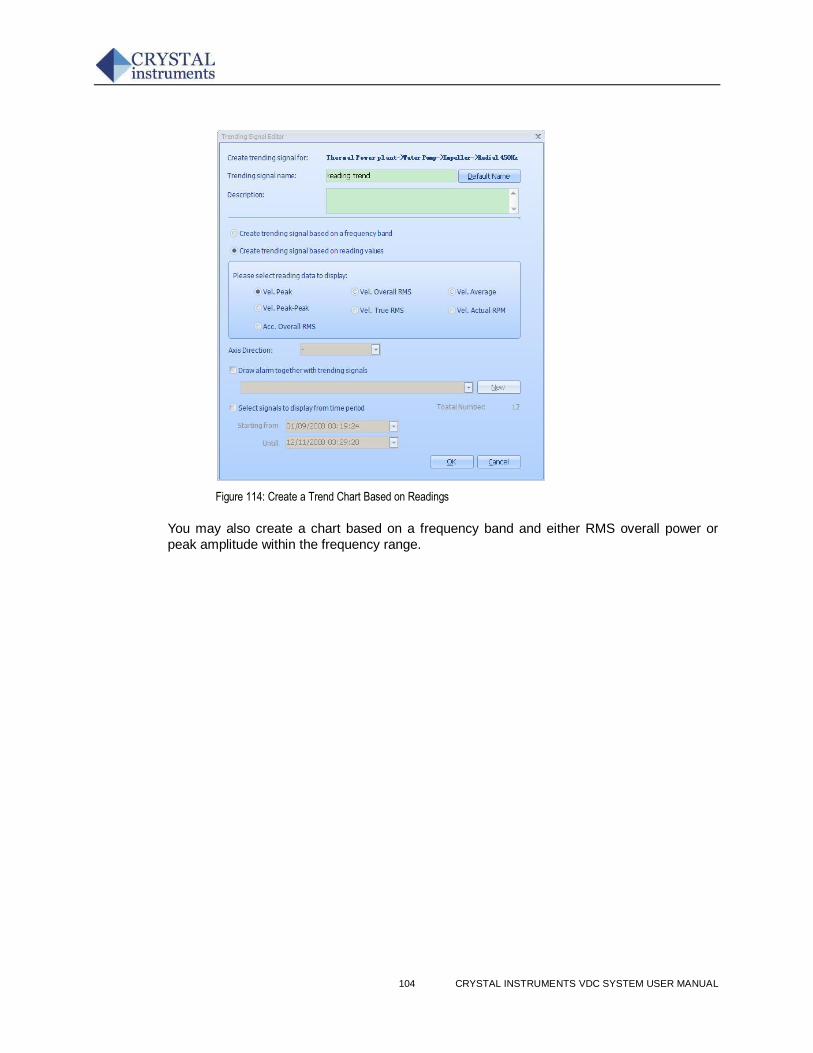
104 CRYSTAL INSTRUMENTS VDC SYSTEM USER MANUAL
Figure 114: Create a Trend Chart Based on Readings
You may also create a chart based on a frequency band and either RMS overall power or
peak amplitude within the frequency range.
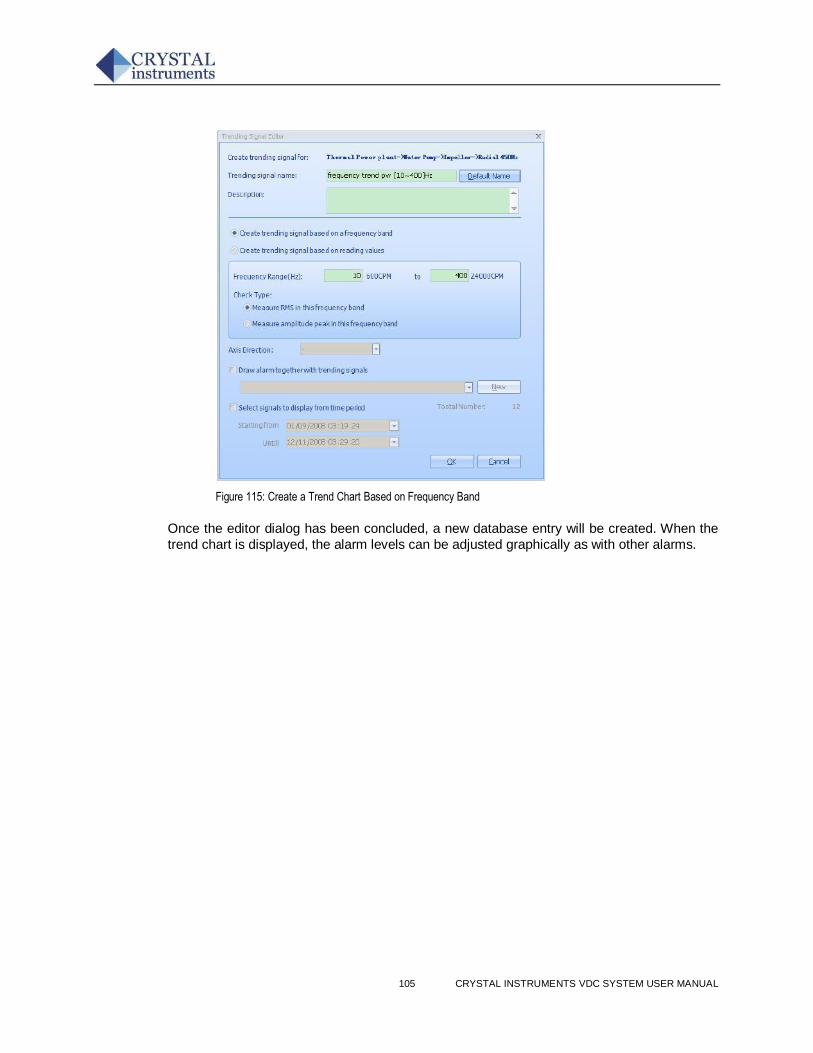
105 CRYSTAL INSTRUMENTS VDC SYSTEM USER MANUAL
Figure 115: Create a Trend Chart Based on Frequency Band
Once the editor dialog has been concluded, a new database entry will be created. When the
trend chart is displayed, the alarm levels can be adjusted graphically as with other alarms.
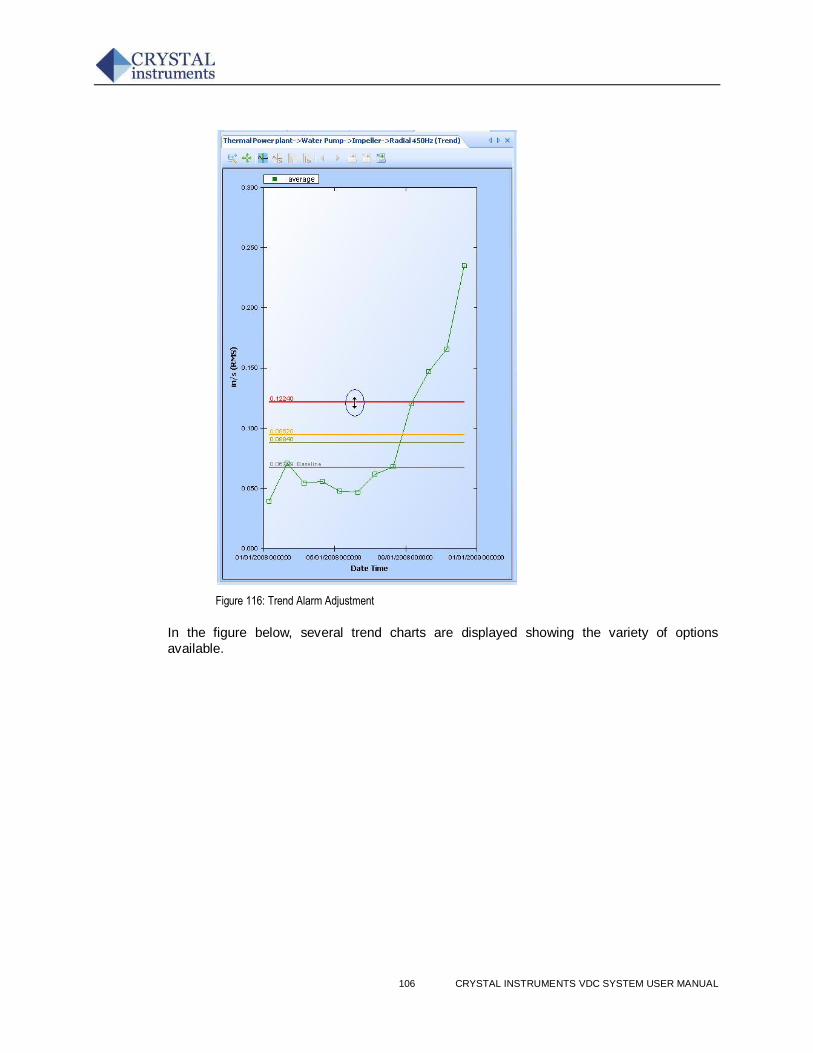
106 CRYSTAL INSTRUMENTS VDC SYSTEM USER MANUAL
Figure 116: Trend Alarm Adjustment
In the figure below, several trend charts are displayed showing the variety of options
available.
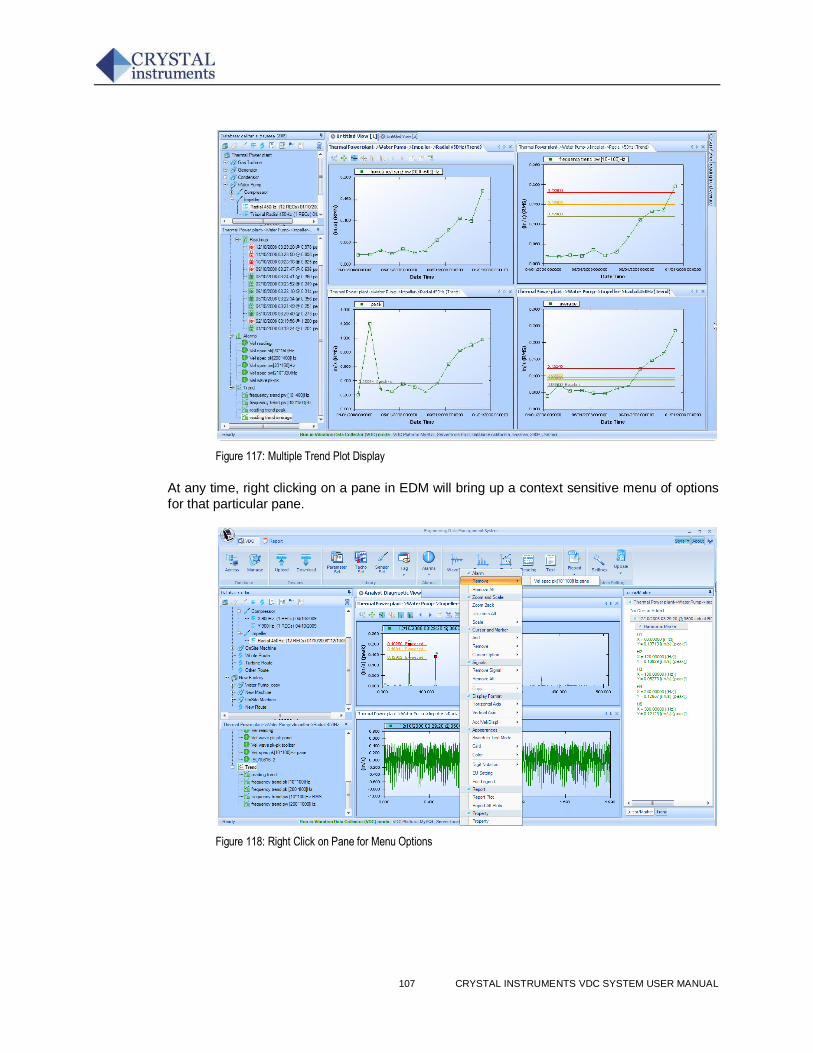
107 CRYSTAL INSTRUMENTS VDC SYSTEM USER MANUAL
Figure 117: Multiple Trend Plot Display
At any time, right clicking on a pane in EDM will bring up a context sensitive menu of options
for that particular pane.
Figure 118: Right Click on Pane for Menu Options
108 CRYSTAL INSTRUMENTS VDC SYSTEM USER MANUAL
CoCo-80 User Interface
CoCo User Interface Front Panel
The CoCo menu-driven user interface is easy to use and requires little training. Hard buttons
on the front panel are used to initiate function-specific menus. The buttons are divided into
three areas. The Navigation buttons include the Power, Shift, Tab, Enter and Arrow buttons.
The Function buttons include the Analysis, Display, Setup, File, Rec/Stop and Save buttons.
The six Soft buttons located directly below the display change function depending on the
current mode selection.
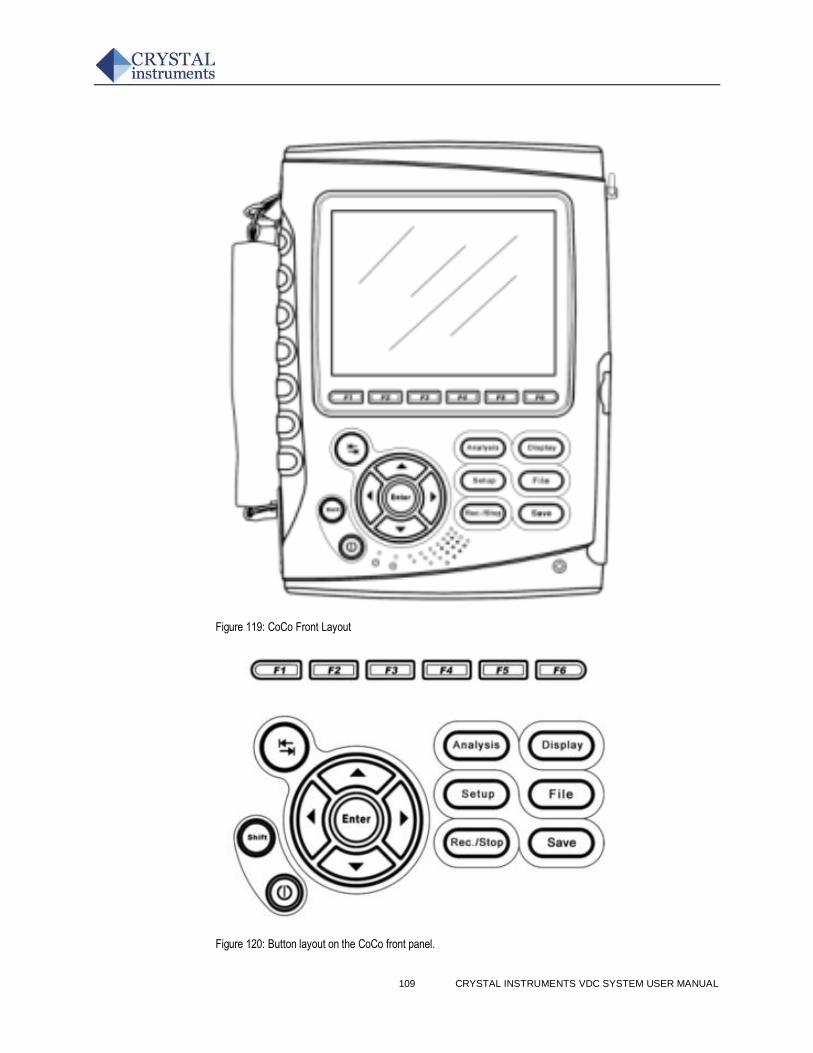
109 CRYSTAL INSTRUMENTS VDC SYSTEM USER MANUAL
Figure 119: CoCo Front Layout
Figure 120: Button layout on the CoCo front panel.
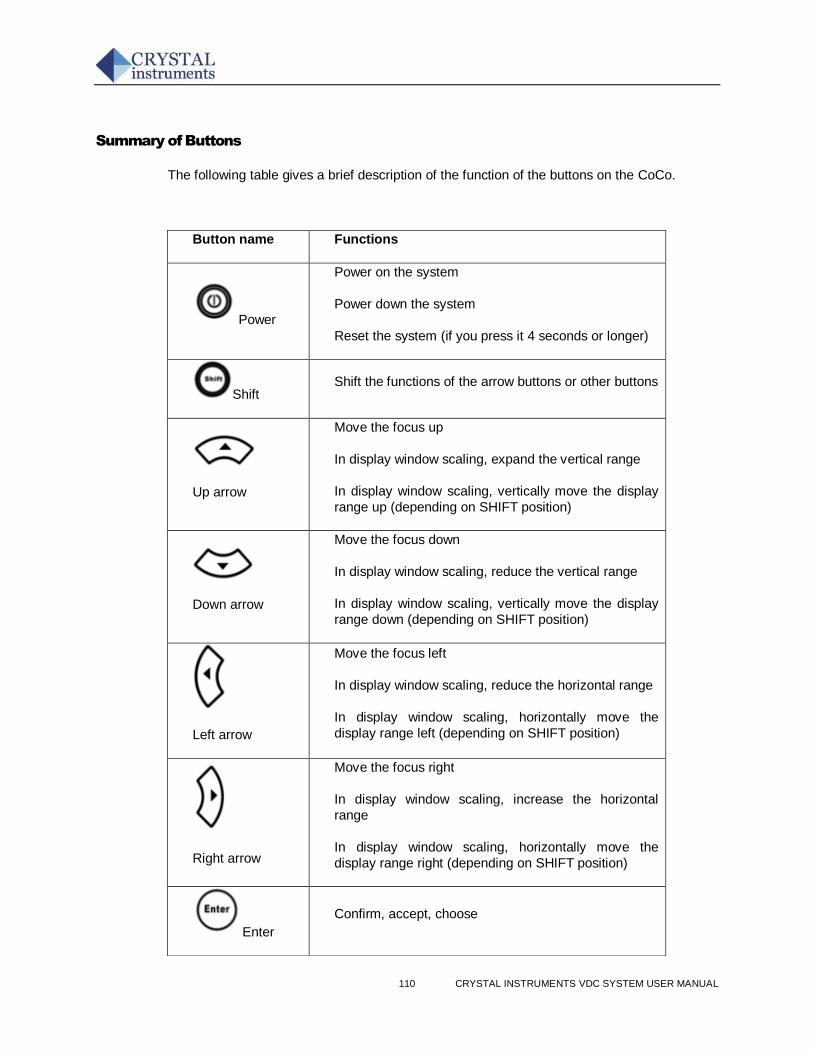
110 CRYSTAL INSTRUMENTS VDC SYSTEM USER MANUAL
Summary of Buttons
The following table gives a brief description of the function of the buttons on the CoCo.
Button name Functions
Power
Power on the system
Power down the system
Reset the system (if you press it 4 seconds or longer)
Shift Shift the functions of the arrow buttons or other buttons
Up arrow
Move the focus up
In display window scaling, expand the vertical range
In display window scaling, vertically move the display
range up (depending on SHIFT position)
Down arrow
Move the focus down
In display window scaling, reduce the vertical range
In display window scaling, vertically move the display
range down (depending on SHIFT position)
Left arrow
Move the focus left
In display window scaling, reduce the horizontal range
In display window scaling, horizontally move the
display range left (depending on SHIFT position)
Right arrow
Move the focus right
In display window scaling, increase the horizontal
range
In display window scaling, horizontally move the
display range right (depending on SHIFT position)
Enter
Confirm, accept, choose
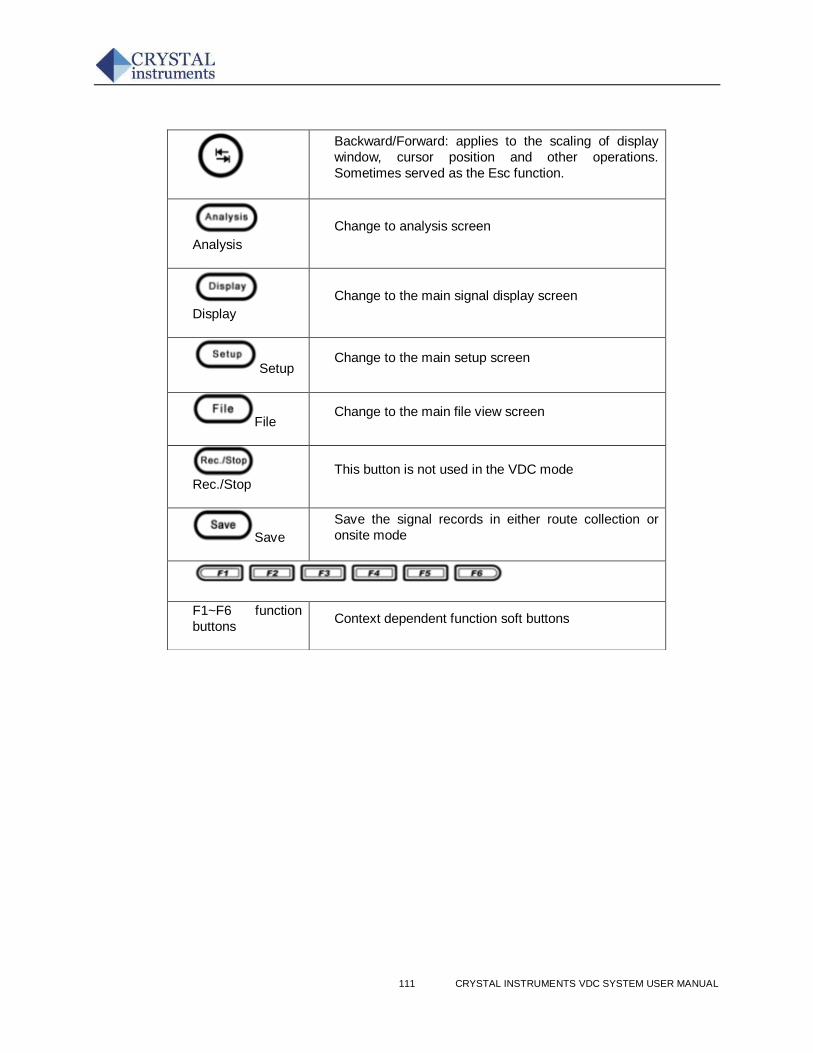
111 CRYSTAL INSTRUMENTS VDC SYSTEM USER MANUAL
Backward/Forward: applies to the scaling of display
window, cursor position and other operations.
Sometimes served as the Esc function.
Analysis
Change to analysis screen
Display
Change to the main signal display screen
Setup Change to the main setup screen
File Change to the main file view screen
Rec./Stop This button is not used in the VDC mode
Save
Save the signal records in either route collection or
onsite mode
F1~F6 function
buttons Context dependent function soft buttons
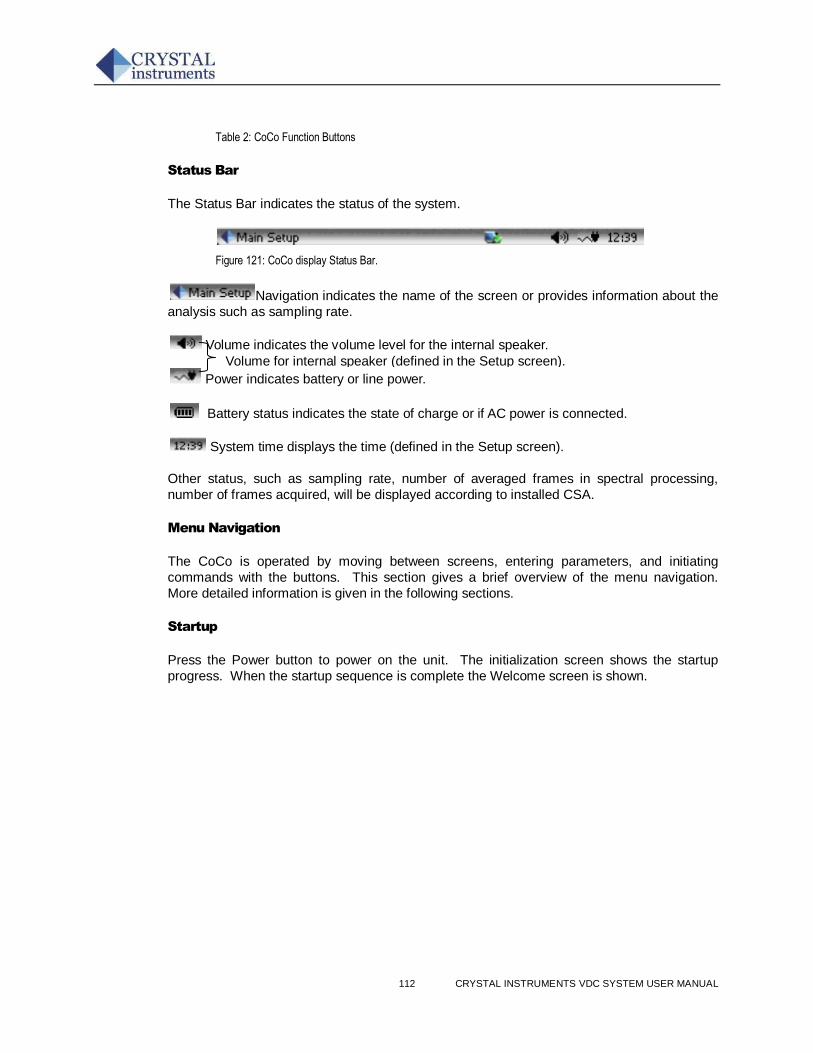
112 CRYSTAL INSTRUMENTS VDC SYSTEM USER MANUAL
Table 2: CoCo Function Buttons
Status Bar
The Status Bar indicates the status of the system.
Figure 121: CoCo display Status Bar.
Navigation indicates the name of the screen or provides information about the
analysis such as sampling rate.
Volume indicates the volume level for the internal speaker.
Power indicates battery or line power.
Battery status indicates the state of charge or if AC power is connected.
System time displays the time (defined in the Setup screen).
Other status, such as sampling rate, number of averaged frames in spectral processing,
number of frames acquired, will be displayed according to installed CSA.
Menu Navigation
The CoCo is operated by moving between screens, entering parameters, and initiating
commands with the buttons. This section gives a brief overview of the menu navigation.
More detailed information is given in the following sections.
Startup
Press the Power button to power on the unit. The initialization screen shows the startup
progress. When the startup sequence is complete the Welcome screen is shown.
Volume for internal speaker (defined in the Setup screen).
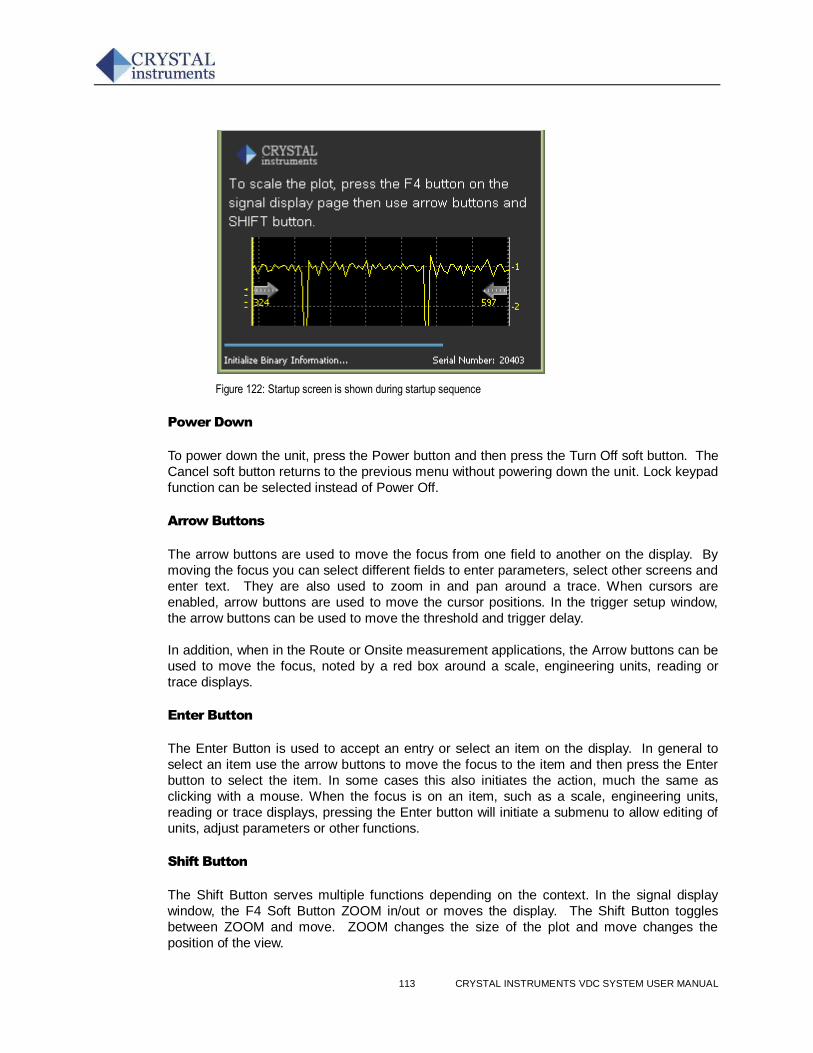
113 CRYSTAL INSTRUMENTS VDC SYSTEM USER MANUAL
Figure 122: Startup screen is shown during startup sequence
Power Down
To power down the unit, press the Power button and then press the Turn Off soft button. The
Cancel soft button returns to the previous menu without powering down the unit. Lock keypad
function can be selected instead of Power Off.
Arrow Buttons
The arrow buttons are used to move the focus from one field to another on the display. By
moving the focus you can select different fields to enter parameters, select other screens and
enter text. They are also used to zoom in and pan around a trace. When cursors are
enabled, arrow buttons are used to move the cursor positions. In the trigger setup window,
the arrow buttons can be used to move the threshold and trigger delay.
In addition, when in the Route or Onsite measurement applications, the Arrow buttons can be
used to move the focus, noted by a red box around a scale, engineering units, reading or
trace displays.
Enter Button
The Enter Button is used to accept an entry or select an item on the display. In general to
select an item use the arrow buttons to move the focus to the item and then press the Enter
button to select the item. In some cases this also initiates the action, much the same as
clicking with a mouse. When the focus is on an item, such as a scale, engineering units,
reading or trace displays, pressing the Enter button will initiate a submenu to allow editing of
units, adjust parameters or other functions.
Shift Button
The Shift Button serves multiple functions depending on the context. In the signal display
window, the F4 Soft Button ZOOM in/out or moves the display. The Shift Button toggles
between ZOOM and move. ZOOM changes the size of the plot and move changes the
position of the view.
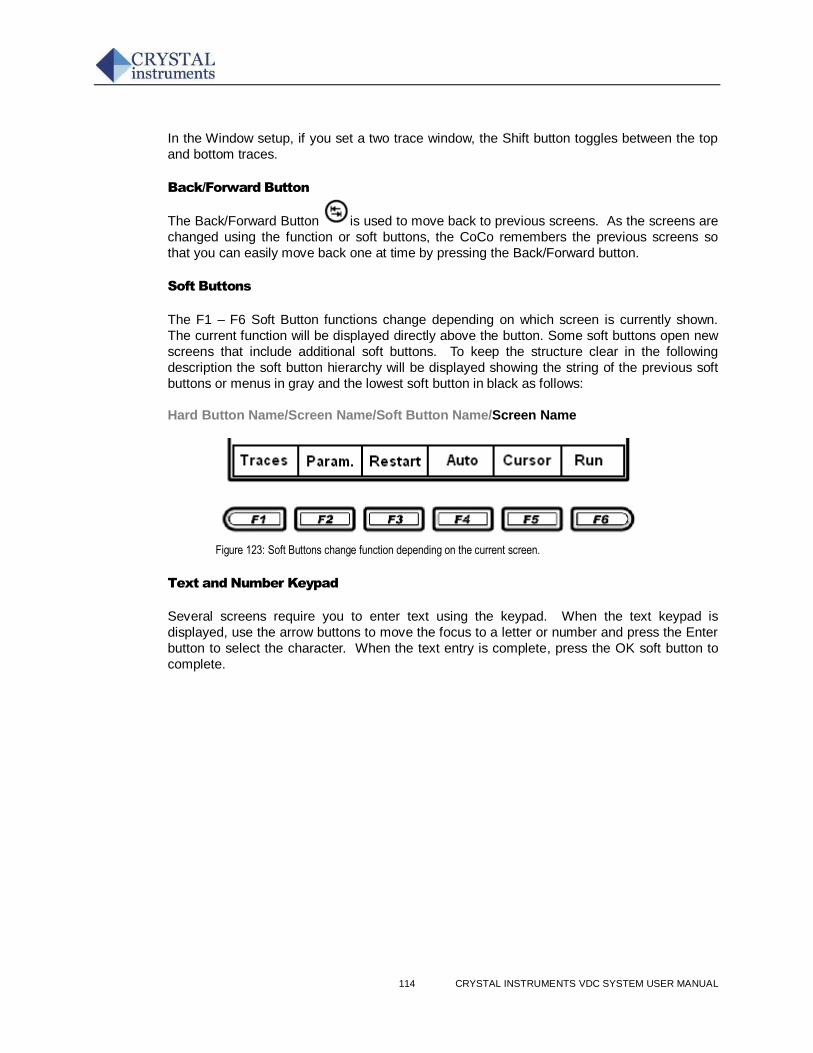
114 CRYSTAL INSTRUMENTS VDC SYSTEM USER MANUAL
In the Window setup, if you set a two trace window, the Shift button toggles between the top
and bottom traces.
Back/Forward Button
The Back/Forward Button is used to move back to previous screens. As the screens are
changed using the function or soft buttons, the CoCo remembers the previous screens so
that you can easily move back one at time by pressing the Back/Forward button.
Soft Buttons
The F1 – F6 Soft Button functions change depending on which screen is currently shown.
The current function will be displayed directly above the button. Some soft buttons open new
screens that include additional soft buttons. To keep the structure clear in the following
description the soft button hierarchy will be displayed showing the string of the previous soft
buttons or menus in gray and the lowest soft button in black as follows:
Hard Button Name/Screen Name/Soft Button Name/Screen Name
Figure 123: Soft Buttons change function depending on the current screen.
Text and Number Keypad
Several screens require you to enter text using the keypad. When the text keypad is
displayed, use the arrow buttons to move the focus to a letter or number and press the Enter
button to select the character. When the text entry is complete, press the OK soft button to
complete.
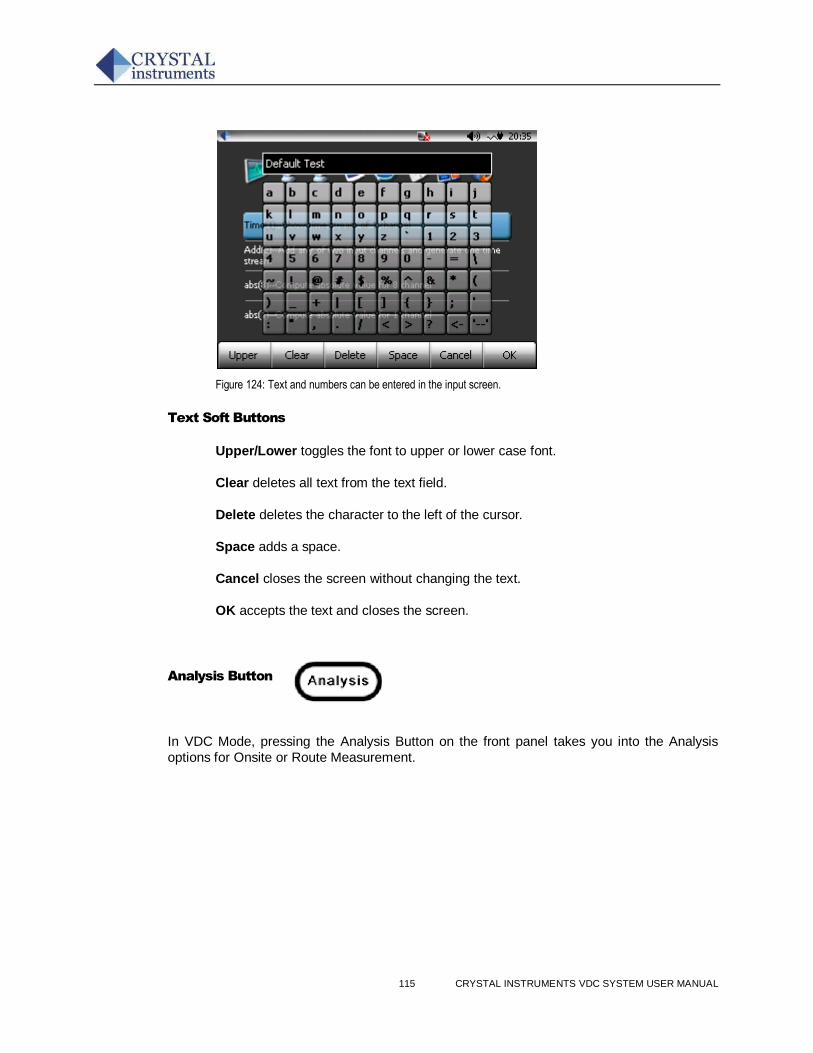
115 CRYSTAL INSTRUMENTS VDC SYSTEM USER MANUAL
Figure 124: Text and numbers can be entered in the input screen.
Text Soft Buttons
Upper/Lower toggles the font to upper or lower case font.
Clear deletes all text from the text field.
Delete deletes the character to the left of the cursor.
Space adds a space.
Cancel closes the screen without changing the text.
OK accepts the text and closes the screen.
Analysis Button
In VDC Mode, pressing the Analysis Button on the front panel takes you into the Analysis
options for Onsite or Route Measurement.
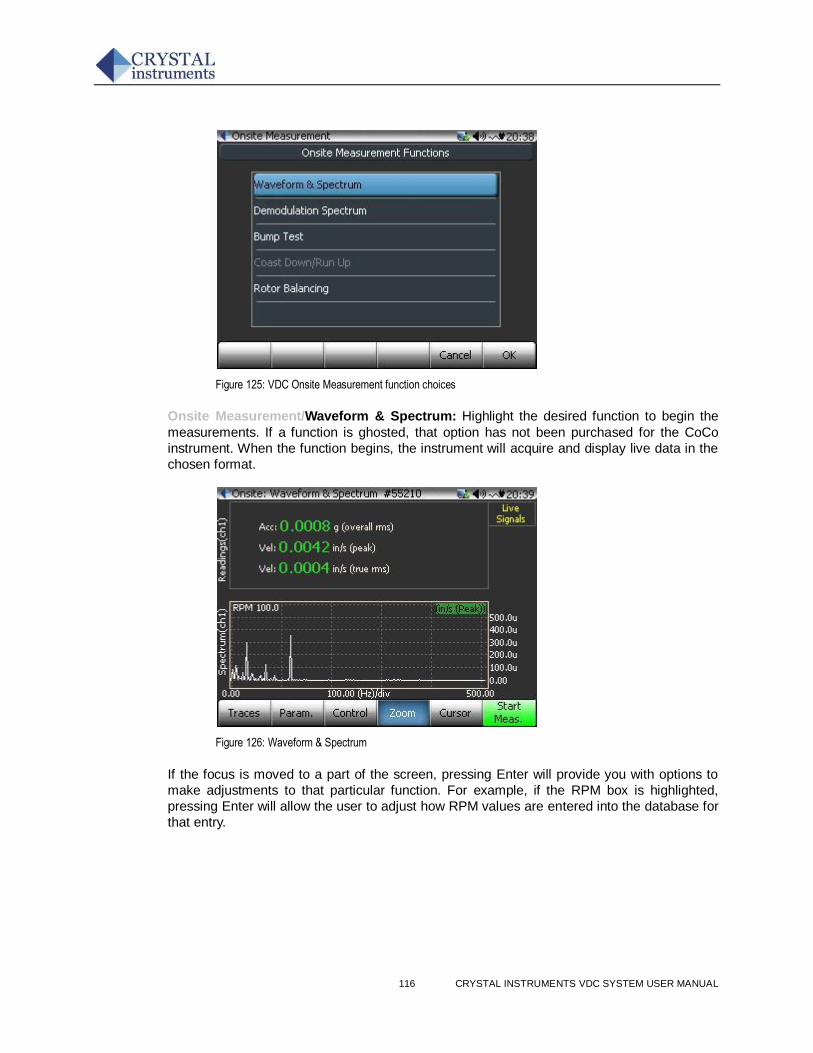
116 CRYSTAL INSTRUMENTS VDC SYSTEM USER MANUAL
Figure 125: VDC Onsite Measurement function choices
Onsite Measurement/Waveform & Spectrum: Highlight the desired function to begin the
measurements. If a function is ghosted, that option has not been purchased for the CoCo
instrument. When the function begins, the instrument will acquire and display live data in the
chosen format.
Figure 126: Waveform & Spectrum
If the focus is moved to a part of the screen, pressing Enter will provide you with options to
make adjustments to that particular function. For example, if the RPM box is highlighted,
pressing Enter will allow the user to adjust how RPM values are entered into the database for
that entry.
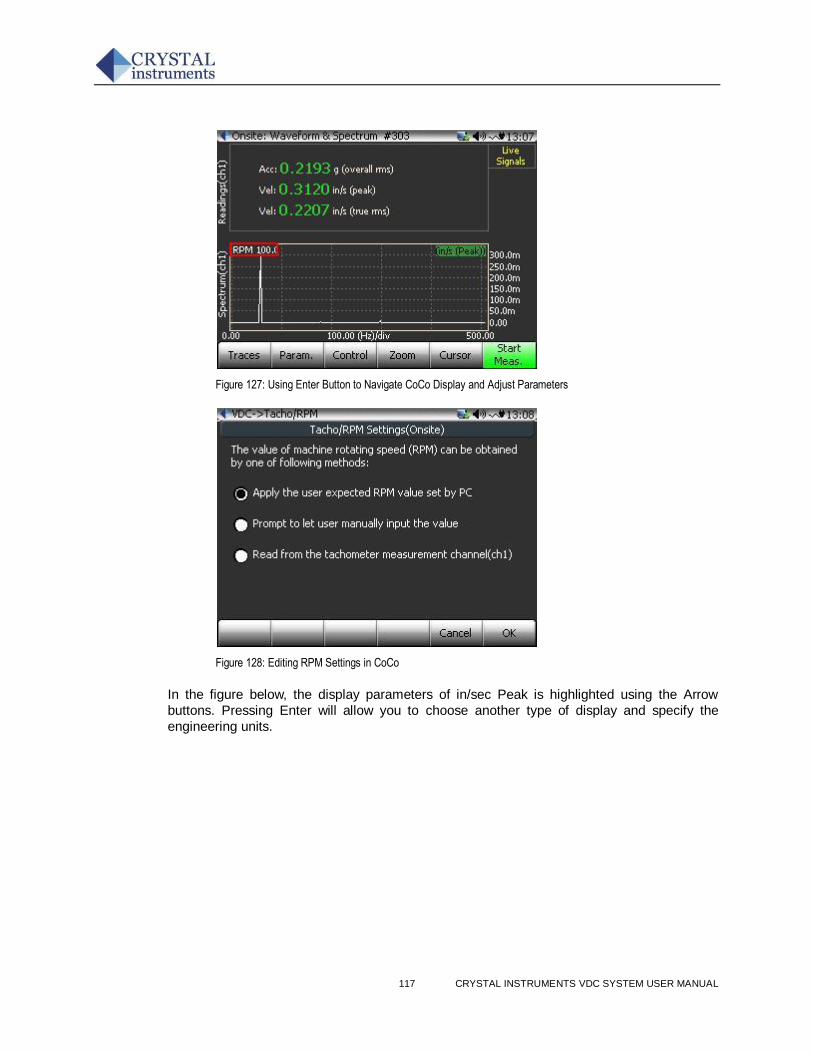
117 CRYSTAL INSTRUMENTS VDC SYSTEM USER MANUAL
Figure 127: Using Enter Button to Navigate CoCo Display and Adjust Parameters
Figure 128: Editing RPM Settings in CoCo
In the figure below, the display parameters of in/sec Peak is highlighted using the Arrow
buttons. Pressing Enter will allow you to choose another type of display and specify the
engineering units.
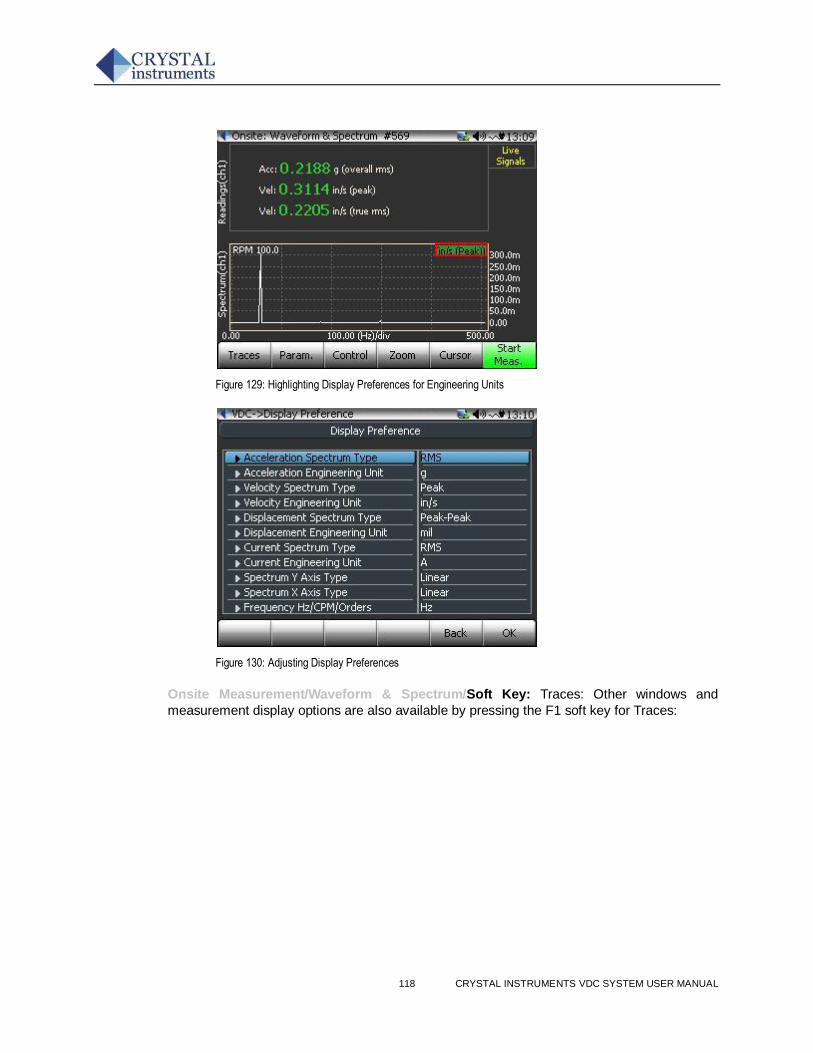
118 CRYSTAL INSTRUMENTS VDC SYSTEM USER MANUAL
Figure 129: Highlighting Display Preferences for Engineering Units
Figure 130: Adjusting Display Preferences
Onsite Measurement/Waveform & Spectrum/Soft Key: Traces: Other windows and
measurement display options are also available by pressing the F1 soft key for Traces:
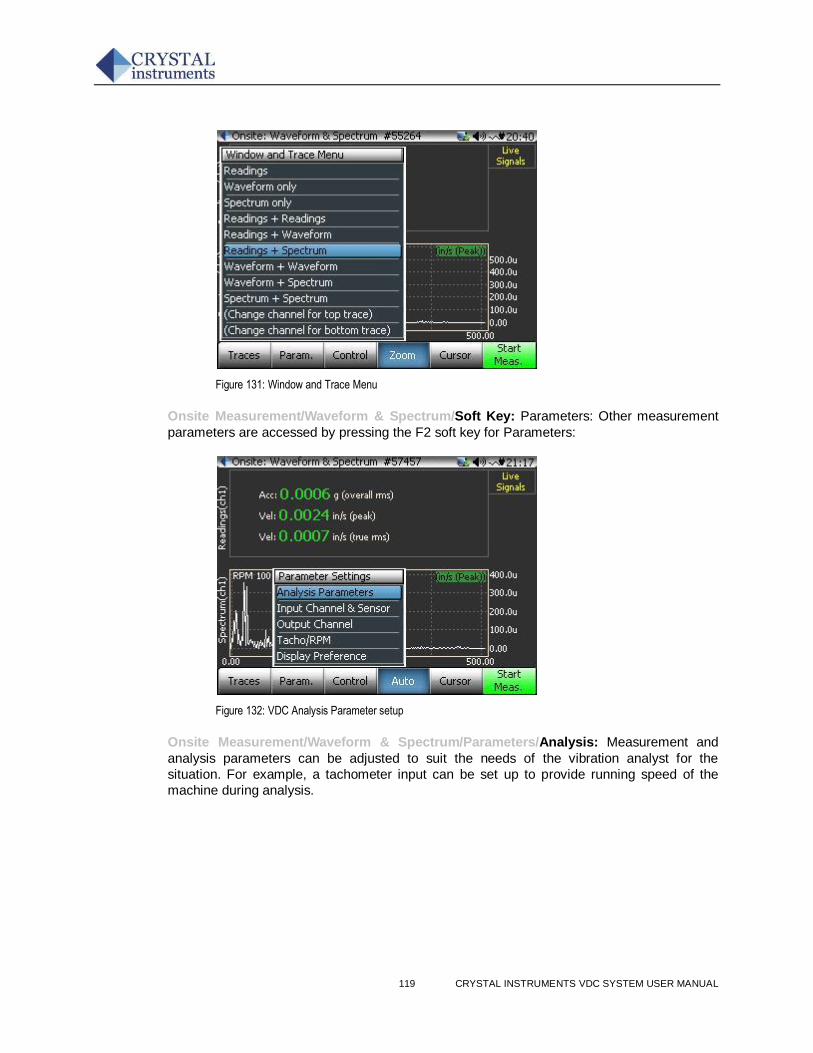
119 CRYSTAL INSTRUMENTS VDC SYSTEM USER MANUAL
Figure 131: Window and Trace Menu
Onsite Measurement/Waveform & Spectrum/Soft Key: Parameters: Other measurement
parameters are accessed by pressing the F2 soft key for Parameters:
Figure 132: VDC Analysis Parameter setup
Onsite Measurement/Waveform & Spectrum/Parameters/Analysis: Measurement and
analysis parameters can be adjusted to suit the needs of the vibration analyst for the
situation. For example, a tachometer input can be set up to provide running speed of the
machine during analysis.
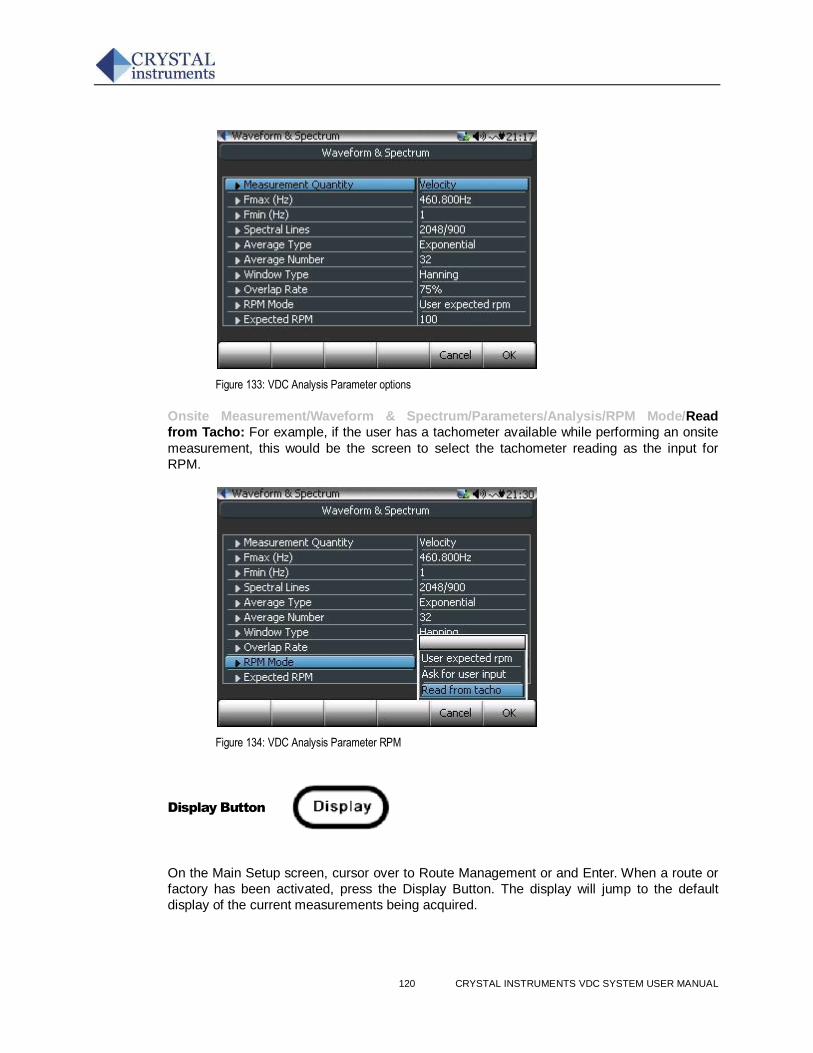
120 CRYSTAL INSTRUMENTS VDC SYSTEM USER MANUAL
Figure 133: VDC Analysis Parameter options
Onsite Measurement/Waveform & Spectrum/Parameters/Analysis/RPM Mode/Read
from Tacho: For example, if the user has a tachometer available while performing an onsite
measurement, this would be the screen to select the tachometer reading as the input for
RPM.
Figure 134: VDC Analysis Parameter RPM
Display Button
On the Main Setup screen, cursor over to Route Management or and Enter. When a route or
factory has been activated, press the Display Button. The display will jump to the default
display of the current measurements being acquired.
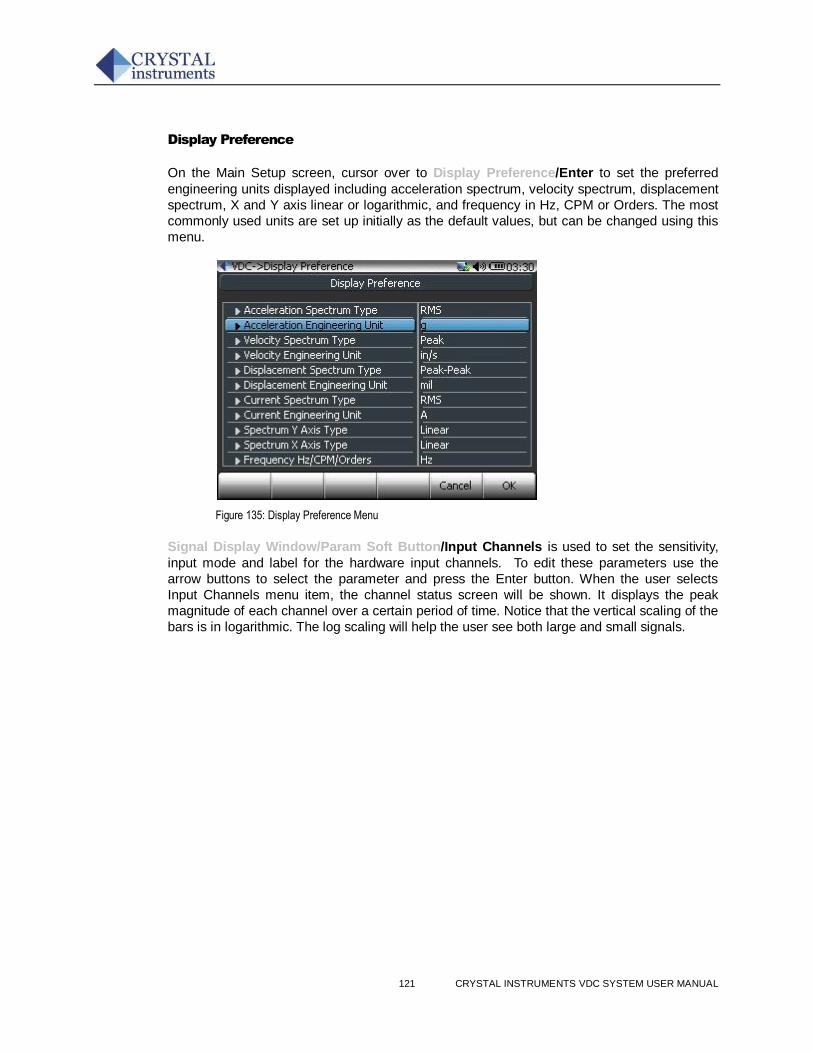
121 CRYSTAL INSTRUMENTS VDC SYSTEM USER MANUAL
Display Preference
On the Main Setup screen, cursor over to Display Preference/Enter to set the preferred
engineering units displayed including acceleration spectrum, velocity spectrum, displacement
spectrum, X and Y axis linear or logarithmic, and frequency in Hz, CPM or Orders. The most
commonly used units are set up initially as the default values, but can be changed using this
menu.
Figure 135: Display Preference Menu
Signal Display Window/Param Soft Button/Input Channels is used to set the sensitivity,
input mode and label for the hardware input channels. To edit these parameters use the
arrow buttons to select the parameter and press the Enter button. When the user selects
Input Channels menu item, the channel status screen will be shown. It displays the peak
magnitude of each channel over a certain period of time. Notice that the vertical scaling of the
bars is in logarithmic. The log scaling will help the user see both large and small signals.
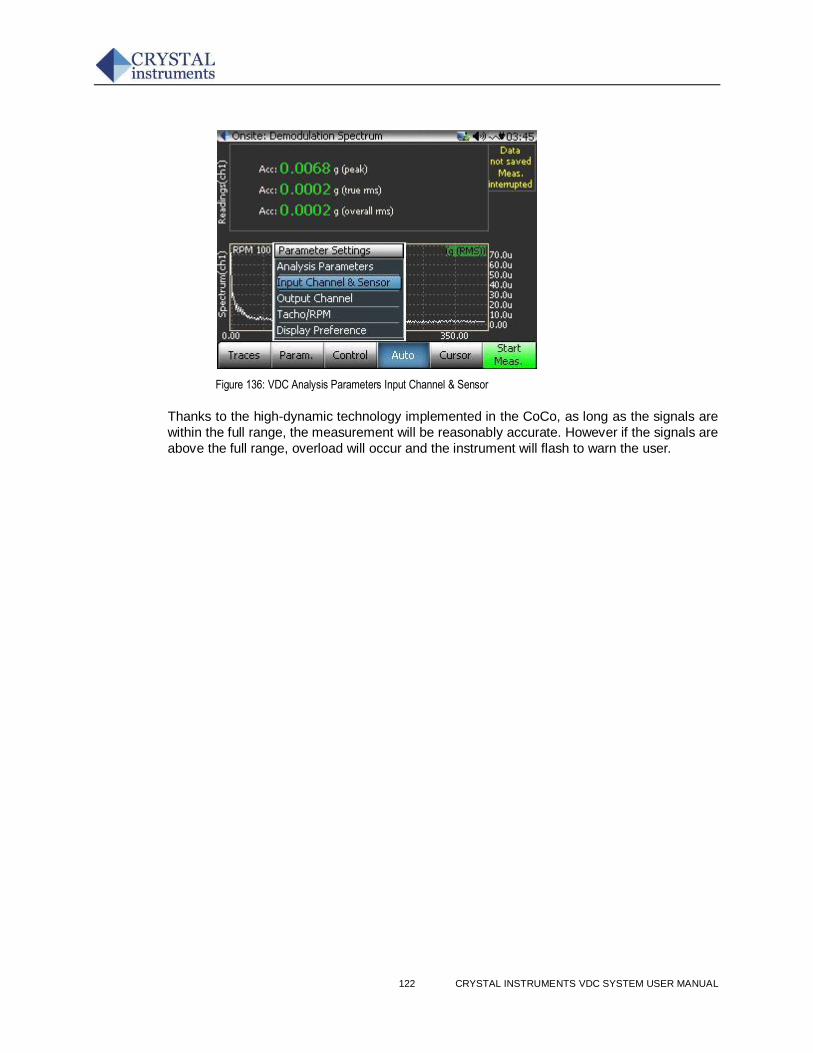
122 CRYSTAL INSTRUMENTS VDC SYSTEM USER MANUAL
Figure 136: VDC Analysis Parameters Input Channel & Sensor
Thanks to the high-dynamic technology implemented in the CoCo, as long as the signals are
within the full range, the measurement will be reasonably accurate. However if the signals are
above the full range, overload will occur and the instrument will flash to warn the user.
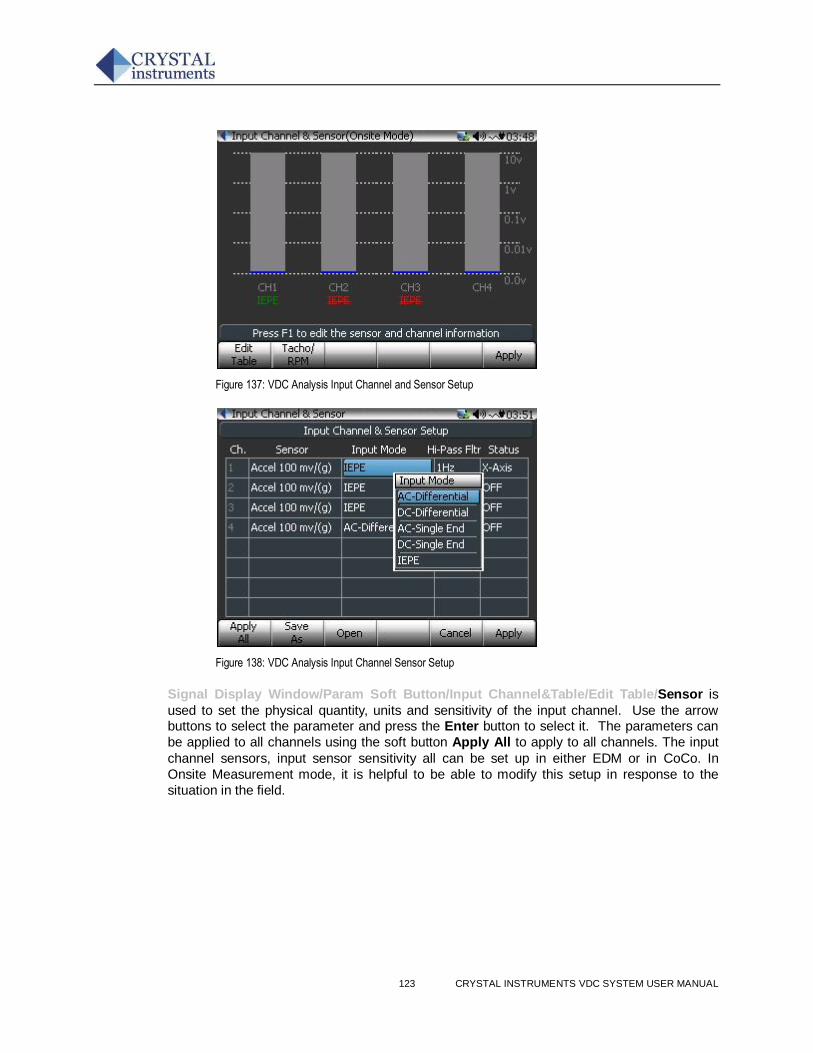
123 CRYSTAL INSTRUMENTS VDC SYSTEM USER MANUAL
Figure 137: VDC Analysis Input Channel and Sensor Setup
Figure 138: VDC Analysis Input Channel Sensor Setup
Signal Display Window/Param Soft Button/Input Channel&Table/Edit Table/Sensor is
used to set the physical quantity, units and sensitivity of the input channel. Use the arrow buttons to select the parameter and press the Enter button to select it. The parameters can
be applied to all channels using the soft button Apply All to apply to all channels. The input
channel sensors, input sensor sensitivity all can be set up in either EDM or in CoCo. In
Onsite Measurement mode, it is helpful to be able to modify this setup in response to the
situation in the field.
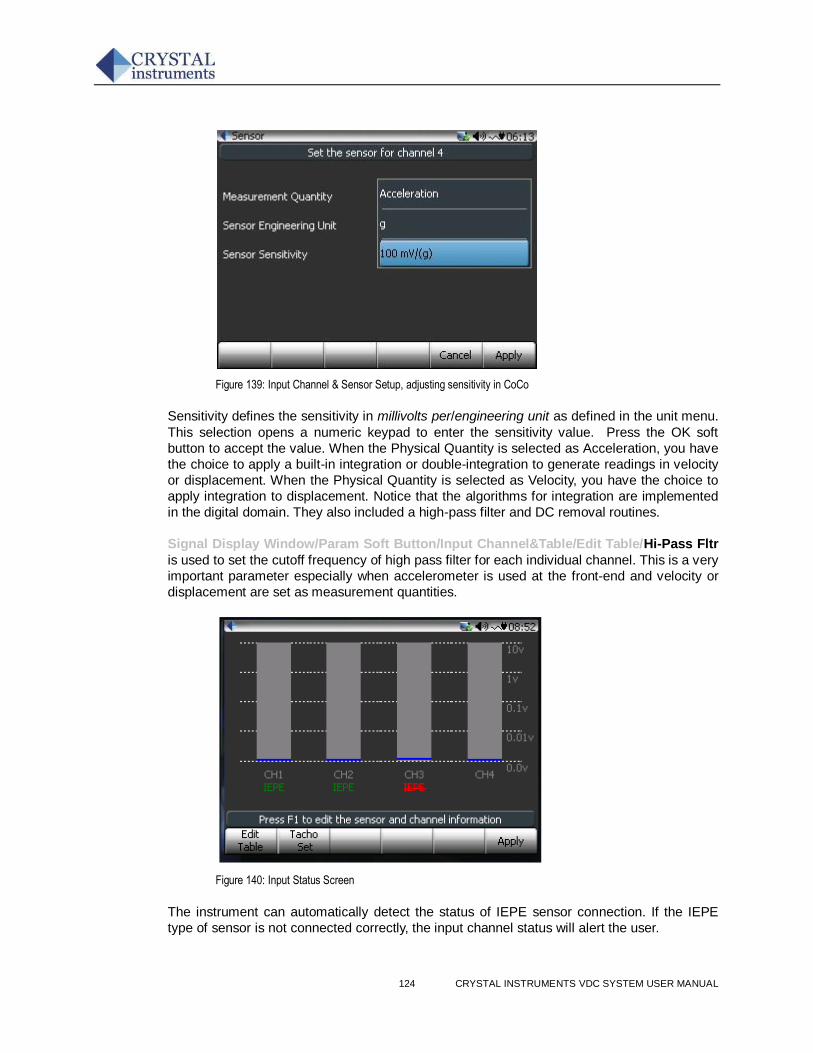
124 CRYSTAL INSTRUMENTS VDC SYSTEM USER MANUAL
Figure 139: Input Channel & Sensor Setup, adjusting sensitivity in CoCo
Sensitivity defines the sensitivity in millivolts per/engineering unit as defined in the unit menu.
This selection opens a numeric keypad to enter the sensitivity value. Press the OK soft
button to accept the value. When the Physical Quantity is selected as Acceleration, you have
the choice to apply a built-in integration or double-integration to generate readings in velocity
or displacement. When the Physical Quantity is selected as Velocity, you have the choice to
apply integration to displacement. Notice that the algorithms for integration are implemented
in the digital domain. They also included a high-pass filter and DC removal routines.
Signal Display Window/Param Soft Button/Input Channel&Table/Edit Table/Hi-Pass Fltr
is used to set the cutoff frequency of high pass filter for each individual channel. This is a very
important parameter especially when accelerometer is used at the front-end and velocity or
displacement are set as measurement quantities.
Figure 140: Input Status Screen
The instrument can automatically detect the status of IEPE sensor connection. If the IEPE
type of sensor is not connected correctly, the input channel status will alert the user.
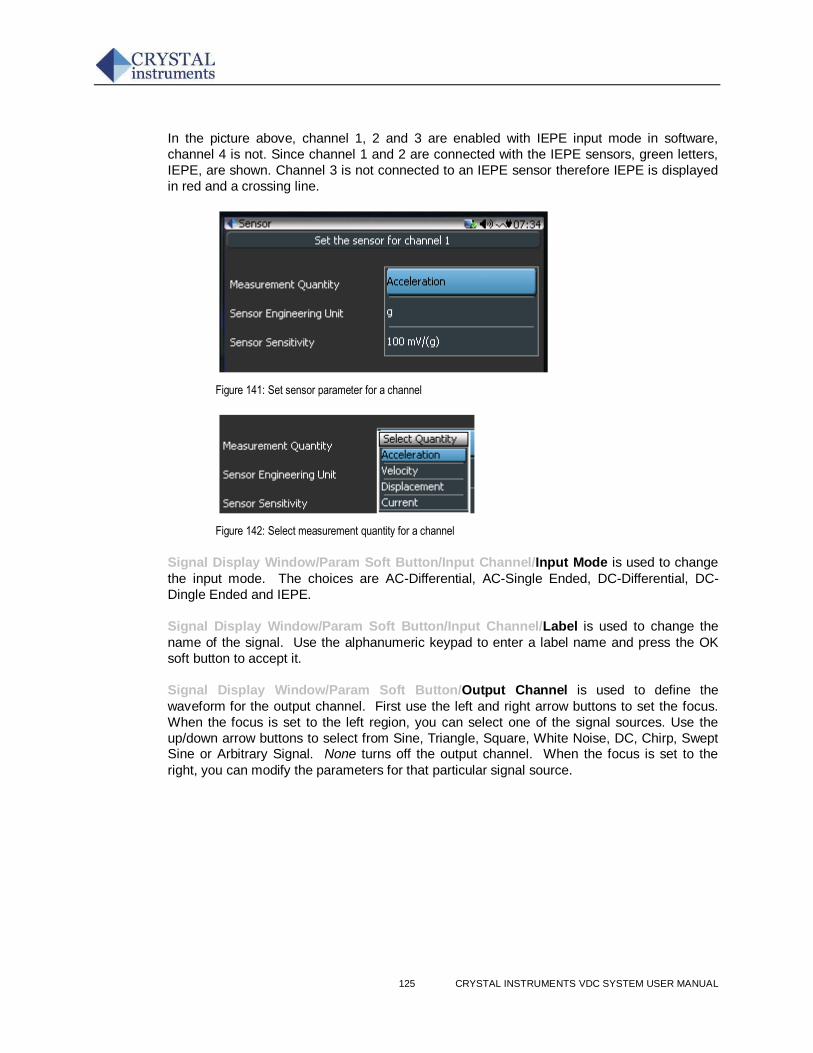
125 CRYSTAL INSTRUMENTS VDC SYSTEM USER MANUAL
In the picture above, channel 1, 2 and 3 are enabled with IEPE input mode in software,
channel 4 is not. Since channel 1 and 2 are connected with the IEPE sensors, green letters,
IEPE, are shown. Channel 3 is not connected to an IEPE sensor therefore IEPE is displayed
in red and a crossing line.
Figure 141: Set sensor parameter for a channel
Figure 142: Select measurement quantity for a channel
Signal Display Window/Param Soft Button/Input Channel/Input Mode is used to change
the input mode. The choices are AC-Differential, AC-Single Ended, DC-Differential, DC-
Dingle Ended and IEPE.
Signal Display Window/Param Soft Button/Input Channel/Label is used to change the
name of the signal. Use the alphanumeric keypad to enter a label name and press the OK
soft button to accept it.
Signal Display Window/Param Soft Button/Output Channel is used to define the
waveform for the output channel. First use the left and right arrow buttons to set the focus.
When the focus is set to the left region, you can select one of the signal sources. Use the
up/down arrow buttons to select from Sine, Triangle, Square, White Noise, DC, Chirp, Swept Sine or Arbitrary Signal. None turns off the output channel. When the focus is set to the
right, you can modify the parameters for that particular signal source.
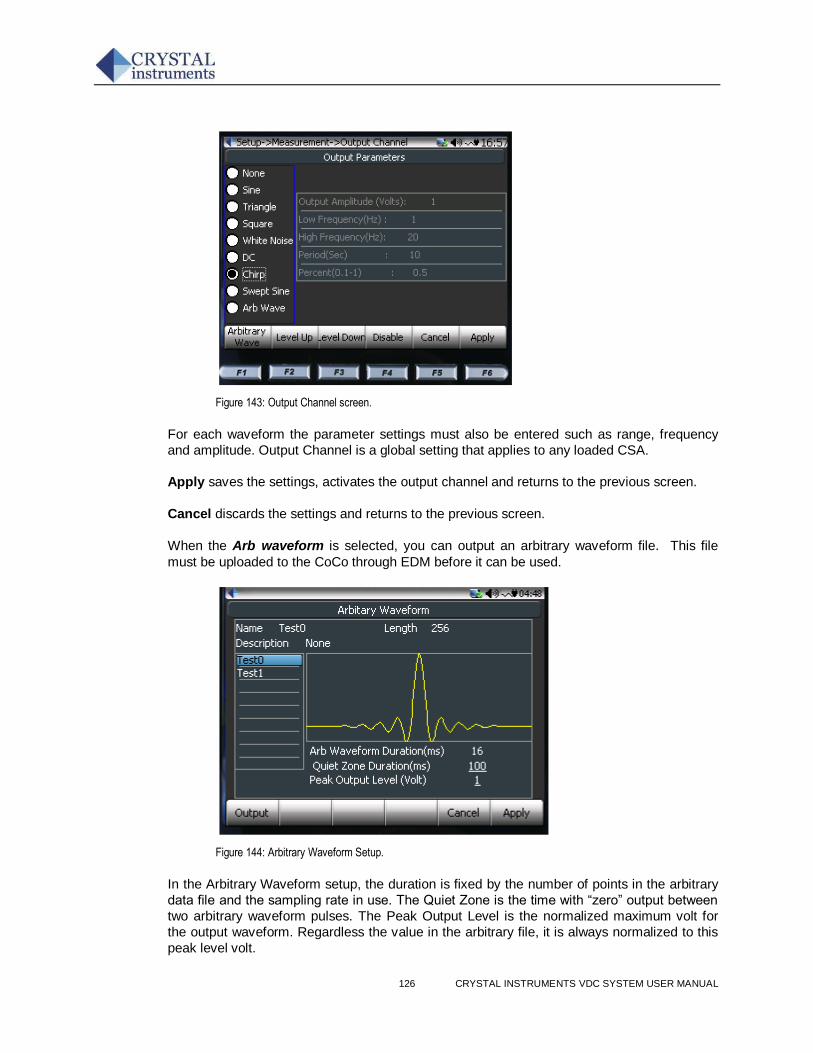
126 CRYSTAL INSTRUMENTS VDC SYSTEM USER MANUAL
Figure 143: Output Channel screen.
For each waveform the parameter settings must also be entered such as range, frequency
and amplitude. Output Channel is a global setting that applies to any loaded CSA.
Apply saves the settings, activates the output channel and returns to the previous screen.
Cancel discards the settings and returns to the previous screen.
When the Arb waveform is selected, you can output an arbitrary waveform file. This file
must be uploaded to the CoCo through EDM before it can be used.
Figure 144: Arbitrary Waveform Setup.
In the Arbitrary Waveform setup, the duration is fixed by the number of points in the arbitrary
data file and the sampling rate in use. The Quiet Zone is the time with “zero” output between
two arbitrary waveform pulses. The Peak Output Level is the normalized maximum volt for
the output waveform. Regardless the value in the arbitrary file, it is always normalized to this
peak level volt.
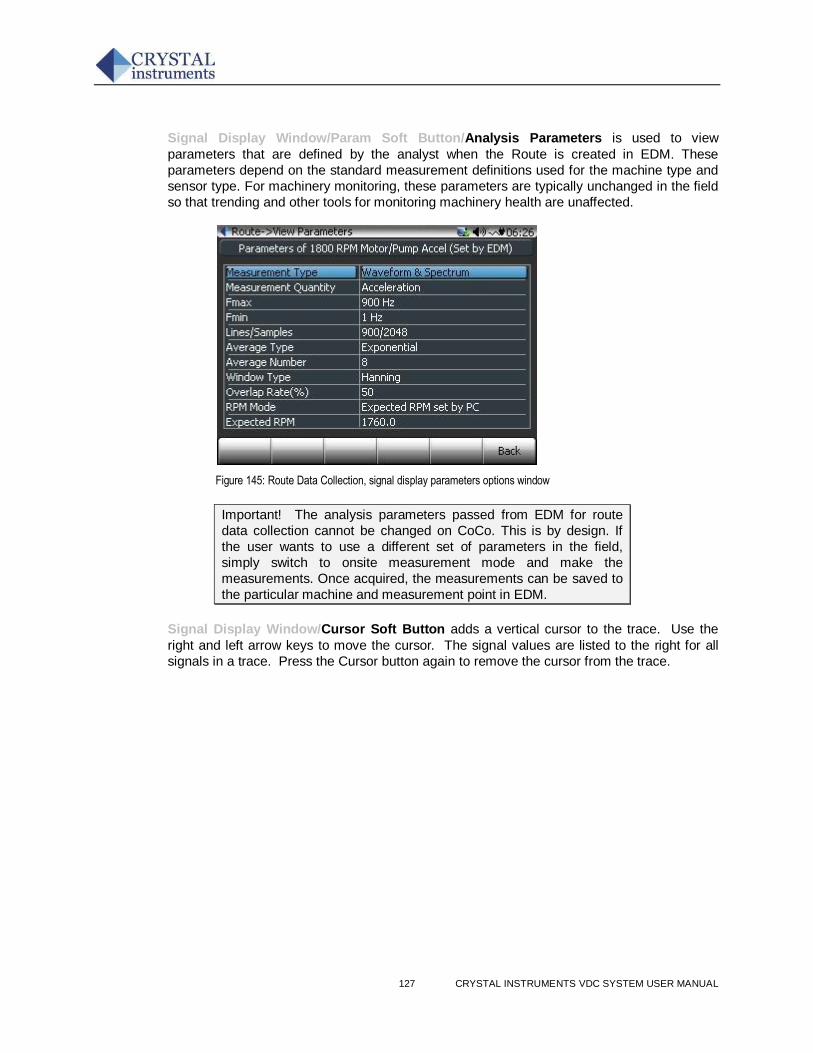
127 CRYSTAL INSTRUMENTS VDC SYSTEM USER MANUAL
Signal Display Window/Param Soft Button/Analysis Parameters is used to view
parameters that are defined by the analyst when the Route is created in EDM. These
parameters depend on the standard measurement definitions used for the machine type and
sensor type. For machinery monitoring, these parameters are typically unchanged in the field
so that trending and other tools for monitoring machinery health are unaffected.
Figure 145: Route Data Collection, signal display parameters options window
Important! The analysis parameters passed from EDM for route
data collection cannot be changed on CoCo. This is by design. If
the user wants to use a different set of parameters in the field,
simply switch to onsite measurement mode and make the
measurements. Once acquired, the measurements can be saved to
the particular machine and measurement point in EDM.
Signal Display Window/Cursor Soft Button adds a vertical cursor to the trace. Use the
right and left arrow keys to move the cursor. The signal values are listed to the right for all
signals in a trace. Press the Cursor button again to remove the cursor from the trace.
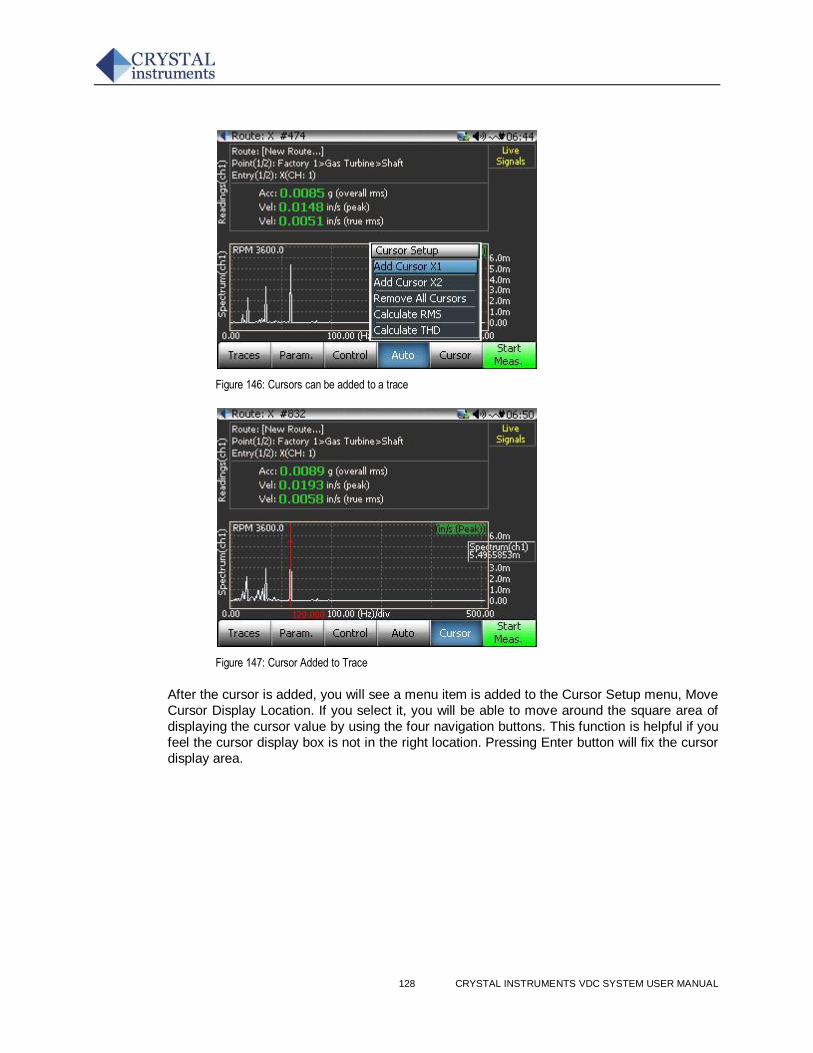
128 CRYSTAL INSTRUMENTS VDC SYSTEM USER MANUAL
Figure 146: Cursors can be added to a trace
Figure 147: Cursor Added to Trace
After the cursor is added, you will see a menu item is added to the Cursor Setup menu, Move
Cursor Display Location. If you select it, you will be able to move around the square area of
displaying the cursor value by using the four navigation buttons. This function is helpful if you
feel the cursor display box is not in the right location. Pressing Enter button will fix the cursor
display area.
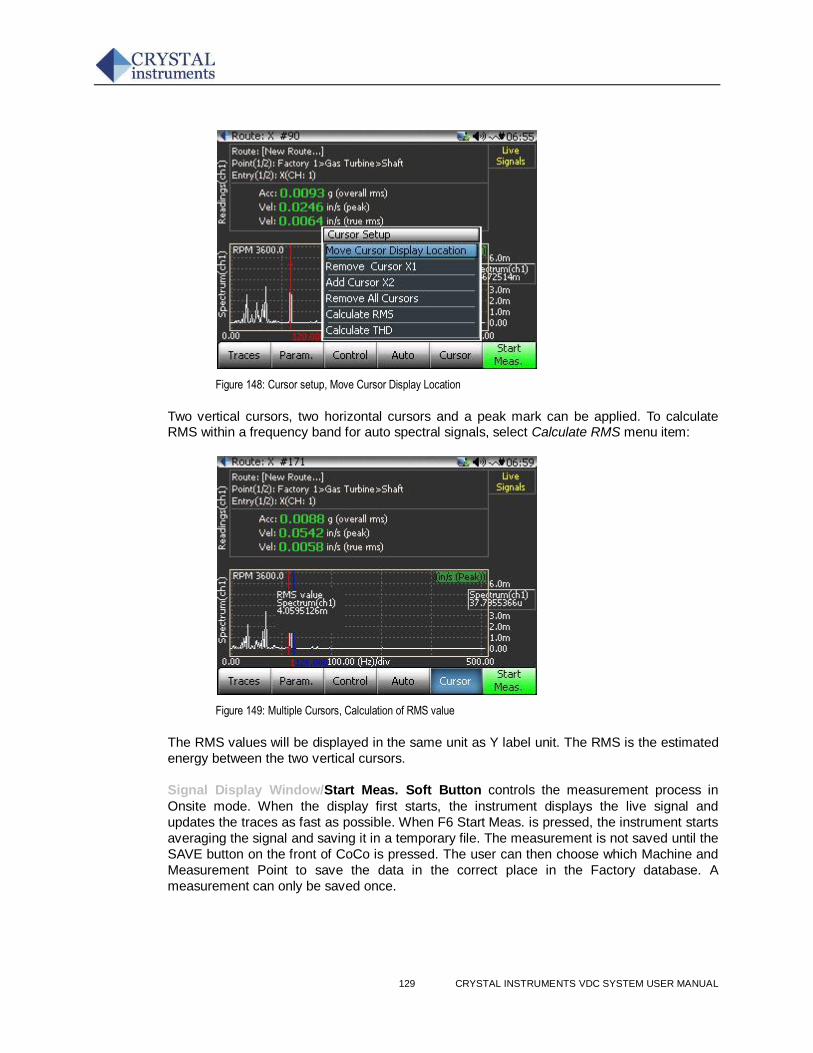
129 CRYSTAL INSTRUMENTS VDC SYSTEM USER MANUAL
Figure 148: Cursor setup, Move Cursor Display Location
Two vertical cursors, two horizontal cursors and a peak mark can be applied. To calculate RMS within a frequency band for auto spectral signals, select Calculate RMS menu item:
Figure 149: Multiple Cursors, Calculation of RMS value
The RMS values will be displayed in the same unit as Y label unit. The RMS is the estimated
energy between the two vertical cursors.
Signal Display Window/Start Meas. Soft Button controls the measurement process in
Onsite mode. When the display first starts, the instrument displays the live signal and
updates the traces as fast as possible. When F6 Start Meas. is pressed, the instrument starts
averaging the signal and saving it in a temporary file. The measurement is not saved until the
SAVE button on the front of CoCo is pressed. The user can then choose which Machine and
Measurement Point to save the data in the correct place in the Factory database. A
measurement can only be saved once.
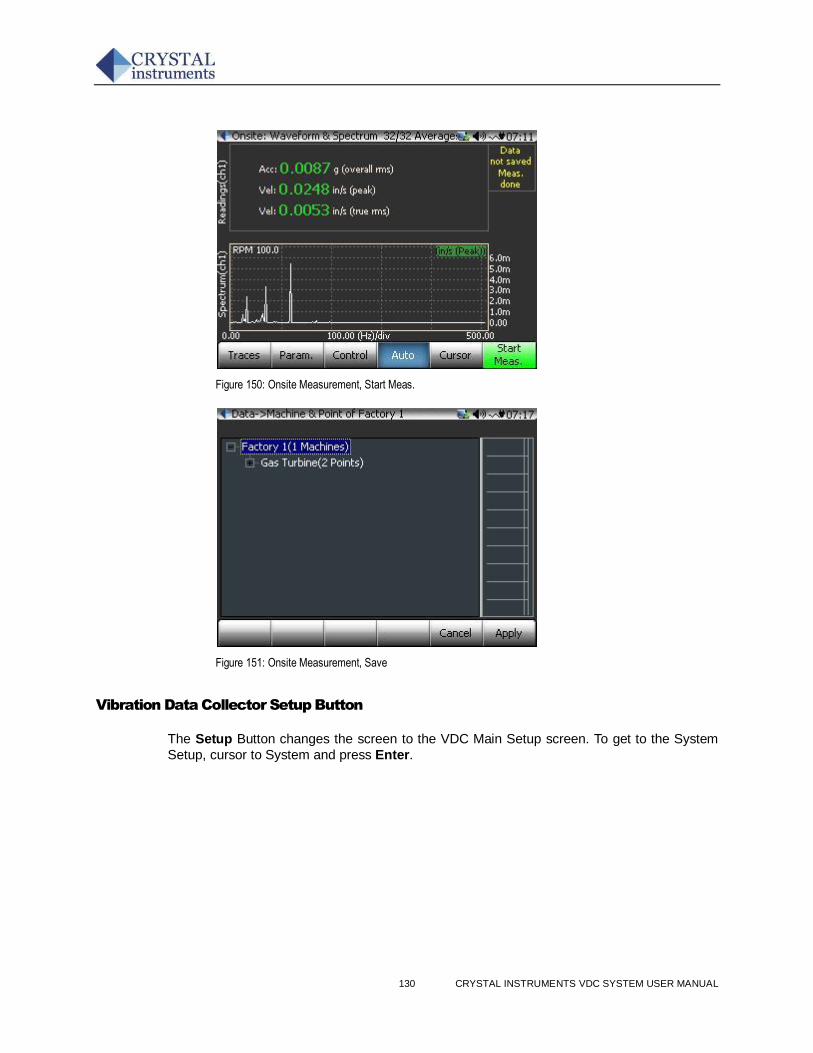
130 CRYSTAL INSTRUMENTS VDC SYSTEM USER MANUAL
Figure 150: Onsite Measurement, Start Meas.
Figure 151: Onsite Measurement, Save
Vibration Data Collector Setup Button
The Setup Button changes the screen to the VDC Main Setup screen. To get to the System
Setup, cursor to System and press Enter.
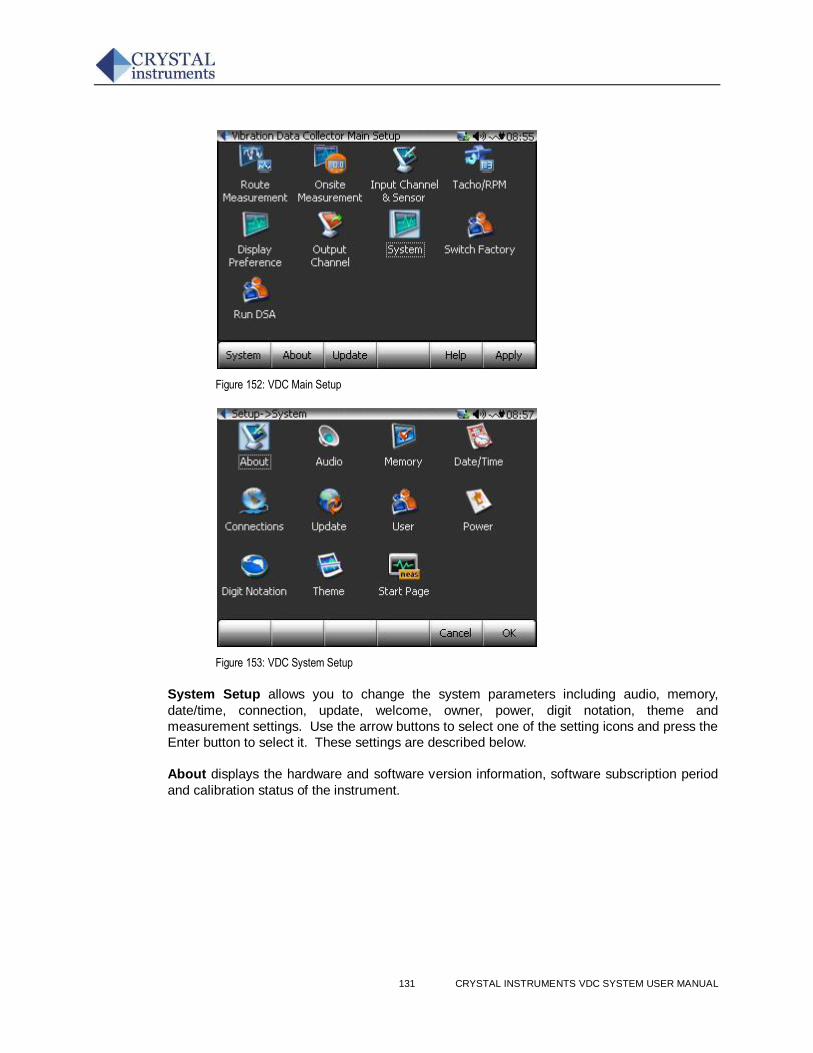
131 CRYSTAL INSTRUMENTS VDC SYSTEM USER MANUAL
Figure 152: VDC Main Setup
Figure 153: VDC System Setup
System Setup allows you to change the system parameters including audio, memory,
date/time, connection, update, welcome, owner, power, digit notation, theme and
measurement settings. Use the arrow buttons to select one of the setting icons and press the
Enter button to select it. These settings are described below.
About displays the hardware and software version information, software subscription period
and calibration status of the instrument.
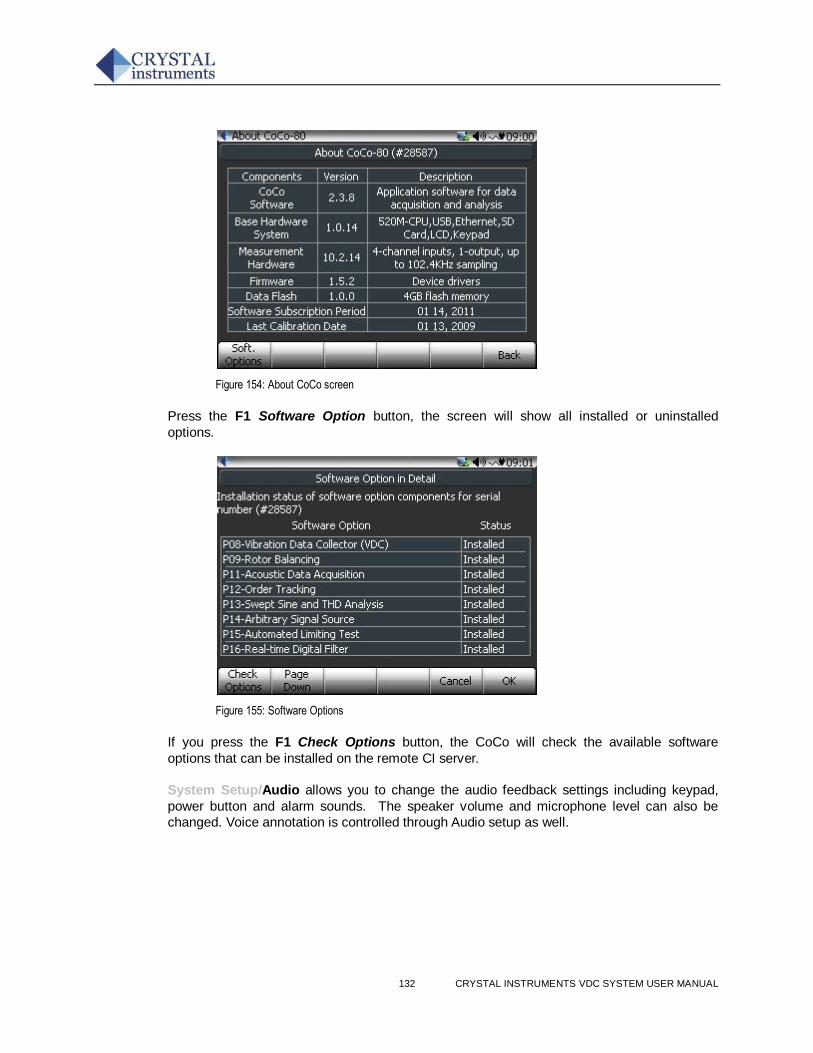
132 CRYSTAL INSTRUMENTS VDC SYSTEM USER MANUAL
Figure 154: About CoCo screen
Press the F1 Software Option button, the screen will show all installed or uninstalled
options.
Figure 155: Software Options
If you press the F1 Check Options button, the CoCo will check the available software
options that can be installed on the remote CI server.
System Setup/Audio allows you to change the audio feedback settings including keypad,
power button and alarm sounds. The speaker volume and microphone level can also be
changed. Voice annotation is controlled through Audio setup as well.
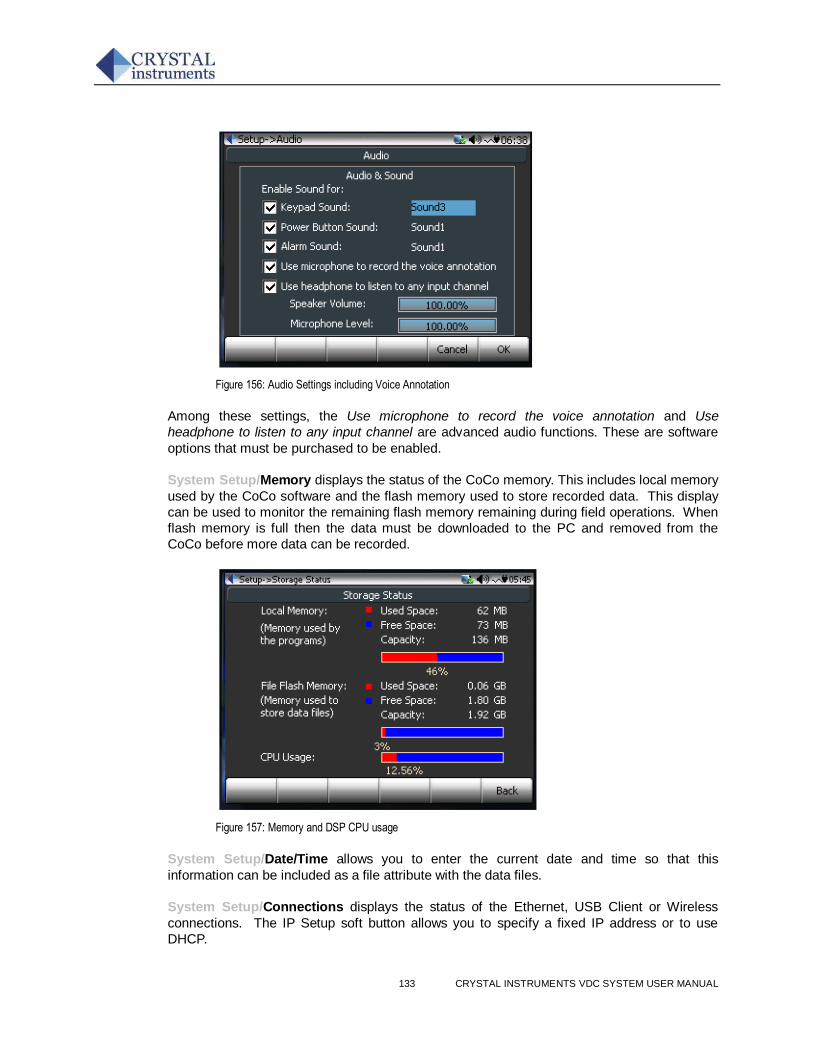
133 CRYSTAL INSTRUMENTS VDC SYSTEM USER MANUAL
Figure 156: Audio Settings including Voice Annotation
Among these settings, the Use microphone to record the voice annotation and Use
headphone to listen to any input channel are advanced audio functions. These are software
options that must be purchased to be enabled.
System Setup/Memory displays the status of the CoCo memory. This includes local memory
used by the CoCo software and the flash memory used to store recorded data. This display
can be used to monitor the remaining flash memory remaining during field operations. When
flash memory is full then the data must be downloaded to the PC and removed from the
CoCo before more data can be recorded.
Figure 157: Memory and DSP CPU usage
System Setup/Date/Time allows you to enter the current date and time so that this
information can be included as a file attribute with the data files.
System Setup/Connections displays the status of the Ethernet, USB Client or Wireless
connections. The IP Setup soft button allows you to specify a fixed IP address or to use
DHCP.
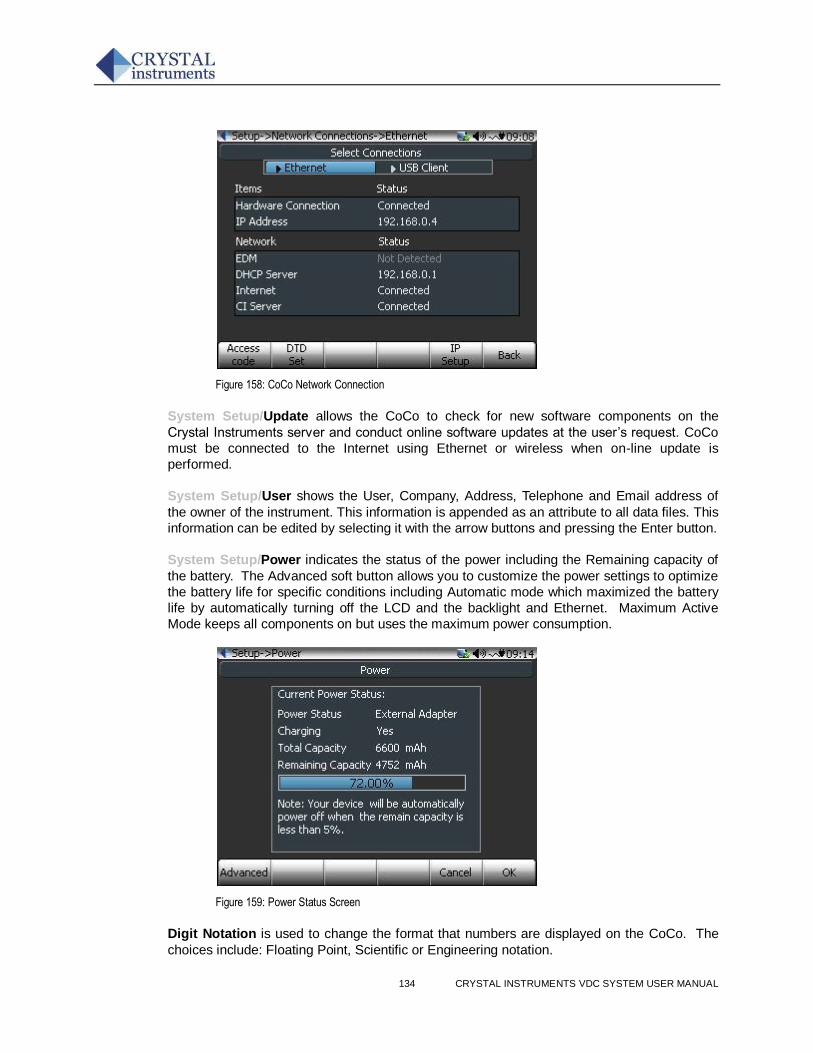
134 CRYSTAL INSTRUMENTS VDC SYSTEM USER MANUAL
Figure 158: CoCo Network Connection
System Setup/Update allows the CoCo to check for new software components on the
Crystal Instruments server and conduct online software updates at the user’s request. CoCo
must be connected to the Internet using Ethernet or wireless when on-line update is
performed.
System Setup/User shows the User, Company, Address, Telephone and Email address of
the owner of the instrument. This information is appended as an attribute to all data files. This
information can be edited by selecting it with the arrow buttons and pressing the Enter button.
System Setup/Power indicates the status of the power including the Remaining capacity of
the battery. The Advanced soft button allows you to customize the power settings to optimize
the battery life for specific conditions including Automatic mode which maximized the battery
life by automatically turning off the LCD and the backlight and Ethernet. Maximum Active
Mode keeps all components on but uses the maximum power consumption.
Figure 159: Power Status Screen
Digit Notation is used to change the format that numbers are displayed on the CoCo. The
choices include: Floating Point, Scientific or Engineering notation.
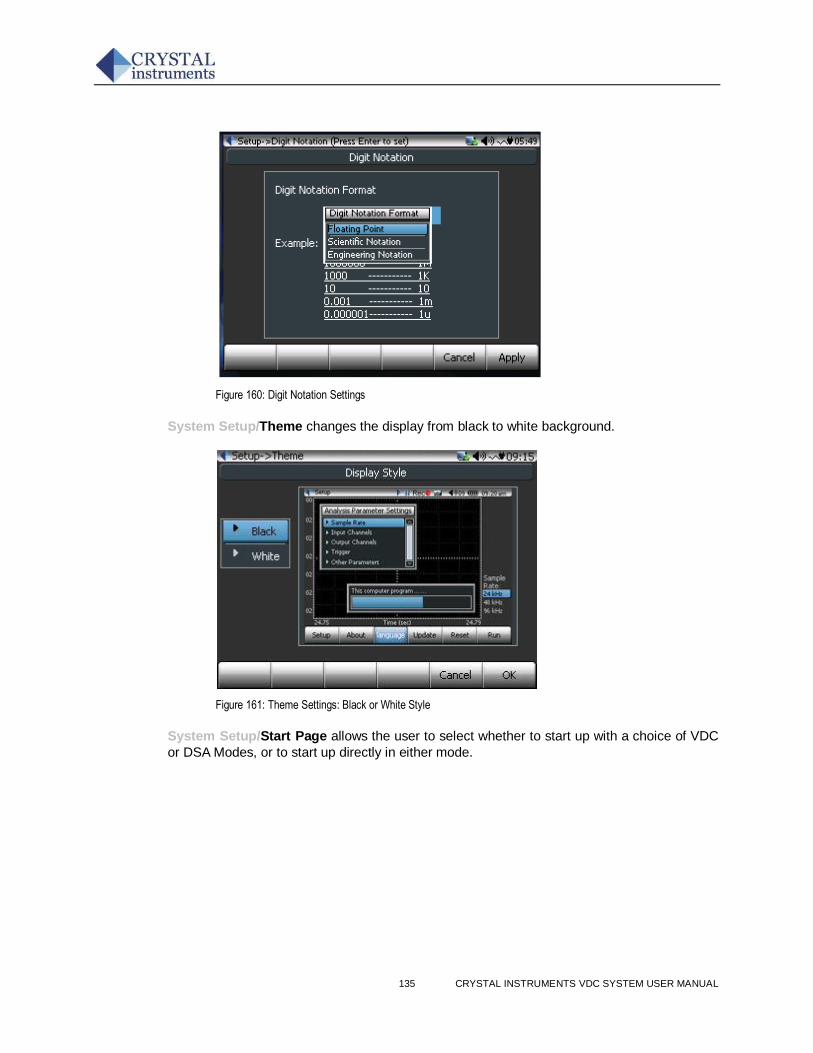
135 CRYSTAL INSTRUMENTS VDC SYSTEM USER MANUAL
Figure 160: Digit Notation Settings
System Setup/Theme changes the display from black to white background.
Figure 161: Theme Settings: Black or White Style
System Setup/Start Page allows the user to select whether to start up with a choice of VDC
or DSA Modes, or to start up directly in either mode.
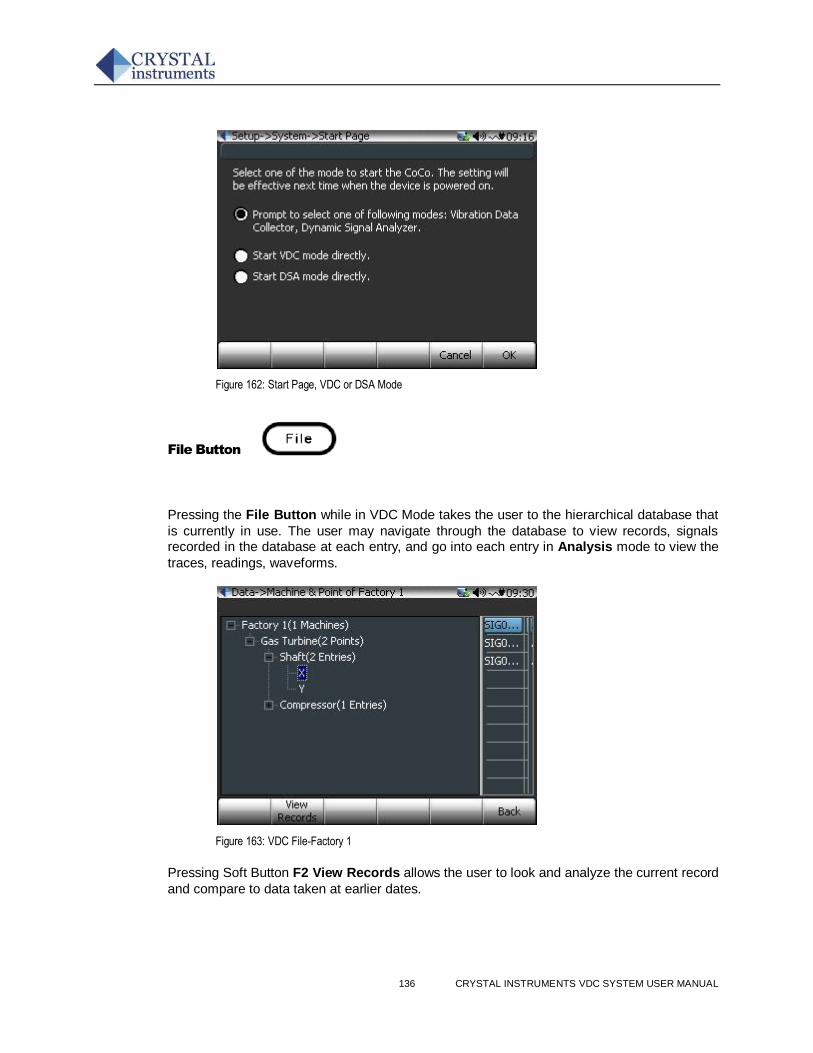
136 CRYSTAL INSTRUMENTS VDC SYSTEM USER MANUAL
Figure 162: Start Page, VDC or DSA Mode
File Button
Pressing the File Button while in VDC Mode takes the user to the hierarchical database that
is currently in use. The user may navigate through the database to view records, signals recorded in the database at each entry, and go into each entry in Analysis mode to view the
traces, readings, waveforms.
Figure 163: VDC File-Factory 1
Pressing Soft Button F2 View Records allows the user to look and analyze the current record
and compare to data taken at earlier dates.
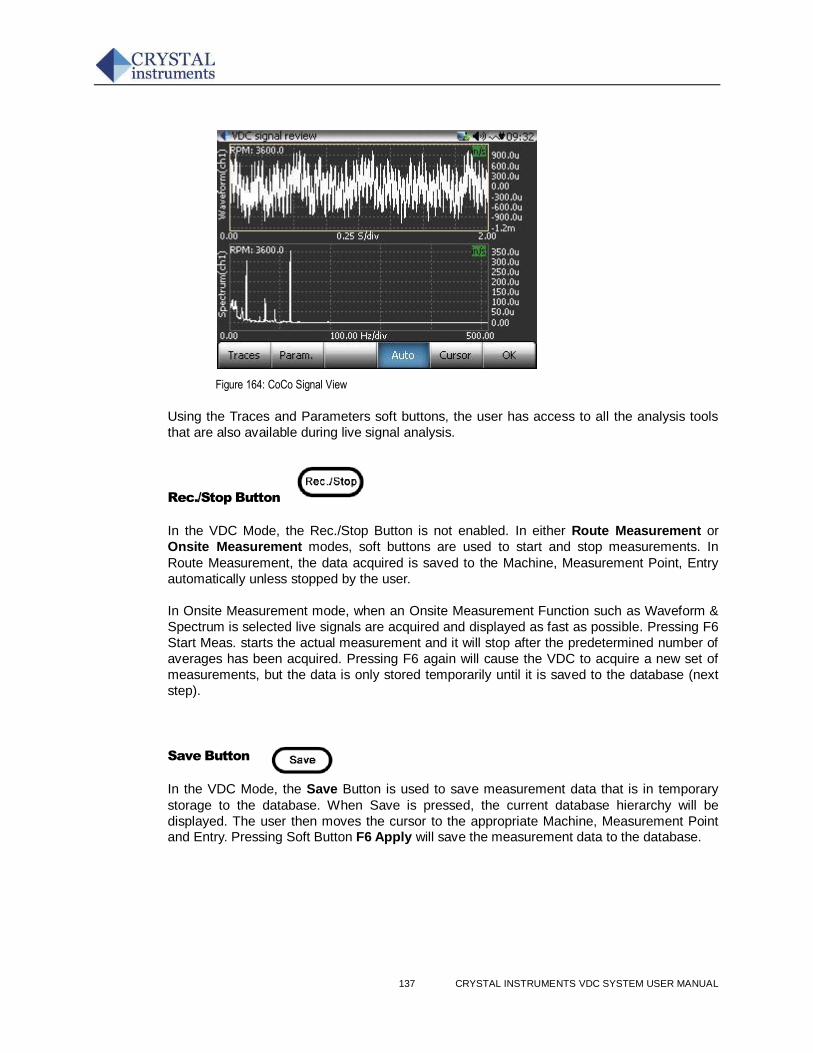
137 CRYSTAL INSTRUMENTS VDC SYSTEM USER MANUAL
Figure 164: CoCo Signal View
Using the Traces and Parameters soft buttons, the user has access to all the analysis tools
that are also available during live signal analysis.
Rec./Stop Button
In the VDC Mode, the Rec./Stop Button is not enabled. In either Route Measurement or
Onsite Measurement modes, soft buttons are used to start and stop measurements. In
Route Measurement, the data acquired is saved to the Machine, Measurement Point, Entry
automatically unless stopped by the user.
In Onsite Measurement mode, when an Onsite Measurement Function such as Waveform &
Spectrum is selected live signals are acquired and displayed as fast as possible. Pressing F6
Start Meas. starts the actual measurement and it will stop after the predetermined number of
averages has been acquired. Pressing F6 again will cause the VDC to acquire a new set of
measurements, but the data is only stored temporarily until it is saved to the database (next
step).
Save Button
In the VDC Mode, the Save Button is used to save measurement data that is in temporary
storage to the database. When Save is pressed, the current database hierarchy will be
displayed. The user then moves the cursor to the appropriate Machine, Measurement Point and Entry. Pressing Soft Button F6 Apply will save the measurement data to the database.
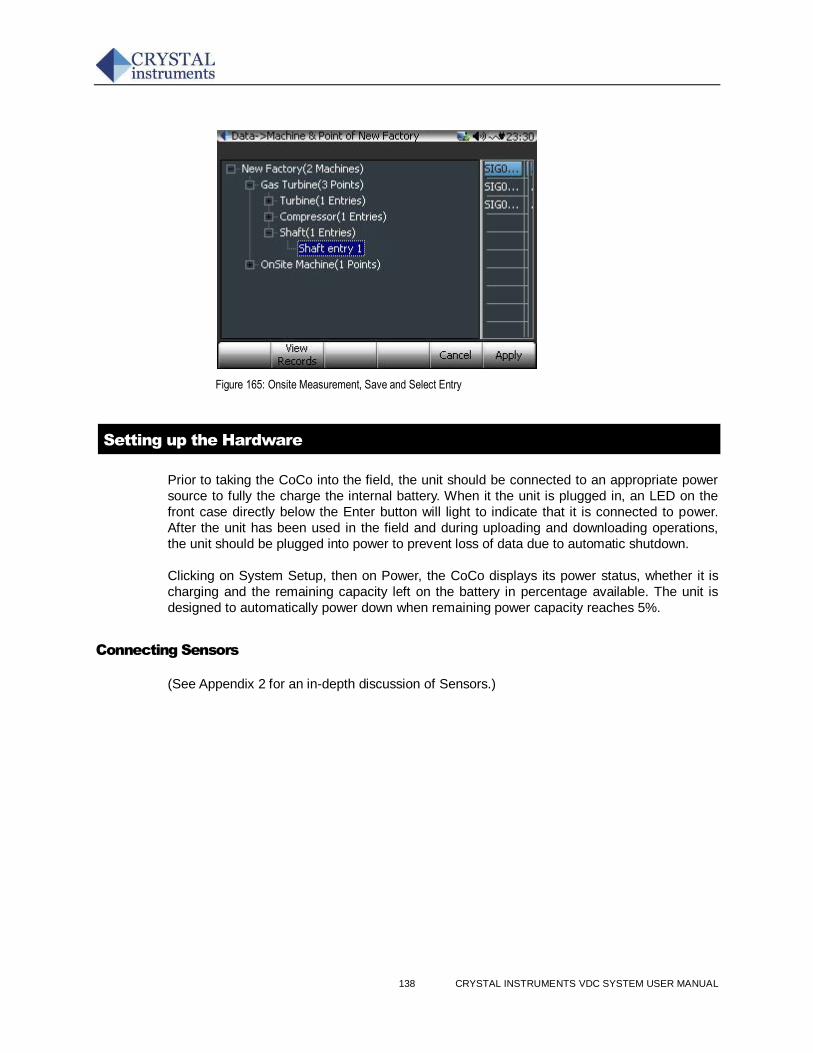
138 CRYSTAL INSTRUMENTS VDC SYSTEM USER MANUAL
Figure 165: Onsite Measurement, Save and Select Entry
Setting up the Hardware
Prior to taking the CoCo into the field, the unit should be connected to an appropriate power
source to fully the charge the internal battery. When it the unit is plugged in, an LED on the
front case directly below the Enter button will light to indicate that it is connected to power.
After the unit has been used in the field and during uploading and downloading operations,
the unit should be plugged into power to prevent loss of data due to automatic shutdown.
Clicking on System Setup, then on Power, the CoCo displays its power status, whether it is
charging and the remaining capacity left on the battery in percentage available. The unit is
designed to automatically power down when remaining power capacity reaches 5%.
Connecting Sensors
(See Appendix 2 for an in-depth discussion of Sensors.)
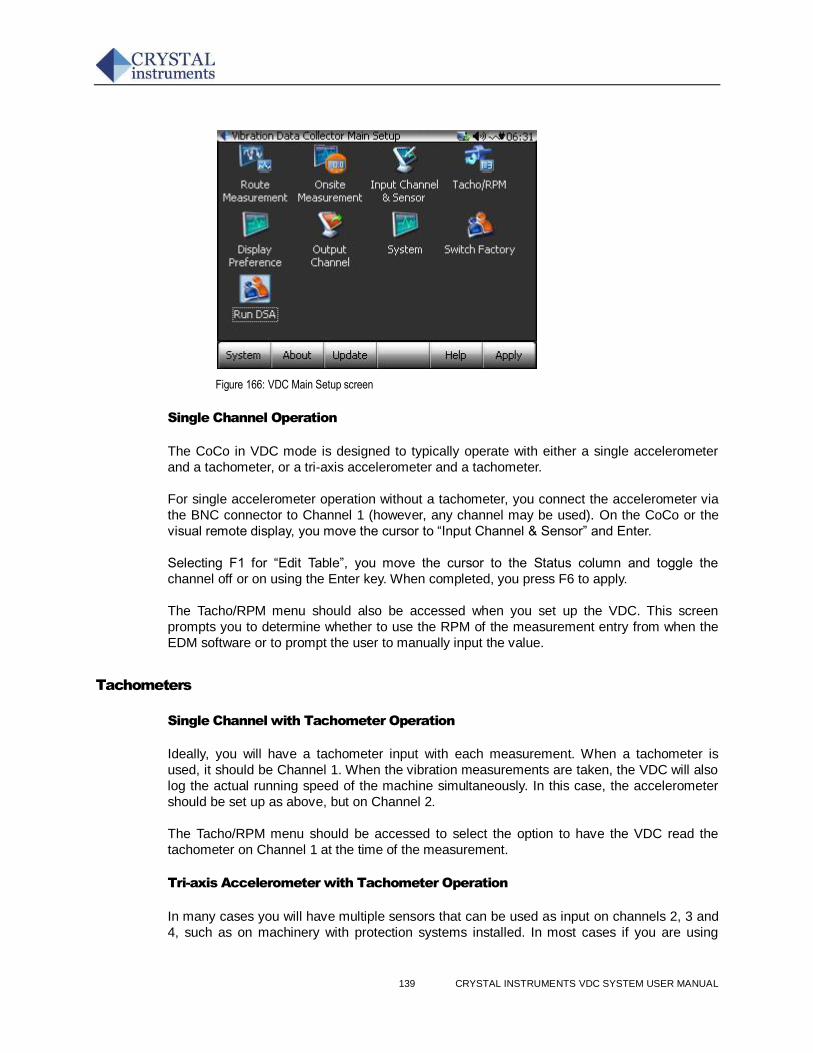
139 CRYSTAL INSTRUMENTS VDC SYSTEM USER MANUAL
Figure 166: VDC Main Setup screen
Single Channel Operation
The CoCo in VDC mode is designed to typically operate with either a single accelerometer
and a tachometer, or a tri-axis accelerometer and a tachometer.
For single accelerometer operation without a tachometer, you connect the accelerometer via
the BNC connector to Channel 1 (however, any channel may be used). On the CoCo or the
visual remote display, you move the cursor to “Input Channel & Sensor” and Enter.
Selecting F1 for “Edit Table”, you move the cursor to the Status column and toggle the
channel off or on using the Enter key. When completed, you press F6 to apply.
The Tacho/RPM menu should also be accessed when you set up the VDC. This screen
prompts you to determine whether to use the RPM of the measurement entry from when the
EDM software or to prompt the user to manually input the value.
Tachometers
Single Channel with Tachometer Operation
Ideally, you will have a tachometer input with each measurement. When a tachometer is
used, it should be Channel 1. When the vibration measurements are taken, the VDC will also
log the actual running speed of the machine simultaneously. In this case, the accelerometer
should be set up as above, but on Channel 2.
The Tacho/RPM menu should be accessed to select the option to have the VDC read the
tachometer on Channel 1 at the time of the measurement.
Tri-axis Accelerometer with Tachometer Operation
In many cases you will have multiple sensors that can be used as input on channels 2, 3 and
4, such as on machinery with protection systems installed. In most cases if you are using
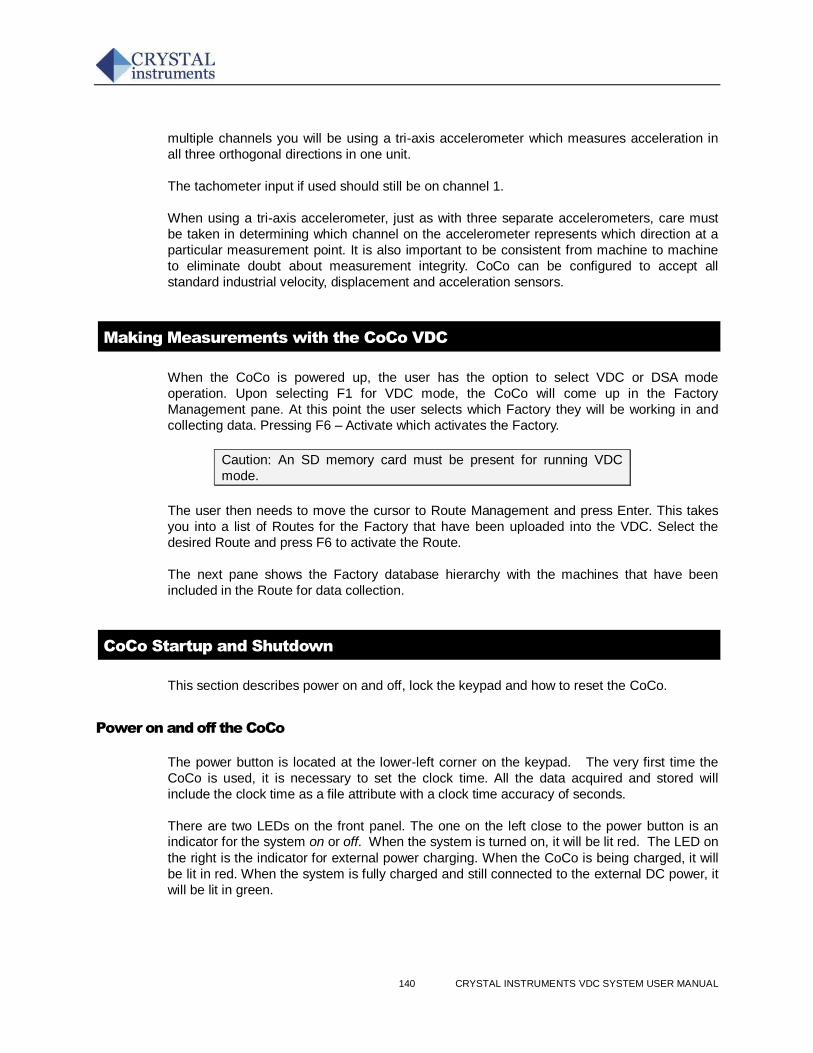
140 CRYSTAL INSTRUMENTS VDC SYSTEM USER MANUAL
multiple channels you will be using a tri-axis accelerometer which measures acceleration in
all three orthogonal directions in one unit.
The tachometer input if used should still be on channel 1.
When using a tri-axis accelerometer, just as with three separate accelerometers, care must
be taken in determining which channel on the accelerometer represents which direction at a
particular measurement point. It is also important to be consistent from machine to machine
to eliminate doubt about measurement integrity. CoCo can be configured to accept all
standard industrial velocity, displacement and acceleration sensors.
Making Measurements with the CoCo VDC
When the CoCo is powered up, the user has the option to select VDC or DSA mode
operation. Upon selecting F1 for VDC mode, the CoCo will come up in the Factory
Management pane. At this point the user selects which Factory they will be working in and
collecting data. Pressing F6 – Activate which activates the Factory.
Caution: An SD memory card must be present for running VDC
mode.
The user then needs to move the cursor to Route Management and press Enter. This takes
you into a list of Routes for the Factory that have been uploaded into the VDC. Select the
desired Route and press F6 to activate the Route.
The next pane shows the Factory database hierarchy with the machines that have been
included in the Route for data collection.
CoCo Startup and Shutdown
This section describes power on and off, lock the keypad and how to reset the CoCo.
Power on and off the CoCo
The power button is located at the lower-left corner on the keypad. The very first time the
CoCo is used, it is necessary to set the clock time. All the data acquired and stored will
include the clock time as a file attribute with a clock time accuracy of seconds.
There are two LEDs on the front panel. The one on the left close to the power button is an indicator for the system on or off. When the system is turned on, it will be lit red. The LED on
the right is the indicator for external power charging. When the CoCo is being charged, it will
be lit in red. When the system is fully charged and still connected to the external DC power, it
will be lit in green.
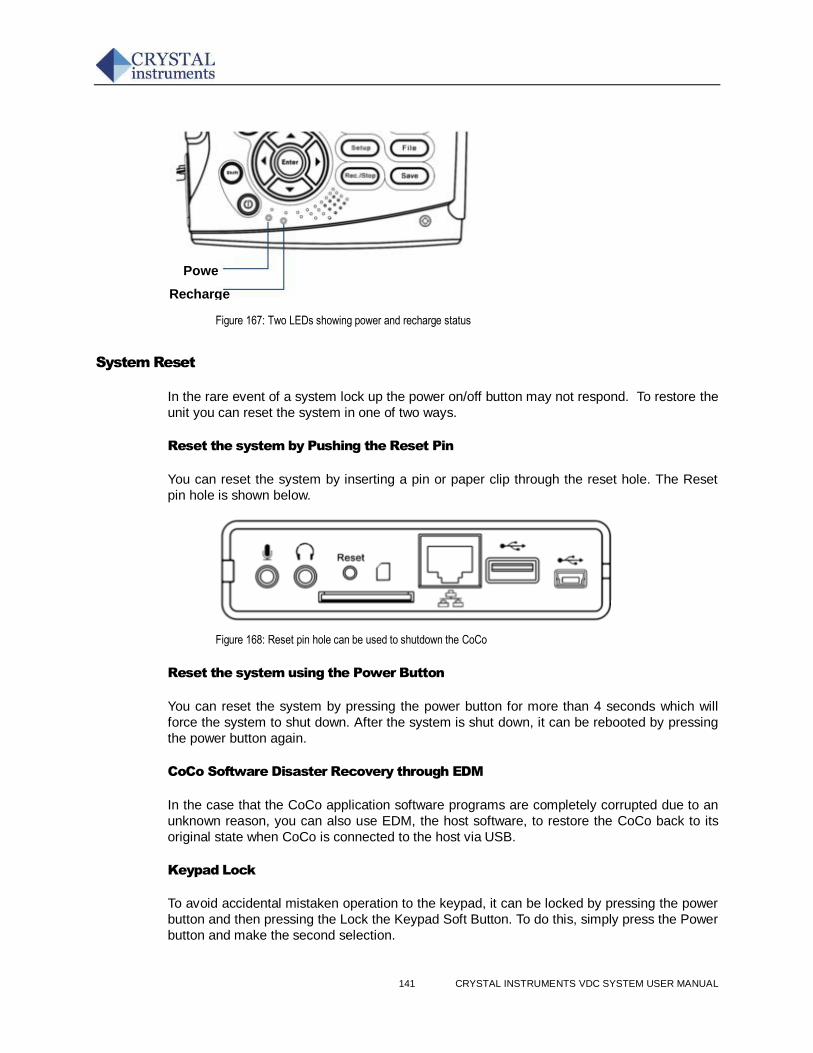
141 CRYSTAL INSTRUMENTS VDC SYSTEM USER MANUAL
Figure 167: Two LEDs showing power and recharge status
System Reset
In the rare event of a system lock up the power on/off button may not respond. To restore the
unit you can reset the system in one of two ways.
Reset the system by Pushing the Reset Pin
You can reset the system by inserting a pin or paper clip through the reset hole. The Reset
pin hole is shown below.
Figure 168: Reset pin hole can be used to shutdown the CoCo
Reset the system using the Power Button
You can reset the system by pressing the power button for more than 4 seconds which will
force the system to shut down. After the system is shut down, it can be rebooted by pressing
the power button again.
CoCo Software Disaster Recovery through EDM
In the case that the CoCo application software programs are completely corrupted due to an
unknown reason, you can also use EDM, the host software, to restore the CoCo back to its
original state when CoCo is connected to the host via USB.
Keypad Lock
To avoid accidental mistaken operation to the keypad, it can be locked by pressing the power
button and then pressing the Lock the Keypad Soft Button. To do this, simply press the Power
button and make the second selection.
Powe
r
Recharge
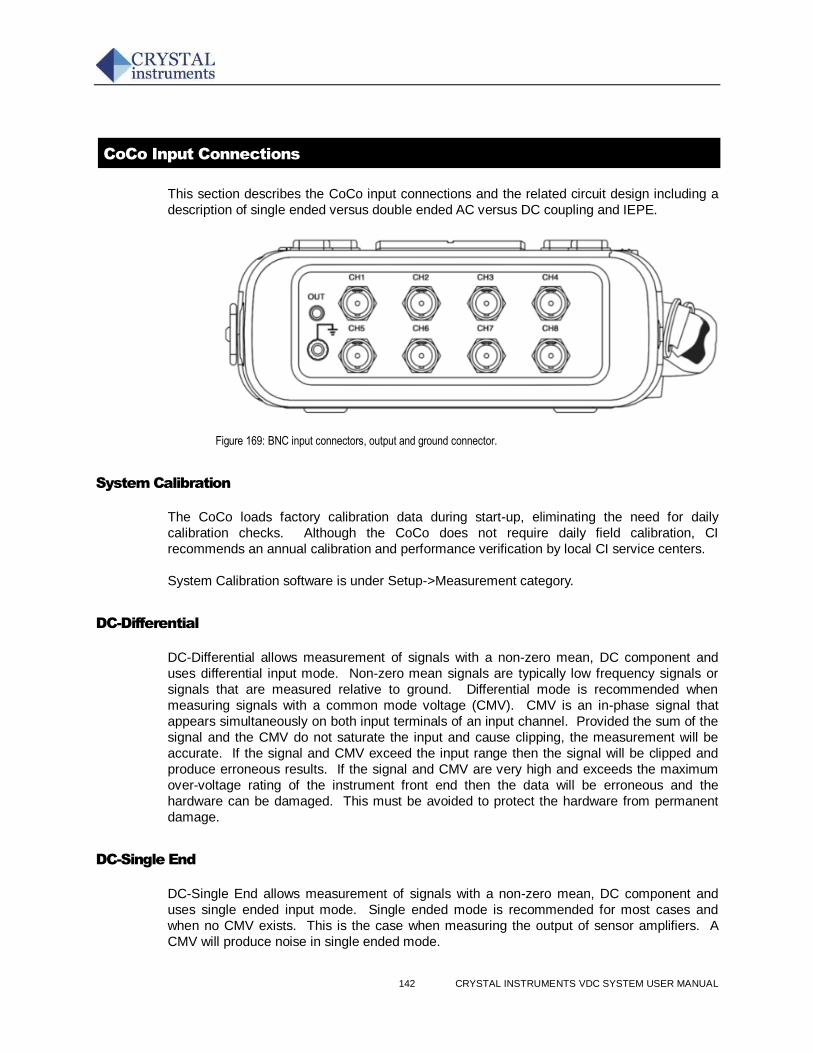
142 CRYSTAL INSTRUMENTS VDC SYSTEM USER MANUAL
CoCo Input Connections
This section describes the CoCo input connections and the related circuit design including a
description of single ended versus double ended AC versus DC coupling and IEPE.
Figure 169: BNC input connectors, output and ground connector.
System Calibration
The CoCo loads factory calibration data during start-up, eliminating the need for daily
calibration checks. Although the CoCo does not require daily field calibration, CI
recommends an annual calibration and performance verification by local CI service centers.
System Calibration software is under Setup->Measurement category.
DC-Differential
DC-Differential allows measurement of signals with a non-zero mean, DC component and
uses differential input mode. Non-zero mean signals are typically low frequency signals or
signals that are measured relative to ground. Differential mode is recommended when
measuring signals with a common mode voltage (CMV). CMV is an in-phase signal that
appears simultaneously on both input terminals of an input channel. Provided the sum of the
signal and the CMV do not saturate the input and cause clipping, the measurement will be
accurate. If the signal and CMV exceed the input range then the signal will be clipped and
produce erroneous results. If the signal and CMV are very high and exceeds the maximum
over-voltage rating of the instrument front end then the data will be erroneous and the
hardware can be damaged. This must be avoided to protect the hardware from permanent
damage.
DC-Single End
DC-Single End allows measurement of signals with a non-zero mean, DC component and
uses single ended input mode. Single ended mode is recommended for most cases and
when no CMV exists. This is the case when measuring the output of sensor amplifiers. A
CMV will produce noise in single ended mode.
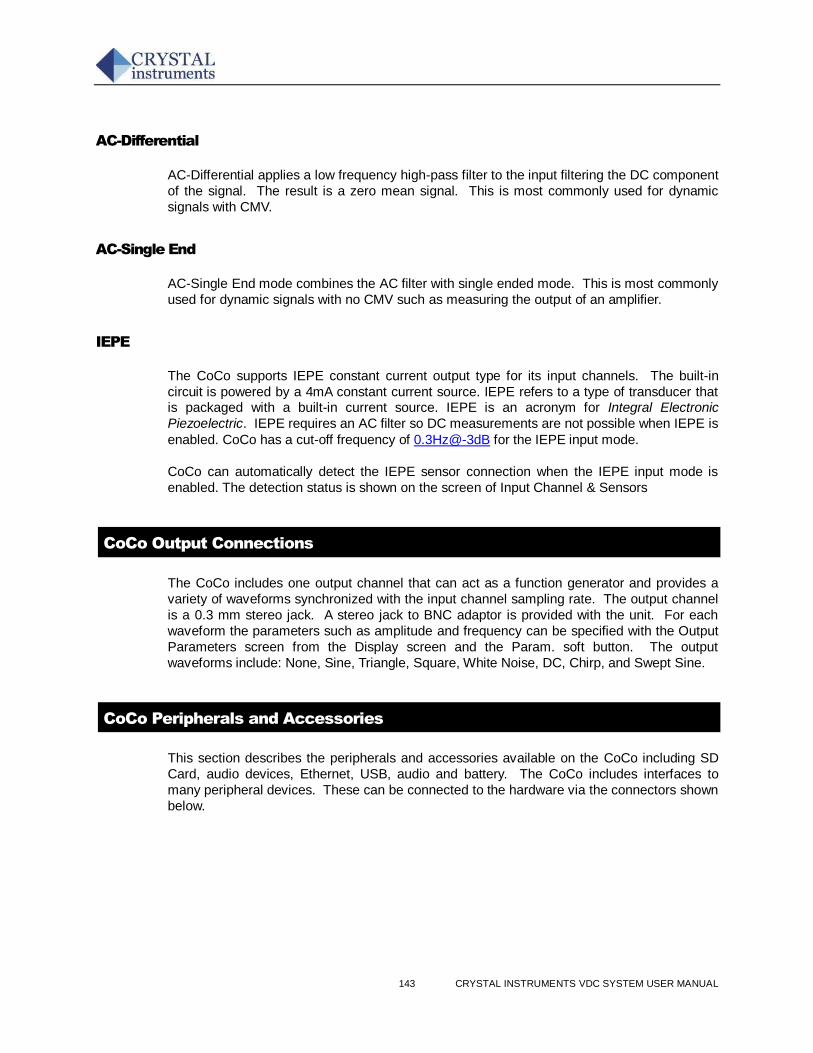
143 CRYSTAL INSTRUMENTS VDC SYSTEM USER MANUAL
AC-Differential
AC-Differential applies a low frequency high-pass filter to the input filtering the DC component
of the signal. The result is a zero mean signal. This is most commonly used for dynamic
signals with CMV.
AC-Single End
AC-Single End mode combines the AC filter with single ended mode. This is most commonly
used for dynamic signals with no CMV such as measuring the output of an amplifier.
IEPE
The CoCo supports IEPE constant current output type for its input channels. The built-in
circuit is powered by a 4mA constant current source. IEPE refers to a type of transducer that is packaged with a built-in current source. IEPE is an acronym for Integral Electronic
Piezoelectric. IEPE requires an AC filter so DC measurements are not possible when IEPE is
enabled. CoCo has a cut-off frequency of 0.3Hz@-3dB for the IEPE input mode.
CoCo can automatically detect the IEPE sensor connection when the IEPE input mode is
enabled. The detection status is shown on the screen of Input Channel & Sensors
CoCo Output Connections
The CoCo includes one output channel that can act as a function generator and provides a
variety of waveforms synchronized with the input channel sampling rate. The output channel
is a 0.3 mm stereo jack. A stereo jack to BNC adaptor is provided with the unit. For each
waveform the parameters such as amplitude and frequency can be specified with the Output
Parameters screen from the Display screen and the Param. soft button. The output
waveforms include: None, Sine, Triangle, Square, White Noise, DC, Chirp, and Swept Sine.
CoCo Peripherals and Accessories
This section describes the peripherals and accessories available on the CoCo including SD
Card, audio devices, Ethernet, USB, audio and battery. The CoCo includes interfaces to
many peripheral devices. These can be connected to the hardware via the connectors shown
below.
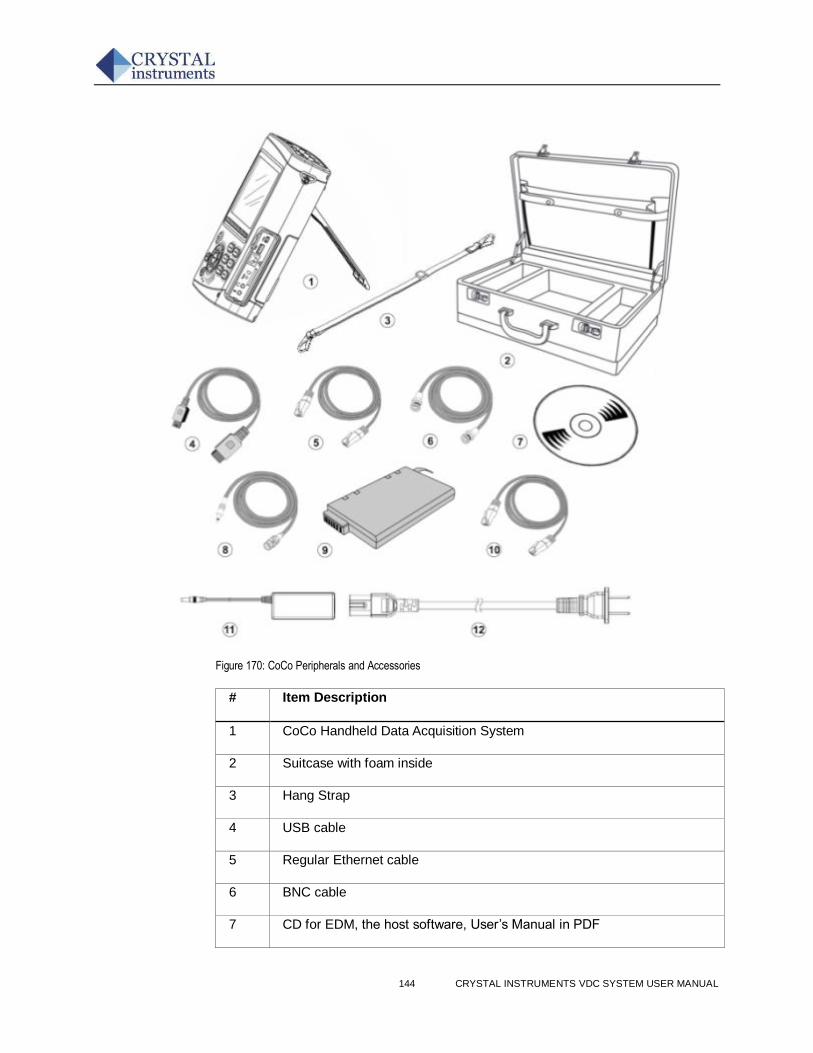
144 CRYSTAL INSTRUMENTS VDC SYSTEM USER MANUAL
Figure 170: CoCo Peripherals and Accessories
# Item Description
1 CoCo Handheld Data Acquisition System
2 Suitcase with foam inside
3 Hang Strap
4 USB cable
5 Regular Ethernet cable
6 BNC cable
7 CD for EDM, the host software, User’s Manual in PDF
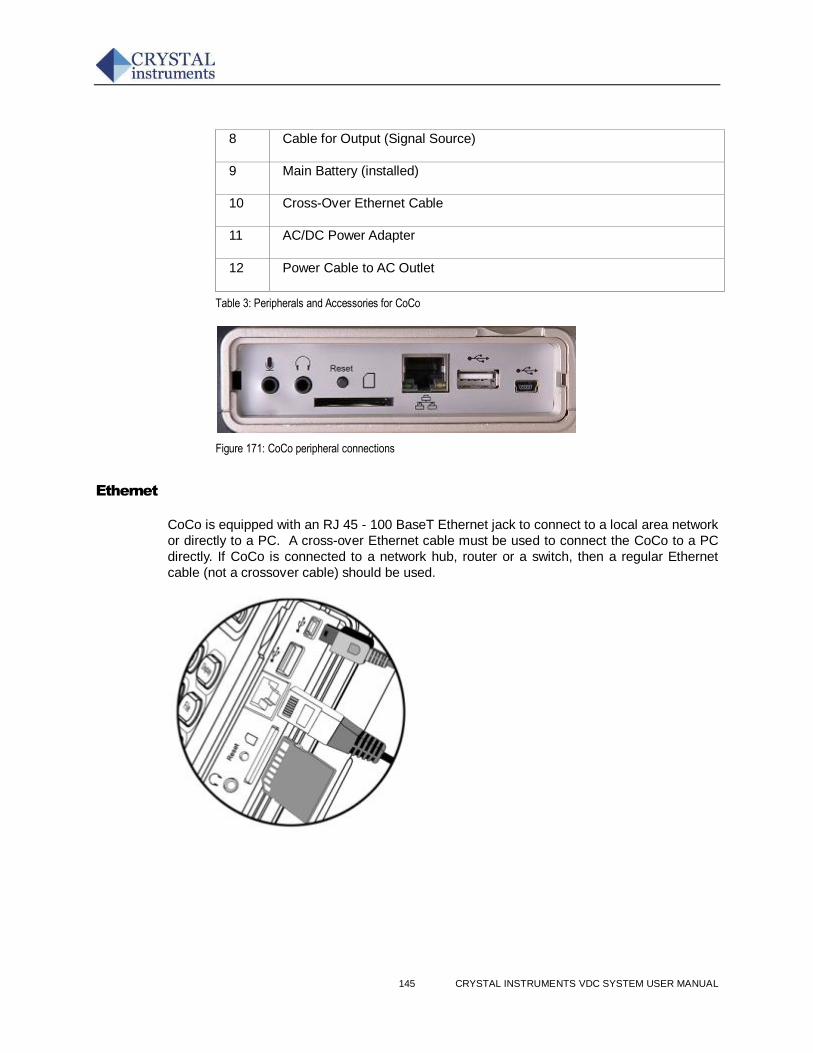
145 CRYSTAL INSTRUMENTS VDC SYSTEM USER MANUAL
8 Cable for Output (Signal Source)
9 Main Battery (installed)
10 Cross-Over Ethernet Cable
11 AC/DC Power Adapter
12 Power Cable to AC Outlet
Table 3: Peripherals and Accessories for CoCo
Figure 171: CoCo peripheral connections
Ethernet
CoCo is equipped with an RJ 45 - 100 BaseT Ethernet jack to connect to a local area network
or directly to a PC. A cross-over Ethernet cable must be used to connect the CoCo to a PC
directly. If CoCo is connected to a network hub, router or a switch, then a regular Ethernet
cable (not a crossover cable) should be used.
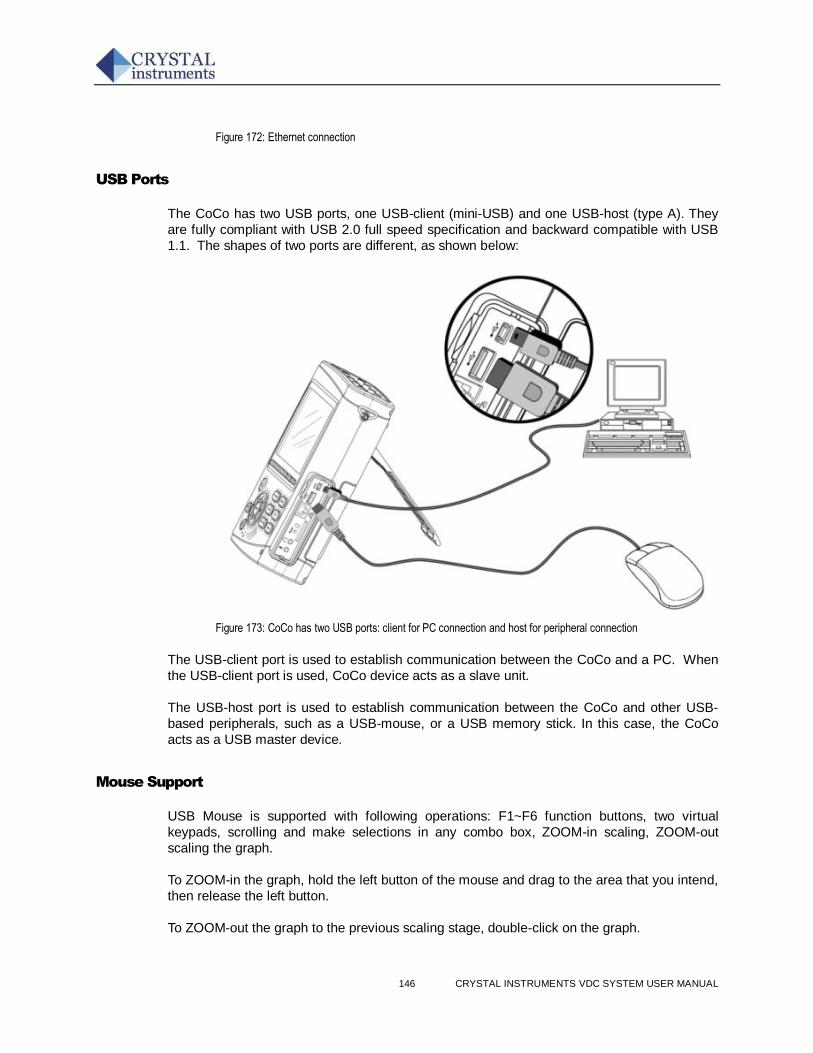
146 CRYSTAL INSTRUMENTS VDC SYSTEM USER MANUAL
Figure 172: Ethernet connection
USB Ports
The CoCo has two USB ports, one USB-client (mini-USB) and one USB-host (type A). They
are fully compliant with USB 2.0 full speed specification and backward compatible with USB
1.1. The shapes of two ports are different, as shown below:
Figure 173: CoCo has two USB ports: client for PC connection and host for peripheral connection
The USB-client port is used to establish communication between the CoCo and a PC. When
the USB-client port is used, CoCo device acts as a slave unit.
The USB-host port is used to establish communication between the CoCo and other USB-
based peripherals, such as a USB-mouse, or a USB memory stick. In this case, the CoCo
acts as a USB master device.
Mouse Support
USB Mouse is supported with following operations: F1~F6 function buttons, two virtual
keypads, scrolling and make selections in any combo box, ZOOM-in scaling, ZOOM-out
scaling the graph.
To ZOOM-in the graph, hold the left button of the mouse and drag to the area that you intend,
then release the left button.
To ZOOM-out the graph to the previous scaling stage, double-click on the graph.
147 CRYSTAL INSTRUMENTS VDC SYSTEM USER MANUAL
SD Card Interface
The MMC/SD-Card interface is designed to be used for multiple purposes, mainly the high
density memory card. The official information about the MMC/SD-card can be found on the
official site: http://www.sdcard.org/
The user can copy the recorded signal files from the internal flash memory to SD memory
card or directly record the time stream data to SD memory card.
Audio Devices
CoCo has the following built-in audio devices:
3.5mm stereo jack connector for an earphone
Built-in speaker
Built-in microphone
The earphone and speaker are used to generate status sounds that provide audio feedback
to the use such as:
AC adapter is connected
AC adapter power was disconnected
System boot-up successful
System boot-up failure
Battery
There are two batteries inside the CoCo device, the clock battery and the main battery. The
clock battery is only used maintain power to the internal clock. It is located inside the
hardware and should be replaced when necessary by an authorized CI service center and
should not be replaced by the user. The main battery is used to power the instrument. The
main battery is a Lithium-Ion type cell with a capacity of up to 6600 milliamp-hours. The main
battery is located inside the enclosure and can be replaced by opening the lid on the back of
the CoCo.
To recharge the main battery, simply connect the AC adaptor between the CoCo and the AC
power source. The power source must be in the range of 100 - 250 VAC. When the CoCo is
turned on, a battery capacity symbol is shown on the status bar that indicates the state of
charge of the battery.
148 CRYSTAL INSTRUMENTS VDC SYSTEM USER MANUAL
Figure 174: CoCo Battery
CoCo On-Line Updates
The CoCo application software has the capability to check for software updates from the CI
web server when you connect the CoCo device to the Internet. You first connect the CoCo to a local network using regular Ethernet. After you connect it, press Setup button and click the
Update icon. The CoCo will first check the connection status, and then a connection will be
established.
Figure 175: Network connection for CoCo update
After communication is established, the CoCo will check with the server to verify if the
software subscription is valid. If the CoCo is in the valid software subscription period, it will
then check the latest software components available on the server and download them to the
CoCo after the user’s approval.
Two types of software components can be updated:
CoCo application software
CSA project files
The CoCo user interface will always ask the user’s confirmation before the software is
downloaded. When the new CoCo application software is downloaded, you will be asked to
confirm to overwrite the old version with the new version. Then the older version will be
overwritten.
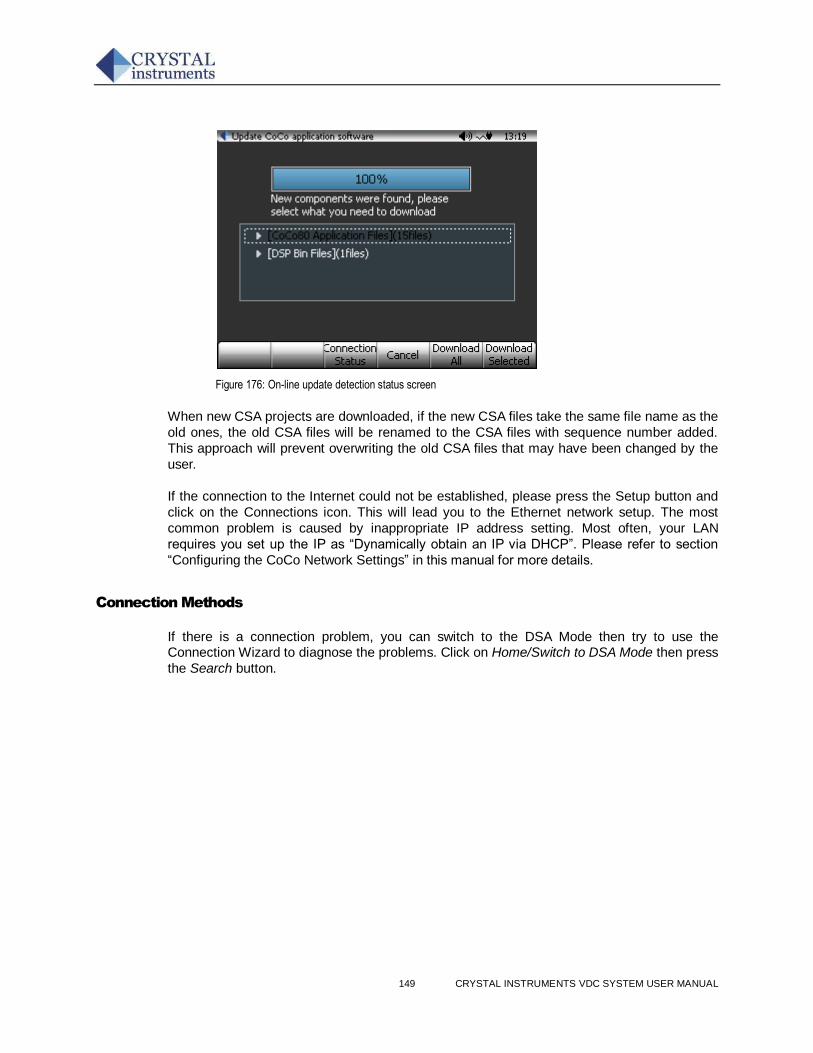
149 CRYSTAL INSTRUMENTS VDC SYSTEM USER MANUAL
Figure 176: On-line update detection status screen
When new CSA projects are downloaded, if the new CSA files take the same file name as the
old ones, the old CSA files will be renamed to the CSA files with sequence number added.
This approach will prevent overwriting the old CSA files that may have been changed by the
user.
If the connection to the Internet could not be established, please press the Setup button and
click on the Connections icon. This will lead you to the Ethernet network setup. The most
common problem is caused by inappropriate IP address setting. Most often, your LAN
requires you set up the IP as “Dynamically obtain an IP via DHCP”. Please refer to section
“Configuring the CoCo Network Settings” in this manual for more details.
Connection Methods
If there is a connection problem, you can switch to the DSA Mode then try to use the Connection Wizard to diagnose the problems. Click on Home/Switch to DSA Mode then press
the Search button.
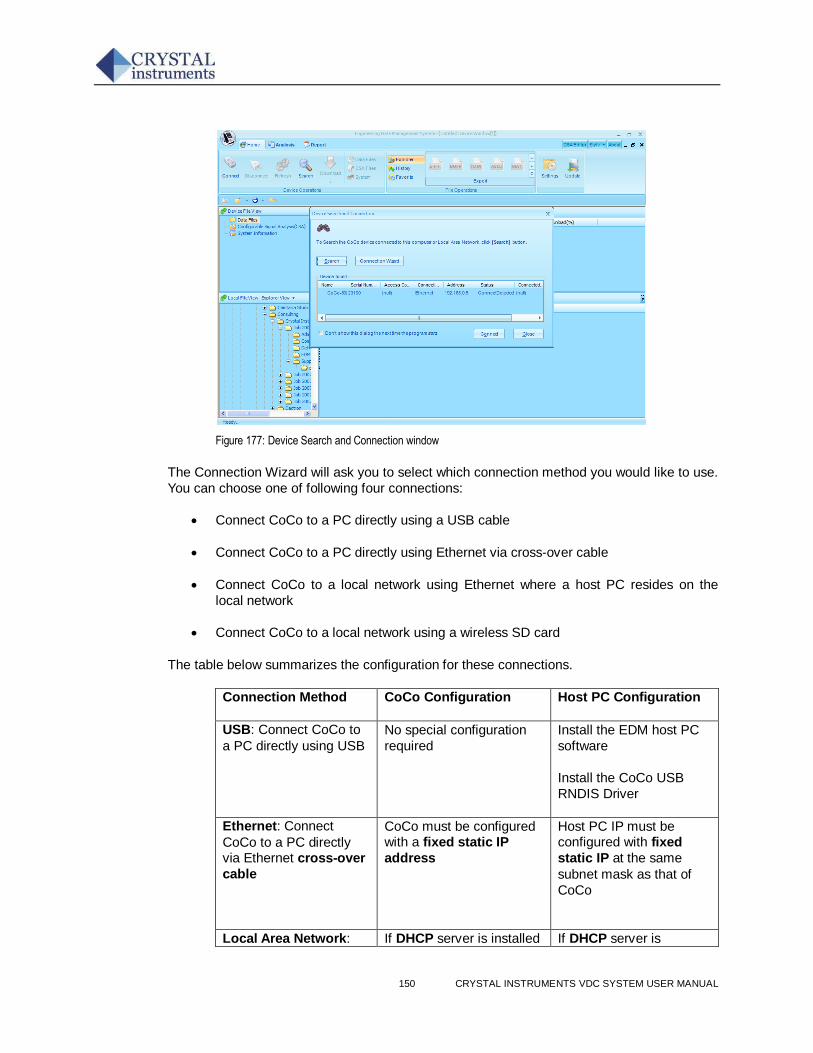
150 CRYSTAL INSTRUMENTS VDC SYSTEM USER MANUAL
Figure 177: Device Search and Connection window
The Connection Wizard will ask you to select which connection method you would like to use.
You can choose one of following four connections:
Connect CoCo to a PC directly using a USB cable
Connect CoCo to a PC directly using Ethernet via cross-over cable
Connect CoCo to a local network using Ethernet where a host PC resides on the
local network
Connect CoCo to a local network using a wireless SD card
The table below summarizes the configuration for these connections.
Connection Method CoCo Configuration Host PC Configuration
USB: Connect CoCo to
a PC directly using USB
No special configuration
required
Install the EDM host PC
software
Install the CoCo USB
RNDIS Driver
Ethernet: Connect
CoCo to a PC directly via Ethernet cross-over
cable
CoCo must be configured with a fixed static IP
address
Host PC IP must be configured with fixed
static IP at the same
subnet mask as that of
CoCo
Local Area Network: If DHCP server is installed If DHCP server is
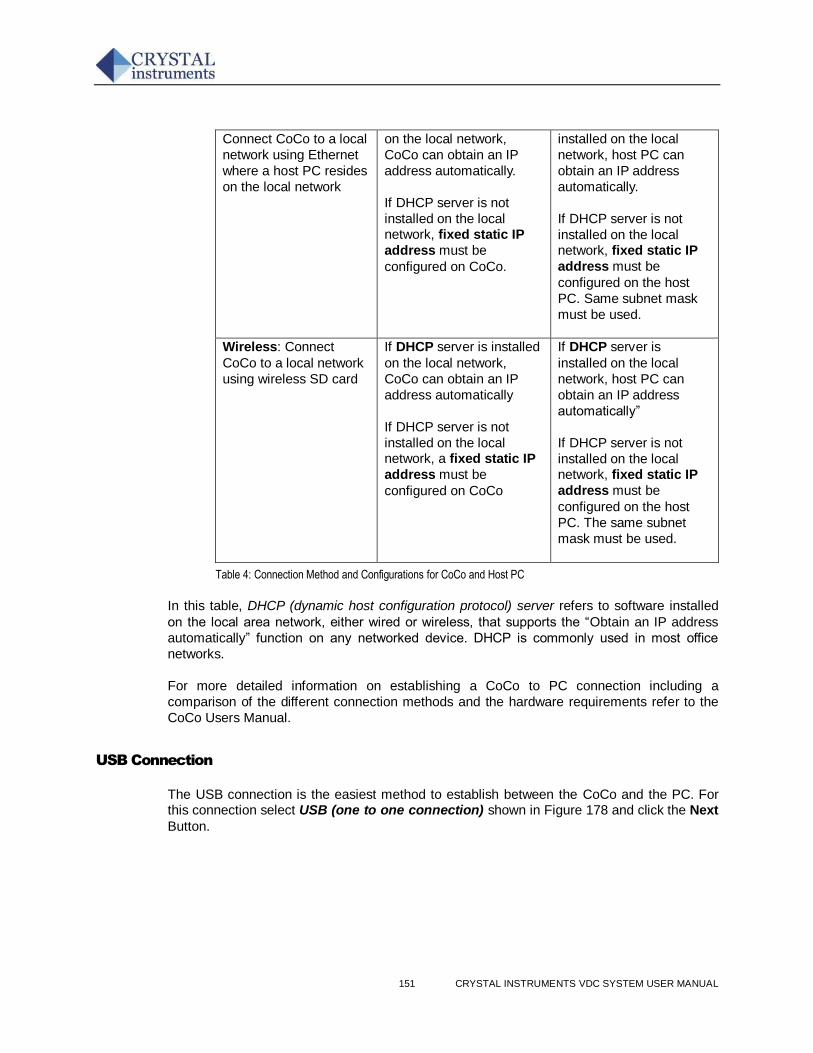
151 CRYSTAL INSTRUMENTS VDC SYSTEM USER MANUAL
Connect CoCo to a local
network using Ethernet
where a host PC resides
on the local network
on the local network,
CoCo can obtain an IP
address automatically.
If DHCP server is not
installed on the local network, fixed static IP
address must be
configured on CoCo.
installed on the local
network, host PC can
obtain an IP address
automatically.
If DHCP server is not
installed on the local network, fixed static IP
address must be
configured on the host
PC. Same subnet mask
must be used.
Wireless: Connect
CoCo to a local network
using wireless SD card
If DHCP server is installed
on the local network,
CoCo can obtain an IP
address automatically
If DHCP server is not
installed on the local network, a fixed static IP
address must be
configured on CoCo
If DHCP server is
installed on the local
network, host PC can
obtain an IP address
automatically”
If DHCP server is not
installed on the local network, fixed static IP
address must be
configured on the host
PC. The same subnet
mask must be used.
Table 4: Connection Method and Configurations for CoCo and Host PC
In this table, DHCP (dynamic host configuration protocol) server refers to software installed
on the local area network, either wired or wireless, that supports the “Obtain an IP address
automatically” function on any networked device. DHCP is commonly used in most office
networks.
For more detailed information on establishing a CoCo to PC connection including a
comparison of the different connection methods and the hardware requirements refer to the
CoCo Users Manual.
USB Connection
The USB connection is the easiest method to establish between the CoCo and the PC. For this connection select USB (one to one connection) shown in Figure 178 and click the Next
Button.
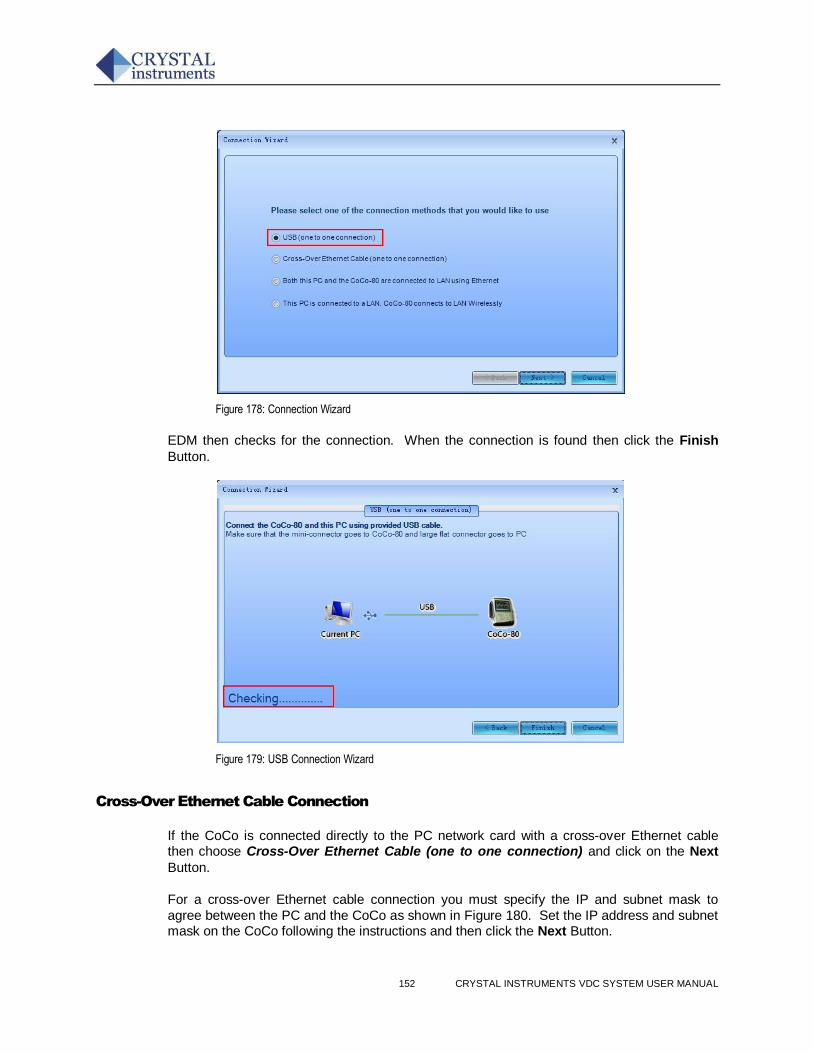
152 CRYSTAL INSTRUMENTS VDC SYSTEM USER MANUAL
Figure 178: Connection Wizard
EDM then checks for the connection. When the connection is found then click the Finish
Button.
Figure 179: USB Connection Wizard
Cross-Over Ethernet Cable Connection
If the CoCo is connected directly to the PC network card with a cross-over Ethernet cable then choose Cross-Over Ethernet Cable (one to one connection) and click on the Next
Button.
For a cross-over Ethernet cable connection you must specify the IP and subnet mask to
agree between the PC and the CoCo as shown in Figure 180. Set the IP address and subnet mask on the CoCo following the instructions and then click the Next Button.
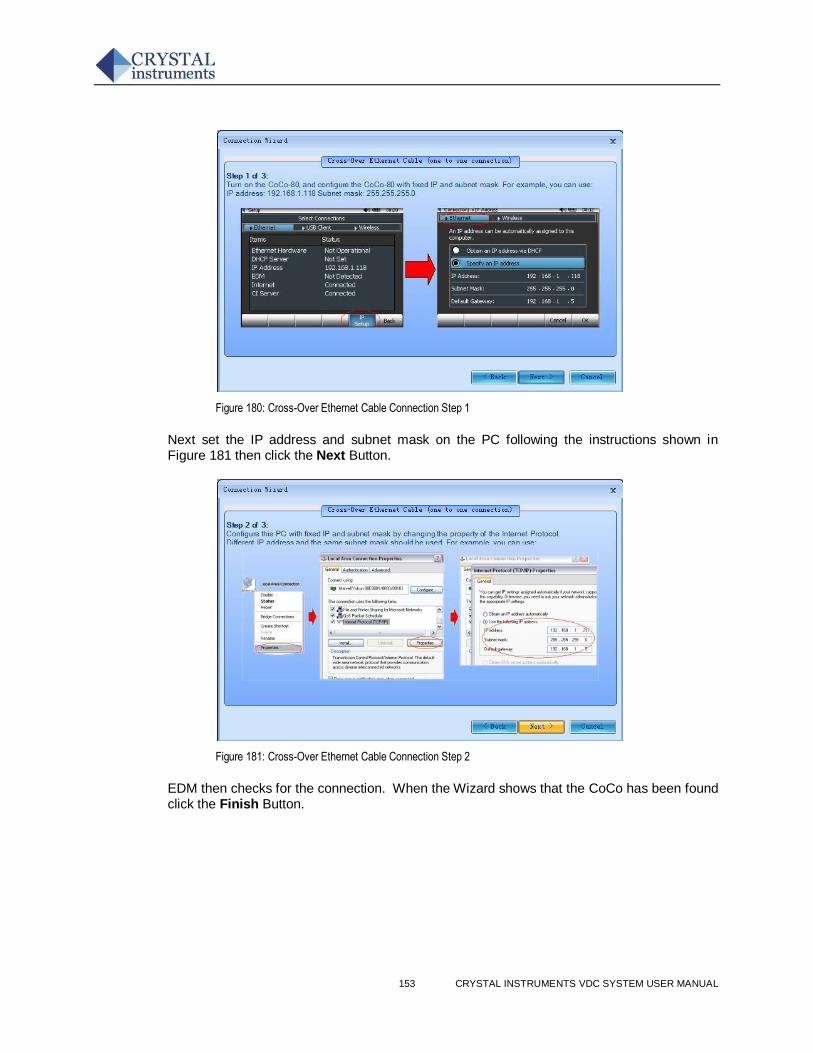
153 CRYSTAL INSTRUMENTS VDC SYSTEM USER MANUAL
Figure 180: Cross-Over Ethernet Cable Connection Step 1
Next set the IP address and subnet mask on the PC following the instructions shown in Figure 181 then click the Next Button.
Figure 181: Cross-Over Ethernet Cable Connection Step 2
EDM then checks for the connection. When the Wizard shows that the CoCo has been found click the Finish Button.
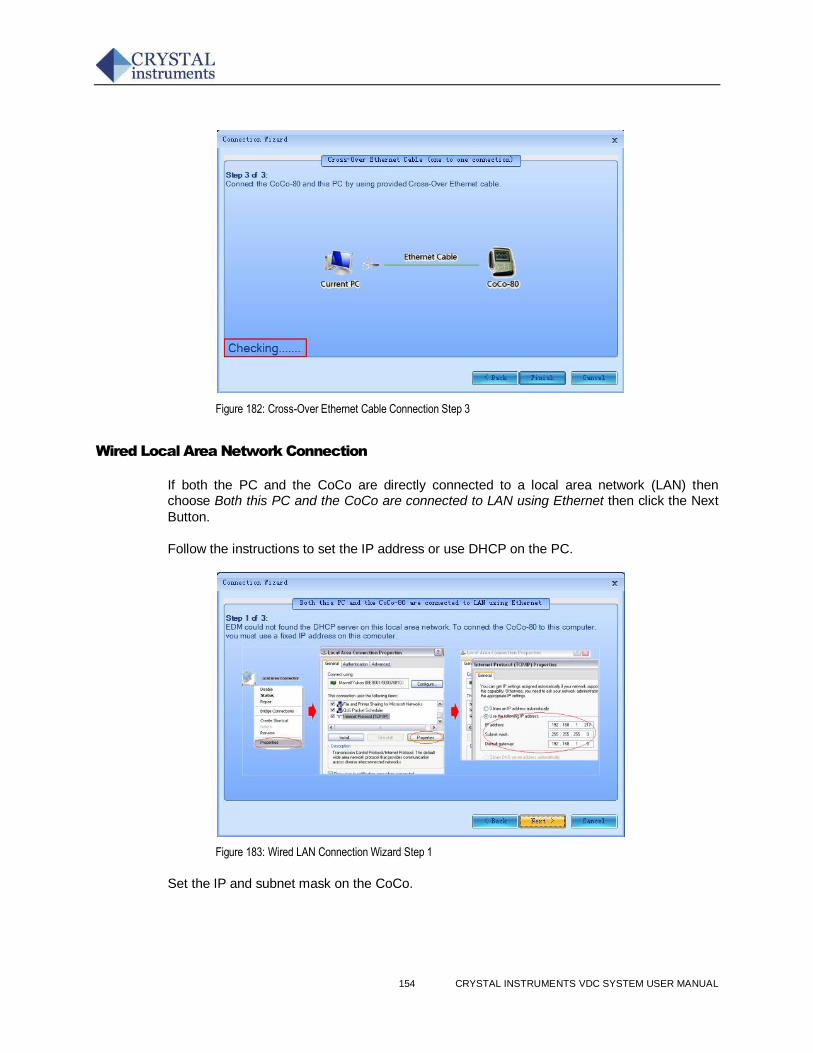
154 CRYSTAL INSTRUMENTS VDC SYSTEM USER MANUAL
Figure 182: Cross-Over Ethernet Cable Connection Step 3
Wired Local Area Network Connection
If both the PC and the CoCo are directly connected to a local area network (LAN) then choose Both this PC and the CoCo are connected to LAN using Ethernet then click the Next
Button.
Follow the instructions to set the IP address or use DHCP on the PC.
Figure 183: Wired LAN Connection Wizard Step 1
Set the IP and subnet mask on the CoCo.
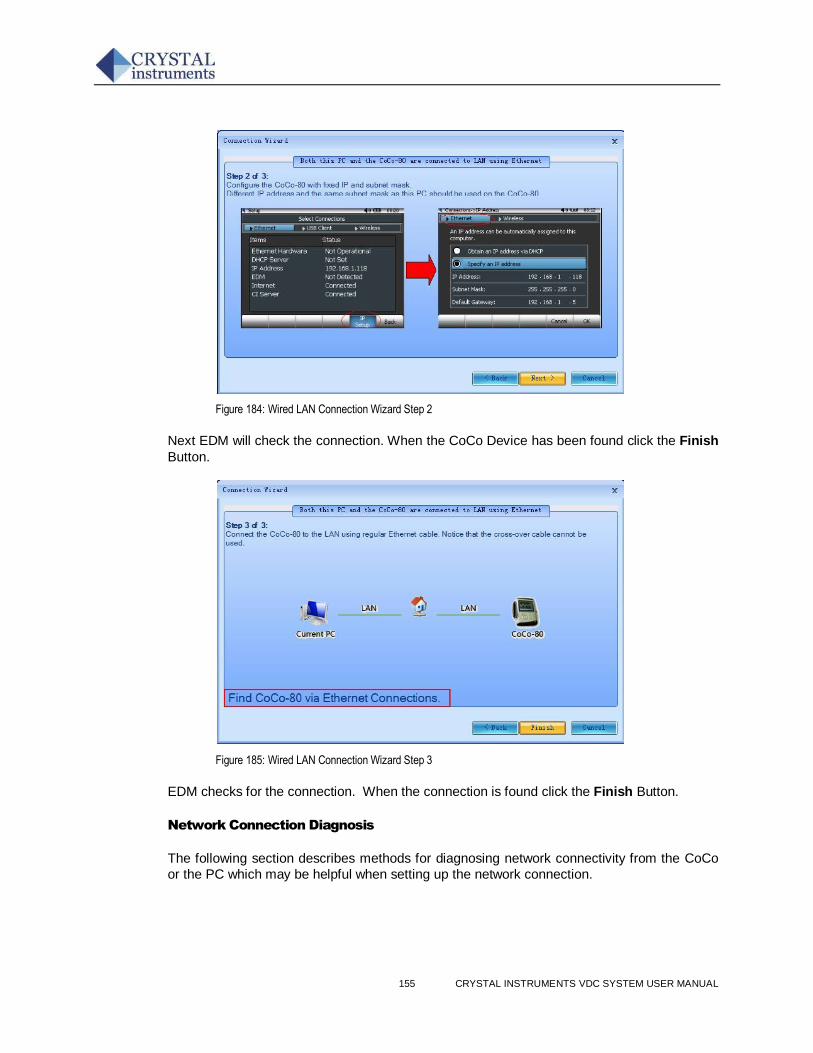
155 CRYSTAL INSTRUMENTS VDC SYSTEM USER MANUAL
Figure 184: Wired LAN Connection Wizard Step 2
Next EDM will check the connection. When the CoCo Device has been found click the Finish
Button.
Figure 185: Wired LAN Connection Wizard Step 3
EDM checks for the connection. When the connection is found click the Finish Button.
Network Connection Diagnosis
The following section describes methods for diagnosing network connectivity from the CoCo
or the PC which may be helpful when setting up the network connection.
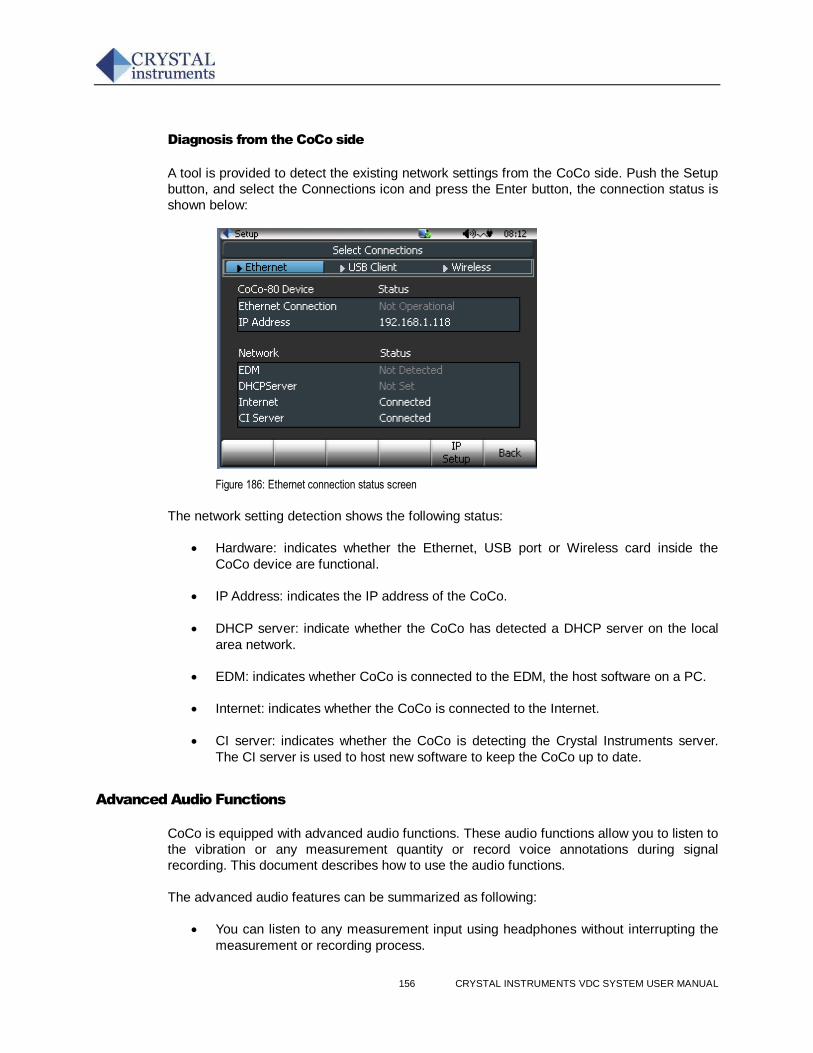
156 CRYSTAL INSTRUMENTS VDC SYSTEM USER MANUAL
Diagnosis from the CoCo side
A tool is provided to detect the existing network settings from the CoCo side. Push the Setup
button, and select the Connections icon and press the Enter button, the connection status is
shown below:
Figure 186: Ethernet connection status screen
The network setting detection shows the following status:
Hardware: indicates whether the Ethernet, USB port or Wireless card inside the
CoCo device are functional.
IP Address: indicates the IP address of the CoCo.
DHCP server: indicate whether the CoCo has detected a DHCP server on the local
area network.
EDM: indicates whether CoCo is connected to the EDM, the host software on a PC.
Internet: indicates whether the CoCo is connected to the Internet.
CI server: indicates whether the CoCo is detecting the Crystal Instruments server.
The CI server is used to host new software to keep the CoCo up to date.
Advanced Audio Functions
CoCo is equipped with advanced audio functions. These audio functions allow you to listen to
the vibration or any measurement quantity or record voice annotations during signal
recording. This document describes how to use the audio functions.
The advanced audio features can be summarized as following:
You can listen to any measurement input using headphones without interrupting the
measurement or recording process.
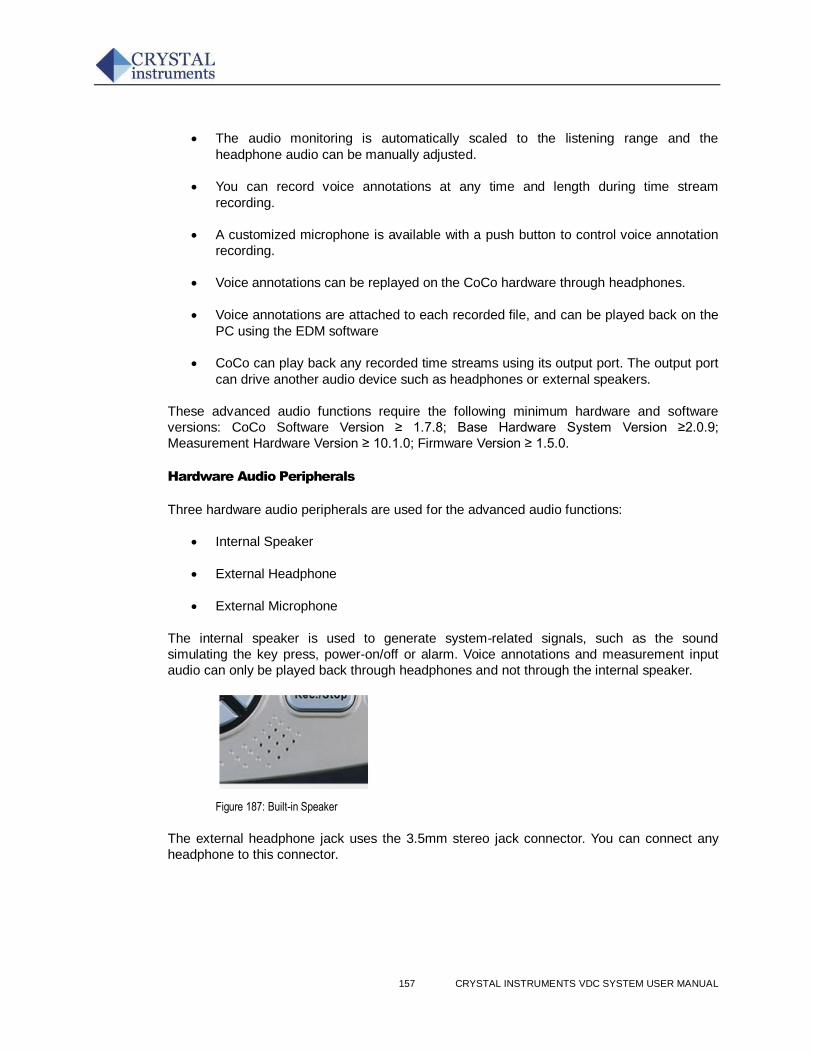
157 CRYSTAL INSTRUMENTS VDC SYSTEM USER MANUAL
The audio monitoring is automatically scaled to the listening range and the
headphone audio can be manually adjusted.
You can record voice annotations at any time and length during time stream
recording.
A customized microphone is available with a push button to control voice annotation
recording.
Voice annotations can be replayed on the CoCo hardware through headphones.
Voice annotations are attached to each recorded file, and can be played back on the
PC using the EDM software
CoCo can play back any recorded time streams using its output port. The output port
can drive another audio device such as headphones or external speakers.
These advanced audio functions require the following minimum hardware and software
versions: CoCo Software Version ≥ 1.7.8; Base Hardware System Version ≥2.0.9;
Measurement Hardware Version ≥ 10.1.0; Firmware Version ≥ 1.5.0.
Hardware Audio Peripherals
Three hardware audio peripherals are used for the advanced audio functions:
Internal Speaker
External Headphone
External Microphone
The internal speaker is used to generate system-related signals, such as the sound
simulating the key press, power-on/off or alarm. Voice annotations and measurement input
audio can only be played back through headphones and not through the internal speaker.
Figure 187: Built-in Speaker
The external headphone jack uses the 3.5mm stereo jack connector. You can connect any
headphone to this connector.
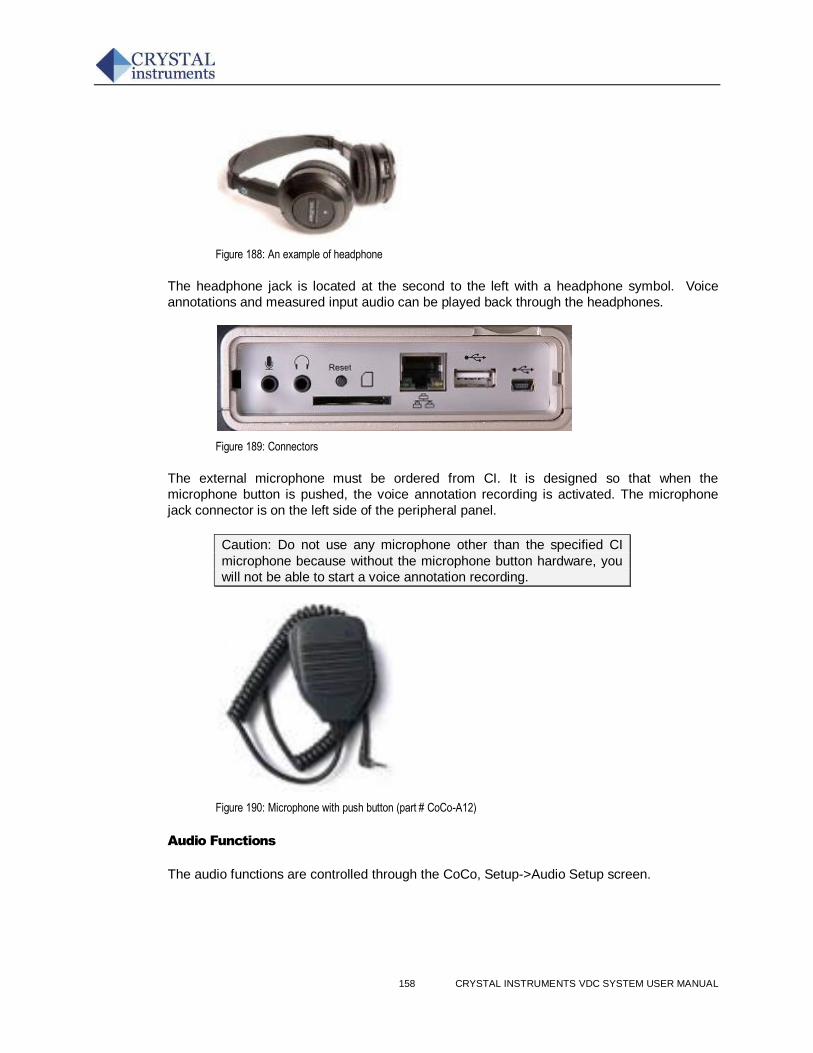
158 CRYSTAL INSTRUMENTS VDC SYSTEM USER MANUAL
Figure 188: An example of headphone
The headphone jack is located at the second to the left with a headphone symbol. Voice
annotations and measured input audio can be played back through the headphones.
Figure 189: Connectors
The external microphone must be ordered from CI. It is designed so that when the
microphone button is pushed, the voice annotation recording is activated. The microphone
jack connector is on the left side of the peripheral panel.
Caution: Do not use any microphone other than the specified CI
microphone because without the microphone button hardware, you
will not be able to start a voice annotation recording.
Figure 190: Microphone with push button (part # CoCo-A12)
Audio Functions
The audio functions are controlled through the CoCo, Setup->Audio Setup screen.
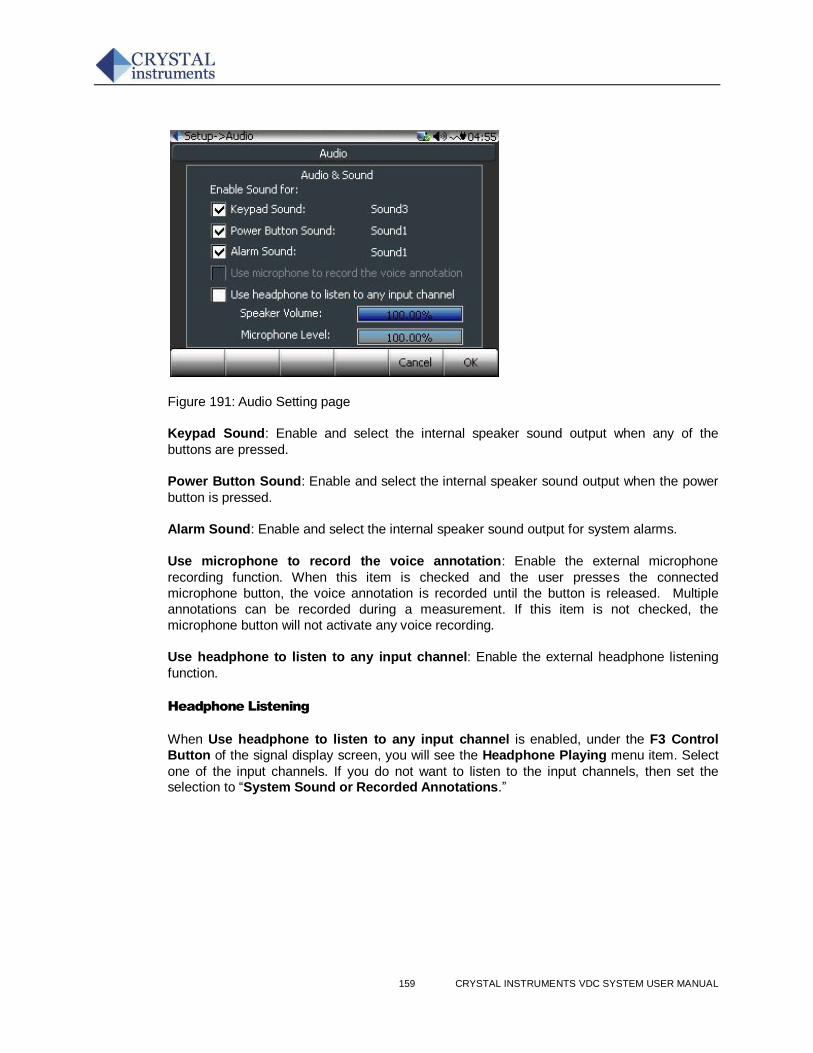
159 CRYSTAL INSTRUMENTS VDC SYSTEM USER MANUAL
Figure 191: Audio Setting page
Keypad Sound: Enable and select the internal speaker sound output when any of the
buttons are pressed.
Power Button Sound: Enable and select the internal speaker sound output when the power
button is pressed.
Alarm Sound: Enable and select the internal speaker sound output for system alarms.
Use microphone to record the voice annotation: Enable the external microphone
recording function. When this item is checked and the user presses the connected
microphone button, the voice annotation is recorded until the button is released. Multiple
annotations can be recorded during a measurement. If this item is not checked, the
microphone button will not activate any voice recording.
Use headphone to listen to any input channel: Enable the external headphone listening
function.
Headphone Listening
When Use headphone to listen to any input channel is enabled, under the F3 Control
Button of the signal display screen, you will see the Headphone Playing menu item. Select
one of the input channels. If you do not want to listen to the input channels, then set the selection to “System Sound or Recorded Annotations.”
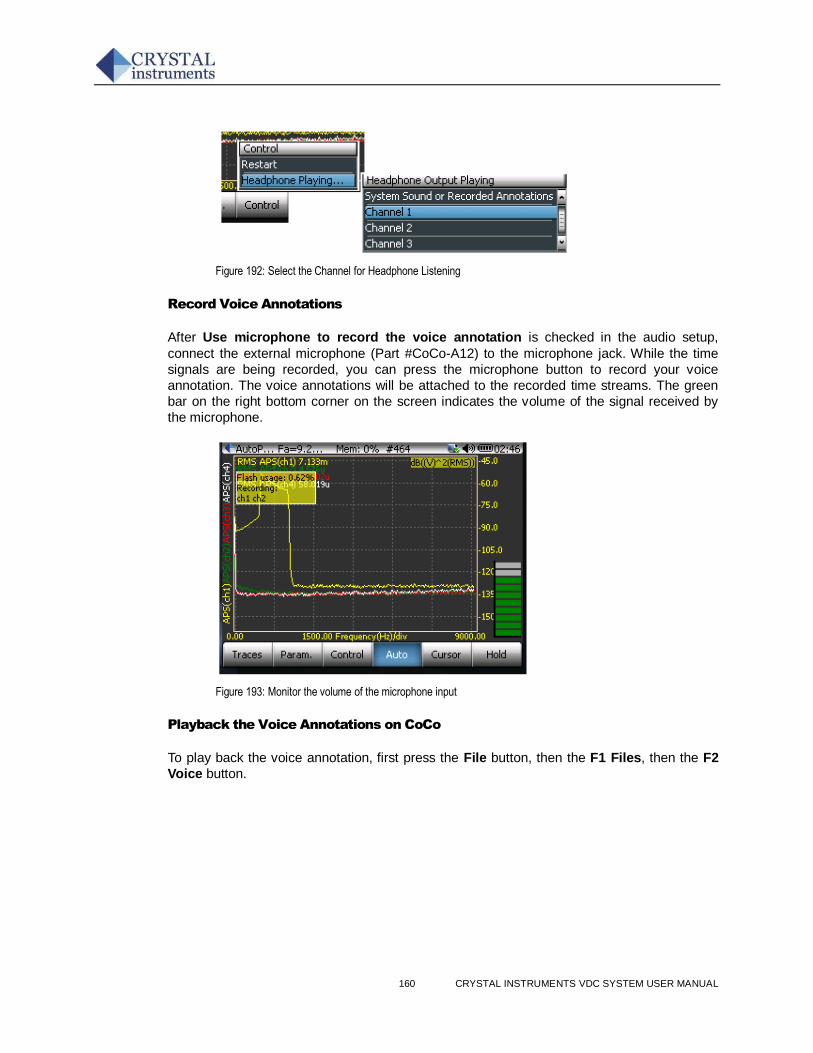
160 CRYSTAL INSTRUMENTS VDC SYSTEM USER MANUAL
Figure 192: Select the Channel for Headphone Listening
Record Voice Annotations
After Use microphone to record the voice annotation is checked in the audio setup,
connect the external microphone (Part #CoCo-A12) to the microphone jack. While the time
signals are being recorded, you can press the microphone button to record your voice
annotation. The voice annotations will be attached to the recorded time streams. The green
bar on the right bottom corner on the screen indicates the volume of the signal received by
the microphone.
Figure 193: Monitor the volume of the microphone input
Playback the Voice Annotations on CoCo
To play back the voice annotation, first press the File button, then the F1 Files, then the F2
Voice button.
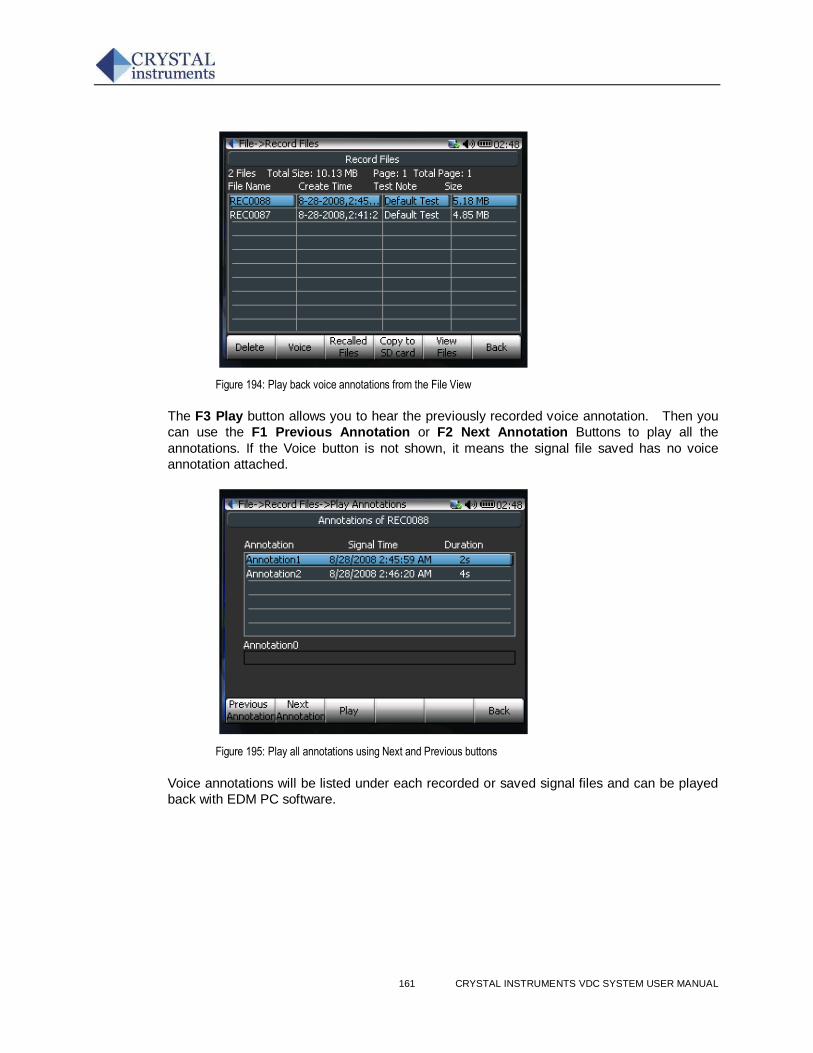
161 CRYSTAL INSTRUMENTS VDC SYSTEM USER MANUAL
Figure 194: Play back voice annotations from the File View
The F3 Play button allows you to hear the previously recorded voice annotation. Then you
can use the F1 Previous Annotation or F2 Next Annotation Buttons to play all the
annotations. If the Voice button is not shown, it means the signal file saved has no voice
annotation attached.
Figure 195: Play all annotations using Next and Previous buttons
Voice annotations will be listed under each recorded or saved signal files and can be played
back with EDM PC software.
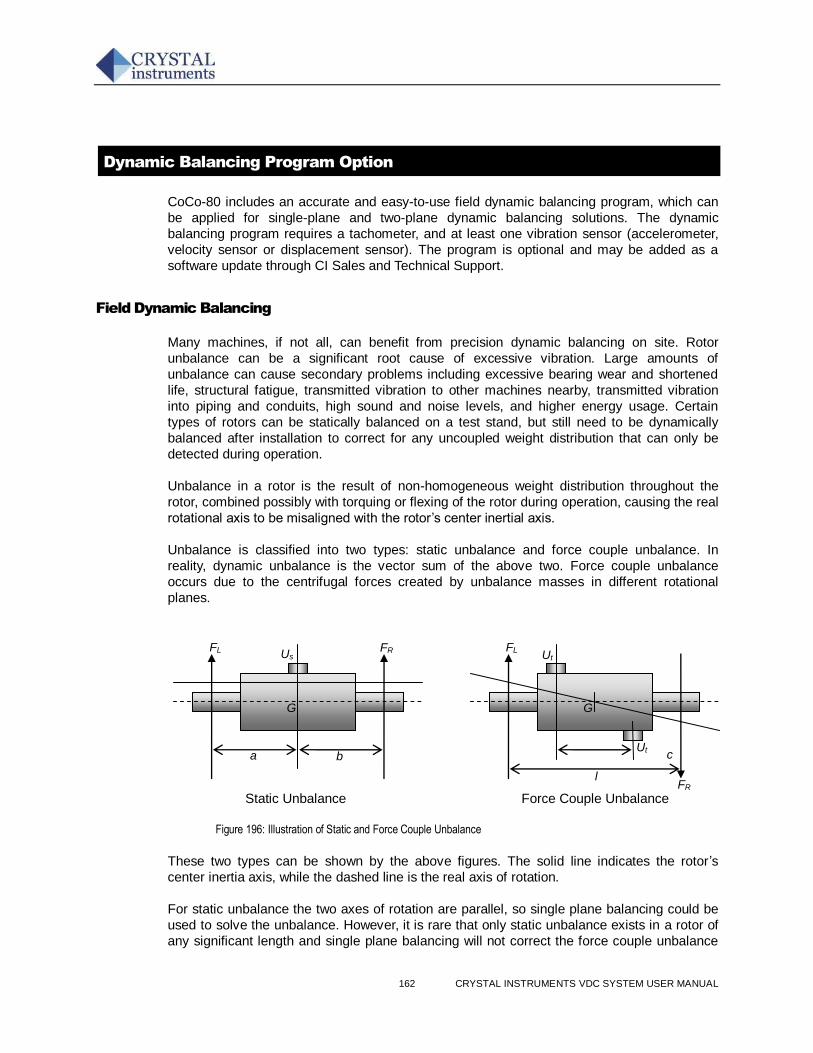
162 CRYSTAL INSTRUMENTS VDC SYSTEM USER MANUAL
Dynamic Balancing Program Option
CoCo-80 includes an accurate and easy-to-use field dynamic balancing program, which can
be applied for single-plane and two-plane dynamic balancing solutions. The dynamic
balancing program requires a tachometer, and at least one vibration sensor (accelerometer,
velocity sensor or displacement sensor). The program is optional and may be added as a
software update through CI Sales and Technical Support.
Field Dynamic Balancing
Many machines, if not all, can benefit from precision dynamic balancing on site. Rotor
unbalance can be a significant root cause of excessive vibration. Large amounts of
unbalance can cause secondary problems including excessive bearing wear and shortened
life, structural fatigue, transmitted vibration to other machines nearby, transmitted vibration
into piping and conduits, high sound and noise levels, and higher energy usage. Certain
types of rotors can be statically balanced on a test stand, but still need to be dynamically
balanced after installation to correct for any uncoupled weight distribution that can only be
detected during operation.
Unbalance in a rotor is the result of non-homogeneous weight distribution throughout the
rotor, combined possibly with torquing or flexing of the rotor during operation, causing the real
rotational axis to be misaligned with the rotor’s center inertial axis.
Unbalance is classified into two types: static unbalance and force couple unbalance. In
reality, dynamic unbalance is the vector sum of the above two. Force couple unbalance
occurs due to the centrifugal forces created by unbalance masses in different rotational
planes.
Figure 196: Illustration of Static and Force Couple Unbalance
These two types can be shown by the above figures. The solid line indicates the rotor’s
center inertia axis, while the dashed line is the real axis of rotation.
For static unbalance the two axes of rotation are parallel, so single plane balancing could be
used to solve the unbalance. However, it is rare that only static unbalance exists in a rotor of
any significant length and single plane balancing will not correct the force couple unbalance
Static Unbalance Force Couple Unbalance
l FR
c
Ut
G
FL
Ut a b
Us FL
G
FR
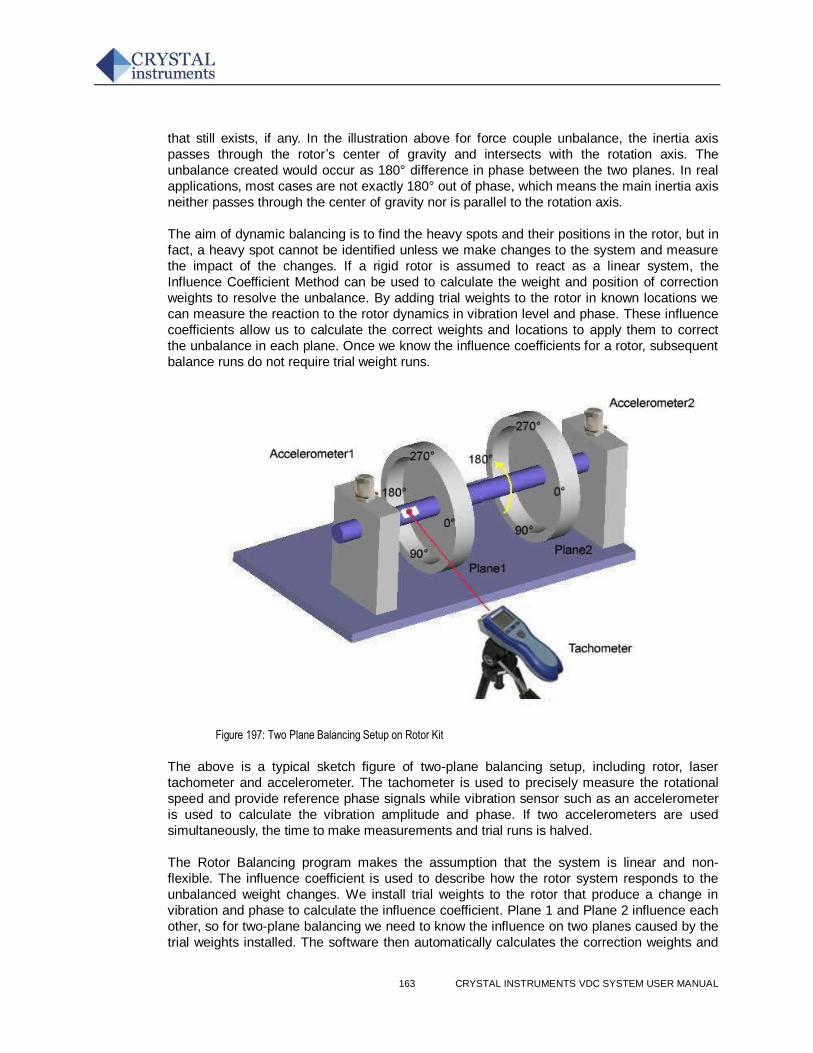
163 CRYSTAL INSTRUMENTS VDC SYSTEM USER MANUAL
that still exists, if any. In the illustration above for force couple unbalance, the inertia axis
passes through the rotor’s center of gravity and intersects with the rotation axis. The
unbalance created would occur as 180° difference in phase between the two planes. In real
applications, most cases are not exactly 180° out of phase, which means the main inertia axis
neither passes through the center of gravity nor is parallel to the rotation axis.
The aim of dynamic balancing is to find the heavy spots and their positions in the rotor, but in
fact, a heavy spot cannot be identified unless we make changes to the system and measure
the impact of the changes. If a rigid rotor is assumed to react as a linear system, the
Influence Coefficient Method can be used to calculate the weight and position of correction
weights to resolve the unbalance. By adding trial weights to the rotor in known locations we
can measure the reaction to the rotor dynamics in vibration level and phase. These influence
coefficients allow us to calculate the correct weights and locations to apply them to correct
the unbalance in each plane. Once we know the influence coefficients for a rotor, subsequent
balance runs do not require trial weight runs.
Figure 197: Two Plane Balancing Setup on Rotor Kit
The above is a typical sketch figure of two-plane balancing setup, including rotor, laser
tachometer and accelerometer. The tachometer is used to precisely measure the rotational
speed and provide reference phase signals while vibration sensor such as an accelerometer
is used to calculate the vibration amplitude and phase. If two accelerometers are used
simultaneously, the time to make measurements and trial runs is halved.
The Rotor Balancing program makes the assumption that the system is linear and non-
flexible. The influence coefficient is used to describe how the rotor system responds to the
unbalanced weight changes. We install trial weights to the rotor that produce a change in
vibration and phase to calculate the influence coefficient. Plane 1 and Plane 2 influence each
other, so for two-plane balancing we need to know the influence on two planes caused by the
trial weights installed. The software then automatically calculates the correction weights and
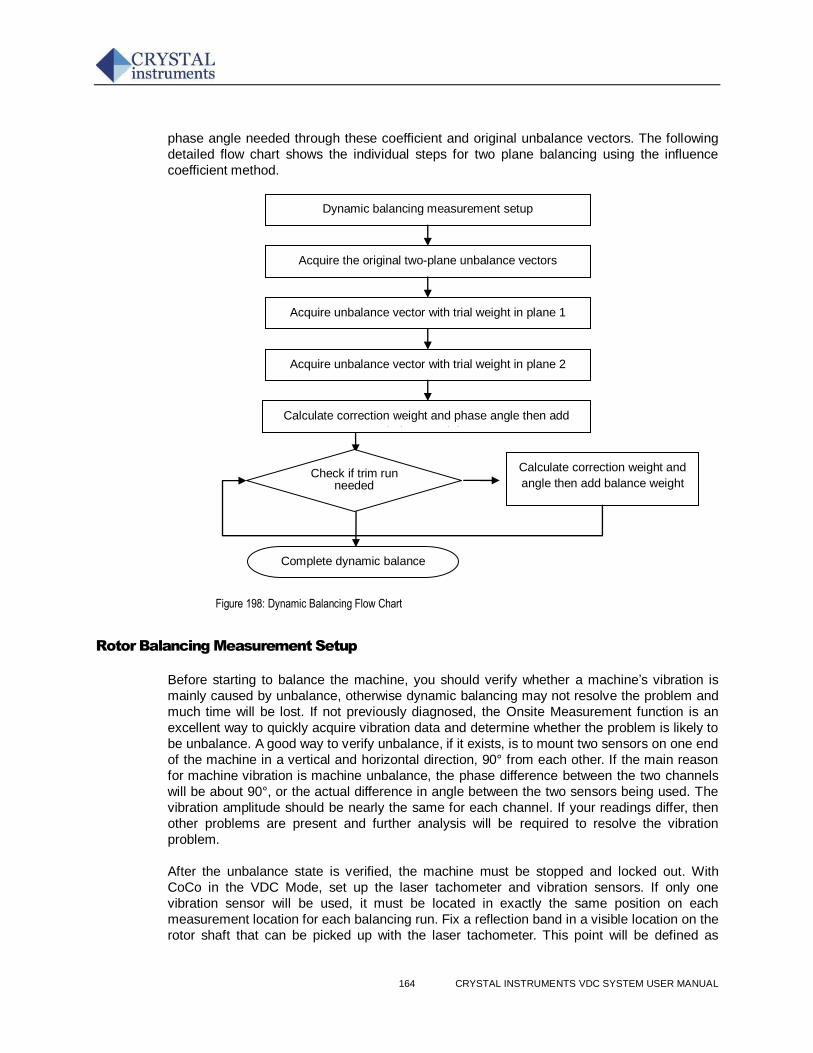
164 CRYSTAL INSTRUMENTS VDC SYSTEM USER MANUAL
phase angle needed through these coefficient and original unbalance vectors. The following
detailed flow chart shows the individual steps for two plane balancing using the influence
coefficient method.
Figure 198: Dynamic Balancing Flow Chart
Rotor Balancing Measurement Setup
Before starting to balance the machine, you should verify whether a machine’s vibration is
mainly caused by unbalance, otherwise dynamic balancing may not resolve the problem and
much time will be lost. If not previously diagnosed, the Onsite Measurement function is an
excellent way to quickly acquire vibration data and determine whether the problem is likely to
be unbalance. A good way to verify unbalance, if it exists, is to mount two sensors on one end
of the machine in a vertical and horizontal direction, 90° from each other. If the main reason
for machine vibration is machine unbalance, the phase difference between the two channels
will be about 90°, or the actual difference in angle between the two sensors being used. The
vibration amplitude should be nearly the same for each channel. If your readings differ, then
other problems are present and further analysis will be required to resolve the vibration
problem.
After the unbalance state is verified, the machine must be stopped and locked out. With
CoCo in the VDC Mode, set up the laser tachometer and vibration sensors. If only one
vibration sensor will be used, it must be located in exactly the same position on each
measurement location for each balancing run. Fix a reflection band in a visible location on the
rotor shaft that can be picked up with the laser tachometer. This point will be defined as
Dynamic balancing measurement setup
Acquire the original two-plane unbalance vectors
Acquire unbalance vector with trial weight in plane 1
Acquire unbalance vector with trial weight in plane 2
Calculate correction weight and phase angle then add
balance weight
Check if trim run
needed
Complete dynamic balance
Calculate correction weight and
angle then add balance weight
Yes
No
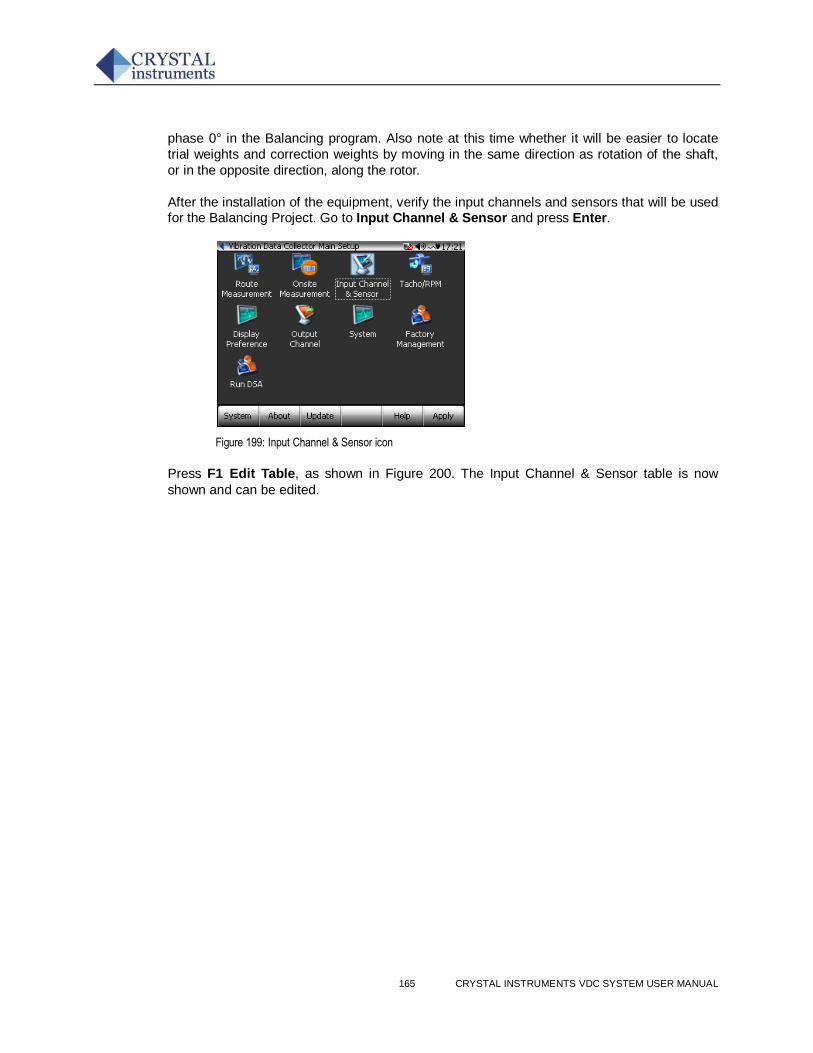
165 CRYSTAL INSTRUMENTS VDC SYSTEM USER MANUAL
phase 0° in the Balancing program. Also note at this time whether it will be easier to locate
trial weights and correction weights by moving in the same direction as rotation of the shaft,
or in the opposite direction, along the rotor.
After the installation of the equipment, verify the input channels and sensors that will be used for the Balancing Project. Go to Input Channel & Sensor and press Enter.
Figure 199: Input Channel & Sensor icon
Press F1 Edit Table, as shown in Figure 200. The Input Channel & Sensor table is now
shown and can be edited.
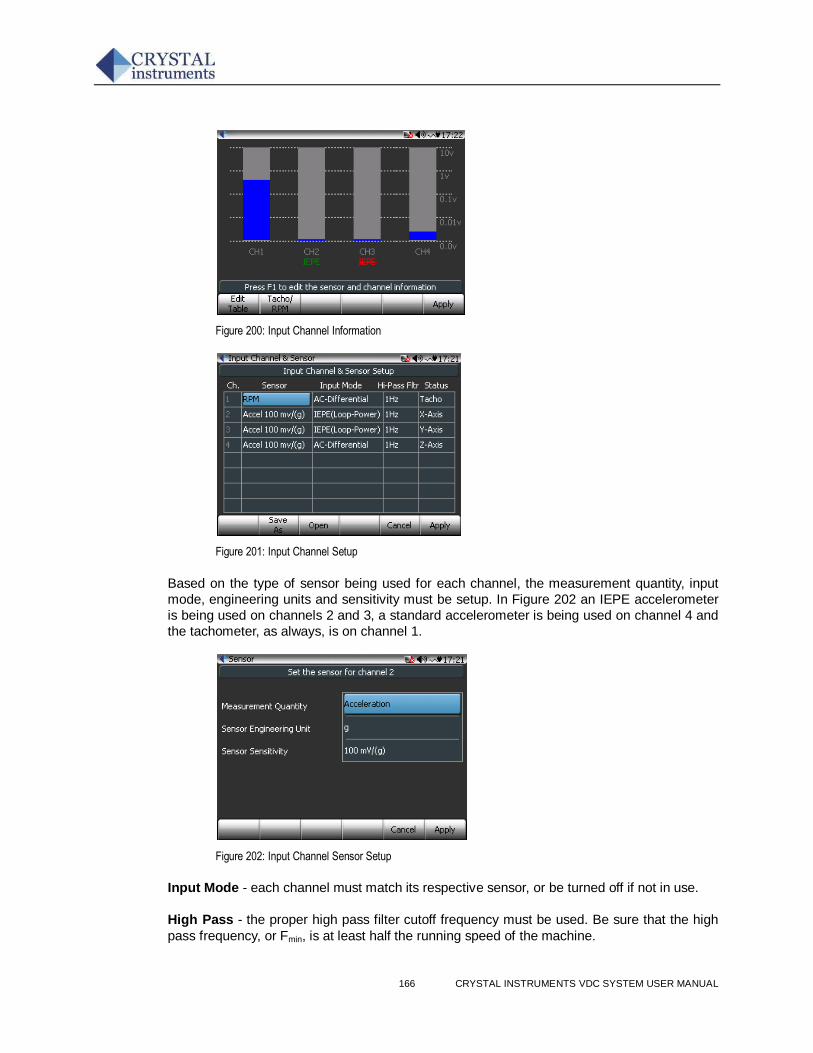
166 CRYSTAL INSTRUMENTS VDC SYSTEM USER MANUAL
Figure 200: Input Channel Information
Figure 201: Input Channel Setup
Based on the type of sensor being used for each channel, the measurement quantity, input
mode, engineering units and sensitivity must be setup. In Figure 202 an IEPE accelerometer
is being used on channels 2 and 3, a standard accelerometer is being used on channel 4 and
the tachometer, as always, is on channel 1.
Figure 202: Input Channel Sensor Setup
Input Mode - each channel must match its respective sensor, or be turned off if not in use.
High Pass - the proper high pass filter cutoff frequency must be used. Be sure that the high
pass frequency, or Fmin, is at least half the running speed of the machine.
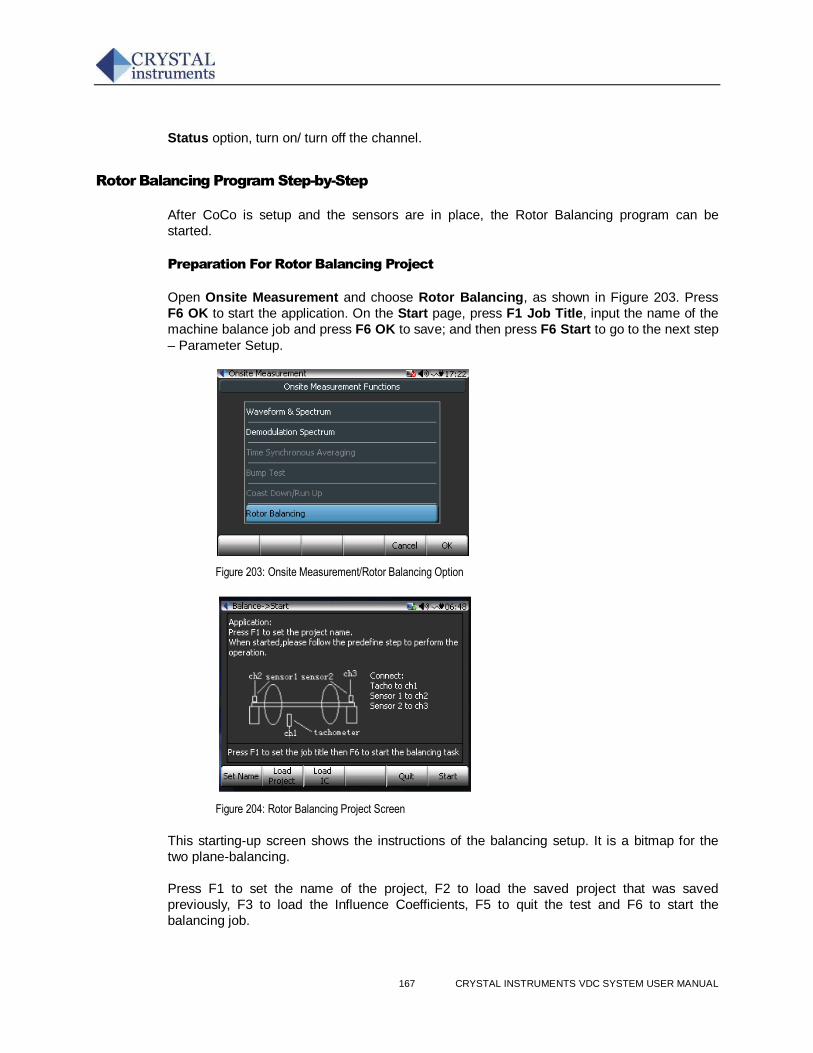
167 CRYSTAL INSTRUMENTS VDC SYSTEM USER MANUAL
Status option, turn on/ turn off the channel.
Rotor Balancing Program Step-by-Step
After CoCo is setup and the sensors are in place, the Rotor Balancing program can be
started.
Preparation For Rotor Balancing Project
Open Onsite Measurement and choose Rotor Balancing, as shown in Figure 203. Press
F6 OK to start the application. On the Start page, press F1 Job Title, input the name of the
machine balance job and press F6 OK to save; and then press F6 Start to go to the next step
– Parameter Setup.
Figure 203: Onsite Measurement/Rotor Balancing Option
Figure 204: Rotor Balancing Project Screen
This starting-up screen shows the instructions of the balancing setup. It is a bitmap for the
two plane-balancing.
Press F1 to set the name of the project, F2 to load the saved project that was saved
previously, F3 to load the Influence Coefficients, F5 to quit the test and F6 to start the
balancing job.
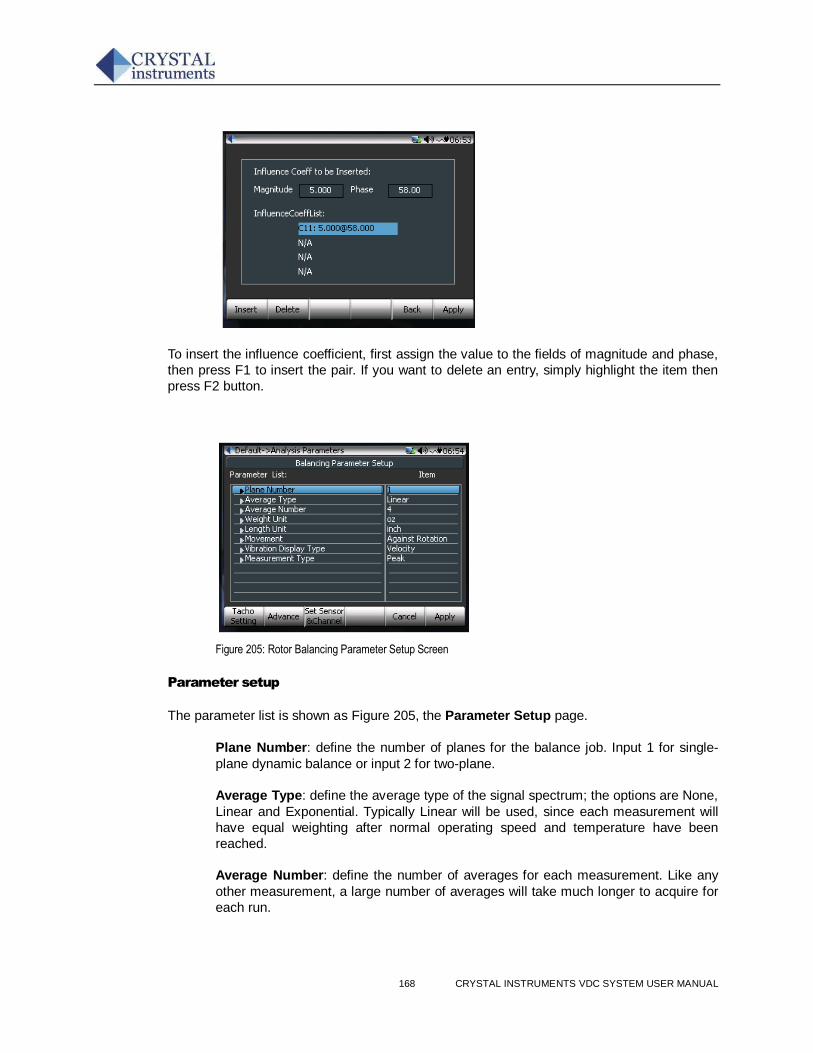
168 CRYSTAL INSTRUMENTS VDC SYSTEM USER MANUAL
To insert the influence coefficient, first assign the value to the fields of magnitude and phase,
then press F1 to insert the pair. If you want to delete an entry, simply highlight the item then
press F2 button.
Figure 205: Rotor Balancing Parameter Setup Screen
Parameter setup
The parameter list is shown as Figure 205, the Parameter Setup page.
Plane Number: define the number of planes for the balance job. Input 1 for single-
plane dynamic balance or input 2 for two-plane.
Average Type: define the average type of the signal spectrum; the options are None,
Linear and Exponential. Typically Linear will be used, since each measurement will
have equal weighting after normal operating speed and temperature have been
reached.
Average Number: define the number of averages for each measurement. Like any
other measurement, a large number of averages will take much longer to acquire for
each run.
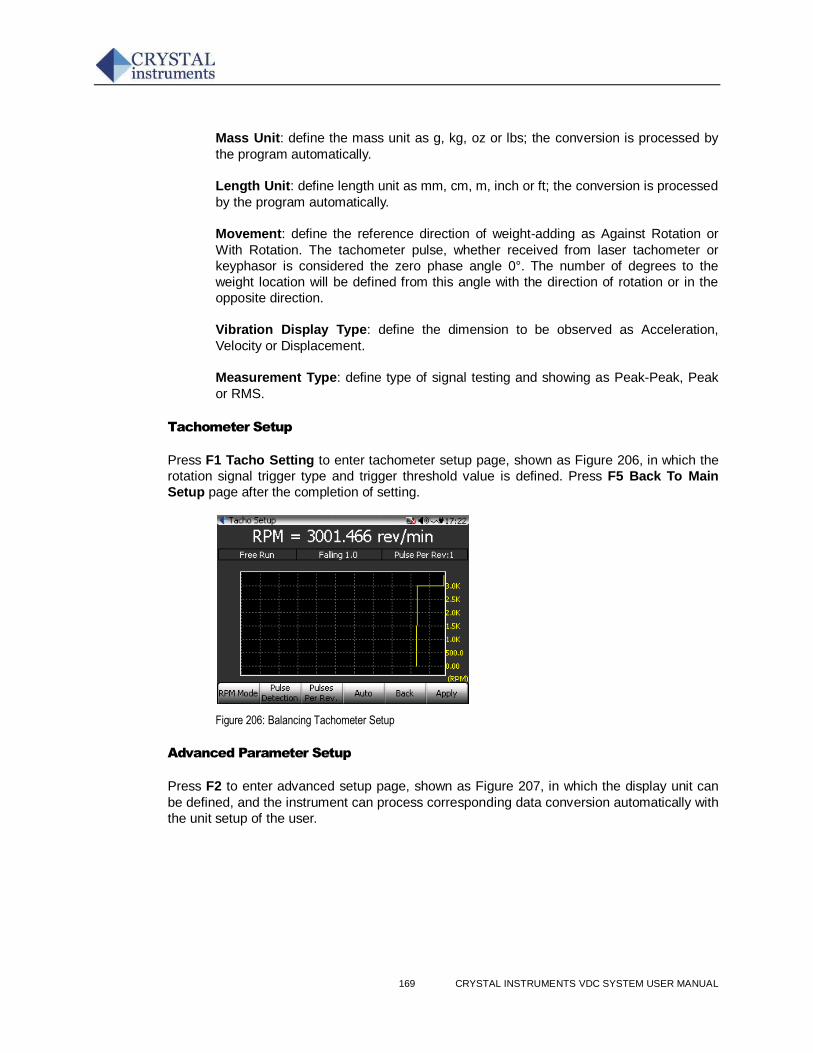
169 CRYSTAL INSTRUMENTS VDC SYSTEM USER MANUAL
Mass Unit: define the mass unit as g, kg, oz or lbs; the conversion is processed by
the program automatically.
Length Unit: define length unit as mm, cm, m, inch or ft; the conversion is processed
by the program automatically.
Movement: define the reference direction of weight-adding as Against Rotation or
With Rotation. The tachometer pulse, whether received from laser tachometer or
keyphasor is considered the zero phase angle 0°. The number of degrees to the
weight location will be defined from this angle with the direction of rotation or in the
opposite direction.
Vibration Display Type: define the dimension to be observed as Acceleration,
Velocity or Displacement.
Measurement Type: define type of signal testing and showing as Peak-Peak, Peak
or RMS.
Tachometer Setup
Press F1 Tacho Setting to enter tachometer setup page, shown as Figure 206, in which the
rotation signal trigger type and trigger threshold value is defined. Press F5 Back To Main
Setup page after the completion of setting.
Figure 206: Balancing Tachometer Setup
Advanced Parameter Setup
Press F2 to enter advanced setup page, shown as Figure 207, in which the display unit can
be defined, and the instrument can process corresponding data conversion automatically with
the unit setup of the user.
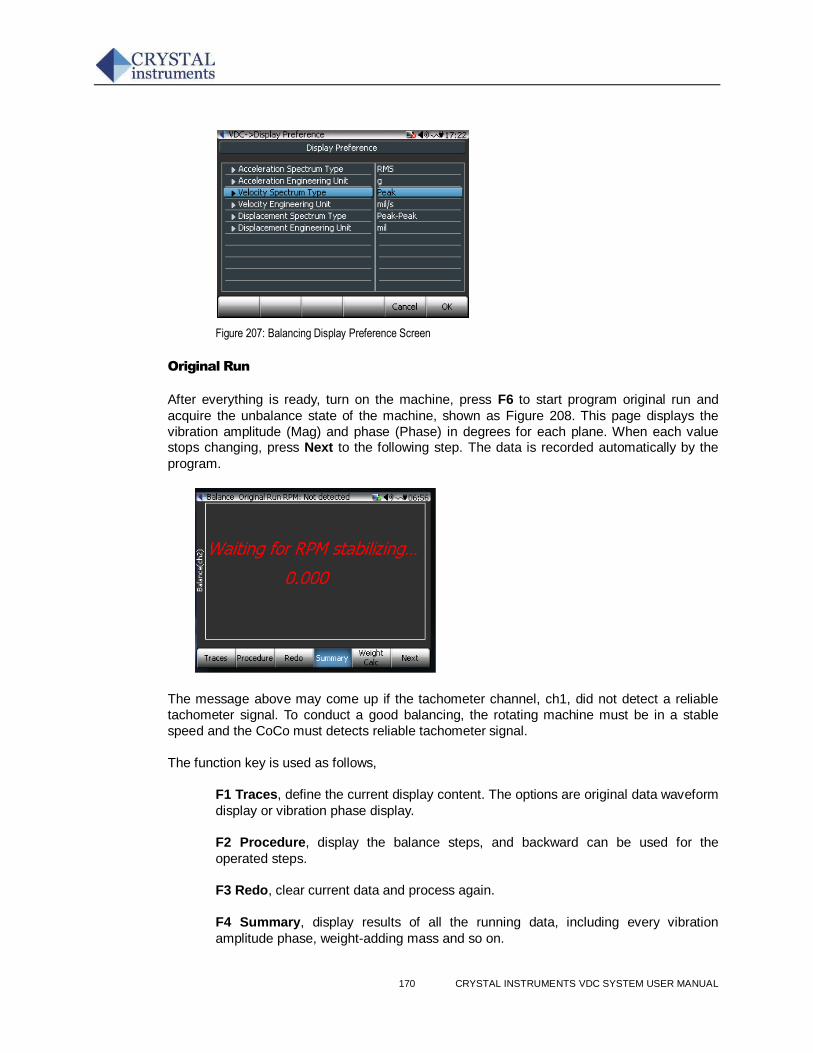
170 CRYSTAL INSTRUMENTS VDC SYSTEM USER MANUAL
Figure 207: Balancing Display Preference Screen
Original Run
After everything is ready, turn on the machine, press F6 to start program original run and
acquire the unbalance state of the machine, shown as Figure 208. This page displays the
vibration amplitude (Mag) and phase (Phase) in degrees for each plane. When each value stops changing, press Next to the following step. The data is recorded automatically by the
program.
The message above may come up if the tachometer channel, ch1, did not detect a reliable
tachometer signal. To conduct a good balancing, the rotating machine must be in a stable
speed and the CoCo must detects reliable tachometer signal.
The function key is used as follows,
F1 Traces, define the current display content. The options are original data waveform
display or vibration phase display.
F2 Procedure, display the balance steps, and backward can be used for the
operated steps.
F3 Redo, clear current data and process again.
F4 Summary, display results of all the running data, including every vibration
amplitude phase, weight-adding mass and so on.
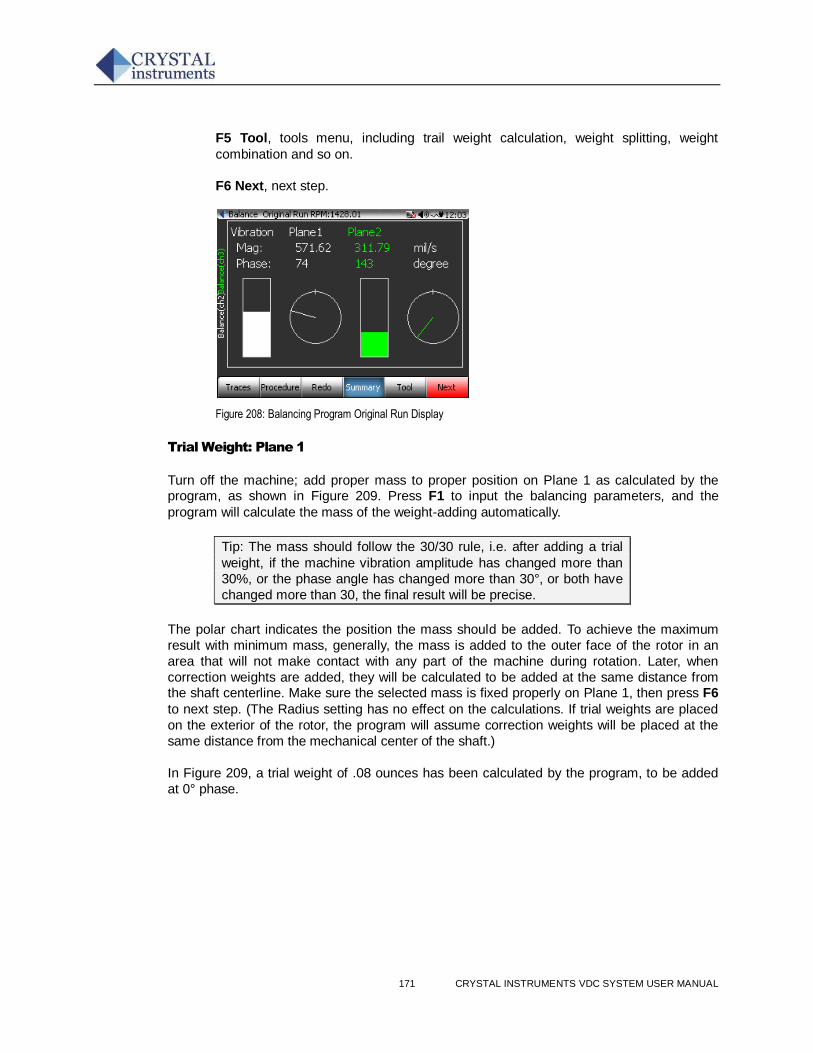
171 CRYSTAL INSTRUMENTS VDC SYSTEM USER MANUAL
F5 Tool, tools menu, including trail weight calculation, weight splitting, weight
combination and so on.
F6 Next, next step.
Figure 208: Balancing Program Original Run Display
Trial Weight: Plane 1
Turn off the machine; add proper mass to proper position on Plane 1 as calculated by the program, as shown in Figure 209. Press F1 to input the balancing parameters, and the
program will calculate the mass of the weight-adding automatically.
Tip: The mass should follow the 30/30 rule, i.e. after adding a trial
weight, if the machine vibration amplitude has changed more than
30%, or the phase angle has changed more than 30°, or both have
changed more than 30, the final result will be precise.
The polar chart indicates the position the mass should be added. To achieve the maximum
result with minimum mass, generally, the mass is added to the outer face of the rotor in an
area that will not make contact with any part of the machine during rotation. Later, when
correction weights are added, they will be calculated to be added at the same distance from the shaft centerline. Make sure the selected mass is fixed properly on Plane 1, then press F6
to next step. (The Radius setting has no effect on the calculations. If trial weights are placed
on the exterior of the rotor, the program will assume correction weights will be placed at the
same distance from the mechanical center of the shaft.)
In Figure 209, a trial weight of .08 ounces has been calculated by the program, to be added
at 0° phase.
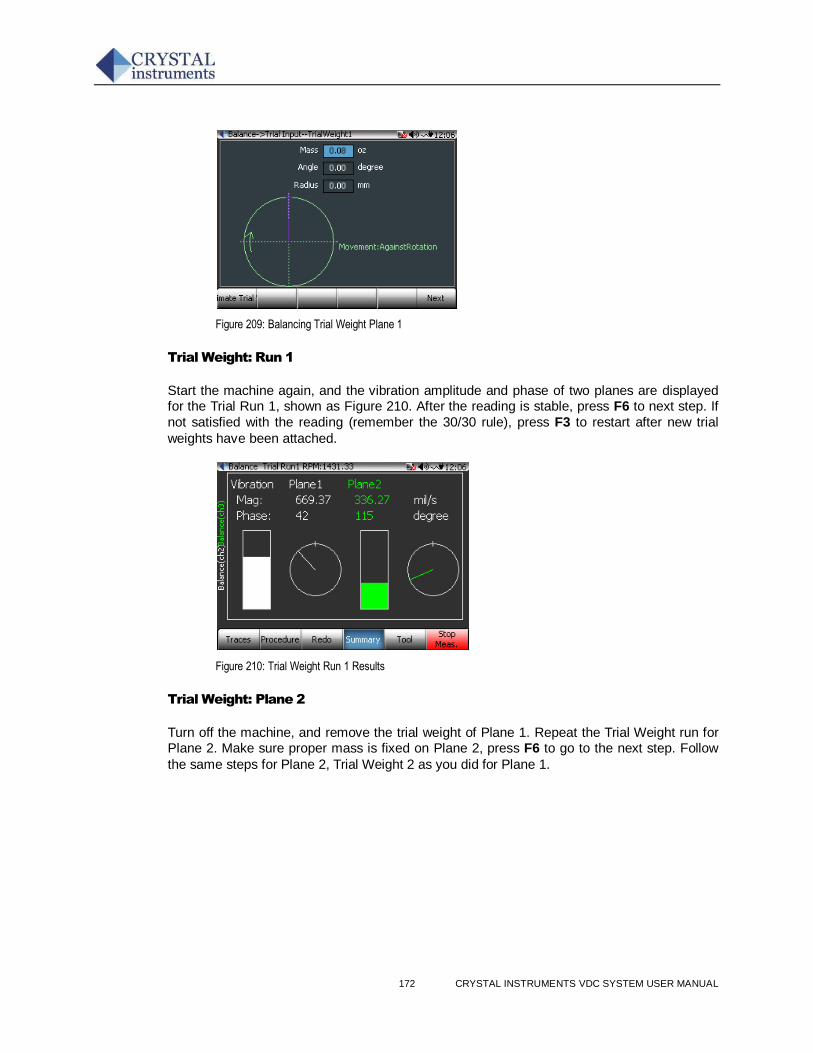
172 CRYSTAL INSTRUMENTS VDC SYSTEM USER MANUAL
Figure 209: Balancing Trial Weight Plane 1
Trial Weight: Run 1
Start the machine again, and the vibration amplitude and phase of two planes are displayed for the Trial Run 1, shown as Figure 210. After the reading is stable, press F6 to next step. If
not satisfied with the reading (remember the 30/30 rule), press F3 to restart after new trial
weights have been attached.
Figure 210: Trial Weight Run 1 Results
Trial Weight: Plane 2
Turn off the machine, and remove the trial weight of Plane 1. Repeat the Trial Weight run for Plane 2. Make sure proper mass is fixed on Plane 2, press F6 to go to the next step. Follow
the same steps for Plane 2, Trial Weight 2 as you did for Plane 1.
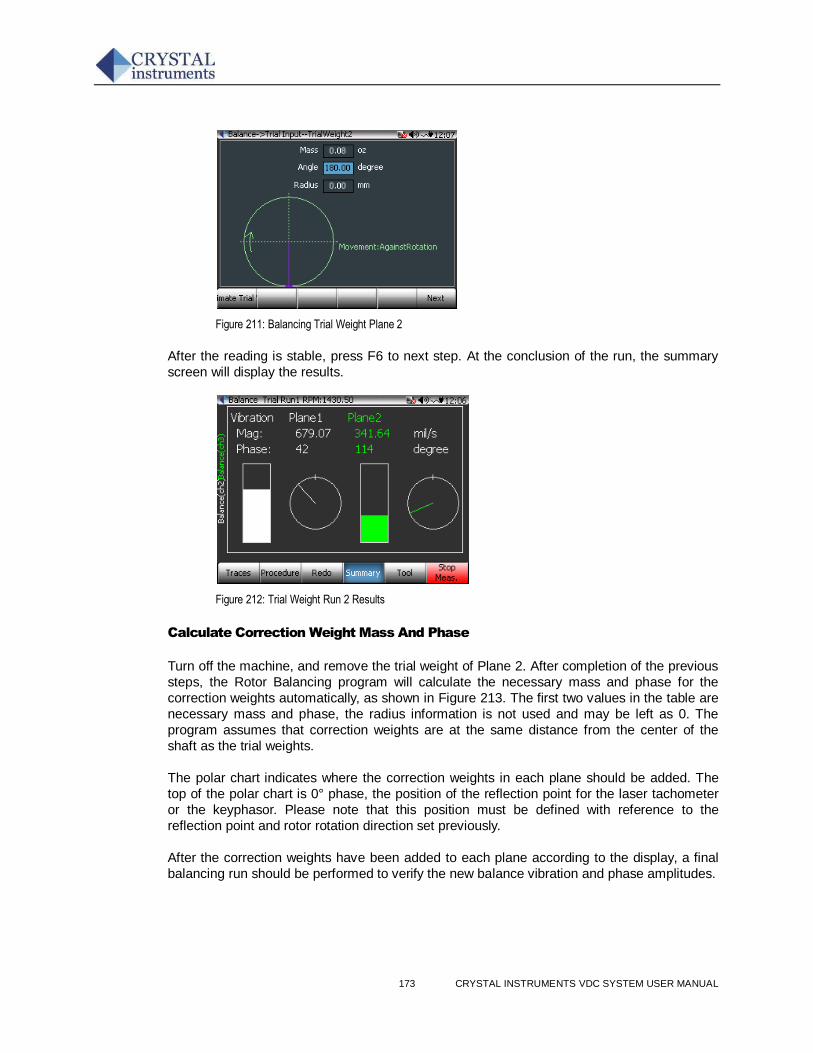
173 CRYSTAL INSTRUMENTS VDC SYSTEM USER MANUAL
Figure 211: Balancing Trial Weight Plane 2
After the reading is stable, press F6 to next step. At the conclusion of the run, the summary
screen will display the results.
Figure 212: Trial Weight Run 2 Results
Calculate Correction Weight Mass And Phase
Turn off the machine, and remove the trial weight of Plane 2. After completion of the previous
steps, the Rotor Balancing program will calculate the necessary mass and phase for the
correction weights automatically, as shown in Figure 213. The first two values in the table are
necessary mass and phase, the radius information is not used and may be left as 0. The
program assumes that correction weights are at the same distance from the center of the
shaft as the trial weights.
The polar chart indicates where the correction weights in each plane should be added. The
top of the polar chart is 0° phase, the position of the reflection point for the laser tachometer
or the keyphasor. Please note that this position must be defined with reference to the
reflection point and rotor rotation direction set previously.
After the correction weights have been added to each plane according to the display, a final
balancing run should be performed to verify the new balance vibration and phase amplitudes.
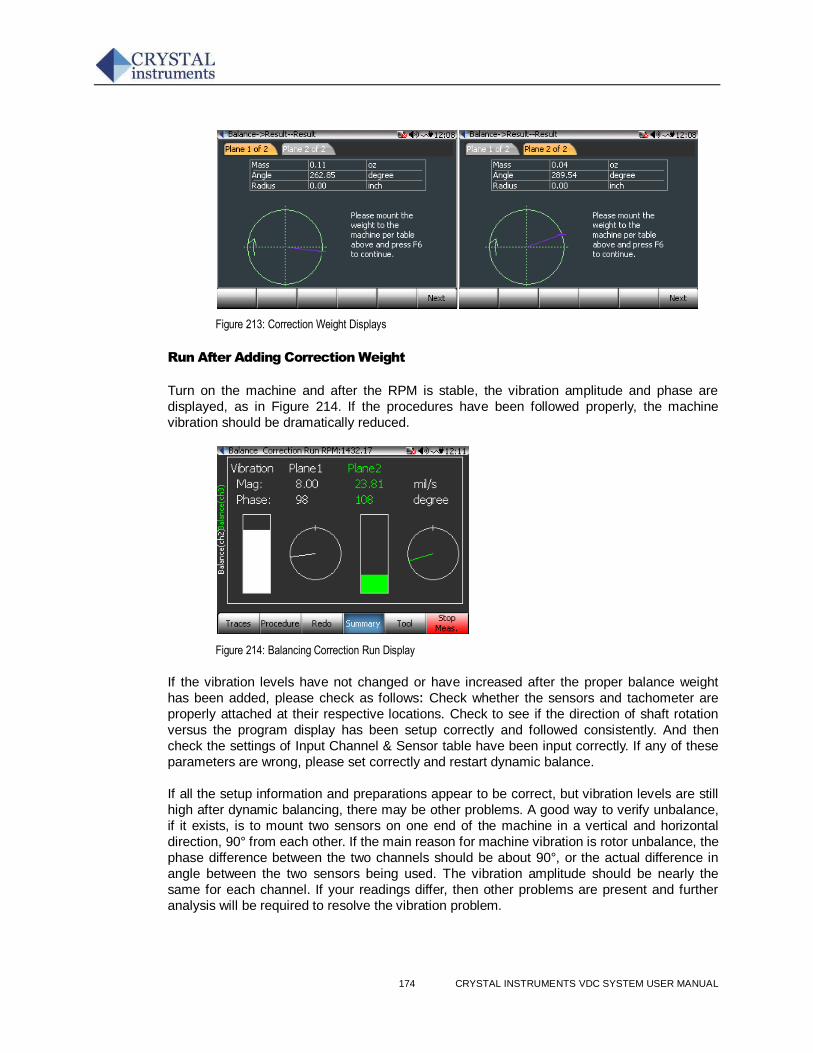
174 CRYSTAL INSTRUMENTS VDC SYSTEM USER MANUAL
Figure 213: Correction Weight Displays
Run After Adding Correction Weight
Turn on the machine and after the RPM is stable, the vibration amplitude and phase are
displayed, as in Figure 214. If the procedures have been followed properly, the machine
vibration should be dramatically reduced.
Figure 214: Balancing Correction Run Display
If the vibration levels have not changed or have increased after the proper balance weight
has been added, please check as follows: Check whether the sensors and tachometer are
properly attached at their respective locations. Check to see if the direction of shaft rotation
versus the program display has been setup correctly and followed consistently. And then
check the settings of Input Channel & Sensor table have been input correctly. If any of these
parameters are wrong, please set correctly and restart dynamic balance.
If all the setup information and preparations appear to be correct, but vibration levels are still
high after dynamic balancing, there may be other problems. A good way to verify unbalance,
if it exists, is to mount two sensors on one end of the machine in a vertical and horizontal
direction, 90° from each other. If the main reason for machine vibration is rotor unbalance, the
phase difference between the two channels should be about 90°, or the actual difference in
angle between the two sensors being used. The vibration amplitude should be nearly the
same for each channel. If your readings differ, then other problems are present and further
analysis will be required to resolve the vibration problem.
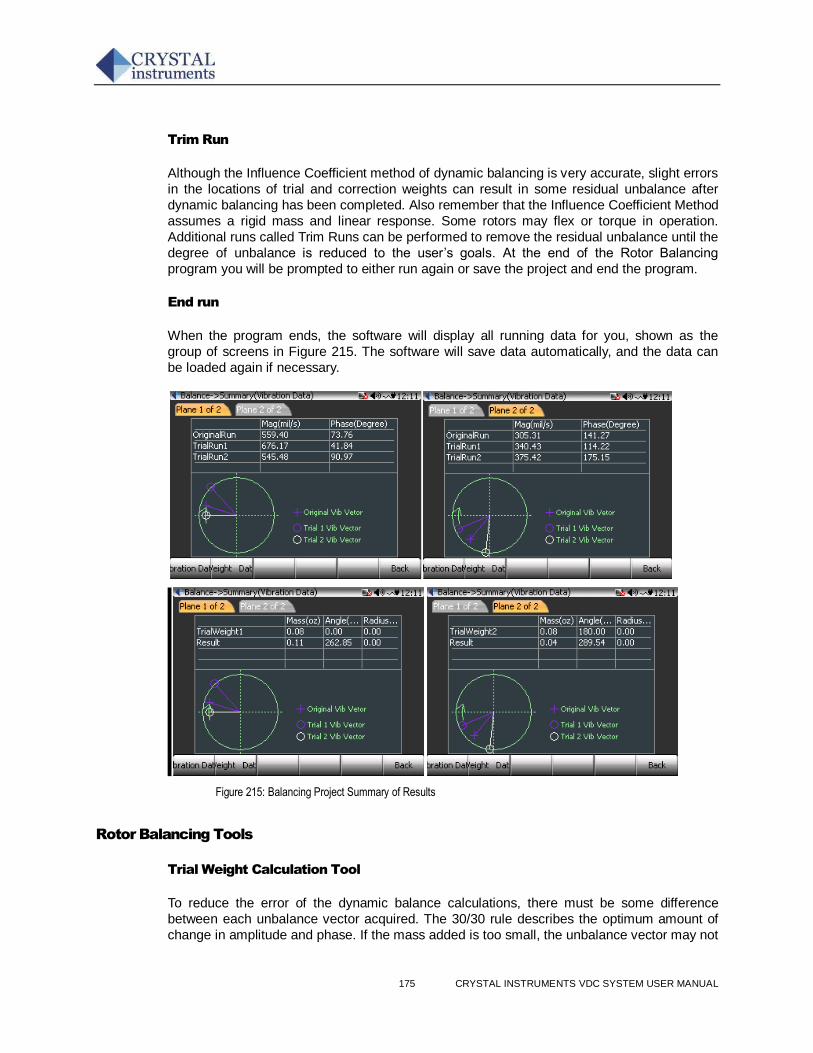
175 CRYSTAL INSTRUMENTS VDC SYSTEM USER MANUAL
Trim Run
Although the Influence Coefficient method of dynamic balancing is very accurate, slight errors
in the locations of trial and correction weights can result in some residual unbalance after
dynamic balancing has been completed. Also remember that the Influence Coefficient Method
assumes a rigid mass and linear response. Some rotors may flex or torque in operation.
Additional runs called Trim Runs can be performed to remove the residual unbalance until the
degree of unbalance is reduced to the user’s goals. At the end of the Rotor Balancing
program you will be prompted to either run again or save the project and end the program.
End run
When the program ends, the software will display all running data for you, shown as the
group of screens in Figure 215. The software will save data automatically, and the data can
be loaded again if necessary.
Figure 215: Balancing Project Summary of Results
Rotor Balancing Tools
Trial Weight Calculation Tool
To reduce the error of the dynamic balance calculations, there must be some difference
between each unbalance vector acquired. The 30/30 rule describes the optimum amount of
change in amplitude and phase. If the mass added is too small, the unbalance vector may not
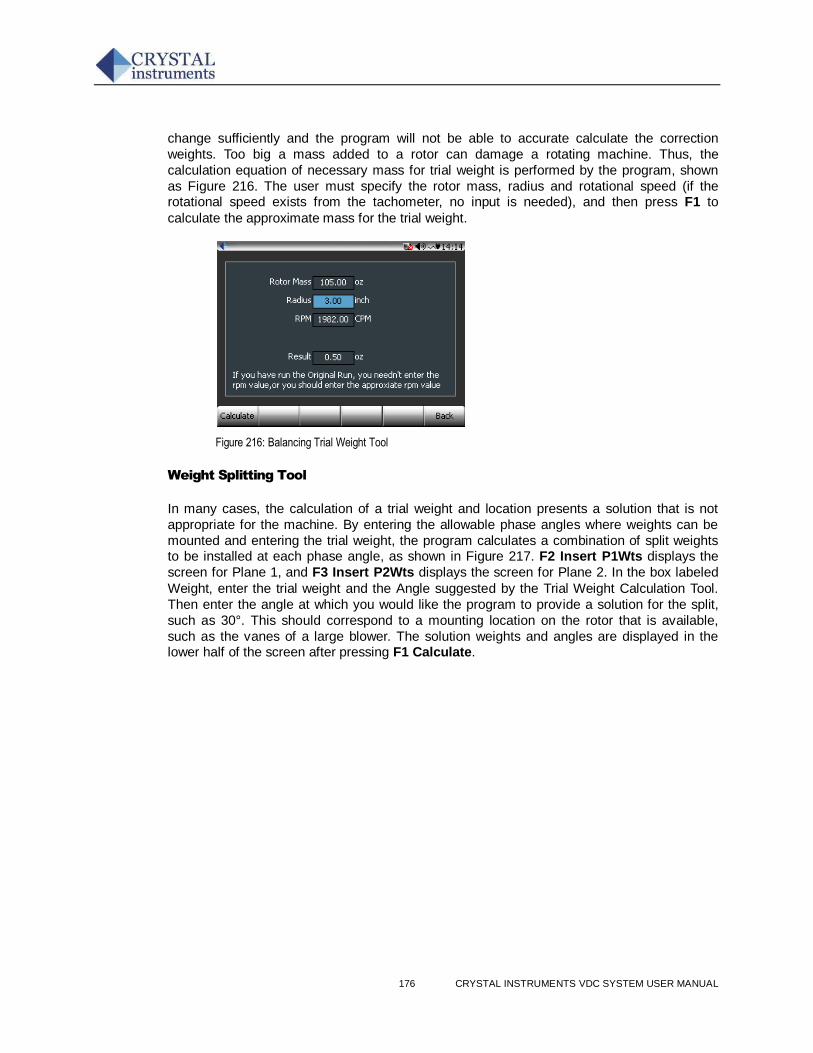
176 CRYSTAL INSTRUMENTS VDC SYSTEM USER MANUAL
change sufficiently and the program will not be able to accurate calculate the correction
weights. Too big a mass added to a rotor can damage a rotating machine. Thus, the
calculation equation of necessary mass for trial weight is performed by the program, shown
as Figure 216. The user must specify the rotor mass, radius and rotational speed (if the rotational speed exists from the tachometer, no input is needed), and then press F1 to
calculate the approximate mass for the trial weight.
Figure 216: Balancing Trial Weight Tool
Weight Splitting Tool
In many cases, the calculation of a trial weight and location presents a solution that is not
appropriate for the machine. By entering the allowable phase angles where weights can be
mounted and entering the trial weight, the program calculates a combination of split weights to be installed at each phase angle, as shown in Figure 217. F2 Insert P1Wts displays the
screen for Plane 1, and F3 Insert P2Wts displays the screen for Plane 2. In the box labeled
Weight, enter the trial weight and the Angle suggested by the Trial Weight Calculation Tool.
Then enter the angle at which you would like the program to provide a solution for the split,
such as 30°. This should correspond to a mounting location on the rotor that is available,
such as the vanes of a large blower. The solution weights and angles are displayed in the lower half of the screen after pressing F1 Calculate.
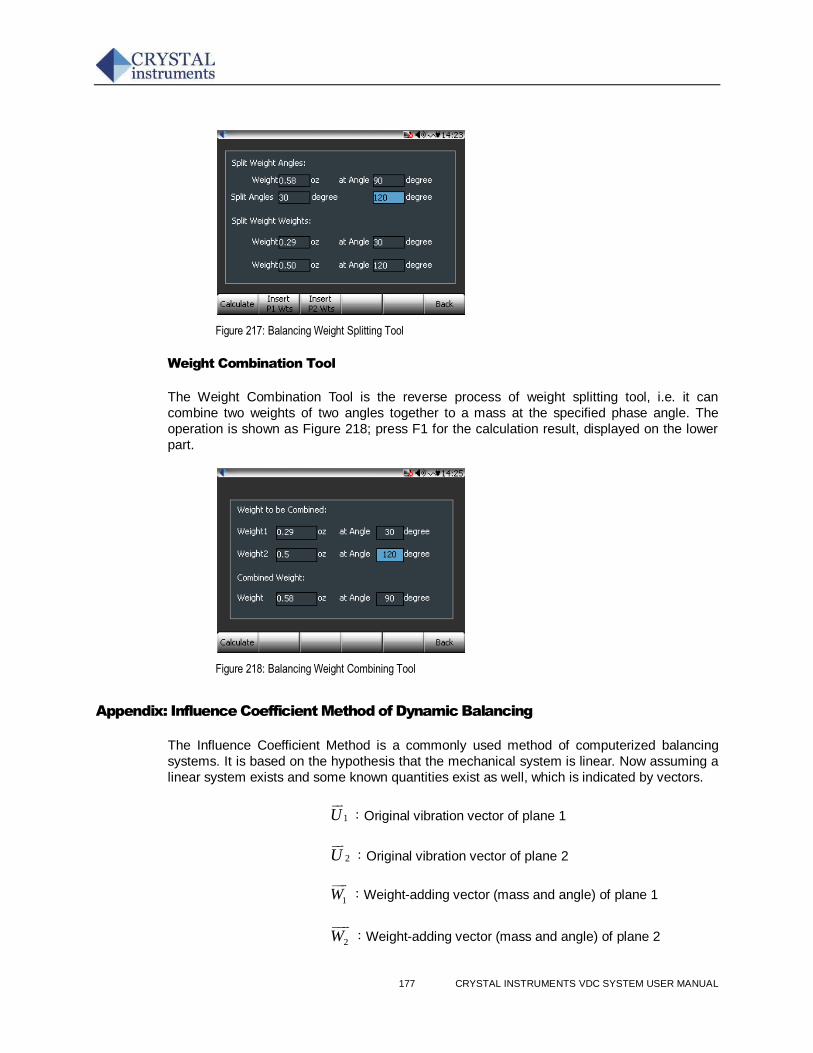
177 CRYSTAL INSTRUMENTS VDC SYSTEM USER MANUAL
Figure 217: Balancing Weight Splitting Tool
Weight Combination Tool
The Weight Combination Tool is the reverse process of weight splitting tool, i.e. it can
combine two weights of two angles together to a mass at the specified phase angle. The
operation is shown as Figure 218; press F1 for the calculation result, displayed on the lower
part.
Figure 218: Balancing Weight Combining Tool
Appendix: Influence Coefficient Method of Dynamic Balancing
The Influence Coefficient Method is a commonly used method of computerized balancing
systems. It is based on the hypothesis that the mechanical system is linear. Now assuming a
linear system exists and some known quantities exist as well, which is indicated by vectors.
1U
:Original vibration vector of plane 1
2U
:Original vibration vector of plane 2
1W
:Weight-adding vector (mass and angle) of plane 1
2W
:Weight-adding vector (mass and angle) of plane 2
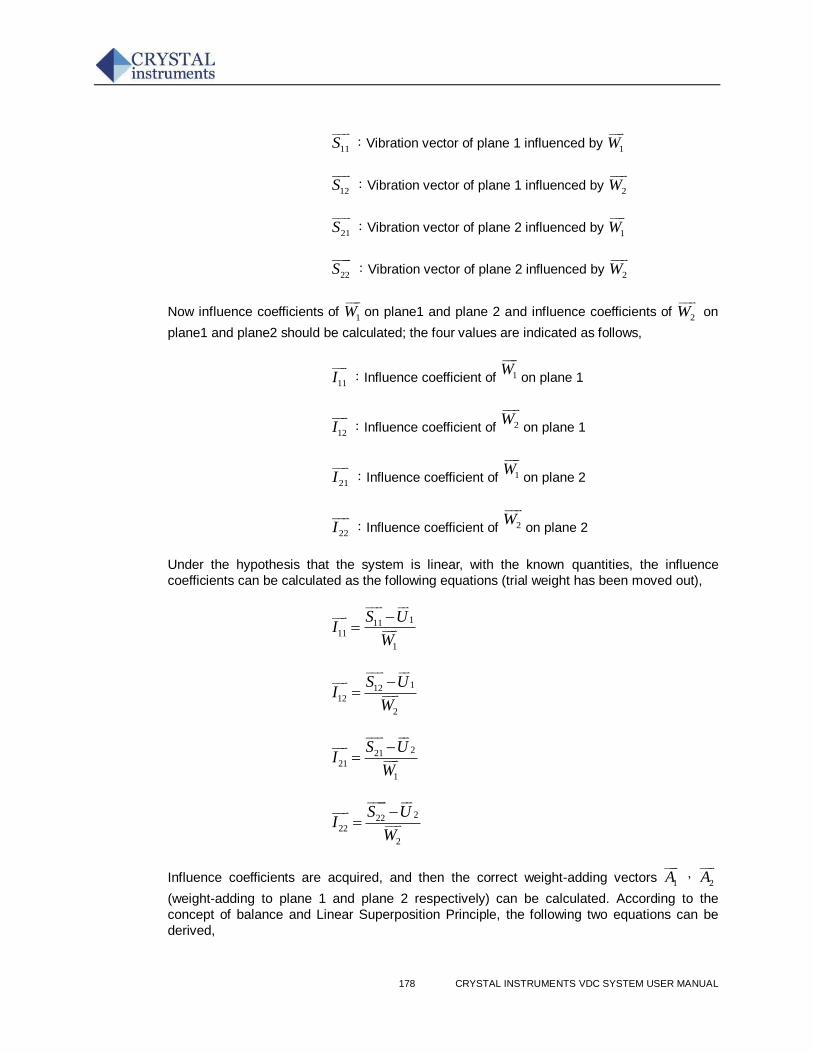
178 CRYSTAL INSTRUMENTS VDC SYSTEM USER MANUAL
11S
:Vibration vector of plane 1 influenced by 1W
12S
:Vibration vector of plane 1 influenced by 2W
21S
:Vibration vector of plane 2 influenced by 1W
22S
:Vibration vector of plane 2 influenced by 2W
Now influence coefficients of 1W
on plane1 and plane 2 and influence coefficients of
2W
on
plane1 and plane2 should be calculated; the four values are indicated as follows,
11I
:Influence coefficient of 1W
on plane 1
12I
:Influence coefficient of 2W
on plane 1
21I
:Influence coefficient of 1W
on plane 2
22I
:Influence coefficient of 2W
on plane 2
Under the hypothesis that the system is linear, with the known quantities, the influence
coefficients can be calculated as the following equations (trial weight has been moved out),
11111
1
S UI
W
11212
2
S UI
W
22121
1
S UI
W
22222
2
S UI
W
Influence coefficients are acquired, and then the correct weight-adding vectors 1A
, 2A
(weight-adding to plane 1 and plane 2 respectively) can be calculated. According to the
concept of balance and Linear Superposition Principle, the following two equations can be
derived,
179 CRYSTAL INSTRUMENTS VDC SYSTEM USER MANUAL
111 1 12 2 0I A I A U
221 1 22 2 0I A I A U
The meaning of these two equations is the vibration after weight-adding should balance the
original vibration. This is a binary linear equation, so according to equation solution theory,
1A
,2A
can be solved, which are the mass and angle of weight-adding.
Appendix 1: Dynamic Signal Analysis in Vibration Data Collector
The CoCo-80/90 provides two different user interfaces for Dynamic Signal Analyzer and
Vibration Data Collector. The style and settings are different to meet industrial conventions.
The user has the choice to enter one of the interfaces when system is powered on. The VDC
user interface is specifically designed for fast data collection operation and ease of use. A
professional user focused on research and development can open and use the DSA functions
instead of that of VDC. This section explains in detail about how the signals are processed
when CoCo runs in the VDC mode.
CoCo uses various different technologies of digital signal processing. Among them, the most
fundamental and popular technology is based on the Fast Fourier Transform (FFT). The FFT
transforms time domain signals into the frequency domain. To perform FFT-based
measurements, however, it helps to understand the fundamental issues and computations
involved. This Appendix describes some of the basic signal analysis computations, discusses
anti-aliasing and acquisition front end for FFT-based signal analysis, explains how to use
windowing functions correctly, explains some spectrum computations, and shows you how to
use FFT-based functions for some typical measurements. Users should be aware of the
subtle differences between a traditional dynamic signal analyzer and a vibration data collector
even though they all employ the same signal processing theory.
General Theory of Spectral Analysis
Time Domain Waveform
A typical time waveform signal in analog form from the sensor, such as an accelerometer,
velocimeter or displacement probe, could take an appearance like that shown in the following
picture.
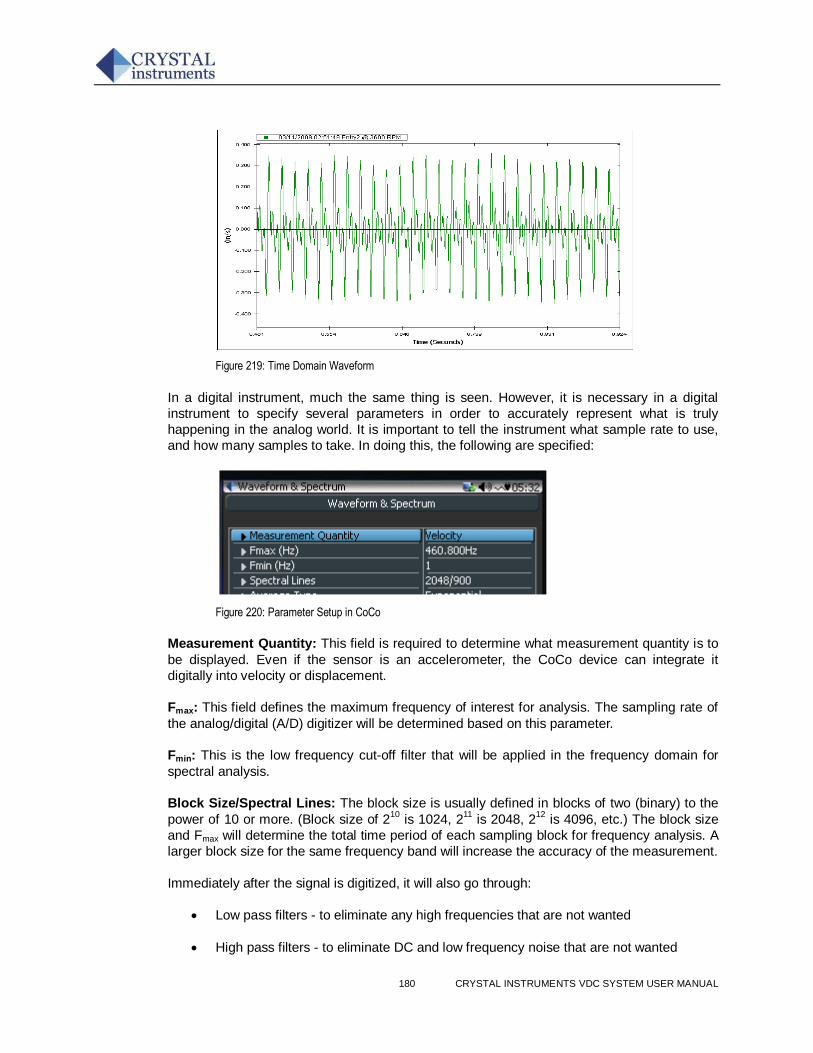
180 CRYSTAL INSTRUMENTS VDC SYSTEM USER MANUAL
Figure 219: Time Domain Waveform
In a digital instrument, much the same thing is seen. However, it is necessary in a digital
instrument to specify several parameters in order to accurately represent what is truly
happening in the analog world. It is important to tell the instrument what sample rate to use,
and how many samples to take. In doing this, the following are specified:
Figure 220: Parameter Setup in CoCo
Measurement Quantity: This field is required to determine what measurement quantity is to
be displayed. Even if the sensor is an accelerometer, the CoCo device can integrate it
digitally into velocity or displacement.
Fmax: This field defines the maximum frequency of interest for analysis. The sampling rate of
the analog/digital (A/D) digitizer will be determined based on this parameter.
Fmin: This is the low frequency cut-off filter that will be applied in the frequency domain for
spectral analysis.
Block Size/Spectral Lines: The block size is usually defined in blocks of two (binary) to the
power of 10 or more. (Block size of 210
is 1024, 211
is 2048, 212
is 4096, etc.) The block size
and Fmax will determine the total time period of each sampling block for frequency analysis. A
larger block size for the same frequency band will increase the accuracy of the measurement.
Immediately after the signal is digitized, it will also go through:
Low pass filters - to eliminate any high frequencies that are not wanted
High pass filters - to eliminate DC and low frequency noise that are not wanted
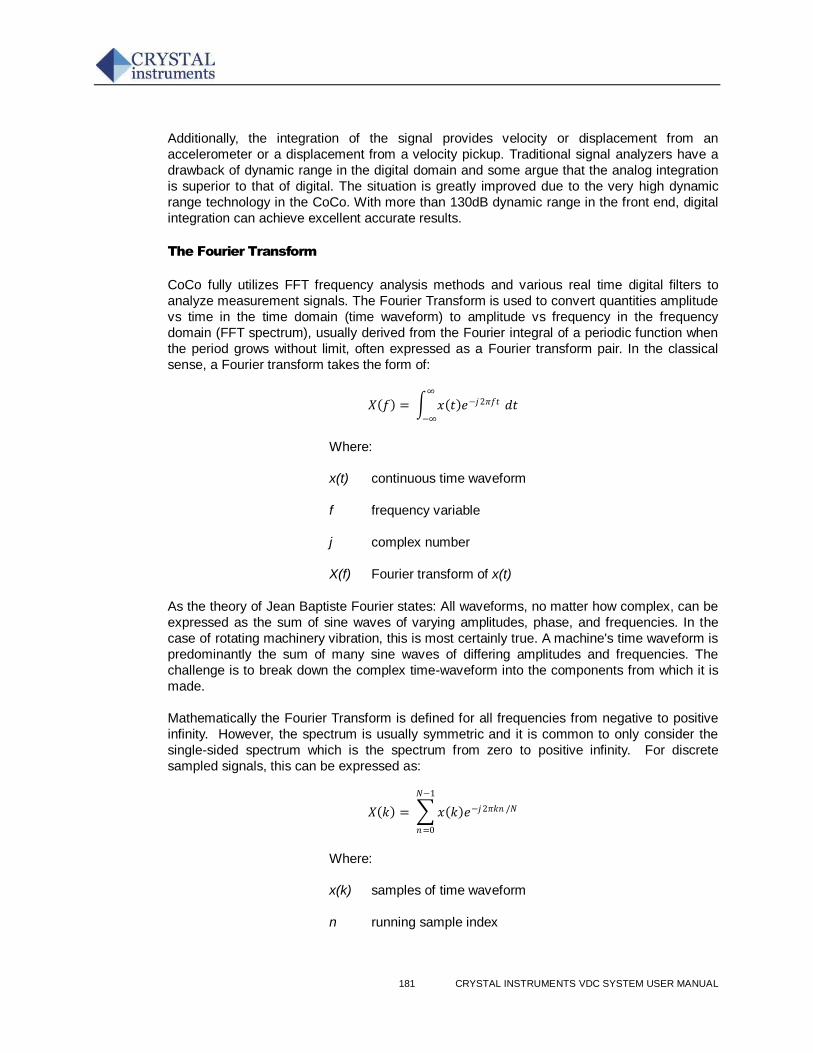
181 CRYSTAL INSTRUMENTS VDC SYSTEM USER MANUAL
Additionally, the integration of the signal provides velocity or displacement from an
accelerometer or a displacement from a velocity pickup. Traditional signal analyzers have a
drawback of dynamic range in the digital domain and some argue that the analog integration
is superior to that of digital. The situation is greatly improved due to the very high dynamic
range technology in the CoCo. With more than 130dB dynamic range in the front end, digital
integration can achieve excellent accurate results.
The Fourier Transform
CoCo fully utilizes FFT frequency analysis methods and various real time digital filters to
analyze measurement signals. The Fourier Transform is used to convert quantities amplitude
vs time in the time domain (time waveform) to amplitude vs frequency in the frequency
domain (FFT spectrum), usually derived from the Fourier integral of a periodic function when
the period grows without limit, often expressed as a Fourier transform pair. In the classical
sense, a Fourier transform takes the form of:
𝑋 𝑓 = 𝑥 𝑡 𝑒−𝑗2𝜋𝑓𝑡 𝑑𝑡∞
−∞
Where:
x(t) continuous time waveform
f frequency variable
j complex number
X(f) Fourier transform of x(t)
As the theory of Jean Baptiste Fourier states: All waveforms, no matter how complex, can be
expressed as the sum of sine waves of varying amplitudes, phase, and frequencies. In the
case of rotating machinery vibration, this is most certainly true. A machine's time waveform is
predominantly the sum of many sine waves of differing amplitudes and frequencies. The
challenge is to break down the complex time-waveform into the components from which it is
made.
Mathematically the Fourier Transform is defined for all frequencies from negative to positive
infinity. However, the spectrum is usually symmetric and it is common to only consider the
single-sided spectrum which is the spectrum from zero to positive infinity. For discrete
sampled signals, this can be expressed as:
𝑋 𝑘 = 𝑥 𝑘 𝑒−𝑗2𝜋𝑘𝑛 /𝑁
𝑁−1
𝑛=0
Where:
x(k) samples of time waveform
n running sample index
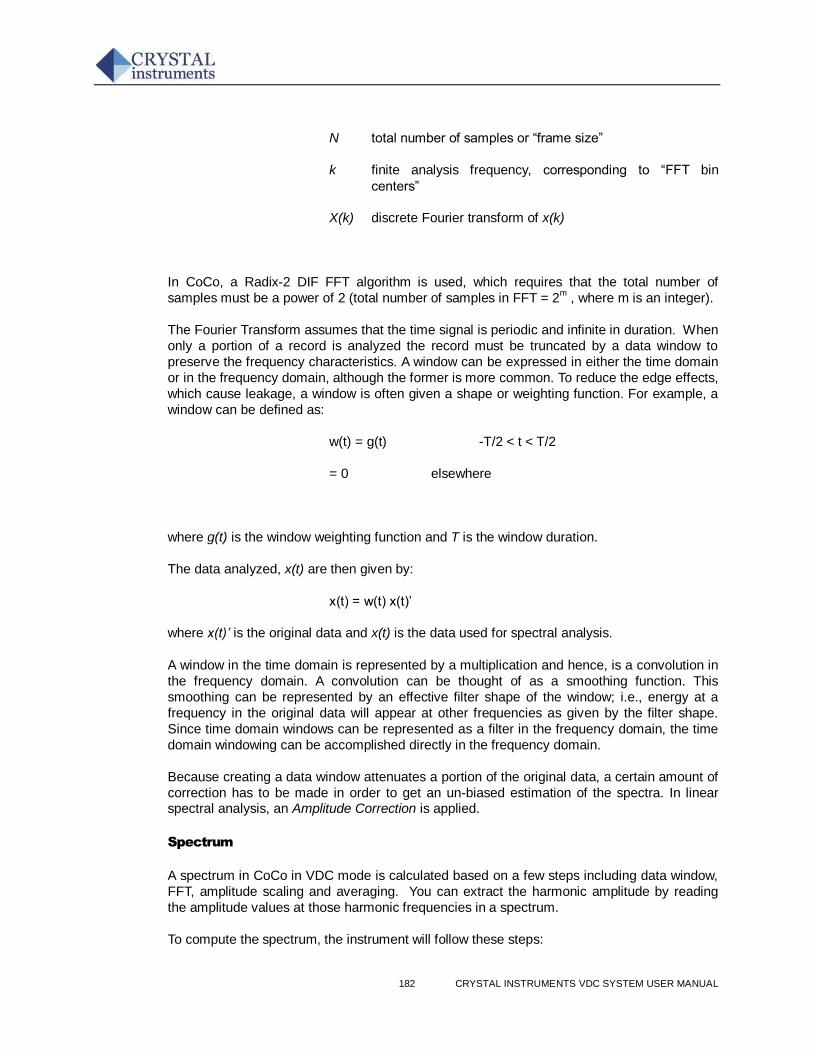
182 CRYSTAL INSTRUMENTS VDC SYSTEM USER MANUAL
N total number of samples or “frame size”
k finite analysis frequency, corresponding to “FFT bin
centers”
X(k) discrete Fourier transform of x(k)
In CoCo, a Radix-2 DIF FFT algorithm is used, which requires that the total number of
samples must be a power of 2 (total number of samples in FFT = 2m , where m is an integer).
The Fourier Transform assumes that the time signal is periodic and infinite in duration. When
only a portion of a record is analyzed the record must be truncated by a data window to
preserve the frequency characteristics. A window can be expressed in either the time domain
or in the frequency domain, although the former is more common. To reduce the edge effects,
which cause leakage, a window is often given a shape or weighting function. For example, a
window can be defined as:
w(t) = g(t) -T/2 < t < T/2
= 0 elsewhere
where g(t) is the window weighting function and T is the window duration.
The data analyzed, x(t) are then given by:
x(t) = w(t) x(t)’
where x(t)’ is the original data and x(t) is the data used for spectral analysis.
A window in the time domain is represented by a multiplication and hence, is a convolution in
the frequency domain. A convolution can be thought of as a smoothing function. This
smoothing can be represented by an effective filter shape of the window; i.e., energy at a
frequency in the original data will appear at other frequencies as given by the filter shape.
Since time domain windows can be represented as a filter in the frequency domain, the time
domain windowing can be accomplished directly in the frequency domain.
Because creating a data window attenuates a portion of the original data, a certain amount of
correction has to be made in order to get an un-biased estimation of the spectra. In linear spectral analysis, an Amplitude Correction is applied.
Spectrum
A spectrum in CoCo in VDC mode is calculated based on a few steps including data window,
FFT, amplitude scaling and averaging. You can extract the harmonic amplitude by reading
the amplitude values at those harmonic frequencies in a spectrum.
To compute the spectrum, the instrument will follow these steps:
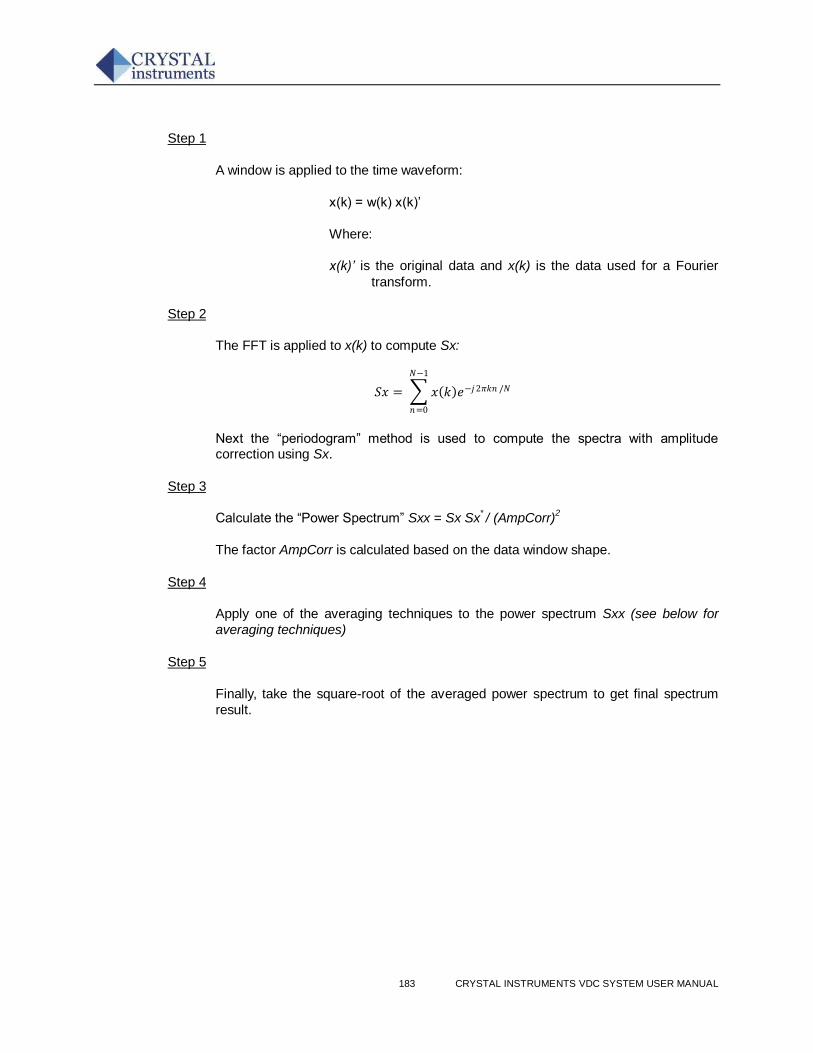
183 CRYSTAL INSTRUMENTS VDC SYSTEM USER MANUAL
Step 1
A window is applied to the time waveform:
x(k) = w(k) x(k)’
Where:
x(k)’ is the original data and x(k) is the data used for a Fourier
transform.
Step 2
The FFT is applied to x(k) to compute Sx:
𝑆𝑥 = 𝑥 𝑘 𝑒−𝑗2𝜋𝑘𝑛 /𝑁
𝑁−1
𝑛=0
Next the “periodogram” method is used to compute the spectra with amplitude correction using Sx.
Step 3
Calculate the “Power Spectrum” Sxx = Sx Sx* / (AmpCorr)
2
The factor AmpCorr is calculated based on the data window shape.
Step 4
Apply one of the averaging techniques to the power spectrum Sxx (see below for
averaging techniques)
Step 5
Finally, take the square-root of the averaged power spectrum to get final spectrum
result.
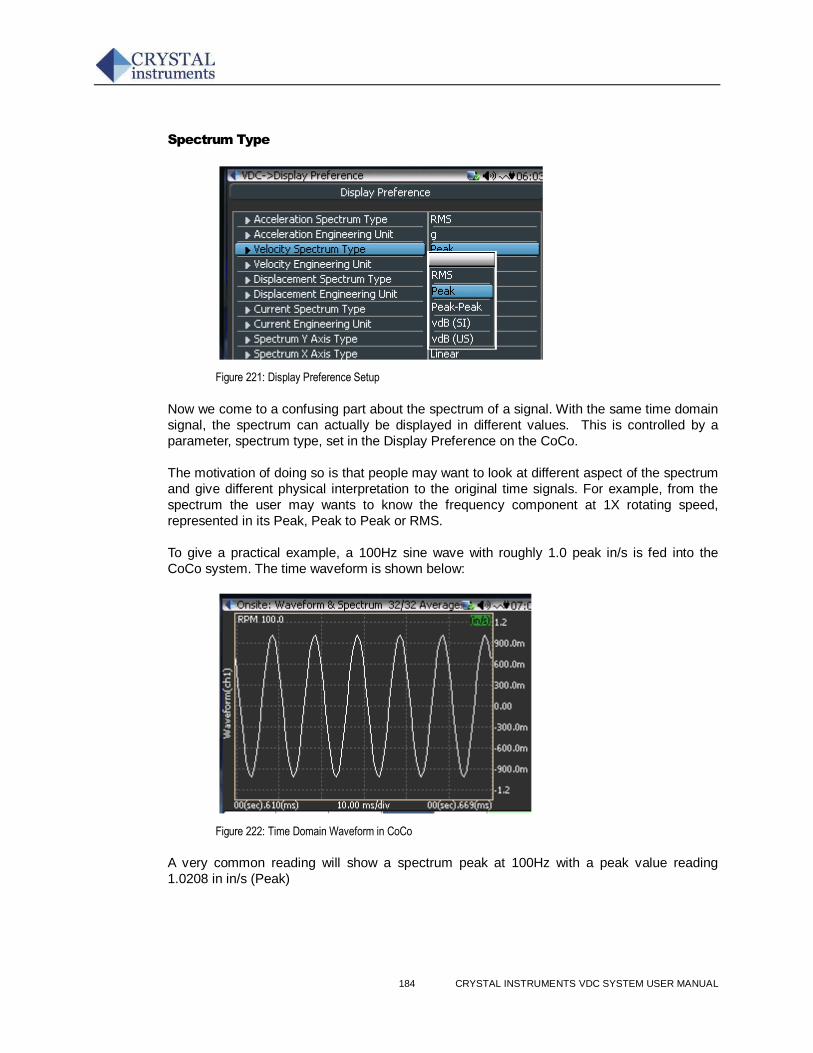
184 CRYSTAL INSTRUMENTS VDC SYSTEM USER MANUAL
Spectrum Type
Figure 221: Display Preference Setup
Now we come to a confusing part about the spectrum of a signal. With the same time domain
signal, the spectrum can actually be displayed in different values. This is controlled by a
parameter, spectrum type, set in the Display Preference on the CoCo.
The motivation of doing so is that people may want to look at different aspect of the spectrum
and give different physical interpretation to the original time signals. For example, from the
spectrum the user may wants to know the frequency component at 1X rotating speed,
represented in its Peak, Peak to Peak or RMS.
To give a practical example, a 100Hz sine wave with roughly 1.0 peak in/s is fed into the
CoCo system. The time waveform is shown below:
Figure 222: Time Domain Waveform in CoCo
A very common reading will show a spectrum peak at 100Hz with a peak value reading
1.0208 in in/s (Peak)
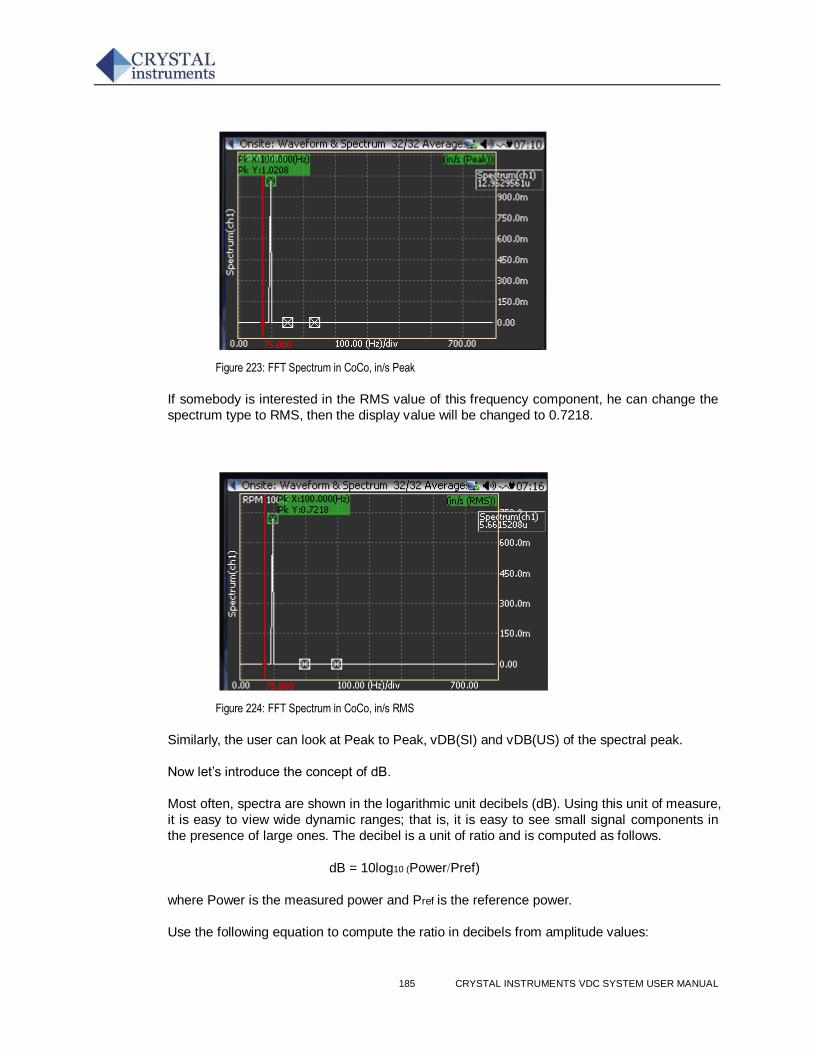
185 CRYSTAL INSTRUMENTS VDC SYSTEM USER MANUAL
Figure 223: FFT Spectrum in CoCo, in/s Peak
If somebody is interested in the RMS value of this frequency component, he can change the
spectrum type to RMS, then the display value will be changed to 0.7218.
Figure 224: FFT Spectrum in CoCo, in/s RMS
Similarly, the user can look at Peak to Peak, vDB(SI) and vDB(US) of the spectral peak.
Now let’s introduce the concept of dB.
Most often, spectra are shown in the logarithmic unit decibels (dB). Using this unit of measure,
it is easy to view wide dynamic ranges; that is, it is easy to see small signal components in
the presence of large ones. The decibel is a unit of ratio and is computed as follows.
dB = 10log10 (PowerPref)
where Power is the measured power and Pref is the reference power.
Use the following equation to compute the ratio in decibels from amplitude values:
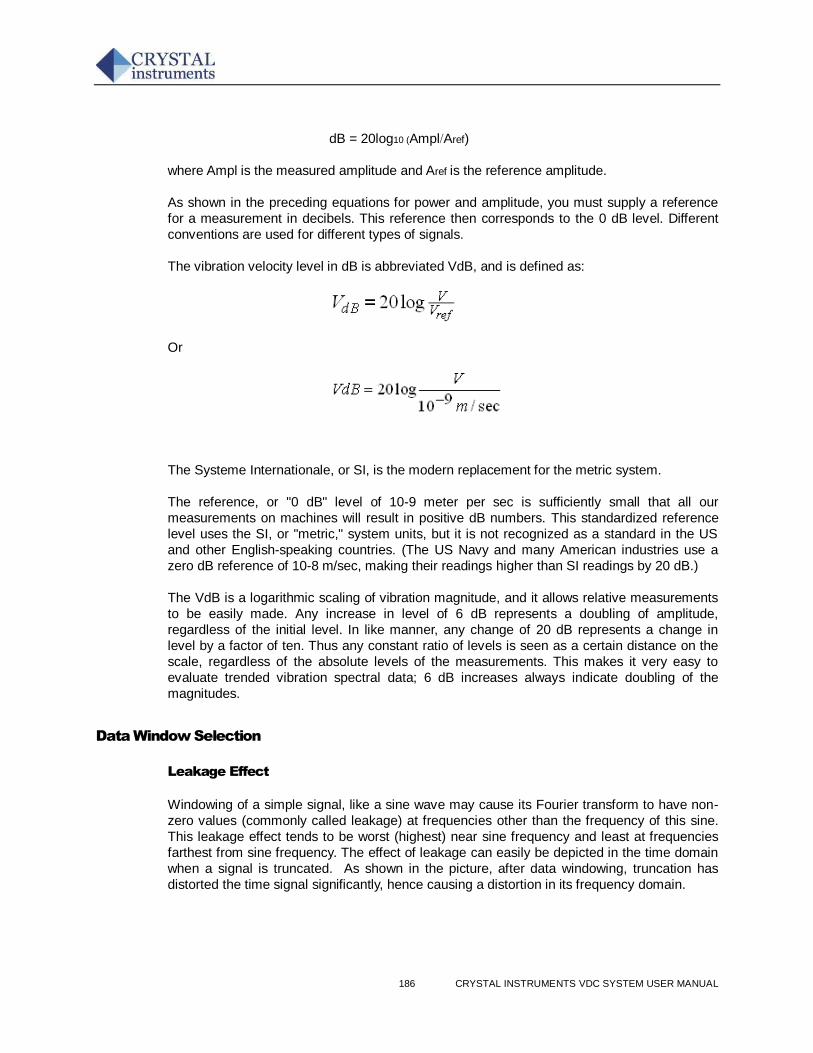
186 CRYSTAL INSTRUMENTS VDC SYSTEM USER MANUAL
dB = 20log10 (AmplAref)
where Ampl is the measured amplitude and Aref is the reference amplitude.
As shown in the preceding equations for power and amplitude, you must supply a reference
for a measurement in decibels. This reference then corresponds to the 0 dB level. Different
conventions are used for different types of signals.
The vibration velocity level in dB is abbreviated VdB, and is defined as:
Or
The Systeme Internationale, or SI, is the modern replacement for the metric system.
The reference, or "0 dB" level of 10-9 meter per sec is sufficiently small that all our
measurements on machines will result in positive dB numbers. This standardized reference
level uses the SI, or "metric," system units, but it is not recognized as a standard in the US
and other English-speaking countries. (The US Navy and many American industries use a
zero dB reference of 10-8 m/sec, making their readings higher than SI readings by 20 dB.)
The VdB is a logarithmic scaling of vibration magnitude, and it allows relative measurements
to be easily made. Any increase in level of 6 dB represents a doubling of amplitude,
regardless of the initial level. In like manner, any change of 20 dB represents a change in
level by a factor of ten. Thus any constant ratio of levels is seen as a certain distance on the
scale, regardless of the absolute levels of the measurements. This makes it very easy to
evaluate trended vibration spectral data; 6 dB increases always indicate doubling of the
magnitudes.
Data Window Selection
Leakage Effect
Windowing of a simple signal, like a sine wave may cause its Fourier transform to have non-
zero values (commonly called leakage) at frequencies other than the frequency of this sine.
This leakage effect tends to be worst (highest) near sine frequency and least at frequencies
farthest from sine frequency. The effect of leakage can easily be depicted in the time domain
when a signal is truncated. As shown in the picture, after data windowing, truncation has
distorted the time signal significantly, hence causing a distortion in its frequency domain.
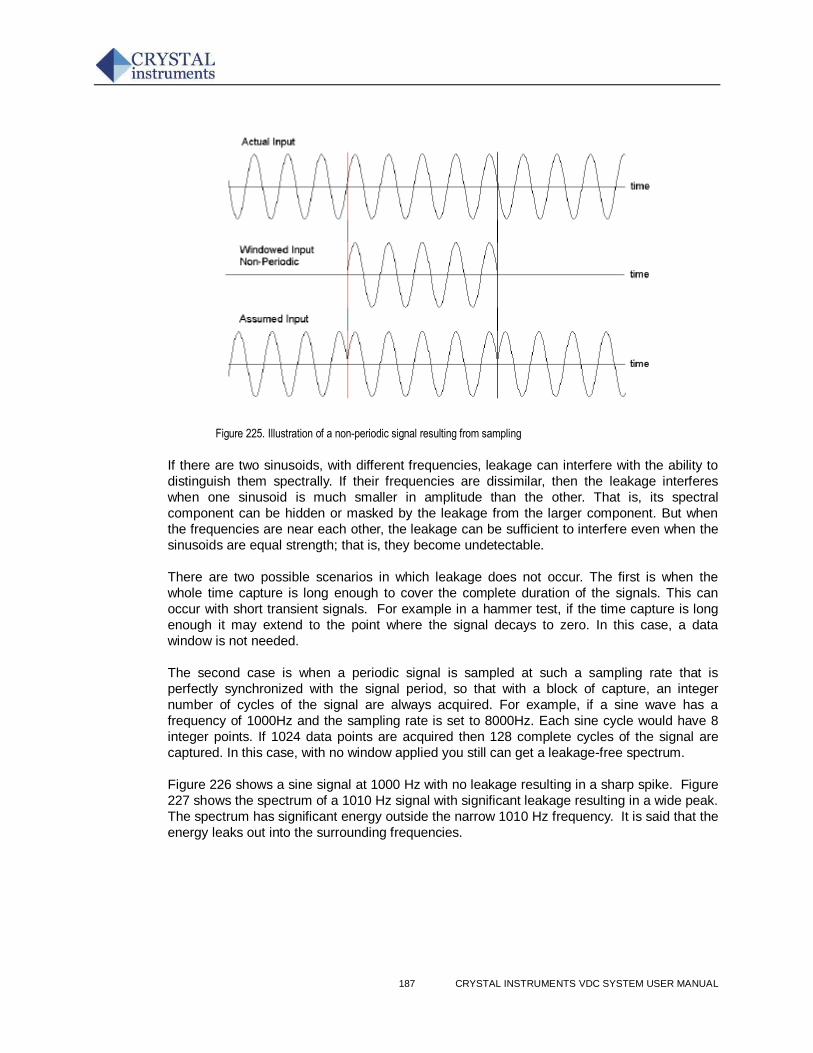
187 CRYSTAL INSTRUMENTS VDC SYSTEM USER MANUAL
Figure 225. Illustration of a non-periodic signal resulting from sampling
If there are two sinusoids, with different frequencies, leakage can interfere with the ability to
distinguish them spectrally. If their frequencies are dissimilar, then the leakage interferes
when one sinusoid is much smaller in amplitude than the other. That is, its spectral
component can be hidden or masked by the leakage from the larger component. But when
the frequencies are near each other, the leakage can be sufficient to interfere even when the
sinusoids are equal strength; that is, they become undetectable.
There are two possible scenarios in which leakage does not occur. The first is when the
whole time capture is long enough to cover the complete duration of the signals. This can
occur with short transient signals. For example in a hammer test, if the time capture is long
enough it may extend to the point where the signal decays to zero. In this case, a data
window is not needed.
The second case is when a periodic signal is sampled at such a sampling rate that is
perfectly synchronized with the signal period, so that with a block of capture, an integer
number of cycles of the signal are always acquired. For example, if a sine wave has a
frequency of 1000Hz and the sampling rate is set to 8000Hz. Each sine cycle would have 8
integer points. If 1024 data points are acquired then 128 complete cycles of the signal are
captured. In this case, with no window applied you still can get a leakage-free spectrum.
Figure 226 shows a sine signal at 1000 Hz with no leakage resulting in a sharp spike. Figure
227 shows the spectrum of a 1010 Hz signal with significant leakage resulting in a wide peak.
The spectrum has significant energy outside the narrow 1010 Hz frequency. It is said that the
energy leaks out into the surrounding frequencies.
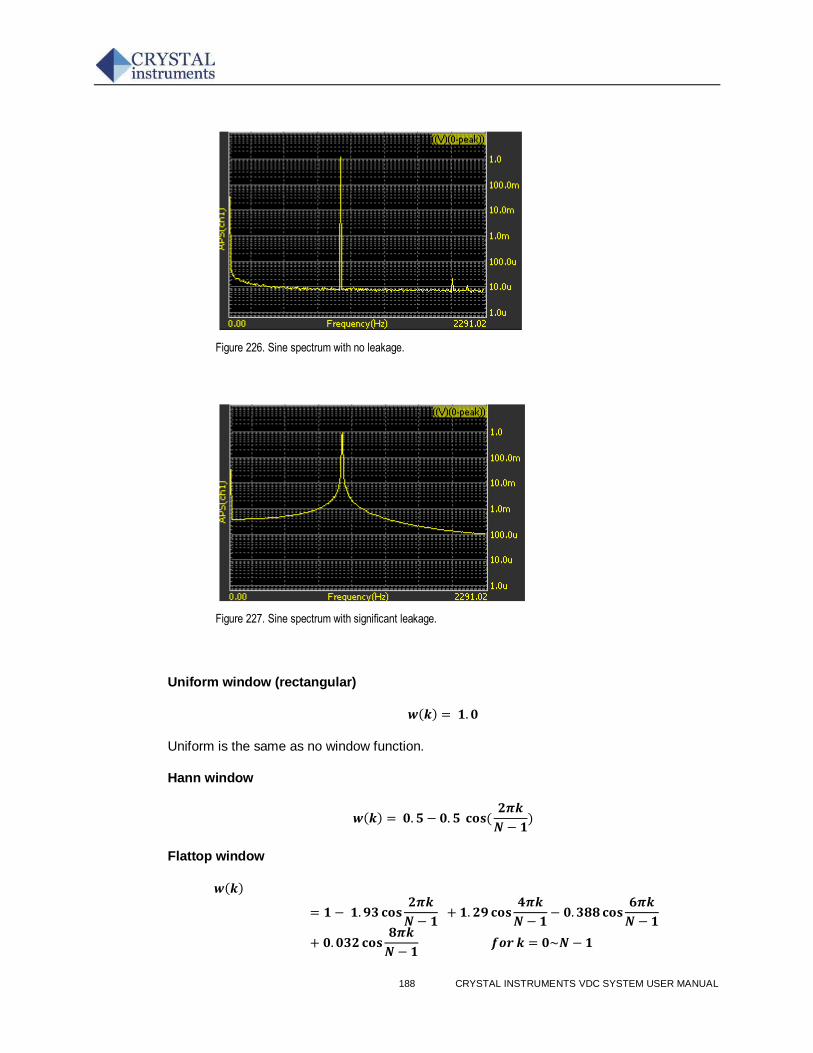
188 CRYSTAL INSTRUMENTS VDC SYSTEM USER MANUAL
Figure 226. Sine spectrum with no leakage.
Figure 227. Sine spectrum with significant leakage.
Uniform window (rectangular)
𝒘 𝒌 = 𝟏. 𝟎
Uniform is the same as no window function.
Hann window
𝒘 𝒌 = 𝟎. 𝟓 − 𝟎. 𝟓 𝐜𝐨𝐬(𝟐𝝅𝒌
𝑵 − 𝟏)
Flattop window
𝒘 𝒌
= 𝟏 − 𝟏. 𝟗𝟑𝐜𝐨𝐬𝟐𝝅𝒌
𝑵 − 𝟏 + 𝟏. 𝟐𝟗𝐜𝐨𝐬
𝟒𝝅𝒌
𝑵 − 𝟏− 𝟎. 𝟑𝟖𝟖𝐜𝐨𝐬
𝟔𝝅𝒌
𝑵 − 𝟏
+ 𝟎. 𝟎𝟑𝟐𝐜𝐨𝐬𝟖𝝅𝒌
𝑵 − 𝟏 𝒇𝒐𝒓 𝒌 = 𝟎~𝑵 − 𝟏
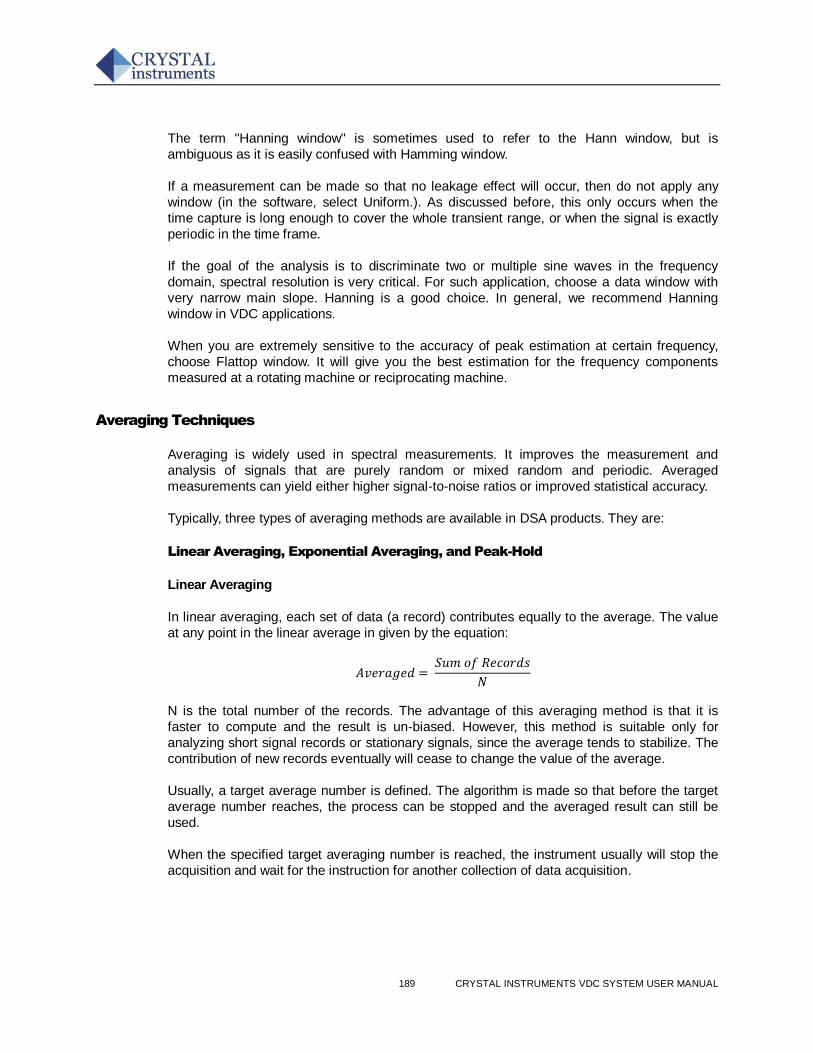
189 CRYSTAL INSTRUMENTS VDC SYSTEM USER MANUAL
The term "Hanning window" is sometimes used to refer to the Hann window, but is
ambiguous as it is easily confused with Hamming window.
If a measurement can be made so that no leakage effect will occur, then do not apply any
window (in the software, select Uniform.). As discussed before, this only occurs when the
time capture is long enough to cover the whole transient range, or when the signal is exactly
periodic in the time frame.
If the goal of the analysis is to discriminate two or multiple sine waves in the frequency
domain, spectral resolution is very critical. For such application, choose a data window with
very narrow main slope. Hanning is a good choice. In general, we recommend Hanning
window in VDC applications.
When you are extremely sensitive to the accuracy of peak estimation at certain frequency,
choose Flattop window. It will give you the best estimation for the frequency components
measured at a rotating machine or reciprocating machine.
Averaging Techniques
Averaging is widely used in spectral measurements. It improves the measurement and
analysis of signals that are purely random or mixed random and periodic. Averaged
measurements can yield either higher signal-to-noise ratios or improved statistical accuracy.
Typically, three types of averaging methods are available in DSA products. They are:
Linear Averaging, Exponential Averaging, and Peak-Hold
Linear Averaging
In linear averaging, each set of data (a record) contributes equally to the average. The value
at any point in the linear average in given by the equation:
𝐴𝑣𝑒𝑟𝑎𝑔𝑒𝑑 = 𝑆𝑢𝑚 𝑜𝑓 𝑅𝑒𝑐𝑜𝑟𝑑𝑠
𝑁
N is the total number of the records. The advantage of this averaging method is that it is
faster to compute and the result is un-biased. However, this method is suitable only for
analyzing short signal records or stationary signals, since the average tends to stabilize. The
contribution of new records eventually will cease to change the value of the average.
Usually, a target average number is defined. The algorithm is made so that before the target
average number reaches, the process can be stopped and the averaged result can still be
used.
When the specified target averaging number is reached, the instrument usually will stop the
acquisition and wait for the instruction for another collection of data acquisition.
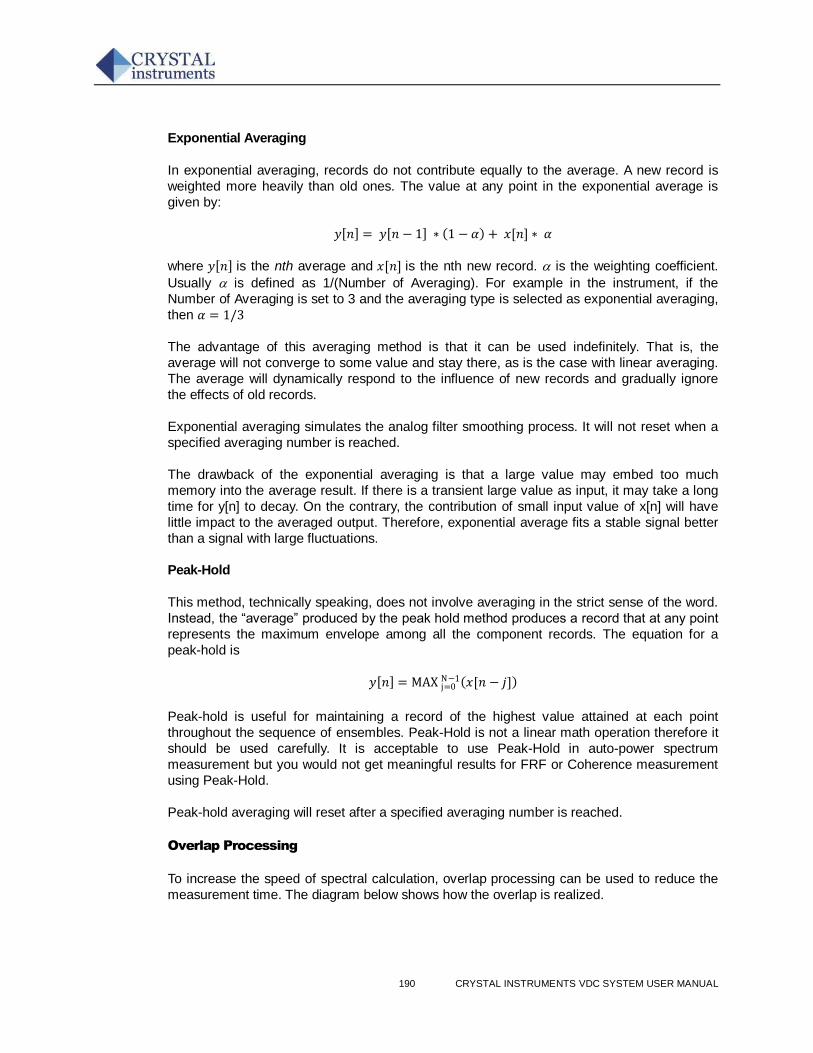
190 CRYSTAL INSTRUMENTS VDC SYSTEM USER MANUAL
Exponential Averaging
In exponential averaging, records do not contribute equally to the average. A new record is
weighted more heavily than old ones. The value at any point in the exponential average is
given by:
𝑦 𝑛 = 𝑦 𝑛 − 1 ∗ 1 − 𝛼 + 𝑥[𝑛] ∗ 𝛼
where 𝑦 𝑛 is the nth average and 𝑥[𝑛] is the nth new record. is the weighting coefficient.
Usually is defined as 1/(Number of Averaging). For example in the instrument, if the
Number of Averaging is set to 3 and the averaging type is selected as exponential averaging,
then 𝛼 = 1/3
The advantage of this averaging method is that it can be used indefinitely. That is, the
average will not converge to some value and stay there, as is the case with linear averaging.
The average will dynamically respond to the influence of new records and gradually ignore
the effects of old records.
Exponential averaging simulates the analog filter smoothing process. It will not reset when a
specified averaging number is reached.
The drawback of the exponential averaging is that a large value may embed too much
memory into the average result. If there is a transient large value as input, it may take a long
time for y[n] to decay. On the contrary, the contribution of small input value of x[n] will have
little impact to the averaged output. Therefore, exponential average fits a stable signal better
than a signal with large fluctuations.
Peak-Hold
This method, technically speaking, does not involve averaging in the strict sense of the word.
Instead, the “average” produced by the peak hold method produces a record that at any point
represents the maximum envelope among all the component records. The equation for a
peak-hold is
𝑦 𝑛 = MAX j=0N−1 𝑥[𝑛 − 𝑗]
Peak-hold is useful for maintaining a record of the highest value attained at each point
throughout the sequence of ensembles. Peak-Hold is not a linear math operation therefore it
should be used carefully. It is acceptable to use Peak-Hold in auto-power spectrum
measurement but you would not get meaningful results for FRF or Coherence measurement
using Peak-Hold.
Peak-hold averaging will reset after a specified averaging number is reached.
Overlap Processing
To increase the speed of spectral calculation, overlap processing can be used to reduce the
measurement time. The diagram below shows how the overlap is realized.
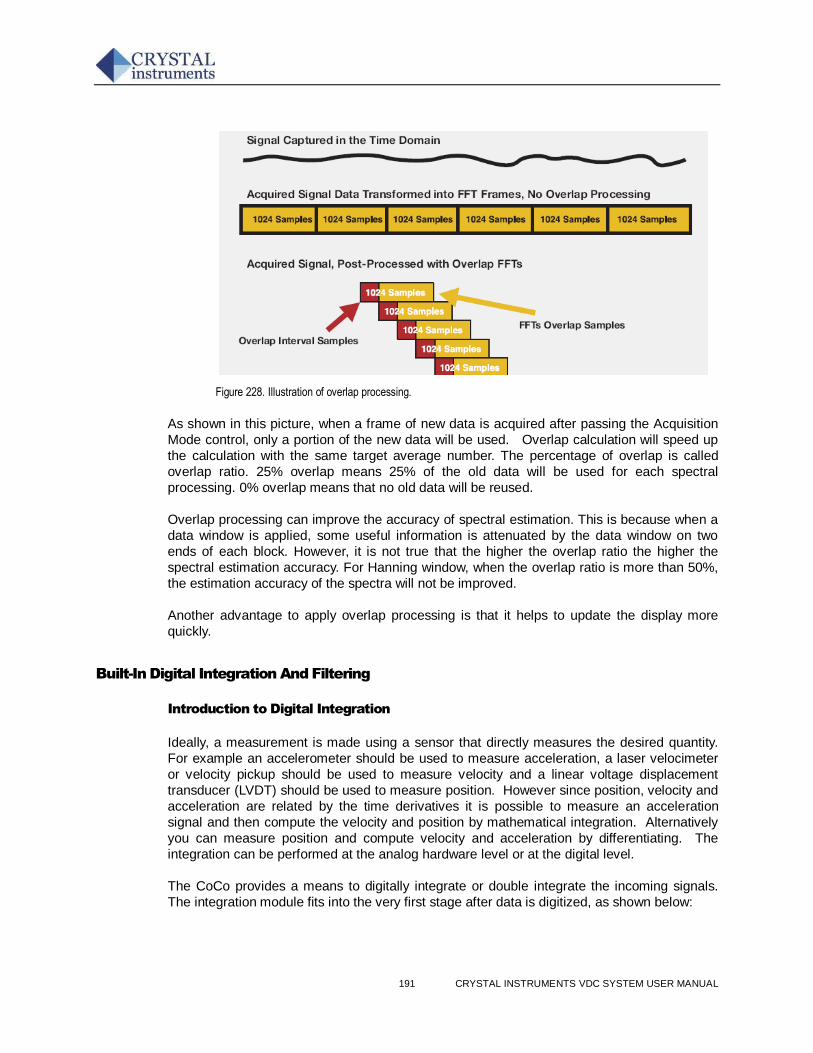
191 CRYSTAL INSTRUMENTS VDC SYSTEM USER MANUAL
Figure 228. Illustration of overlap processing.
As shown in this picture, when a frame of new data is acquired after passing the Acquisition
Mode control, only a portion of the new data will be used. Overlap calculation will speed up
the calculation with the same target average number. The percentage of overlap is called
overlap ratio. 25% overlap means 25% of the old data will be used for each spectral
processing. 0% overlap means that no old data will be reused.
Overlap processing can improve the accuracy of spectral estimation. This is because when a
data window is applied, some useful information is attenuated by the data window on two
ends of each block. However, it is not true that the higher the overlap ratio the higher the
spectral estimation accuracy. For Hanning window, when the overlap ratio is more than 50%,
the estimation accuracy of the spectra will not be improved.
Another advantage to apply overlap processing is that it helps to update the display more
quickly.
Built-In Digital Integration And Filtering
Introduction to Digital Integration
Ideally, a measurement is made using a sensor that directly measures the desired quantity.
For example an accelerometer should be used to measure acceleration, a laser velocimeter
or velocity pickup should be used to measure velocity and a linear voltage displacement
transducer (LVDT) should be used to measure position. However since position, velocity and
acceleration are related by the time derivatives it is possible to measure an acceleration
signal and then compute the velocity and position by mathematical integration. Alternatively
you can measure position and compute velocity and acceleration by differentiating. The
integration can be performed at the analog hardware level or at the digital level.
The CoCo provides a means to digitally integrate or double integrate the incoming signals.
The integration module fits into the very first stage after data is digitized, as shown below:
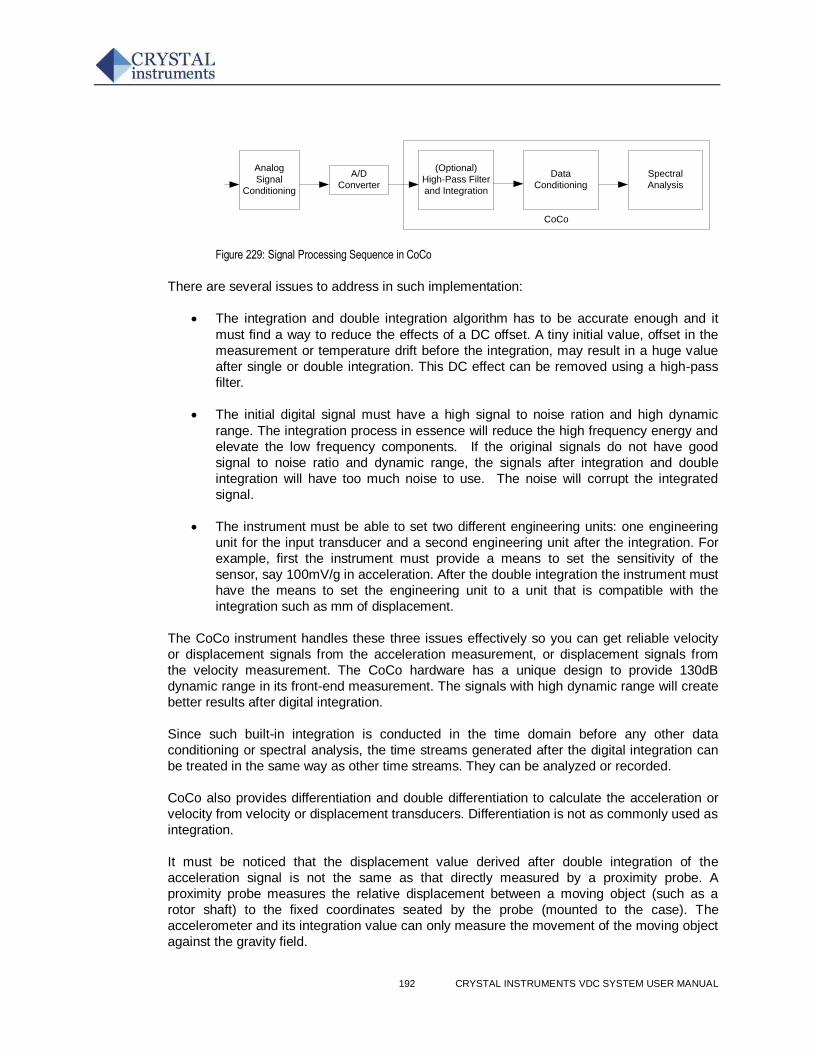
192 CRYSTAL INSTRUMENTS VDC SYSTEM USER MANUAL
CoCo
Analog
Signal
Conditioning
A/D
Converter
(Optional)
High-Pass Filter
and Integration
Data
Conditioning
Spectral
Analysis
Figure 229: Signal Processing Sequence in CoCo
There are several issues to address in such implementation:
The integration and double integration algorithm has to be accurate enough and it
must find a way to reduce the effects of a DC offset. A tiny initial value, offset in the
measurement or temperature drift before the integration, may result in a huge value
after single or double integration. This DC effect can be removed using a high-pass
filter.
The initial digital signal must have a high signal to noise ration and high dynamic
range. The integration process in essence will reduce the high frequency energy and
elevate the low frequency components. If the original signals do not have good
signal to noise ratio and dynamic range, the signals after integration and double
integration will have too much noise to use. The noise will corrupt the integrated
signal.
The instrument must be able to set two different engineering units: one engineering
unit for the input transducer and a second engineering unit after the integration. For
example, first the instrument must provide a means to set the sensitivity of the
sensor, say 100mV/g in acceleration. After the double integration the instrument must
have the means to set the engineering unit to a unit that is compatible with the
integration such as mm of displacement.
The CoCo instrument handles these three issues effectively so you can get reliable velocity
or displacement signals from the acceleration measurement, or displacement signals from
the velocity measurement. The CoCo hardware has a unique design to provide 130dB
dynamic range in its front-end measurement. The signals with high dynamic range will create
better results after digital integration.
Since such built-in integration is conducted in the time domain before any other data
conditioning or spectral analysis, the time streams generated after the digital integration can
be treated in the same way as other time streams. They can be analyzed or recorded.
CoCo also provides differentiation and double differentiation to calculate the acceleration or
velocity from velocity or displacement transducers. Differentiation is not as commonly used as
integration.
It must be noticed that the displacement value derived after double integration of the
acceleration signal is not the same as that directly measured by a proximity probe. A
proximity probe measures the relative displacement between a moving object (such as a
rotor shaft) to the fixed coordinates seated by the probe (mounted to the case). The
accelerometer and its integration value can only measure the movement of the moving object
against the gravity field.
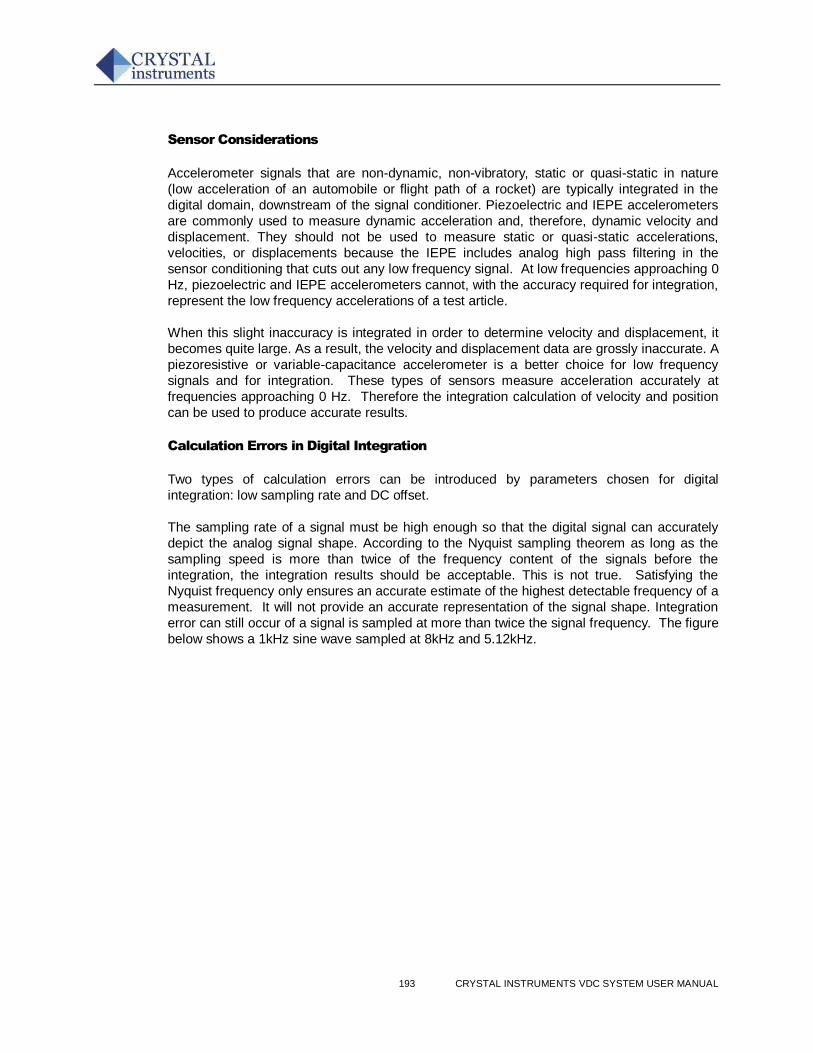
193 CRYSTAL INSTRUMENTS VDC SYSTEM USER MANUAL
Sensor Considerations
Accelerometer signals that are non-dynamic, non-vibratory, static or quasi-static in nature
(low acceleration of an automobile or flight path of a rocket) are typically integrated in the
digital domain, downstream of the signal conditioner. Piezoelectric and IEPE accelerometers
are commonly used to measure dynamic acceleration and, therefore, dynamic velocity and
displacement. They should not be used to measure static or quasi-static accelerations,
velocities, or displacements because the IEPE includes analog high pass filtering in the
sensor conditioning that cuts out any low frequency signal. At low frequencies approaching 0
Hz, piezoelectric and IEPE accelerometers cannot, with the accuracy required for integration,
represent the low frequency accelerations of a test article.
When this slight inaccuracy is integrated in order to determine velocity and displacement, it
becomes quite large. As a result, the velocity and displacement data are grossly inaccurate. A
piezoresistive or variable-capacitance accelerometer is a better choice for low frequency
signals and for integration. These types of sensors measure acceleration accurately at
frequencies approaching 0 Hz. Therefore the integration calculation of velocity and position
can be used to produce accurate results.
Calculation Errors in Digital Integration
Two types of calculation errors can be introduced by parameters chosen for digital
integration: low sampling rate and DC offset.
The sampling rate of a signal must be high enough so that the digital signal can accurately
depict the analog signal shape. According to the Nyquist sampling theorem as long as the
sampling speed is more than twice of the frequency content of the signals before the
integration, the integration results should be acceptable. This is not true. Satisfying the
Nyquist frequency only ensures an accurate estimate of the highest detectable frequency of a
measurement. It will not provide an accurate representation of the signal shape. Integration
error can still occur of a signal is sampled at more than twice the signal frequency. The figure
below shows a 1kHz sine wave sampled at 8kHz and 5.12kHz.
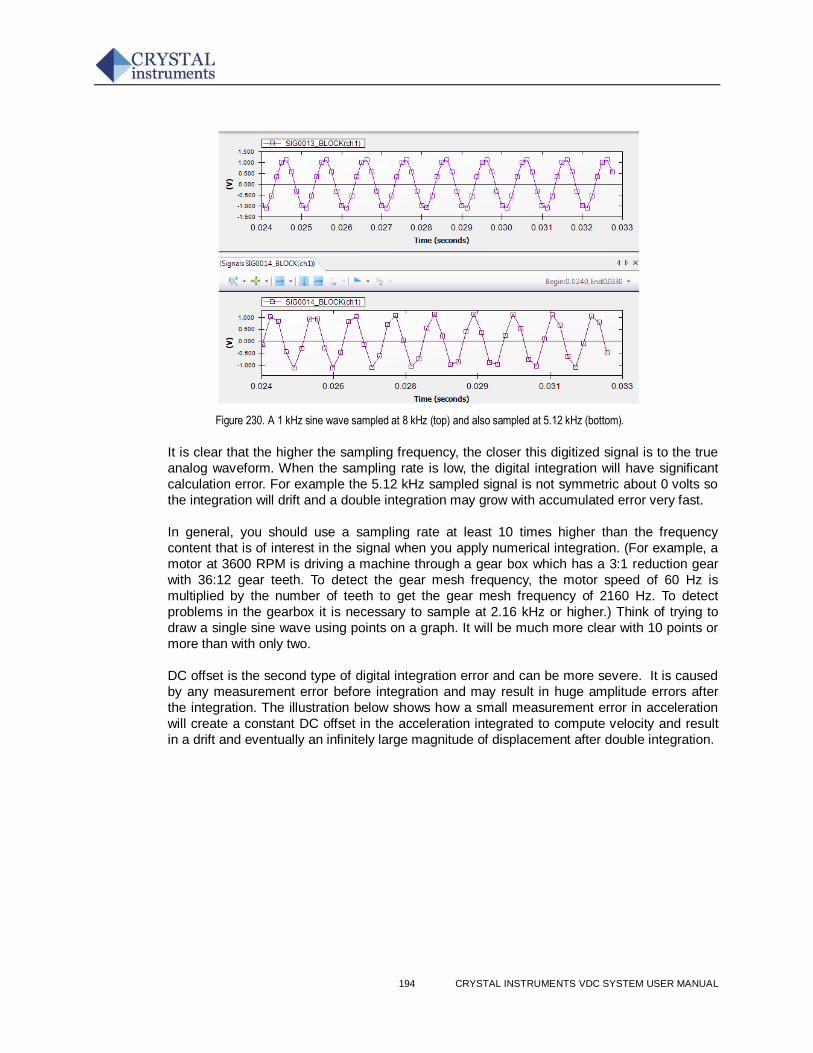
194 CRYSTAL INSTRUMENTS VDC SYSTEM USER MANUAL
Figure 230. A 1 kHz sine wave sampled at 8 kHz (top) and also sampled at 5.12 kHz (bottom).
It is clear that the higher the sampling frequency, the closer this digitized signal is to the true
analog waveform. When the sampling rate is low, the digital integration will have significant
calculation error. For example the 5.12 kHz sampled signal is not symmetric about 0 volts so
the integration will drift and a double integration may grow with accumulated error very fast.
In general, you should use a sampling rate at least 10 times higher than the frequency
content that is of interest in the signal when you apply numerical integration. (For example, a
motor at 3600 RPM is driving a machine through a gear box which has a 3:1 reduction gear
with 36:12 gear teeth. To detect the gear mesh frequency, the motor speed of 60 Hz is
multiplied by the number of teeth to get the gear mesh frequency of 2160 Hz. To detect
problems in the gearbox it is necessary to sample at 2.16 kHz or higher.) Think of trying to
draw a single sine wave using points on a graph. It will be much more clear with 10 points or
more than with only two.
DC offset is the second type of digital integration error and can be more severe. It is caused
by any measurement error before integration and may result in huge amplitude errors after
the integration. The illustration below shows how a small measurement error in acceleration
will create a constant DC offset in the acceleration integrated to compute velocity and result
in a drift and eventually an infinitely large magnitude of displacement after double integration.
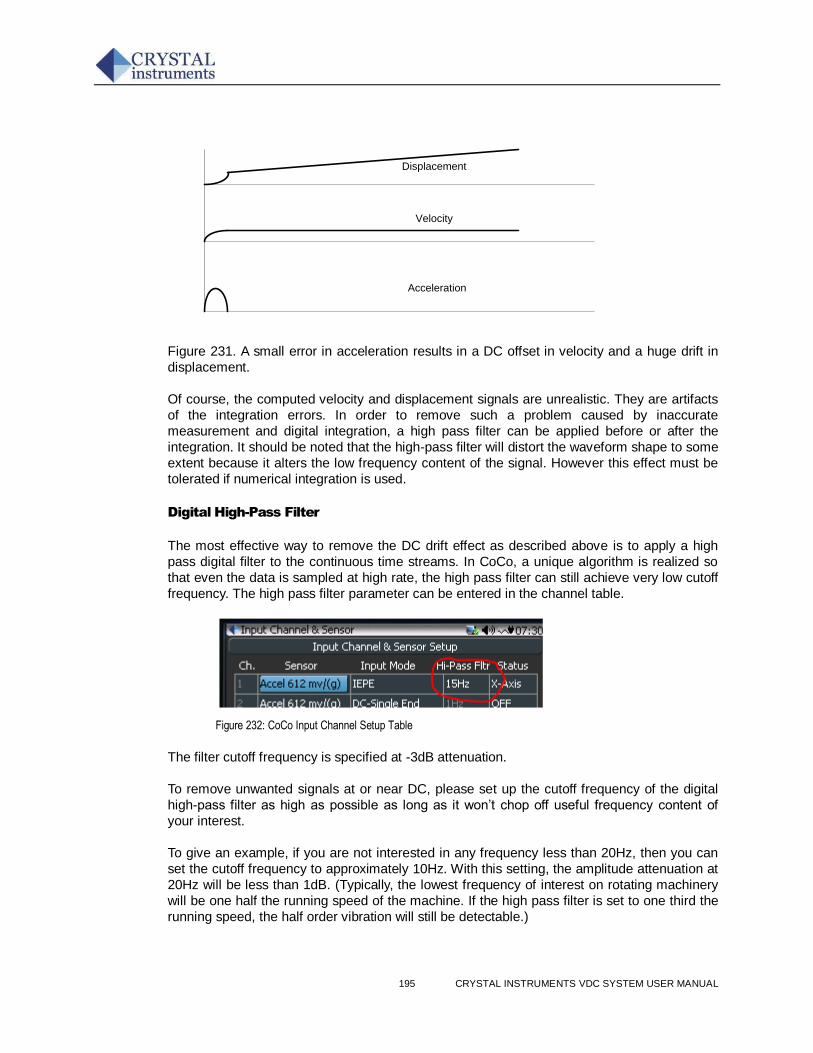
195 CRYSTAL INSTRUMENTS VDC SYSTEM USER MANUAL
Acceleration
Velocity
Displacement
Figure 231. A small error in acceleration results in a DC offset in velocity and a huge drift in
displacement.
Of course, the computed velocity and displacement signals are unrealistic. They are artifacts
of the integration errors. In order to remove such a problem caused by inaccurate
measurement and digital integration, a high pass filter can be applied before or after the
integration. It should be noted that the high-pass filter will distort the waveform shape to some
extent because it alters the low frequency content of the signal. However this effect must be
tolerated if numerical integration is used.
Digital High-Pass Filter
The most effective way to remove the DC drift effect as described above is to apply a high
pass digital filter to the continuous time streams. In CoCo, a unique algorithm is realized so
that even the data is sampled at high rate, the high pass filter can still achieve very low cutoff
frequency. The high pass filter parameter can be entered in the channel table.
Figure 232: CoCo Input Channel Setup Table
The filter cutoff frequency is specified at -3dB attenuation.
To remove unwanted signals at or near DC, please set up the cutoff frequency of the digital
high-pass filter as high as possible as long as it won’t chop off useful frequency content of
your interest.
To give an example, if you are not interested in any frequency less than 20Hz, then you can
set the cutoff frequency to approximately 10Hz. With this setting, the amplitude attenuation at
20Hz will be less than 1dB. (Typically, the lowest frequency of interest on rotating machinery
will be one half the running speed of the machine. If the high pass filter is set to one third the
running speed, the half order vibration will still be detectable.)
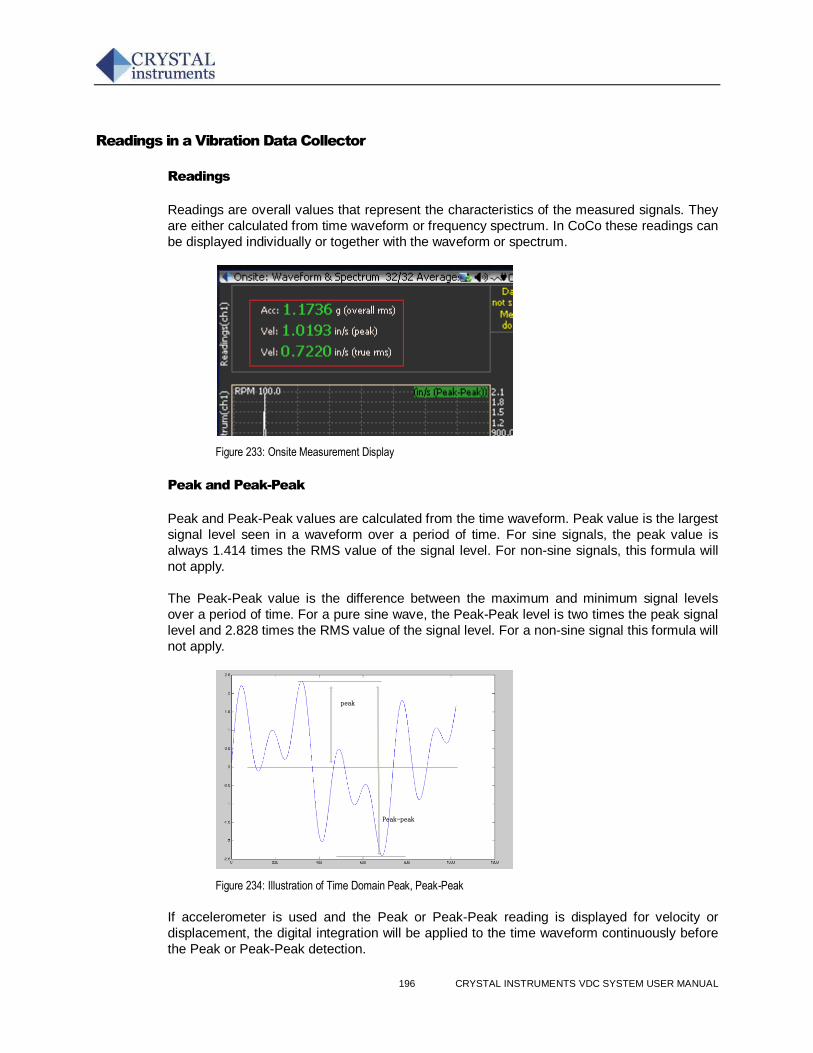
196 CRYSTAL INSTRUMENTS VDC SYSTEM USER MANUAL
Readings in a Vibration Data Collector
Readings
Readings are overall values that represent the characteristics of the measured signals. They
are either calculated from time waveform or frequency spectrum. In CoCo these readings can
be displayed individually or together with the waveform or spectrum.
Figure 233: Onsite Measurement Display
Peak and Peak-Peak
Peak and Peak-Peak values are calculated from the time waveform. Peak value is the largest
signal level seen in a waveform over a period of time. For sine signals, the peak value is
always 1.414 times the RMS value of the signal level. For non-sine signals, this formula will
not apply.
The Peak-Peak value is the difference between the maximum and minimum signal levels
over a period of time. For a pure sine wave, the Peak-Peak level is two times the peak signal
level and 2.828 times the RMS value of the signal level. For a non-sine signal this formula will
not apply.
peak
Peak-peak
Figure 234: Illustration of Time Domain Peak, Peak-Peak
If accelerometer is used and the Peak or Peak-Peak reading is displayed for velocity or
displacement, the digital integration will be applied to the time waveform continuously before
the Peak or Peak-Peak detection.
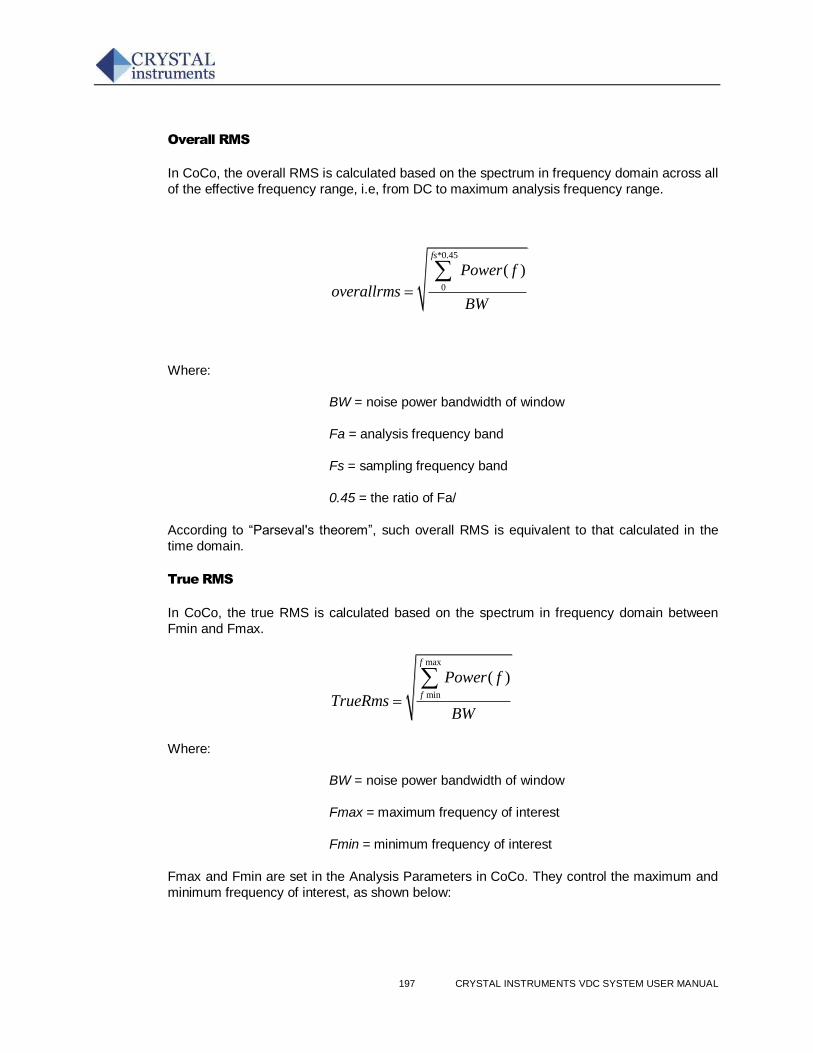
197 CRYSTAL INSTRUMENTS VDC SYSTEM USER MANUAL
Overall RMS
In CoCo, the overall RMS is calculated based on the spectrum in frequency domain across all
of the effective frequency range, i.e, from DC to maximum analysis frequency range.
*0.45
0
( )fs
Power f
overallrmsBW
Where:
BW = noise power bandwidth of window
Fa = analysis frequency band
Fs = sampling frequency band
0.45 = the ratio of Fa/
According to “Parseval's theorem”, such overall RMS is equivalent to that calculated in the
time domain.
True RMS
In CoCo, the true RMS is calculated based on the spectrum in frequency domain between
Fmin and Fmax.
max
min
( )f
f
Power f
TrueRmsBW
Where:
BW = noise power bandwidth of window
Fmax = maximum frequency of interest
Fmin = minimum frequency of interest
Fmax and Fmin are set in the Analysis Parameters in CoCo. They control the maximum and
minimum frequency of interest, as shown below:
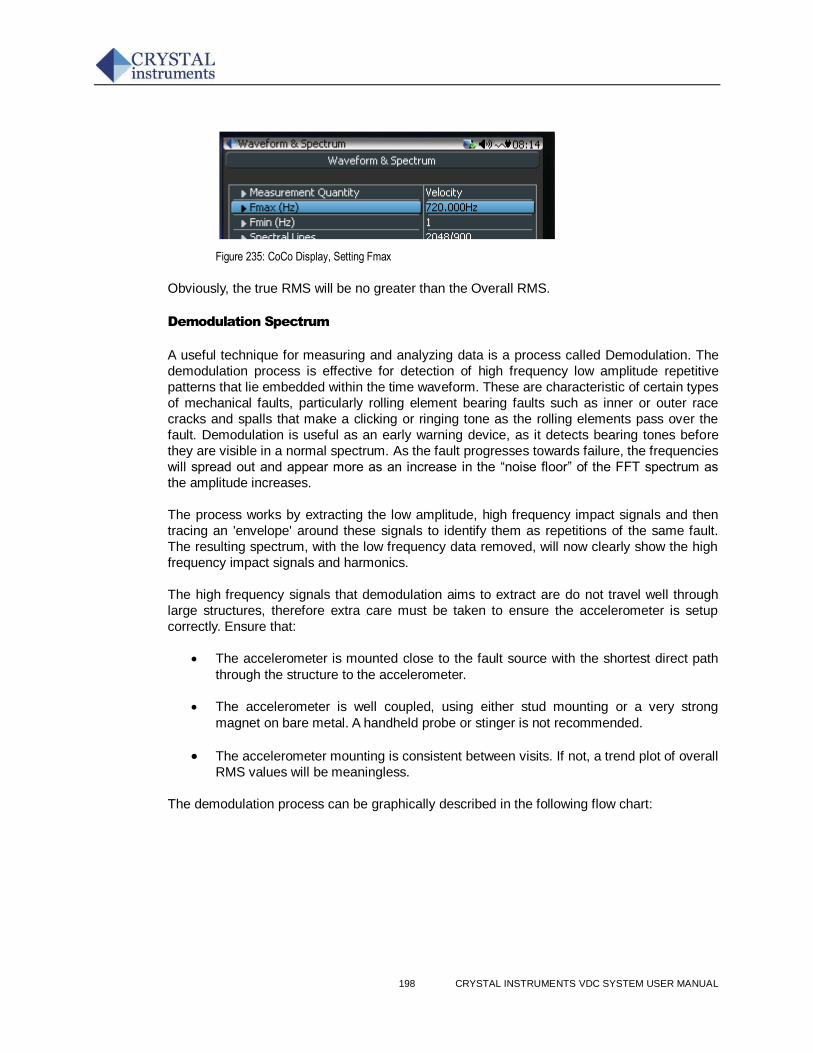
198 CRYSTAL INSTRUMENTS VDC SYSTEM USER MANUAL
Figure 235: CoCo Display, Setting Fmax
Obviously, the true RMS will be no greater than the Overall RMS.
Demodulation Spectrum
A useful technique for measuring and analyzing data is a process called Demodulation. The
demodulation process is effective for detection of high frequency low amplitude repetitive
patterns that lie embedded within the time waveform. These are characteristic of certain types
of mechanical faults, particularly rolling element bearing faults such as inner or outer race
cracks and spalls that make a clicking or ringing tone as the rolling elements pass over the
fault. Demodulation is useful as an early warning device, as it detects bearing tones before
they are visible in a normal spectrum. As the fault progresses towards failure, the frequencies
will spread out and appear more as an increase in the “noise floor” of the FFT spectrum as
the amplitude increases.
The process works by extracting the low amplitude, high frequency impact signals and then
tracing an 'envelope' around these signals to identify them as repetitions of the same fault.
The resulting spectrum, with the low frequency data removed, will now clearly show the high
frequency impact signals and harmonics.
The high frequency signals that demodulation aims to extract are do not travel well through
large structures, therefore extra care must be taken to ensure the accelerometer is setup
correctly. Ensure that:
The accelerometer is mounted close to the fault source with the shortest direct path
through the structure to the accelerometer.
The accelerometer is well coupled, using either stud mounting or a very strong
magnet on bare metal. A handheld probe or stinger is not recommended.
The accelerometer mounting is consistent between visits. If not, a trend plot of overall
RMS values will be meaningless.
The demodulation process can be graphically described in the following flow chart:
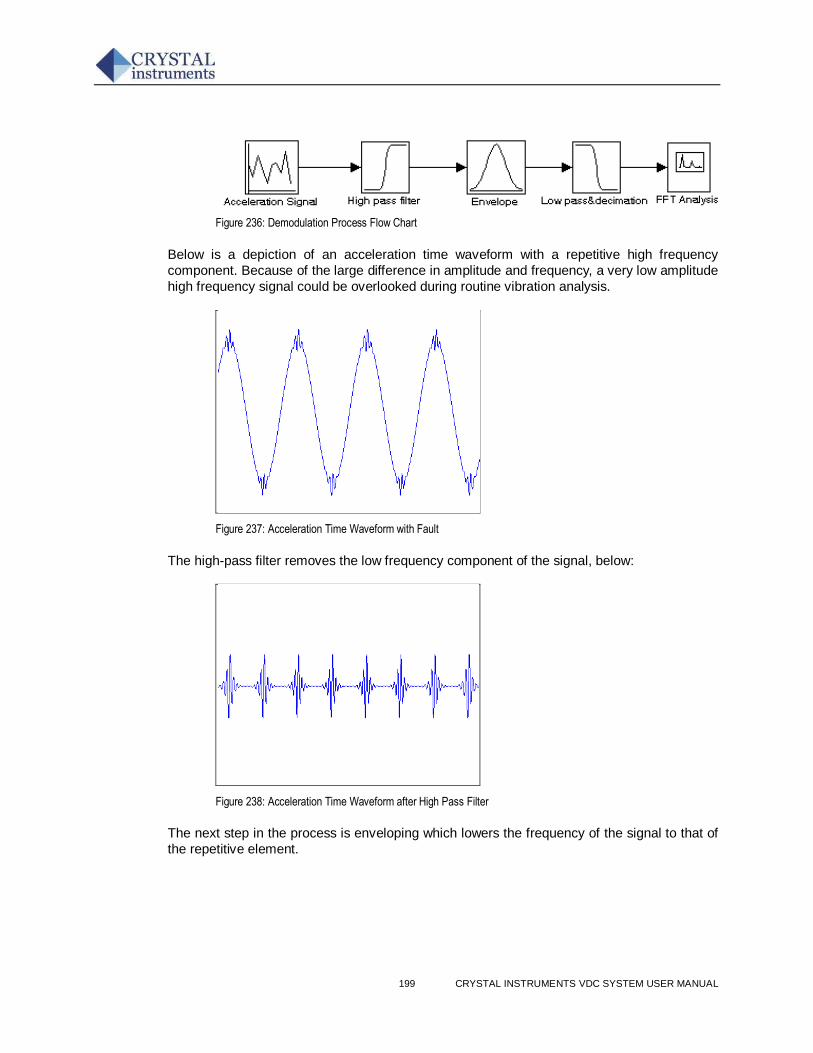
199 CRYSTAL INSTRUMENTS VDC SYSTEM USER MANUAL
Figure 236: Demodulation Process Flow Chart
Below is a depiction of an acceleration time waveform with a repetitive high frequency
component. Because of the large difference in amplitude and frequency, a very low amplitude
high frequency signal could be overlooked during routine vibration analysis.
Figure 237: Acceleration Time Waveform with Fault
The high-pass filter removes the low frequency component of the signal, below:
Figure 238: Acceleration Time Waveform after High Pass Filter
The next step in the process is enveloping which lowers the frequency of the signal to that of
the repetitive element.
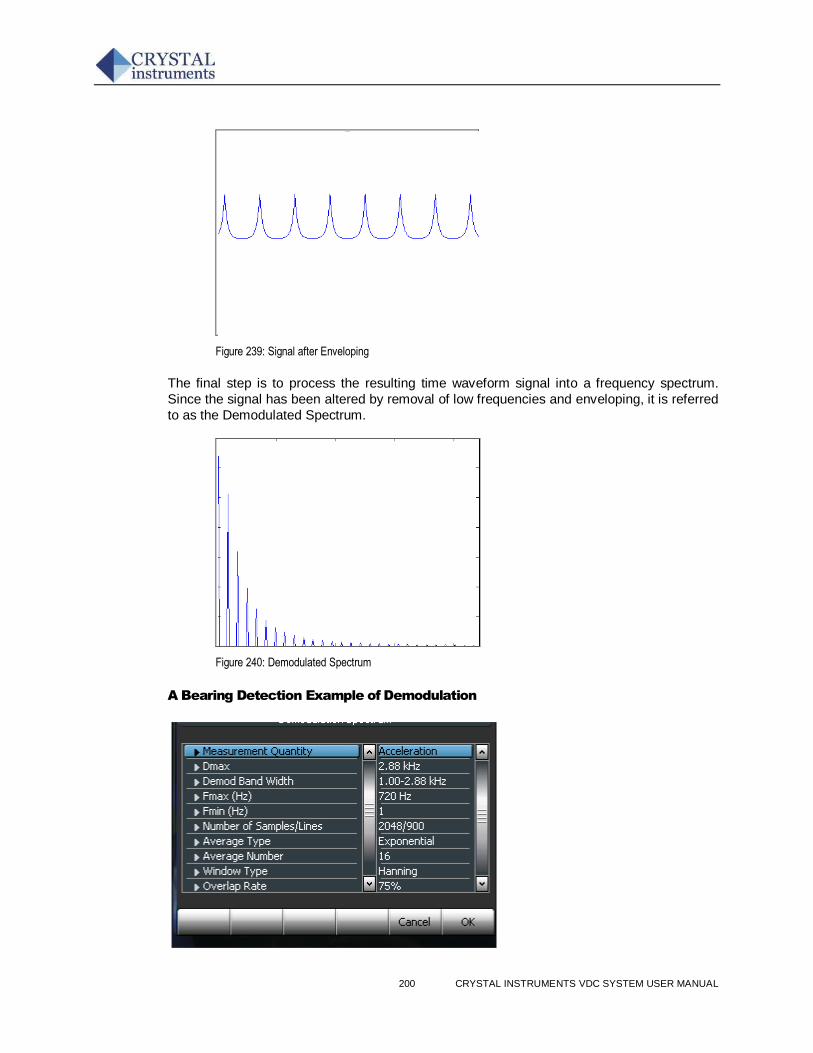
200 CRYSTAL INSTRUMENTS VDC SYSTEM USER MANUAL
Figure 239: Signal after Enveloping
The final step is to process the resulting time waveform signal into a frequency spectrum.
Since the signal has been altered by removal of low frequencies and enveloping, it is referred
to as the Demodulated Spectrum.
Figure 240: Demodulated Spectrum
A Bearing Detection Example of Demodulation
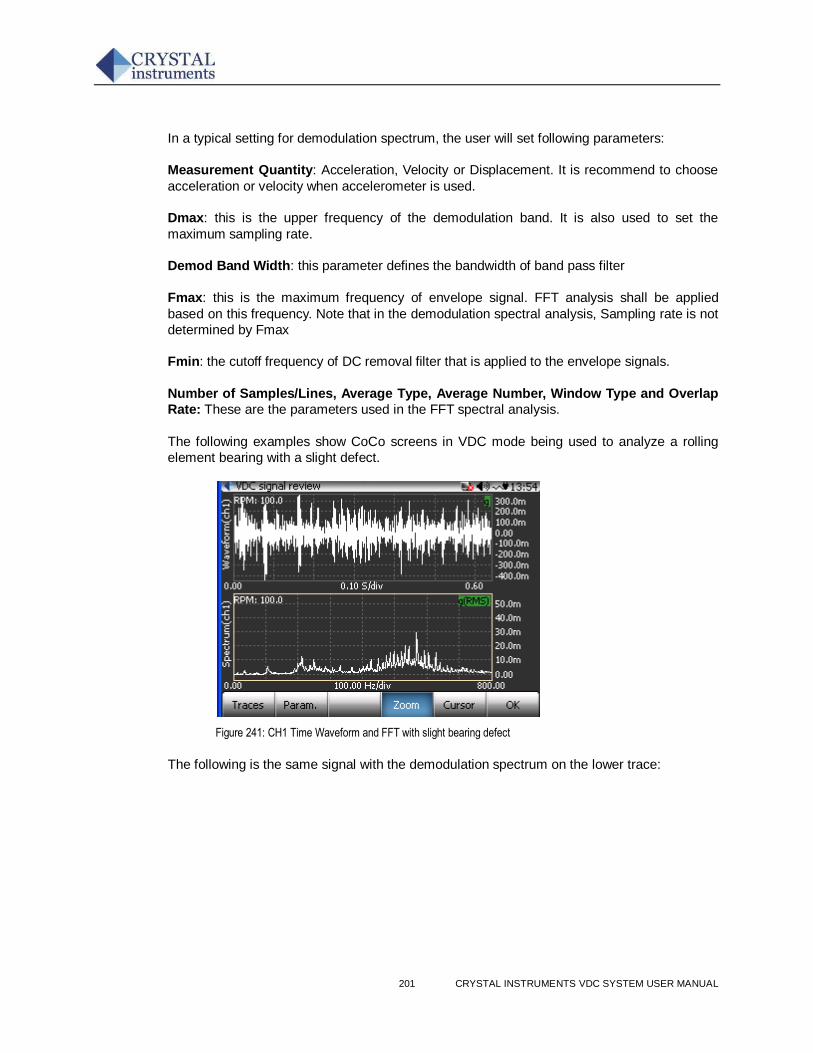
201 CRYSTAL INSTRUMENTS VDC SYSTEM USER MANUAL
In a typical setting for demodulation spectrum, the user will set following parameters:
Measurement Quantity: Acceleration, Velocity or Displacement. It is recommend to choose
acceleration or velocity when accelerometer is used.
Dmax: this is the upper frequency of the demodulation band. It is also used to set the
maximum sampling rate.
Demod Band Width: this parameter defines the bandwidth of band pass filter
Fmax: this is the maximum frequency of envelope signal. FFT analysis shall be applied
based on this frequency. Note that in the demodulation spectral analysis, Sampling rate is not
determined by Fmax
Fmin: the cutoff frequency of DC removal filter that is applied to the envelope signals.
Number of Samples/Lines, Average Type, Average Number, Window Type and Overlap
Rate: These are the parameters used in the FFT spectral analysis.
The following examples show CoCo screens in VDC mode being used to analyze a rolling
element bearing with a slight defect.
Figure 241: CH1 Time Waveform and FFT with slight bearing defect
The following is the same signal with the demodulation spectrum on the lower trace:
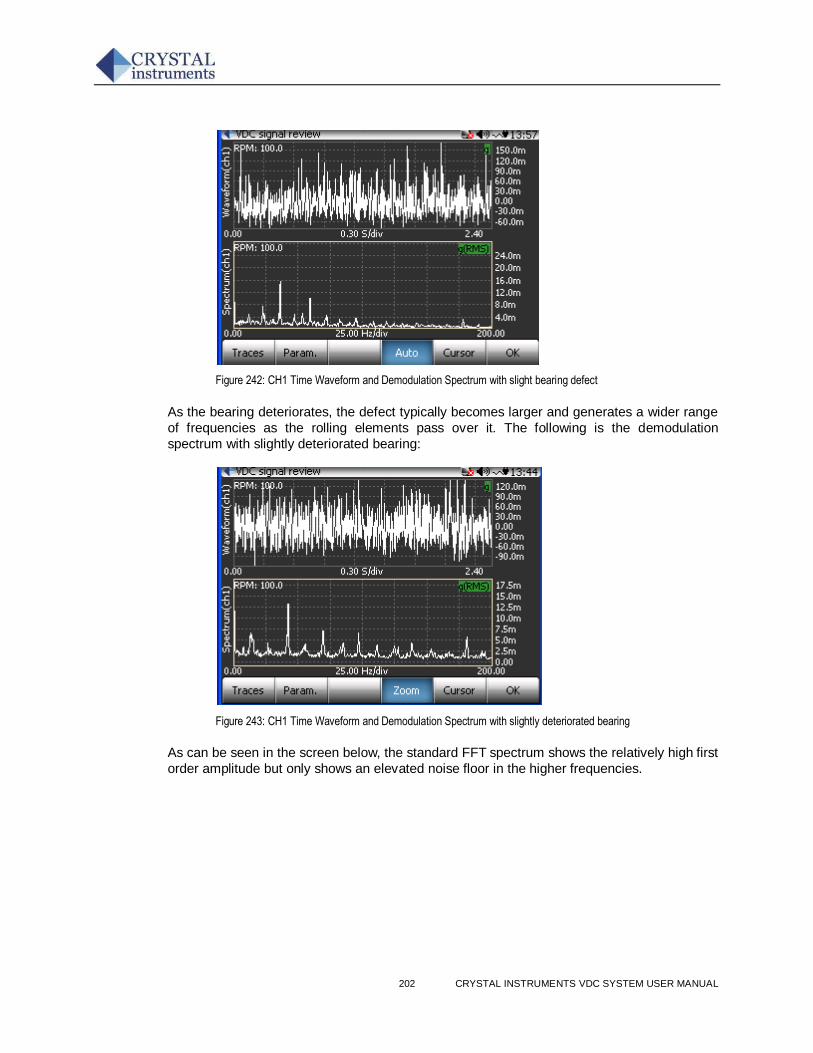
202 CRYSTAL INSTRUMENTS VDC SYSTEM USER MANUAL
Figure 242: CH1 Time Waveform and Demodulation Spectrum with slight bearing defect
As the bearing deteriorates, the defect typically becomes larger and generates a wider range
of frequencies as the rolling elements pass over it. The following is the demodulation
spectrum with slightly deteriorated bearing:
Figure 243: CH1 Time Waveform and Demodulation Spectrum with slightly deteriorated bearing
As can be seen in the screen below, the standard FFT spectrum shows the relatively high first
order amplitude but only shows an elevated noise floor in the higher frequencies.
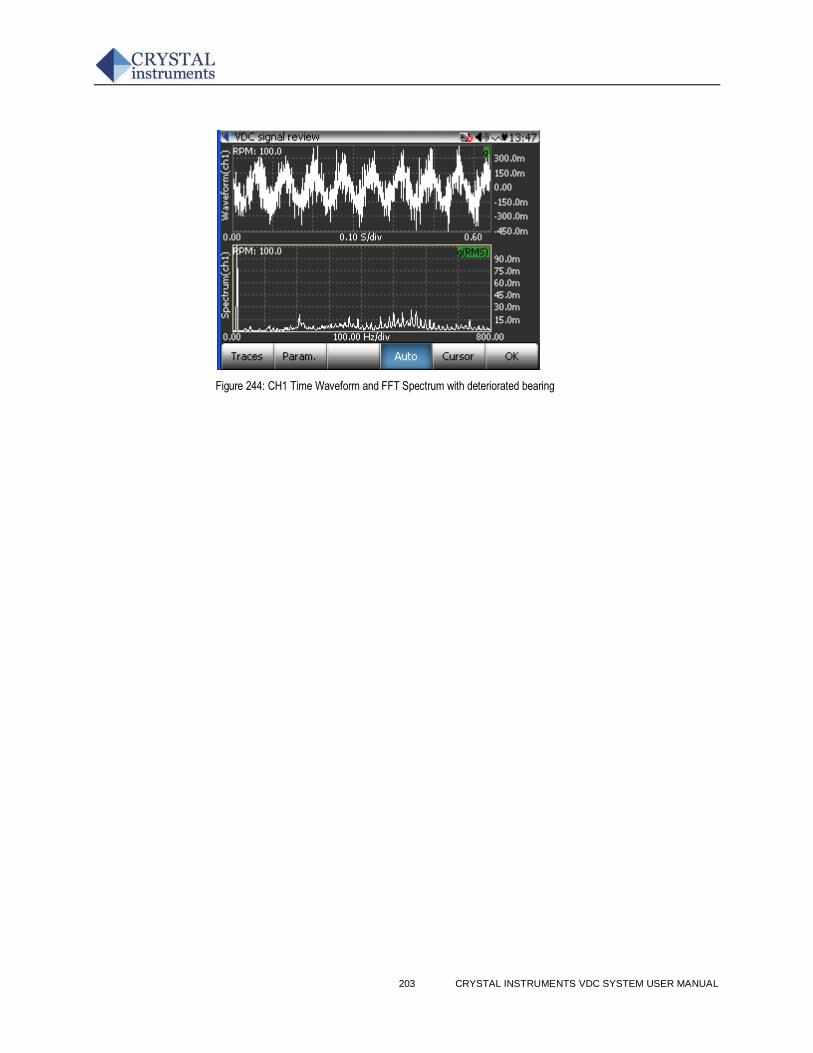
203 CRYSTAL INSTRUMENTS VDC SYSTEM USER MANUAL
Figure 244: CH1 Time Waveform and FFT Spectrum with deteriorated bearing
204 CRYSTAL INSTRUMENTS VDC SYSTEM USER MANUAL
Appendix 2: Using Accelerometers and Tachometer
Accelerometers for Industrial Applications
Accelerometers are widely used in the vibration data collection. By using the feature of
CoCo’s very high dynamic range (130dB), the acceleration signals can also be accurately
integrated into velocity and displacement signals. There are a wide range of accelerometers
to choose in the market. Many of them are IEPE mode. In most of applications we
recommend using IEPE accelerometers.
There are three types of accelerometers in the market: (1). accelerometers used for cost-
sensitive market such as PDAs, electronic toys, automotive airbags or laptop computers.
These are MEMS based sensors that cost a few dollars each. They do not fall into our
categories. (2). The accelerometers used for testing and measurement purpose. The US
manufacturers like PCB, Endevco and Dytran all focus on such applications; (3). The
accelerometers used for machine vibration, or called industrial applications. US
manufacturers include Wilcoxon, CTC and so on. Most often, the vibration data collector asks
for the sensors from the last category. These sensors are relatively large in size, rugged, less
accurate and less expensive than those from the category (2).
Mounting Accelerometers
Care must be taken to insure the appropriate accuracy across the whole frequency range.
The accuracy of your high frequency response is directly affected by the mounting technique
that you select for the sensor. In general, the greater the mounted surface area contact
between the sensor and the machine surface, the more accurate your high frequency
response will be. High frequency response is based on the sensor specified as well as the
method of attachment together with a system. Stud mounted sensors are often able to utilize
the entire frequency range that the sensor specified. Conversely, a probe tip mounted sensor
has very little surface area contact with the machine surface, and offers very little high
frequency accuracy above 500Hz (30, 000CPM).
The picture below shows the frequency response of a typical accelerometer. It might be
surprising to you that how inaccurate the measurement can be at different frequency range.
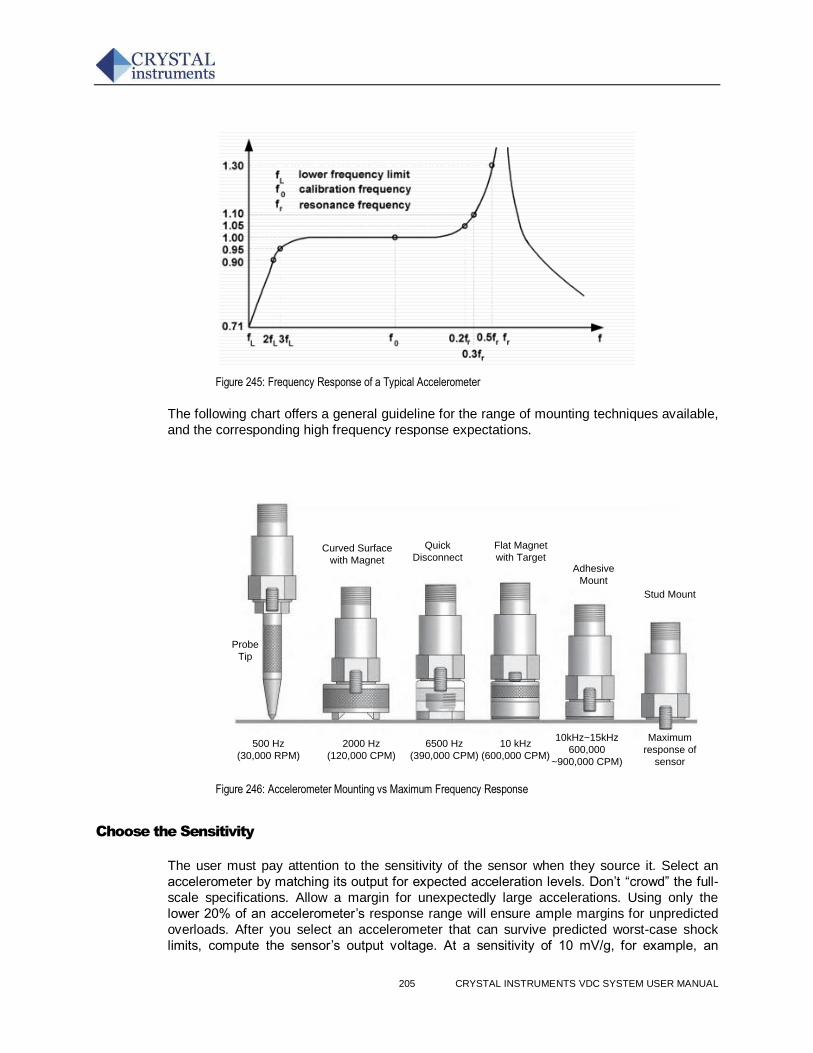
205 CRYSTAL INSTRUMENTS VDC SYSTEM USER MANUAL
Figure 245: Frequency Response of a Typical Accelerometer
The following chart offers a general guideline for the range of mounting techniques available,
and the corresponding high frequency response expectations.
Probe
Tip
500 Hz
(30,000 RPM)
Quick
Disconnect
Flat Magnet
with TargetAdhesive
Mount
Stud Mount
2000 Hz
(120,000 CPM)
6500 Hz
(390,000 CPM)
10 kHz
(600,000 CPM)
10kHz~15kHz
600,000
~900,000 CPM)
Maximum
response of
sensor
Curved Surface
with Magnet
Figure 246: Accelerometer Mounting vs Maximum Frequency Response
Choose the Sensitivity
The user must pay attention to the sensitivity of the sensor when they source it. Select an
accelerometer by matching its output for expected acceleration levels. Don’t “crowd” the full-
scale specifications. Allow a margin for unexpectedly large accelerations. Using only the
lower 20% of an accelerometer’s response range will ensure ample margins for unpredicted
overloads. After you select an accelerometer that can survive predicted worst-case shock
limits, compute the sensor’s output voltage. At a sensitivity of 10 mV/g, for example, an
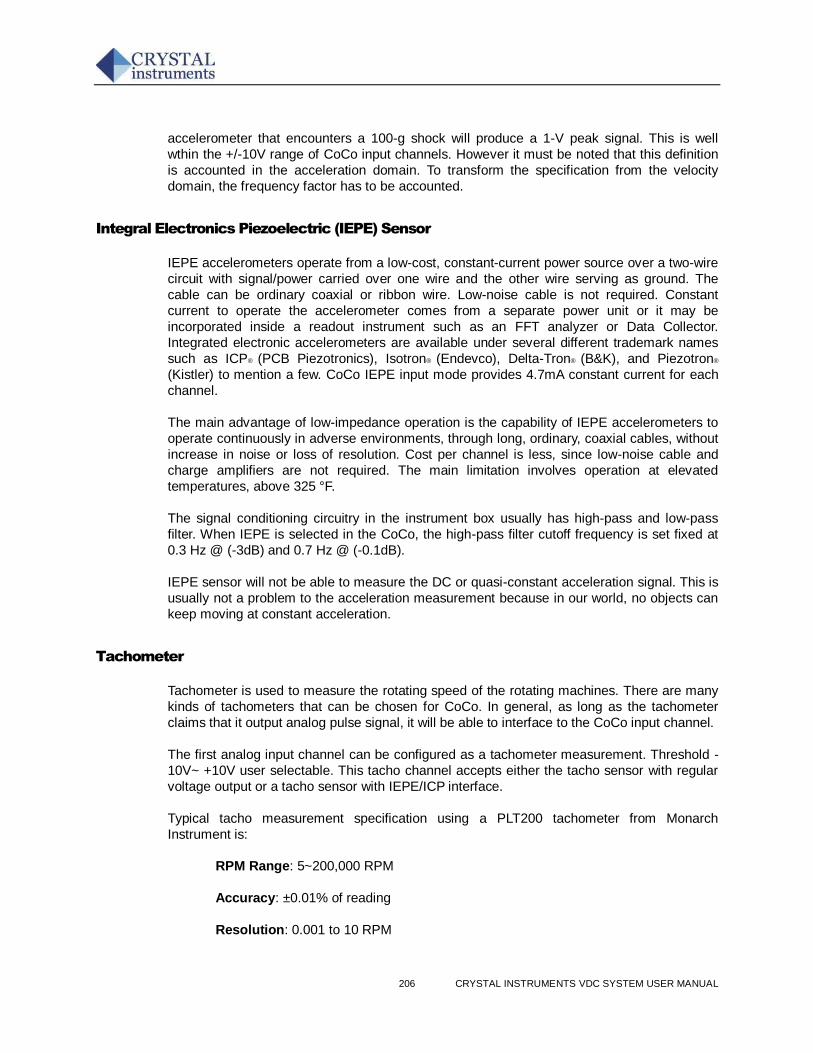
206 CRYSTAL INSTRUMENTS VDC SYSTEM USER MANUAL
accelerometer that encounters a 100-g shock will produce a 1-V peak signal. This is well
wthin the +/-10V range of CoCo input channels. However it must be noted that this definition
is accounted in the acceleration domain. To transform the specification from the velocity
domain, the frequency factor has to be accounted.
Integral Electronics Piezoelectric (IEPE) Sensor
IEPE accelerometers operate from a low-cost, constant-current power source over a two-wire
circuit with signal/power carried over one wire and the other wire serving as ground. The
cable can be ordinary coaxial or ribbon wire. Low-noise cable is not required. Constant
current to operate the accelerometer comes from a separate power unit or it may be
incorporated inside a readout instrument such as an FFT analyzer or Data Collector.
Integrated electronic accelerometers are available under several different trademark names
such as ICP® (PCB Piezotronics), Isotron® (Endevco), Delta-Tron® (B&K), and Piezotron®
(Kistler) to mention a few. CoCo IEPE input mode provides 4.7mA constant current for each
channel.
The main advantage of low-impedance operation is the capability of IEPE accelerometers to
operate continuously in adverse environments, through long, ordinary, coaxial cables, without
increase in noise or loss of resolution. Cost per channel is less, since low-noise cable and
charge amplifiers are not required. The main limitation involves operation at elevated
temperatures, above 325 °F.
The signal conditioning circuitry in the instrument box usually has high-pass and low-pass
filter. When IEPE is selected in the CoCo, the high-pass filter cutoff frequency is set fixed at
0.3 Hz @ (-3dB) and 0.7 Hz @ (-0.1dB).
IEPE sensor will not be able to measure the DC or quasi-constant acceleration signal. This is
usually not a problem to the acceleration measurement because in our world, no objects can
keep moving at constant acceleration.
Tachometer
Tachometer is used to measure the rotating speed of the rotating machines. There are many
kinds of tachometers that can be chosen for CoCo. In general, as long as the tachometer
claims that it output analog pulse signal, it will be able to interface to the CoCo input channel.
The first analog input channel can be configured as a tachometer measurement. Threshold -
10V~ +10V user selectable. This tacho channel accepts either the tacho sensor with regular
voltage output or a tacho sensor with IEPE/ICP interface.
Typical tacho measurement specification using a PLT200 tachometer from Monarch
Instrument is:
RPM Range: 5~200,000 RPM
Accuracy: ±0.01% of reading
Resolution: 0.001 to 10 RPM
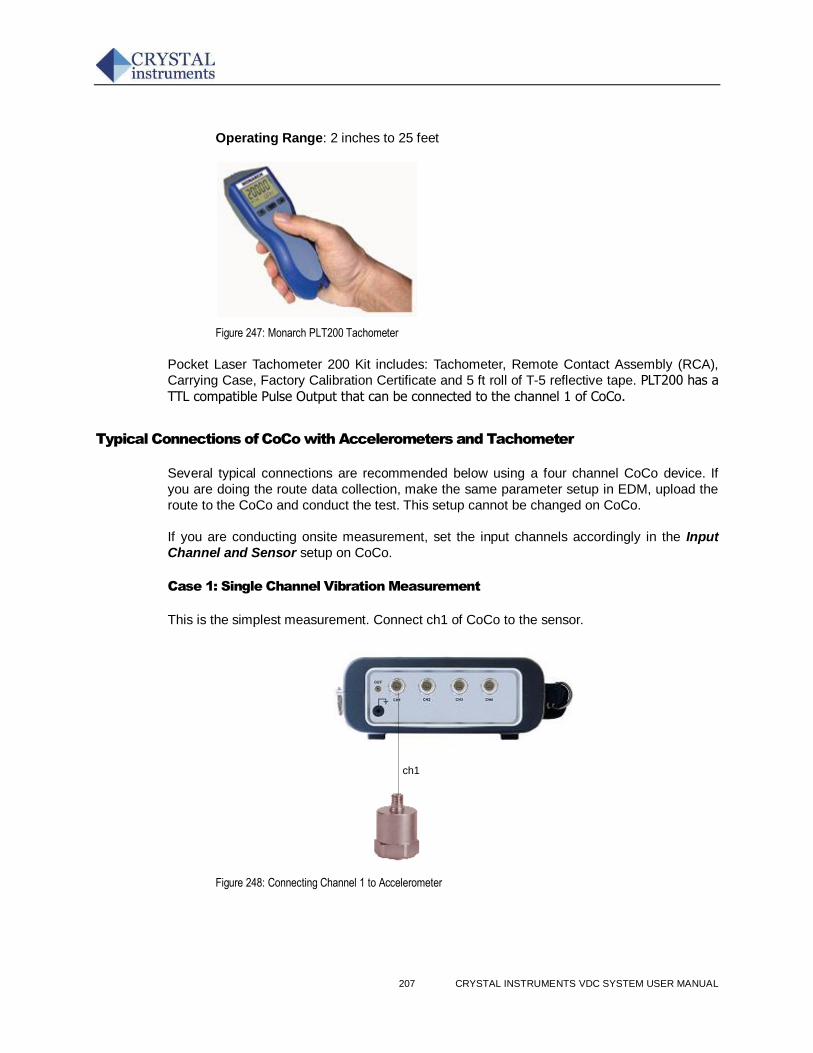
207 CRYSTAL INSTRUMENTS VDC SYSTEM USER MANUAL
Operating Range: 2 inches to 25 feet
Figure 247: Monarch PLT200 Tachometer
Pocket Laser Tachometer 200 Kit includes: Tachometer, Remote Contact Assembly (RCA),
Carrying Case, Factory Calibration Certificate and 5 ft roll of T-5 reflective tape. PLT200 has a
TTL compatible Pulse Output that can be connected to the channel 1 of CoCo.
Typical Connections of CoCo with Accelerometers and Tachometer
Several typical connections are recommended below using a four channel CoCo device. If
you are doing the route data collection, make the same parameter setup in EDM, upload the
route to the CoCo and conduct the test. This setup cannot be changed on CoCo.
If you are conducting onsite measurement, set the input channels accordingly in the Input
Channel and Sensor setup on CoCo.
Case 1: Single Channel Vibration Measurement
This is the simplest measurement. Connect ch1 of CoCo to the sensor.
ch1
Figure 248: Connecting Channel 1 to Accelerometer
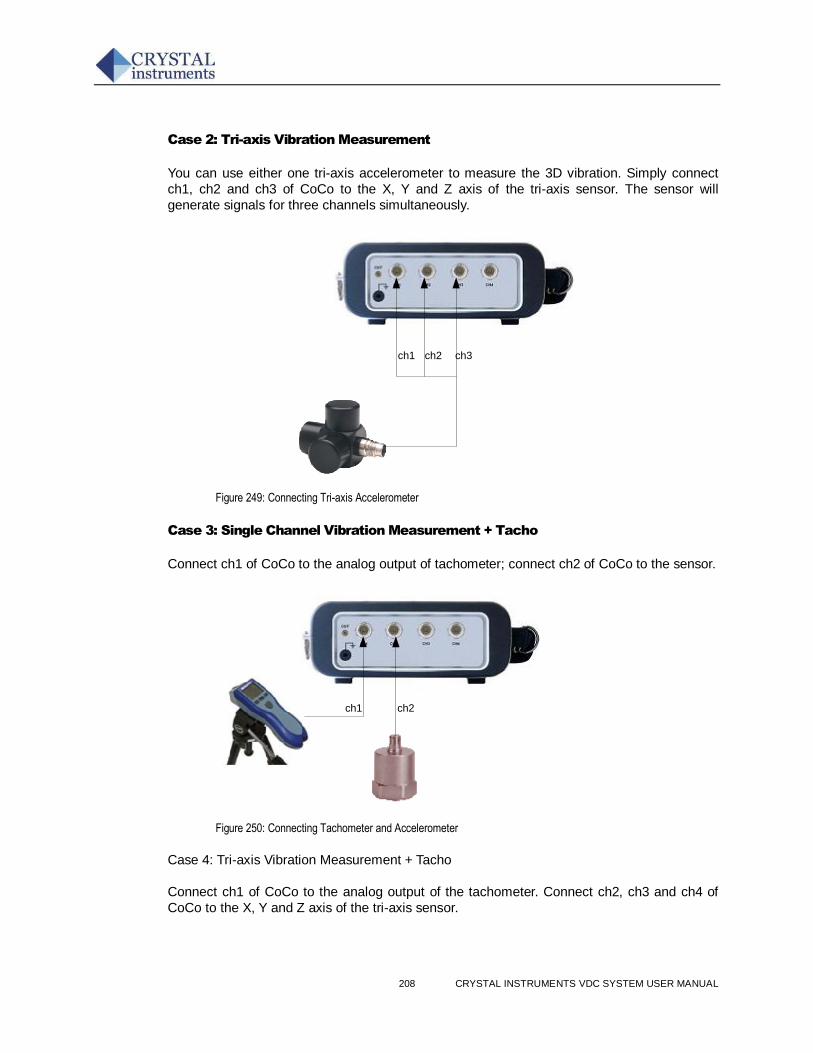
208 CRYSTAL INSTRUMENTS VDC SYSTEM USER MANUAL
Case 2: Tri-axis Vibration Measurement
You can use either one tri-axis accelerometer to measure the 3D vibration. Simply connect
ch1, ch2 and ch3 of CoCo to the X, Y and Z axis of the tri-axis sensor. The sensor will
generate signals for three channels simultaneously.
ch1 ch2 ch3
Figure 249: Connecting Tri-axis Accelerometer
Case 3: Single Channel Vibration Measurement + Tacho
Connect ch1 of CoCo to the analog output of tachometer; connect ch2 of CoCo to the sensor.
ch1 ch2
Figure 250: Connecting Tachometer and Accelerometer
Case 4: Tri-axis Vibration Measurement + Tacho
Connect ch1 of CoCo to the analog output of the tachometer. Connect ch2, ch3 and ch4 of
CoCo to the X, Y and Z axis of the tri-axis sensor.
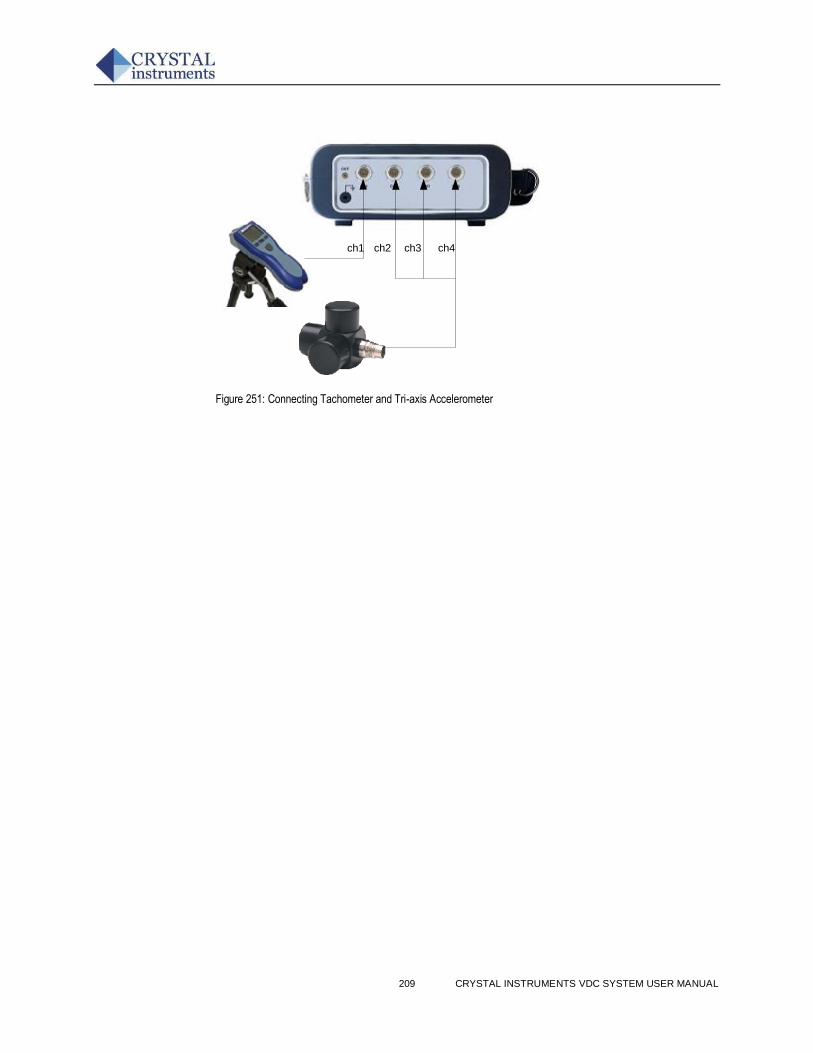
209 CRYSTAL INSTRUMENTS VDC SYSTEM USER MANUAL
ch1 ch2 ch3 ch4
Figure 251: Connecting Tachometer and Tri-axis Accelerometer
210 CRYSTAL INSTRUMENTS VDC SYSTEM USER MANUAL
Index
About Tab, 79
Access, 28
Advanced Tab, 29
Alarm Report, 76
Analysis Pane, 64
Analysis Parameters, 97
Appendix 1: Dynamic Signal Analysis, 133
Arbitrary Waveform, 96
Audio, 102
Auto backup, 31
Auto Save, 31
Average Type, 35
Averaging, 143; Exponential, 144; Linear, 143; Peak-hold, 144
Averaging Number, 35
Bearing Detection, 155
Block Size, 134
Chart Report, 76
CI Technical Support, 14
clock battery, 118
CoCo Recovery, 45
CoCo serial number, 14
Combine Mode, 73
Common Properties, 41
Connection Wizard, 120, 122, 123, 125
Connections, 104
211 CRYSTAL INSTRUMENTS VDC SYSTEM USER MANUAL
Create a new database, 29
Cross-Over Ethernet Cable Connection, 123
Cursor, 97
Database backup, 31
Database Management, 47
Database Operations, 32
Database structure, 48
Date/Time, 103
dB, 139
Demod BW, 35
Demodulated Spectra, 22
Demodulated Waveforms, 21
Demodulation, 152
Devices Toolbar, 33
Digit Notation, 105
Digital Integration, 145
Download, 63
DSA mode, 16
EDM Settings, 27
EDM Software Installation, 13
EDM upgrades, 16
EDM User Interface, 22
Engineering Data Management, 16
Ethernet, 120
Exception Report, 76
Factory backup, 31
212 CRYSTAL INSTRUMENTS VDC SYSTEM USER MANUAL
Fast Fourier Transform, 133
FFT, 136, 137
Flattop window, 142
Fmax, 134, 151, 152
Fmin, 134, 151, 152
Forcing frequencies, 65
Fourier transform, 135
Free Run, 37
Frequency Properties, 42
Gage readings, 20
General Properties, 41
Hann window, 142
hierarchical database, 17
Home Page, 25
Home Page Ribbon, 25, 27, 28
IEPE, 94, 159
Input Mode, 95
Installation, 7
Keypad Lock, 112
License Key, 13
License Key Toolbar, 46
Lines/Sample, 35
main battery, 118
Manage, 30
MAT-File Preference, 42
Max Freq, 35
213 CRYSTAL INSTRUMENTS VDC SYSTEM USER MANUAL
Measurement Entries, 18
Memory, 103
Min Freq, 35
multiple displays, 69
MySQL Database Server, 8
Navigation, 80
Notes, 51
Onsite Measurement, 88
Output Channel, 95
Overlap Percentage, 35
Page Views, 23
Parameter Template Toolbar, 33
password, 14
Pop-Up Messages, 25
Power, 104
Power Down, 85
Power Spectrum, 42, 137
Pulse Edge, 37
Quick Access Toolbar, 24
Radix-2 DIF FFT, 136
Reading Report, 76
Recovery, 45
Remote Display, 27
Replace Mode, 72
Report Page, 27
RMS, 139
214 CRYSTAL INSTRUMENTS VDC SYSTEM USER MANUAL
Route Management, 90
Routes, 18
Run Down and Up, 37
Run Up, 37
Run Up and Down, 37
Safety, 5, 6
SD memory card, 110
Setting Up a Route, 47
Signal Display Window, 91
Signal Export, 41
Software Option, 102
Software Update, 15
Spectra, 21
Start Button, 25, 26
Start Meas., 99
Startup, 84
Status Bar, 25, 84
Structure Report, 76
Style Tab, 78, 79
System Setup, 101
Tachometer, 60
Tag, 61
Theme, 105
Time Domain Waveform, 133
Toolbar Ribbons, 23
Trend recording backup, 31
215 CRYSTAL INSTRUMENTS VDC SYSTEM USER MANUAL
Uniform window, 142
Update, 46, 104
Upload, 70
USB Connection, 122
USB Driver, 14
User, 104
VdB, 140
VDC mode, 16
VDC Ribbon, 28
Version History, 171
Vibration Data Collector mode, 16
warm-up phase, 5
Warranty, 4
waveform, 20
Weighting Factor, 35
Window Type, 35
Windowing, 137
Wired Local Area Network Connection, 124
Wireless SD card, 120

216 CRYSTAL INSTRUMENTS VDC SYSTEM USER MANUAL
217 CRYSTAL INSTRUMENTS VDC SYSTEM USER MANUAL
Version History
Date: 3/11/09 Version:
Preliminary
Comments
EDM Users Guide Typeface
Headings: Arial Black 12 and 11 pt
Body Text: Arial 10 pt
Captions: Arial Narrow 9 pt
218 CRYSTAL INSTRUMENTS VDC SYSTEM USER MANUAL
Declaration of Conformity
Declaration of Conformity for CI CoCo, Handheld Data Acquisition System
Manufacturer: Crystal Instruments Corporation, 4633 Old Ironsides Drive, Suite 304, Santa
Clara, CA 95054
Statement of Conformity:
EC Declaration of Conformity
Council Directive 2004/108/EC on Electromagnetic Compatibility
WE, Crystal Instruments
4633 Old Ironsides Drive, Suite 304, Santa Clara, CA 95054, USA.
Product Name: CoCo (Handheld Data Acquisition System)
Model No.: CoCo
Assessment of compliance of the product with the requirement relating to Electromagnetic
Compatibility Directive .The product has been assessed by the application of the following
standards:
EN 61326:1997+A1:1998+A2:2001
EN61000-3-2: 2000
EN61000-3-3: 1995+A1:2001
The tests have been performed in a typical configuration.
This Conformity is indicated by the symbol, i.e. “Conformité Européenne”.


![Nickel and Cobalt Recovery from Mesaba Concentrate [0.94 MB]](https://img.pdfslide.us/doc/110x75/5868b9411a28ab427d8b4f69/nickel-and-cobalt-recovery-from-mesaba-concentrate-094-mb.jpg)