Embed Size (px)
Citation preview

1
DRAFT
Interim report 1 January – 31 March 2014
3 months ended 31 March 2014
Local currency sales decreased by 2% and Euro sales decreased by 14% to €327.2m (€381.3m).
Number of active consultants decreased by 5% to 3.5m.
EBITDA amounted to €29.4m (€45.2m).
Adjusted* operating margin was 7.0% (10.0%), negatively impacted by approximately 450 bps
from currency volatility, partly offset by hedging and positive price / mix effects, resulting in an
adjusted* operating profit of €23.1m (€38.0m).
Adjusted* net profit amounted to €12.0m (€28.0m) and adjusted* EPS amounted to €0.22 (€0.50).
Cash flow from operating activities amounted to €16.9m (€28.4m).
Second quarter update: The underlying sales development in the second quarter to date is
approximately -2% in local currency, and the year to date development is approximately -2% in
local currency.
New structure of segment reporting reflecting the new Global Business Areas.
* Adjusted for restructuring costs during the quarter €0.4m.
Significant events during and after the end of the quarter
In line with the adjusted dividend proposal announced in April, the Board proposes Q2 dividend
payment of €0.25 per share following the AGM on 19 May 2014.
Based on the proposed mandate to the Board (subject to approval by the AGM) and given the
exceptional geopolitical events in Russia and Ukraine, impacting currencies and economic climate,
the Board does not intend to make any dividend payment in Q3. Subsequent dividend payments
will be announced in upcoming quarterly reports.
Planned alignment of legal structure continues.
CEO Magnus Brännström comments “With sharply devaluating currencies and challenges of exceptional nature in our two largest markets Russia and Ukraine, there is no doubt
the company is facing very tough conditions. As a measure of prudence, the Board is of the opinion that there should be no dividend payment
in Q3. Our new split of Global Business Areas clearly illustrates the situation: we need to return the momentum and improve profitability in
CIS and Europe while we continue to see a very positive development in Latin America, Turkey, Africa & Asia. During the end of the first quarter, additional improvements to the CIS Success Plan were launched and I am pleased to see the drive
among our Leaders despite the current challenges. There is an undivided focus on restoring growth and mitigating the negative impact on
profitability from the geopolitical situation, currency headwind and lack of leverage through margin improvements and reduced cost levels.”

2
Sales and earnings
FINANCIAL
SUMMARY (€ Million)
3 months ended
31 March
20141 2013 Change
LTM2,
April ’13- March ‘14
Year end 20133
Sales 327.2 381.3 (14%) 1,352.6 1,406.7
Gross margin, % 68.5 69.6 69.9 70.1
EBITDA 29.4 45.2 (35%) 150.7 166.5
Adj. operating profit 23.1 38.0 (39%) 127.5 142.4
Adj. operating margin, % 7.0 10.0 9.4 10.1
Adj. net profit before tax 18.6 36.5 (49%) 94.9 112.8
Adj. net profit 12.0 28.0 (57%) 68.4 84.4
Adj. EPS, € 0.22 0.50 (57%) 1.23 1.52
Cash flow from operating activities 16.9 28.4 (40%) 100.6 112.1
Net interest-bearing debt 270.4 236.9 14% 270.4 275.9
Net interest-bearing debt at hedged values 257.3 195.0 32% 257.3 263.3
Active consultants, ‘000 3,481 3,681 (5%) 3,481 3,460 1Adjusted for restructuring costs of €0.4m 2Adjusted for restructuring costs of €6.2m 3Adjusted for restructuring costs of €5.8m
Three months ended 31 March 2014
Sales in local currencies decreased by 2% and Euro sales amounted to €327.2m
compared to €381.3m in the same period prior year. Sales development in local
currencies was impacted by a 3% increase in productivity while the number of
active consultants in the quarter decreased by 5% to 3.5m (3.7m). Unit sales
were down by 6%, largely offset by a positive price/mix effect of 4%.
Local currency sales increased by 19% in Latin America and by 16% in
Turkey, Africa & Asia while CIS decreased by 11% and Europe by 6%.
The gross margin was 68.5% (69.6%) and the adjusted operating margin
(adjusted for €0.4m in restructuring cost) amounted to 7.0% (10.0%). Currency
movements had a negative impact of approximately 450 bps on the adjusted
operating margin, partly offset by hedging and positive price / mix effects.
The margin improvements initiatives with the focus on general
organizational efficiencies, waste reduction and cost reductions in both the direct
and the indirect spend areas, are in the process of implementation and have
started to deliver benefits.
Adjusted net profit amounted to €12.0m (€28.0m) and adjusted earnings per
share amounted to €0.22 (€0.50), impacted by higher losses on exchange
compared to prior year.
Cash flow from operating activities was €16.9m (€28.4m), negatively
affected by lower EBITDA.
The average number of full-time equivalent employees was 7,375 (7,435).
-450 bps currency effect on adjusted operating margin
-2 %
Local currency sales

3
Operational highlights
Brand and Innovation The Skin Care category continued its successful roll-out of the Ecollagen range
with active anti-aging ingredients from plant stem cells. In the first quarter it
became the biggest launch ever in the history of Oriflame Latin America. In
addition, further products were added to the range, Wrinkle Correcting and
Lifting Serum as well as three cleansers. The roll-out was strongly endorsed by
the Oriflame Global Skin Expert Panel, sharing their insight with Oriflame
Consultants worldwide.
Within the Color Cosmetics category two major launches were the Giordani
Gold Invisible Touch Foundation and the Hyper Stretch XL Mascara.
The Fragrances female category launched Lady Avebury in the premium
segment, following up on the earlier Sir Avebury, and Volare. Ultimate was
added to the male segment. The fragrance Power Woman, endorsed by celebrity
Tina Kandelaki in the CIS, became a winner of the Fifi Russian Fragrance
Awards 2013 - the fragrance industry's equivalent of the Oscars.
The You Dazzle cross category collection was launched for Women’s Day,
including products in the Personal Care and Color Cosmetics segments. The
Personal Care segment also introduced the WTA Strong is Beautiful range, a
world-first collaboration between Oriflame and the Women’s Tennis
Association.
Within the Wellness category the Natural Balance Bars Chocolate and
Strawberries were successfully launched, Oriflame’s first ready-to-eat products.
In quarter one Oriflame was a main sponsor of the Mercedes Benz Fashion
Week in Stockholm and of the Moscow Fashion Week, which also included a
pre-launch of the new fashion-inspired make-up brand The ONE. To support the
launch of The ONE, Oriflame has founded The ONE Collective - an exciting
collaboration with beauty and fashion influencers such as bloggers, make-up
artists, models and stylists from around the world who will contribute to making
The ONE “your One-stop Beauty and Fashion Destination”. Elin Kling, the
world famous fashion entrepreneur and blogger, will be the Global Ambassador
for The ONE Collective.
Online
In the first quarter utilisation of the company’s online services continued to
increase, along with overall site activity and incoming traffic. Compared to the
same period last year site activity was up by almost 10% and traffic by 5%.
To further facilitate for site visitors and to increase conversion rates, a new
online payments system was launched in several pilot markets during the period,
making the check-out and payment process faster and more convenient for
customers and consultants. The new payments system will be rolled out in key
markets during 2014.
The ongoing work to have the new global internet platform operational
during 2014 continues according to plan, aiming at harmonising communication
in digital channels and broaden the service offering.
Online highlights for the quarter:
- More than 90% of total orders placed online
- More than 5 million followers on the company’s global Facebook pages
- 15 million unique visitors on Oriflame websites

4
Service
During the first quarter, Oriflame maintained satisfactory service levels while
inventory cover days increased due to lower sales.
The European Group Distribution Centers (GDCs) continue to deliver good
service at well-controlled costs. The two Central European GDCs in Warsaw and
in Budapest have completed the phase of integration of the markets included in
the original scope. The addition of further markets and the re-balancing of some
markets between the two sites are being evaluated. Also an extension of the
territorial scope of the GDC in Noginsk is being prepared. The main focus for
the Kiev GDC is to manage the impact of the situation in the country.
The construction works at the Noginsk site in Russia, are proceeding
according to plan with the validation of the production processes planned to start
in the autumn. The preparations for the LEED certification of the factory
building are on-going.
In Roorkee, India, the refurbishment of the new Wellness facility continues,
and the project has been registered for LEED certification. The factory will be
ready for production in the second half of the year.
During the first quarter, implementation actions have continued in line with
the company’s sustainability strategy. A key achievement has been the
implementation of “zero waste to landfill” for the Oriflame production facility in
China, adding to the factories in Sweden and in Poland for which this is already
achieved. The work with the Rainforest Alliance to move towards a more
sustainable timber supply chain is progressing. The 2013 paper footprint report
developed this quarter, shows that Oriflame was 94% compliant with the paper
commitment in terms of catalogues paper and 96% compliant in terms of paper
based components such as cartons, leaflets and liners.

5
CIS
Key figures
Q1’13 Q2’13 Q3’13 Q4’132 Q1’14
Sales, €m 204.7 173.4 134.9 181.1 154.9
Sales growth in € (7%) (12%) (11%) (16%) (24%)
Sales growth in lc (6%) (8%) (3%) (8%) (11%)
Adj. op profit, €m1 32.9 24.9 18.7 27.1 22.2
Adj. op margin 16.1% 14.4% 13.9% 14.9% 14.3%
Active consultants, ‘000 1,893 1,705 1,382 1,648 1,637
¹ Excludes costs accounted for in the segments Manufacturing and Other.
This is in line with prior years.
2 Adjusted for restructuring costs of €0.3m
Countries
Armenia, Azerbaijan, Belarus, Georgia, Kazakhstan, Kyrgyzstan, Moldova, Mongolia, Russia,
Ukraine.
Development
Local currency sales in the first quarter decreased by 11%, as a result of a 14%
decrease in the number of active consultants and an increase in productivity of
3%. Euro sales were down by 24% to €154.9m (€204.7m).
Further communication and fine tuning of the Success Plan was
implemented in the end of the quarter with the aim to strengthen the momentum
among the Oriflame Consultants.
The exceptional situation in Ukraine had a substantial negative impact on
consumer sentiment which clearly affected sales during the quarter. The situation
has further deteriorated and focus is on adapting the organization to increase
efficiency while ensuring high service to the Oriflame Consultants.
Local currency sales in Russia was down by 8%, impacted by a negative
timing effect and general weak demand.
Adjusted operating profit amounted to €22.2m (€32.9m) resulting in an
adjusted operating margin of 14.3% (16.1%). Margins were negatively affected
by exchange rate movements following sharp devaluation of some of the main
currencies.
Europe
Key figures
Q1’13 Q2’13 Q3’132 Q4’13 Q1’14
Sales, €m 73.6 71.6 65.4 85.9 68.3
Sales growth in € (12%) (13%) (7%) (10%) (7%)
Sales growth in lc (12%) (14%) (6%) (9%) (6%)
Adj. op profit, €m1 8.7 9.0 6.9 14.0 6.8
Adj. op margin 11.8% 12.6% 10.5% 16.2% 10.0%
Active consultants, ‘000 625 600 548 630 580
1Excludes costs accounted for in the segments Manufacturing and Other.
This is in line with prior years.
2Adjusted for restructuring costs of €0.5m
Countries
Bosnia, Bulgaria, Croatia, Czech Rep., Denmark, Estonia, Finland, Greece, Holland, Hungary,
Kosovo, Latvia, Lithuania, Macedonia, Montenegro, Norway, Poland, Portugal, Romania, Serbia,
Slovakia, Slovenia, Spain, Sweden, UK/Ireland.
Development
Local currency sales in the first quarter decreased by 6%, a result of a 7%
decrease in active consultants and a 1% productivity increase. Euro sales were
down by 7% to €68.3m (€73.6m). Challenges persist in many Central and
Escalated challenges and currency devaluation
-6%
Local currency sales

6
Northern European markets while Southern Europe continues to show
stabilisation.
Adjusted operating margin decreased to 10.0% (11.8%) and the adjusted
operating profit was €6.8m (€8.7m). The margin was negatively impacted by
discounts and higher sales and marketing expenses while there was a positive
impact from administrative efficiencies.
Latin America
Key figures
Q1’13 Q2’13 Q3’13 Q4’13 Q1’14
Sales, €m 24.8 29.9 31.2 30.2 26.5
Sales growth in € 11% 24% 10% 17% 7%
Sales growth in lc 10% 21% 19% 27% 19%
Op profit, €m1 2.1 4.1 5.1 4.1 2.6
Op margin 8.4% 13.6% 16.3% 13.5% 9.8%
Active consultants, ‘000 176 195 224 223 213
¹Excludes costs accounted for in the segments Manufacturing and Other.
This is in line with prior years.
Countries
Chile, Colombia, Ecuador, Mexico, Peru.
Development
Local currency sales in the first quarter increased by 19% as a result of a 21%
increase in the number of active consultants and 2% decrease in productivity
compared to prior year. Euro sales were up by 7% to €26.5m (€24.8m). Local
currency sales were strong in all markets, particularly in Mexico.
Operating profit amounted to €2.6m (€2.1m) and operating margin increased
to 9.8% (8.4%). The operating margin improvement was driven by leverage on
overhead costs and price increases while currency movements had a negative
impact.
Turkey, Africa & Asia
Key figures
Q1’13 Q2’13 Q3’13 Q4’13 Q1’14
Sales, €m 75.9 82.1 61.0 72.1 75.2
Sales growth in € 14% 19% 6% 0% (1%)
Sales growth in lc 22% 24% 21% 17% 16%
Op profit, €m1 6.2 11.6 5.2 13.3 9.2
Op margin 8.2% 14.1% 8.5% 18.5% 12.2%
Active consultants, ‘000 987 962 843 959 1,051
¹ Excludes costs accounted for in the segments Manufacturing and Other.
This is in line with prior years.
Countries
Algeria, China, Egypt, India, Indonesia, Kenya, Morocco, Myanmar, Nigeria, Pakistan, Sri Lanka,
Tanzania, Thailand, Tunisia, Turkey, Uganda, Vietnam.
Development
First quarter sales growth in local currencies was 16% as a result of a 7%
increase in the number of active consultants and 9% increase in productivity.
Sales growth was particularly strong in Indonesia and in the African markets.
Euro sales amounted to €75.2m (€75.9m).
Operating margin increased to 12.2% (8.2%), mainly as a result of an
improved gross margin. Operating profit was €9.2m (€6.2m).
+19%
Local currency sales
Strong sales and margin development

7
Sales, operating profit and consultants by Global Business Area
Sales
(€ Million)
3 months ended
31 March
Change in
Euro
Change in
lc
2014 2013
LTM,
April’13-
March ‘14
Year end
2013
CIS 154.9 204.7 (24%) (11%) 644.3 694.1
Europe 68.3 73.6 (7%) (6%) 291.2 296.5
Latin America 26.5 24.8 7% 19% 117.7 116.1
Turkey, Africa & Asia 75.2 75.9 (1%) 16% 290.4 291.0
Manufacturing 0.8 0.9 (8%) (7%) 2.1 2.1
Other 1.5 1.4 8% 2% 7.0 6.9
Total sales 327.2 381.3 (14%) (2%) 1,352.7 1,406.7
Adj. operating profit
(€ Million)
3 months ended
31 March
Change
2014 2013
LTM,
April’13-
March’14
Year end
2013
CIS 22.2 32.9 (32%) 92.8 103.5
Europe 6.8 8.7 (22%) 36.7 38.6
Latin America 2.6 2.1 23% 15.8 15.3
Turkey, Africa & Asia 9.2 6.2 47% 39.3 36.4
Manufacturing 1.5 3.2 (54%) 9.0 10.7
Other (19.2) (15.1) 27% (66.1) (62.1)
Total adj. operating profit 23.1 38.0 (39%) 127.5 142.4
Active consultants (´000)
31 March
Change
2014 2013
Year End
2013
CIS 1,637 1,893 (14%) 1,648
Europe 580 625 (7%) 630
Latin America 213 176 21% 223
Turkey, Africa & Asia 1,051 987 7% 959
Total 3,481 3,681 (5%) 3,460

8
Cash flow & investments
Cash flow from operating activities in the first quarter amounted to €16.9m
(€28.4m) mainly as a result of lower operating profit. Cash flow used in
investing activities amounted to €-8.6m (€-7.3m).
Financial position
Net interest-bearing debt amounted to €270.4m compared to €236.9m at the end
of the first quarter 2013. The net debt/EBITDA ratio was 1.8 (1.2) and interest
cover amounted to 5.6 (9.1) in the first quarter 2014 and to 6.8 (9.5) during the
last twelve months.
Net interest-bearing debt at hedged values amounted to €257.3m (€195.0m).
The net debt at hedged values/EBITDA ratio was 1.7 (1.0).
Related parties
There have been no significant changes in the relationships or transactions with
related parties compared with the information given in the Annual Report 2013.
Dividend
In April, Oriflame’s Board of Directors adjusted its dividend proposal and
proposed to the Annual General Meeting (AGM) a cash dividend of up to a total
of €1.00 per share, and that payments will be made on a quarterly basis with the
first payment of €0.25 per share after the AGM, and that the Board be given a
mandate to decide the timing and size of the subsequent quarterly payments.
Subject to approval of the mandate by the AGM, the Board does not intend to
make any dividend payment during Q3. Subsequent dividend payments will be
announced in upcoming quarterly reports.
Annual Report
The annual report was published on the company’s website on 14 April 2014.
Annual General Meeting
Oriflame Cosmetics S.A. will hold its 2014 Annual General Meeting in
Luxembourg on 19 May 2014.
Personnel
The average number of full-time equivalent employees amounted to 7,375
(7,435).
New structure of segment reporting
From the first quarter of 2014, Oriflame has changed its segment reporting to the
following structure of Global Business Areas (GBA):
1. CIS (excluding Baltics)
2. Europe (including Baltics)
3. Latin America
4. Turkey, Africa & Asia
5. Manufacturing
6. Other
The revised geographical split in 1 through 4 above should be more relevant in
terms of better reflecting common challenges, opportunities and development. In
general terms, Latin America and Turkey, Africa & Asia can be said to represent
€16.9m in operating cash flow
9
the main current and future growth markets whereas Europe and CIS are more
mature in nature.
For comparability the numbers in the press release have been restated for the
last five quarters.
Alignment of legal structure
As announced in April 2013, Oriflame is reviewing its legal structure. On 14
April 2014, Oriflame’s Board of Directors proposed that shareholders, at an
Extraordinary General Meeting (EGM) on 19 May 2014, take decisions to enable
taking the next step in the alignment of the legal structure to Group operations in
order to enable further efficiencies, which includes a forthcoming relocation of
the Group’s domicile from Luxembourg to Switzerland. Further information
about the proposal was included in the notice to the EGM and in a separate press
release from 14 April 2014.
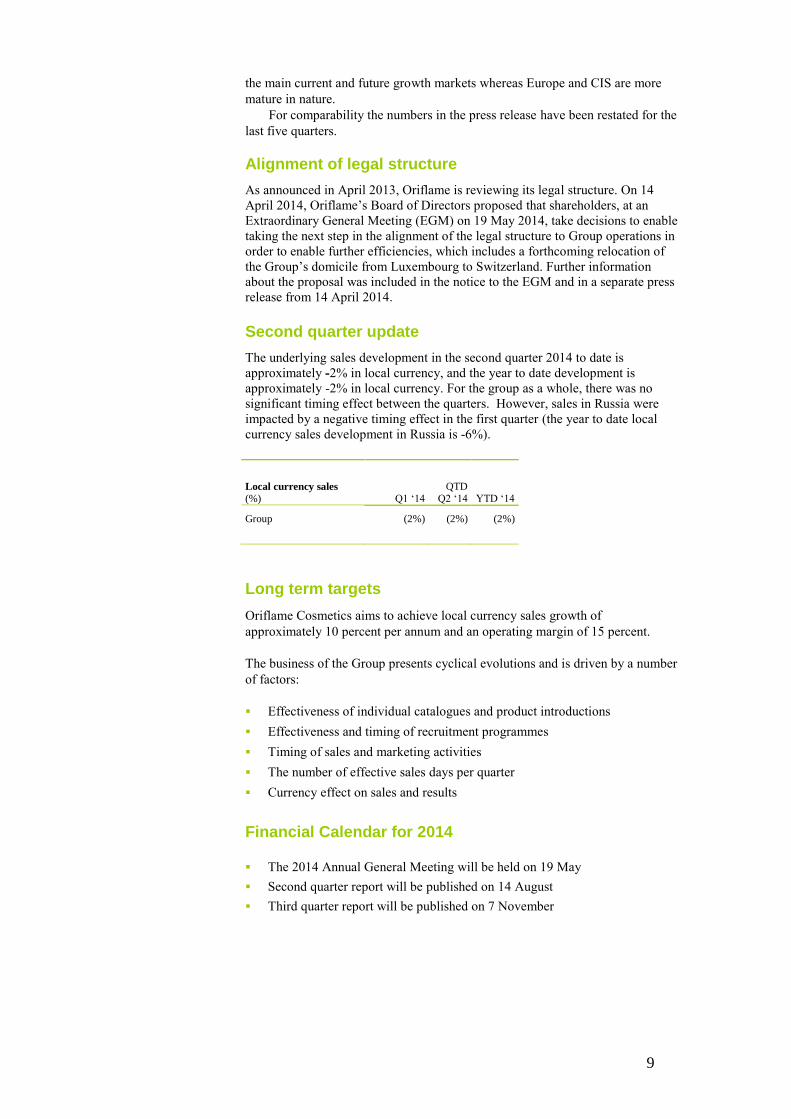
Second quarter update
The underlying sales development in the second quarter 2014 to date is
approximately -2% in local currency, and the year to date development is
approximately -2% in local currency. For the group as a whole, there was no
significant timing effect between the quarters. However, sales in Russia were
impacted by a negative timing effect in the first quarter (the year to date local
currency sales development in Russia is -6%).
Local currency sales (%)
YTD ‘14 Q1 ‘14 QTD
Q2 ‘14
Group (2%) (2%) (2%)
Long term targets
Oriflame Cosmetics aims to achieve local currency sales growth of
approximately 10 percent per annum and an operating margin of 15 percent.
The business of the Group presents cyclical evolutions and is driven by a number
of factors:
Effectiveness of individual catalogues and product introductions
Effectiveness and timing of recruitment programmes
Timing of sales and marketing activities
The number of effective sales days per quarter
Currency effect on sales and results
Financial Calendar for 2014 The 2014 Annual General Meeting will be held on 19 May
Second quarter report will be published on 14 August
Third quarter report will be published on 7 November

10
Other
A Swedish translation is available on www.oriflame.com.
Conference call for the financial community The company will host a conference call on Wednesday, 7 May at 15.30 CET.
Participant access numbers:
Luxembourg: +352 2 786 0202
Sweden: +46 (0)8 506 443 86
Switzerland: +41 44 580 65 22
UK: +44 20 7153 9154
US: +1 877 423 0830
Confirmation code: 865360#
The conference call will also be audio web cast in “listen-only” mode through
Oriflame’s website: www.oriflame.com or through http://www.media-server.com/m/p/oe7aw57i
7 May 2014
Magnus Brännström
Chief Executive Officer
For further information, please contact: Magnus Brännström, Chief Executive Officer, Tel: +352 691 151 930
Gabriel Bennet, Chief Financial Officer, Tel: +41 798 263 713
Johanna Palm, Director Investor Relations, Tel: +46 765 422 672
Oriflame Cosmetics S.A.
24 Avenue Emile Reuter, L-2420, Luxembourg
www.oriflame.com
Company registration no B.8835

11
Consolidated key figures
3 months ended
31 March
2014 2013
LTM, Apr’13-
Mar’14
Year end
2013
Gross margin, % 68.5 69.6 69.9 70.1
EBITDA margin, % 9.0 11.9 11.1 11.8
Adj. operating margin, % 7.0 10.0 9.4 10.1
Return on:
- operating capital, % - - 26.3 29.8
- capital employed, % - - 23.2 25.4
Net debt / EBITDA (LTM) 1.8 1.2 1.8 1.7
Interest cover 5.6 9.1 6.8 7.6
Average no. of full-time
equivalent employees 7,375 7,435 7,325 7,340
Definitions
Operating capital
Total assets less cash and cash equivalents and non interest-bearing liabilities,
including deferred tax liabilities.
Return on operating capital
Operating profit divided by average operating capital.
Capital employed
Total assets less non interest-bearing liabilities, including deferred tax liabilities.
Return on capital employed
Operating profit plus interest income divided by average capital employed.
Net interest-bearing debt
Interest-bearing debt excluding front fees less cash and cash equivalents.
Interest cover
Operating profit plus interest income divided by interest expenses and charges.
Net interest-bearing debt to EBITDA
Net interest-bearing debt divided by EBITDA.
EBITDA
Operating profit before financial items, taxes, depreciation, amortisation and
share incentive plan.

12
Quarterly Figures
Financial summary Q4’12 Q1’13 Q2’13 Q3’131 Q4’132 Q1’143
Sales, €m 410.6 381.3 359.7 294.6 371.2 327.2
Gross margin, % 73.3 69.6 70.7 69.6 70.5 68.5
EBITDA, €m 64.1 45.2 42.2 26.9 52.0 29.4
Adj. operating profit, €m 56.2 38.0 34.5 23.1 46.8 23.1
Adj. operating margin, % 13.7 10.0 9.6 7.8 12.6 7.0
Adj. net profit before income tax, €m 47.9 36.5 25.2 13.1 38.0 18.6
Adj. net profit, €m 37.2 28.0 19.9 9.4 27.2 12.0
Adj. EPS, diluted € 0.65 0.50 0.36 0.17 0.49 0.22
Cash flow from op. activities, €m 77.9 28.4 29.3 (9.3) 63.7 16.9
Net interest-bearing debt, €m 214.0 236.9 314.9 330.5 275.9 270.4
Active consultants, ‘000 3,422 3,681 3,462 2,998 3,460 3,481
Sales, €m Q4’12 Q1’13 Q2’13 Q3’13 Q4’13 Q1’14
CIS 216.0 204.7 173.3 134.9 181.1 154.9
Europe 95.1 73.6 71.6 65.4 85.9 68.3
Latin America 25.8 24.8 29.9 31.2 30.2 26.5
Turkey, Africa & Asia 71.9 75.9 82.1 61.0 72.1 75.2
Manufacturing 0.1 0.9 0.8 0.3 0.1 0.8
Other 1.7 1.4 2.0 1.8 1.8 1.5
Oriflame 410.6 381.3 359.7 294.6 371.2 327.2
Adj. operating Profit, €m Q4’12 Q1’13 Q2’13 Q3’13 Q4’13 Q1’14
CIS 39.2 32.9 24.9 18.7 27.1 22.2
Europe 18.6 8.7 9.0 6.9 14.0 6.8
Latin America 2.5 2.1 4.1 5.1 4.1 2.6
Turkey, Africa & Asia 10.5 6.2 11.6 5.2 13.3 9.2
Manufacturing 1.6 3.2 2.8 2.9 1.7 1.5
Other (16.2) (15.1) (17.9) (15.7) (13.4) (19.2)
Oriflame 56.2 38.0 34.5 23.11 46.82 23.13
Active consultants, ‘000 Q4’12 Q1’13 Q2’13 Q3’13 Q4’13 Q1’14
CIS 1,732 1,893 1,705 1,383 1,648 1,637
Europe 678 625 600 548 630 580
Latin America 174 176 195 224 223 213
Turkey, Africa & Asia 838 987 962 843 959 1,051
Oriflame 3,422 3,681 3,462 2,998 3,460 3,481
Adj. operating Margin, % Q4’12 Q1’13 Q2’13 Q3’13 Q4’13 Q1’14
CIS 18.1 16.1 14.4 13.9 14.9 14.3
Europe 19.6 11.8 12.6 10.5 16.2 10.0
Latin America 9.7 8.4 13.6 16.3 13.5 9.8
Turkey, Africa & Asia 14.6 8.2 14.1 8.5 18.5 12.2
Oriflame 13.7 10.0 9.6 7.81 12.62 7.03 1 Adjusted for restructuring costs of €3.6m 2 Adjusted for restructuring costs of €2.2m 3 Adjusted for restructuring costs of €0.4m

13
€ Sales Growth in % Q4’12 Q1’13 Q2’13 Q3’13 Q4’13 Q1’14
CIS (4) (7) (12) (11) (16) (24)
Europe (3) (12) (13) (7) (10) (7)
Latin America 18 11 24 10 17 7
Turkey, Africa & Asia 14 14 19 6 0 (1)
Oriflame 0 (4) (4) (5) (10) (14)
Cash Flow, €m Q4’12 Q1’13 Q2’13 Q3’13 Q4’13 Q1’14
Operating cash flow 77.9 28.4 29.3 (9.3) 63.7 16.9
Cash flow used in investing activities (21.7) (7.3) (16.9) (13.1) (15.7) (8.6)

14
Condensed consolidated interim income statements
€’000
3 months ended 31 March
2014 2013
LTM,
Apr’13-Mar’14
Year End 2013
Sales 327,232 381,292 1,352,661 1,406,721
Cost of sales (103,213) (115,984) (407,520) (420,291)
Gross profit 224,019 265,308 945,141 986,430
Other income 11,430 14,033 49,208 51,811
Selling and
marketing expenses (125,908) (143,708) (508,045) (525,847)
Distribution and Infrastructure
(27,059) (33,549) (108,438) (114,724)
Administrative expenses
(59,850) (64,077) (256,631) (261,062)
Operating profit 22,633 38,007 121,234 136,608
Analysis of
operating profit:
Adjusted operating
profit 23,058 38,007 127,445 142,394
Restructuring (425) - (6,211) (5,786)
Operating profit 22,633 38,007 121,234 136,608
Financial income 13,102 12,716 39,344 38,959
Financial expenses (17,579) (14,182) (71,935) (68,538)
Net financing costs (4,477) (1,466) (32,591) (29,579)
Net profit before
income tax
18,156 36,541 88,644 107,029
Total income tax
expense (6,622) (8,566) (26,442) (28,386)
Net profit 11,534 27,975 62,202 78,643
€
3 months ended
31 March
2014 2013
LTM,
Apr’13-
Mar’14
Year end
2013
Adj. EPS:
- basic 0.22 0.50 1.23 1.52
- diluted 0.22 0.50 1.23 1.52
Weighted avg. number of
shares outstanding:
- basic 55,600,653 56,208,138 55,573,143 55,722,934
- diluted 55,600,653 56,208,138 55,573,143 55,722,934
Total number of shares
outstanding:
- basic 55,600,653 55,599,060 55,600,653 55,600,653
- diluted 55,600,653 55,599,060 55,600,653 55,600,653
15
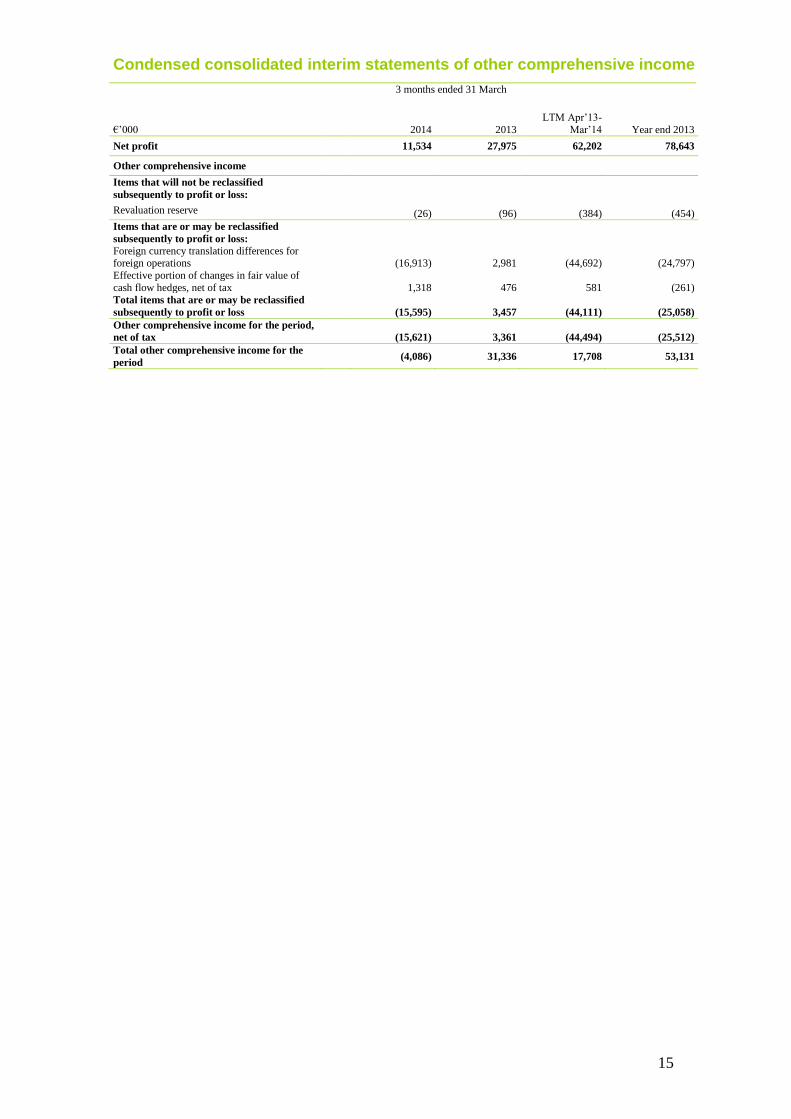
Condensed consolidated interim statements of other comprehensive income
€’000
3 months ended 31 March
2014 2013
LTM Apr’13-
Mar’14 Year end 2013
Net profit 11,534 27,975 62,202 78,643
Other comprehensive income
Items that will not be reclassified
subsequently to profit or loss:
Revaluation reserve (26) (96) (384) (454)
Items that are or may be reclassified
subsequently to profit or loss:
Foreign currency translation differences for foreign operations
(16,913) 2,981 (44,692) (24,797)
Effective portion of changes in fair value of
cash flow hedges, net of tax
1,318 476 581 (261)
Total items that are or may be reclassified
subsequently to profit or loss
(15,595) 3,457 (44,111) (25,058)
Other comprehensive income for the period,
net of tax
(15,621) 3,361 (44,494) (25,512)
Total other comprehensive income for the
period (4,086) 31,336 17,708 53,131

16
Condensed consolidated interim statements of financial position
€’000
31 March,
2014
31 December,
2013
31 March,
2013
Assets
Property, plant and equipment 241,253 254,537 254,563
Intangible assets 19,842 20,802 20,243
Investment property 814 928 1,005
Deferred tax assets 26,327 26,614 29,502
Other long-term receivables 855 1,129 1,486
Total non-current assets 289,091 304,010 306,799
Inventories 193,797 196,876 203,977
Trade and other receivables 87,516 83,597 102,413
Tax receivables 4,122 2,894 3,446
Prepaid expenses 42,904 53,412 43,054
Derivative financial assets 28,115 18,973 45,336
Cash and cash equivalents 93,375 107,336 90,463
Total current assets 449,829 463,088 488,689
Total assets 738,920 767,098 795,488
Equity
Share capital 71,517 71,517 71,401
Treasury shares (41,235) (41,235) (37,751)
Reserves (100,055) (84,458) (53,042)
Retained earnings 233,914 222,379 265,835
Total equity 164,141 168,203 246,443
Liabilities
Interest-bearing loans 360,213 379,672 323,654
Other long-term non interest-bearing liabilities 2,175 2,592 3,479
Deferred income 409 406 585
Deferred tax liablilities
4,894 4,621 4,146
Total non-current liabilities 367,691 387,291 331,864
Current portion of interest-bearing loans 2,835 2,744 2,569
Trade and other payables 88,926 82,357 89,139
Deferred Income 2,868 3,148 -
Tax payables 8,482 10,878 9,338
Accrued expenses 89,734 98,082 105,385
Derivative financial liabilities 7,683 6,440 7,748
Provisions 6,560 7,955 3,002
Total current liabilities 207,088 211,604 217,181
Total liabilities 574,779 598,895 549,045
Total equity and liabilities 738,920 767,098 795,488

17
Condensed consolidated interim statements of changes in equity
€’000 (Attributable to equity holders of the Company) Share capital
Total reserves
Retained earnings Total equity
At 1 January 2013 71,401 (56,403) 237,860 252,858
Net profit - - 27,975 27,975
Other comprehensive income
Revaluation reserve - (96) - (96)
Foreign currency translation differences for
foreign operations - 2,981 - 2,981
Effective portion of changes in fair value of cash flow hedges, net of tax
- 476 - 476
Total other comprehensive income for the
period, net of income tax - 3,361 - 3,361
Total comprehensive income for the period - 3,361 27,975 31,336
Purchase of treasury shares - (37,751) - (37,751)
At 31 March 2013 71,401 (90,793) 265,835 246,443
At 1 January 2014 71,517 (125,694) 222,380 168,203
Net profit - - 11,534 11,534
Other comprehensive income
Revaluation reserve - (26) - (26)
Foreign currency translation differences for
foreign operations - (16,913) - (16,913)
Effective portion of changes in fair value of cash flow hedges, net of tax
- 1,318 - 1,318
Total other comprehensive income for the
period, net of income tax - (15,621) - (15,621)
Total comprehensive income for the period - (15,621) 11,534 (4,087)
Share incentive plan - 25 - 25
At 31 March 2014 71,517 (141,290) 233,914 164,141

18
Condensed consolidated interim statements of cash flows
€’000
3 months ended
31 March
2014 2013
Operating activities
Net profit before income tax 18,156 36,541
Adjustments for:
Depreciation and impairment of property,
plant and equipment 5,555 6,073
Amortisation of intangible assets 1,207 1,110
Change in fair value of borrowings and
derivatives financial instruments (6,103) 1,608
Deferred income 111 56
Share incentive plan 25 -
Unrealised exchange rate differences 4,534 (2,175)
Profit on disposal of property, plant and
equipment, intangible assets and investment
property
(19) (101)
Financial income (4,206) (4,075)
Financial expenses 6,763 6,759
Operating profit before changes in working
capital and provisions 26,023 45,796
Decrease/(increase) in trade and other receivables, prepaid expenses and derivative
financial assets 3,309 (13,805)
(Increase)/decrease in inventories (355) 10,922
Increase/(decrease) in trade and other payables,
accrued expenses and derivatives financial liabilities 2,266 (3,373)
Decrease in provisions (1,309) (690)
Cash generated from operations 29,934 38,850
Interest received 4,325 4,052
Interest and bank charges paid (6,419) (6,525)
Income taxes paid (10,933) (7,997)
Cash flow from operating activities 16,907 28,380
Investing activities
Proceeds on sale of property, plant and
equipment, intangible assets and investment
property 1,169 106
Purchases of property, plant and equipment, and investment property (9,488) (6,844)
Purchases of intangible assets (280) (588)
Cash flow used in investing activities (8,599) (7,326)
Financing activities
Proceeds from borrowings 1,094 29,945
Repayments of borrowings (20,617) (29,950)
Acquisition of own shares - (37,751)
Decrease of finance lease liabilities (13) (15)
Cash flow used in financing activities (19,536) (37,769)
Change in cash and cash equivalents (11,228) (16,715)
Cash and cash equivalents at the beginning of the
period 106,788 106,171
Effect of exchange rate fluctuations on cash held (2,276) 958
Cash and cash equivalents at the end of the
period net of bank overdrafts 93,284 90,413

19
Notes to the condensed consolidated interim financial information of Oriflame
Cosmetics S.A.
Note 1 • Status and principal activity
Oriflame Cosmetics S.A. (“OCSA” or the “Company”) is a holding company incorporated in Luxembourg and registered at 24 Avenue
Emile Reuter, L-2420 Luxembourg. The principal activity of the Company’s subsidiaries is the direct sale of cosmetics. The condensed
consolidated interim financial information of the Company as at and for the three months ended 31 March 2014 comprises the Company
and its subsidiaries (together referred to as the “Group”).
Note 2 • Basis of preparation and summary of significant accounting policies
Statement of compliance
The condensed consolidated interim financial information has been prepared by management in accordance with the measurement and
recognition principles of International Financial Reporting Standard (IFRS) as adopted by the European Union (“EU”) and should be
read in conjunction with the consolidated financial statements of the Group as at and for the year ended 31 December 2013. The condensed consolidated interim financial information was authorised for issue by the Directors on 7 May 2014.
Changes in accounting policies
The accounting policies applied by the Group in this condensed consolidated interim financial information are the same as those applied
by the Group in its consolidated financial statements as at and for the year ended 31 December 2013 with the exception of new or revised standards endorsed by the EU, as explained below.
Other new or amended IFRS standards
The other new or amended IFRS standards, which became effective January 1, 2014, have had no material effect on the condensed consolidated interim financial information
Changes in presentation
Due to organisational changes, the Group has decided to present the segment reporting to the new structure of Global Business Areas
(GBA). Comparative figures have been restated accordingly.
Copyright 2014 by Oriflame Cosmetics S.A. All rights reserved.