Embed Size (px)
DESCRIPTION
Metso's Interim Review January 1 - March 31, 2014. Presentation. Read more: www.metso.com/investors
Citation preview
Matti Kähkönen, President and CEO Harri Nikunen, CFO
April 24, 2014
© Metso © Metso
Forward looking statements
It should be noted that certain statements herein which are not historical facts, including, without limitation, those regarding expectations for general economic development and the market situation, expectations for customer industry profitability and investment willingness, expectations for company growth, development and profitability and the realization of synergy benefits and cost savings, and statements preceded by ”expects”, ”estimates”, ”forecasts” or similar expressions, are forward-looking statements. These statements are based on current decisions and plans and currently known factors. They involve risks and uncertainties which may cause the actual results to materially differ from the results currently expected by the company.
Such factors include, but are not limited to:
1) general economic conditions, including fluctuations in exchange rates and interest levels which influence the operating environment and profitability of customers and thereby the orders received by the company and their margins
2) the competitive situation, especially significant technological solutions developed by competitors
3) the company’s own operating conditions, such as the success of production, product development and project management and their continuous development and improvement
4) the success of pending and future acquisitions and restructuring.
2
© Metso © Metso
1. Quarterly highlights
2. Metso value creation
3. Financial performance
4. Outlook and guidance
Content
3
© Metso © Metso
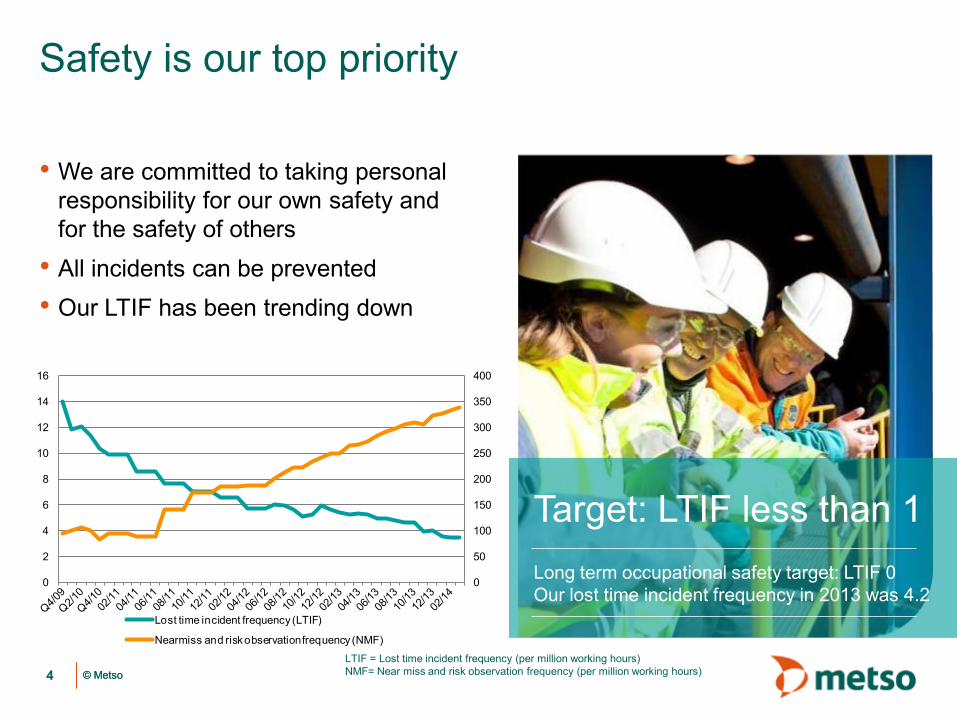
• We are committed to taking personal responsibility for our own safety and for the safety of others
• All incidents can be prevented • Our LTIF has been trending down
Safety is our top priority
4 LTIF = Lost time incident frequency (per million working hours) NMF= Near miss and risk observation frequency (per million working hours)
Target: LTIF less than 1 Long term occupational safety target: LTIF 0 Our lost time incident frequency in 2013 was 4.2
0
50
100
150
200
250
300
350
400
0
2
4
6
8
10
12
14
16
Lost time incident frequency (LTIF)
Nearmiss and risk observation frequency (NMF)
Q1/2014 highlights Matti Kähkönen
President and CEO
© Metso © Metso
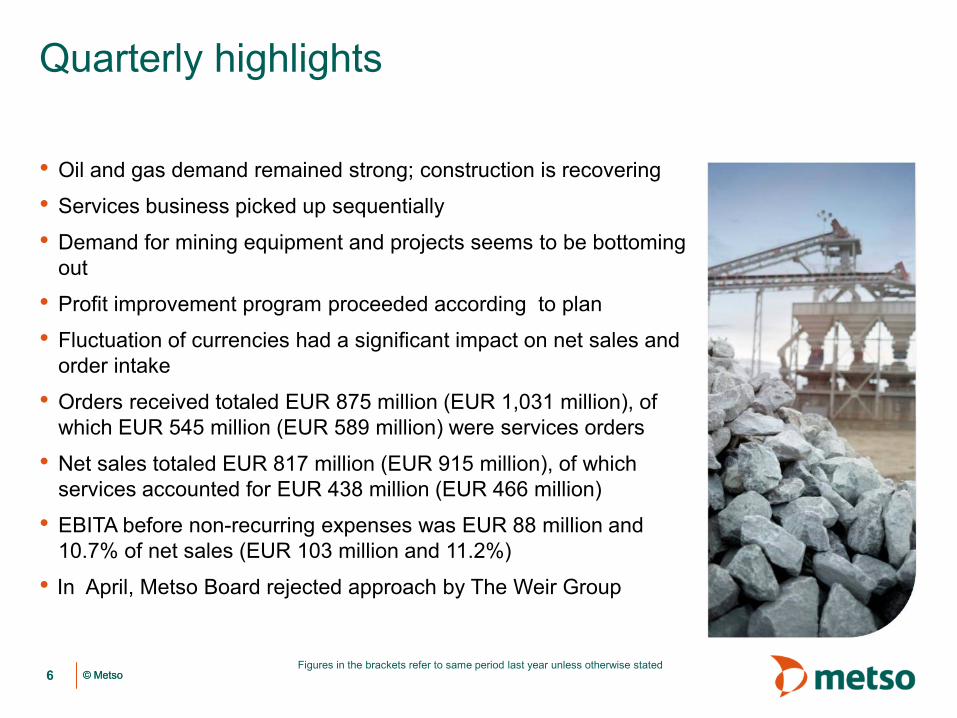
• Oil and gas demand remained strong; construction is recovering
• Services business picked up sequentially
• Demand for mining equipment and projects seems to be bottoming out
• Profit improvement program proceeded according to plan
• Fluctuation of currencies had a significant impact on net sales and order intake
• Orders received totaled EUR 875 million (EUR 1,031 million), of which EUR 545 million (EUR 589 million) were services orders
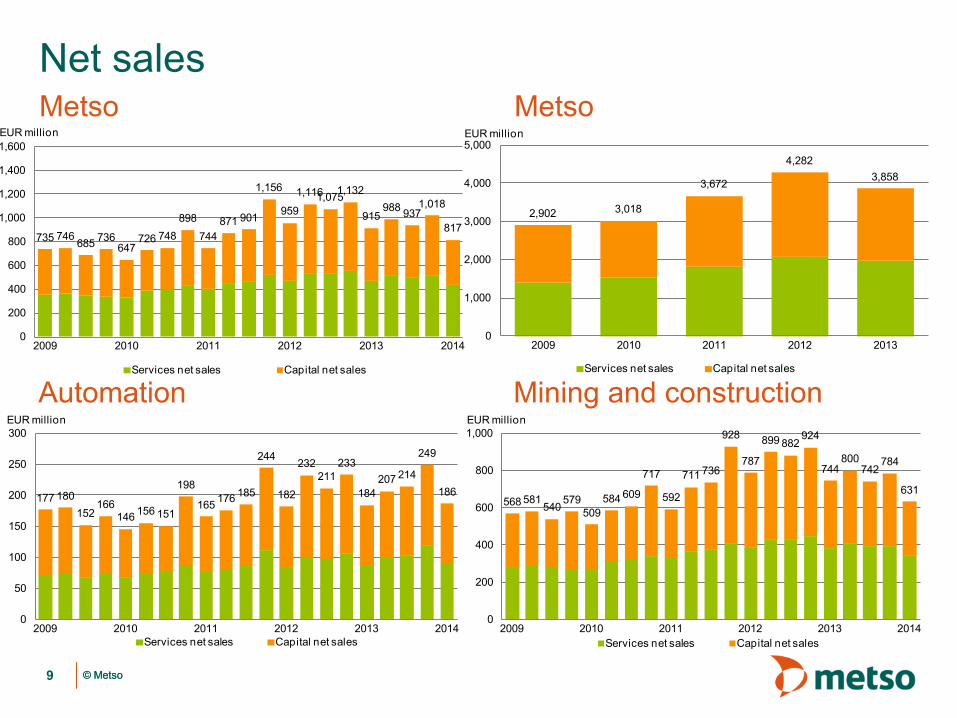
• Net sales totaled EUR 817 million (EUR 915 million), of which services accounted for EUR 438 million (EUR 466 million)
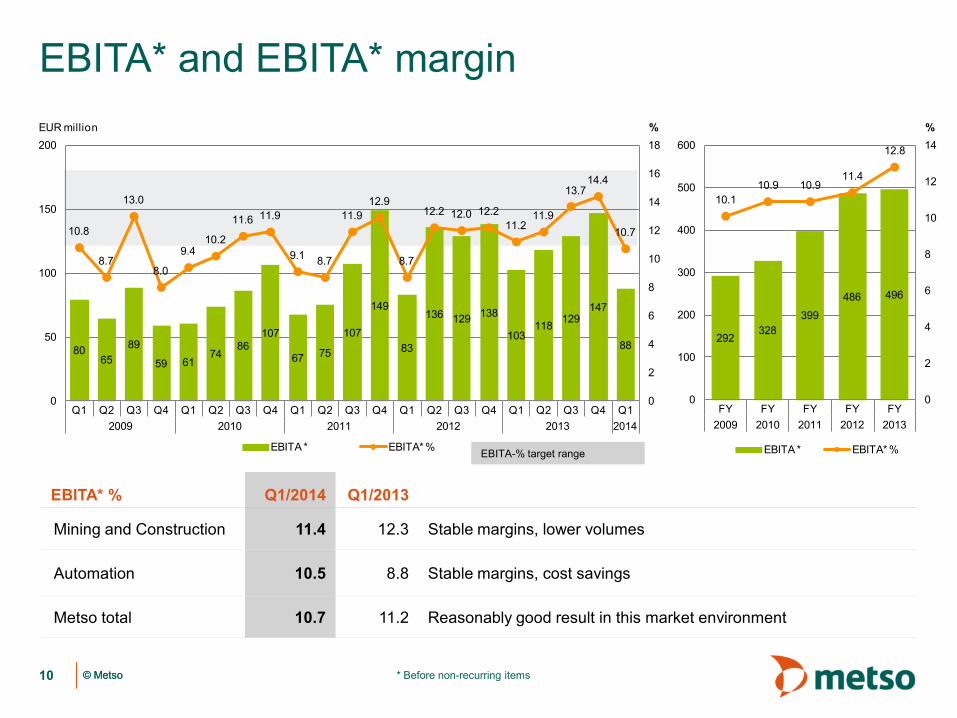
• EBITA before non-recurring expenses was EUR 88 million and 10.7% of net sales (EUR 103 million and 11.2%)
• In April, Metso Board rejected approach by The Weir Group
Quarterly highlights
6 Figures in the brackets refer to same period last year unless otherwise stated
© Metso © Metso
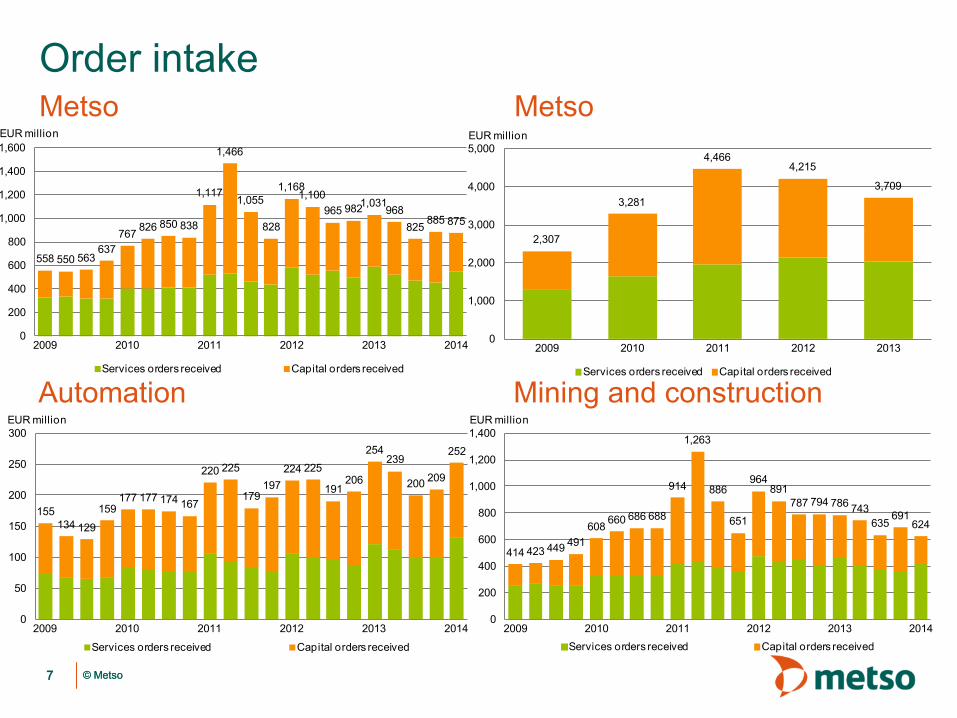
Order intake Metso
7
Automation Mining and construction
Metso
558 550 563637
767 826 850 838
1,117
1,466
1,055
828
1,1681,100
965 9821,031968
825 885 875
0
200
400
600
800
1,000
1,200
1,400
1,600
2009 2010 2011 2012 2013 2014
EUR million
Services orders received Capital orders received
2,307
3,281
4,4664,215
3,709
0
1,000
2,000
3,000
4,000
5,000
2009 2010 2011 2012 2013
EUR million
Services orders received Capital orders received
155134 129
159177 177 174 167
220 225
179197
224 225
191206
254239
200 209
252
0
50
100
150
200
250
300
2009 2010 2011 2012 2013 2014
EUR million
Services orders received Capital orders received
414 423 449 491608 660 686 688
914
1,263
886
651
964891
787 794 786 743635
691624
0
200
400
600
800
1,000
1,200
1,400
2009 2010 2011 2012 2013 2014
EUR million
Services orders received Capital orders received
© Metso © Metso
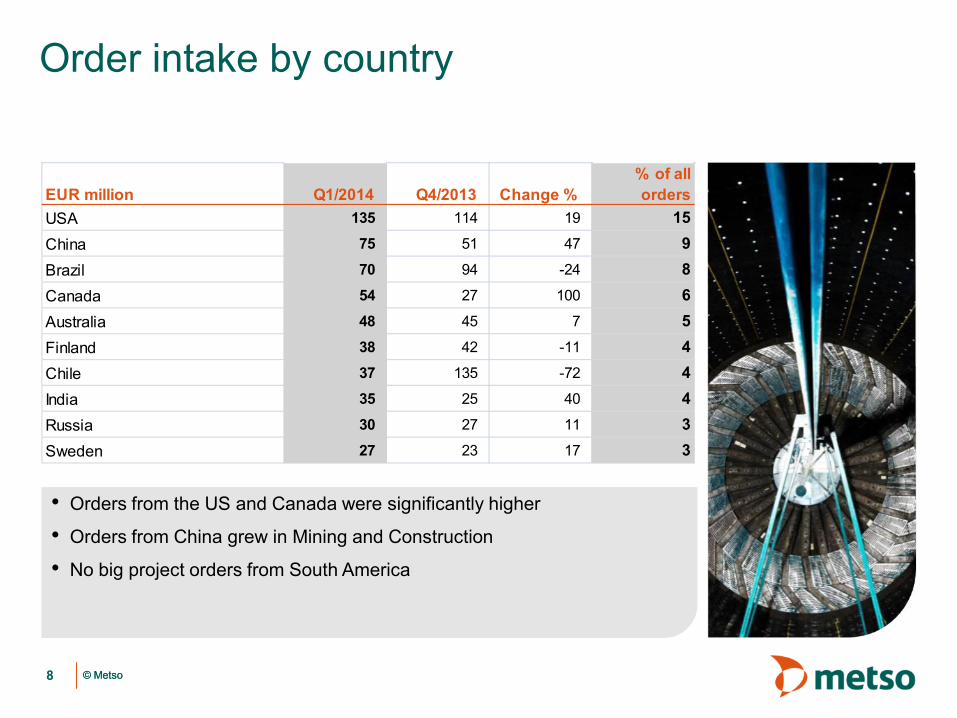
Order intake by country
8
• Orders from the US and Canada were significantly higher
• Orders from China grew in Mining and Construction
• No big project orders from South America
EUR million Q1/2014 Q4/2013 Change %% of all orders
USA 135 114 19 15China 75 51 47 9Brazil 70 94 -24 8Canada 54 27 100 6Australia 48 45 7 5Finland 38 42 -11 4Chile 37 135 -72 4India 35 25 40 4Russia 30 27 11 3Sweden 27 23 17 3
© Metso © Metso
2,902 3,018
3,672
4,2823,858
0
1,000
2,000
3,000
4,000
5,000
2009 2010 2011 2012 2013
EUR million
Services net sales Capital net sales
735 746 685 736647
726 748898
744871 901
1,156
959
1,1161,0751,132
915988 937
1,018
817
0
200
400
600
800
1,000
1,200
1,400
1,600
2009 2010 2011 2012 2013 2014
EUR million
Services net sales Capital net sales
Net sales Metso
9
Automation Mining and construction
Metso
177 180152
166146 156 151
198
165 176 185
244
182
232211
233
184207 214
249
186
0
50
100
150
200
250
300
2009 2010 2011 2012 2013 2014
EUR million
Services net sales Capital net sales
568 581540 579
509584 609
717
592
711 736
928
787
899 882924
744800
742784
631
0
200
400
600
800
1,000
2009 2010 2011 2012 2013 2014
EUR million
Services net sales Capital net sales
© Metso © Metso * Before non-recurring items
EBITA* and EBITA* margin
10
EBITA-% target range
EBITA* % Q1/2014 Q1/2013
Mining and Construction 11.4 12.3 Stable margins, lower volumes
Automation 10.5 8.8 Stable margins, cost savings
Metso total 10.7 11.2 Reasonably good result in this market environment
292328
399
486 496
10.110.9 10.9
11.4
12.8
0
2
4
6
8
10
12
14
0
100
200
300
400
500
600
FY FY FY FY FY2009 2010 2011 2012 2013
%
EBITA * EBITA* %
8065
89
59 6174
86107
67 75
107
149
83
136 129 138
103118 129
147
88
10.8
8.7
13.0
8.0
9.410.2
11.6 11.9
9.1 8.7
11.912.9
8.7
12.2 12.0 12.211.2
11.9
13.714.4
10.7
0
2
4
6
8
10
12
14
16
18
0
50
100
150
200
Q1 Q2 Q3 Q4 Q1 Q2 Q3 Q4 Q1 Q2 Q3 Q4 Q1 Q2 Q3 Q4 Q1 Q2 Q3 Q4 Q12009 2010 2011 2012 2013 2014
%EUR million
EBITA * EBITA* %
© Metso © Metso
• Significant shareholder value has been created through the demerger
• Both Metso and Valmet share prices have shown positive development
• We will continue leveraging our • unrivaled services presence and capabilities • strong global market positions to capitalize on growth
opportunities • competitive advantage through a unique combined offering • ongoing profit improvement and capital efficiency programs • strong financial track record
Metso value creation
11
© Metso © Metso
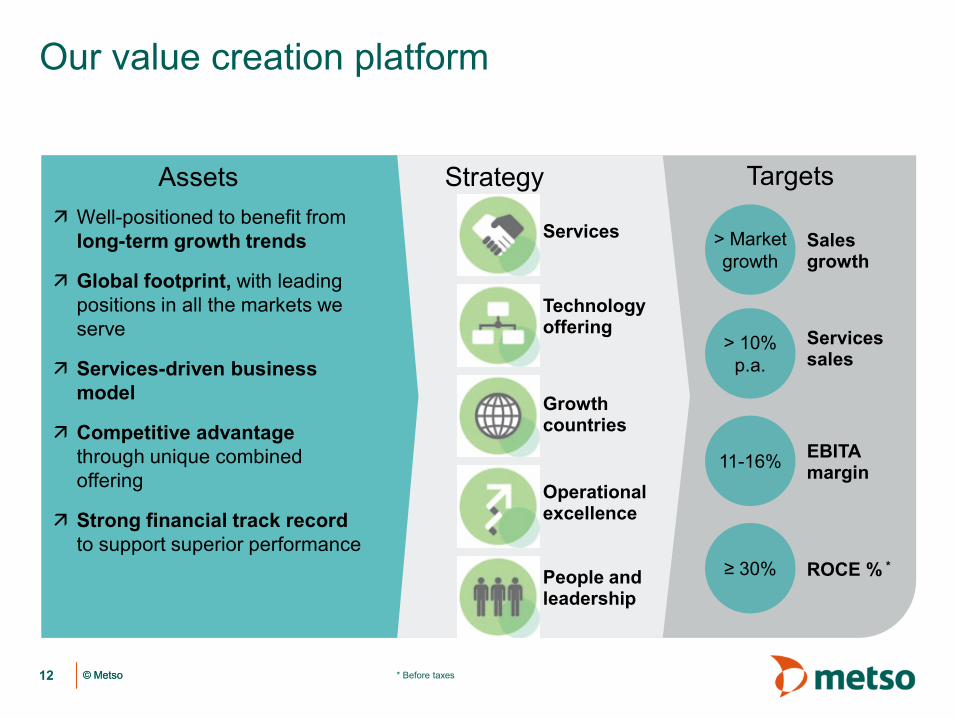
Our value creation platform
12 * Before taxes
Well-positioned to benefit from long-term growth trends
Global footprint, with leading positions in all the markets we serve
Services-driven business model
Competitive advantage through unique combined offering
Strong financial track record to support superior performance
Assets Strategy Targets
≥ 30% ROCE % *
11-16% EBITA margin
> 10% p.a.
Services sales
> Market growth
Sales growth
Services
Technology offering
Growth countries
Operational excellence
People and leadership
Financial performance Harri Nikunen, CFO
© Metso © Metso
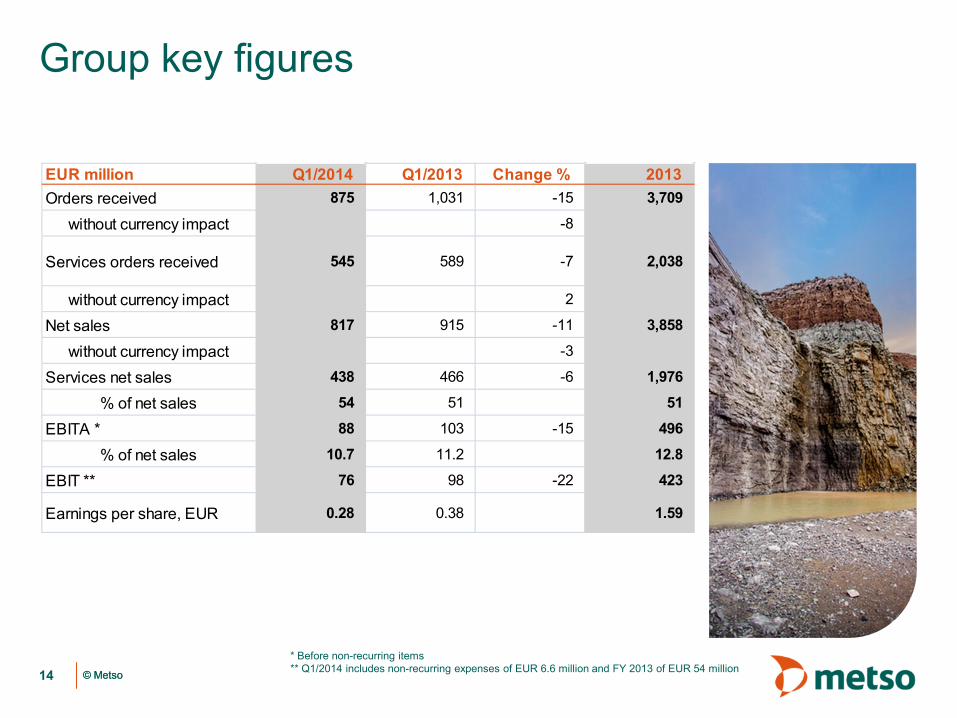
Group key figures
14 * Before non-recurring items ** Q1/2014 includes non-recurring expenses of EUR 6.6 million and FY 2013 of EUR 54 million
EUR million Q1/2014 Q1/2013 Change % 2013Orders received 875 1,031 -15 3,709
without currency impact -8
Services orders received 545 589 -7 2,038
without currency impact 2
Net sales 817 915 -11 3,858
without currency impact -3
Services net sales 438 466 -6 1,976
% of net sales 54 51 51
EBITA * 88 103 -15 496
% of net sales 10.7 11.2 12.8
EBIT ** 76 98 -22 423
Earnings per share, EUR 0.28 0.38 1.59
© Metso © Metso
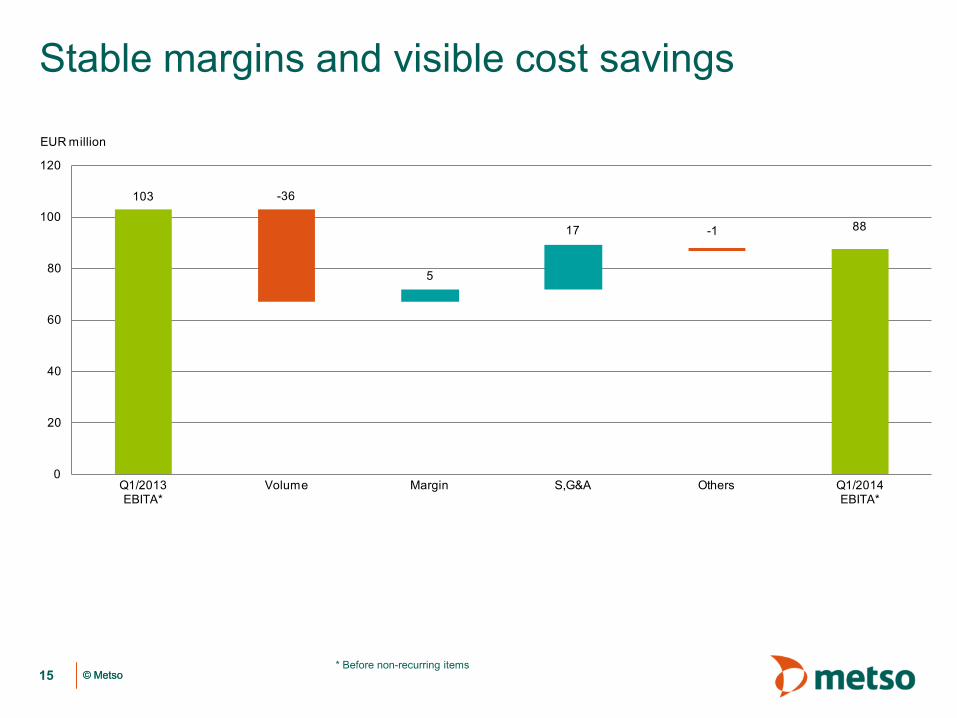
103
88
-36
5
17 -1
0
20
40
60
80
100
120
Q1/2013 EBITA*
Volume Margin S,G&A Others Q1/2014 EBITA*
EUR million
Stable margins and visible cost savings
15 * Before non-recurring items
© Metso © Metso
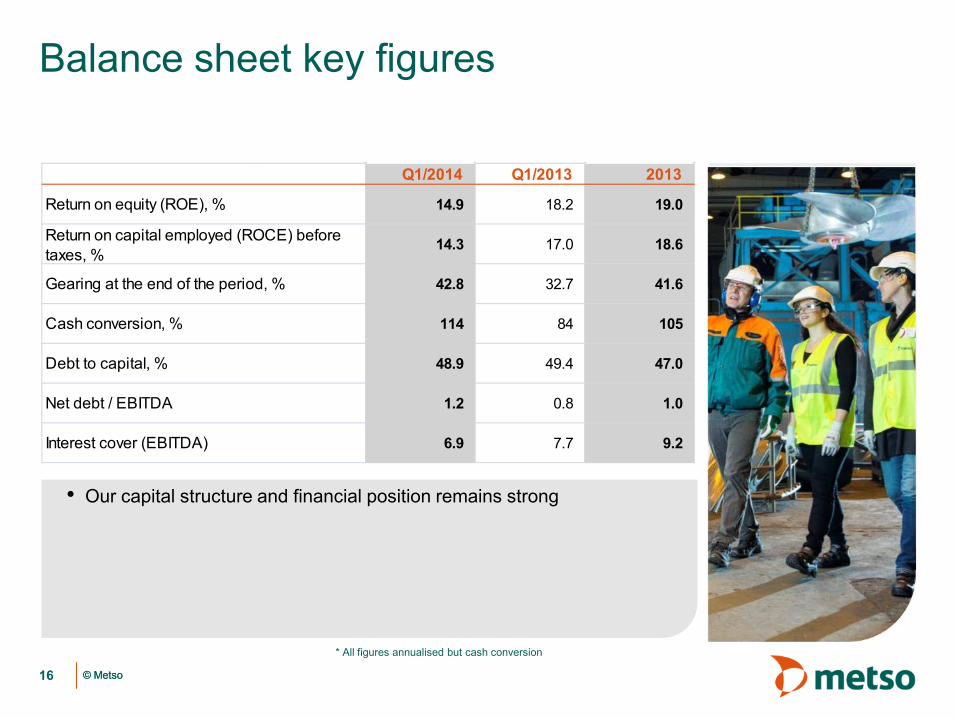
Balance sheet key figures
16
• Our capital structure and financial position remains strong
Q1/2014 Q1/2013 2013
14.9 18.2 19.0
14.3 17.0 18.6
42.8 32.7 41.6
114 84 105
48.9 49.4 47.0
1.2 0.8 1.0
6.9 7.7 9.2Interest cover (EBITDA)
Return on equity (ROE), %
Return on capital employed (ROCE) before taxes, %
Gearing at the end of the period, %
Cash conversion, %
Debt to capital, %
Net debt / EBITDA
* All figures annualised but cash conversion
© Metso © Metso
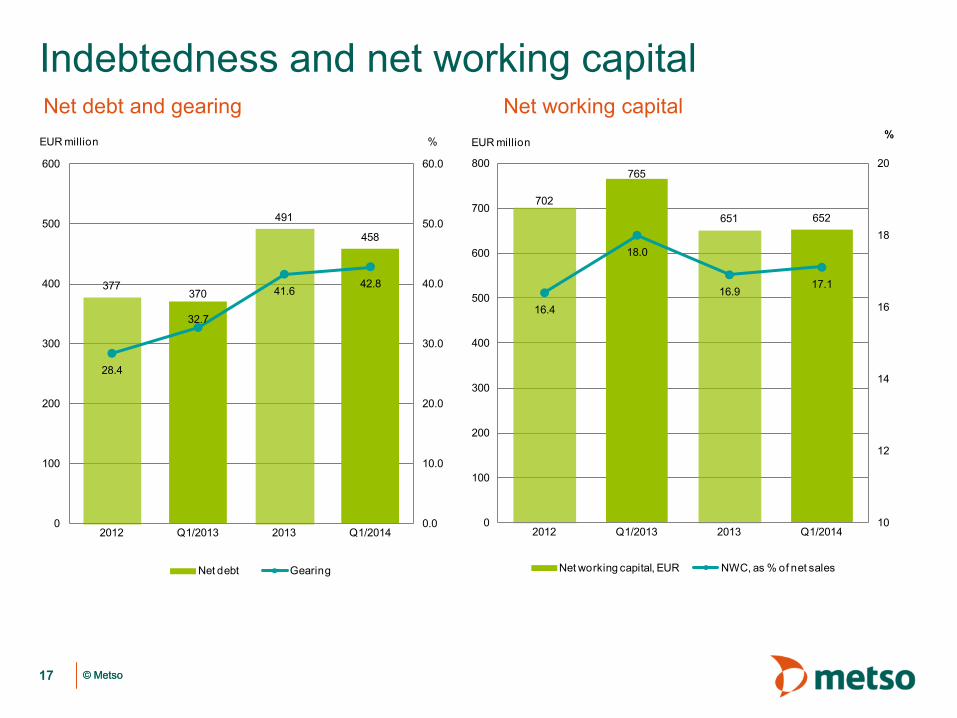
Indebtedness and net working capital
17
Net working capital Net debt and gearing
377370
491
458
28.4
32.7
41.642.8
0.0
10.0
20.0
30.0
40.0
50.0
60.0
0
100
200
300
400
500
600
2012 Q1/2013 2013 Q1/2014
%EUR million
Net debt Gearing
702
765
651 652
16.4
18.0
16.917.1
10
12
14
16
18
20
0
100
200
300
400
500
600
700
800
2012 Q1/2013 2013 Q1/2014
%EUR million
Net working capital, EUR NWC, as % of net sales
© Metso © Metso 18
* Before non-recurring items ** Excluding cash and other non-operative balance sheet items, annualized
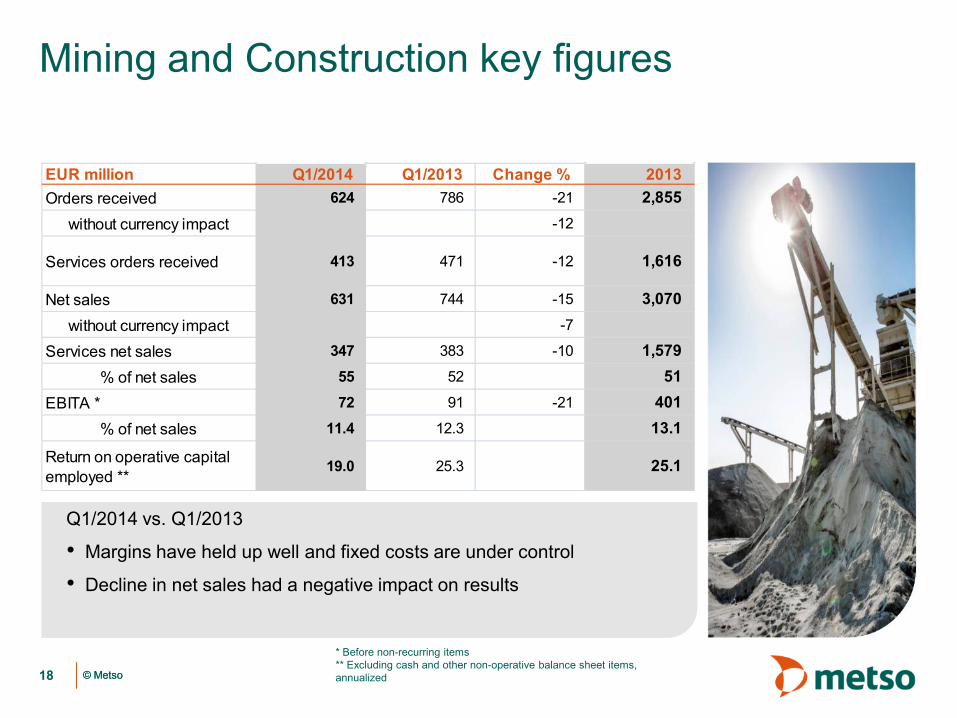
Mining and Construction key figures
Q1/2014 vs. Q1/2013
• Margins have held up well and fixed costs are under control
• Decline in net sales had a negative impact on results
EUR million Q1/2014 Q1/2013 Change % 2013Orders received 624 786 -21 2,855
without currency impact -12
Services orders received 413 471 -12 1,616
Net sales 631 744 -15 3,070without currency impact -7
Services net sales 347 383 -10 1,579% of net sales 55 52 51
EBITA * 72 91 -21 401% of net sales 11.4 12.3 13.1
Return on operative capital employed **
19.0 25.3 25.1
© Metso © Metso
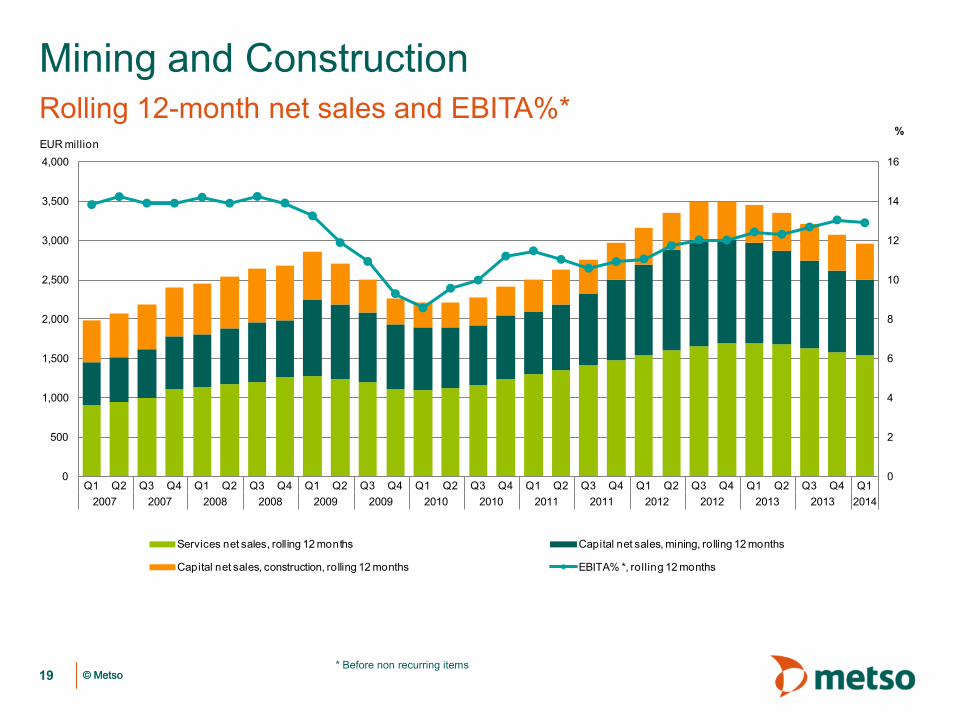
Mining and Construction Rolling 12-month net sales and EBITA%*
19 * Before non recurring items
0
2
4
6
8
10
12
14
16
0
500
1,000
1,500
2,000
2,500
3,000
3,500
4,000
Q1 Q2 Q3 Q4 Q1 Q2 Q3 Q4 Q1 Q2 Q3 Q4 Q1 Q2 Q3 Q4 Q1 Q2 Q3 Q4 Q1 Q2 Q3 Q4 Q1 Q2 Q3 Q4 Q12007 2007 2008 2008 2009 2009 2010 2010 2011 2011 2012 2012 2013 2013 2014
%EUR million
Services net sales, rolling 12 months Capital net sales, mining, rolling 12 months
Capital net sales, construction, rolling 12 months EBITA% *, rolling 12 months
© Metso © Metso
* Before non-recurring items ** Excluding cash and other non-operative balance sheet items, annualized
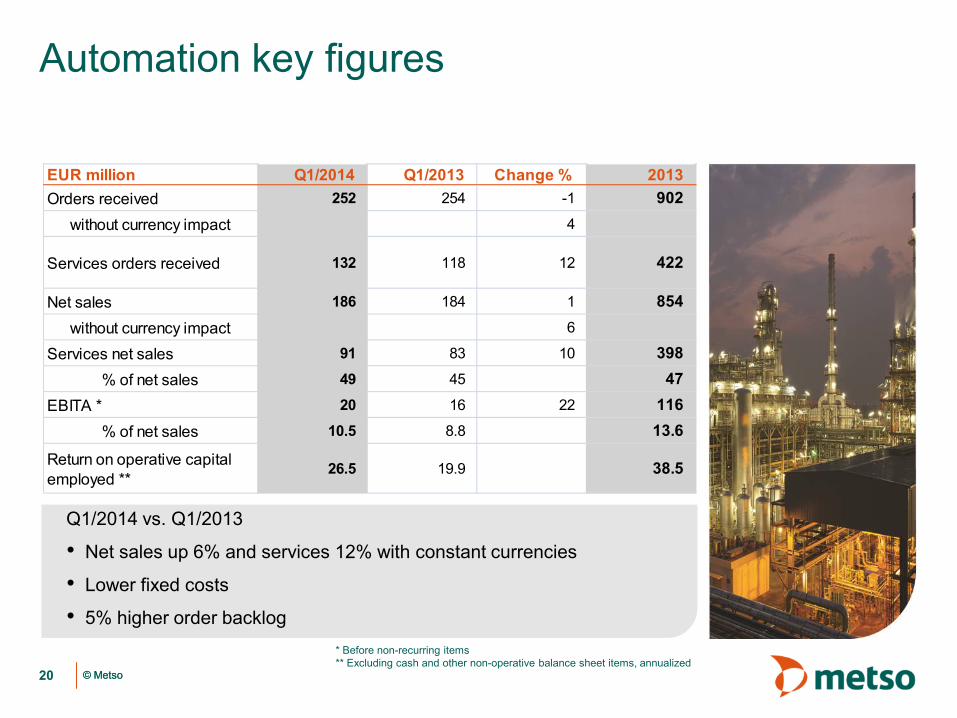
Automation key figures
20
Q1/2014 vs. Q1/2013
• Net sales up 6% and services 12% with constant currencies
• Lower fixed costs
• 5% higher order backlog
EUR million Q1/2014 Q1/2013 Change % 2013Orders received 252 254 -1 902
without currency impact 4
Services orders received 132 118 12 422
Net sales 186 184 1 854without currency impact 6
Services net sales 91 83 10 398% of net sales 49 45 47
EBITA * 20 16 22 116% of net sales 10.5 8.8 13.6
Return on operative capital employed **
26.5 19.9 38.5
© Metso © Metso
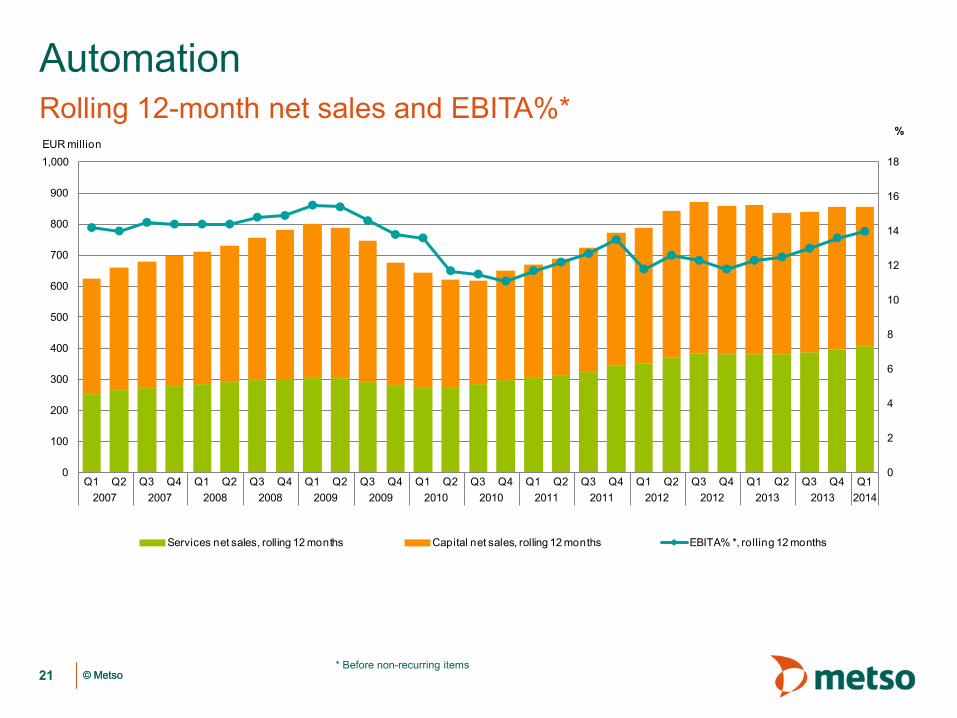
Automation Rolling 12-month net sales and EBITA%*
21 * Before non-recurring items
0
2
4
6
8
10
12
14
16
18
0
100
200
300
400
500
600
700
800
900
1,000
Q1 Q2 Q3 Q4 Q1 Q2 Q3 Q4 Q1 Q2 Q3 Q4 Q1 Q2 Q3 Q4 Q1 Q2 Q3 Q4 Q1 Q2 Q3 Q4 Q1 Q2 Q3 Q4 Q12007 2007 2008 2008 2009 2009 2010 2010 2011 2011 2012 2012 2013 2013 2014
%EUR million
Services net sales, rolling 12 months Capital net sales, rolling 12 months EBITA% *, rolling 12 months
© Metso © Metso
• Program was announced in autumn 2013 • We are responding to the soft market environment in
mining and adjusting to the new Group structure • The current scope encompasses headcount
reduction of 1,300-1,400 • Targeted gross savings total EUR 120-130 million • Completion rate is 60%, targeting full completion by
the end of 2014 • Savings to be fully achieved in H1/2015
Profit improvement program proceeding according to plan
22
© Metso © Metso
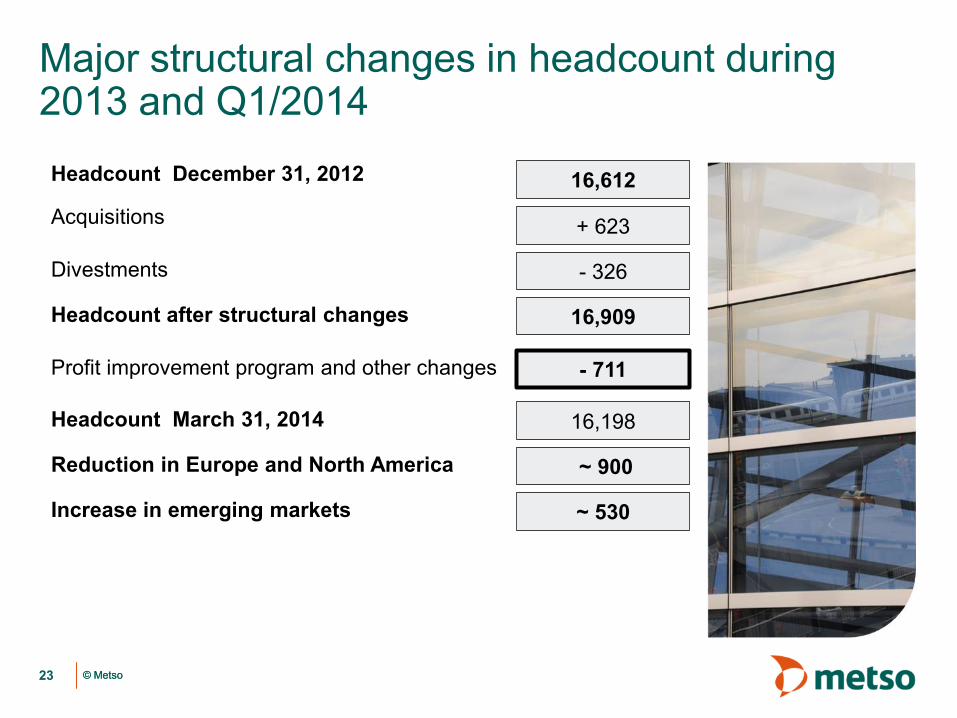
Major structural changes in headcount during 2013 and Q1/2014
23
Headcount December 31, 2012 16,612 Acquisitions + 623
Divestments - 326
Headcount after structural changes 16,909
Profit improvement program and other changes - 711
Headcount March 31, 2014 16,198
Reduction in Europe and North America ~ 900
Increase in emerging markets ~ 530

Outlook and guidance Matti Kähkönen
President and CEO
© Metso © Metso
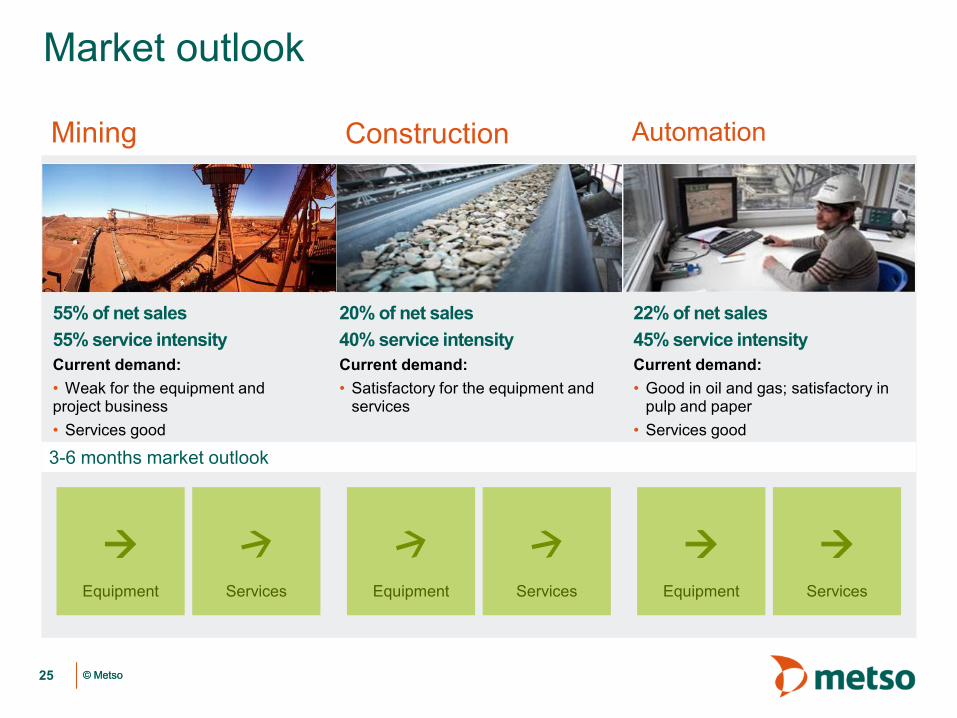
Market outlook
55% of net sales 55% service intensity Current demand: • Weak for the equipment and project business • Services good
20% of net sales 40% service intensity Current demand: • Satisfactory for the equipment and
services
22% of net sales 45% service intensity Current demand: • Good in oil and gas; satisfactory in
pulp and paper • Services good
3-6 months market outlook
Equipment Services
Equipment Services
25
Equipment Services
Mining Construction Automation
© Metso © Metso
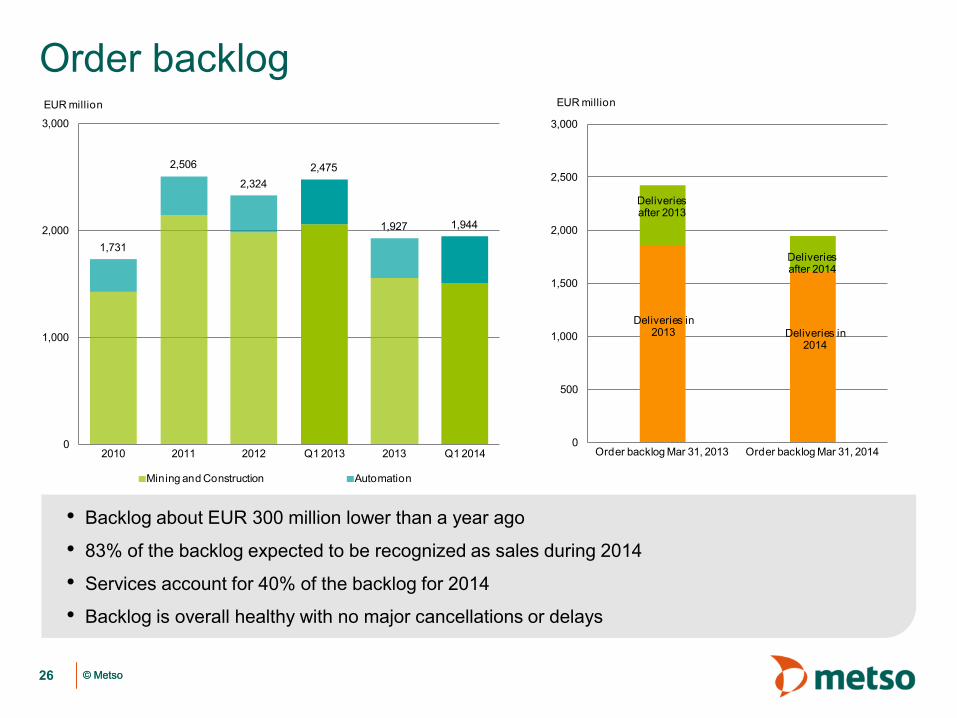
Order backlog
26
• Backlog about EUR 300 million lower than a year ago
• 83% of the backlog expected to be recognized as sales during 2014
• Services account for 40% of the backlog for 2014
• Backlog is overall healthy with no major cancellations or delays
1,731
2,506
2,3242,475
1,927 1,944
0
1,000
2,000
3,000
2010 2011 2012 Q1 2013 2013 Q1 2014
EUR million
Mining and Construction Automation
Deliveries in 2014
Deliveries after 2014
Deliveries in 2013
Deliveries after 2013
0
500
1,000
1,500
2,000
2,500
3,000
Order backlog Mar 31, 2013 Order backlog Mar 31, 2014
EUR million
© Metso © Metso 27
Based on our market outlook, backlog for 2014, current exchange rates and ongoing cost-efficiency actions, we estimate that
• our net sales in 2014 will be somewhat below 2013
• and EBITA margin before non recurring items for 2014 will be at around 12%
Guidance for 2014
company/metso metsogroup metsoworld metsoworld metsogroup
www.metso.com