Embed Size (px)
Citation preview
Dr. Engr. Sami ur Rahman
Data AnalysisBasic Analysis in SPSS

The basic analysis
University Of Malakand | Department of Computer Science | UoMIPS | Dr. Engr. Sami ur Rahman | 2

The basic analysis of SPSS that will be introduced
FrequenciesThis analysis produces frequency tables showing frequency counts and percentages of the values of individual variables.
DescriptivesThis analysis shows the maximum, minimum, mean, and standard deviation of the variables
University Of Malakand | Department of Computer Science | UoMIPS | Dr. Engr. Sami ur Rahman | 3

Opening the sample data
Open ‘Employee data.sav’ from the SPSSGo to “File,” “Open,” and Click Data
University Of Malakand | Department of Computer Science | UoMIPS | Dr. Engr. Sami ur Rahman | 4
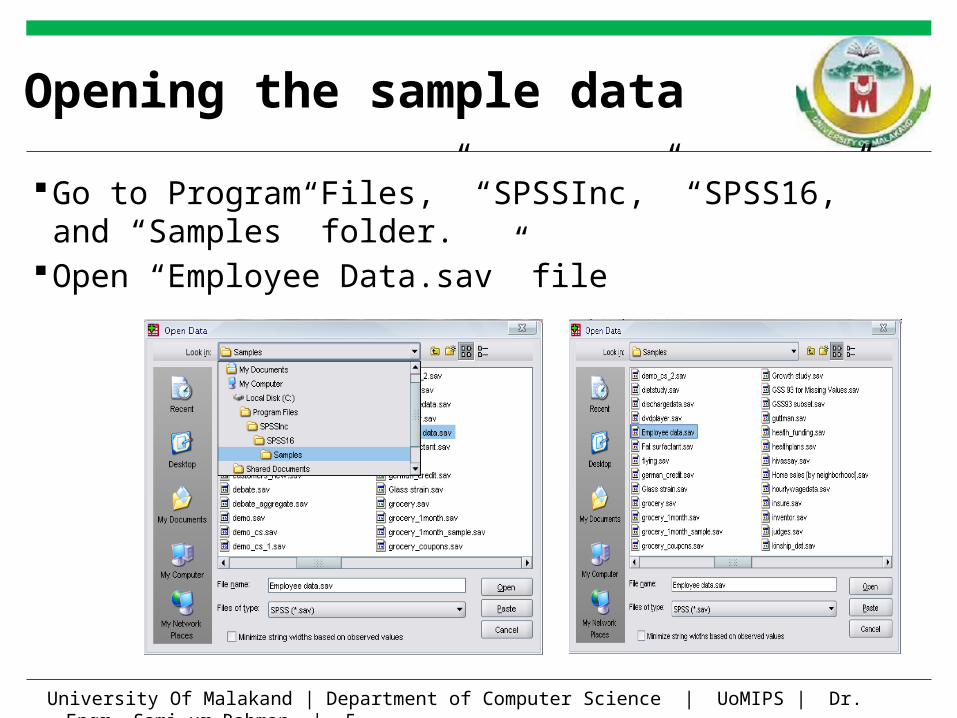
Opening the sample data
Go to Program Files,” “SPSSInc,” “SPSS16,” and “Samples” folder.
Open “Employee Data.sav” file
University Of Malakand | Department of Computer Science | UoMIPS | Dr. Engr. Sami ur Rahman | 5
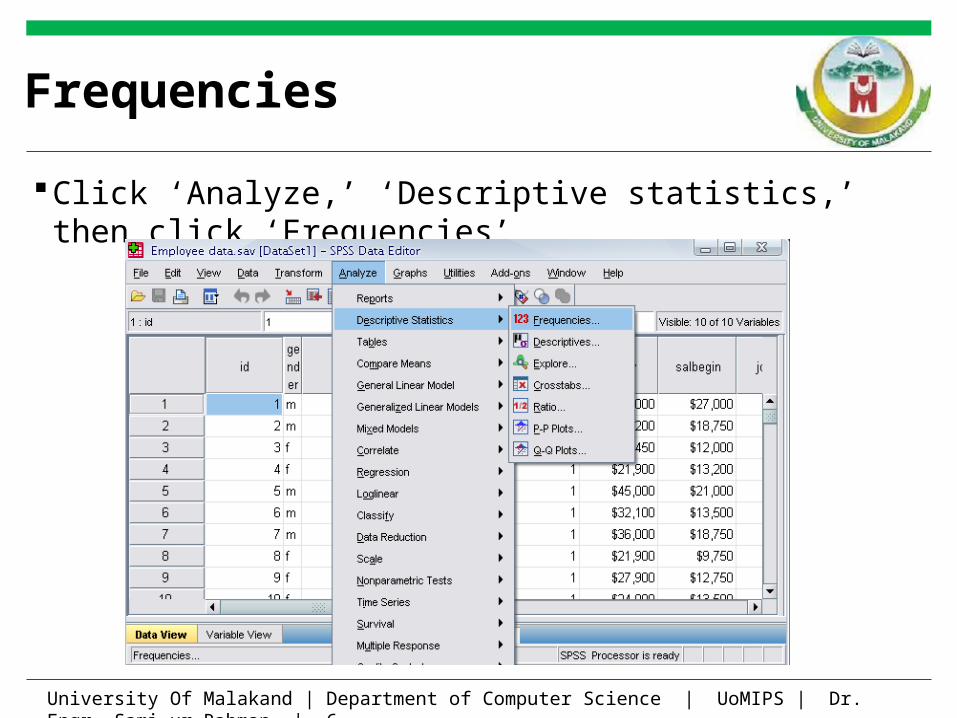
Frequencies
Click ‘Analyze,’ ‘Descriptive statistics,’ then click ‘Frequencies’
University Of Malakand | Department of Computer Science | UoMIPS | Dr. Engr. Sami ur Rahman | 6
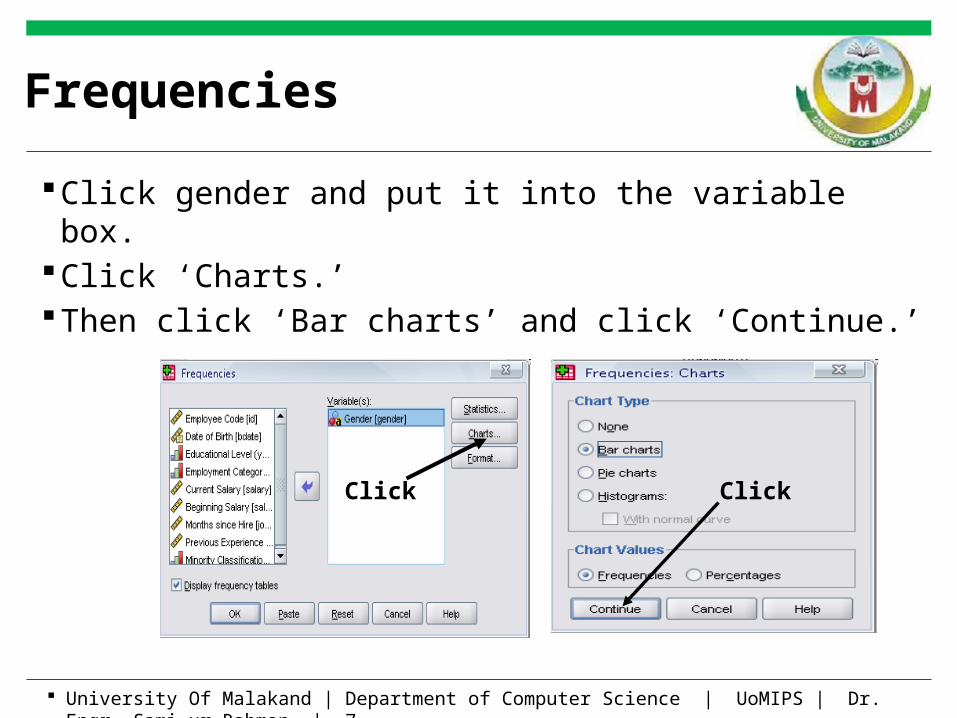
Frequencies
Click gender and put it into the variable box.Click ‘Charts.’ Then click ‘Bar charts’ and click ‘Continue.’
Click Click
University Of Malakand | Department of Computer Science | UoMIPS | Dr. Engr. Sami ur Rahman | 7
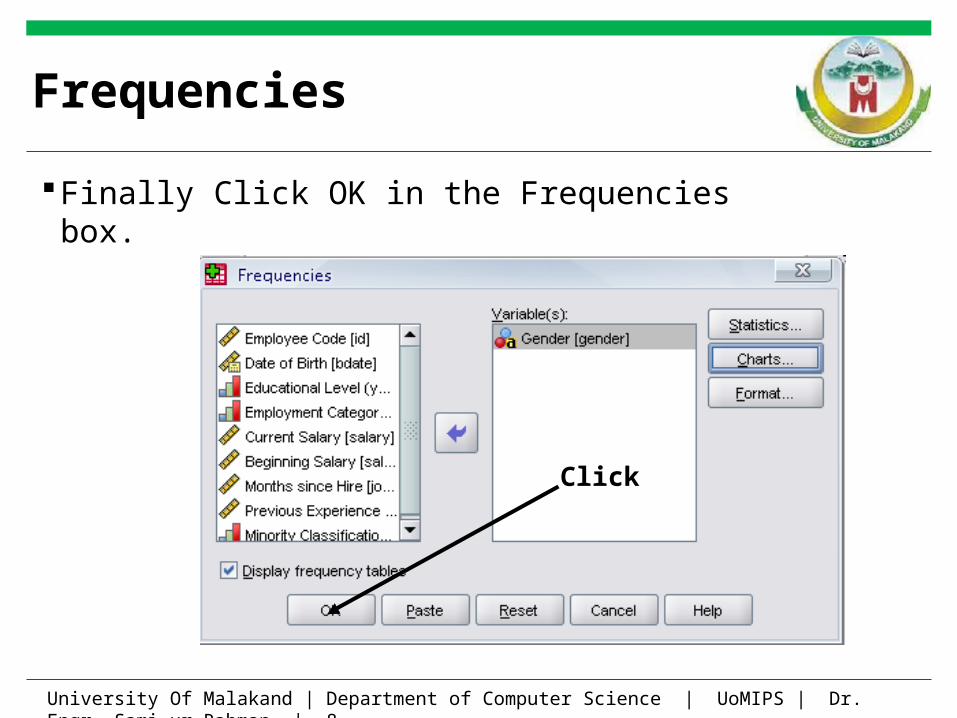
Frequencies
Finally Click OK in the Frequencies box.
Click
University Of Malakand | Department of Computer Science | UoMIPS | Dr. Engr. Sami ur Rahman | 8

University Of Malakand | Department of Computer Science | UoMIPS | Dr. Engr. Sami ur Rahman | 9
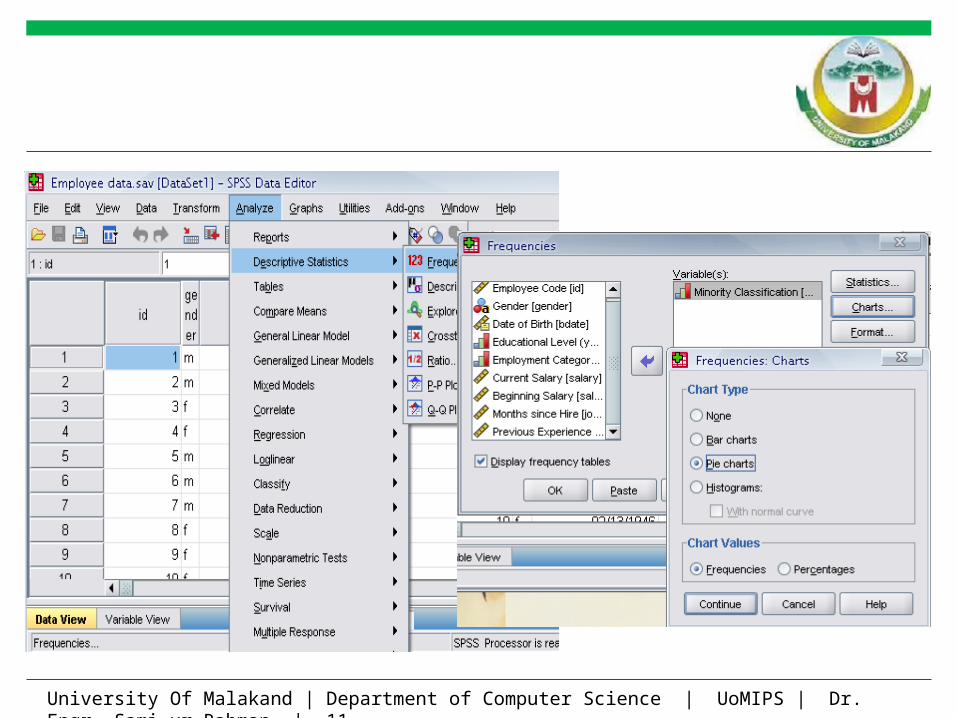
Practice 4
Do a frequency analysis on the variable “minority”
Create pie charts for it
Do the same analysis using the syntax editor
University Of Malakand | Department of Computer Science | UoMIPS | Dr. Engr. Sami ur Rahman | 10
University Of Malakand | Department of Computer Science | UoMIPS | Dr. Engr. Sami ur Rahman | 11

Answer
Click
University Of Malakand | Department of Computer Science | UoMIPS | Dr. Engr. Sami ur Rahman | 12
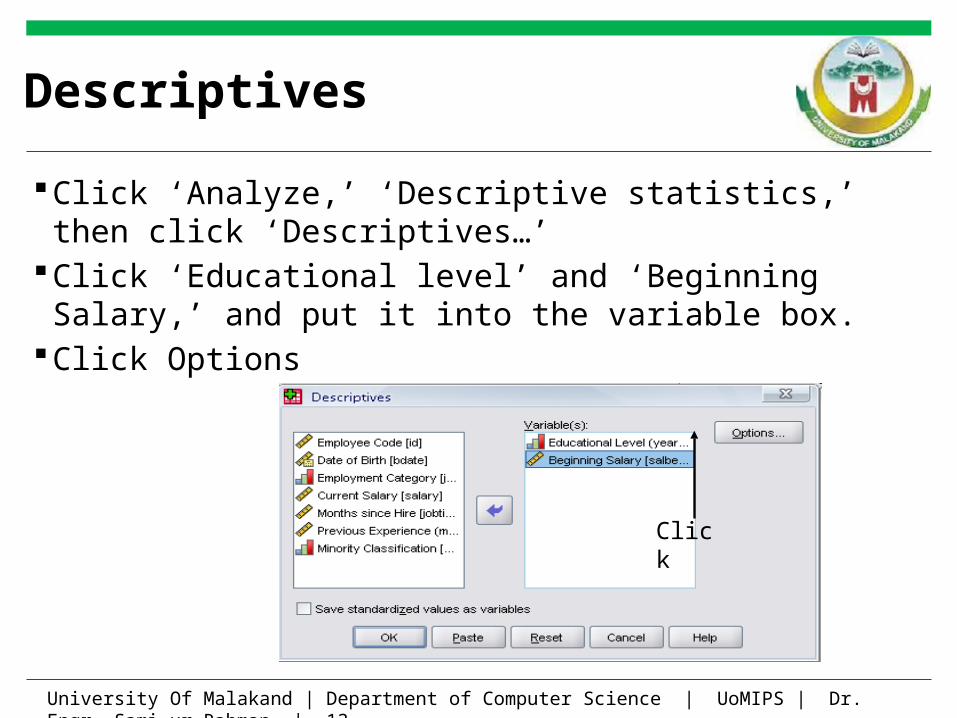
Descriptives
Click ‘Analyze,’ ‘Descriptive statistics,’ then click ‘Descriptives…’
Click ‘Educational level’ and ‘Beginning Salary,’ and put it into the variable box.
Click Options
Click
University Of Malakand | Department of Computer Science | UoMIPS | Dr. Engr. Sami ur Rahman | 13
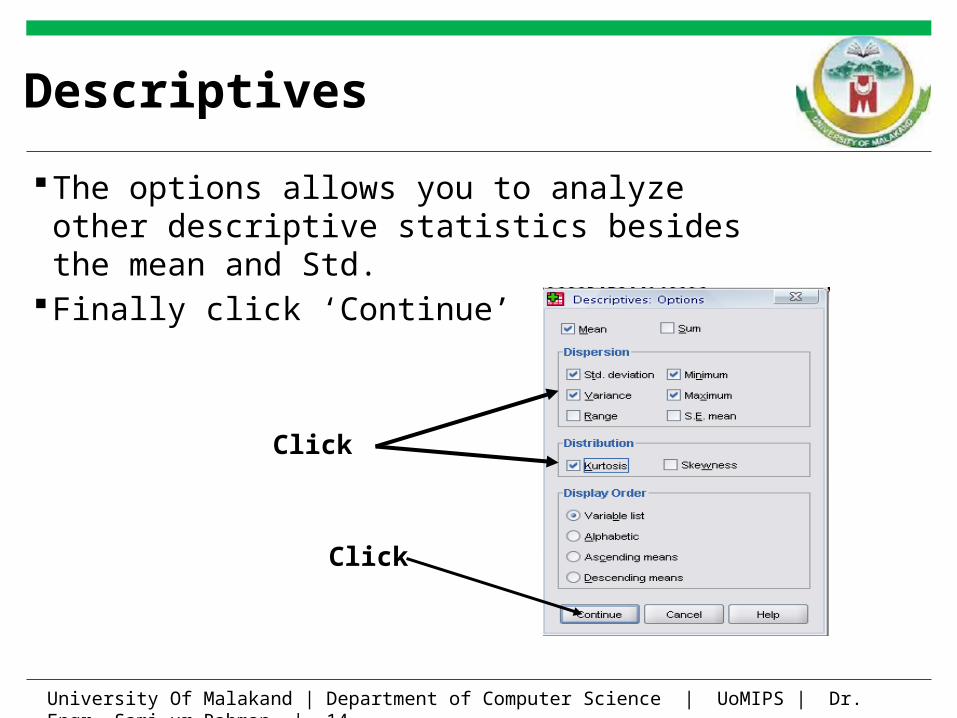
Descriptives
The options allows you to analyze other descriptive statistics besides the mean and Std.
Finally click ‘Continue’
Click
Click
University Of Malakand | Department of Computer Science | UoMIPS | Dr. Engr. Sami ur Rahman | 14
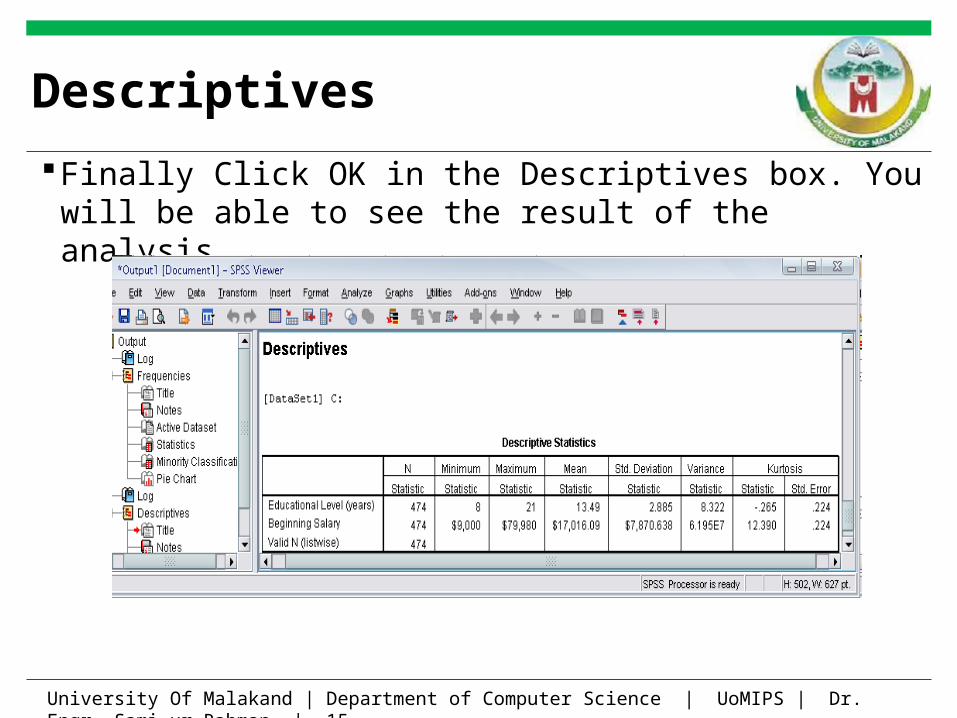
Descriptives
Finally Click OK in the Descriptives box. You will be able to see the result of the analysis.
University Of Malakand | Department of Computer Science | UoMIPS | Dr. Engr. Sami ur Rahman | 15

16
Running Analyses (Central Tendency)
26. Select the desired variables (household income) and click the arrow to move them to the right side
25. Select Analyze- Descriptive Stats- Frequencies
University Of Malakand | Department of Computer Science | UoMIPS | Dr. Engr. Sami ur Rahman | 16
Running Analyses (Central Tendency)
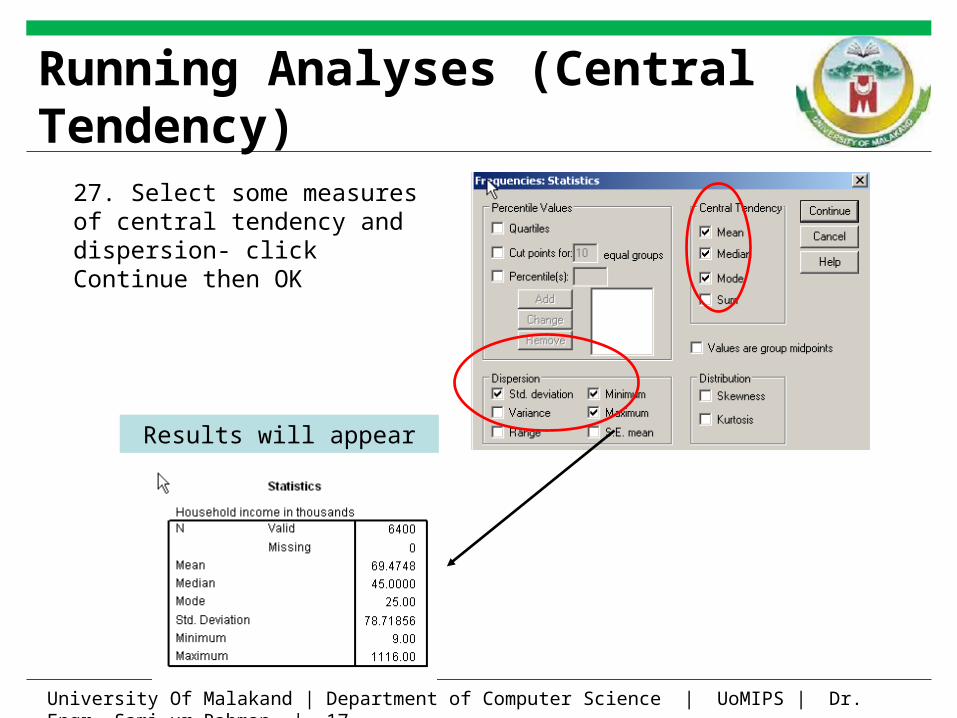
Results will appear
27. Select some measures of central tendency and dispersion- click Continue then OK
University Of Malakand | Department of Computer Science | UoMIPS | Dr. Engr. Sami ur Rahman | 17

18
Running Analyses (Correlation)
28. Click Analyze- Correlate- Bivariate
29. Move the two variables of interest to the right side (age & income), click OK
University Of Malakand | Department of Computer Science | UoMIPS | Dr. Engr. Sami ur Rahman | 18
19
Running Analyses (Correlation)
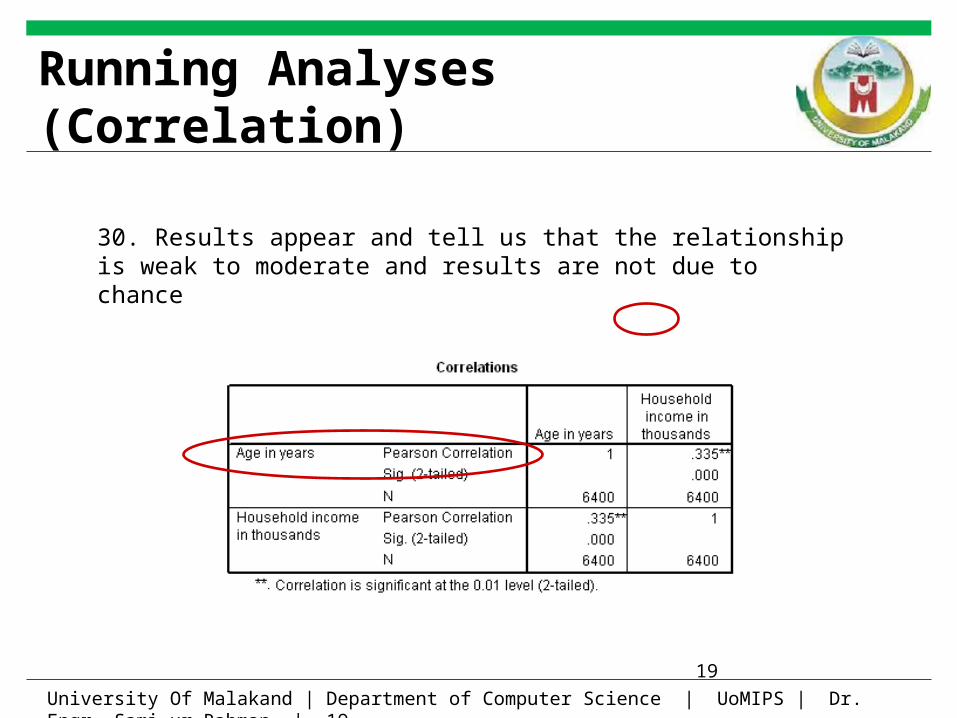
30. Results appear and tell us that the relationship is weak to moderate and results are not due to chance
University Of Malakand | Department of Computer Science | UoMIPS | Dr. Engr. Sami ur Rahman | 19

University Of Malakand | Department of Computer Science | UoMIPS | Dr. Engr. Sami ur Rahman | 20
Thanks for your attention