Embed Size (px)
Citation preview

Downtown Belle Plaine Belle Plaine, Iowa
Market Snapshot
Prepared for:
Belle Plaine Community Development Corporation
A service provided by:
Prepared by:
January 2015
Downtown Professionals Network
133 Holiday Court· Suite 205 Franklin· Tennessee 37067 630.482.2930 www.downtownpros.com

Downtown Belle Plaine Market Snapshot | Belle Plaine, Iowa | January 2015 Page 1
Introduction
Belle Plaine Community Development Corporation (BPCDC), the non-profit corporation spearheading the community’s Main Street program, is taking a pro-active and catalytic approach to planning for the future prosperity of Belle Plaine’s traditional downtown business district. The efforts of BPCDC and its partners, along with investments made by the public and private sectors in downtown Belle Plaine, are working to heighten the appeal of the traditional business district among consumers, investors and entrepreneurs. Moving forward, it will be critical for the community to capitalize upon and leverage these investments and ongoing BPCDC marketing efforts to position downtown Belle Plaine as a local and regional attraction, economic engine, and center for commerce. This Market Snapshot document, prepared as part of Main Street Iowa 2015 Market Analysis Training and Technical Assistance services being delivered to select Main Street Iowa communities, highlights and summarizes important demographic, lifestyle and retail data, characteristics and trends in the marketplace. The information, along with market insights to be explored during the project’s ensuing phases, provides groundwork and a basis for important decision-making process that will guide future enhancement and redevelopment strategies.
Report Contents
Introduction........................................................................................................................ 1
Downtown Belle Plaine Study Area ................................................................................... 2
Drive Time Geographies ................................................................................................. 2
Demographic Snapshot .................................................................................................. 4
Consumer Spending Potential ....................................................................................... 5
Lifestyle Profile .............................................................................................................. 6
Retail Market Performance.......................................................................................... 12
Summary .......................................................................................................................... 16
This document was prepared with technical assistance provided by DPN, under contract by the Iowa Economic Development Authority (IEDA). This institution is an equal opportunity provider and employer. If you wish to file a Civil Rights program complaint of discrimination, complete the USDA Program Discrimination Complaint Form, found online at http://www.ascr.usda.gov/complaint filing cust.html, or at any USDA office, or call (866) 632-9992 to request the form. You may also write a letter containing all of the information requested in the form. Send your completed complaint form or letter to us by mail at U.S. Department of Agriculture, Director, Office of Adjudication, 1400 Independence Avenue, S.W., Washington, D.C. 20250-9410, by fax (202) 690-7442 or email at [email protected]. IEDA is an intermediary of USDA assistance.

Downtown Belle Plaine Market Snapshot | Belle Plaine, Iowa | January 2015 Page 2
Downtown Belle Plaine Study Area
Drive Time Geographies The profile assembled for the Downtown Belle Plaine Drive Time Market is based upon information contained in a series of Esri reports provided by Main Street Iowa, generated for a 5, 10, and 20 minute drive time area originating from the center of the downtown Belle Plaine business district.
The five-minute drive-time market profiles a “captive” resident and convenience-oriented market for downtown Belle Plaine. The population residing in the five-minute drive time area would also be more likely access downtown on foot, bicycle and via other alternative modes of transportation. Demographic and psychographic data could be particularly useful for assessing performance and expansion opportunities for convenience and clientele-oriented businesses and uses, and for analyzing and profiling the composition of the current and potential downtown Belle Plaine area housing market. The area plotted for the ten-minute drive time includes areas that span along major travel routes in the Belle Plaine vicinity. Data and information for the ten-minute drive time area could be helpful for comparing and contrasting the traits and characteristics of the “close to downtown” population with that in the wider local region. The consumer profile may also be indicative of the “comparison market” for Belle Plaine area service, retail and eating & drinking uses. The twenty-minute drive time area is more expansive and rural in nature, encompassing portions of four different counties and extending along state highways and county routes to surrounding communities. Consumers in this regional market, all things being equal, may be more naturally inclined to frequent commercial areas in other communities, based on convenience and/or broader variety and anchor tenants. Opportunities for downtown Belle Plaine to capture consumers from the broader region, and to increase its retail market share, will most likely revolve around retail and service anchors; specialty retail and destination-oriented eating & drinking places; recreational attractions and venues; and events.
Downtown Belle Plaine Drive Time Markets
Fast Facts Population 5 Min 10 Min 20 Min
2000 Census 2,959 3,844 11,191
2010 Census 2,641 3,493 10,495
2014 Estimate 2,577 3,444 10,603
2019 Projection 2,507 3,382 10,633
Change: 2014 - 2019 -2.7% -1.8% 0.3%
Households 5 Min 10 Min 20 Min
2000 Census 1,239 1,566 4,497
2010 Census 1,146 1,477 4,396
2014 Estimate 1,125 1,465 4,471
2019 Projection 1,101 1,445 4,508
Change: 2014 - 2019 -2.1% -1.4% 0.8%
Median HH Income 5 Min 10 Min 20 Min
2014 Estimate $40,329 $44,092 $52,972
2019 Projection $46,523 $51,353 $60,909
Change: 2014 - 2019 15.4% 16.5% 15.0%
Source: Esri Market Profile.

Downtown Belle Plaine Market Snapshot | Belle Plaine, Iowa | January 2015 Page 3
Reports generated and used to examine the Downtown Belle Plaine Drive Time Markets are based on current Esri data and include:
Esri Market Profile The Market Profile report provides current-year and five-year projections for U.S. demographics. The annual updates include information about population, households, housing, occupancy, income, age, race, Hispanic origin, and more. Esri Tapestry Segmentation Area Profile
Tapestry classifies U.S. residential neighborhoods into 67 unique market segments based on socioeconomic and demographic characteristics. Esri Retail MarketPlace Profile Retail MarketPlace data provides a measure of retail activity by trade area and compares retail sales to consumer spending by NAICS industry classification.

Downtown Belle Plaine Market Snapshot | Belle Plaine, Iowa | January 2015 Page 4
Demographic Snapshot
The demographic snapshot compiled for the Downtown Belle Plaine Drive Time Markets benchmarks and tracks changes in the marketplace. Analysis and comparison of data for the three drive time areas reveal:
► Trends and projections for the five- and ten-minute drive time areas anticipate five-year decreases in population and households ranging from 1.4% to 2.7%; and gains of less than one percent in twenty-minute drive time population and households through 2019. At the state level, population and number of households are expected to grow at five-year rates of 2.8% and 3.1%, respectively.
► Consistent with the “Greying of America” phenomenon, average household size is anticipated to decrease slightly across the drive time areas and median age, estimated at 43.9 and 44.0 years in 2014, is expected to increase by a about one-half to one year through 2019. Median age for the drive times is comparatively older than that of the Iowa population, estimated at 38.5 years in 2014 and expected to reach 38.9 years by 2019.
► The concentration of renter-occupied housing units in 2014 is highest at the five-minute drive time level and ranges from 18.6% to 21.9% across the drive time areas. Between 11% and 15% of all housing units in the drive times are classified as vacant in 2014 and an increase in vacant units is expected through 2019. State figures for 2014 assigned a vacant status to 8.9% of all housing units, and the figure is expected to rise to 9.0% by 2019.
► Median household, average household and per capita income estimates for the five- and ten-minute drive times are considerably lower than those estimated for the twenty-minute drive time and for the state. Median household income is expected to increase across the drive times by about 15% to 17% through 2019. Overall, projected five-year growth rates for drive time area income approach or, in some instances, exceed growth rates forecast for the state.
Iowa Income 2014 2019 + %
Median HH $52.4K $61.3K 16.9%
Average HH $65.7K $76.7K 16.8%
Per Capita $26.7K $31.3K 17.1%
Drive Time 5 Minutes 10 Minutes 20 Minutes
Population
2000 Census 2,959 3,844 11,191
2010 Census 2,641 3,493 10,495
2014 Estimate 2,577 3,444 10,603
2019 Projection 2,507 3,382 10,633
Change: 2014 – 2019 -2.7% -1.8% 0.3%
Households
2000 Census 1,239 1,566 4,497
2010 Census 1,146 1,477 4,396
2014 Estimate 1,125 1,465 4,471
2019 Projection 1,101 1,445 4,508
Change: 2014 – 2019 -2.1% -1.4% 0.8%
Median Age
2014 Estimate 43.9 44.0 43.9
2019 Projection 44.8 44.6 44.4
Housing Units – 2014 1,313 1,691 5,023
Owner Occupied Units 63.8% 66.8% 70.4%
Renter Occupied Units 21.9% 19.9% 18.6%
Vacant Housing Units 14.3% 13.4% 11.0%
Housing Units – 2019 1,315 1,696 5,082
Owner Occupied Units 62.2% 65.7% 70.2%
Renter Occupied Units 21.4% 19.5% 18.5%
Vacant Housing Units 16.3% 14.8% 11.3%
Median HH Income
2014 Estimate $40,329 $44,092 $52,972
2019 Projection $46,523 $51,353 $60,909
Change: 2014 – 2019 15.4% 16.5% 15.0%
Average HH Income
2014 Estimate $47,696 $53,189 $62,715
2019 Projection $56,155 $62,212 $72,343
Change: 2014 – 2019 17.7% 17.0% 15.4%
Per Capita Income
2014 Estimate $20,945 $22,819 $26,465
2019 Projection $24,821 $26,822 $30,702
Change: 2014 – 2019 18.5% 17.5% 16.0%
Source: Esri Market Profile. Percentages may not equal 100% due to rounding.

Downtown Belle Plaine Market Snapshot | Belle Plaine, Iowa | January 2015 Page 5
Consumer Spending Potential The Esri Retail Goods and Services Expenditures report, built on Esri’s Consumer Spending database, measures the amount that households spend in select product and service categories, and compares amounts to national figures. The comparison to national household spending amounts is reported as an index, shown in the table below, where 100 equals the national average.
Consumer Spending Index 2014 Households Spending
(100 Equals National Average)
Downtown Belle Plaine Drive Time Areas
5 Minutes 10 Minutes 20 Minutes State of Iowa
Apparel & Services 41 46 52 58
Computers & Accessories 63 70 82 90
Education 55 63 71 84
Entertainment/Recreation 70 78 93 95
Food at Home 71 78 93 94
Food Away from Home 65 72 85 91
Health Care 75 83 101 98
HH Furnishings & Equipment 58 65 77 81
Investments 60 66 94 89
Retail Goods 69 77 92 91
Shelter 60 67 77 87
TV/Video/Audio 71 78 90 93
Travel 60 69 82 88
Vehicle Maintenance & Repairs 68 75 89 92
Data Note: Consumer spending shows the amount spent on a variety of goods and services by households that reside in the area. Expenditures are shown by broad budget categories that are not mutually exclusive. Consumer spending does not equal business revenue. Total and Average Amount Spent Per Household represent annual figures. The Spending Potential Index represents the amount spent in the area relative to a national average of 100. Source: Consumer Spending data are derived from the 2011 and 2012 Consumer Expenditure Surveys, Bureau of Labor Statistics. Esri. Source: U.S. Census Bureau, Census 2010 Summary File 1. Esri forecasts for 2014 and 2019. Esri converted Census 2000 data into 2010 geography.

Downtown Belle Plaine Market Snapshot | Belle Plaine, Iowa | January 2015 Page 6
Lifestyle Profile
Tapestry is a geodemographic segmentation system that integrates consumer traits with residential characteristics to identify markets and classify US neighborhoods. Neighborhoods with the most similar characteristics are grouped together, while neighborhoods with divergent characteristics are separated. Internally homogenous, externally heterogeneous market segments depict consumers' lifestyles and lifestages. Tapestry Segmentation combines the "who" of lifestyle demography with the "where" of local geography to create a classification model with 67 distinct, behavioral market US consumer markets are multidimensional and diverse. Using a large, well-selected array of attributes captures this diversity with the most powerful data available. Data sources include Census 2010, the American Community Survey, Esri's demographic updates, Experian's ConsumerViewSM database, and consumer surveys, such as the Survey of the American Consumer from GfK MRI, to capture the subtlety and vibrancy of the US marketplace. A market segmentation system must be able to distinguish consumer behavior—spending patterns and lifestyle choices—as expected. Esri verified the efficacy of its Tapestry Segmentation markets against consumer surveys from GfK MRI, which include nearly 6,000 product and service brands in 550 categories, along with readership of hundreds of magazines and newspapers, Internet usage, TV viewership by channel and program, radio listening, and other media.
Comparative View of Predominant Tapestry Household Segments
The following table shows and compares concentrations of the most prevalent Tapestry household segments found within each of the Downtown Belle Plaine drive time areas.
2014 Households 5 Minute Drive Time 10 Minute Drive Time 20 Minute Drive Time
Tapestry Segment Count Pct. Rank Count Pct. Rank Count Pct. Rank
Small Town Simplicity (12C) 476 42.3% 1 488 33.3% 1 488 10.9% 5
Salt of the Earth (6B) 325 28.9% 2 461 31.5% 2 1,402 31.4% 1
Heartland Communities (6F) 324 28.8% 3 330 22.5% 3 930 20.8% 3
Green Acres (6A) 0 0.0% -- 156 10.6% 4 497 11.1% 4
Prairie Living (6D) 0 0.0% -- 31 2.1% 5 1,091 24.4% 2
Total Count/Percent of Area 1,125 100.0% 1,466 100.0% 4,408 98.6%
Source: Esri Tapestry Segmentation Profile
Descriptions for the most predominant Tapestry segments found within each of the Downtown Belle Plaine drive time areas, and appearing in the table above, follow. Information on Esri Tapestry methodology and applications, along with descriptions for Tapestry’s 67 segments, are available from the Esri website at http://doc.arcgis.com/en/esri-demographics/data/tapestry-segmentation.htm.
Downtown Belle Plaine Market Snapshot | Belle Plaine, Iowa | January 2015 Page 7
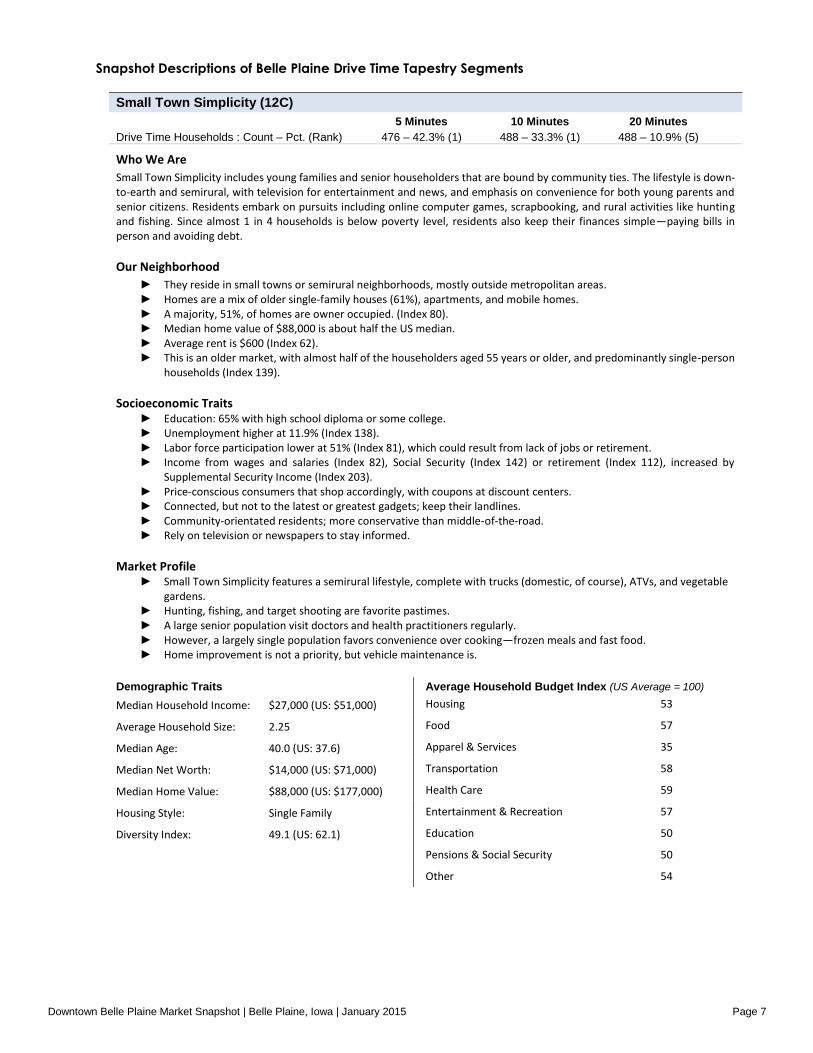
Snapshot Descriptions of Belle Plaine Drive Time Tapestry Segments
Small Town Simplicity (12C)
Drive Time Households : Count – Pct. (Rank)
5 Minutes 10 Minutes 20 Minutes
476 – 42.3% (1) 488 – 33.3% (1) 488 – 10.9% (5)
Who We Are
Small Town Simplicity includes young families and senior householders that are bound by community ties. The lifestyle is down-to-earth and semirural, with television for entertainment and news, and emphasis on convenience for both young parents and senior citizens. Residents embark on pursuits including online computer games, scrapbooking, and rural activities like hunting and fishing. Since almost 1 in 4 households is below poverty level, residents also keep their finances simple—paying bills in person and avoiding debt.
Our Neighborhood
► They reside in small towns or semirural neighborhoods, mostly outside metropolitan areas. ► Homes are a mix of older single-family houses (61%), apartments, and mobile homes. ► A majority, 51%, of homes are owner occupied. (Index 80). ► Median home value of $88,000 is about half the US median. ► Average rent is $600 (Index 62). ► This is an older market, with almost half of the householders aged 55 years or older, and predominantly single-person
households (Index 139).
Socioeconomic Traits ► Education: 65% with high school diploma or some college. ► Unemployment higher at 11.9% (Index 138). ► Labor force participation lower at 51% (Index 81), which could result from lack of jobs or retirement. ► Income from wages and salaries (Index 82), Social Security (Index 142) or retirement (Index 112), increased by
Supplemental Security Income (Index 203). ► Price-conscious consumers that shop accordingly, with coupons at discount centers. ► Connected, but not to the latest or greatest gadgets; keep their landlines. ► Community-orientated residents; more conservative than middle-of-the-road. ► Rely on television or newspapers to stay informed.
Market Profile ► Small Town Simplicity features a semirural lifestyle, complete with trucks (domestic, of course), ATVs, and vegetable
gardens. ► Hunting, fishing, and target shooting are favorite pastimes. ► A large senior population visit doctors and health practitioners regularly. ► However, a largely single population favors convenience over cooking—frozen meals and fast food. ► Home improvement is not a priority, but vehicle maintenance is.
Demographic Traits Average Household Budget Index (US Average = 100)
Median Household Income: $27,000 (US: $51,000) Housing 53
Average Household Size: 2.25 Food 57
Median Age: 40.0 (US: 37.6) Apparel & Services 35
Median Net Worth: $14,000 (US: $71,000) Transportation 58
Median Home Value: $88,000 (US: $177,000) Health Care 59
Housing Style: Single Family Entertainment & Recreation 57
Diversity Index: 49.1 (US: 62.1) Education 50
Pensions & Social Security 50
Other 54
Downtown Belle Plaine Market Snapshot | Belle Plaine, Iowa | January 2015 Page 8
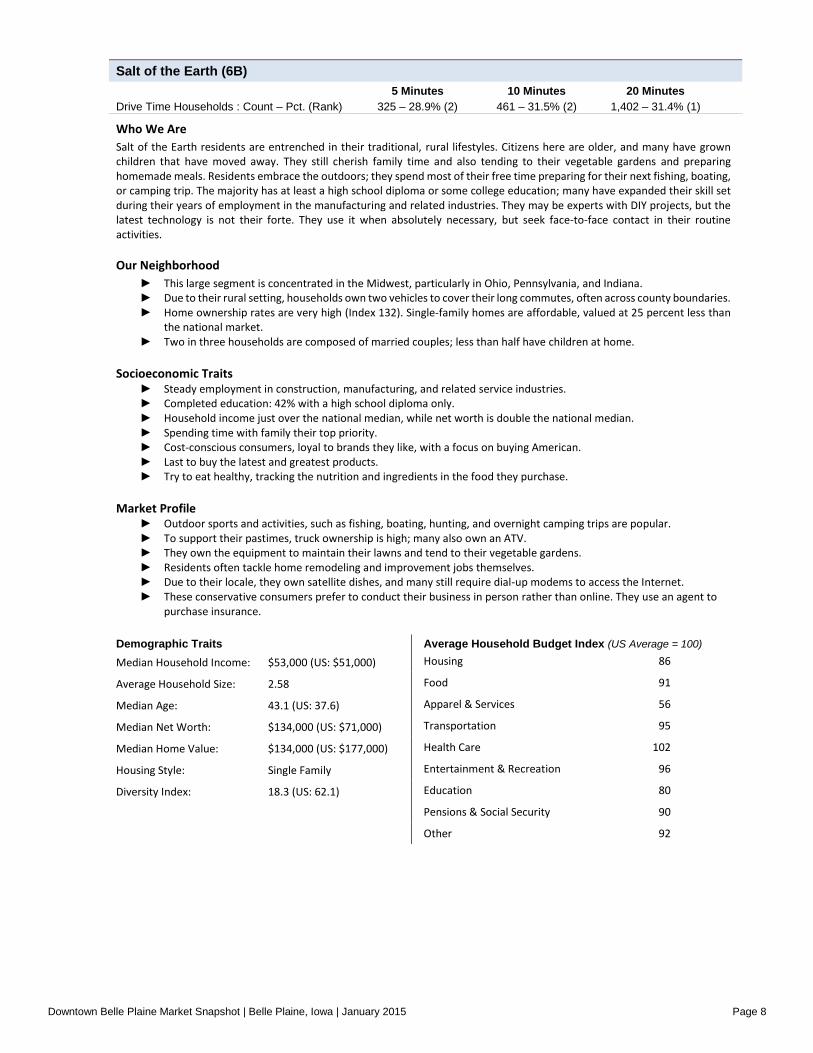
Salt of the Earth (6B)
Drive Time Households : Count – Pct. (Rank)
5 Minutes 10 Minutes 20 Minutes
325 – 28.9% (2) 461 – 31.5% (2) 1,402 – 31.4% (1)
Who We Are
Salt of the Earth residents are entrenched in their traditional, rural lifestyles. Citizens here are older, and many have grown children that have moved away. They still cherish family time and also tending to their vegetable gardens and preparing homemade meals. Residents embrace the outdoors; they spend most of their free time preparing for their next fishing, boating, or camping trip. The majority has at least a high school diploma or some college education; many have expanded their skill set during their years of employment in the manufacturing and related industries. They may be experts with DIY projects, but the latest technology is not their forte. They use it when absolutely necessary, but seek face-to-face contact in their routine activities.
Our Neighborhood
► This large segment is concentrated in the Midwest, particularly in Ohio, Pennsylvania, and Indiana. ► Due to their rural setting, households own two vehicles to cover their long commutes, often across county boundaries. ► Home ownership rates are very high (Index 132). Single-family homes are affordable, valued at 25 percent less than
the national market. ► Two in three households are composed of married couples; less than half have children at home.
Socioeconomic Traits
► Steady employment in construction, manufacturing, and related service industries. ► Completed education: 42% with a high school diploma only. ► Household income just over the national median, while net worth is double the national median. ► Spending time with family their top priority. ► Cost-conscious consumers, loyal to brands they like, with a focus on buying American. ► Last to buy the latest and greatest products. ► Try to eat healthy, tracking the nutrition and ingredients in the food they purchase.
Market Profile
► Outdoor sports and activities, such as fishing, boating, hunting, and overnight camping trips are popular. ► To support their pastimes, truck ownership is high; many also own an ATV. ► They own the equipment to maintain their lawns and tend to their vegetable gardens. ► Residents often tackle home remodeling and improvement jobs themselves. ► Due to their locale, they own satellite dishes, and many still require dial-up modems to access the Internet. ► These conservative consumers prefer to conduct their business in person rather than online. They use an agent to
purchase insurance.
Demographic Traits Average Household Budget Index (US Average = 100)
Median Household Income: $53,000 (US: $51,000) Housing 86
Average Household Size: 2.58 Food 91
Median Age: 43.1 (US: 37.6) Apparel & Services 56
Median Net Worth: $134,000 (US: $71,000) Transportation 95
Median Home Value: $134,000 (US: $177,000) Health Care 102
Housing Style: Single Family Entertainment & Recreation 96
Diversity Index: 18.3 (US: 62.1) Education 80
Pensions & Social Security 90
Other 92

Downtown Belle Plaine Market Snapshot | Belle Plaine, Iowa | January 2015 Page 9
Heartland Communities (6F)
Drive Time Households : Count – Pct. (Rank)
5 Minutes 10 Minutes 20 Minutes
324 – 28.8% (3) 330 – 22.5% (3) 930 – 20.8% (3)
Who We Are
Well settled and close-knit, Heartland Communities are semirural and semiretired. These older householders are primarily homeowners, and many have paid off their mortgages. Their children have moved away, but they have no plans to leave their homes. Their hearts are with the country; they embrace the slower pace of life here but actively participate in outdoor activities and community events. Traditional and patriotic, these residents support their local businesses, always buy American, and favor domestic driving vacations over foreign plane trips.
Our Neighborhood
► Rural communities or small towns are concentrated in the Midwest, from older Rustbelt cities to the Great Plains. ► Distribution of household types is comparable to the US, primarily (but not the majority) married couples, more with
no children, and a slightly higher proportion of singles (Index 112) that reflects the aging of the population. ► Residents own modest, single-family homes built before 1970. ► They own one or two vehicles; commutes are short (Index 95).
Socioeconomic Traits ► Retirees in this market depress the average labor force participation rate to less than 60% (Index 95), but the
unemployment rate is comparable to the US. ► More workers are white collar than blue collar; more skilled than unskilled. ► The rural economy of this market provides employment in the manufacturing, construction, and agriculture industries. ► These are budget savvy consumers; they stick to brands they grew up with and know the price of goods they purchase.
Buying American is important. ► Daily life is busy, but routine. Working on the weekends is not uncommon. ► Residents trust TV and newspapers more than any other media. ► Skeptical about their financial future, they stick to community banks and low-risk investments.
Market Profile ► Traditional in their ways, residents of Heartland Communities choose to bank and pay their bills in person and
purchase insurance from an agent. ► Most have high-speed Internet access at home or on their cell phone but aren’t ready to go paperless. ► Many residents have paid off their home mortgages but still hold auto loans and student loans. Noninterest checking
accounts are common. ► To support their local community, residents participate in public activities. ► Home remodeling is not a priority, but homeowners do tackle necessary maintenance work on their cherished
homes. They have invested in riding lawn mowers to maintain their larger yards. ► They enjoy country music and watch CMT. ► Motorcycling, hunting, and fishing are popular; walking is the main form of exercise. ► To get around these semirural communities, residents prefer domestic trucks or SUVs. ► They prefer to travel in the US and favor the convenience of packaged deals.
Demographic Traits Average Household Budget Index (US Average = 100)
Median Household Income: $39,000 (US: $51,000) Housing 65
Average Household Size: 2.38 Food 72
Median Age: 41.5 (US: 37.6) Apparel & Services 43
Median Net Worth: $55,000 (US: $71,000) Transportation 74
Median Home Value: $89,000 (US: $177,000) Health Care 79
Housing Style: Single Family Entertainment & Recreation 73
Diversity Index: 29.6 (US: 62.1) Education 59
Pensions & Social Security 66
Other 71

Downtown Belle Plaine Market Snapshot | Belle Plaine, Iowa | January 2015 Page 10
Green Acres (6A)
Drive Time Households : Count – Pct. (Rank)
5 Minutes 10 Minutes 20 Minutes
0 – 0.0% (--) 156 – 10.6% (4) 497 – 11.1% (4)
Who We Are
The Green Acres lifestyle features country living and self-reliance. They are avid do-it-yourselfers, maintaining and remodeling their homes, with all the necessary power tools to accomplish the jobs. Gardening, especially growing vegetables, is also a priority, again with the right tools, tillers, tractors, and riding mowers. Outdoor living also features a variety of sports: hunting and fishing, motorcycling, hiking and camping, and even golf. Self-described conservatives, residents of Green Acres remain pessimistic about the near future yet are heavily invested in it.
Our Neighborhood
► Rural enclaves in metropolitan areas, primarily (not exclusively) older homes with acreage; new housing growth in the past 10 years.
► Single-family, owner-occupied housing, with a median value of $197,000. ► An older market, primarily married couples, most with no children.
Socioeconomic Traits
► Education: 60% are college educated. ► Unemployment is low at 6% (Index 70); labor force participation rate is high at 67.4% (Index 108). ► Income is derived not only from wages and salaries but also from self-employment (more than 15% of households),
investments (30% of households), and increasingly, from retirement. ► They are cautious consumers with a focus on quality and durability. ► Comfortable with technology, more as a tool than a trend: banking or paying bills online is convenient; but the Internet
is not viewed as entertainment. ► Economic outlook is professed as pessimistic, but consumers are comfortable with debt, primarily as home and auto
loans, and investments.
Market Profile
► Purchasing choices reflect Green Acres’ residents country life, including a variety of vehicles from trucks and SUVs to ATVs and motorcycles, preferably late model.
► Homeowners favor DIY home improvement projects and gardening. ► Media of choice are provided by satellite service, radio, and television, also with an emphasis on country and home
and garden. ► Green Acres residents pursue physical fitness vigorously, from working out on home exercise equipment to playing a
variety of sports. ► Residents are active in their communities and a variety of social organizations, from fraternal orders to veterans’
clubs.
Demographic Traits Average Household Budget Index (US Average = 100)
Median Household Income: $72,000 (US: $51,000) Housing 119
Average Household Size: 2.69 Food 118
Median Age: 43.0 (US: 37.6) Apparel & Services 78
Median Net Worth: $226,000 (US: $71,000) Transportation 122
Median Home Value: $197,000 (US: $177,000) Health Care 129
Housing Style: Single Family Entertainment & Recreation 128
Diversity Index: 24.0 (US: 62.1) Education 119
Pensions & Social Security 127
Other 122

Downtown Belle Plaine Market Snapshot | Belle Plaine, Iowa | January 2015 Page 11
Prairie Living (6D)
Drive Time Households : Count – Pct. (Rank)
5 Minutes 10 Minutes 20 Minutes
0 – 0.0% (--) 31 – 2.1% (5) 1,091 – 24.4% (2)
Who We Are
Prairie Living is Tapestry Segmentation’s most rural market, comprising about 1 percent of households, located mainly in the Midwest, with a predominance of self-employed farmers. These agricultural communities are not diverse, dominated by married-couple families that own single-family dwellings and many vehicles. Median household income is similar to the US, and labor force participation is slightly higher. Faith is important to this hardworking market. When they find time to relax, they favor outdoor activities.
Our Neighborhood
► About four-fifths of households are owner occupied. ► Dominant household type is married-couples with no children. ► Most are single-family homes (87%) built before 1980; a higher proportion were built before 1940 (Index 225). ► Higher percentage of vacant housing units is at 16% (Index 137). ► Most households own 2 or 3 vehicles; this is the highest ranked market for owning 4 or more vehicles.
Socioeconomic Traits
► Half have completed some college education or hold a degree. ► At 4.1%, the unemployment rate is less than half the US rate. ► Labor force participation rate slightly higher at 66%. ► Wage and salary income for 73% of households plus self-employment income for 27% (Index 242). ► Faith and religion are important to these residents. ► Tend to buy things when they need them, rather than when they want them or to be trendy. ► Somewhat resistant to new technology. ► Creatures of habit when purchasing food items.
Market Profile
► Many own a truck, riding lawn mower, and ATV/UTV and have a satellite dish. ► They purchased plants and seeds in the past year for their vegetable garden, where their tiller comes in handy. ► They favor banking in person, have noninterest checking accounts, invest in CDs (more than 6 months), and have
term/whole life insurance. ► They are pet owners. ► Leisure activities include fishing, hunting, boating, camping, and attending country music concerts. ► Residents prefer to listen to faith and inspirational, as well as country music on the radio. ► They read home service, fishing/hunting, and automotive magazines. ► They contribute to religious organizations and belong to religious clubs. ► Walmart is a favorite shopping stop; Subway is a favorite eating spot.
Demographic Traits Average Household Budget Index (US Average = 100)
Median Household Income: $51,000 (US: $51,000) Housing 79
Average Household Size: 2.50 Food 92
Median Age: 43.4 (US: 37.6) Apparel & Services 50
Median Net Worth: $118,000 (US: $71,000) Transportation 97
Median Home Value: $125,000 (US: $177,000) Health Care 108
Housing Style: Single Family Entertainment & Recreation 96
Diversity Index: 22.6 (US: 62.1) Education 65
Pensions & Social Security 83
Other 93

Downtown Belle Plaine Market Snapshot | Belle Plaine, Iowa | January 2015 Page 12
Retail Market Performance Esri's Retail MarketPlace data provides a direct comparison between retail sales and consumer spending by industry. To capture a snapshot of an area's retail market place, the leakage and surplus factor summarizes the relationship between supply (retail sales by businesses) and demand (consumer spending by household). Deviations from potential sales may reveal areas of opportunity in the trade area’s retail sectors, keeping in mind any extenuating circumstances that may be driving the results. Esri uses the North American Industry Classification System (NAICS) to classify businesses by their primary type of economic activity. Retail establishments are classified into 27 industry groups within Retail Trade sector, and four industry groups within the Food Services & Drinking Establishments subsector. To estimate sales, the Retail MarketPlace database combines a number of data sources, including
► Census Bureau's Census of Retail Trade (CRT) and Monthly Retail Trade (MRT)
► Census Bureau's Nonemployer Statistics (NES)
► Esri's demographic data
► Dun & Bradstreet
► Bureau of Labor Statistics All estimates of actual sales (supply) reflect current dollars derived from receipts of businesses primarily engaged in selling merchandise. Potential sales (demand) is estimated by using Esri's consumer spending data which provides estimated expenditures for more than 700 products and services that are consumed by U.S. households. The estimate of a trade area’s demand is based upon estimated expenditures by households within the trade area. Leakage within a specified trade area represents a condition where supply is less than demand. Retailers outside of the trade area are fulfilling demand for retail products. Surplus within a specified trade area represents a condition where supply exceeds the area's demand. Thus retailers are attracting customers that reside outside the trade area.
Sales Surplus and Leakage Estimates
Total Retail Trade and Food & Drink demand versus sales estimates show a sales surplus estimate of $2.0 million for the five-minute drive time area; and sales leakage estimated at $6.4 million and $78.7 million at the ten- and twenty-minute drive time geography levels, respectively.
Sales Surplus & Leakage Analysis 5 Minutes 10 Minutes 20 Minutes
NAICS Code: Business Description Surplus/(Leakage)
Estimate Surplus/(Leakage)
Estimate Surplus/(Leakage)
Estimate
Total Retail Trade and Food & Drink (NAICS 44 – 45, 722) $2,006,779 ($6,406,016) ($78,653,550)
Total Retail Trade (NAICS 44 – 45) $2,895,916 ($4,648,826) ($70,754,991)
Total Food & Drink (NAICS 722) ($889,137) ($1,757,190) ($7,898,560)
Retail Trade patterns are consistent with overall figures, with a sales surplus estimate of $2.9 million for the five-minute drive time area; and sales leakage ranging from about $4.6 million to $70.8 million in the ten- and twenty-minute drive times, respectively. Notably, the Retail Trade sales surplus reported for the five-minute drive time is largely driven by a substantial sales surplus in the Lawn and Garden Equipment and Supplies subcategory which, in essence, helps to offset leakage occurring in the majority of other retail categories and subcategories. Estimates for Food & Drink sector sales in comparison to projected demand show sales leakage at all drive time area levels ranging from an estimated $0.9 million in the five-minute drive time area to nearly $7.9 million in the twenty-minute drive time area.

Downtown Belle Plaine Market Snapshot | Belle Plaine, Iowa | January 2015 Page 13
The following table presents a breakdown of sales surplus and leakage estimates for 27 industry groups in the Retail Trade sector and for the four industry groups within the Food Services & Drinking Places subsector for the Downtown Belle Plaine drive time markets.
Downtown Belle Plaine • Esri Retail MarketPlace Report Summary
Sales Surplus & Leakage and Leakage Estimates 5 Minutes 10 Minutes 20 Minutes
Surplus/(Leakage) Estimate
Surplus/(Leakage) Estimate
Surplus/(Leakage) Estimate NAICS Code: Business Description
Total Retail Trade and Food & Drink (NAICS 44 – 45, 722) $2,006,779 ($6,406,016) ($78,653,550)
Total Retail Trade (NAICS 44 – 45) $2,895,916 ($4,648,826) ($70,754,991)
Total Food & Drink (NAICS 722) ($889,137) ($1,757,190) ($7,898,560)
441: Motor Vehicle & Parts Dealers $167,913 ($1,573,643) ($11,398,927)
4411: Automobile Dealers $534,099 ($1,037,047) ($9,239,030)
4412: Other Motor Vehicle Dealers ($197,454) ($327,841) ($1,589,854)
4413: Auto Parts, Accessories, and Tire Stores ($168,730) ($208,755) ($570,042)
442: Furniture & Home Furnishings Stores ($398,787) ($583,669) ($1,890,688)
4421: Furniture Stores ($246,270) ($358,234) ($1,266,373)
4422: Home Furnishings Stores ($152,517) ($225,436) ($720,206)
443/4431: Electronics & Appliance Stores ($393,249) ($644,684) ($2,656,832)
444: Building Materials, Garden Equip. & Supply Stores $11,832,021 $12,270,574 $9,755,951
4441: Building Material and Supplies Dealers ($274,668) ($497,149) ($2,329,524)
4442: Lawn and Garden Equipment and Supplies Stores $12,106,689 $12,767,723 $12,085,475
445: Food & Beverage Stores ($3,230,926) ($4,795,671) ($17,812,264)
4451: Grocery Stores ($3,113,041) ($4,625,755) ($17,230,342)
4452: Specialty Food Stores ($50,689) ($72,381) ($262,810)
4453: Beer, Wine, and Liquor Stores ($67,195) ($97,534) ($348,069)
446/4461: Health & Personal Care Stores $1,363,969 $825,948 ($5,161,288)
447/4471: Gasoline Stations ($2,444,605) ($3,461,519) ($9,820,692)
448: Clothing and Clothing Accessories Stores ($898,903) ($1,279,451) ($4,835,425)
4481: Clothing Stores ($700,962) ($932,140) ($3,236,137)
4482: Shoe Stores ($24,917) ($91,275) ($720,756)
4483: Jewelry, Luggage, and Leather Goods Stores ($173,024) ($256,036) ($878,532)
Data Source: Esri Retail MarketPlace Profile, 2014; Esri and Dun & Bradstreet. © 2014 Dun & Bradstreet, Inc. All rights reserved.
Data Note: The polarity of surplus/leakage estimates shown in this report (as compared to those shown in the original Esri reports) have been reversed to show a surplus as a positive value, and to show a leakage as a negative value. The Retail Gap (Sales Surplus/Leakage) represents the difference between Retail Potential and Retail Sales. A positive value represents a surplus in retail sales, often indicating a market where customers are drawn in from outside the defined trade area.

Downtown Belle Plaine Market Snapshot | Belle Plaine, Iowa | January 2015 Page 14
Sales Surplus & Leakage Estimates 5 Minutes 10 Minutes 20 Minutes
Surplus/(Leakage)
Estimate Surplus/(Leakage)
Estimate Surplus/(Leakage)
Estimate NAICS Code: Business Description
451: Sporting Goods, Hobby, Book, and Music Stores ($122,984) ($243,242) ($1,714,331)
4511: Sporting Goods/Hobby/Musical Instrument Stores ($18,415) ($91,399) ($1,196,101)
4512: Book, Periodical, and Music Stores ($104,569) ($151,843) ($531,590)
452: General Merchandise Stores ($2,862,981) ($4,501,560) ($18,777,370)
4521: Department Stores (Excluding Leased Depts.) ($450,253) ($1,051,696) ($6,246,323)
4529: Other General Merchandise Stores ($2,412,728) ($3,449,864) ($12,569,959)
453: Miscellaneous Store Retailers ($158,815) ($409,324) ($2,944,589)
4531: Florists $33,631 $29,166 $42,092
4532: Office Supplies, Stationery, and Gift Stores ($92,450) ($168,810) ($816,536)
4533: Used Merchandise Stores $52,514 $28,790 ($293,823)
4539: Other Miscellaneous Store Retailers ($152,510) ($298,469) ($1,876,321)
454: Nonstore Retailers $43,263 ($284,642) ($3,498,534)
4541: Electronic Shopping and Mail-Order Houses $321,271 $106,323 ($2,212,255)
4542: Vending Machine Operators ($50,470) ($72,236) ($228,257)
4543: Direct Selling Establishments ($227,538) ($318,728) ($1,058,022)
722: Food Services & Drinking Places ($889,137) ($1,757,190) ($7,898,560)
7221: Full-Service Restaurants ($700,085) ($1,019,611) ($2,831,400)
7222: Limited-Service Eating Places ($15,760) ($466,596) ($4,125,203)
7223: Special Food Services ($21,216) ($65,565) ($465,275)
7224: Drinking Places (Alcoholic Beverages) ($152,075) ($205,418) ($476,682)
Data Source: Esri Retail MarketPlace Profile, 2014; Esri and Dun & Bradstreet. © 2014 Dun & Bradstreet, Inc. All rights reserved. Data Note: The polarity of surplus/leakage estimates shown in this report (as compared to those shown in the original Esri reports) have been reversed to show a surplus as a positive value, and to show a leakage as a negative value. The Retail Gap (Sales Surplus/Leakage) represents the difference between Retail Potential and Retail Sales. A positive value represents a surplus in retail sales, often indicating a market where customers are drawn in from outside the defined trade area. Esri uses the North American Industry Classification System (NAICS) to classify businesses by their primary type of economic activity. Retail establishments are classified into 27 industry groups in the Retail Trade sector, as well as four industry groups within the Food Services & Drinking Establishments subsector. For more information on Retail MarketPlace data and to download the methodology statement visit http://doc.arcgis.com/en/esri-demographics/data/retail-marketplace.htm.

Downtown Belle Plaine Market Snapshot | Belle Plaine, Iowa | January 2015 Page 15
Sales Surplus/Leakage Factors
Sales Surplus/Leakage Factors present a snapshot of retail opportunity. This is a measure of the relationship between supply and demand that ranges from +100 (total surplus) to -100 (total leakage). A positive value represents a surplus of retail sales (often indicative of a market where customers are drawn in from outside the trade area). Categories showing the highest surplus factors may be indicative of relative strength in the market. Negative leakage factors may reveal retail opportunity outside the trade area, with the lowest values indicating possible targets for retail expansion or recruitment. The following table displays figures for some of the highest and lowest Surplus/Leakage Factors in the five-minute drive time area for select Retail and Food & Drink categories and subcategories, along with corresponding figures for the ten- and twenty-minute drive time areas. Downtown Belle Plaine Drive Time Areas • Sales Surplus/Leakage Factors – Select Categories
5 Minutes 10 Minutes 20 Minutes
Category/Subcategory Description NAICS Factor # Biz Factor # Biz Factor # Biz
▲ Lawn & Garden Equip & Supply Stores 4442 96.3 1 95.0 1 82.5 3
▲ Florists 4531 51.3 1 38.3 1 19.4 2
▲ Health & Personal Care Stores 446,4461 28.3 2 14.3 2 (39.5) 6
▲ Used Merchandise Stores 4533 22.9 2 10.1 2 (48.3) 2
▲ Electronic Shopping & Mail-Order 4541 20.7 1 5.7 1 (52.7) 1
▲ Automobile Dealers 4411 6.2 2 (9.8) 2 (27.7) 4
▼ Furniture Stores 4421 (100.0) 0 (100.0) 0 (100.0) 0
▼ Home Furnishings Stores 4422 (100.0) 0 (100.0) 0 (80.7) 1
▼ Specialty Food Stores 4452 (100.0) 0 (100.0) 0 (100.0) 0
▼ Beer, Wine & Liquor Stores 4453 (100.0) 0 (100.0) 0 (100.0) 0
▼ Gasoline Stations 447,4471 (100.0) 0 (100.0) 0 (63.8) 1
▼ Clothing Stores 4481 (100.0) 0 (83.7) 1 (82.8) 2
▼ Jewelry, Luggage & Leather Goods 4483 (100.0) 0 (100.0) 0 (100.0) 0
▼ Book, Periodical & Music Stores 4512 (100.0) 0 (100.0) 0 (100.0) 0
▼ Other General Merchandise Stores 4529 (100.0) 0 (100.0) 0 (100.0) 0
▼ Full-Service Restaurants 7221 (100.0) 0 (100.0) 0 (63.3) 2
▼ Grocery Stores 4451 (67.9) 3 (72.8) 3 (75.8) 7
▼ Drinking Places - Alcoholic Beverages 7224 (59.5) 1 (50.5) 2 (29.0) 7
▼ Electronics & Appliance Stores 4431 (50.9) 1 (61.3) 1 (77.8) 2
▼ Other Motor Vehicle Dealers 4412 (42.3) 1 (53.0) 1 (73.4) 2
▼ Auto Parts, Accessories & Tire Stores 4413 (40.4) 1 (32.3) 1 (23.1) 5
▼ Office Supplies, Stationery & Gift Stores 4532 (34.1) 3 (47.4) 3 (74.4) 5
▼ Building Material & Supplies Dealers 4441 (30.9) 2 (41.3) 2 (57.2) 7
▼ Other Miscellaneous Store Retailers 4539 (19.3) 6 (29.3) 6 (61.9) 9
Data Source: Esri Retail MarketPlace Profile, 2014; Esri and Dun & Bradstreet. © 2014 Dun & Bradstreet, Inc. All rights reserved.
Data Note: The polarity of surplus/leakage factors shown in this report (as compared to those shown in the original Esri reports) have been reversed to show a surplus factor as a positive value, and to show a leakage factor as a negative value. The factor is a measure of the relationship between supply and demand that ranges from +100 (total surplus) to -100 (total leakage). A positive value represents a surplus of retail sales (often indicative of a market where customers are drawn in from outside the trade area).

Downtown Belle Plaine Market Snapshot | Belle Plaine, Iowa | January 2015 Page 16
Summary
The preparation of this Market Snapshot document is only the beginning to an ongoing process to study, analyze and interpret the market and to identify and capitalize upon emerging opportunities that are consistent with the community’s vision for Downtown Belle Plaine. The Market Snapshot presents a portrait of the downtown Belle Plaine trade area today and, for certain demographic characteristics, anticipates changes that could occur over the next five years. Important demographic and lifestyle data analyzed reveal:
► The population within the five-and ten-minute drive time areas is expected to decrease at five-year rates of 2.7% and 1.8%, respectively; while a gain of 0.3% is anticipated in the twenty-minute drive time area’s population through 2019.
► Like population, the number of households in the five- and ten-minute drive time areas is forecast to decrease from 2014 to 2019 by 2.1% and 1.4%, respectively; and the twenty-minute drive time area is expected to see an increase of 0.8% over the same five-year period.
► Projected five-year declines in the five- and ten-minute drive time areas’ population and households run counter to expected growth rates for Iowa’s population (2.8%) and households (3.1%) from 2014 to 2019.
► Median age is estimated in 2014 within a range of 43.9 to 44.0 years in the various drive time areas and is expected to increase by about one-half year through 2019. By comparison, the 2014 median age of the state population is estimated at 38.5 years in 2014 and is expected to increase to 38.9 years by 2019.
► All income category figures are highest in the twenty-minute drive time area, where 2014 median household income is estimated at $52,972, as compared to five- and ten-minute drive time area estimates of $40,329 and $44,092, respectively.
► Median household income is expected to grow at five-year rates ranging from 15.0% to 16.5% across the drive time areas, with the highest rate of growth anticipated to occur at the ten-minute drive time geography level. Median household income growth in the drive times approaches, but falls short, of the 16.9% five-year rate of growth forecast for households statewide.
► Consumer expenditures for goods and services are consistent with income levels and patterns across the drive time areas, with expenditure category indices highest at the twenty-minute geography level, and where indices for the majority of spending categories are within 20 points of national spending averages.
► The Small Town Simplicity, Salt of the Earth and Heartland Communities Esri Tapestry Lifestyle segments are dominant across the five- and ten-minute drive time areas, collectively representing 100% of five-minute drive time households and 87% of ten-minute drive time households. The Salt of the Earth segment (31.4%) is the most prevalent lifestyle segment found in the twenty-minute drive time area, followed by the Prairie Living (24.4%) and Heartland Communities (20.8%) segments to, collectively, represent nearly 77% of the twenty-minute drive time area’s households. The data and findings suggest that opportunities and strategies to increase downtown Belle Plaine’s market share might be focused in three areas:
1. Local, client and convenience-oriented marketing and business development strategies which appeal to characteristics and traits common to the three tapestry segments most prevalent across the five- and ten-minute drive time areas (Small Town Simplicity, Salt of the Earth and Heartland Communities). These strategies are likely to emphasize local personalities, hometown customer service, local traditions and convenience.
2. Extending regional appeal through intentional marketing, messages and events similar to those targeting the local audience, along with special consideration for the lifestyle characteristics and traits of the of the Prairie Living and Green Acres lifestyle segments which, together, represent nearly 36% of twenty-minute drive time area households.
3. Continuing to capitalize on unique downtown anchors and attractions which have special appeal – and “pull” – for visitors and day-trippers traveling from areas beyond the twenty-minute drive time area.
Downtown Belle Plaine Market Snapshot | Belle Plaine, Iowa | January 2015 Page 17
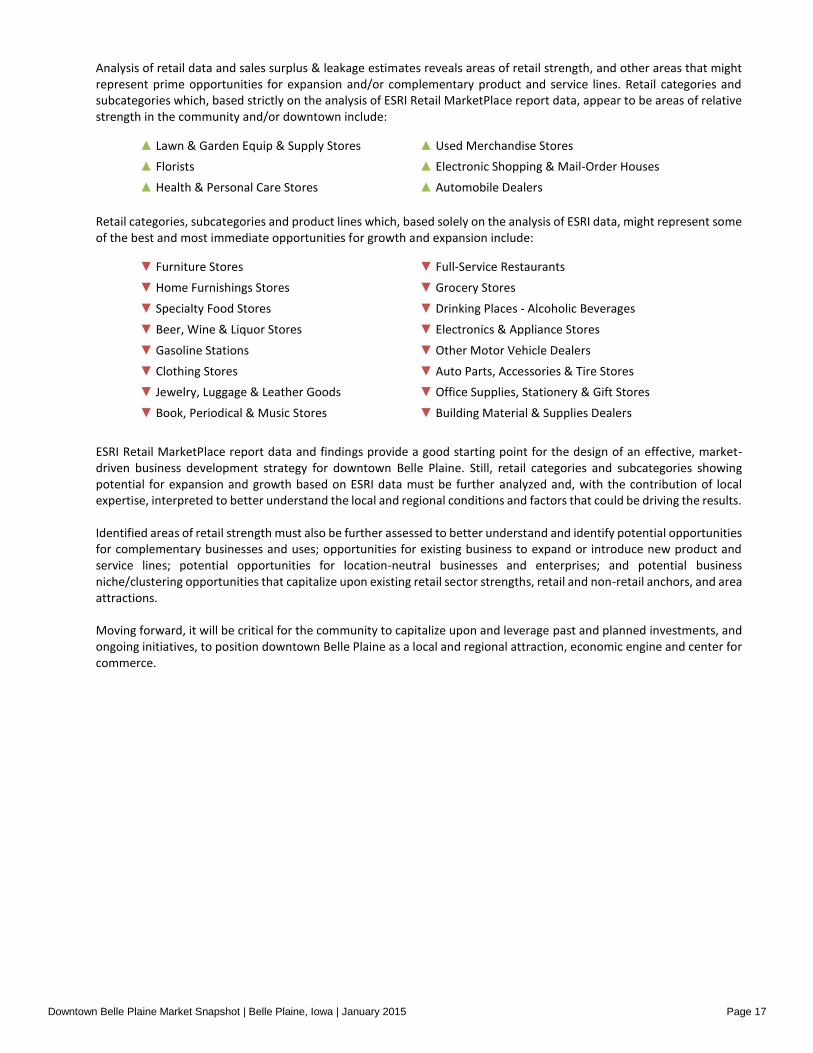
Analysis of retail data and sales surplus & leakage estimates reveals areas of retail strength, and other areas that might represent prime opportunities for expansion and/or complementary product and service lines. Retail categories and subcategories which, based strictly on the analysis of ESRI Retail MarketPlace report data, appear to be areas of relative strength in the community and/or downtown include:
▲ Lawn & Garden Equip & Supply Stores ▲ Used Merchandise Stores
▲ Florists ▲ Electronic Shopping & Mail-Order Houses
▲ Health & Personal Care Stores ▲ Automobile Dealers
Retail categories, subcategories and product lines which, based solely on the analysis of ESRI data, might represent some of the best and most immediate opportunities for growth and expansion include:
▼ Furniture Stores ▼ Full-Service Restaurants
▼ Home Furnishings Stores ▼ Grocery Stores
▼ Specialty Food Stores ▼ Drinking Places - Alcoholic Beverages
▼ Beer, Wine & Liquor Stores ▼ Electronics & Appliance Stores
▼ Gasoline Stations ▼ Other Motor Vehicle Dealers
▼ Clothing Stores ▼ Auto Parts, Accessories & Tire Stores
▼ Jewelry, Luggage & Leather Goods ▼ Office Supplies, Stationery & Gift Stores
▼ Book, Periodical & Music Stores ▼ Building Material & Supplies Dealers
ESRI Retail MarketPlace report data and findings provide a good starting point for the design of an effective, market-driven business development strategy for downtown Belle Plaine. Still, retail categories and subcategories showing potential for expansion and growth based on ESRI data must be further analyzed and, with the contribution of local expertise, interpreted to better understand the local and regional conditions and factors that could be driving the results. Identified areas of retail strength must also be further assessed to better understand and identify potential opportunities for complementary businesses and uses; opportunities for existing business to expand or introduce new product and service lines; potential opportunities for location-neutral businesses and enterprises; and potential business niche/clustering opportunities that capitalize upon existing retail sector strengths, retail and non-retail anchors, and area attractions. Moving forward, it will be critical for the community to capitalize upon and leverage past and planned investments, and ongoing initiatives, to position downtown Belle Plaine as a local and regional attraction, economic engine and center for commerce.