Embed Size (px)
Citation preview
Oxera Draft for Comment: Strictly Confidential
i
Share prices and trading activity over the corporate action processing cycle
Report prepared for The Depository Trust & Clearing Corporation
May 2006

Oxera Consulting Ltd is registered in England No. 2589629. Registered office at Park Central, 40/41 Park End Street, Oxford OX1 1JD, UK. Although every effort has been made to ensure the accuracy of the material and the integrity of the analysis presented herein, the Company accepts no liability for any actions taken on the basis of its contents.
Oxera Consulting Ltd is not licensed in the conduct of investment business as defined in the Financial Services and Markets Act 2000. Anyone considering a specific investment should consult their own broker or other investment adviser. The Company accepts no liability for any specific investment decision, which must be at the investor’s own risk.
© Oxera, 2006. All rights reserved. Except for the quotation of short passages for the purposes of criticism or review, no part may be used or reproduced without permission.
Oxera Share prices and trading activity i
Executive summary
In recent years, there has been considerable interest in the risks associated with corporate action processing. Several industry initiatives have acknowledged the potential impact of this limitation on the risks to which intermediaries and investors are exposed, principally in the operations of the back office. However, market participants are increasingly recognising the advantage that accurate and timely corporate action information can provide in the implementation of their trading strategies and provision of investment advice to their clients.
The overall objective of this research project is to examine the ways in which accurate and timely corporate action information could benefit financial organisations and their customers by improving the effectiveness of their trading strategy and quality of advice offered to their clients. For example, investors might use corporate actions information to develop strategies that make use of predictable movements in share prices, or take advantage of the ability to predict changes in share price volatility. At the same time, predictable movements in trading activity are likely to provide greater understanding of the trading liquidity that investors can expect to observe on a given day.
Due to their nature, corporate actions are likely to have the most significant impact on share prices and the trading activity of firms’ securities on the announcement day. For example, corporate actions often alter firms’ future cash flows, and provide new signals about their profitability and changes in financing structure. Furthermore, some corporate action types can affect the value of firms indirectly by, for example, altering trading costs in the secondary markets. The results documented in this report confirm that corporate actions often have significant implications for share prices and trading activity, and provide evidence on the diversity of these implications, depending on the corporate action type.
An analysis of takeovers, spin-offs, stock splits, exchange offers, and rights issues for a large sample of US (and, in the case of rights issues, European and Asian) firms between 2003 and 2005 has led to the following conclusions.
– Corporate actions have potentially strong effects on share prices and trading activity, although these effects depend on the type of corporate action and the particular point in the corporate action processing cycle.
– Within the corporate action types analysed in this study, takeovers, spin-offs, stock splits and rights issues appear to have the strongest effects, while exchange offers have only a limited impact.
– In general, the strongest effect is observed on the date on which the corporate action is announced, although record dates and ex dates are also often associated with significant increases in share price volatility and trading activity.
– The effect of corporate actions on share prices and trading activity does not appear to be limited to the USA. Analysis of rights issues based on a sample of firms from the USA, Europe and Asia yields significant share price and trading activity effects during the rights issues processing cycle in all of these markets.

Oxera Share prices and trading activity ii
The evidence presented in this study shows that there is a significant link between corporate actions and share prices and trading activity. Moreover, the nature of this relationship suggests that the implications of corporate actions might extend to other financial products, affecting prices of corporate bonds and related derivative products. Therefore, high-quality data on corporate actions could be a valuable component of the information used in developing trading strategies and providing investment advice to clients. However, further examination of the way in which intermediaries and other investors actually use corporate action information would be required in order to evaluate the potential of corporate action data in the overall information set used to reach investment decisions and provide advice.
Oxera Share prices and trading activity
Contents
1 Introduction and key findings 1 1.1 Corporate actions, share prices and investor behaviour 1 1.2 Scope of the analysis 2 1.3 The key findings 2 1.4 Structure of this report 4
2 Data and methodology 5 2.1 Sample 5 2.2 Outline of the analysis 6 2.3 Definitions of variables 7
3 What is the evidence? 9 3.1 Takeovers 9 3.2 Spin-offs 12 3.3 Stock splits 19 3.4 Exchange offers 25 3.5 Rights issues 29
4 What drives these share price effects? 36 4.1 Corporate actions, cash flows and value of the firm 36 4.2 Providing signals about firms’ profitability 38 4.3 Other effects 38
5 Summary and main conclusions 40
Appendix 1 Statistical techniques 41 A1.1 Abnormal shareholder returns 41 A1.2 Abnormal return variance 42 A1.3 Abnormal trading velocity 42
Appendix 2 Announcement date analysis 44
Oxera Share prices and trading activity
List of tables Table 2.1 Corporate action types 5 Table 2.2 Corporate action dates covered in this study 5 Table 3.2 Announcement date, daily share price return volatility 11 Table 3.3 Announcement date, daily trading velocity 12 Table 3.4 Announcement date, daily share price returns (%) 13 Table 3.5 Announcement date, daily share price return volatility 14 Table 3.6 Announcement date, daily trading velocity 15 Table 3.7 Record date, daily share price returns (%) 16 Table 3.8 Record date, daily share price return volatility 17 Table 3.9 Record date, daily trading velocity 17 Table 3.10 Ex date, daily share price returns (%) 18 Table 3.11 Ex date, daily share price return volatility (absolute returns) 18 Table 3.12 Ex date, daily trading velocity 18 Table 3.13 Announcement date, daily share price returns (%) 19 Table 3.14 Announcement date, daily share price return volatility 20 Table 3.15 Announcement date, daily trading velocity 21 Table 3.16 Record date, daily share price returns (%) 22 Table 3.17 Record date, daily share price return volatility 23 Table 3.18 Record date, daily trading velocity 23 Table 3.19 Ex date, daily share price returns (%) 24 Table 3.20 Ex date, daily share price return volatility 24 Table 3.21 Ex date, daily trading velocity 25 Table 3.22 Announcement date, daily share price returns (%) 25 Table 3.23 Announcement date, daily share price return volatility 26 Table 3.24 Announcement date, daily trading velocity 27 Table 3.25 Effective date, daily share price returns (%) 28 Table 3.26 Effective date, daily share price return volatility 29 Table 3.27 Effective date, daily trading velocity 29 Table 3.28 Announcement date, daily share price returns (%) 30 Table 3.29 Announcement date, daily share price return volatility 31 Table 3.30 Announcement date, daily trading velocity 32 Table 3.31 Record date, daily share price returns (%) 33 Table 3.32 Record date, daily share price return volatility 33 Table 3.33 Record date, daily trading velocity 33 Table 3.34 Ex date, daily share price returns (%) 34 Table 3.35 Ex date, daily share price return volatility 34 Table 3.36 Ex date, daily trading velocity 35 Table A2.1 Difference between average daily and historical share price returns 45 Table A2.2 Ratio of average daily absolute share price returns and historical average
daily absolute returns 46 Table A2.3 Ratio of average daily velocity and historical average daily velocity 47
Oxera Share prices and trading activity
List of figures Figure 1.1 Impact of takeover announcements on target companies 4 Figure 3.1 Announcement date, cumulative difference between average daily and
historical share price returns (%) 10 Figure 3.2 Announcement date, ratio of average daily absolute share price returns and
historical average daily absolute returns 11 Figure 3.3 Announcement date, ratio of average daily velocity and historical average
daily velocity 12 Figure 3.4 Announcement date, cumulative difference between average daily and
historical share price returns (%) 14 Figure 3.5 Announcement date, ratio of average daily absolute share price returns and
historical average daily absolute returns 15 Figure 3.6 Announcement date, ratio of average daily velocity and historical average
daily velocity 16 Figure 3.7 Announcement date, cumulative difference between average daily and
historical share price returns (%) 20 Figure 3.8 Announcement date, ratio of average daily absolute share price returns and
historical average daily absolute returns 21 Figure 3.9 Announcement date, ratio of average daily velocity and historical average
daily velocity 22 Figure 3.10 Announcement date, cumulative difference between average daily and
historical share price returns (%) 26 Figure 3.11 Announcement date, ratio of average daily absolute share price returns and
historical average daily absolute returns 27 Figure 3.12 Announcement date, ratio of average daily velocity and historical average
daily velocity 28 Figure 3.13 Announcement date, cumulative difference between average daily and
historical share price returns (%) 30 Figure 3.14 Announcement date, ratio of average daily absolute share price returns and
historical average daily absolute returns 31 Figure 3.15 Announcement date, ratio of average daily velocity and historical average
daily velocity 32
Oxera Share prices and trading activity 1
1 Introduction and key findings
In recent years there has been considerable interest in the risks associated with corporate action processing. Despite significant progress towards straight-through processing of securities transactions, corporate actions processing remains an area with only limited automation and standardisation, or even harmonisation of standard practices, and one in which corporate action information may come from multiple sources with different levels of accuracy and coverage. Several industry initiatives have acknowledged the potential impact of this limitation on the risks to which intermediaries and investors are exposed. Market participants increasingly recognise the advantages that accurate and timely corporate action information can provide in the implementation of their trading strategies and in the provision of investment advice to their clients.
In May 2004, Oxera undertook an analysis of the risks involved in corporate action processing in the global securities markets.1 The aim of that research was to provide one of the first systematic attempts to quantify the major risks involved in processing corporate actions. The results presented in that report highlighted the potentially significant monetary value of the different types of risks associated with corporate action processing. The main focus of the research was on the risks and costs arising within back-office operations.
The aim of this latest research study is to refine the estimates of the potential financial risks associated with corporate actions from the trading, or front office, perspective, including price movements and trading activity over the corporate action processing cycle. Oxera undertook event study analysis, tracking share price effects and trading activity as a result of corporate actions. This report sets out the key results, and discusses the economic rationale behind the observed systematic impact on share prices, share price volatility and trading turnover.
1.1 Corporate actions, share prices and investor behaviour
The initiation of corporate actions may have significant implications for the financial risks of market participants. These effects can be explained by the ‘economic nature’ of corporate actions. In particular, corporate actions often contain new information about the current and expected profitability and growth prospects of firms, or they can result in changes in firms’ operations and financial structure. At the same time, corporate actions can constitute a transfer of wealth between shareholders and bondholders, alter trading costs in secondary markets, and have other direct and indirect effects on a firm’s value.
In this study, the effects of corporate actions associated with different critical dates (announcement, record, ex dates, etc) are analysed using three measures.
– Average share price returns—average returns around various critical dates provide evidence on the extent to which the particular corporate action type is associated with a positive or negative average share price effect around these specific dates in the corporate action processing cycle.
1 Oxera (2004), ‘Corporate Action Processing: What are the Risks?’, May. Report prepared for DTCC, available at www.oxera.com.
Oxera Share prices and trading activity 2
– Share price return volatility—estimation of return volatility around various critical dates provides an indication of the changes in return characteristics and potential risks around specific dates in the corporate action processing cycle.
– Trading velocity—estimation of trading velocity (trading activity or trading volume) around various critical dates provides an indication of the extent to which corporate actions alter investor behaviour, thereby, among other effects, changing the level of liquidity that investors may experience in the secondary market.
These three facets of ‘market conditions’ during the corporate action processing cycle may have significant implications for the profitability of certain trading strategies, and the intermediaries’ supply of trading services to their clients. Therefore, accurate and timely corporate action information that is available in a user-friendly format might give financial intermediaries and investors an informational advantage that would improve their trading strategies and reduce risks associated with corporate actions. The investigation of the precise mechanics of how this information could be used by the intermediaries, however, is beyond the scope of this study.
1.2 Scope of the analysis
The notion that corporate actions might have strong implications for share prices and investor behaviour is, in general, accepted by practitioners. However, this belief is usually founded on observations related to the most visible corporate action types. For example, significant share price volatility following announcements of mergers or takeovers is well documented in both the academic literature and popular press.
The aim of this study is to consider the broader range of corporate action types, and to seek evidence on whether the share price and trading activity effects can be observed in this wider spectrum, and whether these effects go beyond the announcement date.
The study provides assessment of the following corporate action types:
– takeovers; – spin-offs; – forward stock splits; – exchange offers; and – rights issues.
For each corporate action type, the analysis is based on a large sample of US events (the only exception being rights issues, where analysis is based on an international sample comprising events from the USA, UK, France, Germany, Japan, Singapore, and Hong Kong) between 2003 and 2005.
1.3 The key findings
The evidence reported in this study suggests that the corporate actions analysed can often have significant implications for share prices and trading activity in secondary markets.
A number of conclusions emerge from the analysis.
– There is strong evidence that announcement dates of corporate actions often result in significant, and systematic share price movements. The significance of the impact differs depending on the corporate action type. For example, the evidence presented in this study shows that announcements of takeovers, spin-offs and stock splits result in a statistically
Oxera Share prices and trading activity 3
significant positive movement in share prices, while announcements of rights issues result in a statistically significant negative movement in share prices. At the same time, the exchange offer event does not appear to be associated with any systematic movements in share prices.
– The effect of corporate action announcements can also be captured through the impact on volatility of share prices and trading activity in secondary markets. The evidence presented in this report shows that announcement dates are associated with significant increases in both volatility in share prices and volume of trading. Similar to the trends in average returns, the implications of different corporate action types can often vary significantly in magnitude.
– The effect of corporate actions on share prices and trading activity extends beyond the announcement date. In particular, the evidence presented in this study shows that, in some instances, corporate actions appear to result in systematic share price movements, higher-than-average volatility, and increased trading activity around other important dates (eg, record date and ex date) in the corporate action cycle.
– The effect of corporate actions does not appear to be limited to the USA. Analysis of rights issues based on a sample of firms from the USA, Europe (UK, France and Germany) and Asia (Japan, Hong Kong, and Singapore) yields significant share price and trading activity effects during the rights issues processing cycle.
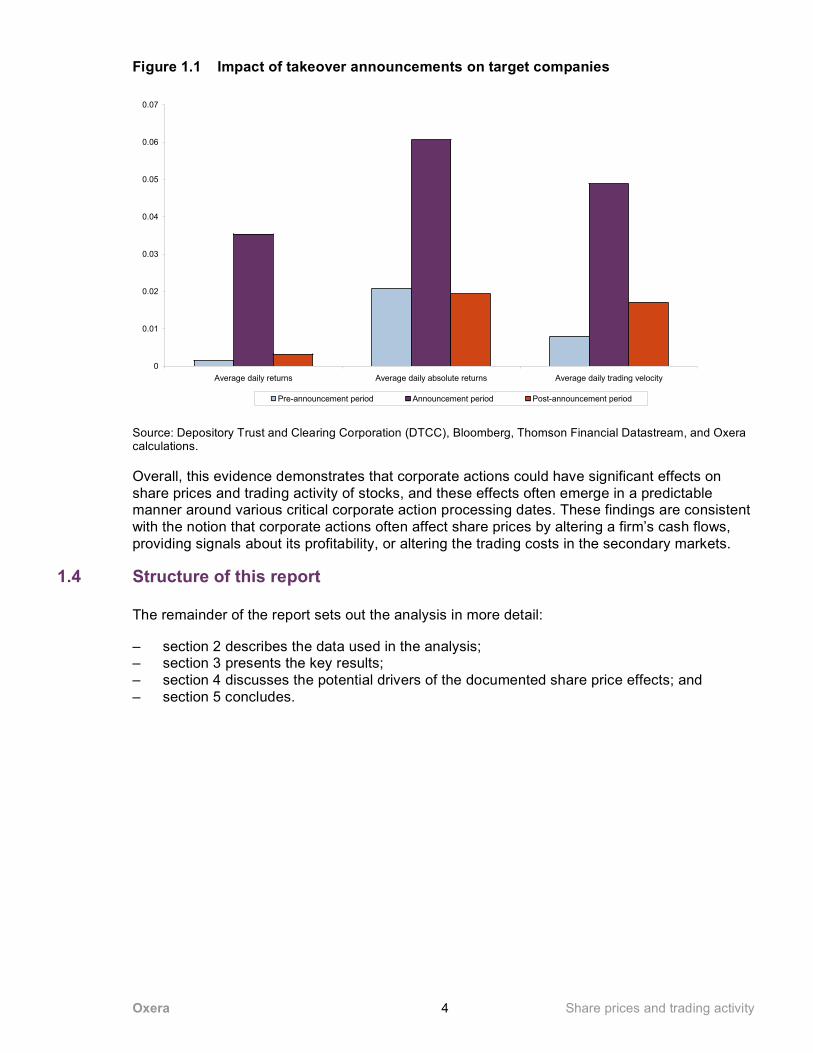
The effect of corporate actions on share prices and trading activity can be illustrated using announcement dates of takeovers as an example. Figure 1.1 shows (i) difference between average daily and historical share price returns; (ii) ratio of average daily absolute share price returns and historical average daily absolute returns; and (iii) ratio of average daily velocity and historical average daily velocity, for three different periods in relation to the corporate action processing cycle. In particular, these results are shown for the pre-announcement period (from 95 days to six days prior the announcement); the announcement period (from one day prior to and one day following the announcement); and the post-announcement period (from one day following the announcement to 11 days following the announcement).
This example illustrates that the announcement event is, on average, associated with a significant increase in share price returns, share price return volatility and trading activity, relative to ‘normal’ conditions observed prior to the announcement. The figure also shows that, in this example, all three measures return to pre-event levels relatively quickly.
Oxera Share prices and trading activity 4
Figure 1.1 Impact of takeover announcements on target companies
0
0.01
0.02
0.03
0.04
0.05
0.06
0.07
Average daily returns Average daily absolute returns Average daily trading velocity
Pre-announcement period Announcement period Post-announcement period
Source: Depository Trust and Clearing Corporation (DTCC), Bloomberg, Thomson Financial Datastream, and Oxera calculations.
Overall, this evidence demonstrates that corporate actions could have significant effects on share prices and trading activity of stocks, and these effects often emerge in a predictable manner around various critical corporate action processing dates. These findings are consistent with the notion that corporate actions often affect share prices by altering a firm’s cash flows, providing signals about its profitability, or altering the trading costs in the secondary markets.
1.4 Structure of this report
The remainder of the report sets out the analysis in more detail:
– section 2 describes the data used in the analysis; – section 3 presents the key results; – section 4 discusses the potential drivers of the documented share price effects; and – section 5 concludes.
Oxera Share prices and trading activity 5
2 Data and methodology
2.1 Sample
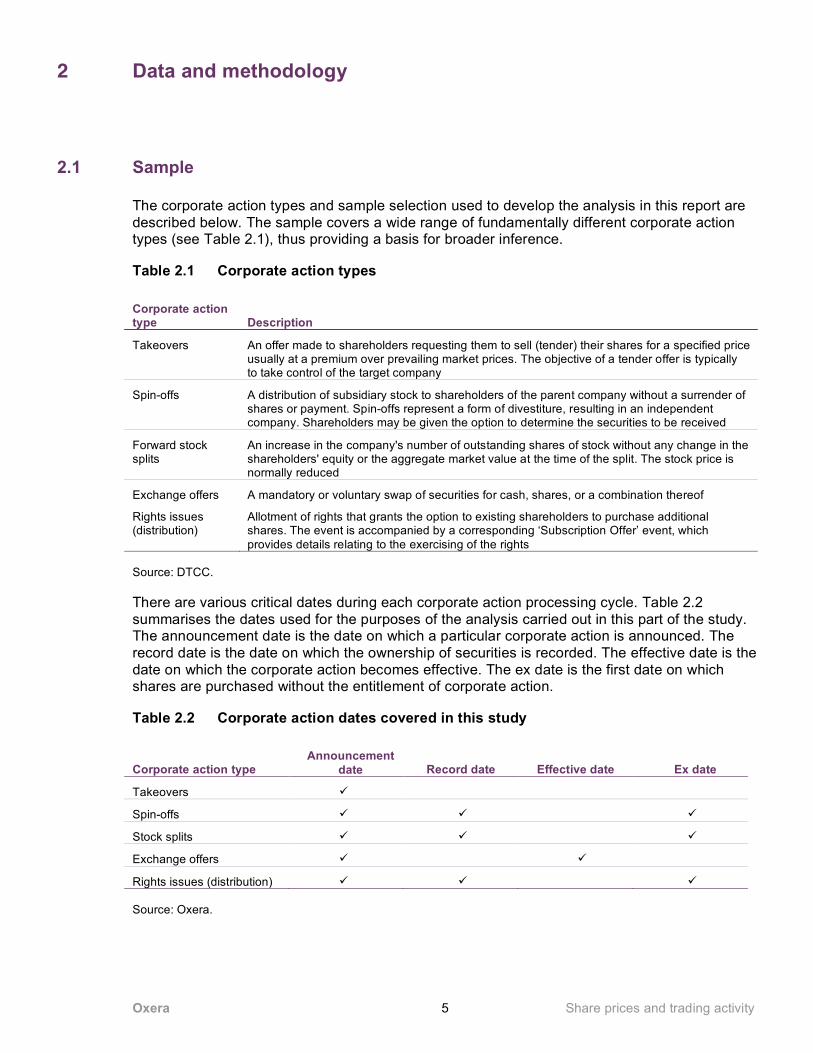
The corporate action types and sample selection used to develop the analysis in this report are described below. The sample covers a wide range of fundamentally different corporate action types (see Table 2.1), thus providing a basis for broader inference.
Table 2.1 Corporate action types
Corporate action type Description
Takeovers An offer made to shareholders requesting them to sell (tender) their shares for a specified price usually at a premium over prevailing market prices. The objective of a tender offer is typically to take control of the target company
Spin-offs A distribution of subsidiary stock to shareholders of the parent company without a surrender of shares or payment. Spin-offs represent a form of divestiture, resulting in an independent company. Shareholders may be given the option to determine the securities to be received
Forward stock splits
An increase in the company's number of outstanding shares of stock without any change in the shareholders' equity or the aggregate market value at the time of the split. The stock price is normally reduced
Exchange offers A mandatory or voluntary swap of securities for cash, shares, or a combination thereof
Rights issues (distribution)
Allotment of rights that grants the option to existing shareholders to purchase additional shares. The event is accompanied by a corresponding ‘Subscription Offer’ event, which provides details relating to the exercising of the rights
Source: DTCC.
There are various critical dates during each corporate action processing cycle. Table 2.2 summarises the dates used for the purposes of the analysis carried out in this part of the study. The announcement date is the date on which a particular corporate action is announced. The record date is the date on which the ownership of securities is recorded. The effective date is the date on which the corporate action becomes effective. The ex date is the first date on which shares are purchased without the entitlement of corporate action.
Table 2.2 Corporate action dates covered in this study
Corporate action type Announcement
date Record date Effective date Ex date
Takeovers
Spin-offs
Stock splits
Exchange offers
Rights issues (distribution) Source: Oxera.
Oxera Share prices and trading activity 6
The main empirical analysis in this study is based on a sample of corporate actions of US non-financial firms between 2003 and 2005. In the case of rights issues, in addition to the US data, the sample includes European (UK, France and Germany) and Asian (Japan, Singapore and Hong Kong) firms. The full sample consists of 105 takeovers, 60 spin-offs, 142 stock splits, 143 exchange offers, and 245 rights issues (30 US, 157 European and 58 Asian). Some statistical tests require data that is available only for a sub-sample of these observations. The number of observations used in each of the tests is stated in the results tables.
This dataset is constructed from a sample of 300–500 most recent US corporate actions for each corporate action type, downloaded from Bloomberg. This data is combined with the data from the Global Corporate Action Validation Service (GCA VS) by matching corporate actions and obtaining the relevant dates (eg, record dates and ex dates). Where data is not matched with the GCA VS, the analysis is based on data from Bloomberg or other secondary sources. Excluded from the sample are all companies for which the announcement date is not available, and all financial companies and observations where the required returns and velocity data is not available.2 The returns and trading activity data is obtained from Thomson Financial Datastream.
2.2 Outline of the analysis
The main aim of this analysis is to establish how share prices and trading activity patterns around various critical corporate action processing dates. In particular, the effects of corporate actions are captured through the following three metrics:
– average share price returns; – share price return volatility; and – trading velocity (trading activity).
The main focus of the analysis is on the observed effects on actual corporate action dates—for example, on the day when corporate action is announced, or when it becomes effective. However, there is evidence that not all of the corporate-action-related information is incorporated into share prices immediately. Therefore, in order to capture the overall effect of corporate actions on share prices and trading activity, the empirical tests in this study are carried out over several event and post-event estimation windows.
The event windows used in this study are defined as follows.
– Event window—defined as the relevant date; the period from one day before to one day after the relevant date; and the period from five days before to five days after the relevant dates.
– Extended event window—to capture potential longer-term implications of these corporate action dates, the assessment is also conducted over the period from one day before to 11 days after the relevant date; and the period from one day before to 31 days after the relevant date.
2 Firms that do not have return data for any of the days in the period between 95 days and six days before the announcement date
are excluded. In addition, individual estimations are carried out using a sample of firms for which returns and velocity are available for every day in a given estimation window. As a result, the estimation sample size between different event and post-event estimation windows can vary (sample sizes are shown in the tables).
Oxera Share prices and trading activity 7
– Post-event window—the extended event window estimations are complemented by post-event window estimations, which capture the implications of the event net of the immediate impact around the relevant dates. The post-event window is defined as: the period from one day after to 11 days after the relevant date; and the period from one day after to 31 days after the relevant event days.
Therefore, for each of the corporate action dates analysed in this study (see Table 2.2), the estimations of average share price returns, share price return volatility and trading velocity are carried out for a variety of estimation windows. The overall effect of a given corporate action date can be inferred by combining evidence obtained for all three types of event window.
Using this approach can, however, lead to results that are distorted by the proximity of other corporate action dates, especially for extended event and post-event windows. In particular, close proximity of record dates and ex dates (and in some instances announcement dates), is likely to distort evidence when using longer event windows. As such, the main emphasis should be on the estimations carried out over shorter event windows.
2.3 Definitions of variables
The empirical analysis presented in this report focuses on share price behaviour and trading velocity around critical corporate action dates. This section sets out definitions of the variables used in this study, and outlines sources of market data.
The main variables used in empirical analysis are defined as follows.
– Share price returns—defined as total shareholder returns, or a sum of capital gains and dividends that investors receive over a given period of time.3 Notably, capital gains used in this study do not capture any changes in nominal value of an individual share that arise due to various corporate actions. For example, a reduction in nominal value due to forward stock split or discounted rights issues would not be recorded as a negative share price movement.
– Share price return volatility—defined as absolute share price returns. This measure captures the average daily absolute share price movement over a given period of time.
– Trading velocity or trading activity—defined as a ratio of number of shares traded in the secondary market in a given period of time to number of shares outstanding.4 This measure effectively captures trading volume for a given security, normalised over the total value of these securities in issue.
Daily share price returns, daily share price return volatility, and daily trading velocity for a sample of firms are estimated as equally weighted average of daily returns, volatilities and velocities of these firms. The average daily share price returns, daily share price return volatility, and daily trading velocity for different estimation windows are estimated by averaging daily share price returns, absolute returns and trading velocity over a given estimating window. Furthermore, to isolate the impact of a particular corporate action date, this evidence is also presented in terms of relative values when measured against pre-event date levels. In particular: 3 Total shareholder returns are estimated using Thomson Financial Datastream Total Return Index data type. 4 Total number of shares traded and total number of shares outstanding are captured by Thomson Financial Datastream Turnover
and Number of Shares Outstanding data types respectively.
Oxera Share prices and trading activity 8
– In the case of share price returns, the returns measure is defined as a difference between average daily share price returns over a given event window and average daily share price returns measured over a 90-day period between 95 days and six days prior the announcement of corporate action.
– In the case of share price return volatility, the ratio of absolute returns is defined as a ratio of average daily absolute share price returns over a given event window and average daily absolute share price returns measured over a 90-day period between 95 days and six days prior the announcement of corporate action.
– In the case of trading velocity, the ratio of trading velocity is defined as a ratio of average daily trading velocity over a given event window and average daily trading velocity measured over a 90-day period between 96 days and six days prior the announcement of corporate action.
The statistical significance of these effects is estimated using standard statistical techniques. In particular, the study estimates cumulative abnormal returns, abnormal variance, and abnormal trading activity measures for each event window analysed. Using these measures, statistical significance is analysed by considering whether these effects are statistically different from zero or 1 (ie, having no effect on the measures), depending on the particular comparison, at the 10% level. This paper does not report the details of these tests, but only on whether, in each particular case, the results are statistically significant. The full methodology used in assessing statistical significance is set out in Appendix 1.
Oxera Share prices and trading activity 9
3 What is the evidence?
This section sets out the evidence on average share price returns, absolute share price returns and trading velocity for takeovers, spin-offs, stock splits, exchange offers and rights issues. The evidence is based on comparisons of the event, extended event and post-event estimates, with ‘normal’ estimates calculated over the pre-announcement period.
3.1 Takeovers
The analysis of returns and trading activity implications of targets for takeovers focuses on the effects observed around the announcement dates. This assessment is based on a sample of 105 US targets announced between 2004 and 2005.
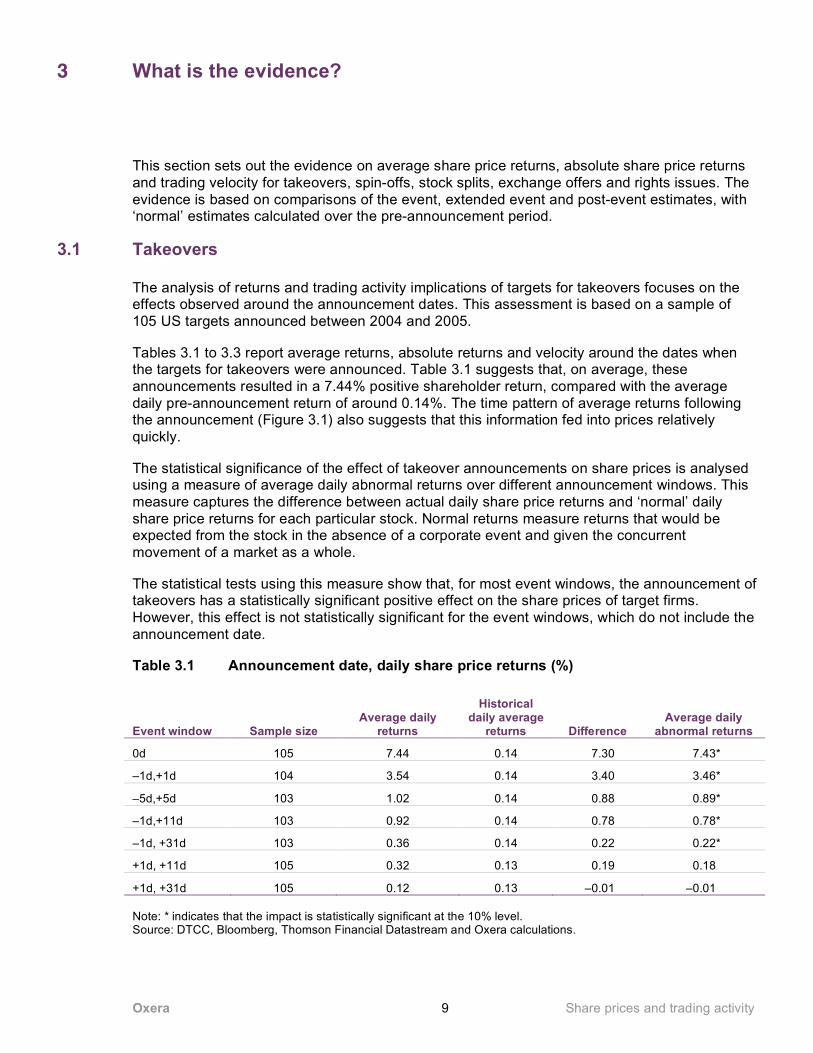
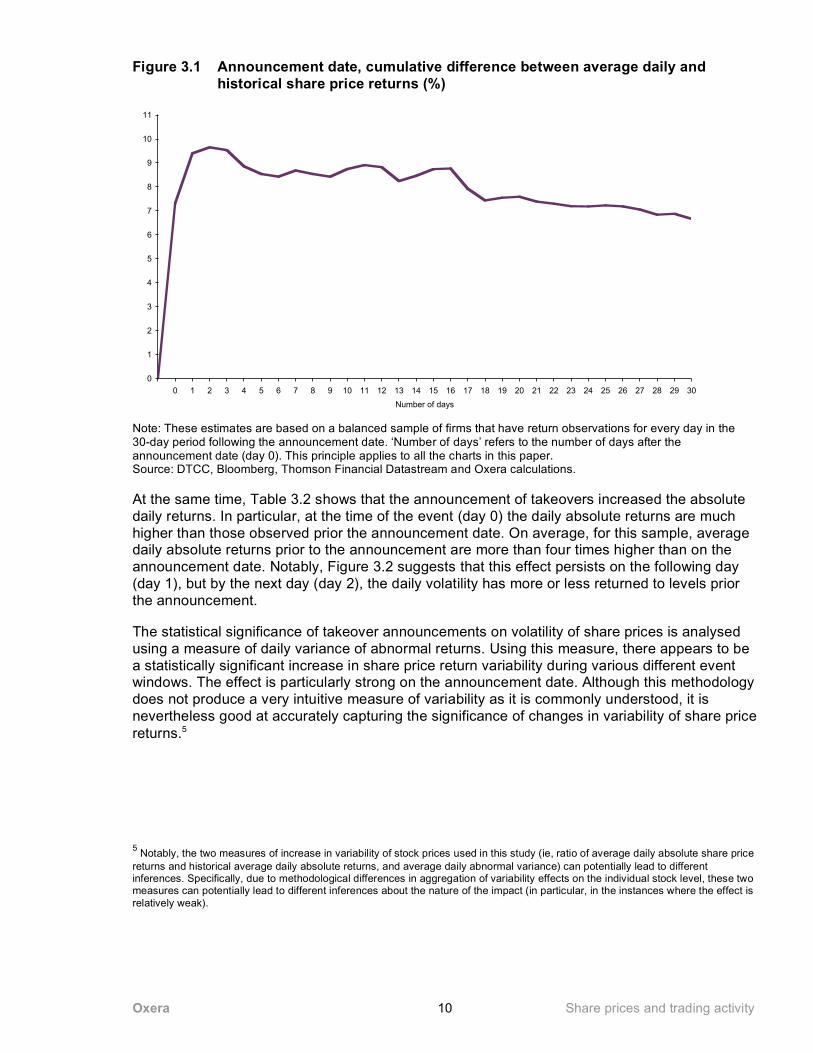
Tables 3.1 to 3.3 report average returns, absolute returns and velocity around the dates when the targets for takeovers were announced. Table 3.1 suggests that, on average, these announcements resulted in a 7.44% positive shareholder return, compared with the average daily pre-announcement return of around 0.14%. The time pattern of average returns following the announcement (Figure 3.1) also suggests that this information fed into prices relatively quickly.
The statistical significance of the effect of takeover announcements on share prices is analysed using a measure of average daily abnormal returns over different announcement windows. This measure captures the difference between actual daily share price returns and ‘normal’ daily share price returns for each particular stock. Normal returns measure returns that would be expected from the stock in the absence of a corporate event and given the concurrent movement of a market as a whole.
The statistical tests using this measure show that, for most event windows, the announcement of takeovers has a statistically significant positive effect on the share prices of target firms. However, this effect is not statistically significant for the event windows, which do not include the announcement date.
Table 3.1 Announcement date, daily share price returns (%)
Event window Sample size Average daily
returns
Historical daily average
returns Difference Average daily
abnormal returns
0d 105 7.44 0.14 7.30 7.43*
–1d,+1d 104 3.54 0.14 3.40 3.46*
–5d,+5d 103 1.02 0.14 0.88 0.89*
–1d,+11d 103 0.92 0.14 0.78 0.78*
–1d, +31d 103 0.36 0.14 0.22 0.22*
+1d, +11d 105 0.32 0.13 0.19 0.18
+1d, +31d 105 0.12 0.13 –0.01 –0.01 Note: * indicates that the impact is statistically significant at the 10% level. Source: DTCC, Bloomberg, Thomson Financial Datastream and Oxera calculations.
Oxera Share prices and trading activity 10
Figure 3.1 Announcement date, cumulative difference between average daily and historical share price returns (%)
0
1
2
3
4
5
6
7
8
9
10
11
0 1 2 3 4 5 6 7 8 9 10 11 12 13 14 15 16 17 18 19 20 21 22 23 24 25 26 27 28 29 30
Number of days
Note: These estimates are based on a balanced sample of firms that have return observations for every day in the 30-day period following the announcement date. ‘Number of days’ refers to the number of days after the announcement date (day 0). This principle applies to all the charts in this paper. Source: DTCC, Bloomberg, Thomson Financial Datastream and Oxera calculations.
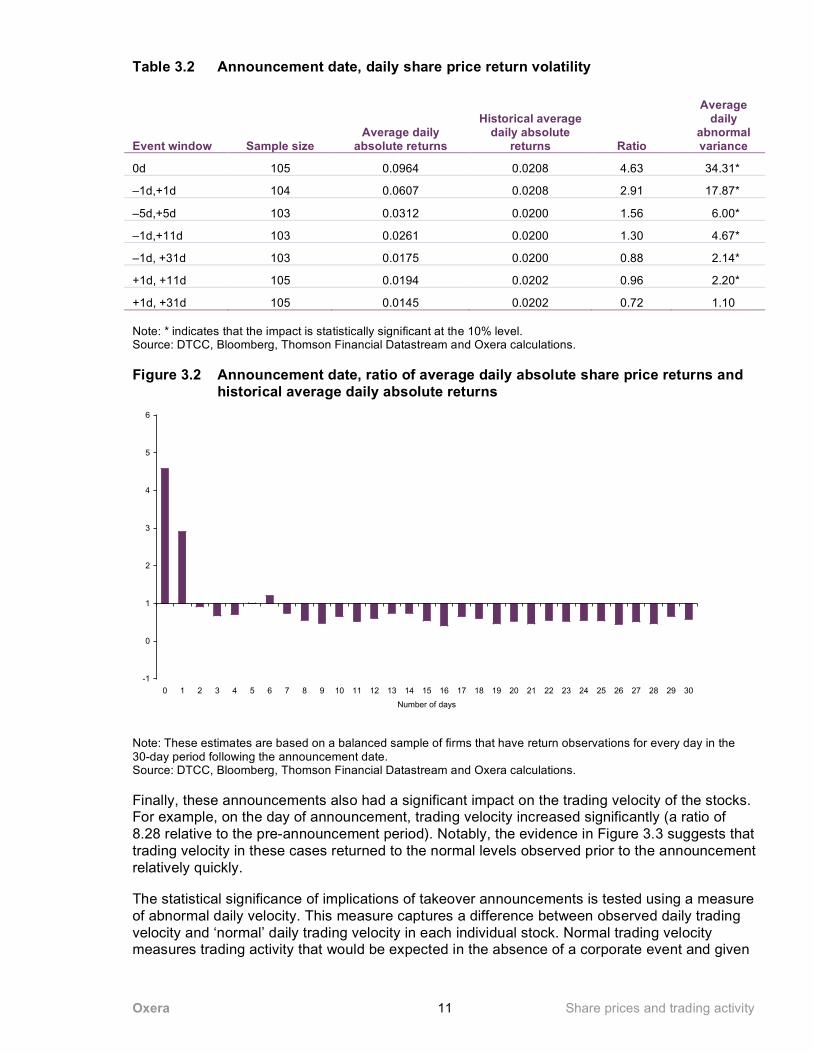
At the same time, Table 3.2 shows that the announcement of takeovers increased the absolute daily returns. In particular, at the time of the event (day 0) the daily absolute returns are much higher than those observed prior the announcement date. On average, for this sample, average daily absolute returns prior to the announcement are more than four times higher than on the announcement date. Notably, Figure 3.2 suggests that this effect persists on the following day (day 1), but by the next day (day 2), the daily volatility has more or less returned to levels prior the announcement.
The statistical significance of takeover announcements on volatility of share prices is analysed using a measure of daily variance of abnormal returns. Using this measure, there appears to be a statistically significant increase in share price return variability during various different event windows. The effect is particularly strong on the announcement date. Although this methodology does not produce a very intuitive measure of variability as it is commonly understood, it is nevertheless good at accurately capturing the significance of changes in variability of share price returns.5
5 Notably, the two measures of increase in variability of stock prices used in this study (ie, ratio of average daily absolute share price
returns and historical average daily absolute returns, and average daily abnormal variance) can potentially lead to different inferences. Specifically, due to methodological differences in aggregation of variability effects on the individual stock level, these two measures can potentially lead to different inferences about the nature of the impact (in particular, in the instances where the effect is relatively weak).
Oxera Share prices and trading activity 11
Table 3.2 Announcement date, daily share price return volatility
Event window Sample size Average daily
absolute returns
Historical average daily absolute
returns Ratio
Average daily
abnormal variance
0d 105 0.0964 0.0208 4.63 34.31*
–1d,+1d 104 0.0607 0.0208 2.91 17.87*
–5d,+5d 103 0.0312 0.0200 1.56 6.00*
–1d,+11d 103 0.0261 0.0200 1.30 4.67*
–1d, +31d 103 0.0175 0.0200 0.88 2.14*
+1d, +11d 105 0.0194 0.0202 0.96 2.20*
+1d, +31d 105 0.0145 0.0202 0.72 1.10 Note: * indicates that the impact is statistically significant at the 10% level. Source: DTCC, Bloomberg, Thomson Financial Datastream and Oxera calculations.
Figure 3.2 Announcement date, ratio of average daily absolute share price returns and historical average daily absolute returns
-1
0
1
2
3
4
5
6
0 1 2 3 4 5 6 7 8 9 10 11 12 13 14 15 16 17 18 19 20 21 22 23 24 25 26 27 28 29 30
Number of days
Note: These estimates are based on a balanced sample of firms that have return observations for every day in the 30-day period following the announcement date. Source: DTCC, Bloomberg, Thomson Financial Datastream and Oxera calculations.
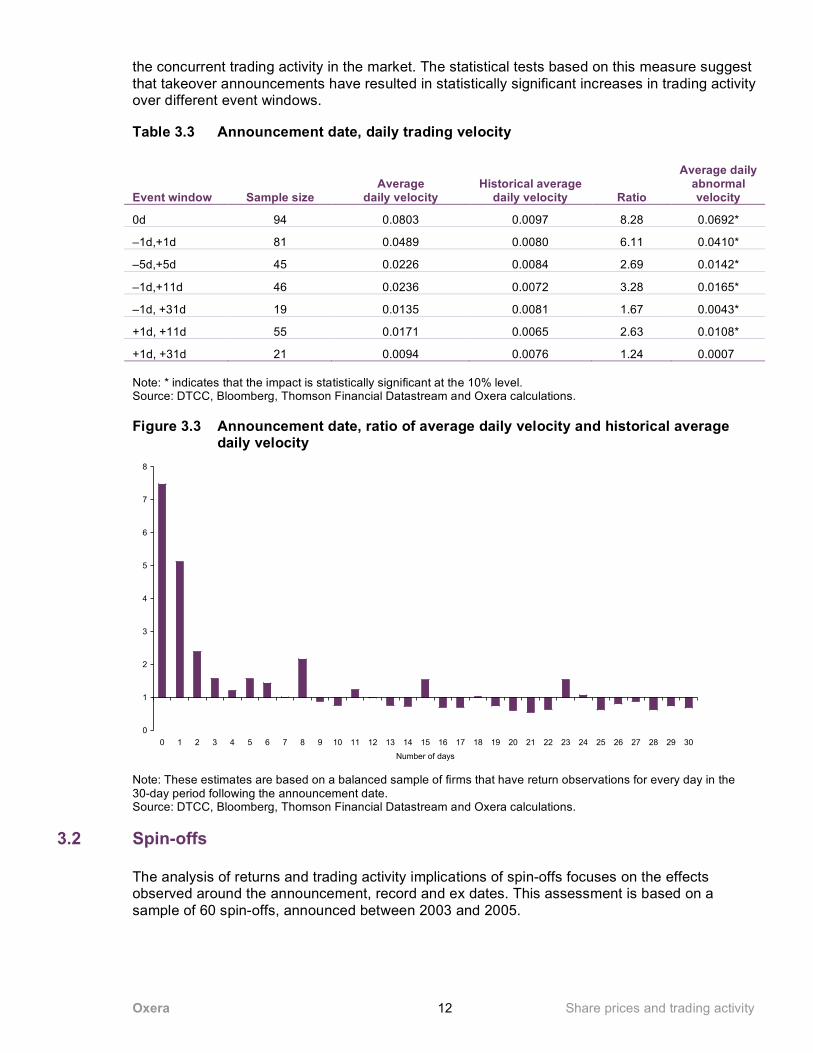
Finally, these announcements also had a significant impact on the trading velocity of the stocks. For example, on the day of announcement, trading velocity increased significantly (a ratio of 8.28 relative to the pre-announcement period). Notably, the evidence in Figure 3.3 suggests that trading velocity in these cases returned to the normal levels observed prior to the announcement relatively quickly.
The statistical significance of implications of takeover announcements is tested using a measure of abnormal daily velocity. This measure captures a difference between observed daily trading velocity and ‘normal’ daily trading velocity in each individual stock. Normal trading velocity measures trading activity that would be expected in the absence of a corporate event and given
Oxera Share prices and trading activity 12
the concurrent trading activity in the market. The statistical tests based on this measure suggest that takeover announcements have resulted in statistically significant increases in trading activity over different event windows.
Table 3.3 Announcement date, daily trading velocity
Event window Sample size Average
daily velocity Historical average
daily velocity Ratio
Average daily abnormal velocity
0d 94 0.0803 0.0097 8.28 0.0692*
–1d,+1d 81 0.0489 0.0080 6.11 0.0410*
–5d,+5d 45 0.0226 0.0084 2.69 0.0142*
–1d,+11d 46 0.0236 0.0072 3.28 0.0165*
–1d, +31d 19 0.0135 0.0081 1.67 0.0043*
+1d, +11d 55 0.0171 0.0065 2.63 0.0108*
+1d, +31d 21 0.0094 0.0076 1.24 0.0007 Note: * indicates that the impact is statistically significant at the 10% level. Source: DTCC, Bloomberg, Thomson Financial Datastream and Oxera calculations.
Figure 3.3 Announcement date, ratio of average daily velocity and historical average daily velocity
0
1
2
3
4
5
6
7
8
0 1 2 3 4 5 6 7 8 9 10 11 12 13 14 15 16 17 18 19 20 21 22 23 24 25 26 27 28 29 30
Number of days
Note: These estimates are based on a balanced sample of firms that have return observations for every day in the 30-day period following the announcement date. Source: DTCC, Bloomberg, Thomson Financial Datastream and Oxera calculations.
3.2 Spin-offs
The analysis of returns and trading activity implications of spin-offs focuses on the effects observed around the announcement, record and ex dates. This assessment is based on a sample of 60 spin-offs, announced between 2003 and 2005.
Oxera Share prices and trading activity 13
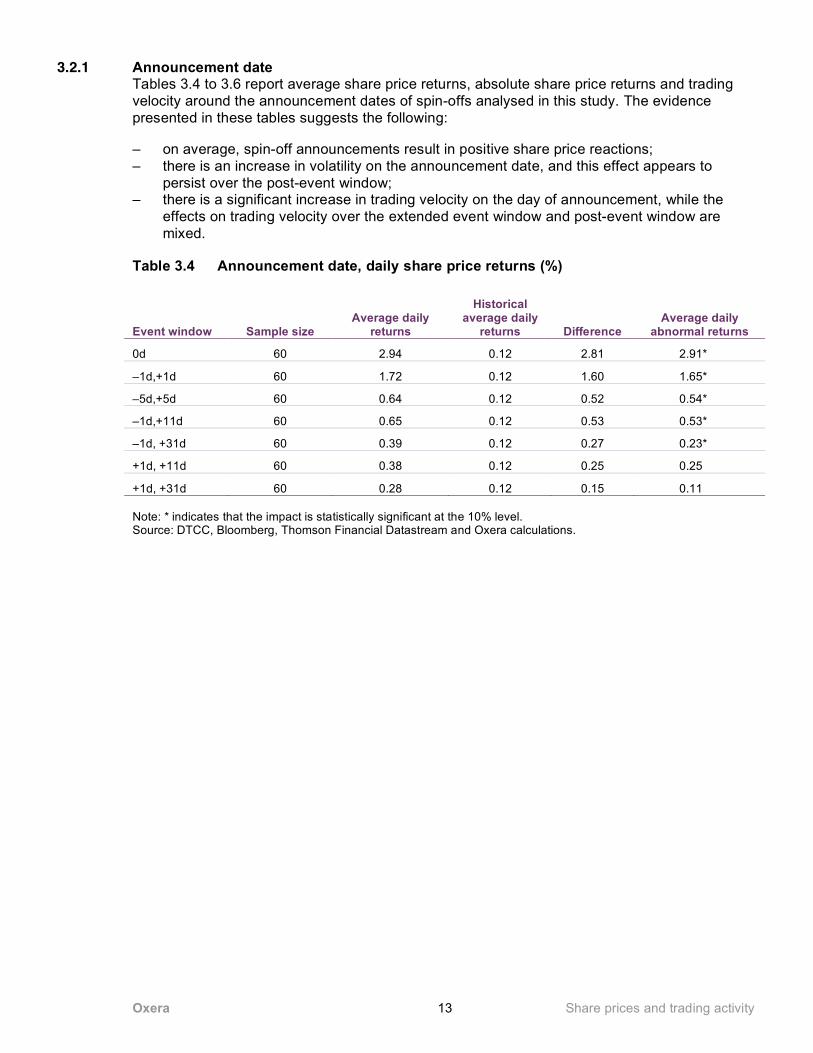
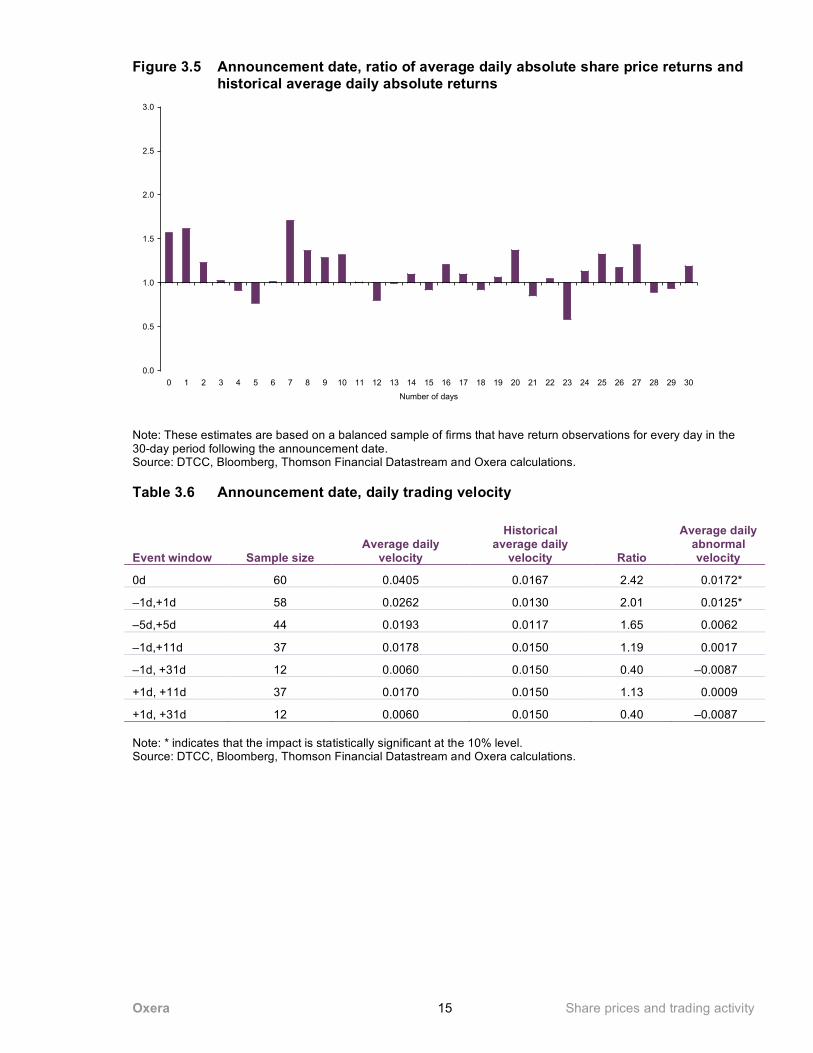
3.2.1 Announcement date Tables 3.4 to 3.6 report average share price returns, absolute share price returns and trading velocity around the announcement dates of spin-offs analysed in this study. The evidence presented in these tables suggests the following:
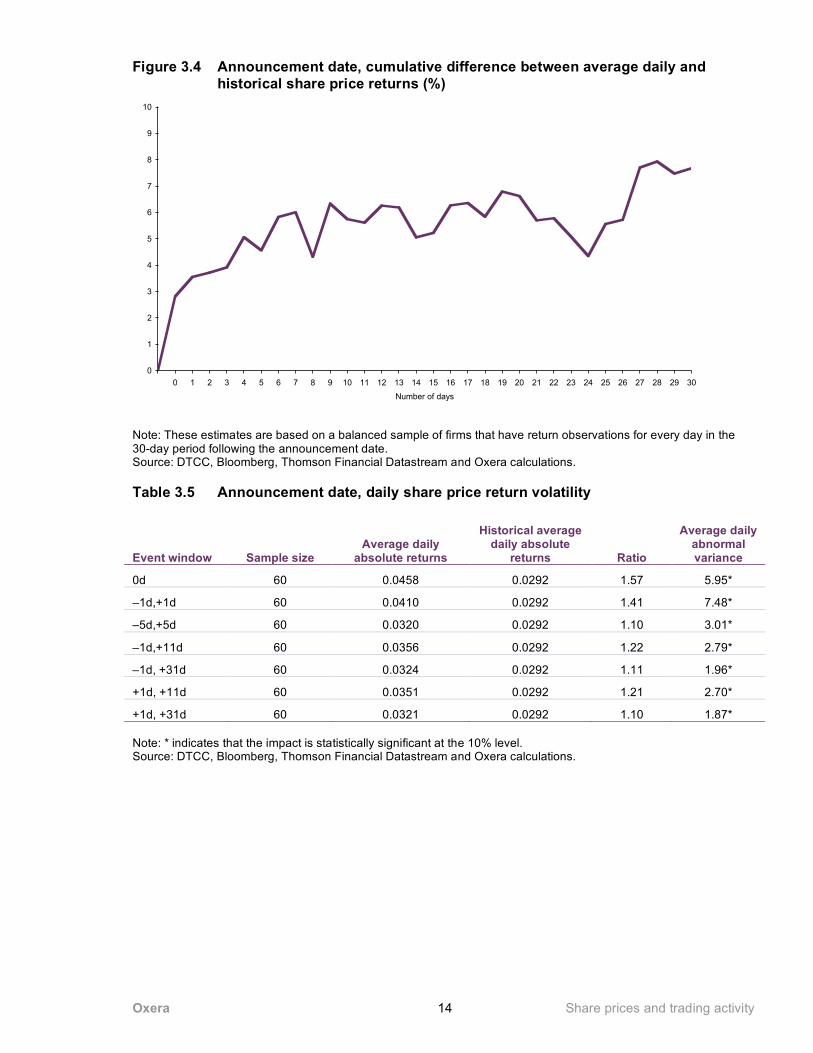
– on average, spin-off announcements result in positive share price reactions; – there is an increase in volatility on the announcement date, and this effect appears to
persist over the post-event window; – there is a significant increase in trading velocity on the day of announcement, while the
effects on trading velocity over the extended event window and post-event window are mixed.
Table 3.4 Announcement date, daily share price returns (%)
Event window Sample size Average daily
returns
Historical average daily
returns Difference Average daily
abnormal returns
0d 60 2.94 0.12 2.81 2.91*
–1d,+1d 60 1.72 0.12 1.60 1.65*
–5d,+5d 60 0.64 0.12 0.52 0.54*
–1d,+11d 60 0.65 0.12 0.53 0.53*
–1d, +31d 60 0.39 0.12 0.27 0.23*
+1d, +11d 60 0.38 0.12 0.25 0.25
+1d, +31d 60 0.28 0.12 0.15 0.11 Note: * indicates that the impact is statistically significant at the 10% level. Source: DTCC, Bloomberg, Thomson Financial Datastream and Oxera calculations.
Oxera Share prices and trading activity 14
Figure 3.4 Announcement date, cumulative difference between average daily and historical share price returns (%)
0
1
2
3
4
5
6
7
8
9
10
0 1 2 3 4 5 6 7 8 9 10 11 12 13 14 15 16 17 18 19 20 21 22 23 24 25 26 27 28 29 30
Number of days
Note: These estimates are based on a balanced sample of firms that have return observations for every day in the 30-day period following the announcement date. Source: DTCC, Bloomberg, Thomson Financial Datastream and Oxera calculations.
Table 3.5 Announcement date, daily share price return volatility
Event window Sample size Average daily
absolute returns
Historical average daily absolute
returns Ratio
Average daily abnormal variance
0d 60 0.0458 0.0292 1.57 5.95*
–1d,+1d 60 0.0410 0.0292 1.41 7.48*
–5d,+5d 60 0.0320 0.0292 1.10 3.01*
–1d,+11d 60 0.0356 0.0292 1.22 2.79*
–1d, +31d 60 0.0324 0.0292 1.11 1.96*
+1d, +11d 60 0.0351 0.0292 1.21 2.70*
+1d, +31d 60 0.0321 0.0292 1.10 1.87* Note: * indicates that the impact is statistically significant at the 10% level. Source: DTCC, Bloomberg, Thomson Financial Datastream and Oxera calculations.
Oxera Share prices and trading activity 15
Figure 3.5 Announcement date, ratio of average daily absolute share price returns and historical average daily absolute returns
0.0
0.5
1.0
1.5
2.0
2.5
3.0
0 1 2 3 4 5 6 7 8 9 10 11 12 13 14 15 16 17 18 19 20 21 22 23 24 25 26 27 28 29 30
Number of days
Note: These estimates are based on a balanced sample of firms that have return observations for every day in the 30-day period following the announcement date. Source: DTCC, Bloomberg, Thomson Financial Datastream and Oxera calculations.
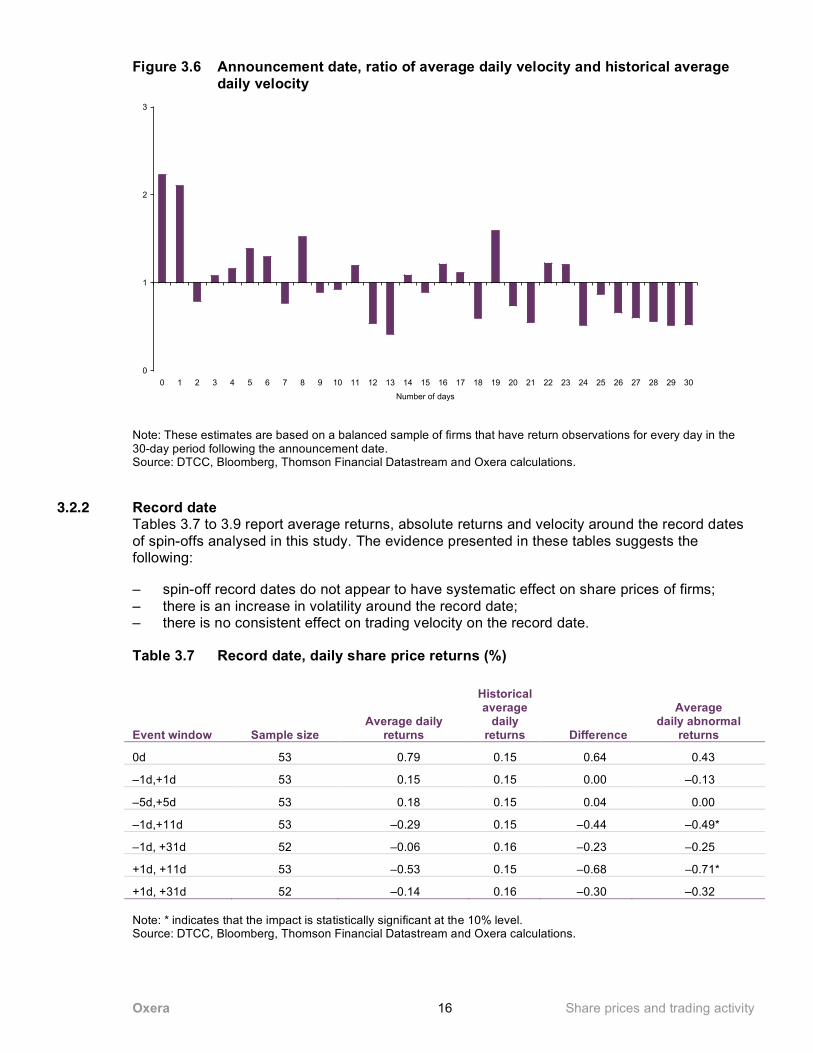
Table 3.6 Announcement date, daily trading velocity
Event window Sample size Average daily
velocity
Historical average daily
velocity Ratio
Average daily abnormal velocity
0d 60 0.0405 0.0167 2.42 0.0172*
–1d,+1d 58 0.0262 0.0130 2.01 0.0125*
–5d,+5d 44 0.0193 0.0117 1.65 0.0062
–1d,+11d 37 0.0178 0.0150 1.19 0.0017
–1d, +31d 12 0.0060 0.0150 0.40 –0.0087
+1d, +11d 37 0.0170 0.0150 1.13 0.0009
+1d, +31d 12 0.0060 0.0150 0.40 –0.0087 Note: * indicates that the impact is statistically significant at the 10% level. Source: DTCC, Bloomberg, Thomson Financial Datastream and Oxera calculations.
Oxera Share prices and trading activity 16
Figure 3.6 Announcement date, ratio of average daily velocity and historical average daily velocity
0
1
2
3
0 1 2 3 4 5 6 7 8 9 10 11 12 13 14 15 16 17 18 19 20 21 22 23 24 25 26 27 28 29 30
Number of days
Note: These estimates are based on a balanced sample of firms that have return observations for every day in the 30-day period following the announcement date. Source: DTCC, Bloomberg, Thomson Financial Datastream and Oxera calculations.
3.2.2 Record date Tables 3.7 to 3.9 report average returns, absolute returns and velocity around the record dates of spin-offs analysed in this study. The evidence presented in these tables suggests the following:
– spin-off record dates do not appear to have systematic effect on share prices of firms; – there is an increase in volatility around the record date; – there is no consistent effect on trading velocity on the record date.
Table 3.7 Record date, daily share price returns (%)
Event window Sample size Average daily
returns
Historical average
daily returns Difference
Average daily abnormal
returns
0d 53 0.79 0.15 0.64 0.43
–1d,+1d 53 0.15 0.15 0.00 –0.13
–5d,+5d 53 0.18 0.15 0.04 0.00
–1d,+11d 53 –0.29 0.15 –0.44 –0.49*
–1d, +31d 52 –0.06 0.16 –0.23 –0.25
+1d, +11d 53 –0.53 0.15 –0.68 –0.71*
+1d, +31d 52 –0.14 0.16 –0.30 –0.32 Note: * indicates that the impact is statistically significant at the 10% level. Source: DTCC, Bloomberg, Thomson Financial Datastream and Oxera calculations.
Oxera Share prices and trading activity 17
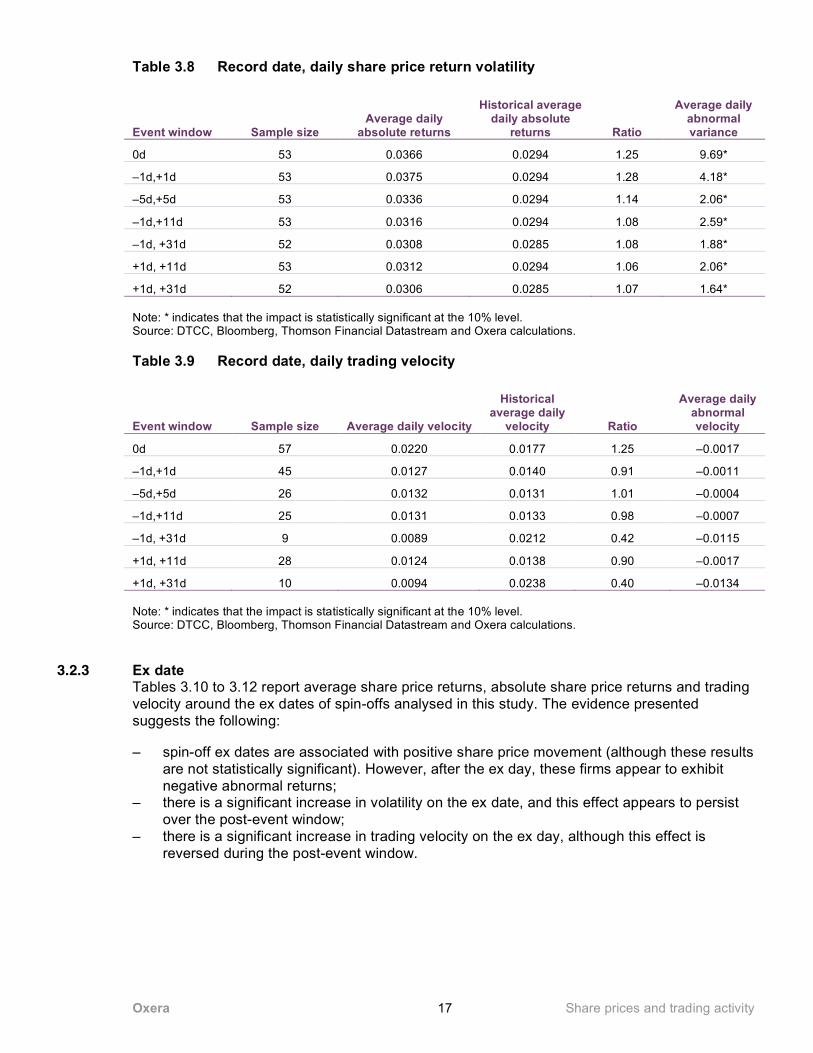
Table 3.8 Record date, daily share price return volatility
Event window Sample size Average daily
absolute returns
Historical average daily absolute
returns Ratio
Average daily abnormal variance
0d 53 0.0366 0.0294 1.25 9.69*
–1d,+1d 53 0.0375 0.0294 1.28 4.18*
–5d,+5d 53 0.0336 0.0294 1.14 2.06*
–1d,+11d 53 0.0316 0.0294 1.08 2.59*
–1d, +31d 52 0.0308 0.0285 1.08 1.88*
+1d, +11d 53 0.0312 0.0294 1.06 2.06*
+1d, +31d 52 0.0306 0.0285 1.07 1.64* Note: * indicates that the impact is statistically significant at the 10% level. Source: DTCC, Bloomberg, Thomson Financial Datastream and Oxera calculations.
Table 3.9 Record date, daily trading velocity
Event window Sample size Average daily velocity
Historical average daily
velocity Ratio
Average daily abnormal velocity
0d 57 0.0220 0.0177 1.25 –0.0017
–1d,+1d 45 0.0127 0.0140 0.91 –0.0011
–5d,+5d 26 0.0132 0.0131 1.01 –0.0004
–1d,+11d 25 0.0131 0.0133 0.98 –0.0007
–1d, +31d 9 0.0089 0.0212 0.42 –0.0115
+1d, +11d 28 0.0124 0.0138 0.90 –0.0017
+1d, +31d 10 0.0094 0.0238 0.40 –0.0134 Note: * indicates that the impact is statistically significant at the 10% level. Source: DTCC, Bloomberg, Thomson Financial Datastream and Oxera calculations.
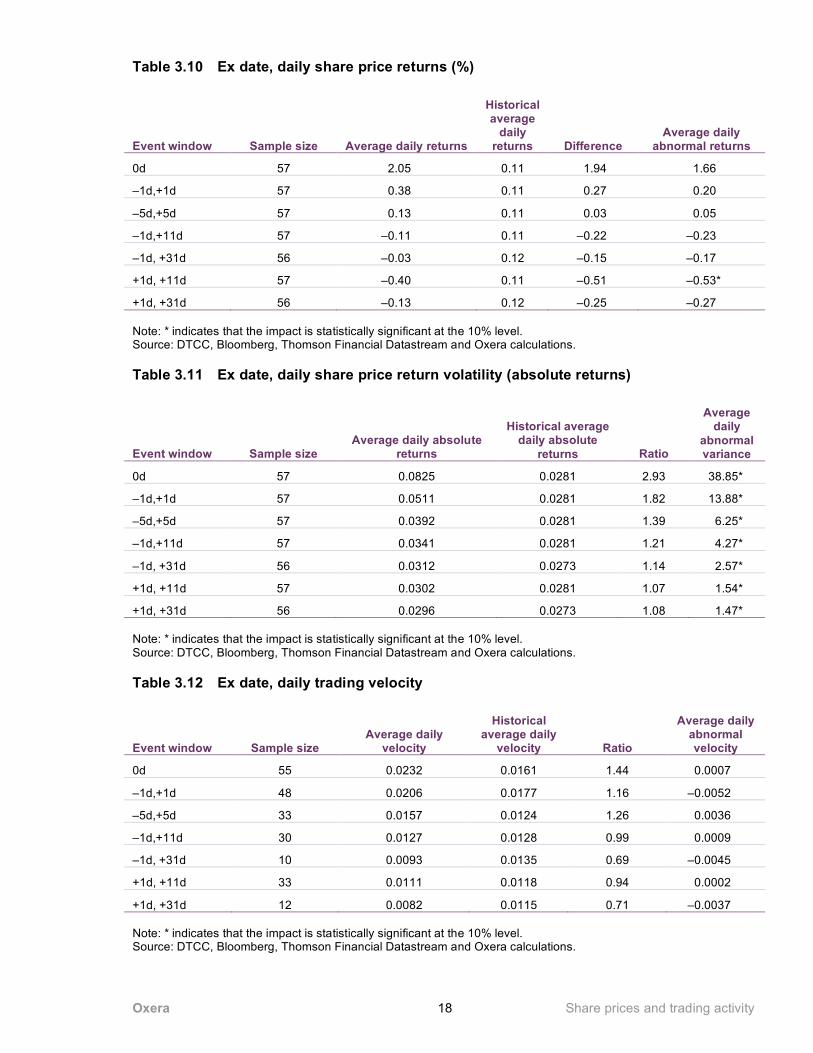
3.2.3 Ex date Tables 3.10 to 3.12 report average share price returns, absolute share price returns and trading velocity around the ex dates of spin-offs analysed in this study. The evidence presented suggests the following:
– spin-off ex dates are associated with positive share price movement (although these results are not statistically significant). However, after the ex day, these firms appear to exhibit negative abnormal returns;
– there is a significant increase in volatility on the ex date, and this effect appears to persist over the post-event window;
– there is a significant increase in trading velocity on the ex day, although this effect is reversed during the post-event window.
Oxera Share prices and trading activity 18
Table 3.10 Ex date, daily share price returns (%)
Event window Sample size Average daily returns
Historical average
daily returns Difference
Average daily abnormal returns
0d 57 2.05 0.11 1.94 1.66
–1d,+1d 57 0.38 0.11 0.27 0.20
–5d,+5d 57 0.13 0.11 0.03 0.05
–1d,+11d 57 –0.11 0.11 –0.22 –0.23
–1d, +31d 56 –0.03 0.12 –0.15 –0.17
+1d, +11d 57 –0.40 0.11 –0.51 –0.53*
+1d, +31d 56 –0.13 0.12 –0.25 –0.27 Note: * indicates that the impact is statistically significant at the 10% level. Source: DTCC, Bloomberg, Thomson Financial Datastream and Oxera calculations.
Table 3.11 Ex date, daily share price return volatility (absolute returns)
Event window Sample size Average daily absolute
returns
Historical average daily absolute
returns Ratio
Average daily
abnormal variance
0d 57 0.0825 0.0281 2.93 38.85*
–1d,+1d 57 0.0511 0.0281 1.82 13.88*
–5d,+5d 57 0.0392 0.0281 1.39 6.25*
–1d,+11d 57 0.0341 0.0281 1.21 4.27*
–1d, +31d 56 0.0312 0.0273 1.14 2.57*
+1d, +11d 57 0.0302 0.0281 1.07 1.54*
+1d, +31d 56 0.0296 0.0273 1.08 1.47* Note: * indicates that the impact is statistically significant at the 10% level. Source: DTCC, Bloomberg, Thomson Financial Datastream and Oxera calculations.
Table 3.12 Ex date, daily trading velocity
Event window Sample size Average daily
velocity
Historical average daily
velocity Ratio
Average daily abnormal velocity
0d 55 0.0232 0.0161 1.44 0.0007
–1d,+1d 48 0.0206 0.0177 1.16 –0.0052
–5d,+5d 33 0.0157 0.0124 1.26 0.0036
–1d,+11d 30 0.0127 0.0128 0.99 0.0009
–1d, +31d 10 0.0093 0.0135 0.69 –0.0045
+1d, +11d 33 0.0111 0.0118 0.94 0.0002
+1d, +31d 12 0.0082 0.0115 0.71 –0.0037 Note: * indicates that the impact is statistically significant at the 10% level. Source: DTCC, Bloomberg, Thomson Financial Datastream and Oxera calculations.
Oxera Share prices and trading activity 19
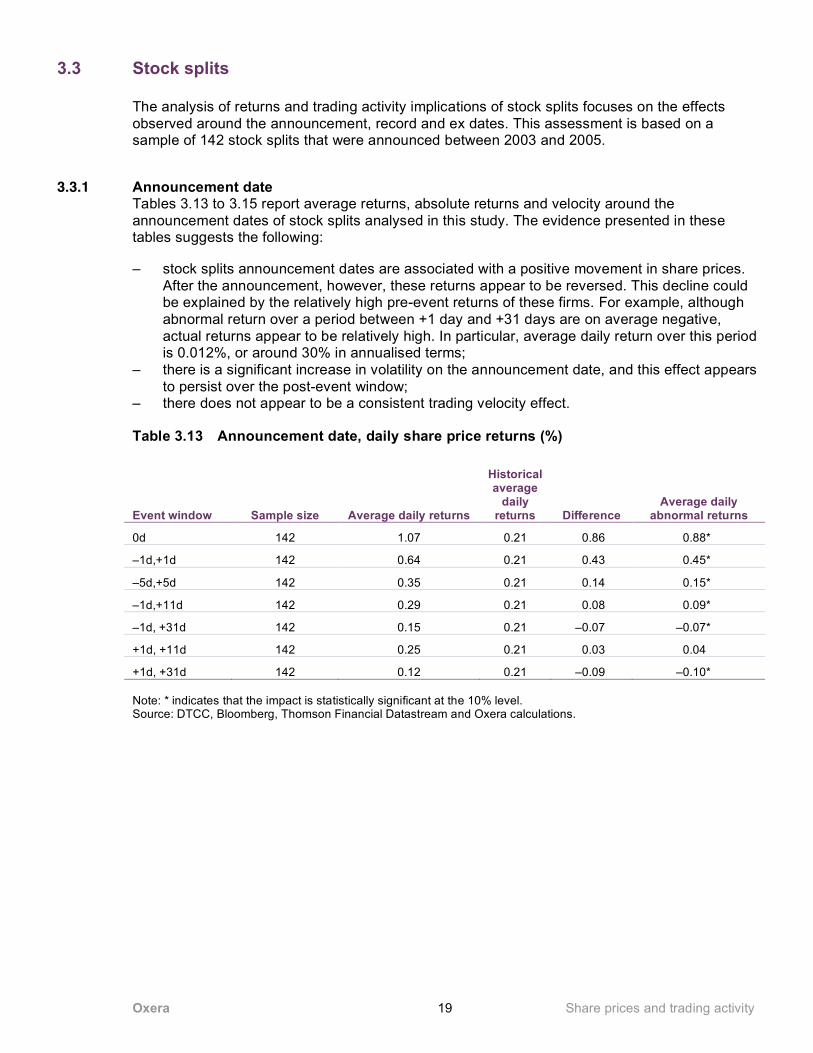
3.3 Stock splits
The analysis of returns and trading activity implications of stock splits focuses on the effects observed around the announcement, record and ex dates. This assessment is based on a sample of 142 stock splits that were announced between 2003 and 2005.
3.3.1 Announcement date Tables 3.13 to 3.15 report average returns, absolute returns and velocity around the announcement dates of stock splits analysed in this study. The evidence presented in these tables suggests the following:
– stock splits announcement dates are associated with a positive movement in share prices. After the announcement, however, these returns appear to be reversed. This decline could be explained by the relatively high pre-event returns of these firms. For example, although abnormal return over a period between +1 day and +31 days are on average negative, actual returns appear to be relatively high. In particular, average daily return over this period is 0.012%, or around 30% in annualised terms;
– there is a significant increase in volatility on the announcement date, and this effect appears to persist over the post-event window;
– there does not appear to be a consistent trading velocity effect.
Table 3.13 Announcement date, daily share price returns (%)
Event window Sample size Average daily returns
Historical average
daily returns Difference
Average daily abnormal returns
0d 142 1.07 0.21 0.86 0.88*
–1d,+1d 142 0.64 0.21 0.43 0.45*
–5d,+5d 142 0.35 0.21 0.14 0.15*
–1d,+11d 142 0.29 0.21 0.08 0.09*
–1d, +31d 142 0.15 0.21 –0.07 –0.07*
+1d, +11d 142 0.25 0.21 0.03 0.04
+1d, +31d 142 0.12 0.21 –0.09 –0.10* Note: * indicates that the impact is statistically significant at the 10% level. Source: DTCC, Bloomberg, Thomson Financial Datastream and Oxera calculations.
Oxera Share prices and trading activity 20
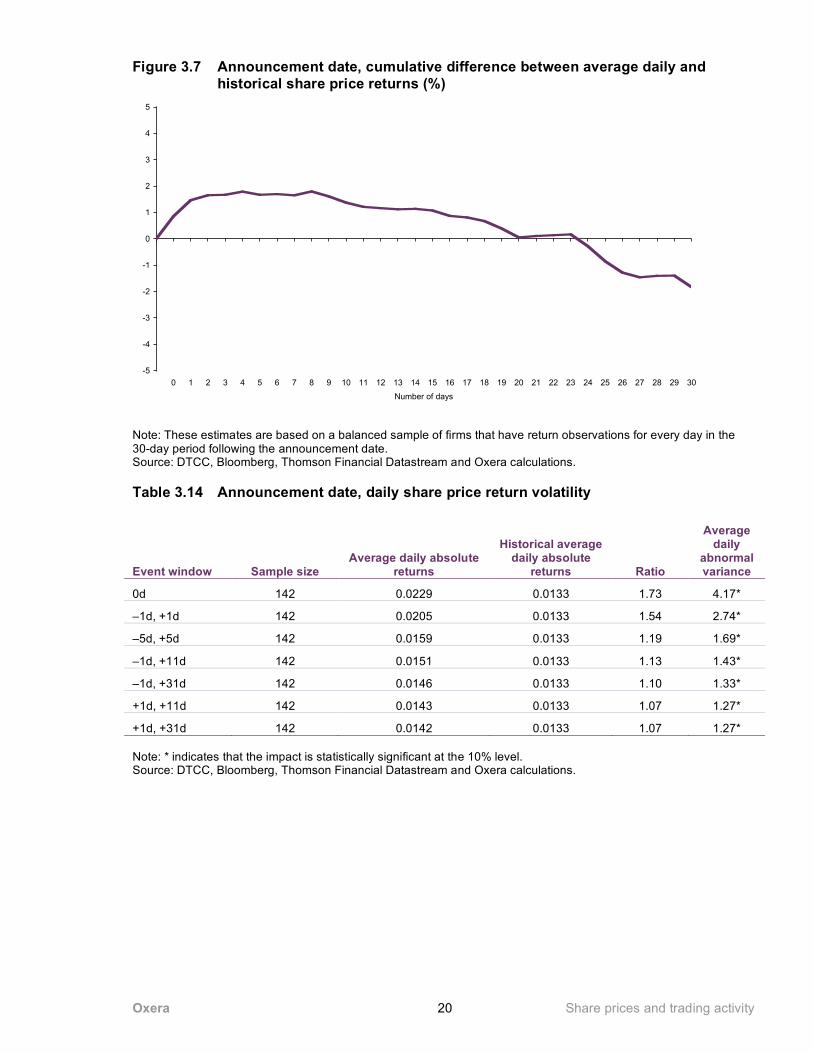
Figure 3.7 Announcement date, cumulative difference between average daily and historical share price returns (%)
-5
-4
-3
-2
-1
0
1
2
3
4
5
0 1 2 3 4 5 6 7 8 9 10 11 12 13 14 15 16 17 18 19 20 21 22 23 24 25 26 27 28 29 30
Number of days
Note: These estimates are based on a balanced sample of firms that have return observations for every day in the 30-day period following the announcement date. Source: DTCC, Bloomberg, Thomson Financial Datastream and Oxera calculations.
Table 3.14 Announcement date, daily share price return volatility
Event window Sample size Average daily absolute
returns
Historical average daily absolute
returns Ratio
Average daily
abnormal variance
0d 142 0.0229 0.0133 1.73 4.17*
–1d, +1d 142 0.0205 0.0133 1.54 2.74*
–5d, +5d 142 0.0159 0.0133 1.19 1.69*
–1d, +11d 142 0.0151 0.0133 1.13 1.43*
–1d, +31d 142 0.0146 0.0133 1.10 1.33*
+1d, +11d 142 0.0143 0.0133 1.07 1.27*
+1d, +31d 142 0.0142 0.0133 1.07 1.27* Note: * indicates that the impact is statistically significant at the 10% level. Source: DTCC, Bloomberg, Thomson Financial Datastream and Oxera calculations.
Oxera Share prices and trading activity 21
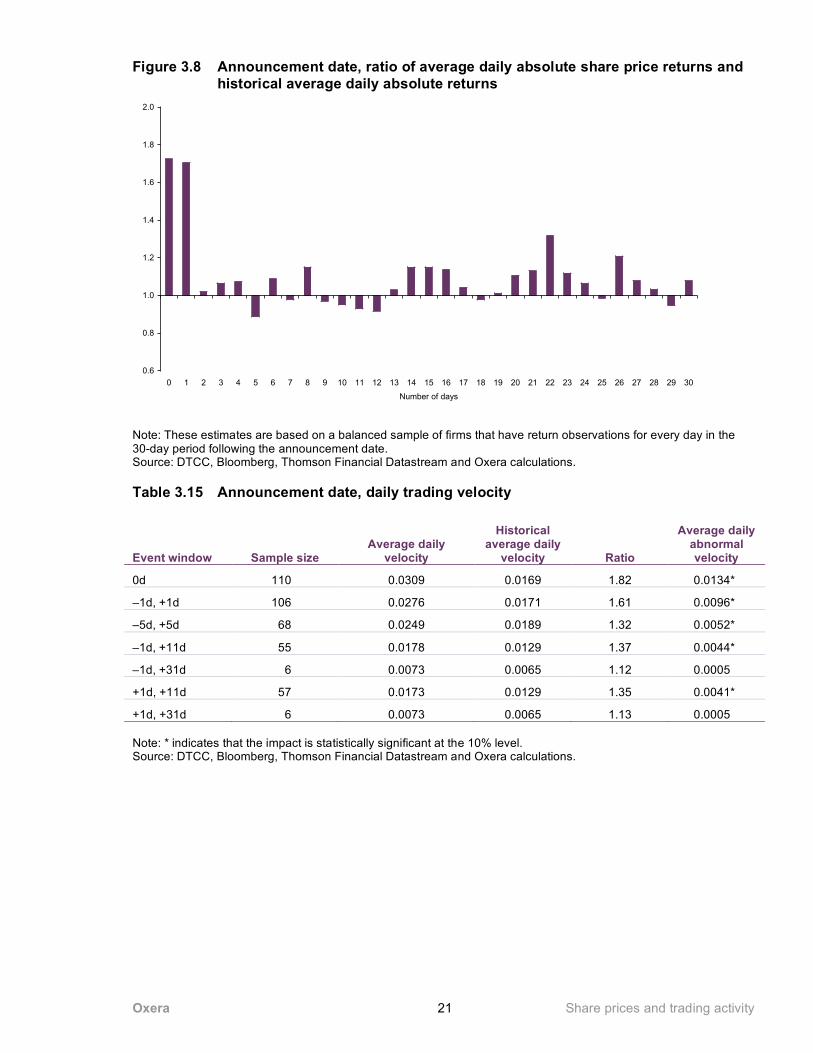
Figure 3.8 Announcement date, ratio of average daily absolute share price returns and historical average daily absolute returns
0.6
0.8
1.0
1.2
1.4
1.6
1.8
2.0
0 1 2 3 4 5 6 7 8 9 10 11 12 13 14 15 16 17 18 19 20 21 22 23 24 25 26 27 28 29 30
Number of days
Note: These estimates are based on a balanced sample of firms that have return observations for every day in the 30-day period following the announcement date. Source: DTCC, Bloomberg, Thomson Financial Datastream and Oxera calculations.
Table 3.15 Announcement date, daily trading velocity
Event window Sample size Average daily
velocity
Historical average daily
velocity Ratio
Average daily abnormal velocity
0d 110 0.0309 0.0169 1.82 0.0134*
–1d, +1d 106 0.0276 0.0171 1.61 0.0096*
–5d, +5d 68 0.0249 0.0189 1.32 0.0052*
–1d, +11d 55 0.0178 0.0129 1.37 0.0044*
–1d, +31d 6 0.0073 0.0065 1.12 0.0005
+1d, +11d 57 0.0173 0.0129 1.35 0.0041*
+1d, +31d 6 0.0073 0.0065 1.13 0.0005 Note: * indicates that the impact is statistically significant at the 10% level. Source: DTCC, Bloomberg, Thomson Financial Datastream and Oxera calculations.
Oxera Share prices and trading activity 22
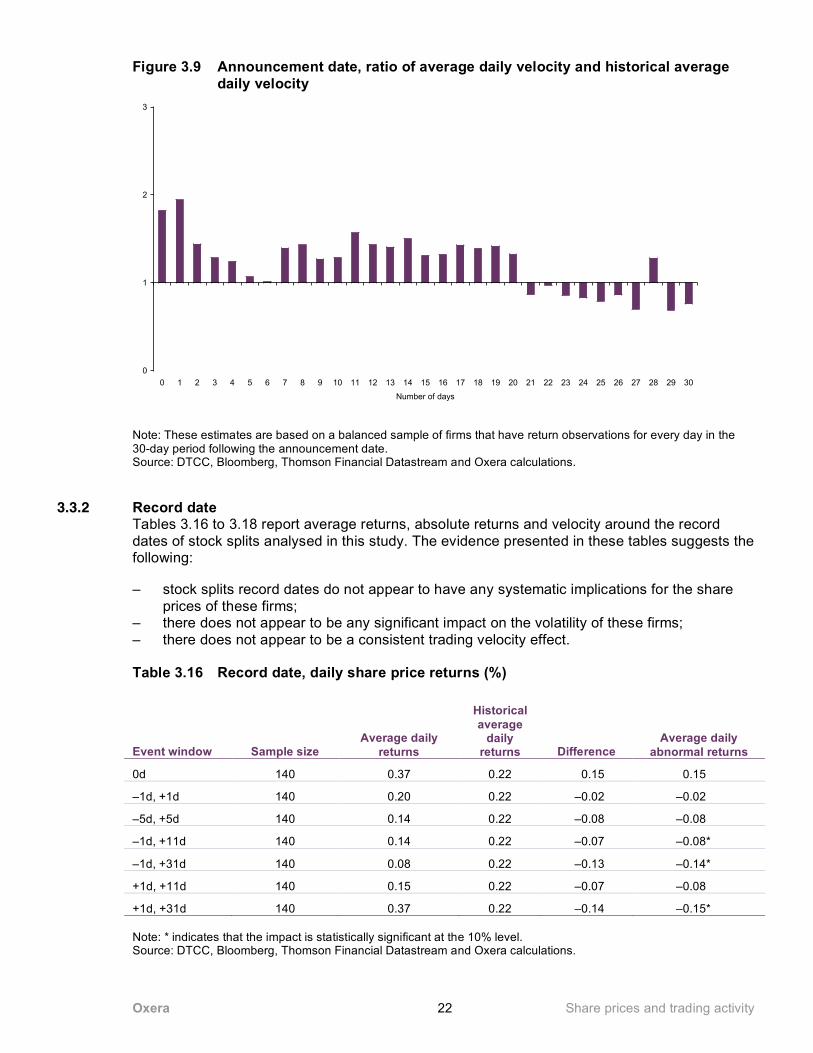
Figure 3.9 Announcement date, ratio of average daily velocity and historical average daily velocity
0
1
2
3
0 1 2 3 4 5 6 7 8 9 10 11 12 13 14 15 16 17 18 19 20 21 22 23 24 25 26 27 28 29 30
Number of days
Note: These estimates are based on a balanced sample of firms that have return observations for every day in the 30-day period following the announcement date. Source: DTCC, Bloomberg, Thomson Financial Datastream and Oxera calculations.
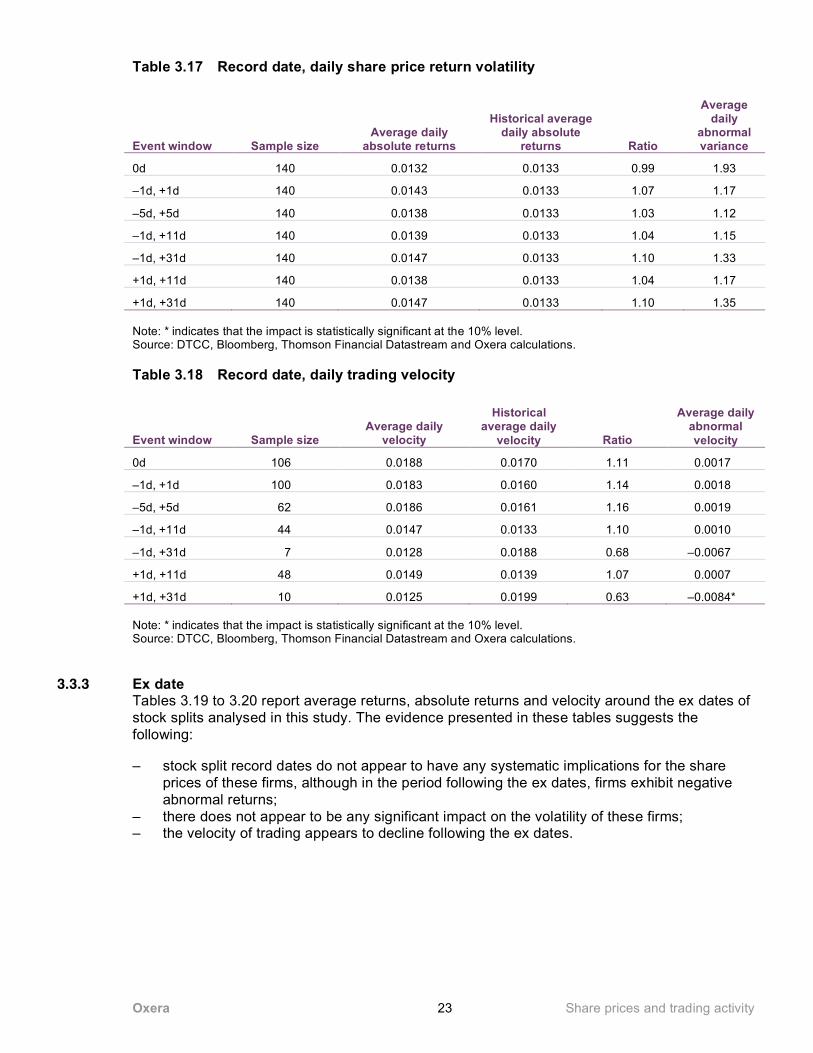
3.3.2 Record date Tables 3.16 to 3.18 report average returns, absolute returns and velocity around the record dates of stock splits analysed in this study. The evidence presented in these tables suggests the following:
– stock splits record dates do not appear to have any systematic implications for the share prices of these firms;
– there does not appear to be any significant impact on the volatility of these firms; – there does not appear to be a consistent trading velocity effect.
Table 3.16 Record date, daily share price returns (%)
Event window Sample size Average daily
returns
Historical average
daily returns Difference
Average daily abnormal returns
0d 140 0.37 0.22 0.15 0.15
–1d, +1d 140 0.20 0.22 –0.02 –0.02
–5d, +5d 140 0.14 0.22 –0.08 –0.08
–1d, +11d 140 0.14 0.22 –0.07 –0.08*
–1d, +31d 140 0.08 0.22 –0.13 –0.14*
+1d, +11d 140 0.15 0.22 –0.07 –0.08
+1d, +31d 140 0.37 0.22 –0.14 –0.15* Note: * indicates that the impact is statistically significant at the 10% level. Source: DTCC, Bloomberg, Thomson Financial Datastream and Oxera calculations.
Oxera Share prices and trading activity 23
Table 3.17 Record date, daily share price return volatility
Event window Sample size Average daily
absolute returns
Historical average daily absolute
returns Ratio
Average daily
abnormal variance
0d 140 0.0132 0.0133 0.99 1.93
–1d, +1d 140 0.0143 0.0133 1.07 1.17
–5d, +5d 140 0.0138 0.0133 1.03 1.12
–1d, +11d 140 0.0139 0.0133 1.04 1.15
–1d, +31d 140 0.0147 0.0133 1.10 1.33
+1d, +11d 140 0.0138 0.0133 1.04 1.17
+1d, +31d 140 0.0147 0.0133 1.10 1.35 Note: * indicates that the impact is statistically significant at the 10% level. Source: DTCC, Bloomberg, Thomson Financial Datastream and Oxera calculations.
Table 3.18 Record date, daily trading velocity
Event window Sample size Average daily
velocity
Historical average daily
velocity Ratio
Average daily abnormal velocity
0d 106 0.0188 0.0170 1.11 0.0017
–1d, +1d 100 0.0183 0.0160 1.14 0.0018
–5d, +5d 62 0.0186 0.0161 1.16 0.0019
–1d, +11d 44 0.0147 0.0133 1.10 0.0010
–1d, +31d 7 0.0128 0.0188 0.68 –0.0067
+1d, +11d 48 0.0149 0.0139 1.07 0.0007
+1d, +31d 10 0.0125 0.0199 0.63 –0.0084* Note: * indicates that the impact is statistically significant at the 10% level. Source: DTCC, Bloomberg, Thomson Financial Datastream and Oxera calculations.
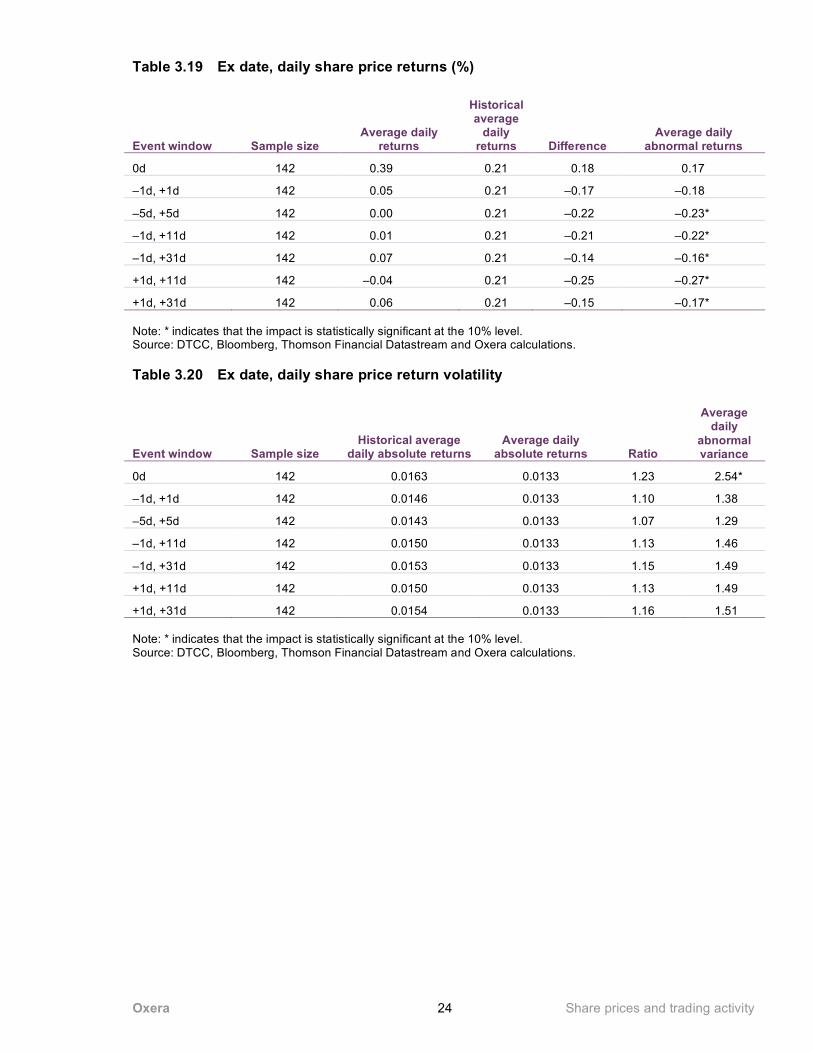
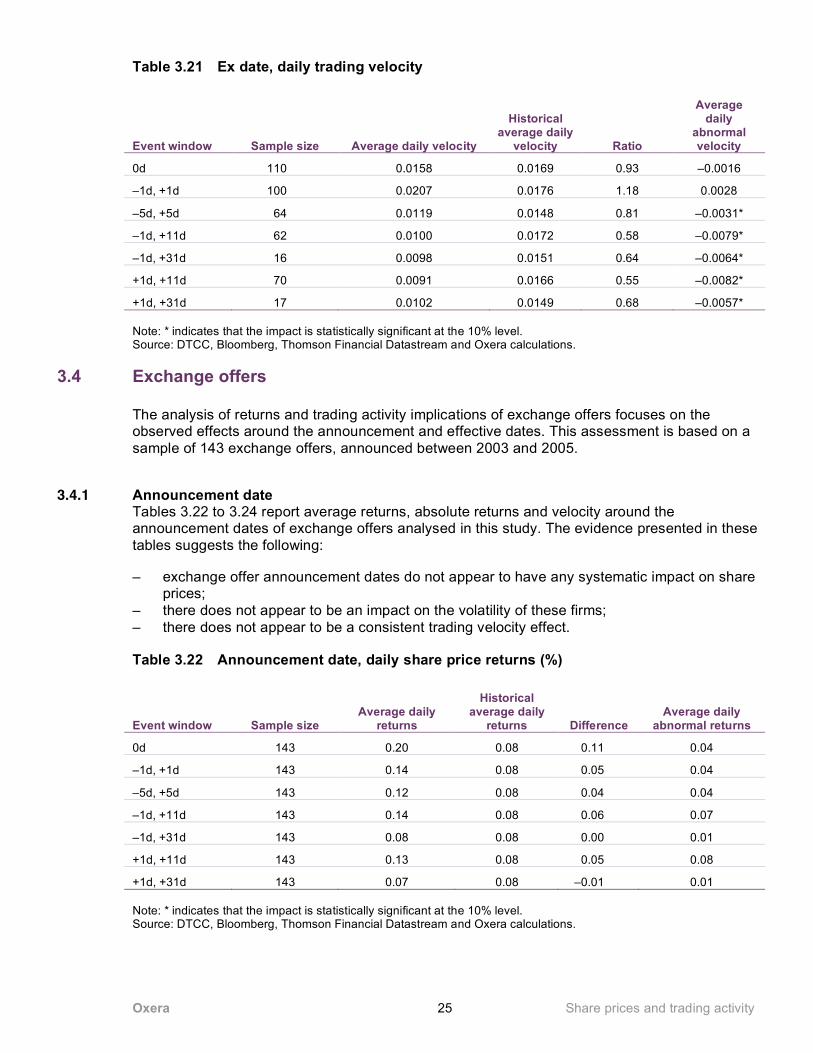
3.3.3 Ex date Tables 3.19 to 3.20 report average returns, absolute returns and velocity around the ex dates of stock splits analysed in this study. The evidence presented in these tables suggests the following:
– stock split record dates do not appear to have any systematic implications for the share prices of these firms, although in the period following the ex dates, firms exhibit negative abnormal returns;
– there does not appear to be any significant impact on the volatility of these firms; – the velocity of trading appears to decline following the ex dates.
Oxera Share prices and trading activity 24
Table 3.19 Ex date, daily share price returns (%)
Event window Sample size Average daily
returns
Historical average
daily returns Difference
Average daily abnormal returns
0d 142 0.39 0.21 0.18 0.17
–1d, +1d 142 0.05 0.21 –0.17 –0.18
–5d, +5d 142 0.00 0.21 –0.22 –0.23*
–1d, +11d 142 0.01 0.21 –0.21 –0.22*
–1d, +31d 142 0.07 0.21 –0.14 –0.16*
+1d, +11d 142 –0.04 0.21 –0.25 –0.27*
+1d, +31d 142 0.06 0.21 –0.15 –0.17* Note: * indicates that the impact is statistically significant at the 10% level. Source: DTCC, Bloomberg, Thomson Financial Datastream and Oxera calculations.
Table 3.20 Ex date, daily share price return volatility
Event window Sample size Historical average
daily absolute returns Average daily
absolute returns Ratio
Average daily
abnormal variance
0d 142 0.0163 0.0133 1.23 2.54*
–1d, +1d 142 0.0146 0.0133 1.10 1.38
–5d, +5d 142 0.0143 0.0133 1.07 1.29
–1d, +11d 142 0.0150 0.0133 1.13 1.46
–1d, +31d 142 0.0153 0.0133 1.15 1.49
+1d, +11d 142 0.0150 0.0133 1.13 1.49
+1d, +31d 142 0.0154 0.0133 1.16 1.51 Note: * indicates that the impact is statistically significant at the 10% level. Source: DTCC, Bloomberg, Thomson Financial Datastream and Oxera calculations.
Oxera Share prices and trading activity 25
Table 3.21 Ex date, daily trading velocity
Event window Sample size Average daily velocity
Historical average daily
velocity Ratio
Average daily
abnormal velocity
0d 110 0.0158 0.0169 0.93 –0.0016
–1d, +1d 100 0.0207 0.0176 1.18 0.0028
–5d, +5d 64 0.0119 0.0148 0.81 –0.0031*
–1d, +11d 62 0.0100 0.0172 0.58 –0.0079*
–1d, +31d 16 0.0098 0.0151 0.64 –0.0064*
+1d, +11d 70 0.0091 0.0166 0.55 –0.0082*
+1d, +31d 17 0.0102 0.0149 0.68 –0.0057* Note: * indicates that the impact is statistically significant at the 10% level. Source: DTCC, Bloomberg, Thomson Financial Datastream and Oxera calculations.
3.4 Exchange offers
The analysis of returns and trading activity implications of exchange offers focuses on the observed effects around the announcement and effective dates. This assessment is based on a sample of 143 exchange offers, announced between 2003 and 2005.
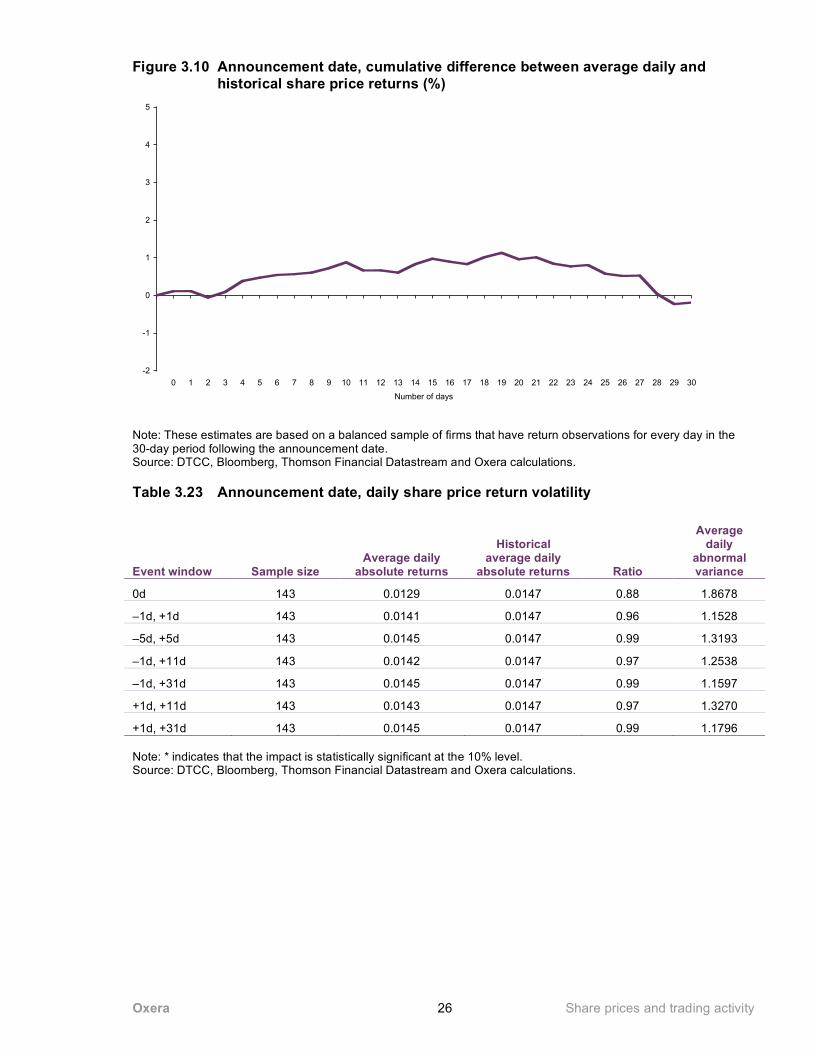
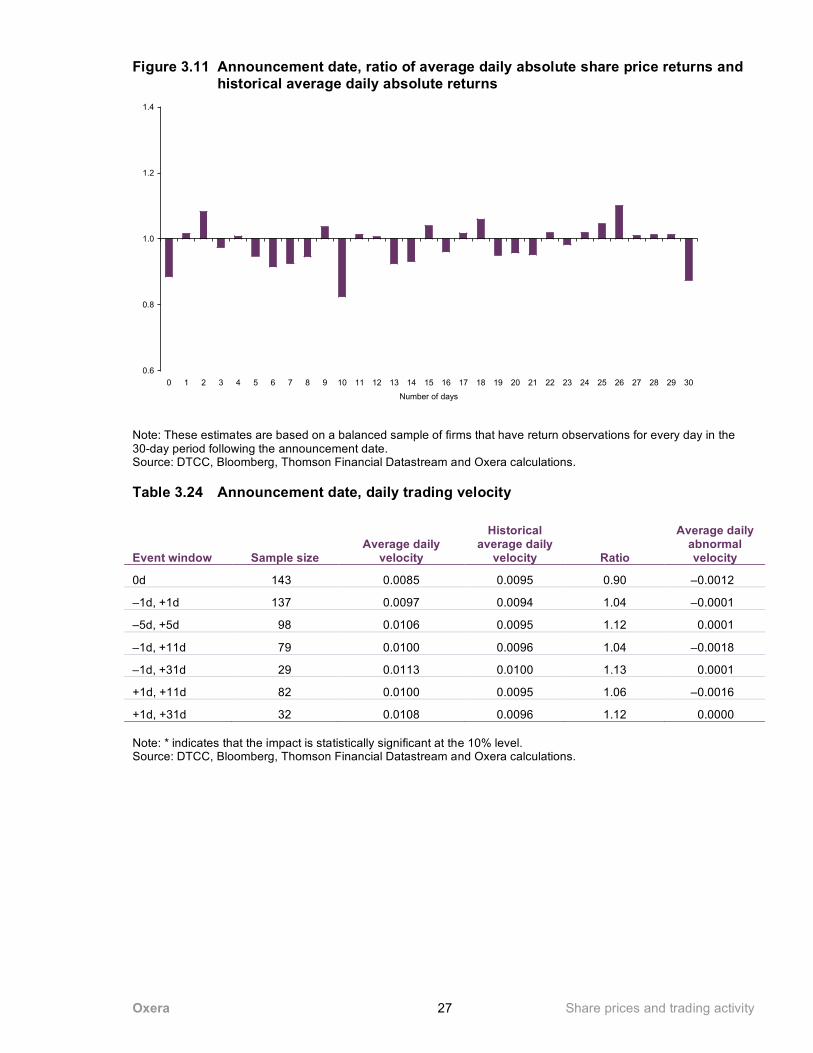
3.4.1 Announcement date Tables 3.22 to 3.24 report average returns, absolute returns and velocity around the announcement dates of exchange offers analysed in this study. The evidence presented in these tables suggests the following:
– exchange offer announcement dates do not appear to have any systematic impact on share prices;
– there does not appear to be an impact on the volatility of these firms; – there does not appear to be a consistent trading velocity effect.
Table 3.22 Announcement date, daily share price returns (%)
Event window Sample size Average daily
returns
Historical average daily
returns Difference Average daily
abnormal returns
0d 143 0.20 0.08 0.11 0.04
–1d, +1d 143 0.14 0.08 0.05 0.04
–5d, +5d 143 0.12 0.08 0.04 0.04
–1d, +11d 143 0.14 0.08 0.06 0.07
–1d, +31d 143 0.08 0.08 0.00 0.01
+1d, +11d 143 0.13 0.08 0.05 0.08
+1d, +31d 143 0.07 0.08 –0.01 0.01 Note: * indicates that the impact is statistically significant at the 10% level. Source: DTCC, Bloomberg, Thomson Financial Datastream and Oxera calculations.
Oxera Share prices and trading activity 26
Figure 3.10 Announcement date, cumulative difference between average daily and historical share price returns (%)
-2
-1
0
1
2
3
4
5
0 1 2 3 4 5 6 7 8 9 10 11 12 13 14 15 16 17 18 19 20 21 22 23 24 25 26 27 28 29 30
Number of days
Note: These estimates are based on a balanced sample of firms that have return observations for every day in the 30-day period following the announcement date. Source: DTCC, Bloomberg, Thomson Financial Datastream and Oxera calculations.
Table 3.23 Announcement date, daily share price return volatility
Event window Sample size Average daily
absolute returns
Historical average daily
absolute returns Ratio
Average daily
abnormal variance
0d 143 0.0129 0.0147 0.88 1.8678
–1d, +1d 143 0.0141 0.0147 0.96 1.1528
–5d, +5d 143 0.0145 0.0147 0.99 1.3193
–1d, +11d 143 0.0142 0.0147 0.97 1.2538
–1d, +31d 143 0.0145 0.0147 0.99 1.1597
+1d, +11d 143 0.0143 0.0147 0.97 1.3270
+1d, +31d 143 0.0145 0.0147 0.99 1.1796 Note: * indicates that the impact is statistically significant at the 10% level. Source: DTCC, Bloomberg, Thomson Financial Datastream and Oxera calculations.
Oxera Share prices and trading activity 27
Figure 3.11 Announcement date, ratio of average daily absolute share price returns and historical average daily absolute returns
0.6
0.8
1.0
1.2
1.4
0 1 2 3 4 5 6 7 8 9 10 11 12 13 14 15 16 17 18 19 20 21 22 23 24 25 26 27 28 29 30
Number of days
Note: These estimates are based on a balanced sample of firms that have return observations for every day in the 30-day period following the announcement date. Source: DTCC, Bloomberg, Thomson Financial Datastream and Oxera calculations.
Table 3.24 Announcement date, daily trading velocity
Event window Sample size Average daily
velocity
Historical average daily
velocity Ratio
Average daily abnormal velocity
0d 143 0.0085 0.0095 0.90 –0.0012
–1d, +1d 137 0.0097 0.0094 1.04 –0.0001
–5d, +5d 98 0.0106 0.0095 1.12 0.0001
–1d, +11d 79 0.0100 0.0096 1.04 –0.0018
–1d, +31d 29 0.0113 0.0100 1.13 0.0001
+1d, +11d 82 0.0100 0.0095 1.06 –0.0016
+1d, +31d 32 0.0108 0.0096 1.12 0.0000 Note: * indicates that the impact is statistically significant at the 10% level. Source: DTCC, Bloomberg, Thomson Financial Datastream and Oxera calculations.
Oxera Share prices and trading activity 28
Figure 3.12 Announcement date, ratio of average daily velocity and historical average daily velocity
0.6
0.8
1.0
1.2
1.4
0 1 2 3 4 5 6 7 8 9 10 11 12 13 14 15 16 17 18 19 20 21 22 23 24 25 26 27 28 29 30
Number of days
Note: These estimates are based on a balanced sample of firms that have return observations for every day in the 30-day period following the announcement date. Source: DTCC, Bloomberg, Thomson Financial Datastream and Oxera calculations.
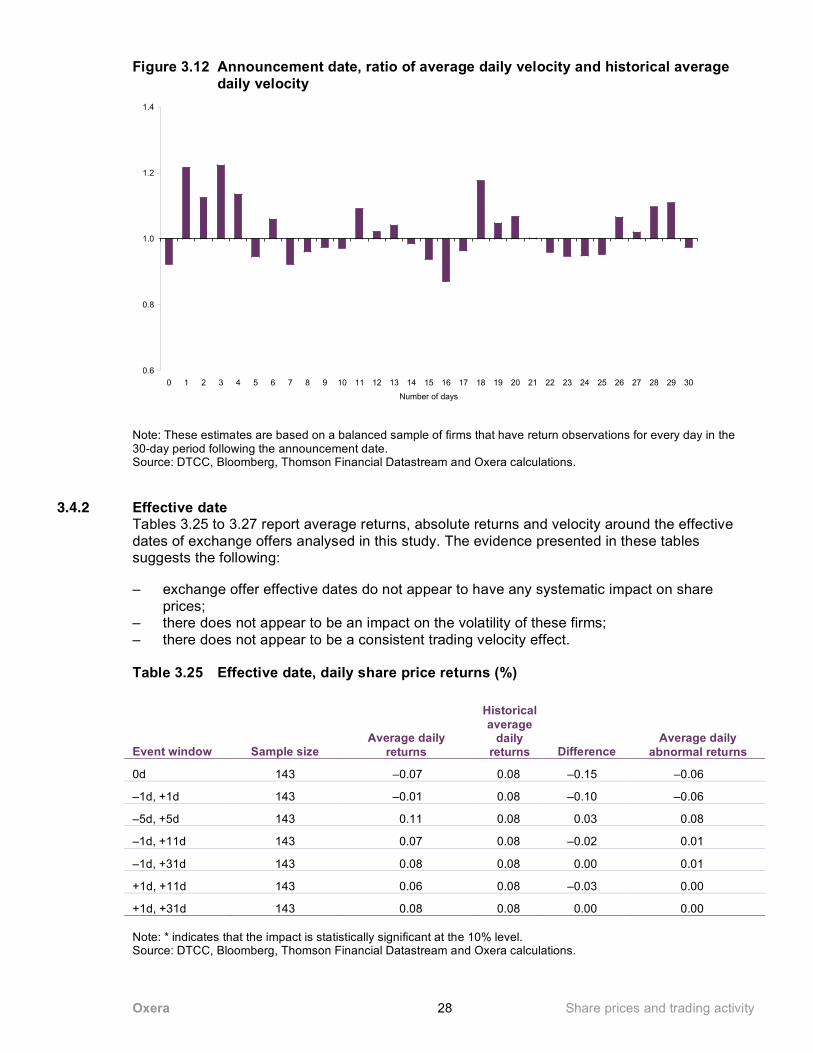
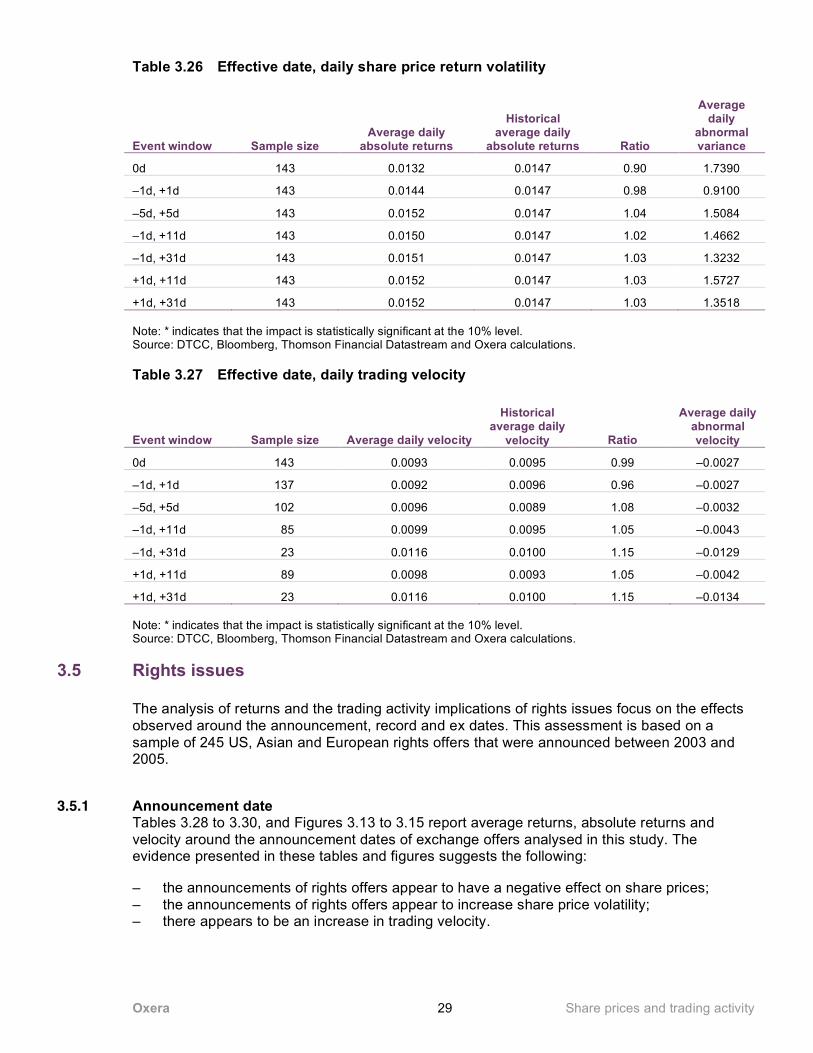
3.4.2 Effective date Tables 3.25 to 3.27 report average returns, absolute returns and velocity around the effective dates of exchange offers analysed in this study. The evidence presented in these tables suggests the following:
– exchange offer effective dates do not appear to have any systematic impact on share prices;
– there does not appear to be an impact on the volatility of these firms; – there does not appear to be a consistent trading velocity effect.
Table 3.25 Effective date, daily share price returns (%)
Event window Sample size Average daily
returns
Historical average
daily returns Difference
Average daily abnormal returns
0d 143 –0.07 0.08 –0.15 –0.06
–1d, +1d 143 –0.01 0.08 –0.10 –0.06
–5d, +5d 143 0.11 0.08 0.03 0.08
–1d, +11d 143 0.07 0.08 –0.02 0.01
–1d, +31d 143 0.08 0.08 0.00 0.01
+1d, +11d 143 0.06 0.08 –0.03 0.00
+1d, +31d 143 0.08 0.08 0.00 0.00 Note: * indicates that the impact is statistically significant at the 10% level. Source: DTCC, Bloomberg, Thomson Financial Datastream and Oxera calculations.
Oxera Share prices and trading activity 29
Table 3.26 Effective date, daily share price return volatility
Event window Sample size Average daily
absolute returns
Historical average daily
absolute returns Ratio
Average daily
abnormal variance
0d 143 0.0132 0.0147 0.90 1.7390
–1d, +1d 143 0.0144 0.0147 0.98 0.9100
–5d, +5d 143 0.0152 0.0147 1.04 1.5084
–1d, +11d 143 0.0150 0.0147 1.02 1.4662
–1d, +31d 143 0.0151 0.0147 1.03 1.3232
+1d, +11d 143 0.0152 0.0147 1.03 1.5727
+1d, +31d 143 0.0152 0.0147 1.03 1.3518 Note: * indicates that the impact is statistically significant at the 10% level. Source: DTCC, Bloomberg, Thomson Financial Datastream and Oxera calculations.
Table 3.27 Effective date, daily trading velocity
Event window Sample size Average daily velocity
Historical average daily
velocity Ratio
Average daily abnormal velocity
0d 143 0.0093 0.0095 0.99 –0.0027
–1d, +1d 137 0.0092 0.0096 0.96 –0.0027
–5d, +5d 102 0.0096 0.0089 1.08 –0.0032
–1d, +11d 85 0.0099 0.0095 1.05 –0.0043
–1d, +31d 23 0.0116 0.0100 1.15 –0.0129
+1d, +11d 89 0.0098 0.0093 1.05 –0.0042
+1d, +31d 23 0.0116 0.0100 1.15 –0.0134 Note: * indicates that the impact is statistically significant at the 10% level. Source: DTCC, Bloomberg, Thomson Financial Datastream and Oxera calculations.
3.5 Rights issues
The analysis of returns and the trading activity implications of rights issues focus on the effects observed around the announcement, record and ex dates. This assessment is based on a sample of 245 US, Asian and European rights offers that were announced between 2003 and 2005.
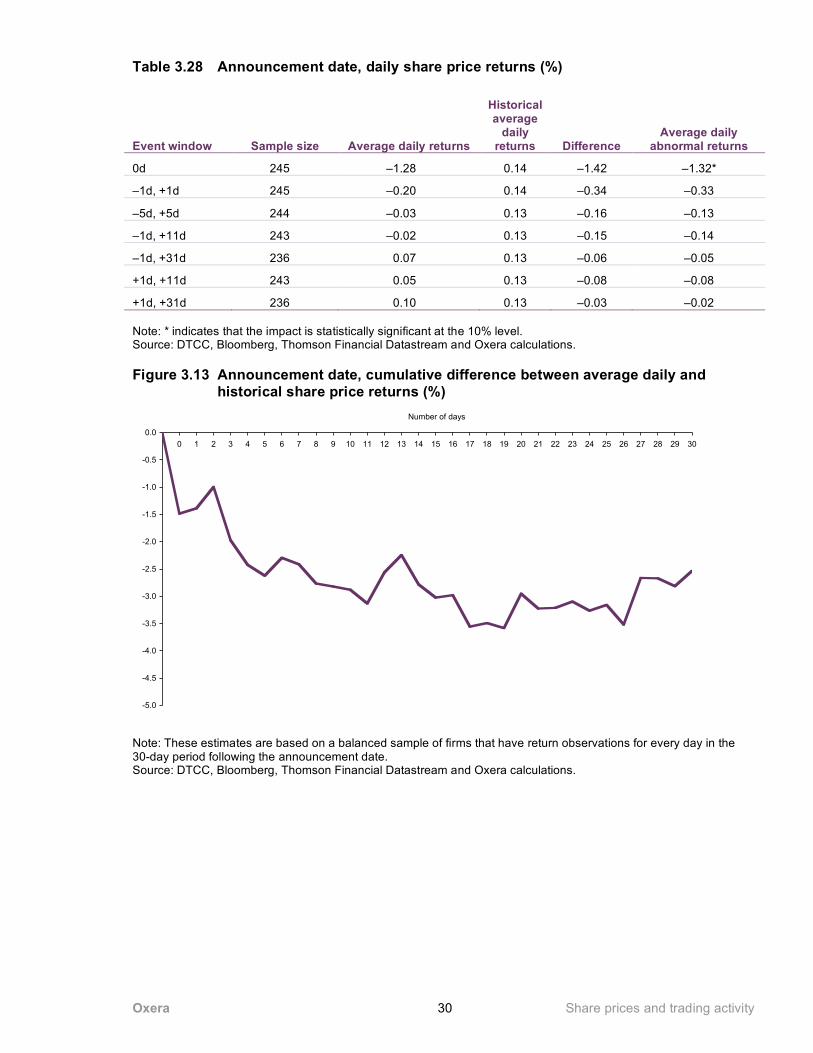
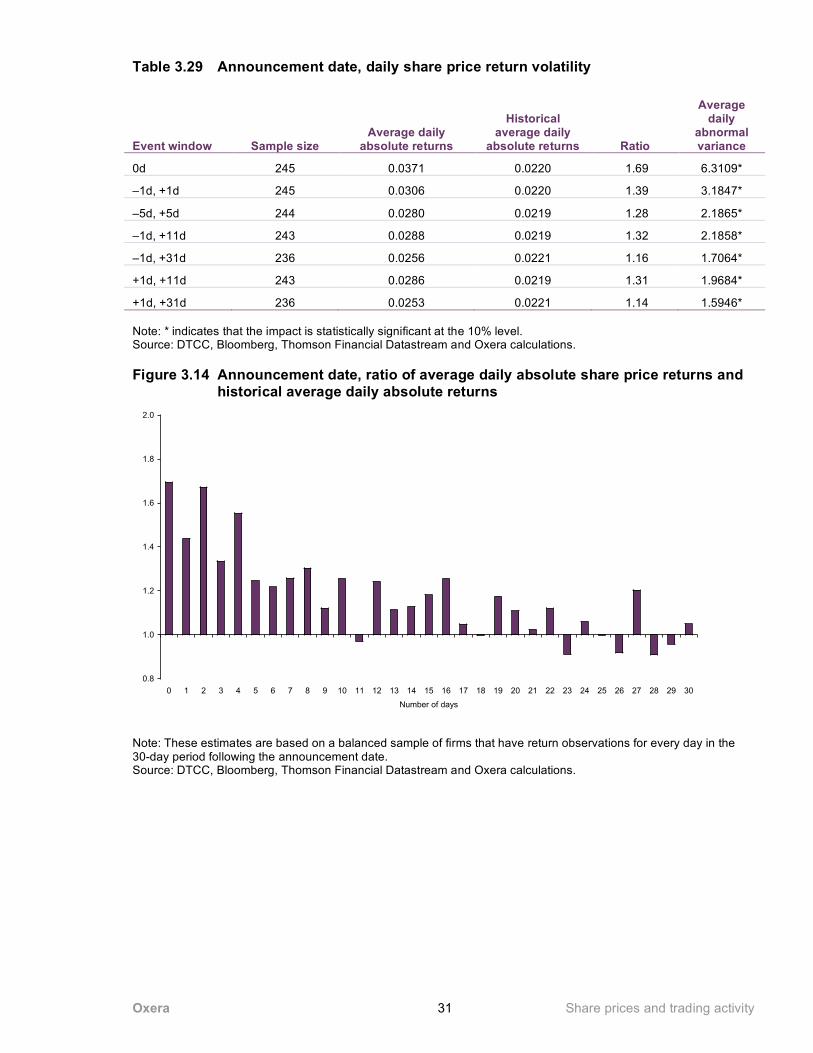
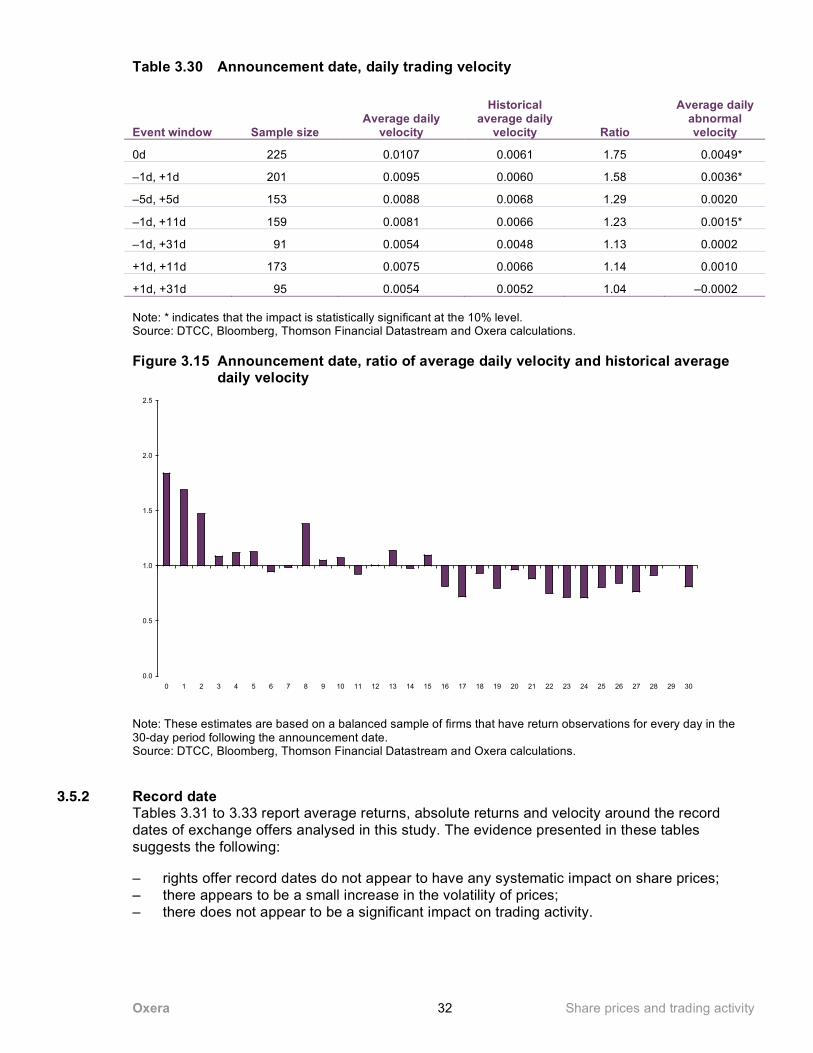
3.5.1 Announcement date Tables 3.28 to 3.30, and Figures 3.13 to 3.15 report average returns, absolute returns and velocity around the announcement dates of exchange offers analysed in this study. The evidence presented in these tables and figures suggests the following:
– the announcements of rights offers appear to have a negative effect on share prices; – the announcements of rights offers appear to increase share price volatility; – there appears to be an increase in trading velocity.
Oxera Share prices and trading activity 30
Table 3.28 Announcement date, daily share price returns (%)
Event window Sample size Average daily returns
Historical average
daily returns Difference
Average daily abnormal returns
0d 245 –1.28 0.14 –1.42 –1.32*
–1d, +1d 245 –0.20 0.14 –0.34 –0.33
–5d, +5d 244 –0.03 0.13 –0.16 –0.13
–1d, +11d 243 –0.02 0.13 –0.15 –0.14
–1d, +31d 236 0.07 0.13 –0.06 –0.05
+1d, +11d 243 0.05 0.13 –0.08 –0.08
+1d, +31d 236 0.10 0.13 –0.03 –0.02 Note: * indicates that the impact is statistically significant at the 10% level. Source: DTCC, Bloomberg, Thomson Financial Datastream and Oxera calculations.
Figure 3.13 Announcement date, cumulative difference between average daily and historical share price returns (%)
-5.0
-4.5
-4.0
-3.5
-3.0
-2.5
-2.0
-1.5
-1.0
-0.5
0.0
0 1 2 3 4 5 6 7 8 9 10 11 12 13 14 15 16 17 18 19 20 21 22 23 24 25 26 27 28 29 30
Number of days
Note: These estimates are based on a balanced sample of firms that have return observations for every day in the 30-day period following the announcement date. Source: DTCC, Bloomberg, Thomson Financial Datastream and Oxera calculations.
Oxera Share prices and trading activity 31
Table 3.29 Announcement date, daily share price return volatility
Event window Sample size Average daily
absolute returns
Historical average daily
absolute returns Ratio
Average daily
abnormal variance
0d 245 0.0371 0.0220 1.69 6.3109*
–1d, +1d 245 0.0306 0.0220 1.39 3.1847*
–5d, +5d 244 0.0280 0.0219 1.28 2.1865*
–1d, +11d 243 0.0288 0.0219 1.32 2.1858*
–1d, +31d 236 0.0256 0.0221 1.16 1.7064*
+1d, +11d 243 0.0286 0.0219 1.31 1.9684*
+1d, +31d 236 0.0253 0.0221 1.14 1.5946* Note: * indicates that the impact is statistically significant at the 10% level. Source: DTCC, Bloomberg, Thomson Financial Datastream and Oxera calculations.
Figure 3.14 Announcement date, ratio of average daily absolute share price returns and historical average daily absolute returns
0.8
1.0
1.2
1.4
1.6
1.8
2.0
0 1 2 3 4 5 6 7 8 9 10 11 12 13 14 15 16 17 18 19 20 21 22 23 24 25 26 27 28 29 30
Number of days
Note: These estimates are based on a balanced sample of firms that have return observations for every day in the 30-day period following the announcement date. Source: DTCC, Bloomberg, Thomson Financial Datastream and Oxera calculations.
Oxera Share prices and trading activity 32
Table 3.30 Announcement date, daily trading velocity
Event window Sample size Average daily
velocity
Historical average daily
velocity Ratio
Average daily abnormal velocity
0d 225 0.0107 0.0061 1.75 0.0049*
–1d, +1d 201 0.0095 0.0060 1.58 0.0036*
–5d, +5d 153 0.0088 0.0068 1.29 0.0020
–1d, +11d 159 0.0081 0.0066 1.23 0.0015*
–1d, +31d 91 0.0054 0.0048 1.13 0.0002
+1d, +11d 173 0.0075 0.0066 1.14 0.0010
+1d, +31d 95 0.0054 0.0052 1.04 –0.0002 Note: * indicates that the impact is statistically significant at the 10% level. Source: DTCC, Bloomberg, Thomson Financial Datastream and Oxera calculations.
Figure 3.15 Announcement date, ratio of average daily velocity and historical average daily velocity
0.0
0.5
1.0
1.5
2.0
2.5
0 1 2 3 4 5 6 7 8 9 10 11 12 13 14 15 16 17 18 19 20 21 22 23 24 25 26 27 28 29 30
Note: These estimates are based on a balanced sample of firms that have return observations for every day in the 30-day period following the announcement date. Source: DTCC, Bloomberg, Thomson Financial Datastream and Oxera calculations.
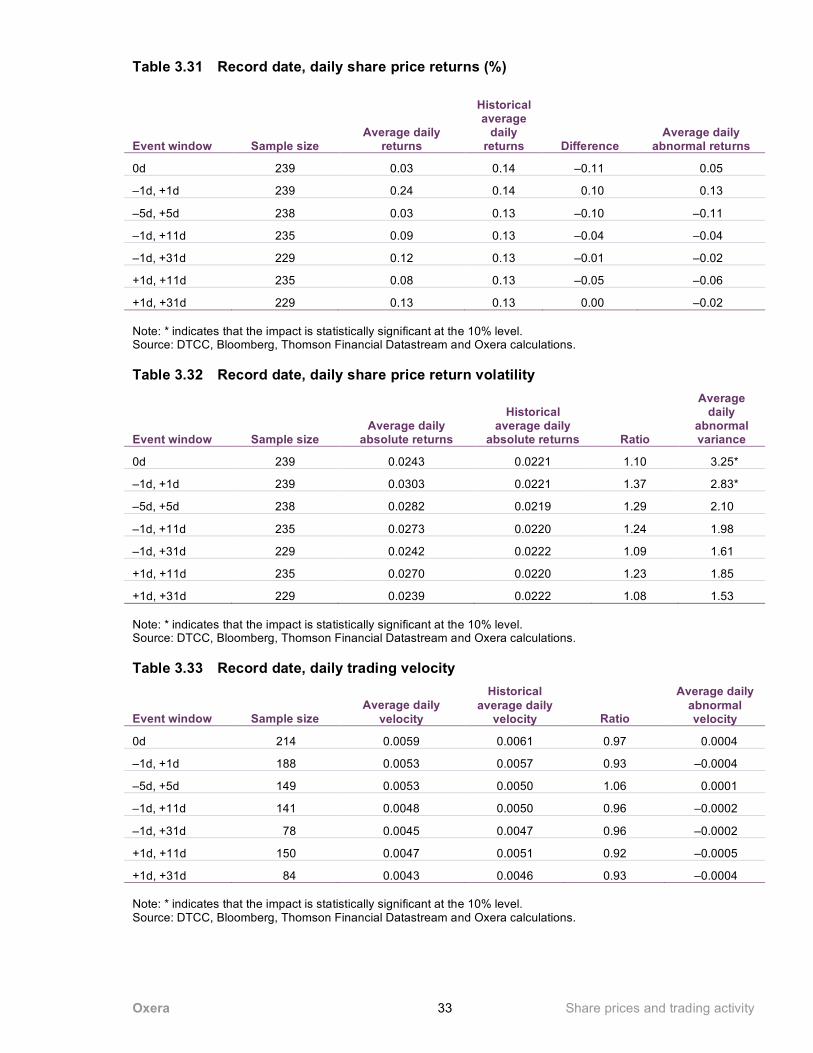
3.5.2 Record date Tables 3.31 to 3.33 report average returns, absolute returns and velocity around the record dates of exchange offers analysed in this study. The evidence presented in these tables suggests the following:
– rights offer record dates do not appear to have any systematic impact on share prices; – there appears to be a small increase in the volatility of prices; – there does not appear to be a significant impact on trading activity.
Oxera Share prices and trading activity 33
Table 3.31 Record date, daily share price returns (%)
Event window Sample size Average daily
returns
Historical average
daily returns Difference
Average daily abnormal returns
0d 239 0.03 0.14 –0.11 0.05
–1d, +1d 239 0.24 0.14 0.10 0.13
–5d, +5d 238 0.03 0.13 –0.10 –0.11
–1d, +11d 235 0.09 0.13 –0.04 –0.04
–1d, +31d 229 0.12 0.13 –0.01 –0.02
+1d, +11d 235 0.08 0.13 –0.05 –0.06
+1d, +31d 229 0.13 0.13 0.00 –0.02 Note: * indicates that the impact is statistically significant at the 10% level. Source: DTCC, Bloomberg, Thomson Financial Datastream and Oxera calculations.
Table 3.32 Record date, daily share price return volatility
Event window Sample size Average daily
absolute returns
Historical average daily
absolute returns Ratio
Average daily
abnormal variance
0d 239 0.0243 0.0221 1.10 3.25*
–1d, +1d 239 0.0303 0.0221 1.37 2.83*
–5d, +5d 238 0.0282 0.0219 1.29 2.10
–1d, +11d 235 0.0273 0.0220 1.24 1.98
–1d, +31d 229 0.0242 0.0222 1.09 1.61
+1d, +11d 235 0.0270 0.0220 1.23 1.85
+1d, +31d 229 0.0239 0.0222 1.08 1.53 Note: * indicates that the impact is statistically significant at the 10% level. Source: DTCC, Bloomberg, Thomson Financial Datastream and Oxera calculations.
Table 3.33 Record date, daily trading velocity
Event window Sample size Average daily
velocity
Historical average daily
velocity Ratio
Average daily abnormal velocity
0d 214 0.0059 0.0061 0.97 0.0004
–1d, +1d 188 0.0053 0.0057 0.93 –0.0004
–5d, +5d 149 0.0053 0.0050 1.06 0.0001
–1d, +11d 141 0.0048 0.0050 0.96 –0.0002
–1d, +31d 78 0.0045 0.0047 0.96 –0.0002
+1d, +11d 150 0.0047 0.0051 0.92 –0.0005
+1d, +31d 84 0.0043 0.0046 0.93 –0.0004 Note: * indicates that the impact is statistically significant at the 10% level. Source: DTCC, Bloomberg, Thomson Financial Datastream and Oxera calculations.
Oxera Share prices and trading activity 34
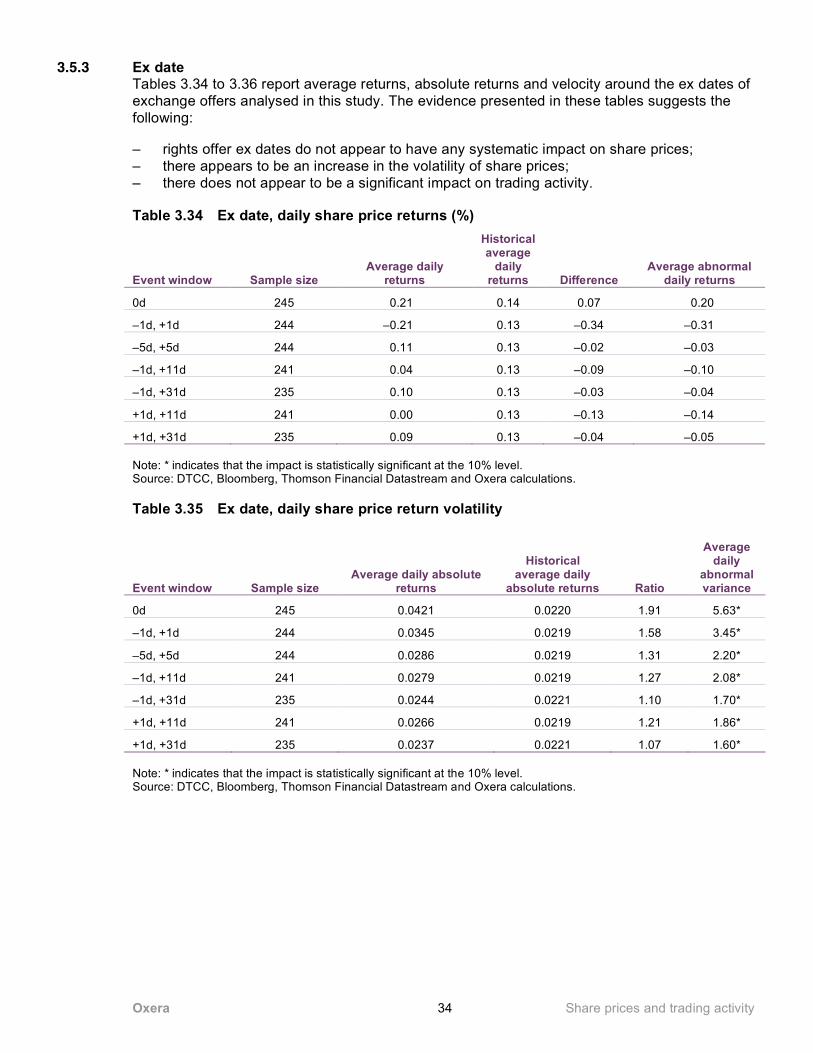
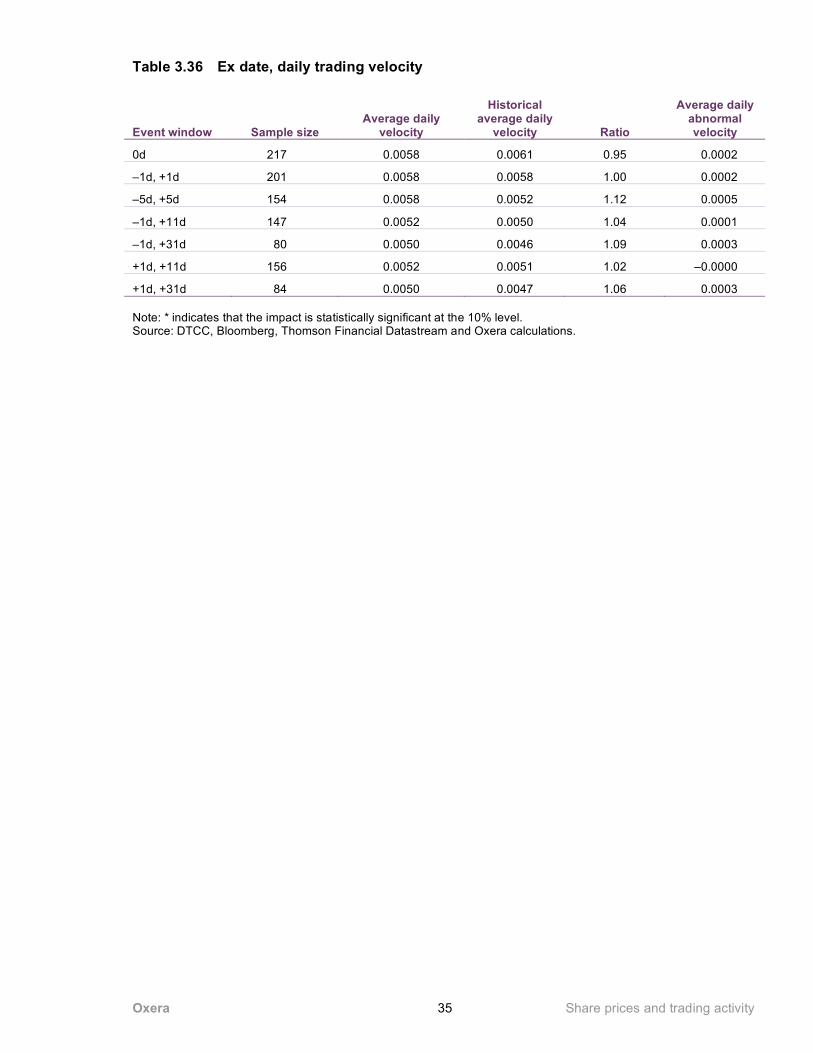
3.5.3 Ex date Tables 3.34 to 3.36 report average returns, absolute returns and velocity around the ex dates of exchange offers analysed in this study. The evidence presented in these tables suggests the following:
– rights offer ex dates do not appear to have any systematic impact on share prices; – there appears to be an increase in the volatility of share prices; – there does not appear to be a significant impact on trading activity.
Table 3.34 Ex date, daily share price returns (%)
Event window Sample size Average daily
returns
Historical average
daily returns Difference
Average abnormal daily returns
0d 245 0.21 0.14 0.07 0.20
–1d, +1d 244 –0.21 0.13 –0.34 –0.31
–5d, +5d 244 0.11 0.13 –0.02 –0.03
–1d, +11d 241 0.04 0.13 –0.09 –0.10
–1d, +31d 235 0.10 0.13 –0.03 –0.04
+1d, +11d 241 0.00 0.13 –0.13 –0.14
+1d, +31d 235 0.09 0.13 –0.04 –0.05 Note: * indicates that the impact is statistically significant at the 10% level. Source: DTCC, Bloomberg, Thomson Financial Datastream and Oxera calculations.
Table 3.35 Ex date, daily share price return volatility
Event window Sample size Average daily absolute
returns
Historical average daily
absolute returns Ratio
Average daily
abnormal variance
0d 245 0.0421 0.0220 1.91 5.63*
–1d, +1d 244 0.0345 0.0219 1.58 3.45*
–5d, +5d 244 0.0286 0.0219 1.31 2.20*
–1d, +11d 241 0.0279 0.0219 1.27 2.08*
–1d, +31d 235 0.0244 0.0221 1.10 1.70*
+1d, +11d 241 0.0266 0.0219 1.21 1.86*
+1d, +31d 235 0.0237 0.0221 1.07 1.60* Note: * indicates that the impact is statistically significant at the 10% level. Source: DTCC, Bloomberg, Thomson Financial Datastream and Oxera calculations.
Oxera Share prices and trading activity 35
Table 3.36 Ex date, daily trading velocity
Event window Sample size Average daily
velocity
Historical average daily
velocity Ratio
Average daily abnormal velocity
0d 217 0.0058 0.0061 0.95 0.0002
–1d, +1d 201 0.0058 0.0058 1.00 0.0002
–5d, +5d 154 0.0058 0.0052 1.12 0.0005
–1d, +11d 147 0.0052 0.0050 1.04 0.0001
–1d, +31d 80 0.0050 0.0046 1.09 0.0003
+1d, +11d 156 0.0052 0.0051 1.02 –0.0000
+1d, +31d 84 0.0050 0.0047 1.06 0.0003 Note: * indicates that the impact is statistically significant at the 10% level. Source: DTCC, Bloomberg, Thomson Financial Datastream and Oxera calculations.

Oxera Share prices and trading activity 36
4 What drives these share price effects?
The evidence in the previous section shows that the initiation of corporate actions may have significant implications for the financial risks of market participants. The announcement of some of the corporate action types is likely to trigger increased return volatility and predictable trading activity patterns, as well as systematic movements of share prices. Some of these effects can also be observed on the other dates over the corporate action processing cycle (eg, record and ex dates). This section discusses the main factors that explain these share price and trading activity effects.
The effects of the corporate action types analysed in this study can be divided into two categories:
– direct effects on the cash flows of the firm; and – providing signals about the firm’s future cash flows.
In addition to the direct effects on firms’ cash flows, and providing signals about their current and future profitability, corporate actions can have further impacts on share prices and trading activity. These can include changes in trading costs in the secondary market, the clientele effect of investors, and transfer of wealth between equity and debt holders in the firm.
4.1 Corporate actions, cash flows and value of the firm
Corporate actions often affect firms’ operations and their financing structure. To the extent that these changes also affect the value of the firm, announcement of such corporate actions is likely to result in increased share price volatility and trading activity in secondary markets.
One example of a corporate action with clear implications for a firm’s cash flows is a takeover. Following the takeover, firms may alter their activities and financing structure, often resulting in cost and/or revenue synergies. For example, acquisitions can create synergies by:
– eliminating staff duplication; – combining facilities, allowing excess property and equipment to be sold; – creating economies of scale in purchasing, marketing and research development; and – reducing cost of capital.
On the day when an acquisition is announced, these implications for firms’ cash flows would be (partly) incorporated into the share prices. Although, over recent years, there has been considerable debate about the actual merits of mergers and acquisitions, empirical evidence suggests that, on average, they have a positive effect on the combined value of the two firms. For example, Andrade, Mitchell and Stafford (2001), studying a sample of US takeovers that took place between 1973 and 1998, found that over the three-day announcement window (–1d, +1d), the combined value of the firms increased by an average of 1.8%.6
6 Andrade, G., Mitchell, M. and Stafford, E. (2001), 'New Evidence and Perspectives on Mergers', Journal of Economic Perspectives,
15.
Oxera Share prices and trading activity 37
The value generated in the acquisitions does not, however, accrue symmetrically to the owners of the acquirer and target firm. In particular, takeovers, on average, result in a significant positive impact on the share value of the target companies, while the effect on the value of the acquirer is less clear. For example, in the same study, Andrade, Mitchell and Stafford (2001) showed that, on average, during the announcement window, target companies exhibit 16.0% abnormal returns, while acquirers exhibit only –0.7% abnormal returns.
The evidence documented in this current study confirms these results. In particular, for the sample of US takeovers, target companies have average announcement date returns of 7.44%. The analysis also demonstrates that this adjustment in share prices can be captured through the measure of share price volatility. In particular, on the day of announcement, the volatility of the targets’ shareholder returns is significantly higher than historical volatility before the tender offer is announced.
The effect of new information can also be captured by measuring trading activity in secondary markets. For example, Holthausen and Verrecchia (1990), have shown that public announcements can influence traders’ activity by altering their perception of the firm’s value, and that the magnitude of this effect is likely to depend on the degree of disagreement between the traders.7 Therefore, announcements of corporate actions are likely to increase trading activity relative to some period before the announcement, and the magnitude of this effect will depend on the information content of news and uncertainty associated with the interpretation of this information.
For example, if the given corporate action has only a minimal effect on the value of the firm, and this effect is relatively certain, there is likely to be only a minimal increase in trading activity on the day of announcement of the corporate action. At the same time, if the given corporate action has a potentially significant impact on the firm’s value, and there is clear disagreement among investors as to the significance of this event, there is likely to be a significant increase in trading activity around the announcement dates.
Other corporate action types analysed in this study might also affect firms’ cash flows. For example, Copeland, Lemgruber and Myers (1987) argue that spin-offs can increase the value of the firm through improved managerial incentives.8 At the same time, rights issues and exchange offers are likely to alter the firm’s financial structure, affecting its financing costs and potentially its business strategy.9 These corporate action events can therefore have a potentially significant impact on share prices and trading activity on different corporate action dates. The magnitude of the impact would depend on the degree to which these corporate actions alter the firms’ cash flows, and whether these events affect the value of firms through other channels (eg, by providing signals about future cash flows).
7 Holthausen, R. and Verrecchia, R. (1990), ‘The Effect of Informedness and Consensus on Price and Volume Behavior’, The Accounting Review, 65, 191–208. 8 Copeland, T.E., Lemgruber, E.F. and Myers, D. (1987) ‘Corporate Spinoffs: Multiple Announcement and Ex-Date Abnormal
Performance’, in T.E. Copeland (ed), Modern Finance and Industrial Economics, Basil Blackwell. 9 For example, gearing levels have an effect on managers’ incentives (as a result of changes in agency costs) and can therefore
alter managerial behaviour.

Oxera Share prices and trading activity 38
4.2 Providing signals about firms’ profitability
Over the years, academic literature has provided a considerable amount of evidence on the asymmetry of information held by the managers of the firm and its investors. In particular, managers are sometimes unable to (credibly) communicate information about the current and future profitability of the firm to the firm’s investors. Therefore, in general, managers have more extensive and better information about the current profitability and future prospects of the firm than its investors.
Ross (1977), Leland and Pyle (1977) and Luo, Brick and Frierman (2002), among others, have suggested that managers could use certain types of corporate action to reduce this asymmetry of information.10 For example, increases in a firm’s dividend payout can be considered a positive signal (since managers commit to higher fixed payments in the future). Similarly, in certain circumstances, increases in gearing can provide a signal about managers’ views on firms’ future cash flows.
At the same time, when new capital is raised, the market often interprets this as a negative signal about a firm’s potential and/or its current valuations. In a seminal paper, Myers and Majluf (1984) argued that asymmetry of information between managers and investors—ie, managers know more about the firm than outsiders—affects choice between internal and external capital, and debt and equity.11 In particular, the authors argued that firms’ investment should be first financed by internal finance, and only when all internally generated funds have been used up should external capital be raised. Moreover, when firms raise external capital, they should first raise debt and then equity.12 One important implication of this theory is that the issuing of new equity capital by firms is usually interpreted as a negative signal about its current and future profitability.
Therefore, in the context of this study, while corporate actions provide signals about the current and future profitability of firms, they can also result in considerable share price movements and changes in trading activity. For example, consistent with Myers and Majluf (1984), announcements of rights issues are likely to be interpreted as a negative signal about the firm’s profitability. Therefore, on average, such announcements are likely to be associated with negative share price reactions, increased volatility and trading activity. The results documented in this study confirm that the announcement of rights issues is, on average, associated with negative abnormal returns, increased return volatility and increased trading velocity.
4.3 Other effects
In addition to the direct impact on firms’ cash flows, and signalling about their current and future profitability, corporate actions can have further effects on share prices and trading activity. Examples of some of these effects are provided below.
10
Ross, S.A. (1977), ’The Determination of Financial Structure: The Incentive-Signalling Approach’, Bell Journal of Economics, 8:1, Spring, 23–40. Leland, H.E. and Pyle, D.H. (1977), 'Informational Asymmetries, Financial Structure, and Financial Intermediation', Journal of Finance, 32. Luo, G. Brick, I. and Frierman, M. (2002), ‘Strategic Decision Making of the Firm Under Asymmetric Information’, Review of Quantitative Finance and Accounting, 19:2, 213–35. 11
Myers, S. and Majluf, N. (1984), ‘Corporate Financing and Investment Decisions when Firms have Information that Investors do not have’, Journal of Financial Economics, 13. 12
Myers and Majluf explain this pecking order by the signalling properties of different forms of capital. For example, they show that the most negative signal is provided by new equity issues, whereby the issue of new equity capital is interpreted as a signal that current market valuations exceed the actual value (or valuation based on the managers' information set).

Oxera Share prices and trading activity 39
One example is the link between the nominal value of stock and trading costs in the secondary market. In particular, forward stock splits can alter trading costs in two ways. On the one hand, forward stock splits reduce the nominal value of shares, thereby potentially making trading more accessible to retail investors. On the other hand, an increase in the total number of shares could have an adverse impact on direct trading costs (eg, exchange fees) incurred by investors in the secondary markets.
At the same time, corporate actions can affect the value of the firm and the level of trading activity in secondary markets through the clientele effect. For example, a firm that is spun off might become too small for some investor classes (eg, large institutional investors). As these investors rebalance their portfolios following the ex date of the spin-off, trading activity in the stock is likely to increase.
Finally, there is some evidence that certain corporate actions alter the equity value of the firm by transferring value from debt to equity holders. For example, Galai and Masulis (1976) argued that the main source of positive abnormal shareholder returns following spin-offs is associated with the wealth transfer from bondholders to shareholders. However, the empirical evidence supporting this hypothesis is mixed.13
13
Galai, D. and Masulis, R. (1976), ‘The Option Pricing Model and the Risk Factor of Stock’, Journal of Financial Economics, 3.
Oxera Share prices and trading activity 40
5 Summary and main conclusions
The evidence presented in this report suggests that the corporate action processing cycle can cause a significant impact on share prices and trading activity patterns. In particular, the analysis suggests that critical corporate action processing dates (eg, the announcement date, record date and ex date) often result in significant alterations in share prices and trading activity relative to the period before the start of the corporate action processing cycle.
A number of conclusions emerge from the analysis.
– This evidence shows that corporate actions have potentially strong effects on share prices and trading activity, although the effects depend on the type of corporate action and particular point in the corporate action processing cycle.
– From the corporate action types analysed in this study, takeovers, spin-offs, stock splits and rights issues appear to have the strongest effects, while exchange offers have only a limited impact.
– In general, the strongest effect is observed on the date when the corporate action is announced, although record dates and ex dates are also often associated with a significant increase in share price volatility and trading activity.
– The effect of corporate actions on share prices and trading activity does not appear to be limited to the USA. The analysis of rights issues based on a sample of firms from the USA, Europe and Asia yields significant share price and trading activity effects during the rights issues processing cycle.
Overall, this evidence demonstrates that corporate actions could have significant effects on share prices and trading activity of stocks, and—potentially most importantly—that these effects often emerge in a predictable manner around critical corporate action processing dates. These findings are consistent with the notion that corporate actions provide explicit or implicit new information about the future profitability and risk of companies, as well as resulting in indirect changes (eg, through changes in trading costs) in the attractiveness of firms. It also supports the conclusion that making available to the front office timely, accurate data on even routine corporate actions can help improve trading decisions and strategies made by a firm’s trading desk.
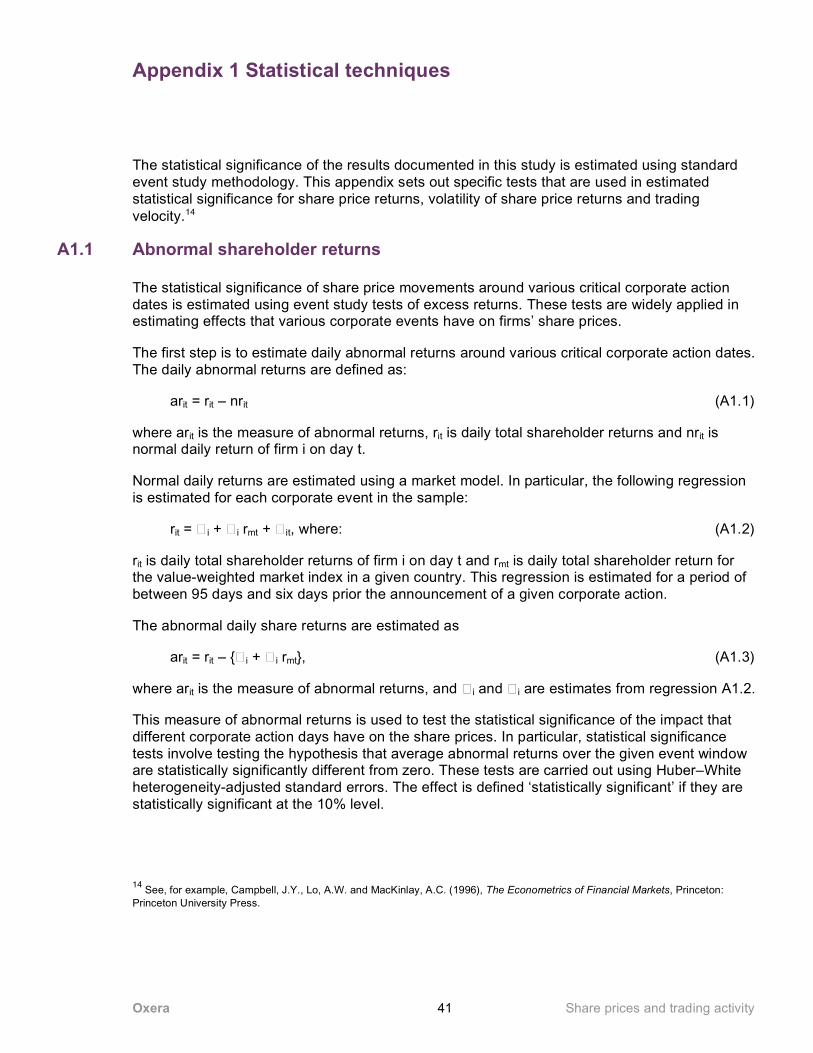
Oxera Share prices and trading activity 41
Appendix 1 Statistical techniques
The statistical significance of the results documented in this study is estimated using standard event study methodology. This appendix sets out specific tests that are used in estimated statistical significance for share price returns, volatility of share price returns and trading velocity.14
A1.1 Abnormal shareholder returns
The statistical significance of share price movements around various critical corporate action dates is estimated using event study tests of excess returns. These tests are widely applied in estimating effects that various corporate events have on firms’ share prices.
The first step is to estimate daily abnormal returns around various critical corporate action dates. The daily abnormal returns are defined as:
arit = rit – nrit (A1.1)
where arit is the measure of abnormal returns, rit is daily total shareholder returns and nrit is normal daily return of firm i on day t.
Normal daily returns are estimated using a market model. In particular, the following regression is estimated for each corporate event in the sample:
rit = � i + � i rmt + � it, where: (A1.2)
rit is daily total shareholder returns of firm i on day t and rmt is daily total shareholder return for the value-weighted market index in a given country. This regression is estimated for a period of between 95 days and six days prior the announcement of a given corporate action.
The abnormal daily share returns are estimated as
arit = rit – {� i + � i rmt}, (A1.3)
where arit is the measure of abnormal returns, and � i and � i are estimates from regression A1.2.
This measure of abnormal returns is used to test the statistical significance of the impact that different corporate action days have on the share prices. In particular, statistical significance tests involve testing the hypothesis that average abnormal returns over the given event window are statistically significantly different from zero. These tests are carried out using Huber–White heterogeneity-adjusted standard errors. The effect is defined ‘statistically significant’ if they are statistically significant at the 10% level.
14
See, for example, Campbell, J.Y., Lo, A.W. and MacKinlay, A.C. (1996), The Econometrics of Financial Markets, Princeton: Princeton University Press.
Oxera Share prices and trading activity 42
A1.2 Abnormal return variance
The statistical significance of changes in share price variability associated with given corporate actions is estimated using a measure of abnormal return variance.
Abnormal variance is estimated as a ratio between average squared abnormal returns in the event window and variance of abnormal returns over a window from 95 days to six days prior to the announcement date.15 The first step is to estimate a series of abnormal returns using the approach set out in section A1.1. The variance of daily abnormal returns is then defined as follows.
avarit = uit2/� it
2 (A1.4)
where avarit is variance of daily abnormal returns; uit is daily abnormal returns of stock i on day t; � it
2 is variance of daily abnormal returns over a period of 95 days to six days prior the announcement date (ie, the market model estimation period).
This measure of changes in variability in share price returns is used to assess the impact of various corporate action dates. In particular, the impact of corporate action dates is tested by considering whether the avar measure is statistically significantly different from 1. These tests are carried out using Huber–White heterogeneity-adjusted standard errors. The effect is defined ‘statistically significant’ if they are statistically significant at the 10% level.
A1.3 Abnormal trading velocity
The statistical significance of changes in trading activity associated with given corporate actions is estimated using a measure of abnormal daily trading velocity.
Abnormal velocity is estimated as the difference between actual velocity and ‘normal’ velocity.16 The first step is to estimate the following regression over a period from 95 days to six days before the announcement date:
velit = � i + bi velmt + � it (A1.5)
where velit is the velocity of firm i on day t, and velmt is the value-weighted velocity of the market index in a given country on day t.
Abnormal daily velocity during this corporate action window is then estimated as:
avelit = velit – {� i + � i velmt} (A1.6)
where avelit is the measure of abnormal daily trading velocity, and � i and � i are coefficient estimates from regression A1.5.
The statistical significance tests involve testing the hypothesis that average abnormal trading velocity over the given event window is statistically significantly different from zero. These tests
15 A similar approach is used by Landsman, W. and Maydew E. (2001), ‘Beaver (1968) Revisited: Has the Information Content of Quarterly Earnings Announcements Declined in the Past Three Decades?’, working paper, University of North Carolina. 16
A similar approach is used by Choi, W. and Kim, J. (2001), ‘Underreaction, Trading Volume, and Post-earnings Announcement Drift’, working paper, Harvard University.

Oxera Share prices and trading activity 43
are carried out using Huber-White heterogeneity-adjusted standard errors. Again, the effect is defined ‘statistically significant’ if they are statistically significant at the 10% level.
Oxera Share prices and trading activity 44
Appendix 2 Announcement date analysis
This appendix documents daily observations of share price returns, share price returns volatility, and trading velocity for a period of 30 days following corporate action announcements. These estimates are based on a balanced sample of firms that have return observations for every day in the 30-day period following the announcement date.
Table A2.1 reports the difference between average daily and historical share price returns. Table A2.2 reports the ratio of average daily absolute share price returns and historical average daily absolute returns. Table A2.3 reports ratio of average daily velocity and historical average daily velocity.
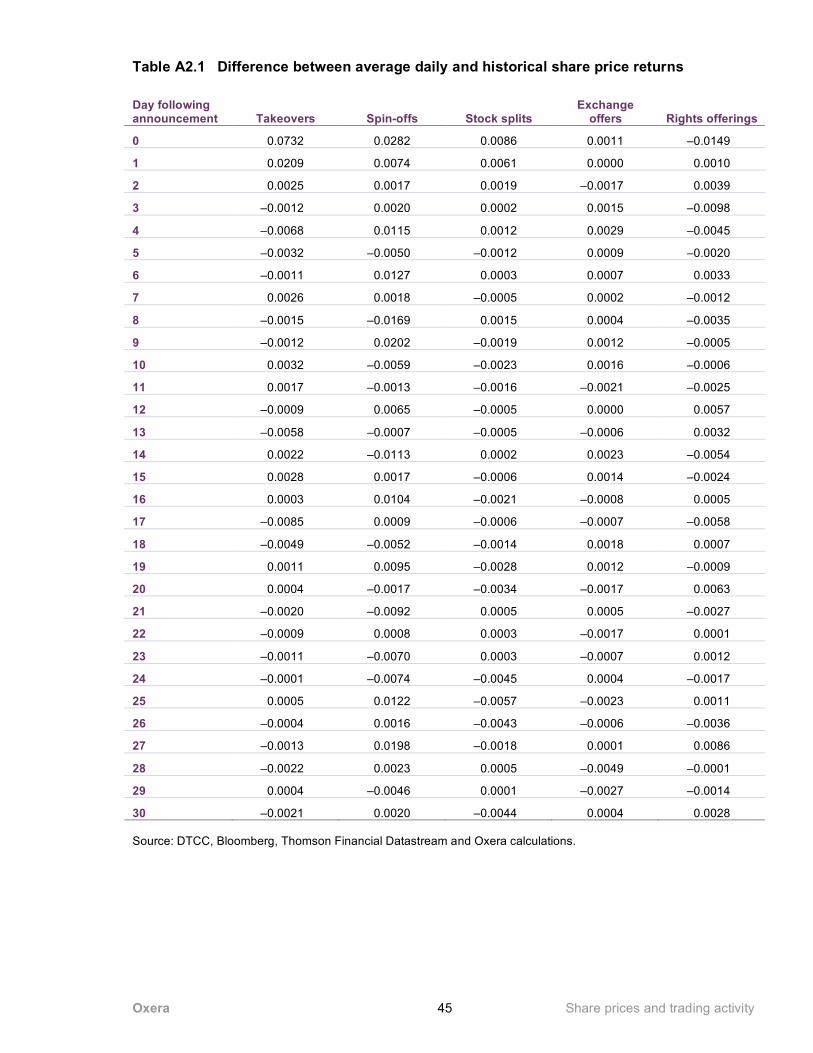
Oxera Share prices and trading activity 45
Table A2.1 Difference between average daily and historical share price returns
Day following announcement Takeovers Spin-offs Stock splits
Exchange offers Rights offerings
0 0.0732 0.0282 0.0086 0.0011 –0.0149
1 0.0209 0.0074 0.0061 0.0000 0.0010
2 0.0025 0.0017 0.0019 –0.0017 0.0039
3 –0.0012 0.0020 0.0002 0.0015 –0.0098
4 –0.0068 0.0115 0.0012 0.0029 –0.0045
5 –0.0032 –0.0050 –0.0012 0.0009 –0.0020
6 –0.0011 0.0127 0.0003 0.0007 0.0033
7 0.0026 0.0018 –0.0005 0.0002 –0.0012
8 –0.0015 –0.0169 0.0015 0.0004 –0.0035
9 –0.0012 0.0202 –0.0019 0.0012 –0.0005
10 0.0032 –0.0059 –0.0023 0.0016 –0.0006
11 0.0017 –0.0013 –0.0016 –0.0021 –0.0025
12 –0.0009 0.0065 –0.0005 0.0000 0.0057
13 –0.0058 –0.0007 –0.0005 –0.0006 0.0032
14 0.0022 –0.0113 0.0002 0.0023 –0.0054
15 0.0028 0.0017 –0.0006 0.0014 –0.0024
16 0.0003 0.0104 –0.0021 –0.0008 0.0005
17 –0.0085 0.0009 –0.0006 –0.0007 –0.0058
18 –0.0049 –0.0052 –0.0014 0.0018 0.0007
19 0.0011 0.0095 –0.0028 0.0012 –0.0009
20 0.0004 –0.0017 –0.0034 –0.0017 0.0063
21 –0.0020 –0.0092 0.0005 0.0005 –0.0027
22 –0.0009 0.0008 0.0003 –0.0017 0.0001
23 –0.0011 –0.0070 0.0003 –0.0007 0.0012
24 –0.0001 –0.0074 –0.0045 0.0004 –0.0017
25 0.0005 0.0122 –0.0057 –0.0023 0.0011
26 –0.0004 0.0016 –0.0043 –0.0006 –0.0036
27 –0.0013 0.0198 –0.0018 0.0001 0.0086
28 –0.0022 0.0023 0.0005 –0.0049 –0.0001
29 0.0004 –0.0046 0.0001 –0.0027 –0.0014
30 –0.0021 0.0020 –0.0044 0.0004 0.0028 Source: DTCC, Bloomberg, Thomson Financial Datastream and Oxera calculations.
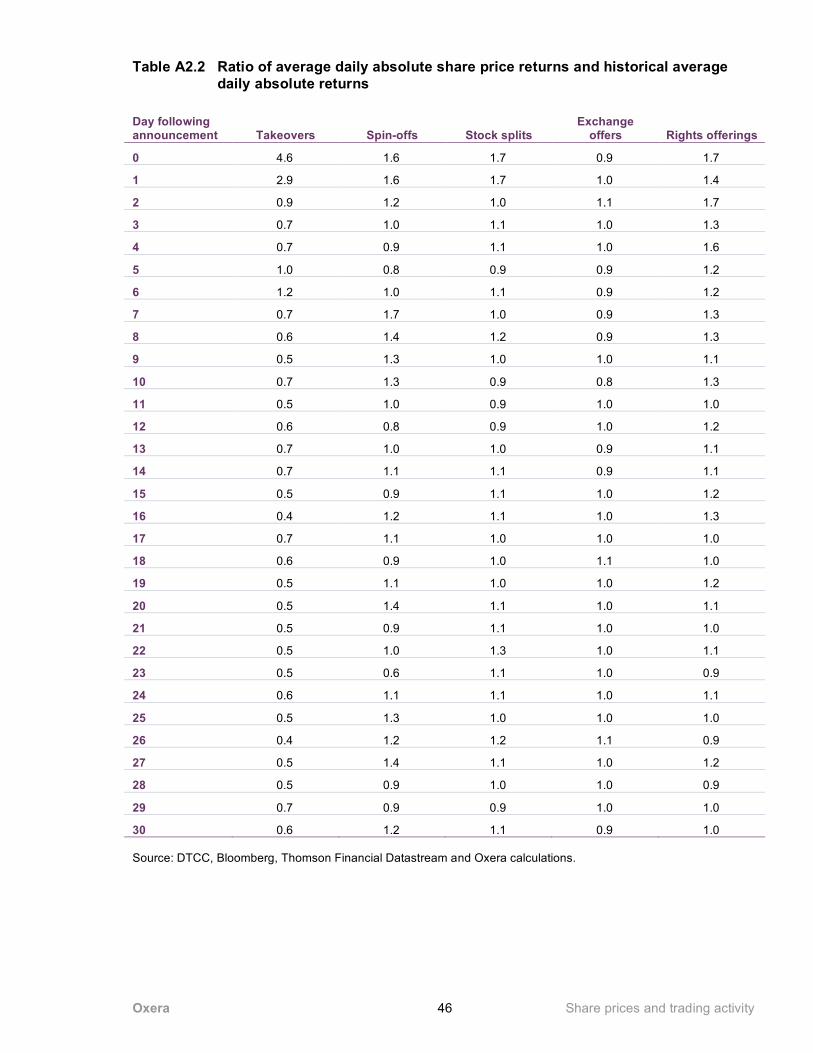
Oxera Share prices and trading activity 46
Table A2.2 Ratio of average daily absolute share price returns and historical average daily absolute returns
Day following announcement Takeovers Spin-offs Stock splits
Exchange offers Rights offerings
0 4.6 1.6 1.7 0.9 1.7
1 2.9 1.6 1.7 1.0 1.4
2 0.9 1.2 1.0 1.1 1.7
3 0.7 1.0 1.1 1.0 1.3
4 0.7 0.9 1.1 1.0 1.6
5 1.0 0.8 0.9 0.9 1.2
6 1.2 1.0 1.1 0.9 1.2
7 0.7 1.7 1.0 0.9 1.3
8 0.6 1.4 1.2 0.9 1.3
9 0.5 1.3 1.0 1.0 1.1
10 0.7 1.3 0.9 0.8 1.3
11 0.5 1.0 0.9 1.0 1.0
12 0.6 0.8 0.9 1.0 1.2
13 0.7 1.0 1.0 0.9 1.1
14 0.7 1.1 1.1 0.9 1.1
15 0.5 0.9 1.1 1.0 1.2
16 0.4 1.2 1.1 1.0 1.3
17 0.7 1.1 1.0 1.0 1.0
18 0.6 0.9 1.0 1.1 1.0
19 0.5 1.1 1.0 1.0 1.2
20 0.5 1.4 1.1 1.0 1.1
21 0.5 0.9 1.1 1.0 1.0
22 0.5 1.0 1.3 1.0 1.1
23 0.5 0.6 1.1 1.0 0.9
24 0.6 1.1 1.1 1.0 1.1
25 0.5 1.3 1.0 1.0 1.0
26 0.4 1.2 1.2 1.1 0.9
27 0.5 1.4 1.1 1.0 1.2
28 0.5 0.9 1.0 1.0 0.9
29 0.7 0.9 0.9 1.0 1.0
30 0.6 1.2 1.1 0.9 1.0 Source: DTCC, Bloomberg, Thomson Financial Datastream and Oxera calculations.
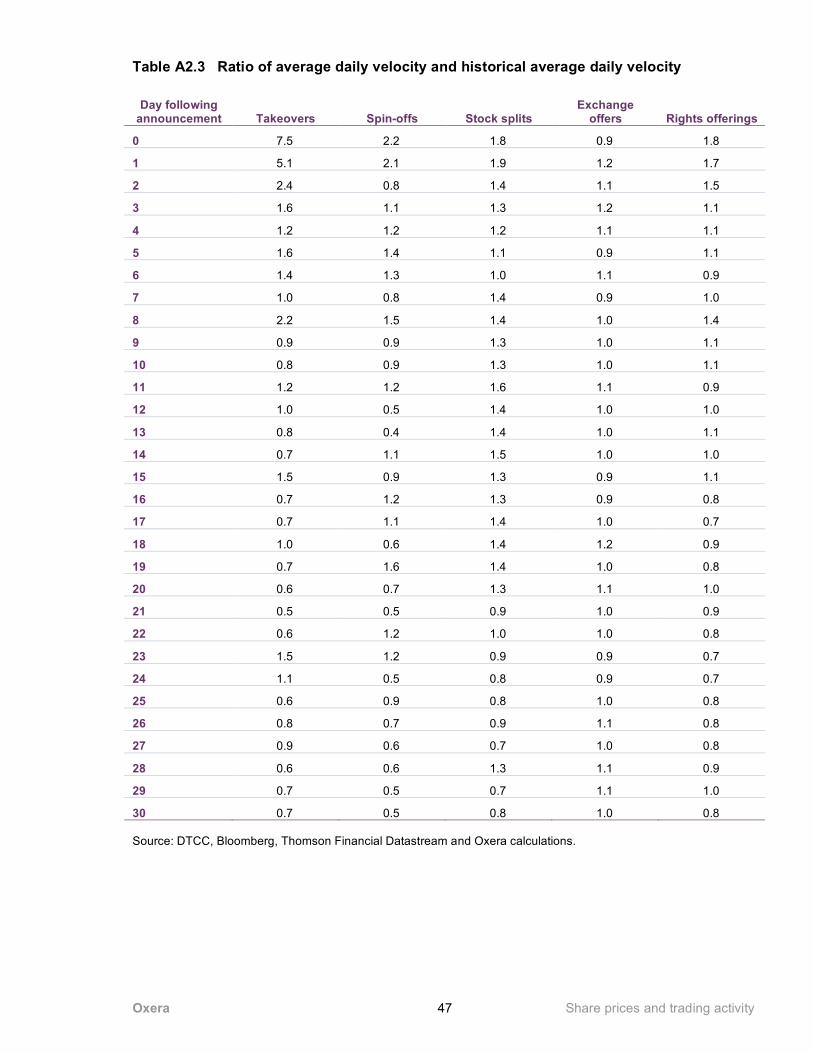
Oxera Share prices and trading activity 47
Table A2.3 Ratio of average daily velocity and historical average daily velocity
Day following announcement Takeovers Spin-offs Stock splits
Exchange offers Rights offerings
0 7.5 2.2 1.8 0.9 1.8
1 5.1 2.1 1.9 1.2 1.7
2 2.4 0.8 1.4 1.1 1.5
3 1.6 1.1 1.3 1.2 1.1
4 1.2 1.2 1.2 1.1 1.1
5 1.6 1.4 1.1 0.9 1.1
6 1.4 1.3 1.0 1.1 0.9
7 1.0 0.8 1.4 0.9 1.0
8 2.2 1.5 1.4 1.0 1.4
9 0.9 0.9 1.3 1.0 1.1
10 0.8 0.9 1.3 1.0 1.1
11 1.2 1.2 1.6 1.1 0.9
12 1.0 0.5 1.4 1.0 1.0
13 0.8 0.4 1.4 1.0 1.1
14 0.7 1.1 1.5 1.0 1.0
15 1.5 0.9 1.3 0.9 1.1
16 0.7 1.2 1.3 0.9 0.8
17 0.7 1.1 1.4 1.0 0.7
18 1.0 0.6 1.4 1.2 0.9
19 0.7 1.6 1.4 1.0 0.8
20 0.6 0.7 1.3 1.1 1.0
21 0.5 0.5 0.9 1.0 0.9
22 0.6 1.2 1.0 1.0 0.8
23 1.5 1.2 0.9 0.9 0.7
24 1.1 0.5 0.8 0.9 0.7
25 0.6 0.9 0.8 1.0 0.8
26 0.8 0.7 0.9 1.1 0.8
27 0.9 0.6 0.7 1.0 0.8
28 0.6 0.6 1.3 1.1 0.9
29 0.7 0.5 0.7 1.1 1.0
30 0.7 0.5 0.8 1.0 0.8 Source: DTCC, Bloomberg, Thomson Financial Datastream and Oxera calculations.

Oxera Park Central 40/41 Park End Street Oxford OX1 1JD United Kingdom Tel: +44 (0) 1865 253 000 Fax: +44 (0) 1865 251 172 www. oxera .com
Oxera Park Central 40/41 Park End Street Oxford OX1 1JD United Kingdom Tel: +44 (0) 1865 253 000 Fax: +44 (0) 1865 251 172 www. oxera .com