Embed Size (px)
Citation preview
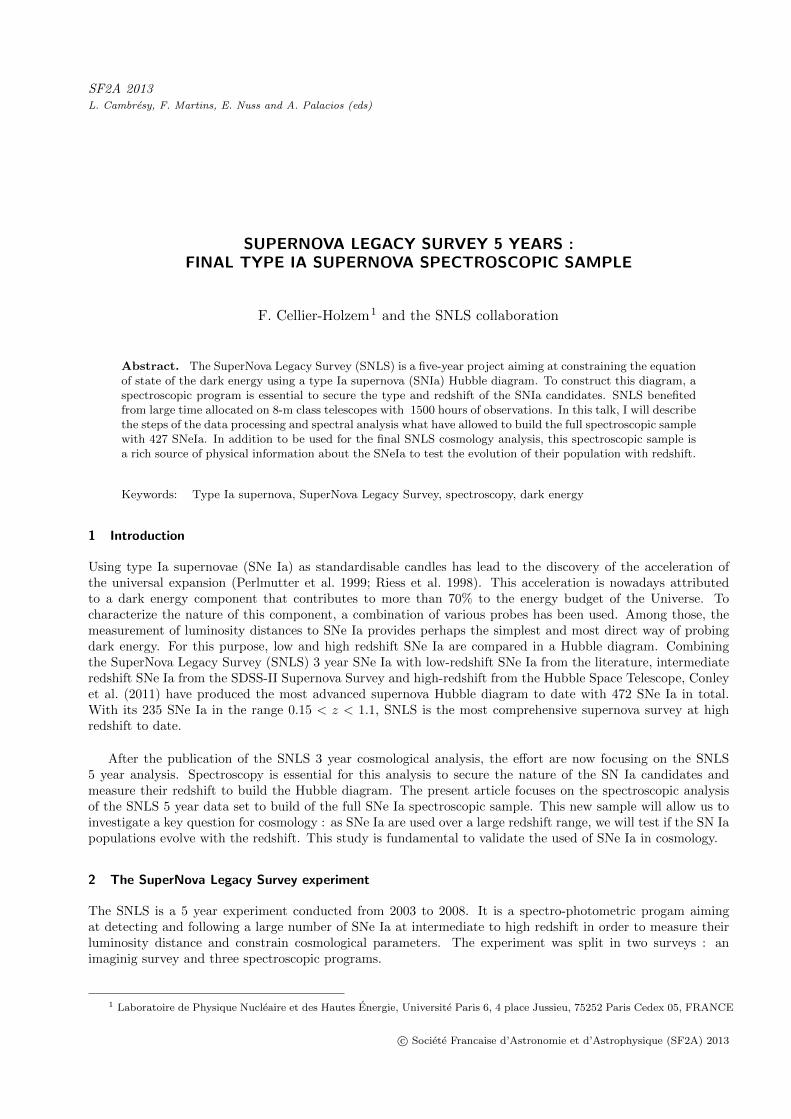
SF2A 2013L. Cambresy, F. Martins, E. Nuss and A. Palacios (eds)
SUPERNOVA LEGACY SURVEY 5 YEARS :FINAL TYPE IA SUPERNOVA SPECTROSCOPIC SAMPLE
F. Cellier-Holzem1 and the SNLS collaboration
Abstract. The SuperNova Legacy Survey (SNLS) is a five-year project aiming at constraining the equationof state of the dark energy using a type Ia supernova (SNIa) Hubble diagram. To construct this diagram, aspectroscopic program is essential to secure the type and redshift of the SNIa candidates. SNLS benefitedfrom large time allocated on 8-m class telescopes with 1500 hours of observations. In this talk, I will describethe steps of the data processing and spectral analysis what have allowed to build the full spectroscopic samplewith 427 SNeIa. In addition to be used for the final SNLS cosmology analysis, this spectroscopic sample isa rich source of physical information about the SNeIa to test the evolution of their population with redshift.
Keywords: Type Ia supernova, SuperNova Legacy Survey, spectroscopy, dark energy
1 Introduction
Using type Ia supernovae (SNe Ia) as standardisable candles has lead to the discovery of the acceleration ofthe universal expansion (Perlmutter et al. 1999; Riess et al. 1998). This acceleration is nowadays attributedto a dark energy component that contributes to more than 70% to the energy budget of the Universe. Tocharacterize the nature of this component, a combination of various probes has been used. Among those, themeasurement of luminosity distances to SNe Ia provides perhaps the simplest and most direct way of probingdark energy. For this purpose, low and high redshift SNe Ia are compared in a Hubble diagram. Combiningthe SuperNova Legacy Survey (SNLS) 3 year SNe Ia with low-redshift SNe Ia from the literature, intermediateredshift SNe Ia from the SDSS-II Supernova Survey and high-redshift from the Hubble Space Telescope, Conleyet al. (2011) have produced the most advanced supernova Hubble diagram to date with 472 SNe Ia in total.With its 235 SNe Ia in the range 0.15 < z < 1.1, SNLS is the most comprehensive supernova survey at highredshift to date.
After the publication of the SNLS 3 year cosmological analysis, the effort are now focusing on the SNLS5 year analysis. Spectroscopy is essential for this analysis to secure the nature of the SN Ia candidates andmeasure their redshift to build the Hubble diagram. The present article focuses on the spectroscopic analysisof the SNLS 5 year data set to build of the full SNe Ia spectroscopic sample. This new sample will allow us toinvestigate a key question for cosmology : as SNe Ia are used over a large redshift range, we will test if the SN Iapopulations evolve with the redshift. This study is fundamental to validate the used of SNe Ia in cosmology.
2 The SuperNova Legacy Survey experiment
The SNLS is a 5 year experiment conducted from 2003 to 2008. It is a spectro-photometric progam aimingat detecting and following a large number of SNe Ia at intermediate to high redshift in order to measure theirluminosity distance and constrain cosmological parameters. The experiment was split in two surveys : animaginig survey and three spectroscopic programs.
1 Laboratoire de Physique Nucleaire et des Hautes Energie, Universite Paris 6, 4 place Jussieu, 75252 Paris Cedex 05, FRANCE
c© Societe Francaise d’Astronomie et d’Astrophysique (SF2A) 2013
320 SF2A 2013
2.1 The imaging survey
A photometric program at the Canada-France-Hawaii Telescope implemented a rolling search technics thatallowed for the detection of new SN Ia candidates as well as the follow-up of their light curves in severalphotometric bands. The objects are detected in four 1 square degree field observed every 3-5 nights during 5-6lunations per years. During the survey, more than 1000 SNe Ia candidates with well sampled multi-bands lightcurves have been optained (Guy et al. 2010).
2.2 The spectroscopic programs
To assess the type of the candidates and estimates their redshift, spectroscopic follow-up programs have beenperformed on three 8-10m class telescopes : the Very Large Telescope (VLT), Gemini-North & South and Keck I& II. SNLS benefited from 1500h of observation on these telescopes and spectra have been measured for aroundhalf of photometric SN Ia candidates :
• 35% of the SNe Ia have been measured by the Gemini telescopes (Howell et al. 2005; Bronder et al. 2008;Walker et al. 2011) where SNLS benefited from 60 hours of observation per semester during 5 years.Gemini observed preferentially high redshift candidates (z > 0.6) in the four SNLS fields,
• the VLT measured 45% of the SNe Ia (Balland et al. 2009; Cellier-Holzem & the SNLS collaborationin prep) during two ESO large programs, corresponding to 60 hours per semester from June 2003 toSeptember 2007. The VLT is a southern telescope and thus observed preferentially the equatorial SNLSfields.
• the remainder of the candidates were sent to the Keck telescopes, in particular the objects of the highlatitude fields and candidates with a redshift around 0.5 for dedicated studies. These telescopes measuredaround 20% of the SNe I (Ellis et al. 2008; Fakhouri & SNLS collaboration in prep).
3 Building the final spectroscopic sample of SNLS
3.1 Redshift estimates
The first step to build the full spectroscopic sample is the redshift estimates of the SN Ia candidates. Redshiftsare estimated from strong host features if present (e.g. [O II] at 3727A or Hβ at 4861A emmission lines orCa II H&K at 3934A and 3968A absorption lines). To estimates the redshift, we perform a gaussian fit ofeach identified host feature. We assign an error of 0.001 on the redshift, typical of the uncertainty obtained onredshift derived from host lines.
If no apparent host line is present, the redshift is estimated from the supernova features themselves. Firsta rough estimate is inferred from one of the large absorption line of the supernova (e.g. Ca II around 3700A orSi II at 4000A). To refine the redshift, we performed a combined fit of the observed light curves and spectrumwith the spectro-photometric model of SN Ia, SALT2 (Guy et al. 2007). A galaxy template representing thehost contribution is added to the model to take into account the host contamination and recover the SN Iasignal. As the supernova feature are larger than the host lines, we assign a higher error of 0.01 on the supernovaredshift.
3.2 SNe Ia identification
The second aim of the spectroscopy is the SN Ia identification to include only SNe Ia to the Hubble diagram.To assess the nature of the candidates, we inspect the SALT2 fit of the spectrum after the host subtraction. Ifat least one typical features of SN Ia is seen (e.g. Si II at 4000A or 6150A), or if the spectral fit is good over theentire spectral range, the object is certainly a SN Ia. For some cases, the candidate is likely a SN Ia but othertypes can not be excluded given the signal-to-noize and the quality of the SALT2 fit : we classify these objectsas SN Ia?. To not contaminate the SN Ia sample with other types, only SNe Ia and SNe Ia? (which represent70% of candidates) are considered for inclusion in the Hubble diagram. The objects where a supernova signalis not clearly visible, or with a not SN Ia spectrum are excluded.
Short title here 321
3.3 Results : full spectroscopic sample
The final spectroscopic sample of SNLS contains 427 objects, with 76% of SNe Ia and 24% of SNe Ia?. TheseSNe Ia and SNe Ia? subsamples have very similar photometric properties (color, stretch and absolute magnitudeat maximum in B-band) on average, which suggest that the SNe Ia? sample is not contaminated by non-Ia-objects with respect to the SN Ia sample.
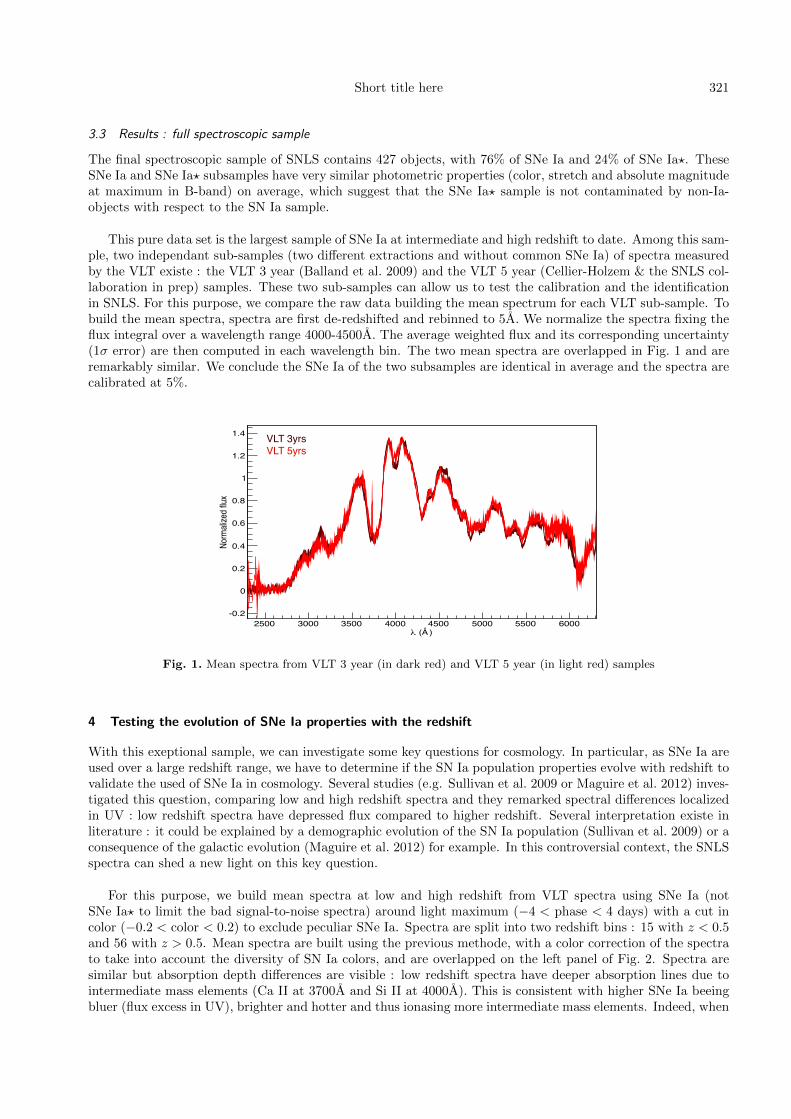
This pure data set is the largest sample of SNe Ia at intermediate and high redshift to date. Among this sam-ple, two independant sub-samples (two different extractions and without common SNe Ia) of spectra measuredby the VLT existe : the VLT 3 year (Balland et al. 2009) and the VLT 5 year (Cellier-Holzem & the SNLS col-laboration in prep) samples. These two sub-samples can allow us to test the calibration and the identificationin SNLS. For this purpose, we compare the raw data building the mean spectrum for each VLT sub-sample. Tobuild the mean spectra, spectra are first de-redshifted and rebinned to 5A. We normalize the spectra fixing theflux integral over a wavelength range 4000-4500A. The average weighted flux and its corresponding uncertainty(1σ error) are then computed in each wavelength bin. The two mean spectra are overlapped in Fig. 1 and areremarkably similar. We conclude the SNe Ia of the two subsamples are identical in average and the spectra arecalibrated at 5%.
)Å (2500 3000 3500 4000 4500 5000 5500 6000
Norm
alize
d flux
-0.2
0
0.2
0.4
0.6
0.8
1
1.2
1.4 VLT 3yrs VLT 5yrs
9
Comparison of the 3yrs and 5yrs VLT samples
Flora CELLIER-HOLZEM - XXVth Rencontres de Blois 2013-05-29
• VLT samples : 2 independant sub-samples with 2 different extractions and without common SN Ia
! mean spectra of the 2 independent samples are remarkably similar
! VLT 3yrs (Balland et al. 2009) ! VLT 5yrs (Cellier-Holzem et al. in prep)
• Compare the raw data :
! Spectra are de-redshifted + rebinned to 5Å! Normalisation : same flux integral over 4000-4500Å! Average weighted flux + dispersion in each bin! Error : 1σ confidence level
build mean spectrum for the 2 sub-samples (only SNe Ia)
↳ SNe Ia of the 2 sub-samples are identical in average
↳ ~5% calibration between the 2 spectral sub-sample
Fig. 1. Mean spectra from VLT 3 year (in dark red) and VLT 5 year (in light red) samples
4 Testing the evolution of SNe Ia properties with the redshift
With this exeptional sample, we can investigate some key questions for cosmology. In particular, as SNe Ia areused over a large redshift range, we have to determine if the SN Ia population properties evolve with redshift tovalidate the used of SNe Ia in cosmology. Several studies (e.g. Sullivan et al. 2009 or Maguire et al. 2012) inves-tigated this question, comparing low and high redshift spectra and they remarked spectral differences localizedin UV : low redshift spectra have depressed flux compared to higher redshift. Several interpretation existe inliterature : it could be explained by a demographic evolution of the SN Ia population (Sullivan et al. 2009) or aconsequence of the galactic evolution (Maguire et al. 2012) for example. In this controversial context, the SNLSspectra can shed a new light on this key question.
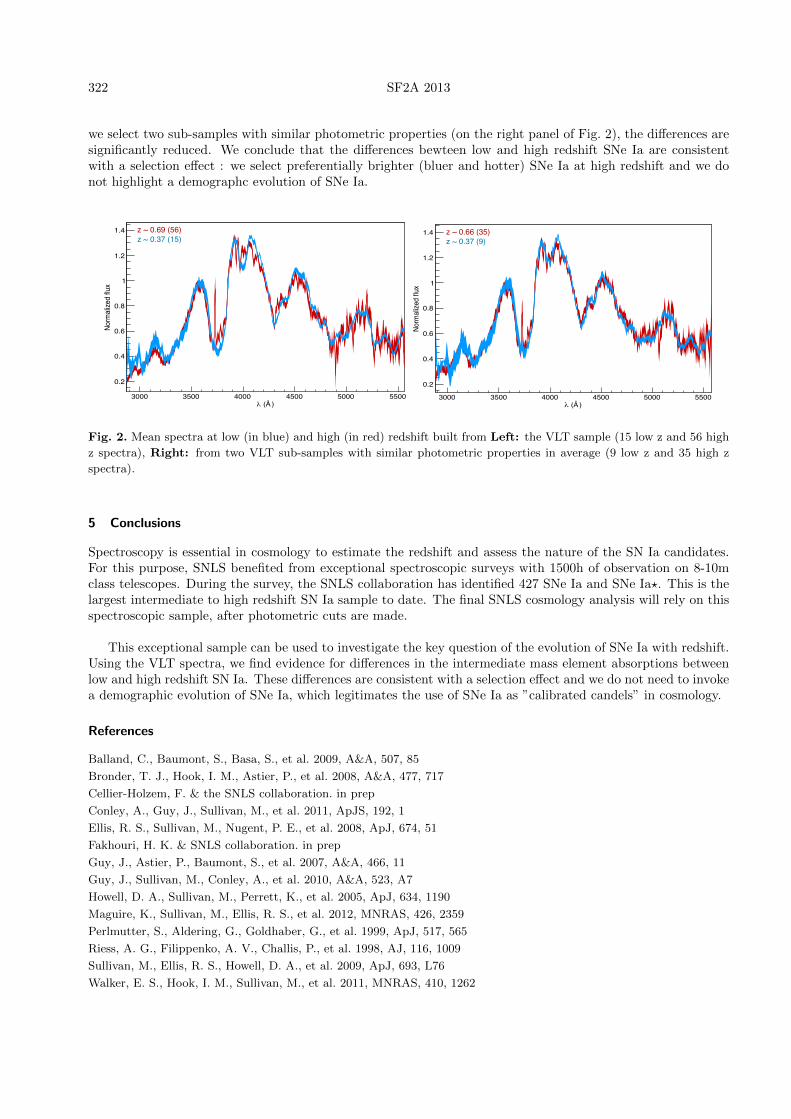
For this purpose, we build mean spectra at low and high redshift from VLT spectra using SNe Ia (notSNe Ia? to limit the bad signal-to-noise spectra) around light maximum (−4 < phase < 4 days) with a cut incolor (−0.2 < color < 0.2) to exclude peculiar SNe Ia. Spectra are split into two redshift bins : 15 with z < 0.5and 56 with z > 0.5. Mean spectra are built using the previous methode, with a color correction of the spectrato take into account the diversity of SN Ia colors, and are overlapped on the left panel of Fig. 2. Spectra aresimilar but absorption depth differences are visible : low redshift spectra have deeper absorption lines due tointermediate mass elements (Ca II at 3700A and Si II at 4000A). This is consistent with higher SNe Ia beeingbluer (flux excess in UV), brighter and hotter and thus ionasing more intermediate mass elements. Indeed, when
322 SF2A 2013
we select two sub-samples with similar photometric properties (on the right panel of Fig. 2), the differences aresignificantly reduced. We conclude that the differences bewteen low and high redshift SNe Ia are consistentwith a selection effect : we select preferentially brighter (bluer and hotter) SNe Ia at high redshift and we donot highlight a demographc evolution of SNe Ia.
)Å (3000 3500 4000 4500 5000 5500
Norm
alize
d flu
x
0.2
0.4
0.6
0.8
1
1.2
1.4
12
Is there evolution ?
Flora CELLIER-HOLZEM - XXVth Rencontres de Blois 2013-05-29
! Spectral differences :
z ~ 0.69 (56) z ~ 0.37 (15)
↳ Low z spectra : deeper absorption features due to intermediate mass elements (Ca II, Si II)
↳ Consistent with higher z SNeIa beeing bluer, brighter and hotter thus ionising more IMEs
↳ Differences are significantly reduced
↳ Consistent with a selection effect : selecting brighter (bluer and hotter) SNe Ia at higher z
)Å (3000 3500 4000 4500 5000 5500
Norm
alize
d flu
x
0.2
0.4
0.6
0.8
1
1.2
1.4
13
Is there evolution ?
Flora CELLIER-HOLZEM - XXVth Rencontres de Blois 2013-05-29
! Compare comparable SNe Ia : select 2 sub-samples with same distributions of photometric properties
z ~ 0.66 (35) z ~ 0.37 (9)
! We do not need to invoke a demographic evolution of SNe Ia (but it could be exist)
Fig. 2. Mean spectra at low (in blue) and high (in red) redshift built from Left: the VLT sample (15 low z and 56 high
z spectra), Right: from two VLT sub-samples with similar photometric properties in average (9 low z and 35 high z
spectra).
5 Conclusions
Spectroscopy is essential in cosmology to estimate the redshift and assess the nature of the SN Ia candidates.For this purpose, SNLS benefited from exceptional spectroscopic surveys with 1500h of observation on 8-10mclass telescopes. During the survey, the SNLS collaboration has identified 427 SNe Ia and SNe Ia?. This is thelargest intermediate to high redshift SN Ia sample to date. The final SNLS cosmology analysis will rely on thisspectroscopic sample, after photometric cuts are made.
This exceptional sample can be used to investigate the key question of the evolution of SNe Ia with redshift.Using the VLT spectra, we find evidence for differences in the intermediate mass element absorptions betweenlow and high redshift SN Ia. These differences are consistent with a selection effect and we do not need to invokea demographic evolution of SNe Ia, which legitimates the use of SNe Ia as ”calibrated candels” in cosmology.
References
Balland, C., Baumont, S., Basa, S., et al. 2009, A&A, 507, 85
Bronder, T. J., Hook, I. M., Astier, P., et al. 2008, A&A, 477, 717
Cellier-Holzem, F. & the SNLS collaboration. in prep
Conley, A., Guy, J., Sullivan, M., et al. 2011, ApJS, 192, 1
Ellis, R. S., Sullivan, M., Nugent, P. E., et al. 2008, ApJ, 674, 51
Fakhouri, H. K. & SNLS collaboration. in prep
Guy, J., Astier, P., Baumont, S., et al. 2007, A&A, 466, 11
Guy, J., Sullivan, M., Conley, A., et al. 2010, A&A, 523, A7
Howell, D. A., Sullivan, M., Perrett, K., et al. 2005, ApJ, 634, 1190
Maguire, K., Sullivan, M., Ellis, R. S., et al. 2012, MNRAS, 426, 2359
Perlmutter, S., Aldering, G., Goldhaber, G., et al. 1999, ApJ, 517, 565
Riess, A. G., Filippenko, A. V., Challis, P., et al. 1998, AJ, 116, 1009
Sullivan, M., Ellis, R. S., Howell, D. A., et al. 2009, ApJ, 693, L76
Walker, E. S., Hook, I. M., Sullivan, M., et al. 2011, MNRAS, 410, 1262