Embed Size (px)
Citation preview
DOT/FAA/AR-10/22 Air Traffic Organization NextGen & Operations Planning Office of Research and Technology Development Washington, DC 20591
Explicit Finite Element Modeling of Multilayer Composite Fabric for Gas Turbine Engine Containment Systems, Phase II Update to Part 3: Material Model Development and Simulation Experiments October 2010 Final Report This document is available to the U.S. public through the National Technical Information Services (NTIS), Springfield, Virginia 22161. This document is also available from the Federal Aviation Administration William J. Hughes Technical Center at actlibrary.tc.faa.gov.
U.S. Department of Transportation Federal Aviation Administration
NOTICE
This document is disseminated under the sponsorship of the U.S. Department of Transportation in the interest of information exchange. The United States Government assumes no liability for the contents or use thereof. The United States Government does not endorse products or manufacturers. Trade or manufacturer's names appear herein solely because they are considered essential to the objective of this report. This document does not constitute FAA certification policy. Consult your local FAA aircraft certification office as to its use. This report is available at the Federal Aviation Administration William J. Hughes Technical Center’s Full-Text Technical Reports page: actlibrary.tc.faa.gov in Adobe Acrobat portable document format (PDF).
Technical Report Documentation Page 1. Report No.
DOT/FAA/AR-10/22
2. Government Accession No. 3. Recipient's Catalog No.
4. Title and Subtitle
EXPLICIT FINITE ELEMENT MODELING OF MULTILAYER COMPOSITE FABRIC FOR GAS TURBINE ENGINE CONTAINMENT SYSTEMS, PHASE II
5. Report Date
October 2010
UPDATE TO PART 3: MATERIAL MODEL DEVELOPMENT AND SIMULATION EXPERIMENTS
6. Performing Organization Code
7. Author(s)
Jeffrey Simons and Donald Shockey
8. Performing Organization Report No.
9. Performing Organization Name and Address
SRI International 333 Ravenswood Avenue Menlo Park, CA 94025
10. Work Unit No. (TRAIS)
11. Contract or Grant No.
2006-G-007 12. Sponsoring Agency Name and Address
U.S. Department of Transportation Federal Aviation Administration Air Traffic Organization NextGen & Operations Planning Office of Research and Technology Development Washington, DC 20591
13. Type of Report and Period Covered
Final Report
14. Sponsoring Agency Code
ANE-110 15. Supplementary Notes
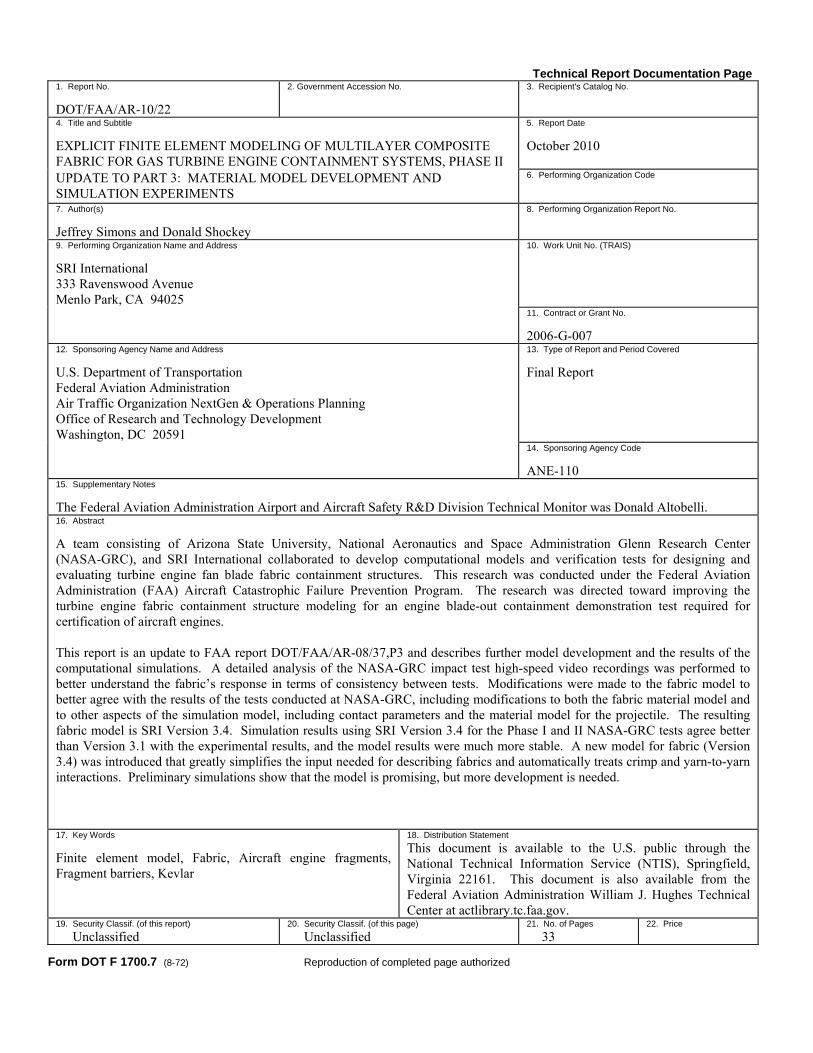
The Federal Aviation Administration Airport and Aircraft Safety R&D Division Technical Monitor was Donald Altobelli. 16. Abstract
A team consisting of Arizona State University, National Aeronautics and Space Administration Glenn Research Center (NASA-GRC), and SRI International collaborated to develop computational models and verification tests for designing and evaluating turbine engine fan blade fabric containment structures. This research was conducted under the Federal Aviation Administration (FAA) Aircraft Catastrophic Failure Prevention Program. The research was directed toward improving the turbine engine fabric containment structure modeling for an engine blade-out containment demonstration test required for certification of aircraft engines. This report is an update to FAA report DOT/FAA/AR-08/37,P3 and describes further model development and the results of the computational simulations. A detailed analysis of the NASA-GRC impact test high-speed video recordings was performed to better understand the fabric’s response in terms of consistency between tests. Modifications were made to the fabric model to better agree with the results of the tests conducted at NASA-GRC, including modifications to both the fabric material model and to other aspects of the simulation model, including contact parameters and the material model for the projectile. The resulting fabric model is SRI Version 3.4. Simulation results using SRI Version 3.4 for the Phase I and II NASA-GRC tests agree better than Version 3.1 with the experimental results, and the model results were much more stable. A new model for fabric (Version 3.4) was introduced that greatly simplifies the input needed for describing fabrics and automatically treats crimp and yarn-to-yarn interactions. Preliminary simulations show that the model is promising, but more development is needed. 17. Key Words
Finite element model, Fabric, Aircraft engine fragments, Fragment barriers, Kevlar
18. Distribution Statement
This document is available to the U.S. public through the National Technical Information Service (NTIS), Springfield, Virginia 22161. This document is also available from the Federal Aviation Administration William J. Hughes Technical Center at actlibrary.tc.faa.gov.
19. Security Classif. (of this report) Unclassified
20. Security Classif. (of this page) Unclassified
21. No. of Pages 33
22. Price
Form DOT F 1700.7 (8-72) Reproduction of completed page authorized
TABLE OF CONTENTS
Page
EXECUTIVE SUMMARY vii 1. BACKGROUND 1
2. TASK 1: RE-EVALUATING TEST DATA 1
2.1 Correlate Projectile Orientation and Energy Absorbed 2 2.2 Test Data Consistency 4
3. TASK 2: CLOSELY COMPARE SIMULATIONS WITH HIGH-SPEED VIDEO
RECORDINGS 6
3.1 Mechanistic Differences Between Model and Tests 6 3.2 Plastic Deformation of the Projectile 8
4. TASK 3: IMPROVED DAMAGE AND FAILURE ALGORITHMS 9
4.1 Modifications to Fabric Material Model 10 4.2 Damage Function 10 4.3 Rate Dependence 12 4.4 Contact Parameters 13 4.5 Material Model for 304 Stainless Steel 14 4.6 The NASA-GRC Test Simulation Results 14
5. TASK 4: DEVELOPMENT OF NEW FABRIC MODEL WITH GEOMETRIC
CRIMP AND YARN-YARN INTERACTION 17
5.1 Cross-Yarn Interaction 17 5.2 Relating the Rotational Strain to the Offset 19 5.3 Constructing a Stiffness Matrix Including Crimp 21 5.4 Simulations With Preliminary Model 21
6. SUMMARY AND RECOMMENDATIONS 22
6.1 Summary 22 6.2 Recommendations 23
7. REFERENCES 24
iii
LIST OF FIGURES Figure Page 1 Reference System for Calculating Presented Area 3
2 Energy Absorbed as a Function of Presented Area for Phase II Tests 3
3 Energy Absorbed for Phase I Tests 5
4 Projectile Orientation for Phase I Tests 6
5 Projectile Orientation for NASA-GRC Test LG594 7
6 The NASA-GRC Test LG594 Experiment and SRI Model V3.1 8
7 Simulation of Test LG594 Including Projectile Plasticity 9
8 The SRI Swath Test Results for Kevlar 49 11
9 Modified Damage Function 12
10 Model Stress-Strain Curve for Kevlar 49 Compared to SRI Swath Tests 12
11 Rate Dependence of Kevlar Fiber Bundles 13
12 Comparison of Percentage Energy Absorbed for SRI Model V3.4 and NASA-GRC Ballistic Tests LG404 and LG411 16
13 Comparison of Kinetic Energy Absorbed for SRI Model V3.4 and NASA-GRC Tests 16
14 Cross-Yarn Interaction in SRI Model V4.1 18
15 Crimp Analysis for Diagonal Yarns 20
iv
LIST OF TABLES Table Page 1 The NASA-GRC Test and SRI Model V3.1-K3B Simulation Results 2 2 Repeatability of Phase I NASA-GRC Test Results 4 3 Johnson-Cook Constants Used for 304 Stainless Steel 14 4 Simulation Results of NASA-GRC Ballistic Tests for SRI Model V3.4 15 5 Overall Statistics for SRI Model V3.4 Simulations of NASA-GRC Ballistics Tests 17 6 Residual Velocity Results for SRI Model V4.1 22
v
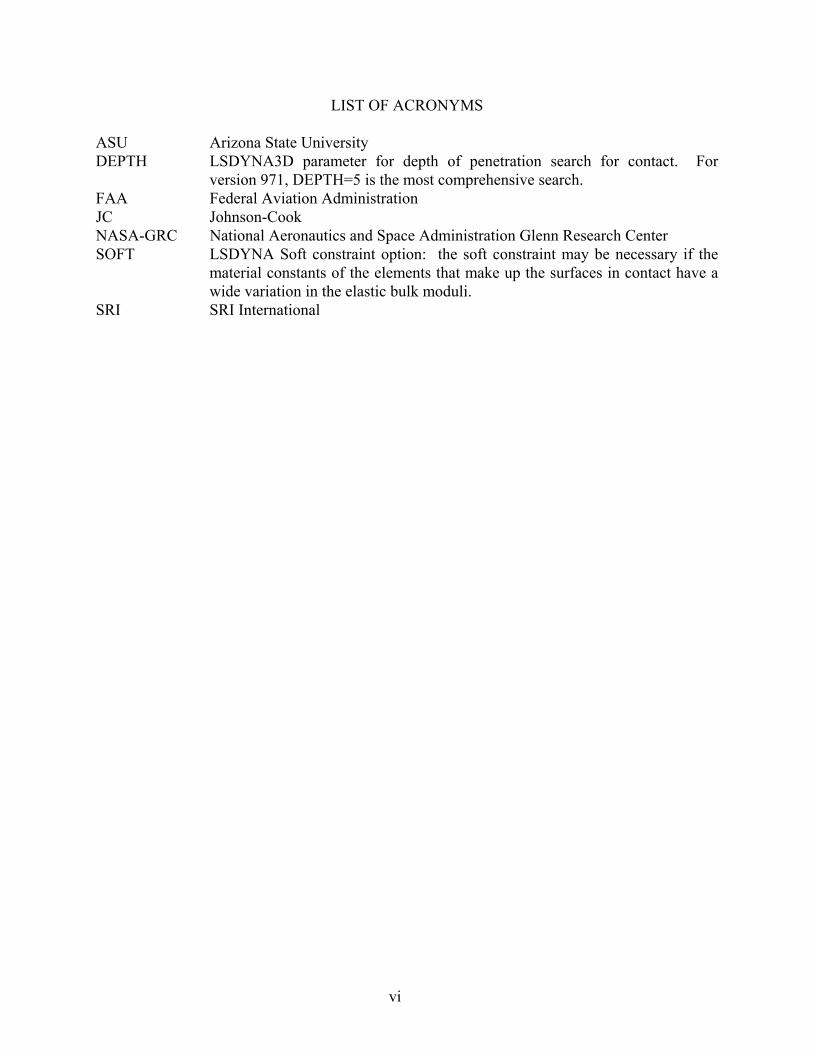
LIST OF ACRONYMS
ASU Arizona State University DEPTH LSDYNA3D parameter for depth of penetration search for contact. For
version 971, DEPTH=5 is the most comprehensive search. FAA Federal Aviation Administration JC Johnson-Cook NASA-GRC National Aeronautics and Space Administration Glenn Research Center SOFT LSDYNA Soft constraint option: the soft constraint may be necessary if the
material constants of the elements that make up the surfaces in contact have a wide variation in the elastic bulk moduli.
SRI SRI International
vi
EXECUTIVE SUMMARY
This report is an update to FAA report DOT/FAA/AR-08/37,P3 and describes further model development and the results of the computational simulations. An analysis of the National Aeronautics and Space Administration Glenn Research Center (NASA-GRC) impact test, high-speed video recordings for Phase I and II of this research was performed to better understand the results in terms of consistency of results between tests and the correlation between the orientation of the projectile and kinetic energy absorbed. Modifications were made to the fabric model to better agree with the results of the Phase I and Phase II tests performed by NASA-GRC. These included modifications to both the fabric material model and to other aspects of the simulation model, including contact parameters and the material model for the projectile. The resulting fabric model is SRI Version 3.4. The most significant changes made were (1) significantly reducing the shear modulus values for the fabric, (2) modifying the contact parameters to address the instabilities that occur from the fabric low shear modulus, (3) allowing for yielding in the projectile, and (4) changes were made to the fabric damage model and rate sensitivity based on a combination of old test data and new information. Simulation results using SRI Version 3.4 for the Phase I and II tests conducted at NASA-GRC agreed better than Version 3.1 with the experimental results, not just in energy absorbed but for level of deformation at initial failure and the tearing to failure; also, the results were much more stable. A new model was introduced that greatly simplifies input needed for describing fabrics and automatically treats crimp and yarn-to-yarn interactions. Preliminary simulations show that the model is promising, but more development is needed.
vii/viii
1. BACKGROUND.
A team consisting of Arizona State University (ASU), National Aeronautics and Space Administration Glenn Research Center (NASA-GRC), and SRI International (SRI) collaborated to develop computational models and verification tests for designing and evaluating turbine engine fan blade fabric containment structures. This research was conducted under the Federal Aviation Administration (FAA) Aircraft Catastrophic Failure Prevention Program. The research was directed toward improving the turbine engine fabric containment structure model for an engine blade-out containment demonstration test required for certification of aircraft engines. SRI’s effort in the current ASU/SRI/NASA-GRC program is presented here. The objective of this phase of the research was to further develop the SRI fabric material model and demonstrate a computational model of ballistic response of fabrics under engine containment conditions. SRI’s part was to (1) analyze the NASA-GRC impact test, high-speed video recordings for Phases I and II to better understand the results in terms of consistency of results between tests and the correlation between the orientation of the projectile and kinetic energy absorbed and (2) modify SRI’s test fixture model and fabric material model to better agree with the results of the NASA-GRC Phase I and II tests. The procedures and results of this effort are presented in the following sections. In Phase I of this research [1-4], much progress was made in testing and computational analysis. A fabric material model was developed for Kevlar® 49 and Zylon® fabrics. ASU performed static tests of containment wraps subjected to loads through a blunt-nose impactor [1]. NASA-GRC performed ballistic tests of containment wraps subjected to a high-velocity, blunt projectile [2]. These tests have provided benchmark results to validate the developed finite element methodology. While the work performed in the previous research program met the stated objectives, improvements in robustness and confidence of the finite element simulations and predictions were desired. The Phase II effort brought a new level of capability for design and development of fan blade containment systems for turbine engines. Significant progress was made in three areas: (1) further development of the ballistic fabric model was performed to increase confidence and robustness in the material models for the Kevlar 49 and Zylon material models developed in Phase I; (2) the capability was improved for finite element modeling of multiple layers of fabric using multiple layers of shell elements; and (3) large-scale fan containment test simulations were performed. This report concentrates on the material model development and impact test simulations [5-8]. It should be noted that Honeywell Engines and Systems (Honeywell) participated in Phases I and II. 2. TASK 1: RE-EVALUATING TEST DATA.
An analysis of the NASA-GRC impact test, high-speed video recordings for Phases I and II was performed to better understand the results in terms of consistency of results between tests and the correlation between the orientation of the projectile and kinetic energy absorbed.
1
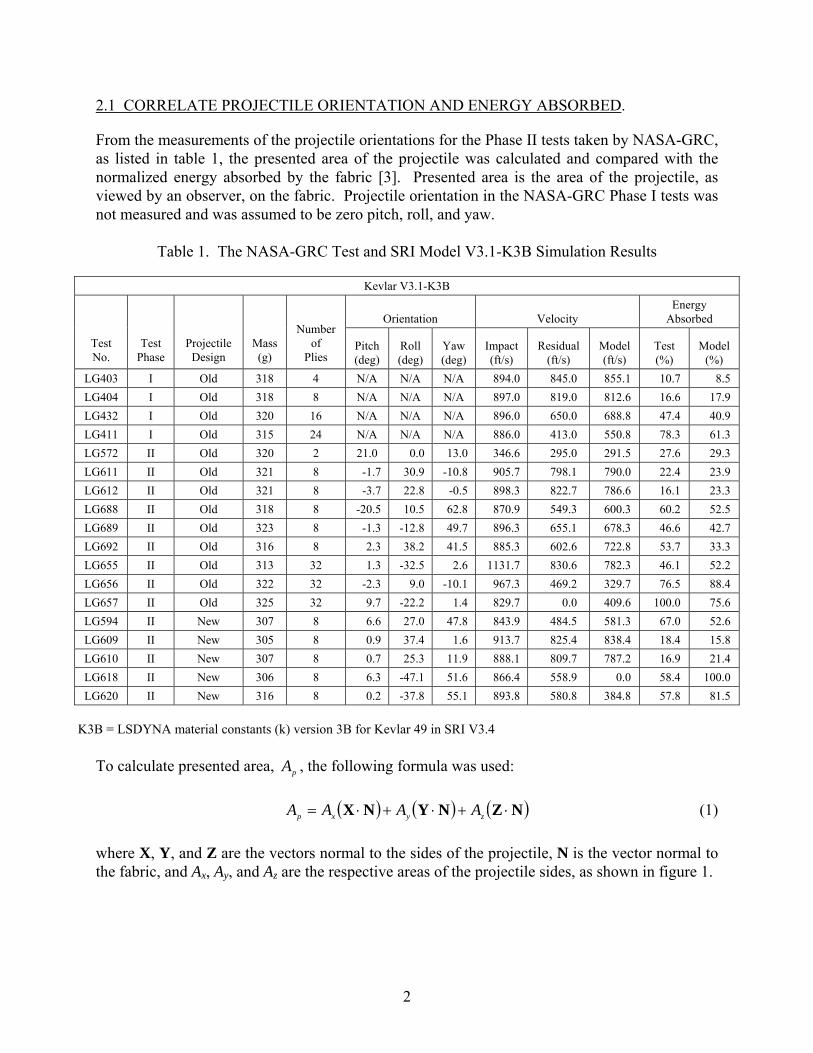
2.1 CORRELATE PROJECTILE ORIENTATION AND ENERGY ABSORBED.
From the measurements of the projectile orientations for the Phase II tests taken by NASA-GRC, as listed in table 1, the presented area of the projectile was calculated and compared with the normalized energy absorbed by the fabric [3]. Presented area is the area of the projectile, as viewed by an observer, on the fabric. Projectile orientation in the NASA-GRC Phase I tests was not measured and was assumed to be zero pitch, roll, and yaw.
Table 1. The NASA-GRC Test and SRI Model V3.1-K3B Simulation Results
Kevlar V3.1-K3B
Orientation Velocity Energy
Absorbed
Test No.
Test Phase
Projectile Design
Mass (g)
Number of
Plies Pitch (deg)
Roll (deg)
Yaw (deg)
Impact (ft/s)
Residual (ft/s)
Model (ft/s)
Test (%)
Model (%)
LG403 I Old 318 4 N/A N/A N/A 894.0 845.0 855.1 10.7 8.5 LG404 I Old 318 8 N/A N/A N/A 897.0 819.0 812.6 16.6 17.9 LG432 I Old 320 16 N/A N/A N/A 896.0 650.0 688.8 47.4 40.9 LG411 I Old 315 24 N/A N/A N/A 886.0 413.0 550.8 78.3 61.3 LG572 II Old 320 2 21.0 0.0 13.0 346.6 295.0 291.5 27.6 29.3 LG611 II Old 321 8 -1.7 30.9 -10.8 905.7 798.1 790.0 22.4 23.9 LG612 II Old 321 8 -3.7 22.8 -0.5 898.3 822.7 786.6 16.1 23.3 LG688 II Old 318 8 -20.5 10.5 62.8 870.9 549.3 600.3 60.2 52.5 LG689 II Old 323 8 -1.3 -12.8 49.7 896.3 655.1 678.3 46.6 42.7 LG692 II Old 316 8 2.3 38.2 41.5 885.3 602.6 722.8 53.7 33.3 LG655 II Old 313 32 1.3 -32.5 2.6 1131.7 830.6 782.3 46.1 52.2 LG656 II Old 322 32 -2.3 9.0 -10.1 967.3 469.2 329.7 76.5 88.4 LG657 II Old 325 32 9.7 -22.2 1.4 829.7 0.0 409.6 100.0 75.6 LG594 II New 307 8 6.6 27.0 47.8 843.9 484.5 581.3 67.0 52.6 LG609 II New 305 8 0.9 37.4 1.6 913.7 825.4 838.4 18.4 15.8 LG610 II New 307 8 0.7 25.3 11.9 888.1 809.7 787.2 16.9 21.4 LG618 II New 306 8 6.3 -47.1 51.6 866.4 558.9 0.0 58.4 100.0 LG620 II New 316 8 0.2 -37.8 55.1 893.8 580.8 384.8 57.8 81.5
K3B = LSDYNA material constants (k) version 3B for Kevlar 49 in SRI V3.4
To calculate presented area, , the following formula was used: pA ( ) ( ) ( )NZNYNX ⋅+⋅+⋅= zyxp AAAA (1) where X, Y, and Z are the vectors normal to the sides of the projectile, N is the vector normal to the fabric, and Ax, Ay, and Az are the respective areas of the projectile sides, as shown in figure 1.
2

XZ
Y N
XZ
Y NN
Figure 1. Reference System for Calculating Presented Area
The results for energy absorbed as a function of projectile presented area are shown in figure 2. There is a strong correlation, i.e., the greater the presented area, the greater the energy absorbed, and the trend is consistent across the range of projectile geometries and number of plies. A linear fit to the data gives an R2 value of 0.86 and compared to the linear fit, the standard deviation across the tests is about 18%.
1000
8 plies, new projectile32 plies, old projectile8 plies, old projectile
= 0.8605y = 13.053x + 123.99
2R
900
800
700
Ene
rgy
Abs
orbe
d/P
ly (J
)
600
500
400
300
200
100
0 0 10 70 20 30 40 50 60
Presented Area (in2)
Figure 2. Energy Absorbed as a Function of Presented Area for Phase II Tests
3
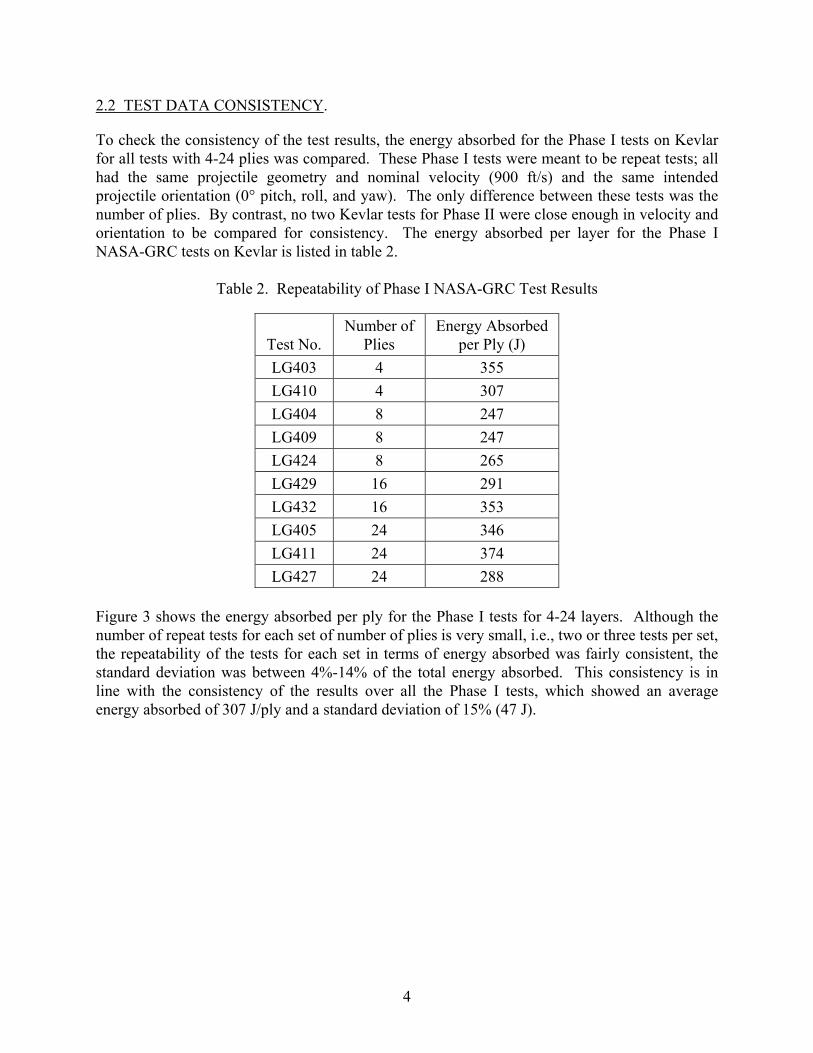
2.2 TEST DATA CONSISTENCY.
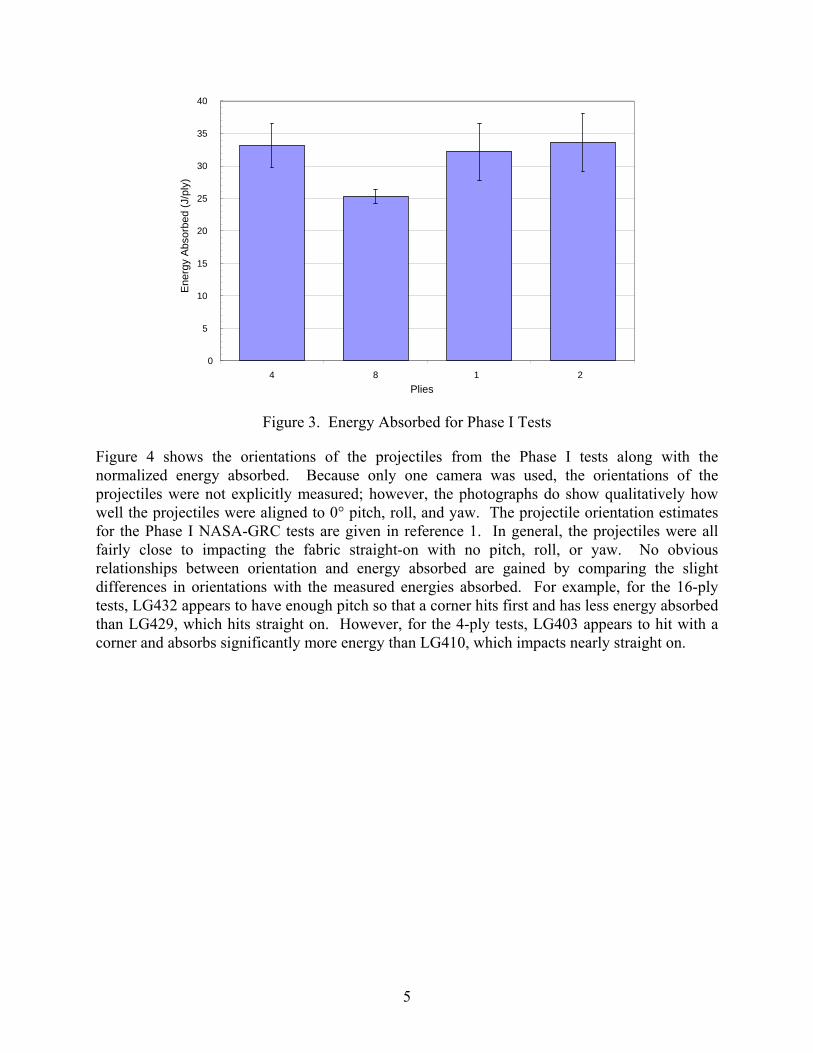
To check the consistency of the test results, the energy absorbed for the Phase I tests on Kevlar for all tests with 4-24 plies was compared. These Phase I tests were meant to be repeat tests; all had the same projectile geometry and nominal velocity (900 ft/s) and the same intended projectile orientation (0° pitch, roll, and yaw). The only difference between these tests was the number of plies. By contrast, no two Kevlar tests for Phase II were close enough in velocity and orientation to be compared for consistency. The energy absorbed per layer for the Phase I NASA-GRC tests on Kevlar is listed in table 2.
Table 2. Repeatability of Phase I NASA-GRC Test Results
Test No. Number of
Plies Energy Absorbed
per Ply (J) LG403 4 355 LG410 4 307 LG404 8 247 LG409 8 247 LG424 8 265 LG429 16 291 LG432 16 353 LG405 24 346 LG411 24 374 LG427 24 288
Figure 3 shows the energy absorbed per ply for the Phase I tests for 4-24 layers. Although the number of repeat tests for each set of number of plies is very small, i.e., two or three tests per set, the repeatability of the tests for each set in terms of energy absorbed was fairly consistent, the standard deviation was between 4%-14% of the total energy absorbed. This consistency is in line with the consistency of the results over all the Phase I tests, which showed an average energy absorbed of 307 J/ply and a standard deviation of 15% (47 J).
4
40
4
35
30
Ene
rgy
Abs
orbe
d (J
/ply
) 25
20
15
10
5
0 8 1 2
Plies
Figure 3. Energy Absorbed for Phase I Tests
Figure 4 shows the orientations of the projectiles from the Phase I tests along with the normalized energy absorbed. Because only one camera was used, the orientations of the projectiles were not explicitly measured; however, the photographs do show qualitatively how well the projectiles were aligned to 0° pitch, roll, and yaw. The projectile orientation estimates for the Phase I NASA-GRC tests are given in reference 1. In general, the projectiles were all fairly close to impacting the fabric straight-on with no pitch, roll, or yaw. No obvious relationships between orientation and energy absorbed are gained by comparing the slight differences in orientations with the measured energies absorbed. For example, for the 16-ply tests, LG432 appears to have enough pitch so that a corner hits first and has less energy absorbed than LG429, which hits straight on. However, for the 4-ply tests, LG403 appears to hit with a corner and absorbs significantly more energy than LG410, which impacts nearly straight on.
5
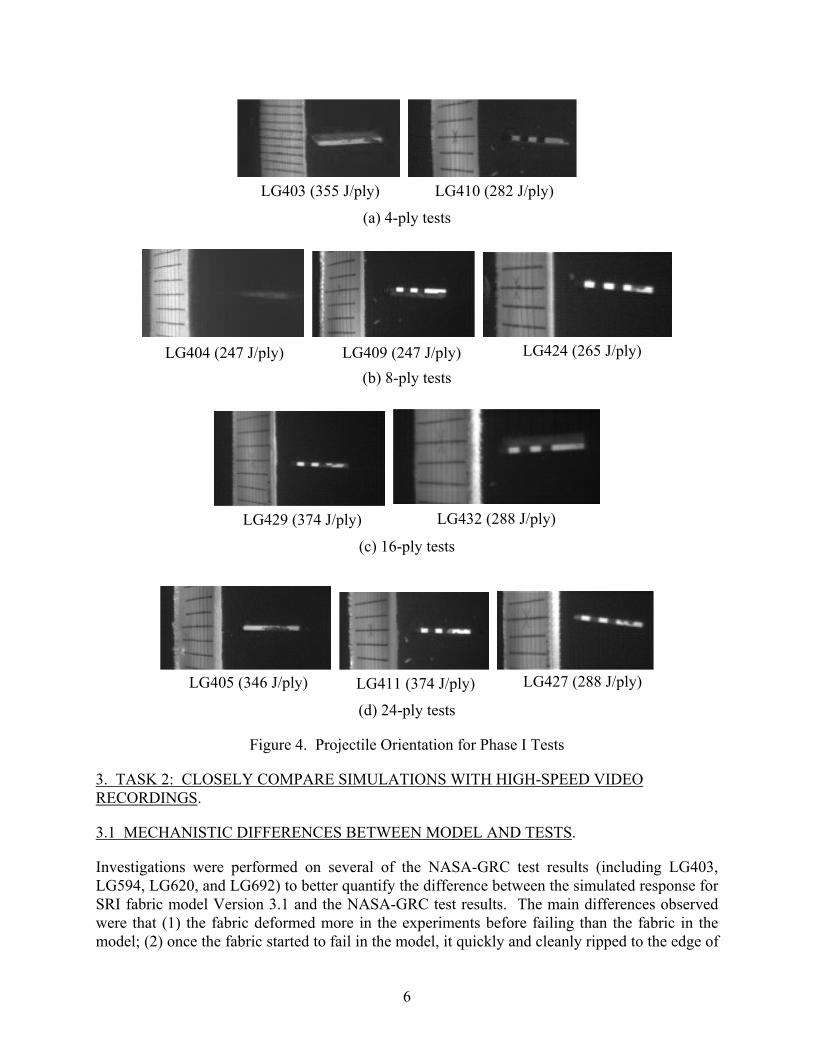
LG403 (355 J/ply) LG410 (282 J/ply)
(a) 4-ply tests
LG424 (265 J/ply) LG409 (247 J/ply) LG404 (247 J/ply)
(b) 8-ply tests
LG432 (288 J/ply) LG429 (374 J/ply)
(c) 16-ply tests
LG427 (288 J/ply) LG405 (346 J/ply) LG411 (374 J/ply)
(d) 24-ply tests
Figure 4. Projectile Orientation for Phase I Tests
3. TASK 2: CLOSELY COMPARE SIMULATIONS WITH HIGH-SPEED VIDEO RECORDINGS.
3.1 MECHANISTIC DIFFERENCES BETWEEN MODEL AND TESTS.
Investigations were performed on several of the NASA-GRC test results (including LG403, LG594, LG620, and LG692) to better quantify the difference between the simulated response for SRI fabric model Version 3.1 and the NASA-GRC test results. The main differences observed were that (1) the fabric deformed more in the experiments before failing than the fabric in the model; (2) once the fabric started to fail in the model, it quickly and cleanly ripped to the edge of
6
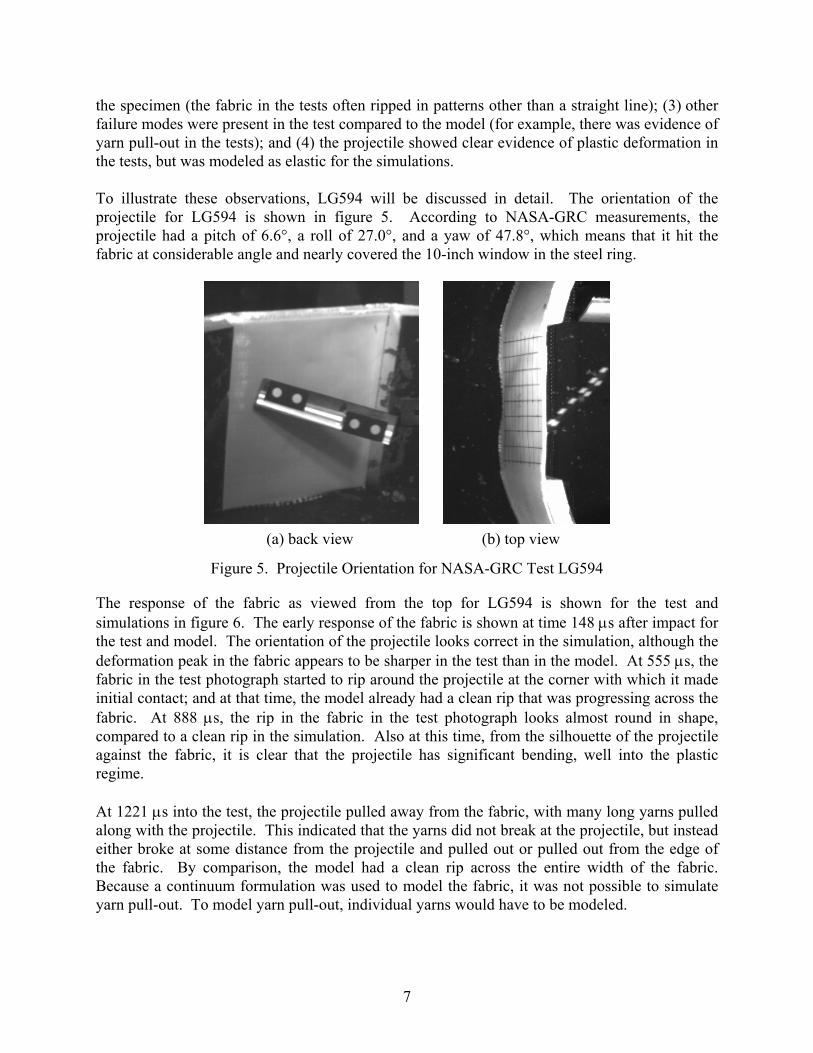
the specimen (the fabric in the tests often ripped in patterns other than a straight line); (3) other failure modes were present in the test compared to the model (for example, there was evidence of yarn pull-out in the tests); and (4) the projectile showed clear evidence of plastic deformation in the tests, but was modeled as elastic for the simulations. To illustrate these observations, LG594 will be discussed in detail. The orientation of the projectile for LG594 is shown in figure 5. According to NASA-GRC measurements, the projectile had a pitch of 6.6°, a roll of 27.0°, and a yaw of 47.8°, which means that it hit the fabric at considerable angle and nearly covered the 10-inch window in the steel ring.
(a) back view (b) top view
Figure 5. Projectile Orientation for NASA-GRC Test LG594
The response of the fabric as viewed from the top for LG594 is shown for the test and simulations in figure 6. The early response of the fabric is shown at time 148 μs after impact for the test and model. The orientation of the projectile looks correct in the simulation, although the deformation peak in the fabric appears to be sharper in the test than in the model. At 555 μs, the fabric in the test photograph started to rip around the projectile at the corner with which it made initial contact; and at that time, the model already had a clean rip that was progressing across the fabric. At 888 μs, the rip in the fabric in the test photograph looks almost round in shape, compared to a clean rip in the simulation. Also at this time, from the silhouette of the projectile against the fabric, it is clear that the projectile has significant bending, well into the plastic regime. At 1221 μs into the test, the projectile pulled away from the fabric, with many long yarns pulled along with the projectile. This indicated that the yarns did not break at the projectile, but instead either broke at some distance from the projectile and pulled out or pulled out from the edge of the fabric. By comparison, the model had a clean rip across the entire width of the fabric. Because a continuum formulation was used to model the fabric, it was not possible to simulate yarn pull-out. To model yarn pull-out, individual yarns would have to be modeled.
7
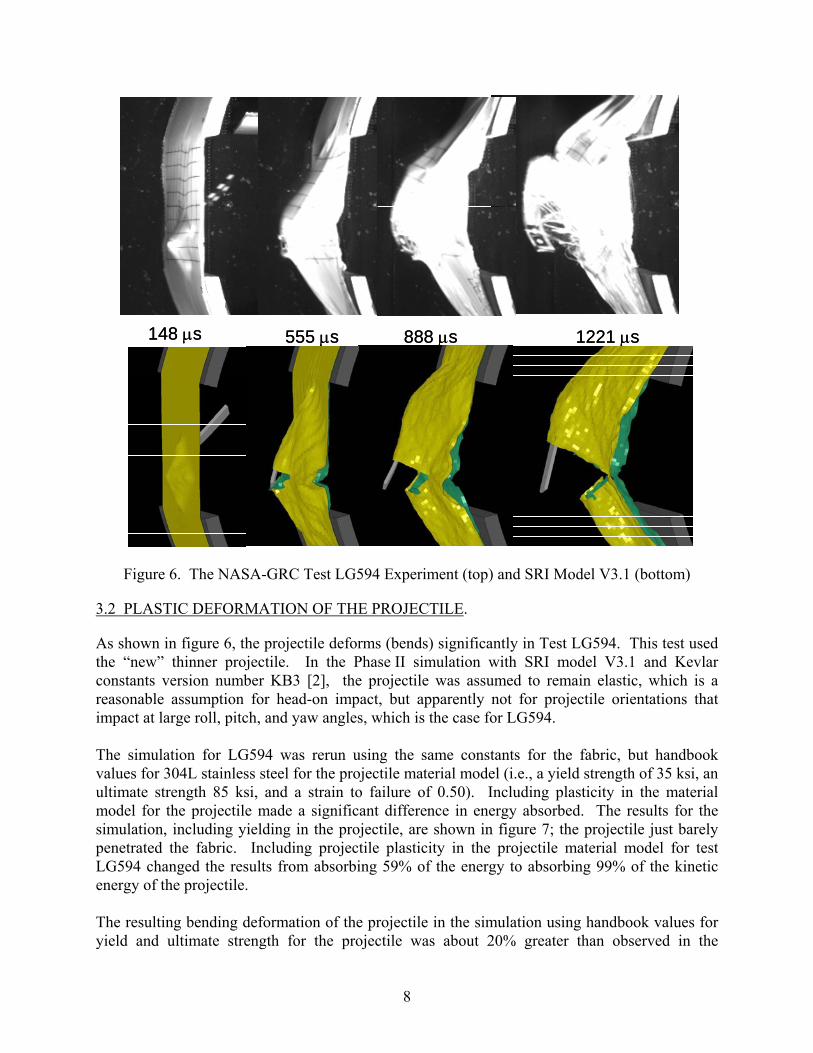
148 μs 555 μs 888 μs 1221 μs148 μs 555 μs 888 μs 1221 μs
Figure 6. The NASA-GRC Test LG594 Experiment (top) and SRI Model V3.1 (bottom)
3.2 PLASTIC DEFORMATION OF THE PROJECTILE.
As shown in figure 6, the projectile deforms (bends) significantly in Test LG594. This test used the “new” thinner projectile. In the Phase II simulation with SRI model V3.1 and Kevlar constants version number KB3 [2], the projectile was assumed to remain elastic, which is a reasonable assumption for head-on impact, but apparently not for projectile orientations that impact at large roll, pitch, and yaw angles, which is the case for LG594. The simulation for LG594 was rerun using the same constants for the fabric, but handbook values for 304L stainless steel for the projectile material model (i.e., a yield strength of 35 ksi, an ultimate strength 85 ksi, and a strain to failure of 0.50). Including plasticity in the material model for the projectile made a significant difference in energy absorbed. The results for the simulation, including yielding in the projectile, are shown in figure 7; the projectile just barely penetrated the fabric. Including projectile plasticity in the projectile material model for test LG594 changed the results from absorbing 59% of the energy to absorbing 99% of the kinetic energy of the projectile. The resulting bending deformation of the projectile in the simulation using handbook values for yield and ultimate strength for the projectile was about 20% greater than observed in the
8
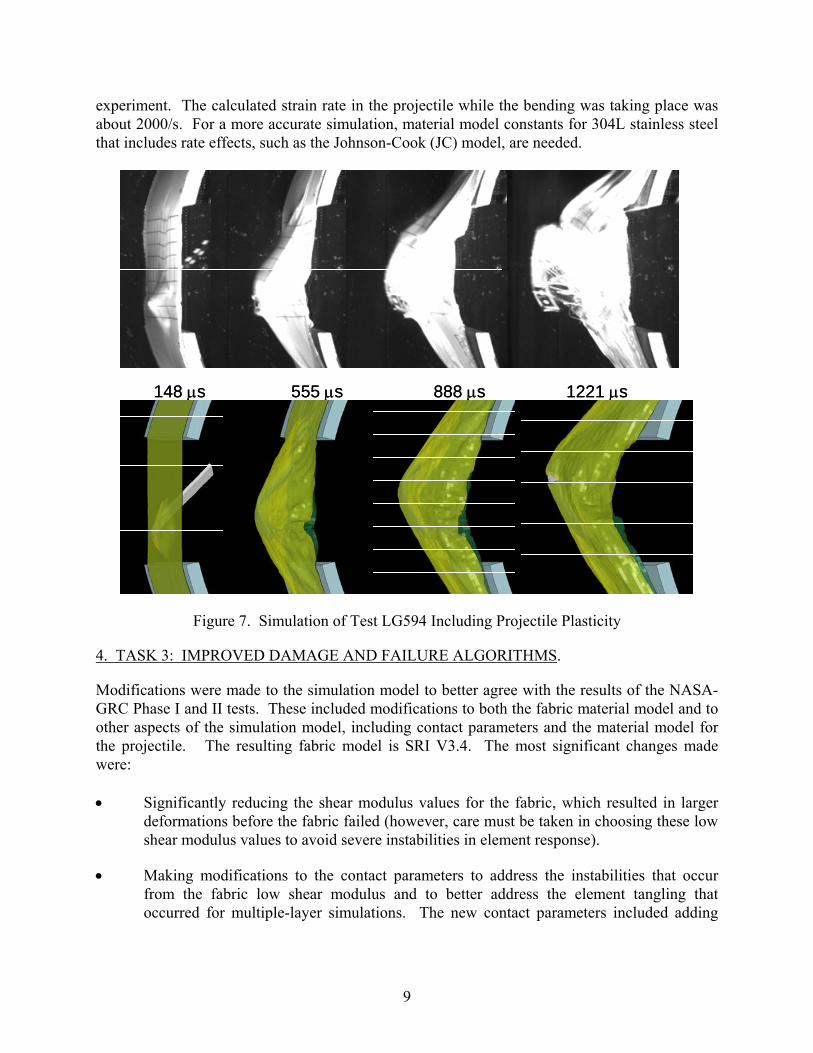
experiment. The calculated strain rate in the projectile while the bending was taking place was about 2000/s. For a more accurate simulation, material model constants for 304L stainless steel that includes rate effects, such as the Johnson-Cook (JC) model, are needed.
148 μs 555 μs 888 μs 1221 μs148 μs 555 μs 888 μs 1221 μs
Figure 7. Simulation of Test LG594 Including Projectile Plasticity
4. TASK 3: IMPROVED DAMAGE AND FAILURE ALGORITHMS.
Modifications were made to the simulation model to better agree with the results of the NASA-GRC Phase I and II tests. These included modifications to both the fabric material model and to other aspects of the simulation model, including contact parameters and the material model for the projectile. The resulting fabric model is SRI V3.4. The most significant changes made were: • Significantly reducing the shear modulus values for the fabric, which resulted in larger
deformations before the fabric failed (however, care must be taken in choosing these low shear modulus values to avoid severe instabilities in element response).
• Making modifications to the contact parameters to address the instabilities that occur from the fabric low shear modulus and to better address the element tangling that occurred for multiple-layer simulations. The new contact parameters included adding
9
significant contact damping and setting the most stringent value for checking element-to-element contact.
• Allowing for yielding in the projectile, a JC model for 304 stainless steel (SS304) was used.
• Changes were made to the fabric damage model and rate sensitivity based on a combination of old test data reviews and new information.
Simulation results using SRI V3.4 for the Phase I and II NASA-GRC tests agreed better with the experimental results than V3.1, not just in the energy absorbed, but for the level of deformation at initial failure and the tearing to failure. The results were also much more stable. A parameter study was performed by varying the shear modulus and contact parameters to optimize agreement with the full set of NASA-GRC tests. The new version of the material model, V3.4, is described in this section along with recommendations for improving the contact response. The agreement for absorbed energy for the NASA-GRC tests is a significant improvement over previous simulations, with all but two tests from Phase I, falling within 10% of the measured values for energy absorbed. 4.1 MODIFICATIONS TO FABRIC MATERIAL MODEL.
Modifications were made to the fabric material model to (1) redefine the damage function based on the post-peak stress-strain curves of early SRI swath tests and (2) modify the rate functions based on new test data of Kevlar fiber bundles by Wang [9]. Reducing the in-plane shear modulus of the fabric greatly increases fabric deformation prior to failure. The large deformation of the fabric prior to failure is consistent with what was observed in the experiments. However, the very low shear modulus also increases the numerical instability of element response, so elements are much more likely to take very unrealistic shapes. Although available test data [1] show that shear modulus starts as very low (near zero) then increases to a small but constant level after the yarns lock up, in this study, a constant value of the shear stiffness was assumed, with best results for values of shear modulus between about 0.1% and 0.2% of the tensile modulus of the yarns. Those values give a good balance between large deformations of fabric prior to failure and good element stability. 4.2 DAMAGE FUNCTION.
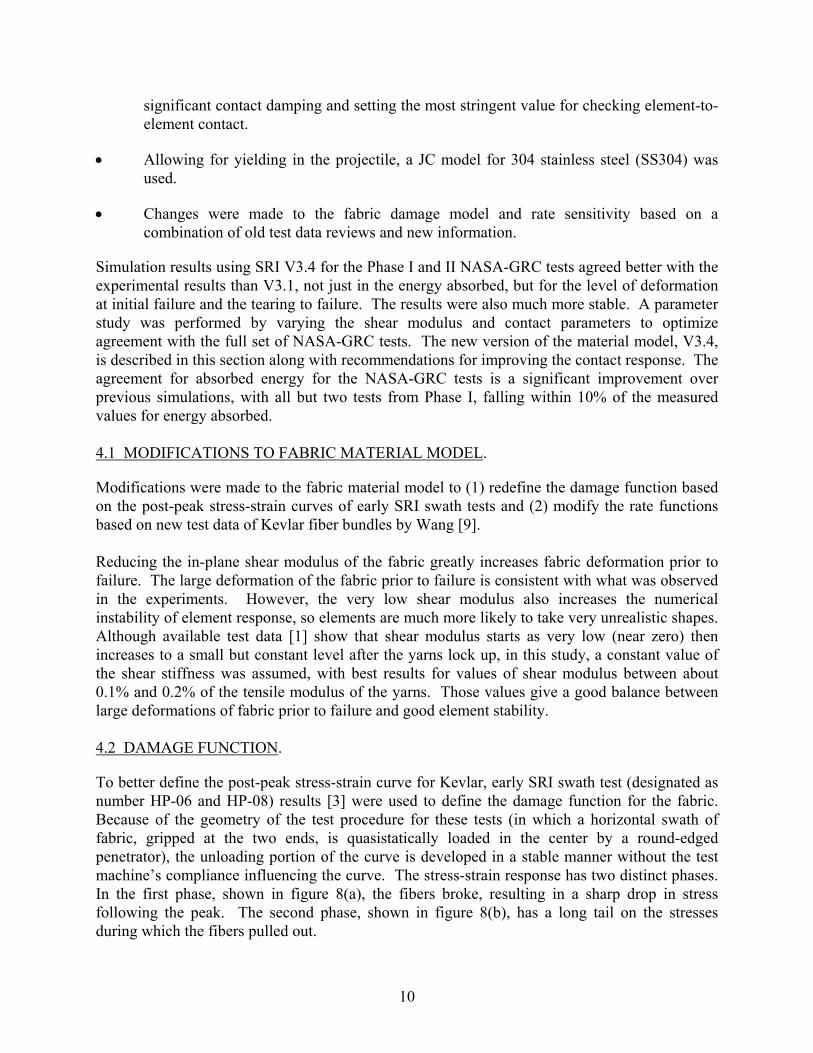
To better define the post-peak stress-strain curve for Kevlar, early SRI swath test (designated as number HP-06 and HP-08) results [3] were used to define the damage function for the fabric. Because of the geometry of the test procedure for these tests (in which a horizontal swath of fabric, gripped at the two ends, is quasistatically loaded in the center by a round-edged penetrator), the unloading portion of the curve is developed in a stable manner without the test machine’s compliance influencing the curve. The stress-strain response has two distinct phases. In the first phase, shown in figure 8(a), the fibers broke, resulting in a sharp drop in stress following the peak. The second phase, shown in figure 8(b), has a long tail on the stresses during which the fibers pulled out.
10
0
100
200
300
0.00 0.01 0.02 0.03 0.04 0.05 0.06
HP-06HP-08
0
100
200
300
0.0 0.1 0.2 0.3
HP-06HP-08
Stre
ss (k
si) (
Stre
ss (k
si)
Strain Strain
(a) First Phase (b) Second Phase
Figure 8. The SRI Swath Test Results for Kevlar 49
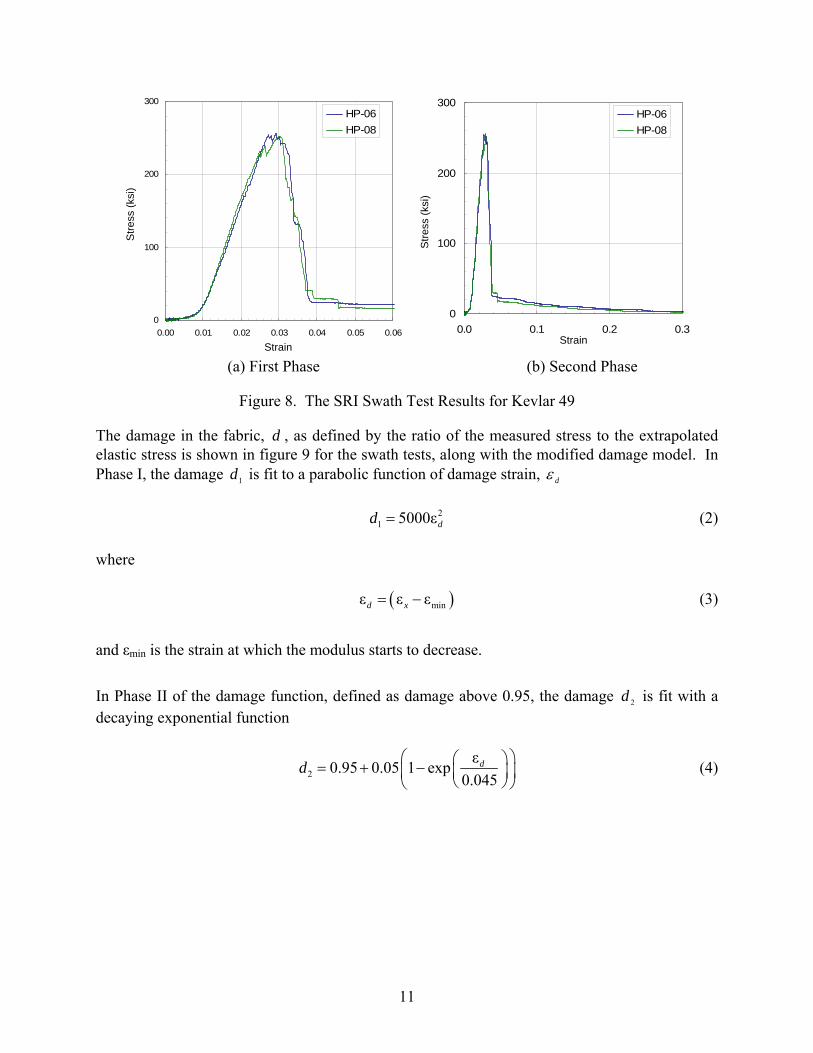
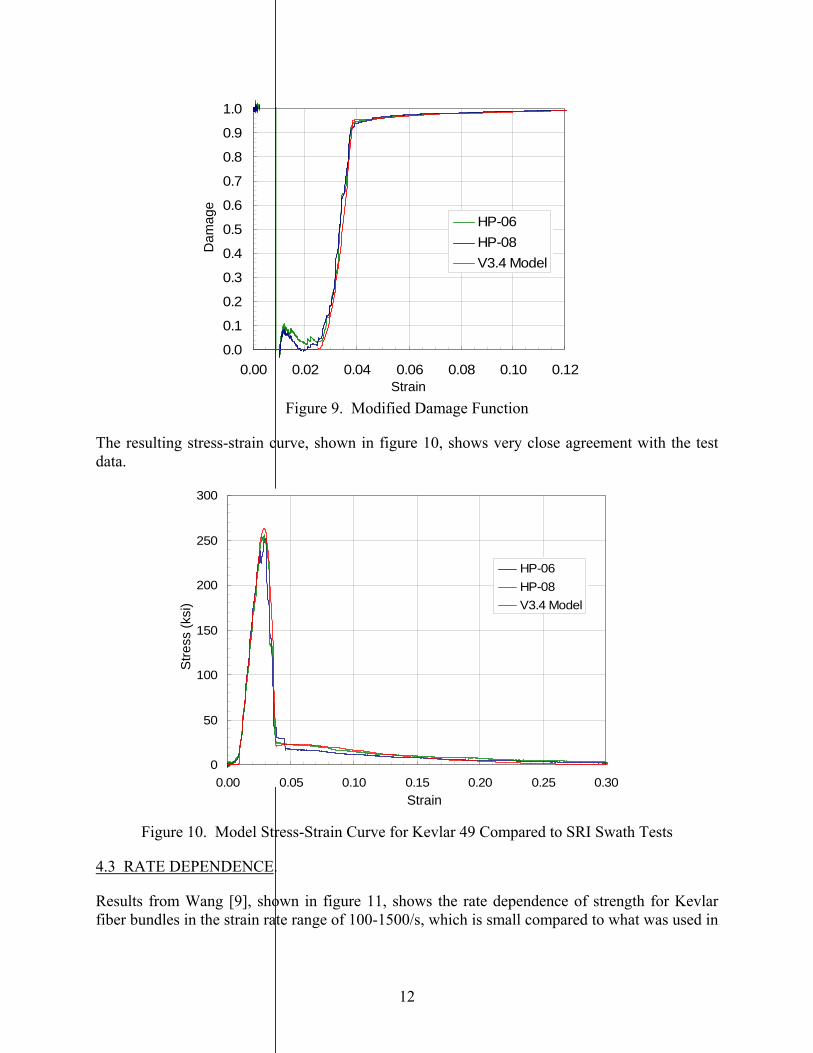
The damage in the fabric, , as defined by the ratio of the measured stress to the extrapolated elastic stress is shown in figure 9 for the swath tests, along with the modified damage model. In Phase I, the damage d is fit to a parabolic function of damage strain,
d
1 dε (2) 2
1 5000εdd = where ( )minε ε εd x= − (3)
and εmin is the strain at which the modulus starts to decrease.
In Phase II of the damage function, defined as damage above 0.95, the damage is fit with a decaying exponential function
2d
2ε0.95 0.05 1 exp
0.045dd ⎛ ⎞⎛= + −⎜ ⎜
⎝ ⎠⎝ ⎠
⎞⎟⎟ (4)
11
0.0
0.1
0.2
0.3
0.4
0.5
0.6
0.7
0.8
0.9
1.0
0.00 0.02 0.04 0.06 0.08 0.10 0.12
HP-06HP-08V3.4 Model
Dam
age
StrainFigure 9. Modified Damage Function
The resulting stress-strain curve, shown in figure 10, shows very close agreement with the test data.
0
50
100
150
200
250
300
0.00 0.05 0.10 0.15 0.20 0.25 0.30
HP-06HP-08V3.4 Model
Stre
ss (k
si)
Strain
Figure 10. Model Stress-Strain Curve for Kevlar 49 Compared to SRI Swath Tests
4.3 RATE DEPENDENCE.
Results from Wang [9], shown in figure 11, shows the rate dependence of strength for Kevlar fiber bundles in the strain rate range of 100-1500/s, which is small compared to what was used in
12
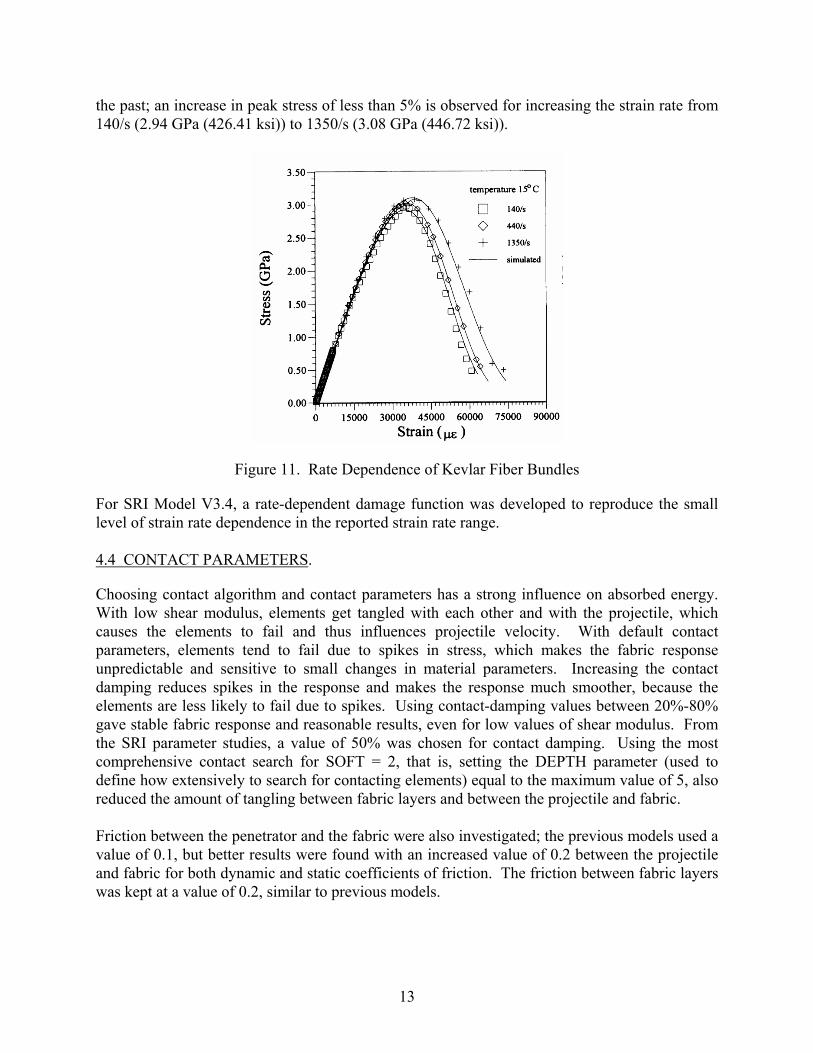
the past; an increase in peak stress of less than 5% is observed for increasing the strain rate from 140/s (2.94 GPa (426.41 ksi)) to 1350/s (3.08 GPa (446.72 ksi)).
Figure 11. Rate Dependence of Kevlar Fiber Bundles
For SRI Model V3.4, a rate-dependent damage function was developed to reproduce the small level of strain rate dependence in the reported strain rate range. 4.4 CONTACT PARAMETERS.
Choosing contact algorithm and contact parameters has a strong influence on absorbed energy. With low shear modulus, elements get tangled with each other and with the projectile, which causes the elements to fail and thus influences projectile velocity. With default contact parameters, elements tend to fail due to spikes in stress, which makes the fabric response unpredictable and sensitive to small changes in material parameters. Increasing the contact damping reduces spikes in the response and makes the response much smoother, because the elements are less likely to fail due to spikes. Using contact-damping values between 20%-80% gave stable fabric response and reasonable results, even for low values of shear modulus. From the SRI parameter studies, a value of 50% was chosen for contact damping. Using the most comprehensive contact search for SOFT = 2, that is, setting the DEPTH parameter (used to define how extensively to search for contacting elements) equal to the maximum value of 5, also reduced the amount of tangling between fabric layers and between the projectile and fabric. Friction between the penetrator and the fabric were also investigated; the previous models used a value of 0.1, but better results were found with an increased value of 0.2 between the projectile and fabric for both dynamic and static coefficients of friction. The friction between fabric layers was kept at a value of 0.2, similar to previous models.
13
To define the contact surfaces, a part set that contains all the fabric layers was defined, and a surface-to-surface contact was defined between the projectile part and the part set containing the fabric layers. A second single-surface contact was defined between all the fabric layers. 4.5 MATERIAL MODEL FOR 304 STAINLESS STEEL.
The material model for the projectile was changed to a JC model with constants for 304L stainless steel, as listed in table 3. The JC model gives yield strength, σy, as a function of effective plastic strain, εpl , and homologous temperature, , as θ̂
( ) (0
εσ ε 1 ln 1 θ
εn pl m
y plA B c⎡ ⎤⎛ ⎞⎡ ⎤= + + −⎢ ⎥⎜ ⎟⎢ ⎥ ⎜ ⎟⎣ ⎦ ⎢ ⎥⎝ ⎠⎣ ⎦
) (5)
The material constants A , B , , , and were chosen to be consistent with an ultimate strength of 85 ksi at a plastic strain of 0.5, as described in section 3.2; however, a rate dependence, , typical of metals, and a higher initial yield strength (50 ksi) was chosen that reduced the bending deformation to be consistent with the test result (test LG594 was used for comparison).
c m n
c
Table 3. Johnson-Cook Constants Used for 304L Stainless Steel
Constant A B n c 0ε m Units Msi Msi ms-1 Value 0.0500 0.045 0.30 0.24 0.001 1.03
Msi = Million pounds per square inch.
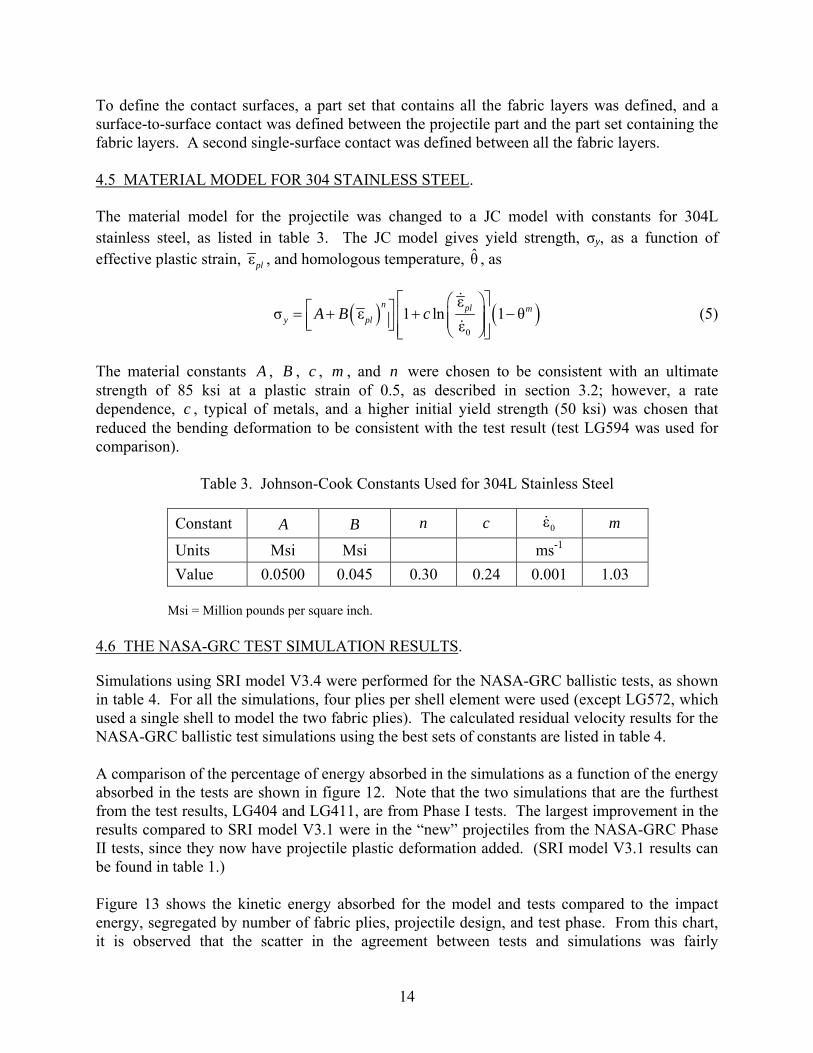
4.6 THE NASA-GRC TEST SIMULATION RESULTS.
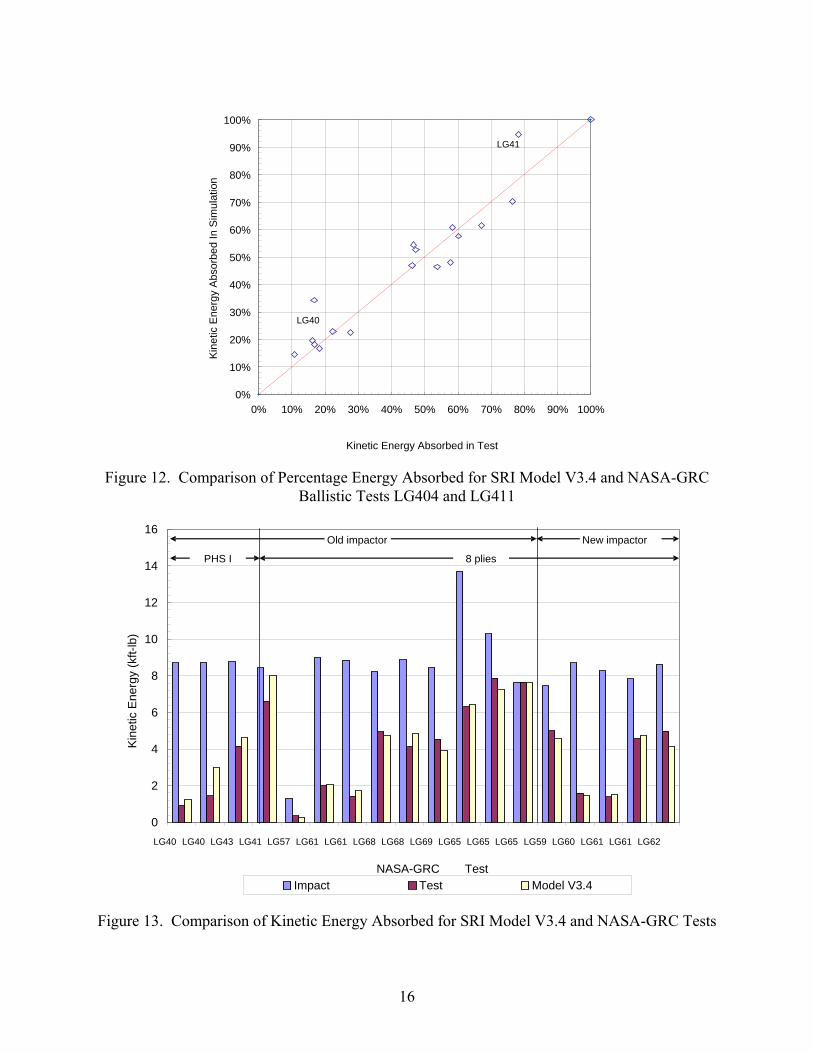
Simulations using SRI model V3.4 were performed for the NASA-GRC ballistic tests, as shown in table 4. For all the simulations, four plies per shell element were used (except LG572, which used a single shell to model the two fabric plies). The calculated residual velocity results for the NASA-GRC ballistic test simulations using the best sets of constants are listed in table 4. A comparison of the percentage of energy absorbed in the simulations as a function of the energy absorbed in the tests are shown in figure 12. Note that the two simulations that are the furthest from the test results, LG404 and LG411, are from Phase I tests. The largest improvement in the results compared to SRI model V3.1 were in the “new” projectiles from the NASA-GRC Phase II tests, since they now have projectile plastic deformation added. (SRI model V3.1 results can be found in table 1.) Figure 13 shows the kinetic energy absorbed for the model and tests compared to the impact energy, segregated by number of fabric plies, projectile design, and test phase. From this chart, it is observed that the scatter in the agreement between tests and simulations was fairly
14
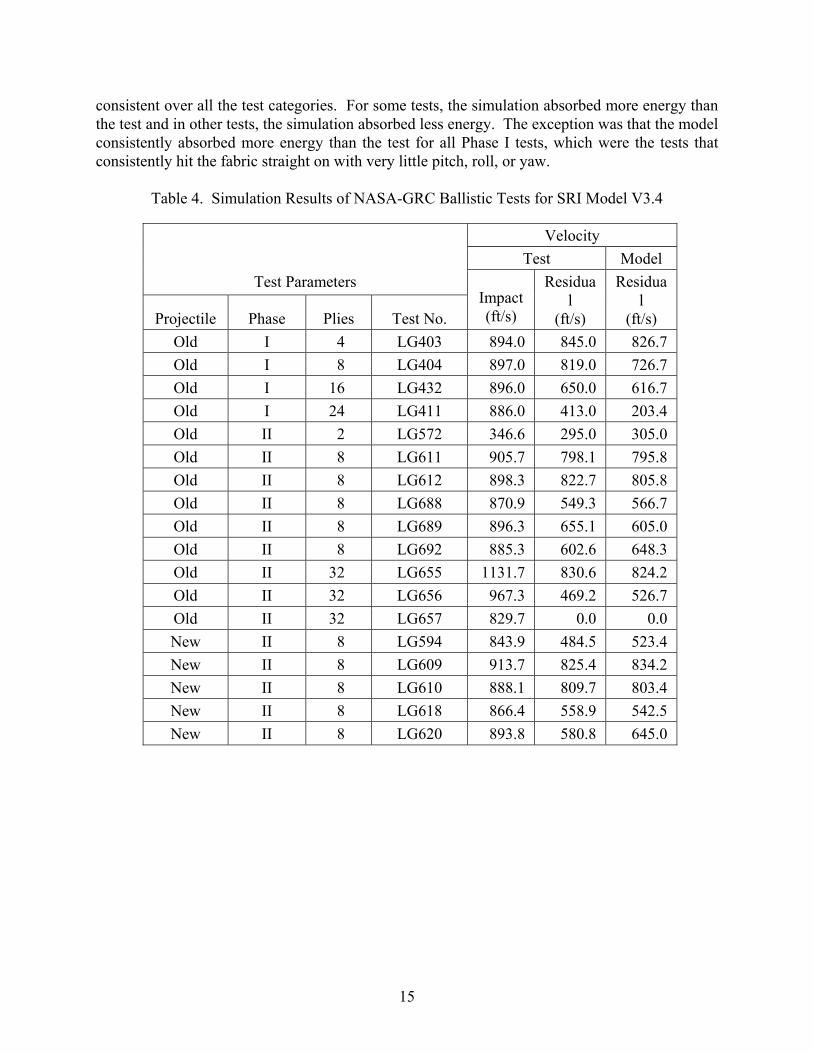
consistent over all the test categories. For some tests, the simulation absorbed more energy than the test and in other tests, the simulation absorbed less energy. The exception was that the model consistently absorbed more energy than the test for all Phase I tests, which were the tests that consistently hit the fabric straight on with very little pitch, roll, or yaw.
Table 4. Simulation Results of NASA-GRC Ballistic Tests for SRI Model V3.4
Velocity Test Model
Test Parameters
Projectile Phase Plies Test No. Impact (ft/s)
Residual
(ft/s)
Residual
(ft/s) Old I 4 LG403 894.0 845.0 826.7 Old I 8 LG404 897.0 819.0 726.7 Old I 16 LG432 896.0 650.0 616.7 Old I 24 LG411 886.0 413.0 203.4 Old II 2 LG572 346.6 295.0 305.0 Old II 8 LG611 905.7 798.1 795.8 Old II 8 LG612 898.3 822.7 805.8 Old II 8 LG688 870.9 549.3 566.7 Old II 8 LG689 896.3 655.1 605.0 Old II 8 LG692 885.3 602.6 648.3 Old II 32 LG655 1131.7 830.6 824.2 Old II 32 LG656 967.3 469.2 526.7 Old II 32 LG657 829.7 0.0 0.0 New II 8 LG594 843.9 484.5 523.4 New II 8 LG609 913.7 825.4 834.2 New II 8 LG610 888.1 809.7 803.4 New II 8 LG618 866.4 558.9 542.5 New II 8 LG620 893.8 580.8 645.0
15
100%
90% LG41
80%
Kin
etic
Ene
rgy
Abs
orbe
d In
Sim
ulat
ion
70%
60%
50%
40%
30% LG40
20%
10%
0% 0% 10% 100% 20% 30% 40% 50% 60% 70% 80% 90%
Kinetic Energy Absorbed in Test
Figure 12. Comparison of Percentage Energy Absorbed for SRI Model V3.4 and NASA-GRC Ballistic Tests LG404 and LG411
16
Figure 13. Comparison of Kinetic Energy Absorbed for SRI Model V3.4 and NASA-GRC Tests
0
2
4
6
8
10
12
14
LG40 LG40 LG43 LG41 LG57 LG61 LG61 LG68 LG68 LG69 LG65 LG65 LG65 LG59 LG60 LG61 LG61 LG62
NASA-GRC Test
Kin
etic
Ene
rgy
(kft-
lb)
Impact Test Model V3.4
Old impactor New impactor PHS I 8 plies
16
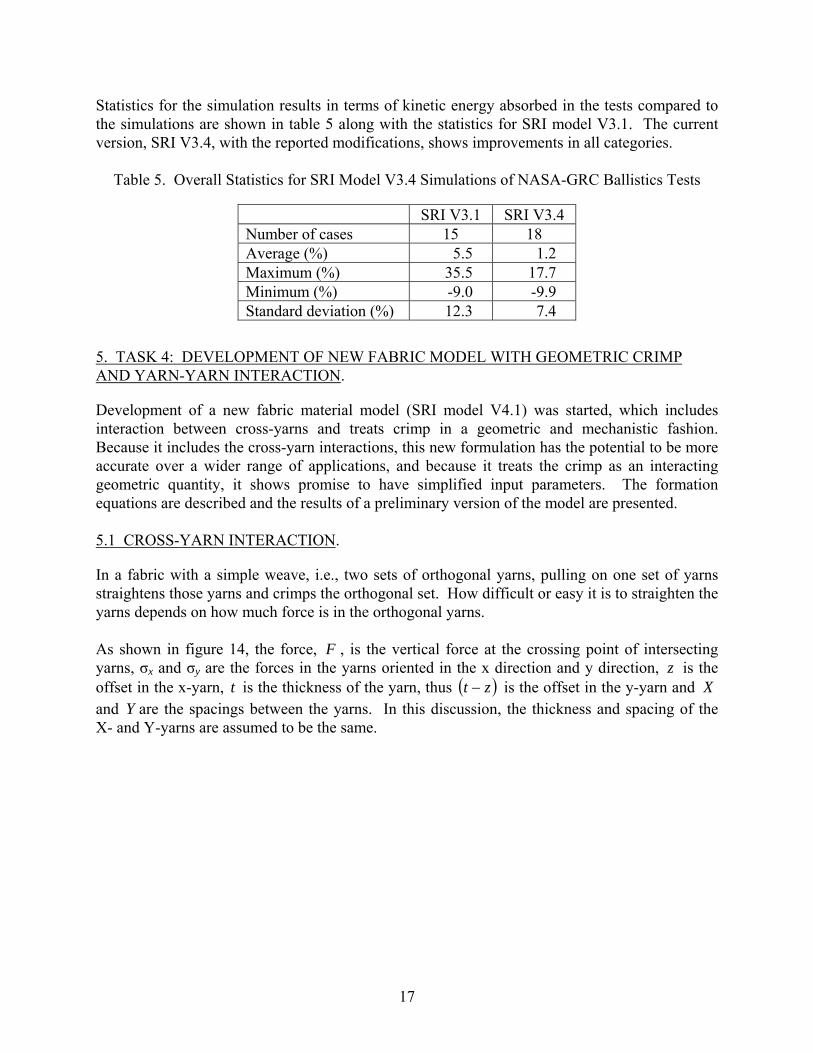
Statistics for the simulation results in terms of kinetic energy absorbed in the tests compared to the simulations are shown in table 5 along with the statistics for SRI model V3.1. The current version, SRI V3.4, with the reported modifications, shows improvements in all categories.
Table 5. Overall Statistics for SRI Model V3.4 Simulations of NASA-GRC Ballistics Tests
SRI V3.1 SRI V3.4 Number of cases 15 18 Average (%) 5.5 1.2 Maximum (%) 35.5 17.7 Minimum (%) -9.0 -9.9 Standard deviation (%) 12.3 7.4
5. TASK 4: DEVELOPMENT OF NEW FABRIC MODEL WITH GEOMETRIC CRIMP AND YARN-YARN INTERACTION.
Development of a new fabric material model (SRI model V4.1) was started, which includes interaction between cross-yarns and treats crimp in a geometric and mechanistic fashion. Because it includes the cross-yarn interactions, this new formulation has the potential to be more accurate over a wider range of applications, and because it treats the crimp as an interacting geometric quantity, it shows promise to have simplified input parameters. The formation equations are described and the results of a preliminary version of the model are presented. 5.1 CROSS-YARN INTERACTION.
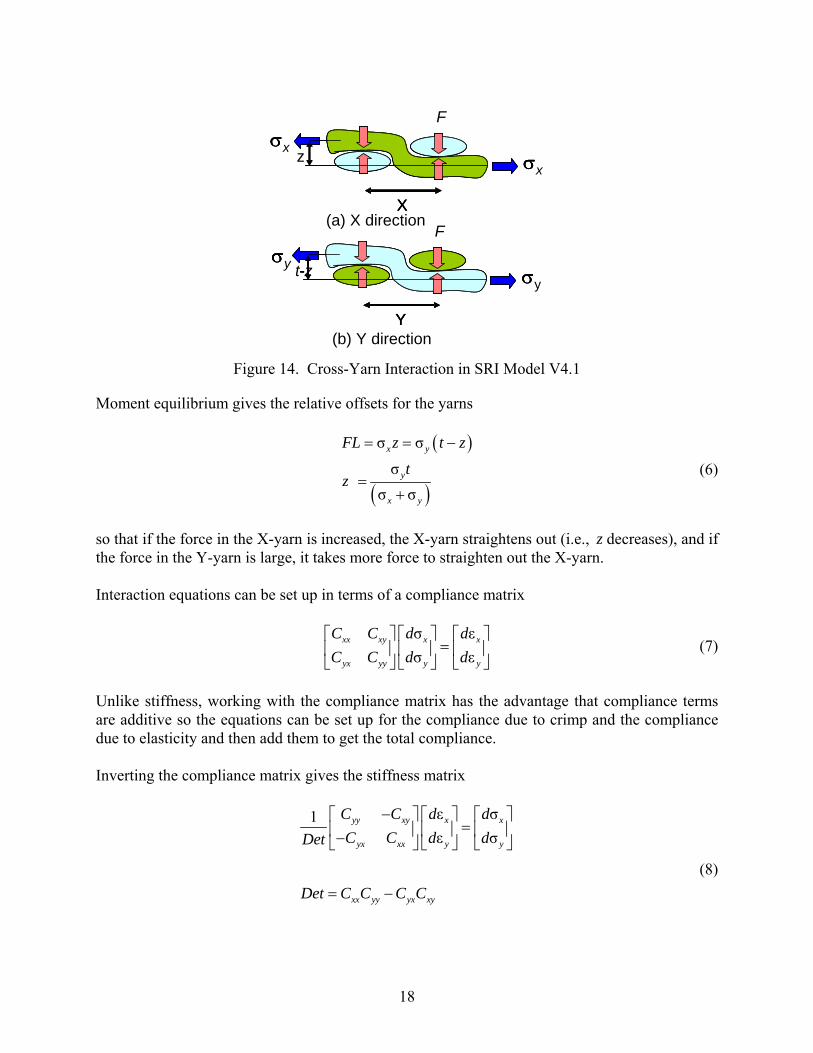
In a fabric with a simple weave, i.e., two sets of orthogonal yarns, pulling on one set of yarns straightens those yarns and crimps the orthogonal set. How difficult or easy it is to straighten the yarns depends on how much force is in the orthogonal yarns. As shown in figure 14, the force, , is the vertical force at the crossing point of intersecting yarns, σx and σy are the forces in the yarns oriented in the x direction and y direction,
Fz is the
offset in the x-yarn, is the thickness of the yarn, thus t ( )zt − is the offset in the y-yarn and X and Y are the spacings between the yarns. In this discussion, the thickness and spacing of the X- and Y-yarns are assumed to be the same.
17
F
z
σ xσ σ
σσσx
X(a) X direction
XXF
t -z --σ yσ σ
σσσy
Y(b) Y direction
YY
Figure 14. Cross-Yarn Interaction in SRI Model V4.1
Moment equilibrium gives the relative offsets for the yarns
( )
( )
σ σ
σσ σ
x y
y
x y
FL z t z
tz
= = −
=+
(6)
so that if the force in the X-yarn is increased, the X-yarn straightens out (i.e., z decreases), and if the force in the Y-yarn is large, it takes more force to straighten out the X-yarn. Interaction equations can be set up in terms of a compliance matrix
σ εσ ε
xx xy x x
yx yy y y
C C d dC C d d⎡ ⎤ ⎡ ⎤ ⎡
=⎢ ⎥ ⎢ ⎥ ⎢⎣ ⎦ ⎣ ⎦ ⎣
⎤⎥⎦
(7)
Unlike stiffness, working with the compliance matrix has the advantage that compliance terms are additive so the equations can be set up for the compliance due to crimp and the compliance due to elasticity and then add them to get the total compliance. Inverting the compliance matrix gives the stiffness matrix
ε σ1ε σ
yy xy x x
yx xx y y
xx yy yx xy
C C d dC C d dDet
Det C C C C
−⎡ ⎤ ⎡ ⎤ ⎡ ⎤=⎢ ⎥ ⎢ ⎥ ⎢ ⎥−⎣ ⎦ ⎣ ⎦ ⎣ ⎦
= − (8)
18
The compliance terms are computed by taking partial derivatives of the stresses with respect to the strains. The compliance due to crimp is given in equation 9.
εσεσ
εσεσ
xxx
x
xxy
y
yyx
x
yyy
y
C
C
C
C
∂=∂∂
=∂
∂=∂∂
=∂
(9)
Because the strains are functions of the offset, the chain rule is used
ε εσ σε εσ σ
ε εσ
ε εσ σ
x x xxx
x x x
x x xxy
y x
y y
y
xyx
x x x
y y xyy
y x
zCz
zCz
zCz
zCz y
∂ ∂ ∂= =∂ ∂ ∂∂ ∂ ∂
= =∂ ∂ ∂
∂ ∂ ∂= =∂σ ∂ ∂∂ ∂ ∂
= =∂ ∂ ∂
(10)
From equation 6
( ) ( )
( )(
( ))
2
2
σσ σ σσ σ
σσ σ σσ σ
yx x
x x yx y
xx x
y x yx y
tz z
t zz t
−∂ −= =
∂ ++
− −∂= =
∂ ++
(11)
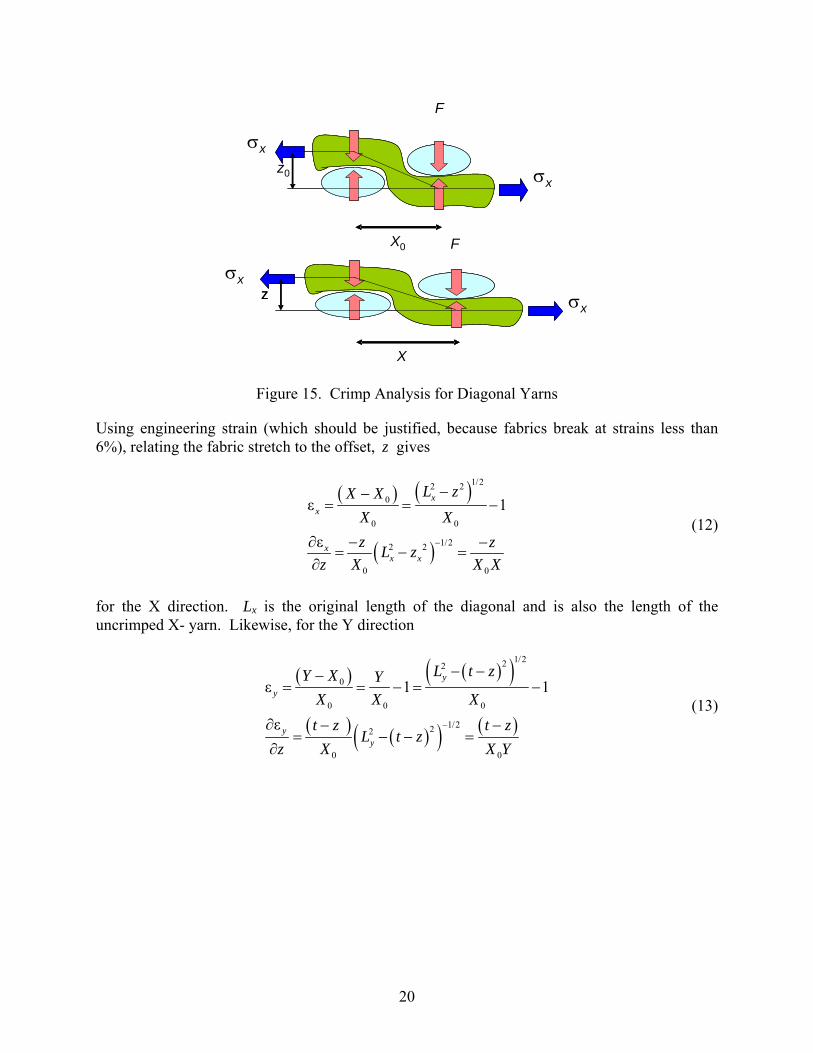
5.2 RELATING THE ROTATIONAL STRAIN TO THE OFFSET.
As a yarn is pulled, the yarn straightens out, which lengthens the yarn, that is, the yarn undergoes lengthening, i.e., tensile strain due to a reduction in the amount of crimp. To calculate this elongation correctly would require that the shape of the yarn is known as it straightens. As a first approximation, it is assumed that the crimped yarn is simply on a diagonal, as shown in figure 15, and that straightening the yarn changes the slope of the diagonal. Assuming for this partition of strain that the yarn does not stretch, the relationship between the offset and the strain can be found using the geometry of the interwoven yarns.
19
F
σ x z 0 σx
X F0
Figure 15. Crimp Analysis for Diagonal Yarns
Using engineering strain (which should be justified, because fabrics break at strains less than 6%), relating the fabric stretch to the offset, z gives
( ) ( )
( )
1/22 20
0 0
1/22 2
0 0
ε 1
ε
xx
xx x
L zX XX Xz zL z
z X X X−
−−= =
∂ −
−
−= − =
∂
(12)
for the X direction. Lx is the original length of the diagonal and is also the length of the uncrimped X- yarn. Likewise, for the Y direction
( ) ( )( )
( ) ( )( ) ( )
1/222
0
0 0 0
1/222
0 0
ε 1 1
ε
y
y
yy
L t zY X YX X Xt z t z
L t zz X X Y
−
− −−= = − =
∂ − −= − − =
∂
− (13)
σ x
X
z z σ x
20
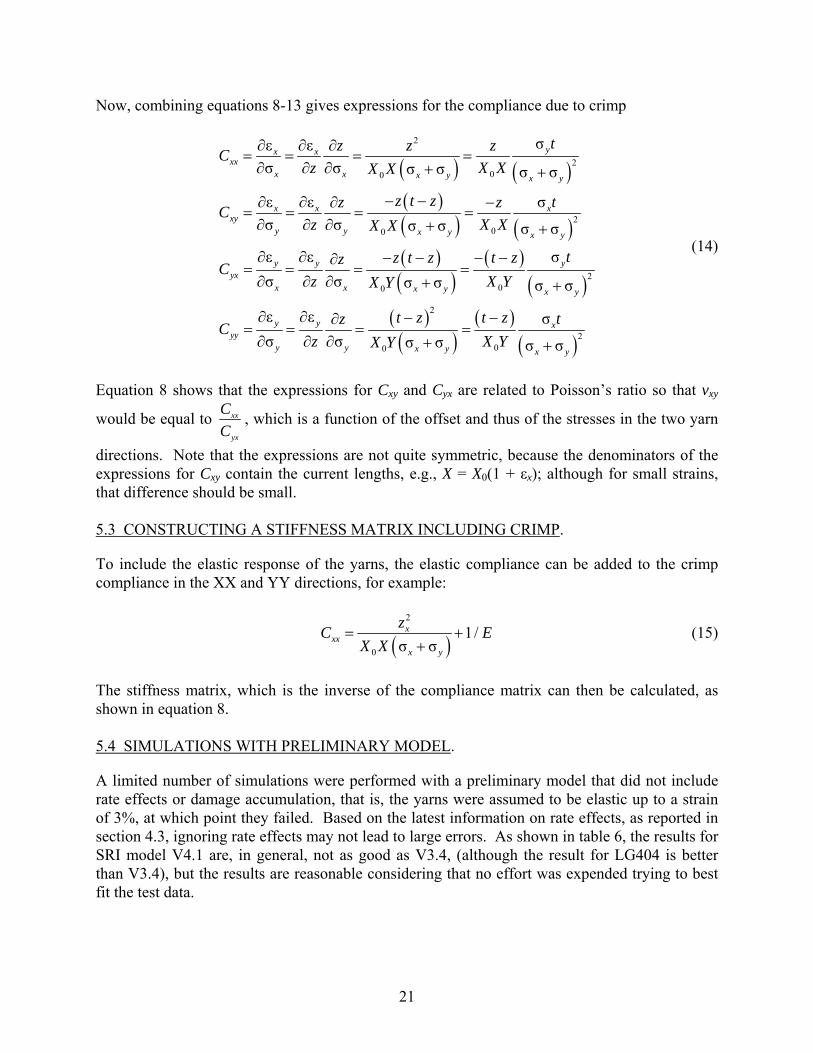
Now, combining equations 8-13 gives expressions for the compliance due to crimp
( ) ( )( )( ) ( )( )( )
( )( )
( )( )
( )( )
2
200
200
200
2
200
σε εσ σ σ σ σ σ
ε ε σσ σ σ σ σ σ
ε ε σσ σ σ σ σ σ
ε ε σσ σ σ σ σ σ
yx xxx
x x x y x y
x x xxy
y y x y x y
y y yyx
x x x y x y
y y xyy
y y x y x y
tzz zCz X XX X
z t z tz zCz X XX X
tz t z t zzCz X YX Y
t z t z tzCz X YX Y
∂ ∂ ∂= = = =∂ ∂ ∂ + +
− −∂ ∂ ∂ −= = = =∂ ∂ ∂ + +
∂ ∂ − − − −∂= = = =∂ ∂ ∂ + +
∂ ∂ − −∂= = = =∂ ∂ ∂ + +
(14)
Equation 8 shows that the expressions for Cxy and Cyx are related to Poisson’s ratio so that vxy
would be equal to yx
xx
CC , which is a function of the offset and thus of the stresses in the two yarn
directions. Note that the expressions are not quite symmetric, because the denominators of the expressions for Cxy contain the current lengths, e.g., X = X0(1 + εx); although for small strains, that difference should be small. 5.3 CONSTRUCTING A STIFFNESS MATRIX INCLUDING CRIMP.
To include the elastic response of the yarns, the elastic compliance can be added to the crimp compliance in the XX and YY directions, for example:
( )2
0
1/σ σ
xxx
x y
zCX X
=+
E+ (15)
The stiffness matrix, which is the inverse of the compliance matrix can then be calculated, as shown in equation 8. 5.4 SIMULATIONS WITH PRELIMINARY MODEL.
A limited number of simulations were performed with a preliminary model that did not include rate effects or damage accumulation, that is, the yarns were assumed to be elastic up to a strain of 3%, at which point they failed. Based on the latest information on rate effects, as reported in section 4.3, ignoring rate effects may not lead to large errors. As shown in table 6, the results for SRI model V4.1 are, in general, not as good as V3.4, (although the result for LG404 is better than V3.4), but the results are reasonable considering that no effort was expended trying to best fit the test data.
21
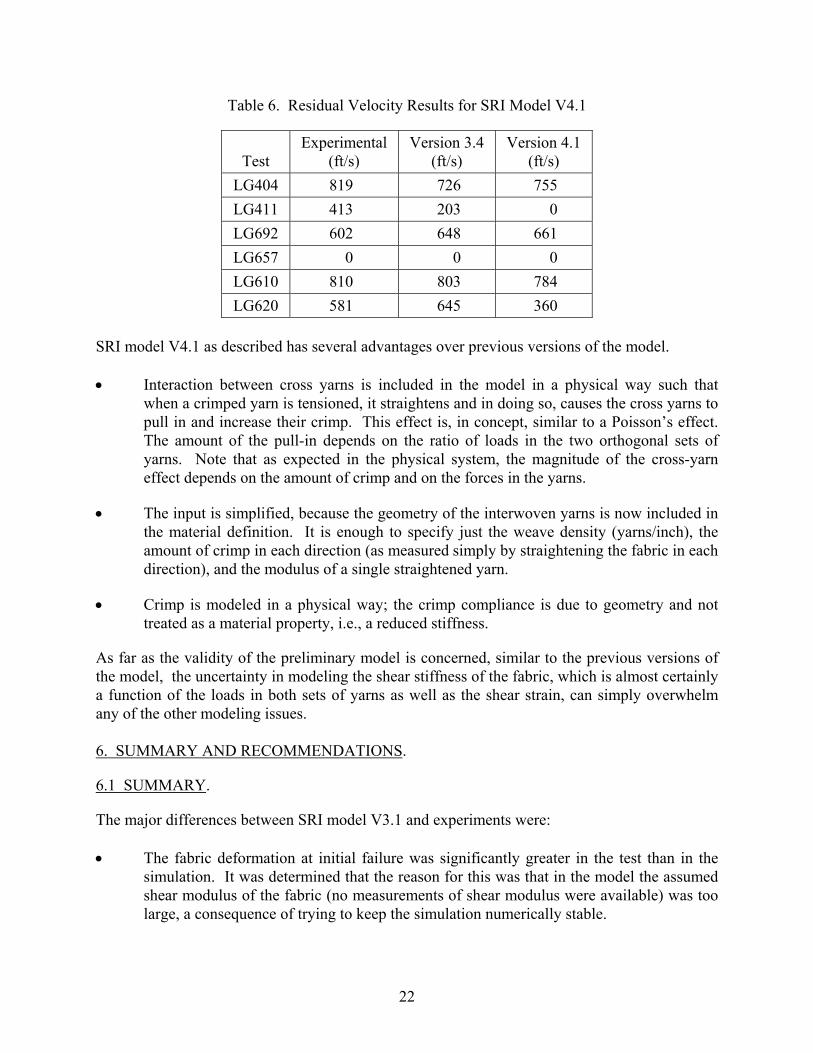
Table 6. Residual Velocity Results for SRI Model V4.1
Test Experimental
(ft/s) Version 3.4
(ft/s) Version 4.1
(ft/s) LG404 819 726 755 LG411 413 203 0 LG692 602 648 661 LG657 0 0 0 LG610 810 803 784 LG620 581 645 360
SRI model V4.1 as described has several advantages over previous versions of the model. • Interaction between cross yarns is included in the model in a physical way such that
when a crimped yarn is tensioned, it straightens and in doing so, causes the cross yarns to pull in and increase their crimp. This effect is, in concept, similar to a Poisson’s effect. The amount of the pull-in depends on the ratio of loads in the two orthogonal sets of yarns. Note that as expected in the physical system, the magnitude of the cross-yarn effect depends on the amount of crimp and on the forces in the yarns.
• The input is simplified, because the geometry of the interwoven yarns is now included in the material definition. It is enough to specify just the weave density (yarns/inch), the amount of crimp in each direction (as measured simply by straightening the fabric in each direction), and the modulus of a single straightened yarn.
• Crimp is modeled in a physical way; the crimp compliance is due to geometry and not treated as a material property, i.e., a reduced stiffness.
As far as the validity of the preliminary model is concerned, similar to the previous versions of the model, the uncertainty in modeling the shear stiffness of the fabric, which is almost certainly a function of the loads in both sets of yarns as well as the shear strain, can simply overwhelm any of the other modeling issues. 6. SUMMARY AND RECOMMENDATIONS.
6.1 SUMMARY.
The major differences between SRI model V3.1 and experiments were: • The fabric deformation at initial failure was significantly greater in the test than in the
simulation. It was determined that the reason for this was that in the model the assumed shear modulus of the fabric (no measurements of shear modulus were available) was too large, a consequence of trying to keep the simulation numerically stable.
22
• In the model, the fabric tears cleanly across the swath, but in the tests, the fabric sometimes tears in nonstraight patterns.
• The fabric in the tests appeared to have damage due to yarn pull-out as evidence by the long yarns around the projectile for some of the tests. In the model, yarn pull-out is not possible.
Test repeatability, as judged by the NASA-GRC Phase I tests on Kevlar, is ±15% in energy absorbed in tests that are very close to each other in terms of projectile velocity and orientation. This value was determined in Phase I, which had repeat tests in terms of velocity and projectile with a direct end-on orientation. The variations in energy absorbed are most likely due to (1) uncertainty in the measurement in velocity, especially for the tests in which little energy was absorbed by the fabric and (2) variations in projectile orientation. The parameter for any of the fabric models with the largest effect on energy absorbed is shear modulus. Variations within a factor of two in shear modulus can make the difference between yarns failing and not for a wide range of test conditions. It is also the physical property that is likely the least well-characterized, not only in terms of value but also in terms of functional dependence of other terms such as loads in yarns and shear strain. Furthermore, low values of shear modulus, which seem appropriate for unloaded yarns, can cause numerical instabilities in the response. Besides the fabric material model, several computational parameters have significant effect on simulation quality, including contact parameters and plasticity in the material model for the projectile. Improvements were made in the simulation model, including reducing the shear modulus, modifying the damage model and rate dependence for the fabric model, adding contact damping and a more stringent contact search in the interfaces, as well as plasticity in the projectile material model. SRI Version 3.4 resulted in significant improvements for the NASA-GRC Phase I and II tests compared to Version 3.1. A new model, SRI Version 4.1, was introduced that greatly simplifies input needed for describing fabrics and automatically treats crimp and yarn-to-yarn interactions. Preliminary simulations show that the model is promising, but more development is needed. 6.2 RECOMMENDATIONS.
The following recommendations are suggested for future research. • Acquire better data on the fabric shear modulus as a function of yarn forces and shear
strains. Use these data to calibrate shear modulus function in the fabric model.
• Acquire definitive results for rate effects. Rate effects on fabric response have been assumed to be significant based on previous data. However, current research by Wang shows that Kevlar is not very rate-dependent across a range of rates of interest for this
23
24
application. A comprehensive set of tests is needed to determine what the rate effect actually is.
• The initial development of SRI fabric model Version 4.1 with cross-yarn interaction and simplified input shows promise of a significant improvement in modeling the fabric for a range of applications that are not simple wraps, i.e., situations where stresses develop in two directions. This model should be further developed.
• Develop better tests and model for determining failure criteria as function of forces in both yarn directions. The models used to date for failure of fabric have been simplistic in assuming that the fabric fails if yarns in a single direction fail. More comprehensive biaxial testing of fabrics is needed to determine a more valid set of criteria for fabric failure.
7. REFERENCES.
1. Rajan, S.D., Mobasher, B., Sharda, J., Yanna, V., Deenadayla, C., Lau, D., and Shah, D., “Explicit Finite Element Modeling of Multilayer Composite Fabric for Gas Turbine Engine Containment Systems, Part 1: Static Tests and Modeling,” FAA report DOT/FAA/AR-04/40,P1, November 2004.
2. Periera, M. and Revilock, D., “Explicit Finite Element Modeling of Multilayer Composite Fabric for Gas Turbine Engine Containment Systems, Part 2: Ballistic Impact Testing,” FAA report DOT/FAA/AR-04/40,P2, November 2004.
3. Simons, J., Erlich, D., and Shockey, D., “Explicit Finite Element Modeling of Multilayer Composite Fabric for Gas Turbine Engine Containment Systems, Part 3: Model Development and Simulation of Experiments,” FAA report DOT/FAA/AR-04/40,P3, November 2004.
4. Gomuc, R., “Explicit Finite Element Modeling of Multilayer Composite Fabric for Gas Turbine Engine Containment Systems, Part 4: Model Simulation for Ballistic Tests, Engine Fan Blade-Out and Generic Engine,” FAA report DOT/FAA/AR-04/40,P4, November 2004.
5. Rajan, S.D., Mobasher, B., Stahlecker, Z., Naik, D., and Sankaran, S., “Explicit Finite Element Analysis Modeling of Multilayer Composite Fabric for Gas Turbine Engine Containment Systems, Phase II, Part 1: Fabric Material Tests and Modeling,” FAA report DOT/FAA/AR-08/37,P1, February 2009.
6. Revilock, D.M. and Pereira, J.M., “Explicit Finite Element Analysis Modeling of
Multilayer Composite Fabric for Gas Turbine Engine Containment Systems, Phase II, Part 2: Ballistic Impact Testing,” FAA report DOT/FAA/AR-08/37,P2, February 2009.
7. Simons, J., Erlich, D., and Shockey, D., “Explicit Finite Element Analysis Modeling of Multilayer Composite Fabric for Gas Turbine Engines Containment Systems, Phase II, Part 3: Material Model Development and Simulation of Experiments,” FAA report DOT/FAA/AR-08/37,P3, February 2009.
8. Vintilescu, I.V., “Explicit Finite Element Analysis Modeling of Multilayer Composite Fabric for Gas Turbine Engines Containment Systems, Phase II, Part 4: Model Simulation for Ballistic Tests, Engine Fan Blade-Out, and Generic Engine,” FAA report DOT/FAA/AR-08/37,P4, February 2009.
9. Wang, Y. and Xia, Y.M., “Experimental and Theoretical Study on the Strain Rate and
Temperature Dependence of Mechanical Behaviour or Kevlar Fibre,” Composites: Part A, Vol. 30, 1999, pp. 1251-1257.
25/26