Embed Size (px)
Citation preview
DOT/FAA/AR-10/16 Air Traffic Organization NextGen & Operations Planning Office of Research and Technology Development Washington, DC 20591
Trends in Accidents and Fatalities in Large Transport Aircraft June 2010 Final Report This document is available to the U.S. public through the National Technical Information Services (NTIS), Springfield, Virginia 22161. This document is also available from the Federal Aviation Administration William J. Hughes Technical Center at actlibrary.tc.faa.gov.
U.S. Department of Transportation Federal Aviation Administration
United Kingdom Civil Aviation Authority

NOTICE This research was commissioned by the Federal Aviation Administration and Transport Canada by means of their respective Memorandums of Cooperation regarding Civil Aviation Research and Development with the Civil Aviation Authority of the United Kingdom. This activity has been carried out in cooperation between the Federal Aviation Administration, Transport Canada, and the UK Civil Aviation Authority under the auspices of the International Cabin Safety Research Technical Group whose goal is to enhance the effectiveness and timeliness of cabin safety research. This document is disseminated under the sponsorship of the U.S. Department of Transportation in the interest of information exchange. The United States Government assumes no liability for the contents of use thereof. The United States Government does not endorse products or manufacturers. Trade or manufacturer’s names appear herein solely because they are considered essential to the objective of this report. This document does not constitute FAA certification policy. Consult your local FAA aircraft certification office as to its use. This report is available at the Federal Aviation Administration William J. Hughes Technical Center’s Full-Text Technical Reports page: actlibrary.tc.faa.gov in Adobe Acrobat portable document format (PDF).

Technical Report Documentation Page 1. Report No.
DOT/FAA/AR-10/16
2. Government Accession No. 3. Recipient's Catalog No.
4. Title and Subtitle
TRENDS IN ACCIDENTS AND FATALITIES IN LARGE TRANSPORT AIRCRAFT
5. Report Date
June 2010
6. Performing Organization Code
7. Author(s)
R.G.W. Cherry & Associates Limited
8. Performing Organization Report No.
9. Performing Organization Name and Address
R.G.W. Cherry & Associates Limited The Priory, High Street SG129AL Ware, Herfordshire
10. Work Unit No. (TRAIS)
United Kingdom 11. Contract or Grant No.
12. Sponsoring Agency Name and Address
U.S. Department of Transportation Federal Aviation Administration Air Traffic Organization NextGen & Operations Planning Office of Research and Technology Development Washington, DC 20591
13. Type of Report and Period Covered Final Report
14. Sponsoring Agency Code ANM-115
15. Supplementary Notes
Jointly funded by the Federal Aviation Administration and Transport Canada. The FAA Airport and Aircraft Safety R&D Division Technical Monitor was Richard Hill. 16. Abstract
This study is based on 1036 accidents (of which 672 were survivable) that occurred between 1968 and 2007 involving large transport category turbojet and turboprop western-built aircraft operating in a passenger or passenger/cargo role. Over the study period, there was a marked reduction in the total accident rate both for the world fleet and the combined U.S. and Canadian fleets. This reduction is apparent when the accident rate is measured on a per flight, per passenger, or per revenue passenger mile basis. The survivability of accidents has also shown a marked improvement over the study period with a greater proportion of accidents being survivable and a marked increase in the proportion of occupants surviving an accident. These improvements are apparent in both the world fleet and the combined U.S. and Canadian fleets. It would seem that fatalities attributable to impact represent a larger proportion of the total number of fatalities in survivable accidents than those that are caused by fire. 17. Key Words
Aircraft accidents, Aircraft trends, Aircraft fire, Accident statistics
18. Distribution Statement
This document is available to the U.S. public through the National Technical Information Service (NTIS), Springfield, Virginia 22161. This document is also available from the Federal Aviation Administration William J. Hughes Technical Center at actlibrary.tc.faa.gov.
19. Security Classif. (of this report) Unclassified
20. Security Classif. (of this page) Unclassified
21. No. of Pages 34
22. Price
Form DOT F 1700.7 (8-72) Reproduction of completed page authorized
TABLE OF CONTENTS
Page EXECUTIVE SUMMARY vii 1. INTRODUCTION 1
1.1 Objectives 1 1.2 Scope 2
2. METHODOLOGY 2
2.1 Accidents Selected for Analysis 2 2.2 Categorization of Accidents 3
2.2.1 Accident 3 2.2.2 Nonsurvivable Accident 3 2.2.3 Survivable Accident 4
2.3 Assessment of Occupant Survivability 5
2.3.1 Number of Occupants 5 2.3.2 Fatalities by Cause of Death 5
2.4 Flights, Passengers, and Revenue Passenger Miles Statistics 6
3. RESULTS 6
3.1 Accident Trends 7
3.1.1 Accident Numbers 7 3.1.2 Accident Rates 8
3.2 Fatality Trends 11
3.2.1 Fatality Numbers 11 3.2.2 Fatality Rates 12
3.3 Survivability Trends 14
3.3.1 Probability of an Accident Being Survivable 14 3.3.2 Probability of Death in a Survivable Accident 14
iii
3.4 Trends in Cause of Death 15 3.5 In-Flight Fire Accidents 17
4. REFERENCES 17
APPENDICES A—Aircraft Types Analyzed in the Study B—Aircraft Flights, Passengers, and Revenue Passenger Miles
iv
LIST OF FIGURES
Figure Page 1 Annual Number of Accidents and Survivable Accidents—World Fleet 7
2 Annual Number of Accidents and Survivable Accidents—U.S. and Canadian Fleets 8
3 Accident Rate per Million Flights—All Accidents and Survivable Accidents— World Fleet 8
4 Accident Rate per 100-Million Revenue Passenger Miles—All Accidents and Survivable Accidents—World Fleet 9
5 Accident Rate per Million Flights—All Accidents and Survivable Accidents— U.S and Canadian Fleets 10
6 Accident Rate per Million Flights—All Accidents—Turbojets and Turboprops— World Fleet 10
7 Accident Rate per Million Flights—All Accidents—Turbojets and Turboprops— U.S. and Canadian Fleets 11
8 Number of Fatalities—All Accidents and Survivable Accidents—World Fleet 12
9 Number of Fatalities—All Accidents and Survivable Accidents—U.S and Canadian Fleets 12
10 Fatality Rate—All Accidents and Survivable Accidents—World Fleet 13
11 Fatality Rate—All Accidents and Survivable Accidents—U.S. and Canadian Fleets 13
12 Probability of an Accident Being Survivable—World Fleet and U.S. and Canadian Fleets 14
13 Probability of Death in a Survivable Accident—World Fleet and U.S. and Canadian Fleets 15
14 Cause of Death in a Survivable Accident—World Fleet 15
15 Proportion of Fatalities by Cause in a Survivable Accident—World Fleet 16
16 In-Flight Fire Accidents Over the Study Period 17
v

vi
LIST OF ACRONYMS ASN Aviation Safety Network CAA Civil Aviation Authority CSRTG Cabin Safety Research Technical Group FAA Federal Aviation Administration NTSB National Transportation Safety Board UK United Kingdom

EXECUTIVE SUMMARY
Over the past 40 years, many safety enhancements have been instituted as a result of advances in technology, and by regulations derived from research, aimed at improving aircraft safety through accident prevention and occupant survivability enhancement. However, the magnitude of these improvements has not been quantified precisely. Therefore, the Federal Aviation Administration and Transport Canada have commissioned this study with the broad aim of identifying the degree of improvement in aircraft safety and occupant survivability that has been achieved. The intention is that the results of the study can help in the determination of the future direction of any regulatory activity, particularly in relation to occupant survivability. The most significant findings of the study are contained within this report. The study is based on 1036 accidents (of which 672 were survivable) that occurred between 1968 and 2007 involving large transport category turbojet and turboprop western-built aircraft operating in a passenger or passenger/cargo role. Over the study period, there was a marked reduction in the total accident rate both for the world fleet and the combined U.S. and Canadian fleets. This reduction is apparent when the accident rate is measured on a per flight, per passenger, or per revenue passenger mile basis. The survivability of accidents has also shown a marked improvement over the study period with a greater proportion of accidents being survivable and the proportion of occupants surviving an accident increased markedly. These improvements are apparent in both the world fleet and the combined U.S. and Canadian fleets. It would seem that fatalities attributable to impact represent a larger proportion of the total number of fatalities in survivable accidents than those that are caused by fire. However, the extent to which the number of fatalities attributable to each of these two areas might be reduced was beyond the scope of this study.
vii/viii

1. INTRODUCTION.
Over the past 40 years, many safety enhancements have been instituted as a result of advances in technology, and by regulations derived from research, aimed at improving aircraft safety through accident prevention and occupant survivability enhancement. However, the magnitude of these improvements has not been quantified precisely. Earlier studies carried out on behalf of Transport Canada [1 and 2] gave an indication of the likely direction of improvements in aircraft accident rates, albeit limited by the data available at the time. The development of the Cabin Safety Research Technical Group (CSRTG) Accident Database has resulted in improved availability of sufficient data. This has facilitated the task of analyzing the magnitude of the safety improvements that have been achieved. The broad aim of this study was, therefore, to identify the degree of improvement in aircraft safety and occupant survivability to enable the airworthiness authorities to determine the future direction of research and regulatory activity, particularly in relation to occupant survivability. This study has identified and analyzed all the data required to meet the objectives defined in section 1.1. However, for reasons of clarity, only the most significant results of the analysis are presented in this report. The complete data set has been made available to the Federal Aviation Administration (FAA) and Transport Canada, who commissioned this study in association with the United Kingdom (UK) Civil Aviation Authority (CAA). 1.1 OBJECTIVES.
The broad objectives of the study were to make determinations of • The total number of fatalities in all accidents (survivable and nonsurvivable)
• The total number of occupants per year involved in survivable accidents
• The total number of fatalities per year involved in survivable accidents
• The total number of fire fatalities per year involved in survivable accidents
• The total number of impact fatalities per year involved in survivable accidents
• The proportion of the total number of fatalities that are nonsurvivable, survivable impact-related, survivable fire-related, survivable fire- and impact-related, survivable water-related and other
• The proportion of occupants in survivable accidents sustaining fatal injuries resulting from impact, fire, fire and impact, drowning, or other (e.g., caused by turbulence, violent maneuvers, etc.)
• The total number of fatalities, per in-flight fire accident
1
The data analyzed was categorized and analyzed in relation to: • Accidents to the world fleet • Accidents to U.S.-registered aircraft • Accidents to U.S.- and Canadian-registered aircraft • Accidents occurring on U.S. or Canadian soil or within their territorial waters Determinations of the safety trends were made for the western-built fleet of aircraft, as defined in appendix A. Further determinations were made for the western-built fleet, which were subdivided into turbojets and turboprops. The rates of occurrence used in the analysis were derived on a per million flight, per million passengers, and per 100-million revenue passenger mile basis. This report presents the more significant trends in safety; however, data and trend curves were prepared relevant to all the indicators, based on the variables listed above. These are contained in Microsoft® Excel® spreadsheets provided separately to the FAA, Transport Canada, and the UK CAA. 1.2 SCOPE.
The study was based on accidents to large transport category turbojet and turboprop western-built aircraft operating in a passenger or passenger/cargo role. The analysis considered accidents involving the aircraft identified in appendix A between 1968 and 2007. 2. METHODOLOGY.
2.1 ACCIDENTS SELECTED FOR ANALYSIS.
Accidents (as defined in section 2.2) that met the following criteria were selected for analysis using the CSRTG Accident Database version 33: • The accident occurred between 1968 and 2007. • The aircraft type is listed in appendix A. • The aircraft was operating a passenger or combined passenger/cargo flight. • The accident was not caused by an act of terrorism or violence. Although the primary data source was the CSRTG Accident Database, additional information was obtained from the in-house library of accident reports produced by accident investigating authorities. In instances where official data were not available, unofficial data were used, primarily based on the Aviation Safety Network (ASN) database1. Thirty-two accidents were excluded from the study because there was insufficient information to make an assessment as to whether they were survivable or nonsurvivable. There were 1036 accidents selected for analysis that met the criteria specified above.
1ASN Aviation Safety Database—a service of the Flight Safety Foundation http://aviation-safety.net/database/
2
2.2 CATEGORIZATION OF ACCIDENTS.
This study was primarily intended to provide data to assist the airworthiness authorities in their decision-making process regarding the direction of research and regulations related to occupant survivability. As part of the regulatory decision-making process, the authorities were required to undertake cost benefit analyses and regulatory impact assessments to determine the effects of any changes. As a consequence, the definitions of an Accident, a Nonsurvivable Accident, and a Survivable Accident used in this study were developed and agreed to by the FAA and Transport Canada. 2.2.1 Accident.
The FAA and Transport Canada define an accident as:
“An occurrence associated with the operation of an aircraft which takes place between the time any person boards the aircraft with the intention of flight until such time as all such persons have disembarked, in which: a) At least one person is fatally injured or b) The aircraft is destroyed”
2.2.2 Nonsurvivable Accident.
The following definition was used as a basis for determining if an accident was Nonsurvivable:
“A Nonsurvivable Accident is one in which all occupants sustain fatal injuries.” However, accidents were identified where the vast majority of occupants sustained fatal injuries, although a few occupants survived (typically one or two). If in these accidents it was evident that there were no survivability factors that could be identified that might have improved occupant survivability, these accidents were classified as Nonsurvivable. Examples of accidents of this kind include the following:
Tamanrasset B737 - 20032 “On Thursday 6 March 2003, the Boeing 737 registered 7T-VEZ, operated by Air Algérie, was taking off from Tamanrasset to undertake, with a three-hour delay, scheduled flight DAH 6289 to Ghardaia and Algiers. The accident was caused by the loss of an engine during a critical phase of flight, the non-retraction of the landing gear after the engine failure, and the Captain, the PNF [pilot not flying], taking over control of the aircraft before having clearly identified the problem. The aircraft, with landing gear extended, struck the ground on its right side. A severe fire broke out immediately.
2This account of the accident is based on a translation of the accident report. As accurate as the translation may be, the original text of the accident report should be considered as the work of reference.
3

Six crew members (two flight crew and four cabin crew) and 97 passengers were on board. All six crew were fatally injured. Of the 97 passengers on board, 96 passengers were fatally injured and one passenger was seriously injured. Only one passenger, seated in the last row and with seat belt unattached, according to his statement, was ejected from the plane by the impact and escaped from the accident.” Detroit MD-82 - 19873 “On 16-Aug-1987 a Northwest DC-9-82 (MD82) registered as N312RC was taking off without the flaps and slats extended. After lift-off, the aircraft collided with obstacles northeast of the runway and broke up as it slid across the ground and post-impact fires erupted along the wreckage path. Of the persons on board, 148 passengers and six crew members were killed; the only survivor, a four year old child, was seriously injured.”
Of the 1036 accidents selected for analysis, 364 were categorized as Nonsurvivable. 2.2.3 Survivable Accident.
The following definition was used as a basis for determining if an accident was survivable.
“An Accident that is not Nonsurvivable, but involves at least one Fatal Injury or the aircraft was destroyed.”
Some accidents, classified as Survivable, involved areas of the aircraft that were clearly Nonsurvivable. An example of such an accident is as follows:
Dallas L1011- 19854 “On 2-Aug-1985, Delta Airlines Lockheed L1011-385-1, N726DA, crashed while passing through a microburst. The aircraft struck the ground about 6300 feet north of the approach end of the runway, disintegrated during the impact sequence, and a severe fire erupted during the impact sequence. Of the 163 persons aboard, 134 passengers and crewmembers were killed; 26 passengers and 3 cabin attendants survived. The forward cabin containing the cockpit and first 12 rows of passenger seats was destroyed on impact with the water tanks, and there were no survivors from this part of the airplane.”
In the above accident, for the occupants located in the cockpit and first 12 rows of passenger seats, the impact injuries were clearly not survivable, and it is evident that no survivability factors could have increased their chance of survival. However, accidents of this nature were classified as Survivable. Of the 1036 accidents selected for analysis, 672 were categorized as Survivable.
3This account of the accident is based on the National Transportation Safety Board (NTSB) Report AAR-88-5. 4This account of the accident is based on NTSB Report AAR-86/05.
4

In some instances, it was difficult to classify the accident as Survivable or Nonsurvivable. For example, some accidents were 100% fatal but, nevertheless, were considered as Survivable since factors could be identified that might have improved occupant survivability. However, the number of accidents that are not clearly in one category or the other is small and, hence, does not significantly affect the overall conclusions that may be derived from this study. 2.3 ASSESSMENT OF OCCUPANT SURVIVABILITY.
To assess trends in occupant survivability, an evaluation was required for each Survivable Accident: • The number of occupants onboard the aircraft • The number of fatalities by cause of death In certain instances, accidents were identified for which there was insufficient data to determine the precise value for each of these numbers; in these cases, their probable values had to be assessed. The following sections discuss the approaches that were used to make these assessments and the number of accidents that were involved. 2.3.1 Number of Occupants.
The number of occupants (passengers and crew) was determined from the CSRTG Accident Database. However, 17 Survivable Accidents were identified for which data were not available as to the number of occupants. Since the aircraft type was known, data was extracted from the CSRTG Accident Database to assess the average and likely range of the number of occupants in previous accidents to the aircraft type. For these 17 accidents, random selections were made of the distribution of the total number of occupants to determine values that could be used in the assessment of survivability. 2.3.2 Fatalities by Cause of Death.
For each Survivable Accident, the number of fatalities resulting from each of the following causes was identified. • Impact
• Fire
• Impact and fire (incapacitation or immobilization by impact followed by death by fire)
• Water (drowning)
• Other—“Other” causes of death include injury from turbulence or an in-flight upset, engine blade separation resulting in cabin penetration, falling from an evacuation slide,
5
being sucked out of an opening in the aircraft during flight, asphyxiation by seat belt (child), and explosive door opening due to cabin pressure on the ground.
No determination was made as to the cause of death of the Nonsurvivable Accidents. For some of the Survivable Accidents, there was insufficient information available to determine the cause of some or all fatalities. This occurred if the cause of death was not determined in the course of the accident investigation, if the accident report did not document the cause, or if the official accident report was not available. For accidents that involved either impact with no fire or fire with no impact, the cause of death was obvious. However, in 224 of the Survivable Accidents, the occupants were subjected to both impact and fire, and in 157 of these accidents, the cause of death could not be determined for all occupants. In such cases, the fatalities were randomly assigned to impact, impact and fire, or fire in a proportionate manner over the known possible range. 2.4 FLIGHTS, PASSENGERS, AND REVENUE PASSENGER MILES STATISTICS.
For each year from 1968 to 2007 inclusive, the number of flights, passengers carried, and revenue passenger miles were assessed for western-built aircraft and are provided in appendix B. The following sources were used as a basis for assessing the data: 1. The UK CAA Hours and Landings Database (flight hours and flights—for the U.S. and
worldwide)
2. RITA (Research and Innovative Technology Administration) Bureau of Transportation Statistics (passengers and revenue passenger miles for the U.S.)
3. Transportation in Canada—An Overview (Passengers for Canada)
In many instances, the dataset was incomplete for the period covered in this study or was not divided into turbojets and turboprops. As a consequence, estimates had to be made for much of the data contained in appendix B. Estimates were crosschecked to ensure that the assumptions made were reasonably accurate and produced meaningful results. The most comprehensive data available was that relating to the number of flights for the U.S. and worldwide (taken from data source 1 above). Hence, these data were used as a basis for assessing much of the data regarding number of passengers and revenue passenger miles. Checks were made to ensure that the number of passengers per flight and the stage length in miles that might be inferred from the interpolations and extrapolations were reasonable. 3. RESULTS.
Over 400 graphs were generated as part of this study in an attempt to determine the rate of improvement in safety indicators. However, meaningful trends can only be produced when there are sufficient data to accommodate statistical variation. Therefore, only those trends that were considered to be statistically significant have been reproduced in this report.
6

3.1 ACCIDENT TRENDS.
3.1.1 Accident Numbers.
The average number of Accidents and Survivable Accidents to the world fleet of western-built aircraft is shown in figure 1 for the period 1970 to 20055 inclusive. Figure 1 also shows the annual number of flights appropriate to the accident data set, i.e., those accumulated by the western-built aircraft contained in appendix A.
Flights
(Millions)
Acciden
ts
Flights AccidentsAll
Survivable Accidents
Accidents—World Fleet(5‐Year Centered Moving Average)
Year20001995199019851980 1975
40 35 30
20 25
15 10 5 0 1970
40 35 30
20 25
15
5 10
0 2005
Figure 1. Annual Number of Accidents and Survivable Accidents—World Fleet
Figure 1 shows that the annual number of Accidents and Survivable Accidents to the western-built world fleet has decreased since the mid-1990s despite the large increase in the annual number of flights. The decline in the number of Accidents and Survivable Accidents is also exhibited by U.S. and Canadian fleets, as illustrated in figure 2. Also shown in figure 2 is the annual number of flights appropriate to the accident data set, i.e., those accumulated by the western-built aircraft contained in appendix A that are U.S.- or Canadian-registered.
5The accidents used to obtain the data illustrated in figure 1 encompassed the period 1968 to 2007. However, only the period 1970 to 2005 is illustrated to obtain a meaningful centered moving average.
7

Figure 2. Annual Number of Accidents and Survivable Accidents—U.S. and Canadian Fleets
Accidents—U.S. and Canadian Fleets(5‐Year Centered Moving Average)
40 40
35 35
30 30
25 25
Flig
hts
(Mill
ions
)
Acc
iden
ts
20 20
Flights15 15
10 10All Accidents
5 5 Survivable Accidents
0 0 1970 1975 1980 1985 1990 1995 2000 2005
Year
Figure 2 shows that the annual total number of Accidents and Survivable Accidents to U.S.- and Canadian-registered aircraft has decreased since the late 1980s. 3.1.2 Accident Rates.
3.1.2.1 All Accidents and Survivable Accidents—World Fleet. The reduction in the number of accidents to the world fleet described in section 3.1.1 is attributable to a marked reduction in the accident rate, as illustrated in figure 3.
Acc
iden
ts p
er M
illio
n Fl
ight
s
All Accidents
Survivable Accidents
Accident Rate—World Fleet (5‐Year Centered Moving Average)
Year2005 2000 19951990198519801975
2 . 5
2 . 0
1 . 5
1 . 0
0 . 5
0.0 1970
Figure 3. Accident Rate per Million Flights—All Accidents and Survivable Accidents—World Fleet
8

As expected, similar trends are shown for the accident rate to the world fleet when expressed in terms of millions of passengers carried or on a 100-million revenue passenger miles basis, as shown in figure 4. Figures 3 and 4 also illustrate that the proportion of accidents that are Survivable increased over the study period (this issue is discussed further in section 3.3.1).
Acc
iden
ts p
er 1
00-M
illio
n Pa
x M
iles
AccidentsAll
Survivable Accidents
(5‐Year Centered Moving Average)
Accident Rate—World Fleet
20052000 199519901985Year
19801975
0 . 005
0 . 004
0 . 003
0 . 002
0 . 001
0 . 000 1970
Figure 4. Accident Rate per 100-Million Revenue Passenger Miles—All Accidents and Survivable Accidents—World Fleet
3.1.2.2 All Accidents and Survivable Accidents—U.S. and Canadian Fleets. The accident rate, for the combined U.S. and Canadian fleets, has also improved markedly both in terms of all Accidents and Survivable Accidents, as illustrated in figure 5. The U.S. and Canadian fleets are exhibiting accident rates that are less than half those experienced by the world fleet. Once again, similar trends are shown for the Accident Rate to the U.S. and Canadian fleets when expressed in terms of millions of passengers carried or on a 100-million revenue passenger miles basis.
9

Acc
iden
ts p
er M
illio
n Fl
ight
s
All Accidents
Survivable Accidents
Accident Rate—U.S. and Canadian Fleets (5‐Year Centered Moving Average)
2005 2000 19951985 1990Year
1980
2 . 5
2 . 0
1 . 5
1 . 0
0 . 5
0 . 0 1970 1975
Figure 5. Accident Rate per Million Flights—All Accidents and Survivable Accidents—U.S. and Canadian Fleets
3.1.2.3 All Accidents and Survivable Accidents—Turbojets and Turboprops—World Fleet. Figure 6 shows that for both turbojets and turboprops, the accident rate has improved significantly over the past 30 to 40 years, with turboprops showing the greater rate of improvement. However, the accident rate per flight continues to be significantly higher for turboprops than for turbojets.
Acc
iden
ts p
er M
illio
n Fl
ight
s
Turboprops
Turbojets
Accident Rate—World Fleet (5‐Year Centered Moving Average)
2005 2000 19951985 1990Year
19801975
4 0.3 5.3 0.2 5.2 0.1 5.1 0.0 5.0 0
1970 .
Figure 6. Accident Rate per Million Flights—All Accidents—Turbojets and Turboprops—World Fleet
10
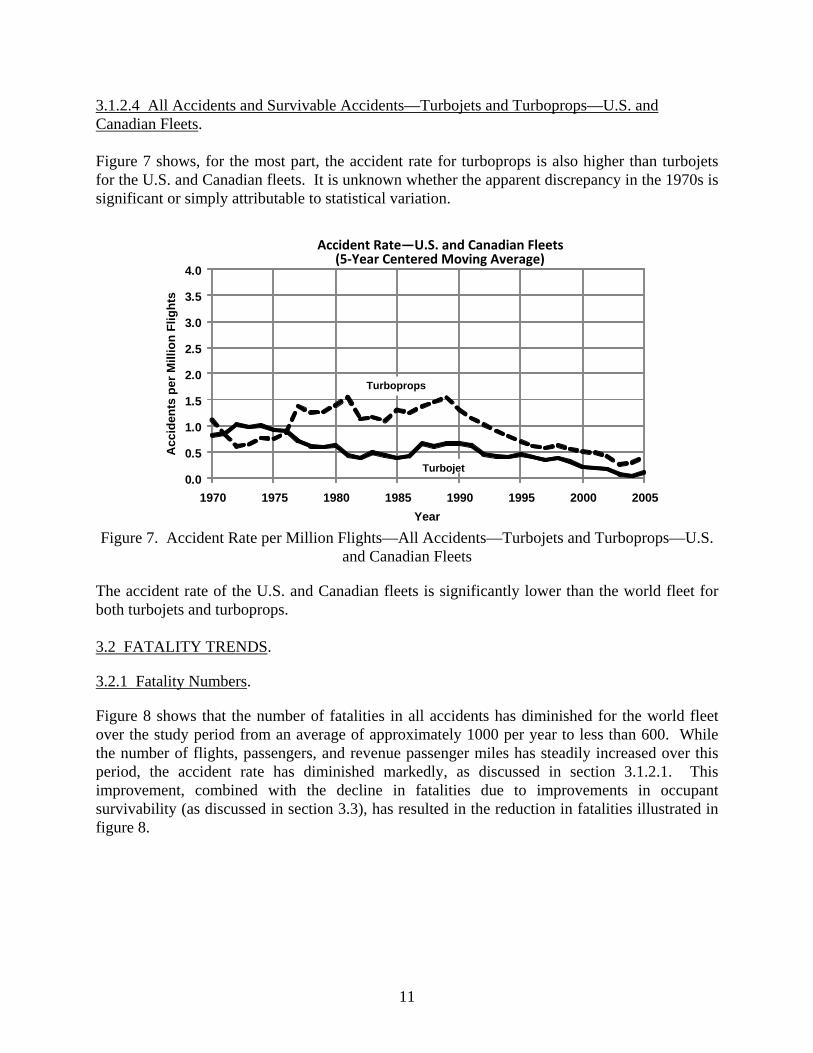
3.1.2.4 All Accidents and Survivable Accidents—Turbojets and Turboprops—U.S. and Canadian Fleets. Figure 7 shows, for the most part, the accident rate for turboprops is also higher than turbojets for the U.S. and Canadian fleets. It is unknown whether the apparent discrepancy in the 1970s is significant or simply attributable to statistical variation.
Figure 7. Accident Rate per Million Flights—All Accidents—Turbojets and Turboprops—U.S.
and Canadian Fleets
Acc
iden
ts p
er M
illio
n Fl
ight
s
Turbojet
Turboprops
Accident Rate—U.S. and Canadian Fleets (5‐Year Centered Moving Average)
Year20052000 19951990198519801975
4 .0 3 .5
3 .0 2 .5 2 .0
1 .5 1 .0 0 .5 0 .0
1970
The accident rate of the U.S. and Canadian fleets is significantly lower than the world fleet for both turbojets and turboprops. 3.2 FATALITY TRENDS.
3.2.1 Fatality Numbers.
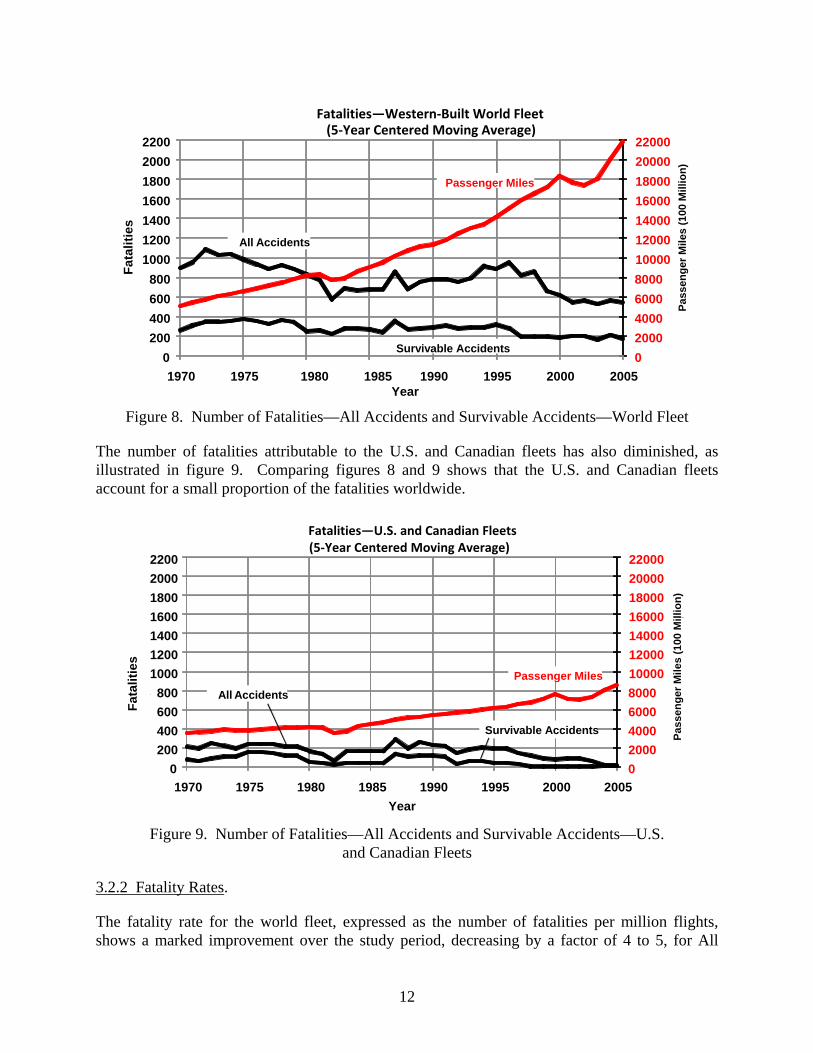
Figure 8 shows that the number of fatalities in all accidents has diminished for the world fleet over the study period from an average of approximately 1000 per year to less than 600. While the number of flights, passengers, and revenue passenger miles has steadily increased over this period, the accident rate has diminished markedly, as discussed in section 3.1.2.1. This improvement, combined with the decline in fatalities due to improvements in occupant survivability (as discussed in section 3.3), has resulted in the reduction in fatalities illustrated in figure 8.
11
Passenger Miles
Survivable Accidents
All Accidents
Fatalities—Western‐Built World Fleet(5‐Year Centered Moving Average)
2000 1995199019851980 19750 1970
200 400 600 800
1000
0 2005
2000
220002200
400060008000100001200014000160001800020000
Pass
enge
r Mile
s (1
00 M
illio
n) 2000
180016001400
Fata
litie
s
1200
Year
Figure 8. Number of Fatalities—All Accidents and Survivable Accidents—World Fleet
The number of fatalities attributable to the U.S. and Canadian fleets has also diminished, as illustrated in figure 9. Comparing figures 8 and 9 shows that the U.S. and Canadian fleets account for a small proportion of the fatalities worldwide.
Fata
litie
s
Passenger Miles
Survivable Accidents
All Accidents
(5‐Year Centered Moving Average)Fatalities—U.S. and Canadian Fleets
Year
I
100
MILLION)
Pass
enge
r Mile
s (1
00 M
illio
n)
2000 1995199019851980 19750 1970
200 400 600 800
1000 1200 1400 1600 1800 2000 2200 22000
200001800016000140001200010000800060004000
0 2005
2000
Figure 9. Number of Fatalities—All Accidents and Survivable Accidents—U.S.
and Canadian Fleets
3.2.2 Fatality Rates.
The fatality rate for the world fleet, expressed as the number of fatalities per million flights, shows a marked improvement over the study period, decreasing by a factor of 4 to 5, for All
12

Accidents, as illustrated in figure 10. The fatality rate for Survivable Accidents has also decreased, although not as markedly as the All Accidents rate. This is primarily attributable to the greater proportion of accidents that are Survivable, as discussed in section 3.3.1.
Survivable Accidents
AccidentAll
Fatality Rate—Western‐Built World Fleet (5‐Year Centered Moving Average)
1975 0 1970
10 20 30 40 50 60 70 80 90
100 110
Fata
litie
s pe
r Mill
ion
Flig
hts
1980 1985Year
1990 1995 2000 2005
Figure 10. Fatality Rate—All Accidents and Survivable Accidents—World Fleet
The U.S. and Canadian fleets have also shown a marked reduction in the fatality rate over the study period, as illustrated in figure 11. Figures 10 and 11 show that the fatality rate for the U.S. and Canadian fleets is lower compared with the world fleet.
Survivable Accidents All Accidents
Fatality Rate—U.S. and Canadian Fleets(5‐Year Centered Moving Average)
2000 199519901985Year
19801975
90 100 110
40 50 60 70 80
0 197
10 20 30
Fata
litie
s pe
r Mill
ion
Flig
hts
2005
Figure 11. Fatality Rate—All Accidents and Survivable Accidents—U.S. and Canadian Fleets
13

3.3 SURVIVABILITY TRENDS.
3.3.1 Probability of an Accident Being Survivable.
Figure 12 shows that over the study period, there has been an improvement in the probability of an accident being Survivable for the world fleet6. The U.S. and Canadian fleets do not appear to exhibit such a steady improvement, although it is likely that over the study period the proportion of accidents that are Survivable has increased.
Prob
abili
ty
World Fleet
U.S. and Canadian Fleets
Probability of an Accident Being Survivable(5‐Year Centered Moving Average)
Year2005200019951990198519801975
1 . 0
0 . 8
. 6 0
. 4 0
0 . 2
0 . 0 1970
Figure 12. Probability of an Accident Being Survivable—World Fleet and U.S. and Canadian Fleets
3.3.2 Probability of Death in a Survivable Accident.
Figure 13 shows that there is a marked improvement in occupant survivability for the world fleet, as measured by the probability of death in a Survivable Accident. The improvement would seem to be in the order of a factor of 2, i.e., from approximately 0.3 to approximately 0.15. For this dataset, a 9-year moving average was used in preference to a 5-year moving average to more clearly identify the underlying trend. This improvement is reflected in the U.S. and Canadian fleets, which appear to have shown an improvement, such that this measure of occupant survivability surpasses that exhibited by the average for the world fleet.
6This probability is simply the ratio of Survivable Accidents to All Accidents.
14

Prob
abili
ty
World Fleet
U.S. and Canadian Fleets
(9‐Year Centered Moving Average)Probability of Death in a Survivable Accident
Year
2005 200019951990198519801975
0 . 4
0 . 3
0 . 2
0 . 1
0 . 0 1970
Figure 13. Probability of Death in a Survivable Accident—World Fleet and U.S. and Canadian Fleets
3.4 TRENDS IN CAUSE OF DEATH.
Figure 14 shows the reduction in fatality rate in Survivable Accidents subdivided into cause of death for the world fleet. The data are presented as a centered 9-year moving average to identify the underlying trend. Because of the limited data on some accidents, compensated to a degree by the use of random numbers described in section 2.3.2, some of the values depicted in the graph cannot be considered as precise.
0.0
0.1
0.2
0.3
0.4
1972
1974
1976
1978
1980
1982
1984
1986
1988
1990
1992
1994
1996
1998
2000
2002
Other Water Impact Impact/Fire Fire
Probability of Death in a Survivable Accident (9-Year Centered Moving Average)
Prob
abili
ty
Year
Figure 14. Cause of Death in a Survivable Accident—World Fleet
15

16
The upper bound of the curve shown in figure 14 simply reflects the data presented in figure 13. As expected, the probability of death due to water (drowning) and those in the “Other” category are small in comparison with those attributable to fire and impact, which are the primary causes of death. The probability of death attributable to fire may have reduced markedly over the study period as have those attributable to impact, although perhaps not to the extent that fire-related deaths have diminished. Deaths attributable to impact and fire are, for the most part, caused by incapacitation or immobilization by impact followed by death by fire. Hence, further mitigation of the fire threat is likely to reduce the deaths of occupants in this category, although not the injuries due to impact. Conversely, had these occupants been uninjured by the impact, they might have survived the accident, provided they were able to evacuate the aircraft prior to being overcome by the fire. To obtain a clearer understanding of the relative magnitude of the five causes of death, each are presented in figure 15 as a proportion of the total number of fatalities in a Survivable accident. Once again, due to the incomplete nature of some of the accident data, precise values cannot be determined from figure 15. It would seem that fatalities attributable to impact represent a larger proportion of the total number of fatalities than those that are caused by fire. However, the extent to which the number of fatalities, attributable to each of these two causes of death, might be reduced was beyond the scope of this study. For some accidents, improvements in impact-related survivability factors may not have prevented all the impact-related fatalities (see section 2.2.2).
0%
10%
20%
30%
40%
50%
60%
70%
80%
90%
100%
1972
1974
1976
1978
1980
1982
1984
1986
1988
1990
1992
1994
1996
1998
2000
2002
Fire Impact/Fire Impact Water Other
Year
Figure 15. Proportion of Fatalities by Cause in a Survivable Accident—World Fleet

The data presented in figures 14 and 15 are based on the world fleet for which there are sufficient data to assess trends. For smaller data sets, such as the U.S. and Canadian fleets, the smaller sample sizes result in large periodical variations from which meaningful trends cannot be determined. 3.5 IN-FLIGHT FIRE ACCIDENTS.
Figure 16 shows the in-flight fires that have occurred to the world fleet over the study period. They are classified as Impact Nonsurvivable, in which the in-flight fire resulted in a nonsurvivable ground impact, and Impact Survivable/No Impact, in which the aircraft landed without resultant impact conditions that would cause death to all of the occupants.
GREENSB
ORO, N
ORTH
CAROLINA, U
SA DC‐9
PARIS, FRANCE
CONCO
RDE
NOVA
SCO
TIA, CANADA M
D‐11 (SR11
1)
MONTR
EAL, CANADA SA‐226
OFF LONG ISLA
ND, U
SA B74
7 (TWA80
0)
EVER
GLA
DES, FLO
RIDA DC‐9
PAPU
A NEW
GUINEA
DHC‐6
JEDDAH, SAUDI A
RABIA DC‐8
SEATTLE, U
SA DHC‐8
MAURITIUS B74
7
MARAVA
TO, M
EXICO B72
7
JEDDAH, SAUDI A
RABIA B70
7
BOMBAY, IN
DIA CARA
VELLE
MANILA, PHILIPPINES HS748
PUER
TA IN
CA, PER
U L18
8
NICE, FRANCE
CARA
VELLE
COOTA
MUNDRA
, AUSTRALIA EMB11
0
BANDUNG, INDONESIA F27
SANTO
DOMINGO, D
OMINICAN REPUBLIC B72
7
STOCK
HOLM
, SWED
EN M
D‐81
BARA
NQUILLA
, COLU
MBIA CL44
CINCINNATI, U
SA DC‐9
PROVIDEN
CE, R
HODE ISLA
ND, U
SA DHC‐6
RIYA
DH, SAUDI A
RABIA L10
11
QUEB
EC CITY, CANADA F27
ELMA, IOWA, U
SA CV58
0
ORLY, FRA
NCE
B70
7
MOGADISCIO, SOMALIA VISCO
UNT
BISKR
A, A
LGER
IA CARAVELLE
SEVEN
ISLA
NDS, CANADA VISCO
UNT
HEA
THROW, U
K B70
7
0
50
100
150
200
250
300
350
1968
1968
1969
1969
1970
1971
1973
1975
1976
1978
1979
1979
1980
1982
1983
1986
1987
1988
1988
1991
1991
1993
1995
1996
1996
1997
1998
1998
2000
2000
2001
YEAR
FATA
LITI
ES
IMPACT NONSURVIVABLE IMPACT SURVIVABLE/NO IMPACT
Figure 16. In-Flight Fire Accidents Over the Study Period
4. REFERENCES.
1. RGW Cherry & Associates Ltd., 0937/R/000289/KK, “The Identification of Trends in Aircraft Accident Rates,” United Kingdom, 2005.
2. RGW Cherry & Associates Ltd., 0977/R/000410KK, “Safety Trends Analysis—A
Comparison Between the Fatal Accident Rates for Current Production Aircraft and the In-Service World Fleet,” United Kingdom, 2008.
17/18
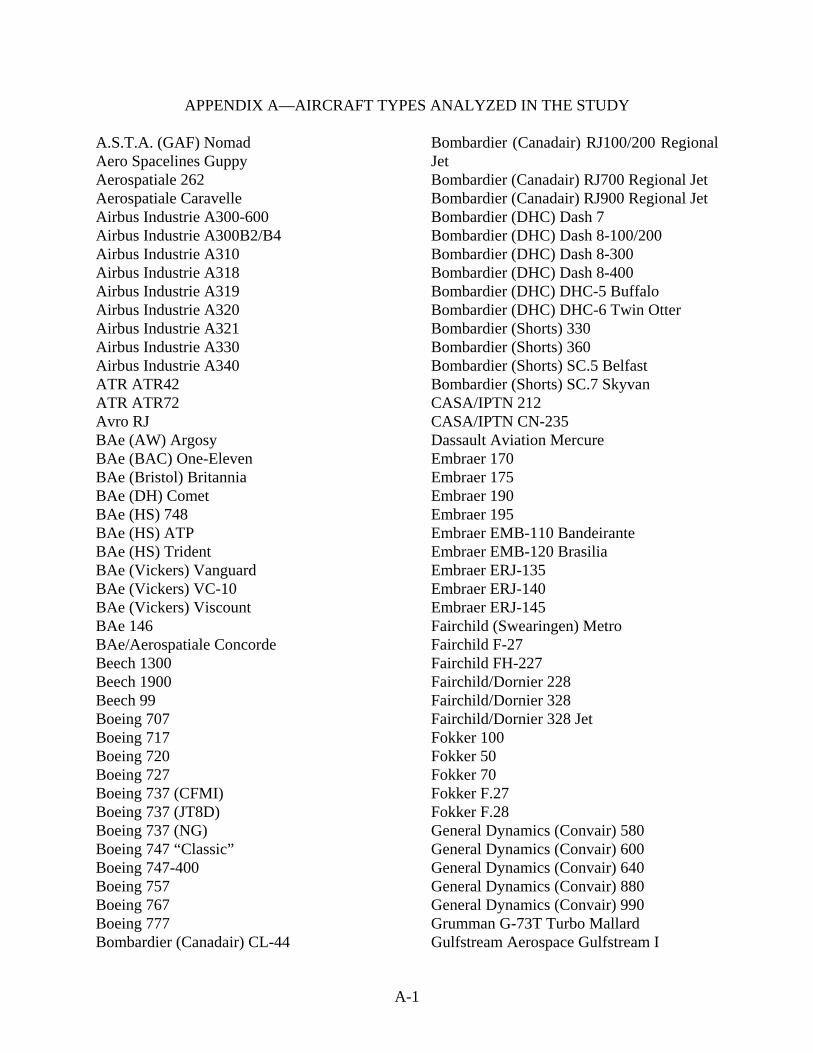
APPENDIX A—AIRCRAFT TYPES ANALYZED IN THE STUDY
A.S.T.A. (GAF) Nomad Aero Spacelines Guppy Aerospatiale 262 Aerospatiale Caravelle Airbus Industrie A300-600 Airbus Industrie A300B2/B4 Airbus Industrie A310 Airbus Industrie A318 Airbus Industrie A319 Airbus Industrie A320 Airbus Industrie A321 Airbus Industrie A330 Airbus Industrie A340 ATR ATR42 ATR ATR72 Avro RJ BAe (AW) Argosy BAe (BAC) One-Eleven BAe (Bristol) Britannia BAe (DH) Comet BAe (HS) 748 BAe (HS) ATP BAe (HS) Trident BAe (Vickers) Vanguard BAe (Vickers) VC-10 BAe (Vickers) Viscount BAe 146 BAe/Aerospatiale Concorde Beech 1300 Beech 1900 Beech 99 Boeing 707 Boeing 717 Boeing 720 Boeing 727 Boeing 737 (CFMI) Boeing 737 (JT8D) Boeing 737 (NG) Boeing 747 “Classic” Boeing 747-400 Boeing 757 Boeing 767 Boeing 777 Bombardier (Canadair) CL-44
Bombardier (Canadair) RJ100/200 Regional Jet Bombardier (Canadair) RJ700 Regional Jet Bombardier (Canadair) RJ900 Regional Jet Bombardier (DHC) Dash 7 Bombardier (DHC) Dash 8-100/200 Bombardier (DHC) Dash 8-300 Bombardier (DHC) Dash 8-400 Bombardier (DHC) DHC-5 Buffalo Bombardier (DHC) DHC-6 Twin Otter Bombardier (Shorts) 330 Bombardier (Shorts) 360 Bombardier (Shorts) SC.5 Belfast Bombardier (Shorts) SC.7 Skyvan CASA/IPTN 212 CASA/IPTN CN-235 Dassault Aviation Mercure Embraer 170 Embraer 175 Embraer 190 Embraer 195 Embraer EMB-110 Bandeirante Embraer EMB-120 Brasilia Embraer ERJ-135 Embraer ERJ-140 Embraer ERJ-145 Fairchild (Swearingen) Metro Fairchild F-27 Fairchild FH-227 Fairchild/Dornier 228 Fairchild/Dornier 328 Fairchild/Dornier 328 Jet Fokker 100 Fokker 50 Fokker 70 Fokker F.27 Fokker F.28 General Dynamics (Convair) 580 General Dynamics (Convair) 600 General Dynamics (Convair) 640 General Dynamics (Convair) 880 General Dynamics (Convair) 990 Grumman G-73T Turbo Mallard Gulfstream Aerospace Gulfstream I
A-1
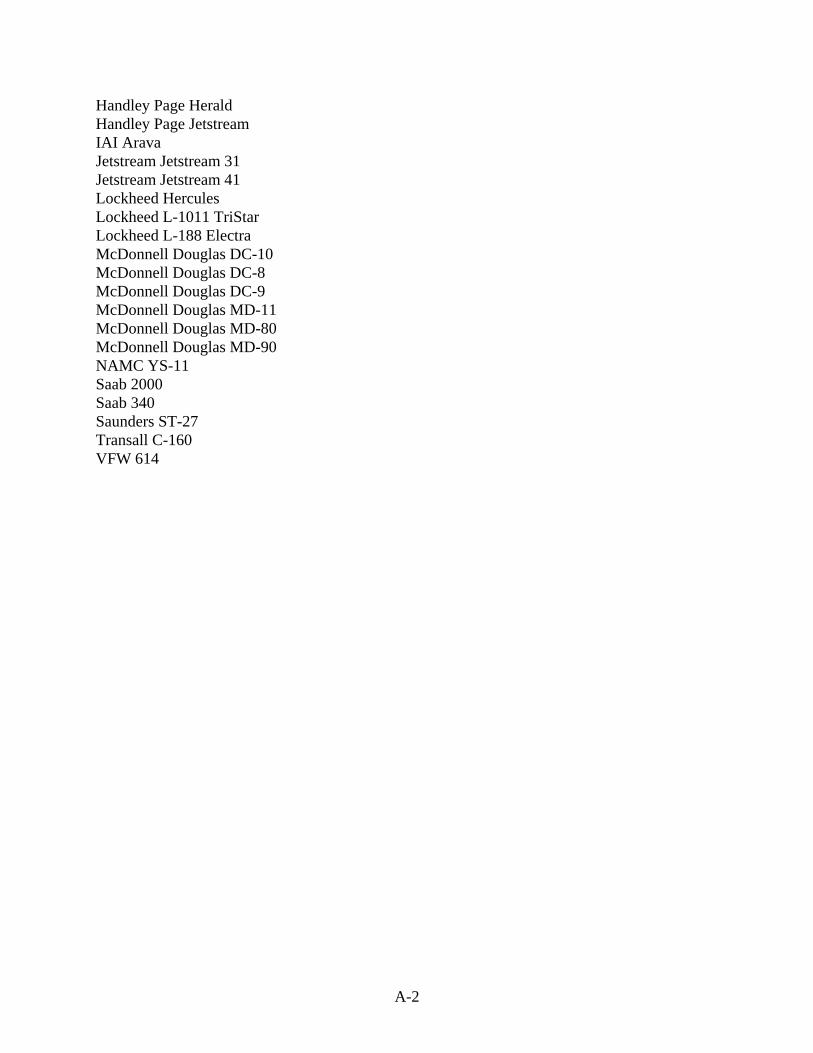
Handley Page Herald Handley Page Jetstream IAI Arava Jetstream Jetstream 31 Jetstream Jetstream 41 Lockheed Hercules Lockheed L-1011 TriStar Lockheed L-188 Electra McDonnell Douglas DC-10 McDonnell Douglas DC-8 McDonnell Douglas DC-9 McDonnell Douglas MD-11 McDonnell Douglas MD-80 McDonnell Douglas MD-90 NAMC YS-11 Saab 2000 Saab 340 Saunders ST-27 Transall C-160 VFW 614
A-2

APPENDIX B—AIRCRAFT FLIGHTS, PASSENGERS, AND REVENUE PASSENGER MILES
Flights—Turbojets and Turboprops
Year World U.S. Canada U.S. and Canada 1968 9,510,491 6,493,649 569,126 7,062,775 1969 9,757,275 6,545,925 573,707 7,119,632 1970 10,059,937 6,631,721 581,227 7,212,947 1971 10,398,056 6,736,537 590,413 7,326,950 1972 10,742,531 6,839,790 599,463 7,439,253 1973 11,092,242 6,940,477 608,287 7,548,764 1974 11,468,033 7,052,961 618,146 7,671,106 1975 11,846,674 7,160,747 627,592 7,788,339 1976 12,230,770 7,265,415 636,766 7,902,180 1977 12,625,557 7,370,379 645,965 8,016,344 1978 13,030,754 7,475,183 655,151 8,130,334 1979 13,445,021 7,578,622 664,216 8,242,838 1980 13,884,954 7,692,035 674,156 8,366,191 1981 13,948,914 7,591,537 665,348 8,256,885 1982 13,010,651 6,855,721 600,859 7,456,579 1983 13,222,608 7,133,288 625,186 7,758,473 1984 14,226,847 8,095,686 709,534 8,805,220 1985 15,008,271 8,663,429 759,293 9,422,721 1986 16,149,587 8,555,946 749,872 9,305,819 1987 17,334,121 8,495,555 744,580 9,240,134 1988 18,308,537 8,779,186 769,438 9,548,624 1989 19,155,493 9,106,355 798,112 9,904,467 1990 20,611,401 9,824,010 861,010 10,685,020 1991 20,794,533 9,780,216 857,172 10,637,387 1992 21,855,054 9,985,359 875,151 10,860,511 1993 22,789,206 10,276,044 900,628 11,176,672 1994 23,959,130 10,721,596 939,677 11,661,273 1995 24,910,110 10,853,500 951,238 11,804,737 1996 25,940,246 10,955,988 960,220 11,916,209 1997 26,934,881 11,074,968 970,648 12,045,616 1998 27,485,269 11,103,432 973,143 12,076,574 1999 28,438,600 11,475,230 1,005,728 12,480,958 2000 29,195,008 11,698,724 1,025,316 12,724,040 2001 28,873,006 11,290,751 989,560 12,280,311 2002 28,261,535 10,902,055 955,493 11,857,548 2003 28,072,358 10,721,739 939,690 11,661,429 2004 29,917,939 11,316,394 991,808 12,308,202 2005 30,665,596 11,342,006 994,052 12,336,058 2006 31,667,184 11,142,305 976,550 12,118,855 2007 33,046,547 11,312,317 991,450 12,303,767
B-1

Passengers—Turbojets and Turboprops (million) Year World U.S. Canada U.S. and Canada 1968 387 257 23 280 1969 457 301 26 328 1970 499 319 28 347 1971 523 323 28 351 1972 550 329 29 358 1973 578 340 30 369 1974 598 336 29 366 1975 623 340 30 370 1976 647 347 30 378 1977 673 356 31 387 1978 702 366 32 398 1979 734 377 33 410 1980 762 384 34 417 1981 770 377 33 410 1982 723 341 30 371 1983 738 356 31 387 1984 797 403 35 439 1985 840 428 37 465 1986 889 443 39 482 1987 947 464 41 505 1988 993 476 42 518 1989 1,027 488 43 531 1990 1,052 501 44 545 1991 1,093 514 45 559 1992 1,155 528 46 574 1993 1,201 541 47 589 1994 1,242 556 49 604 1995 1,308 570 50 620 1996 1,385 585 51 636 1997 1,467 603 53 656 1998 1,530 618 54 672 1999 1,592 642 56 699 2000 1,696 674 60 734 2001 1,632 629 57 686 2002 1,610 622 54 676 2003 1,666 657 54 711 2004 1,855 714 60 774 2005 2,020 747 65 813 2006 2,192 751 69 820 2007 2,400 776 72 848
B-2

Passengers—Turbojets (million) Year World U.S. Canada U.S. and Canada 1968 303 206 18 224 1969 390 261 23 284 1970 439 282 25 307 1971 462 283 25 308 1972 489 289 25 314 1973 517 299 26 325 1974 534 293 26 318 1975 558 295 26 321 1976 581 303 27 329 1977 605 312 27 339 1978 634 323 28 351 1979 666 335 29 365 1980 692 341 30 371 1981 699 335 29 365 1982 657 303 27 330 1983 671 317 28 345 1984 725 359 31 390 1985 764 380 33 414 1986 803 401 35 436 1987 849 428 38 466 1988 887 438 38 476 1989 910 443 39 482 1990 927 450 39 490 1991 955 458 40 498 1992 1,008 466 41 506 1993 1,047 477 42 519 1994 1,085 491 43 534 1995 1,145 504 44 549 1996 1,213 518 45 564 1997 1,286 536 47 583 1998 1,347 552 48 600 1999 1,406 577 51 627 2000 1,506 610 54 664 2001 1,457 573 52 624 2002 1,448 572 50 622 2003 1,507 611 50 661 2004 1,691 670 57 727 2005 1,846 704 62 766 2006 2,013 710 66 776 2007 2,217 737 68 806
B-3

Passengers—Turboprops (million) Year World U.S. Canada U.S. and Canada 1968 85 52 5 56 1969 67 40 3 43 1970 60 37 3 40 1971 61 39 3 43 1972 61 40 4 44 1973 62 41 4 44 1974 64 43 4 47 1975 65 45 4 49 1976 66 45 4 49 1977 68 44 4 48 1978 68 43 4 47 1979 67 42 4 45 1980 70 42 4 46 1981 71 42 4 45 1982 66 38 3 41 1983 67 39 3 43 1984 72 44 4 48 1985 76 48 4 52 1986 87 42 4 45 1987 97 36 3 39 1988 105 38 3 42 1989 117 45 4 49 1990 125 51 4 55 1991 138 57 5 62 1992 147 62 5 67 1993 153 64 6 70 1994 157 65 6 71 1995 164 66 6 71 1996 172 67 6 73 1997 181 67 6 73 1998 183 67 6 73 1999 186 66 6 71 2000 189 64 6 70 2001 176 56 5 62 2002 162 49 4 54 2003 159 46 4 50 2004 165 44 4 47 2005 173 43 4 46 2006 179 41 4 44 2007 183 39 4 42
B-4
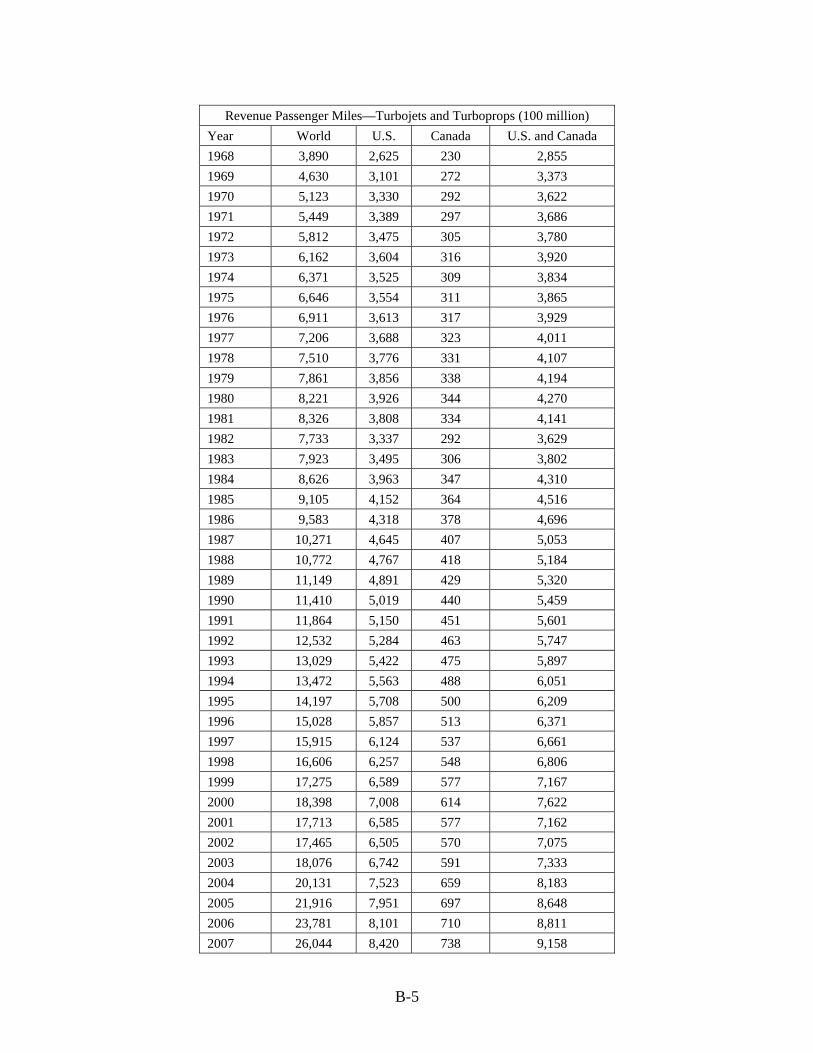
Revenue Passenger Miles—Turbojets and Turboprops (100 million) Year World U.S. Canada U.S. and Canada 1968 3,890 2,625 230 2,855 1969 4,630 3,101 272 3,373 1970 5,123 3,330 292 3,622 1971 5,449 3,389 297 3,686 1972 5,812 3,475 305 3,780 1973 6,162 3,604 316 3,920 1974 6,371 3,525 309 3,834 1975 6,646 3,554 311 3,865 1976 6,911 3,613 317 3,929 1977 7,206 3,688 323 4,011 1978 7,510 3,776 331 4,107 1979 7,861 3,856 338 4,194 1980 8,221 3,926 344 4,270 1981 8,326 3,808 334 4,141 1982 7,733 3,337 292 3,629 1983 7,923 3,495 306 3,802 1984 8,626 3,963 347 4,310 1985 9,105 4,152 364 4,516 1986 9,583 4,318 378 4,696 1987 10,271 4,645 407 5,053 1988 10,772 4,767 418 5,184 1989 11,149 4,891 429 5,320 1990 11,410 5,019 440 5,459 1991 11,864 5,150 451 5,601 1992 12,532 5,284 463 5,747 1993 13,029 5,422 475 5,897 1994 13,472 5,563 488 6,051 1995 14,197 5,708 500 6,209 1996 15,028 5,857 513 6,371 1997 15,915 6,124 537 6,661 1998 16,606 6,257 548 6,806 1999 17,275 6,589 577 7,167 2000 18,398 7,008 614 7,622 2001 17,713 6,585 577 7,162 2002 17,465 6,505 570 7,075 2003 18,076 6,742 591 7,333 2004 20,131 7,523 659 8,183 2005 21,916 7,951 697 8,648 2006 23,781 8,101 710 8,811 2007 26,044 8,420 738 9,158
B-5

B-6
Turbojets—Revenue Passenger Miles (100 million) Year World U.S. Canada U.S. and Canada 1968 3,545 2,412 211 2,623 1969 4,358 2,936 257 3,194 1970 4,877 3,177 278 3,456 1971 5,201 3,228 283 3,511 1972 5,561 3,309 290 3,599 1973 5,910 3,437 301 3,739 1974 6,110 3,346 293 3,639 1975 6,380 3,370 295 3,665 1976 6,640 3,428 300 3,729 1977 6,929 3,505 307 3,812 1978 7,233 3,598 315 3,913 1979 7,585 3,684 323 4,007 1980 7,934 3,752 329 4,081 1981 8,038 3,636 319 3,954 1982 7,465 3,181 279 3,460 1983 7,651 3,334 292 3,626 1984 8,332 3,780 331 4,111 1985 8,795 3,956 347 4,302 1986 9,230 4,146 363 4,509 1987 9,874 4,498 394 4,892 1988 10,358 4,621 405 5,026 1989 10,707 4,728 414 5,143 1990 10,924 4,829 423 5,252 1991 11,330 4,937 433 5,370 1992 11,971 5,045 442 5,488 1993 12,458 5,180 454 5,634 1994 12,893 5,319 466 5,785 1995 13,597 5,458 478 5,936 1996 14,401 5,601 491 6,092 1997 15,265 5,866 514 6,380 1998 15,959 6,006 526 6,532 1999 16,629 6,342 556 6,898 2000 17,750 6,765 593 7,358 2001 17,118 6,372 558 6,930 2002 16,927 6,322 554 6,876 2003 17,552 6,574 576 7,150 2004 19,595 7,361 645 8,006 2005 21,353 7,791 683 8,474 2006 23,205 7,948 697 8,645 2007 25,477 8,277 725 9,002

B-7/B-8
Turboprops—Revenue Passenger Miles (100 million) Year World U.S. Canada U.S. and Canada 1968 345 213 19 231 1969 273 165 14 179 1970 246 153 13 166 1971 249 162 14 176 1972 250 167 15 181 1973 251 167 15 182 1974 261 179 16 195 1975 266 184 16 201 1976 271 184 16 200 1977 277 182 16 198 1978 277 179 16 194 1979 275 172 15 187 1980 287 174 15 189 1981 288 172 15 187 1982 268 155 14 169 1983 273 162 14 176 1984 294 183 16 199 1985 310 196 17 213 1986 353 172 15 187 1987 397 147 13 160 1988 413 145 13 158 1989 442 163 14 177 1990 486 190 17 207 1991 535 212 19 231 1992 561 239 21 260 1993 571 242 21 264 1994 578 244 21 266 1995 600 250 22 272 1996 627 256 22 279 1997 650 258 23 281 1998 647 252 22 274 1999 646 247 22 269 2000 648 243 21 264 2001 595 213 19 232 2002 539 183 16 199 2003 524 168 15 182 2004 536 163 14 177 2005 563 160 14 174 2006 576 153 13 166 2007 567 143 13 156