Embed Size (px)
Citation preview
HAL Id: cea-01851363https://hal-cea.archives-ouvertes.fr/cea-01851363
Submitted on 30 Jul 2018
HAL is a multi-disciplinary open accessarchive for the deposit and dissemination of sci-entific research documents, whether they are pub-lished or not. The documents may come fromteaching and research institutions in France orabroad, or from public or private research centers.
L’archive ouverte pluridisciplinaire HAL, estdestinée au dépôt et à la diffusion de documentsscientifiques de niveau recherche, publiés ou non,émanant des établissements d’enseignement et derecherche français ou étrangers, des laboratoirespublics ou privés.
Dose Measured On-Board INTEGRAL After MoreThan 12 Years in Space
Arnaud Claret, Philippe Laurent, Aymeric Sauvageon, Volodymyr Savchenko
To cite this version:Arnaud Claret, Philippe Laurent, Aymeric Sauvageon, Volodymyr Savchenko. Dose Measured On-Board INTEGRAL After More Than 12 Years in Space. IEEE Transactions on Nuclear Science, Insti-tute of Electrical and Electronics Engineers, 2015, 62, pp.2784 - 2791. �10.1109/TNS.2015.2473671�.�cea-01851363�
This article has been accepted for inclusion in a future issue of this journal. Content is final as presented, with the exception of pagination.
IEEE TRANSACTIONS ON NUCLEAR SCIENCE 1
Dose Measured On-Board INTEGRAL After MoreThan 12 Years in Space
Arnaud Claret, Member, IEEE, Philippe Laurent, Aymeric Sauvageon, and Volodymyr Savchenko
Abstract—The INTEGRAL satellite was launched on October17, 2002 and all on-board instruments are still operating success-fully after more than 12 years, which represents more than a fullsolar cycle. This paper deals with the dose measured by 8 RadFETsmounted in 2 electronic boxes, which control the detector planeof the IBIS/ISGRI camera. These measurements are compared towhat could be predicted before the launch, by using the dose pro-file, as determined by common space environment software, andalso a detailed sectorial analysis of shielding materials around theRadFETs by means of a Monte-Carlo based model of the wholespacecraft. In this study, the sectorial analysis relies on the accu-rate knowledge of the geometry, as determined from the qualifi-cation model of the electronic box still in the lab. In order to takeinto account the orbit evolution with time, the dose profile is deter-mined with yearly-averaged orbital parameters for each of the 12years of measurements. The aim of this analysis is to estimate thepossibility of releasing some margins for future projects.
Index Terms—Dose, radFET, space environment.
I. INTRODUCTION
T HE INTEGRAL (INTErnational Gamma-Ray Astro-physics Laboratory) satellite is an ESA (European Space
Agency) gamma-ray observatory successfully launched fromBaïkonour on October 17, 2002. It is devoted to the observationof the universe between few keV up to 10 MeV, the energyrange of the most extreme phenomena (black holes, accre-tion in X-ray binaries, gamma-ray bursts…). Two telescopesare mounted on INTEGRAL. The first one, IBIS (Imager onBoard the Integral Satellite), provides diagnostic capabilitiesof fine imaging whereas the second one, SPI (SPectrometeron Integral), performs spectral analysis of gamma-ray sources.Both are coded mask aperture telescopes. In order to achievea spectral coverage from several tens of keV to several MeV,the detection unit of the imager IBIS [1] is composed of twogamma cameras, ISGRI (Integral Soft Gamma-Ray Imager)[2] covering the range from 15 keV to 1 MeV and PICsIT(Pixilated CsI Telescope) [3] covering the range from 170 keVto 10 MeV. The orbit of INTEGRAL was selected to minimize
Manuscript received July 09, 2015; revisedAugust 20, 2015; acceptedAugust24, 2015.A. Claret and A. Sauvageon are with CEA-Saclay, Irfu/SAp, F-91191 Gif-
sur-Yvette, France (e-mail: [email protected]).P. Laurent is with CEA-Saclay, Irfu/SAp, F-91191 Gif-sur-Yvette, France,
and also with Université Paris 7, APC, F-75205 Paris, France.V. Savchenko is with Université Paris 7, APC, F-75205 Paris, France.Color versions of one or more of the figures in this paper are available online
at http://ieeexplore.ieee.org.Digital Object Identifier 10.1109/TNS.2015.2473671
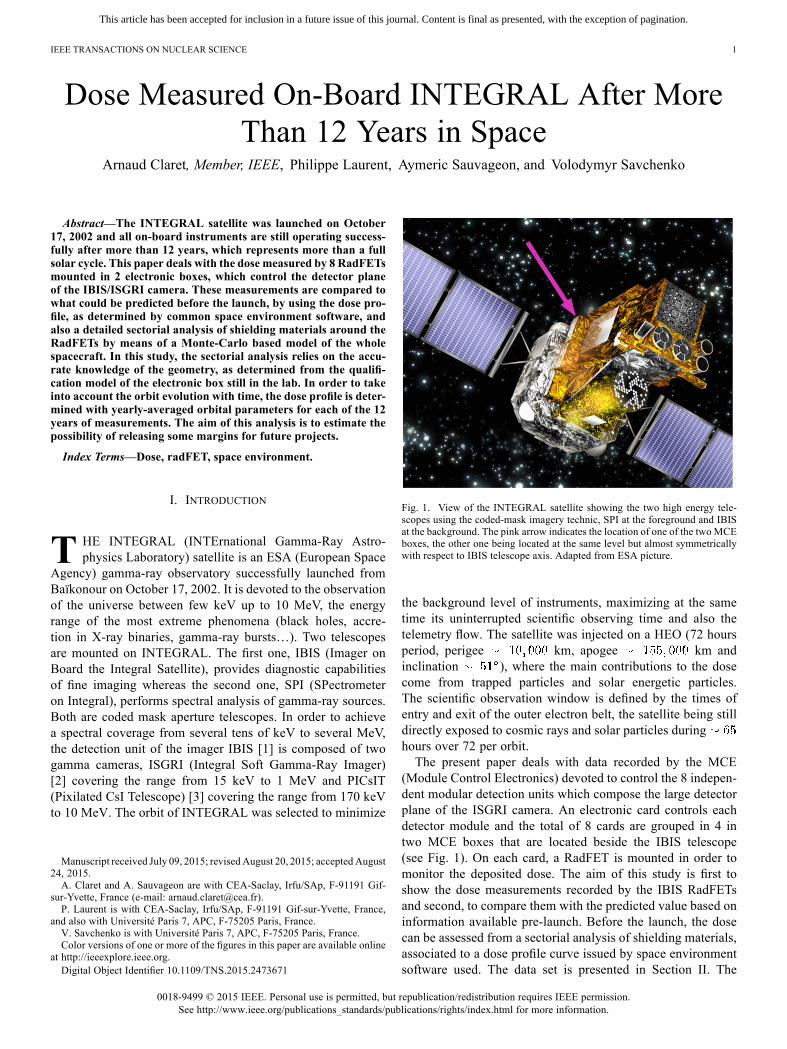
Fig. 1. View of the INTEGRAL satellite showing the two high energy tele-scopes using the coded-mask imagery technic, SPI at the foreground and IBISat the background. The pink arrow indicates the location of one of the two MCEboxes, the other one being located at the same level but almost symmetricallywith respect to IBIS telescope axis. Adapted from ESA picture.
the background level of instruments, maximizing at the sametime its uninterrupted scientific observing time and also thetelemetry flow. The satellite was injected on a HEO (72 hoursperiod, perigee km, apogee km andinclination ), where the main contributions to the dosecome from trapped particles and solar energetic particles.The scientific observation window is defined by the times ofentry and exit of the outer electron belt, the satellite being stilldirectly exposed to cosmic rays and solar particles duringhours over 72 per orbit.The present paper deals with data recorded by the MCE
(Module Control Electronics) devoted to control the 8 indepen-dent modular detection units which compose the large detectorplane of the ISGRI camera. An electronic card controls eachdetector module and the total of 8 cards are grouped in 4 intwo MCE boxes that are located beside the IBIS telescope(see Fig. 1). On each card, a RadFET is mounted in order tomonitor the deposited dose. The aim of this study is first toshow the dose measurements recorded by the IBIS RadFETsand second, to compare them with the predicted value based oninformation available pre-launch. Before the launch, the dosecan be assessed from a sectorial analysis of shielding materials,associated to a dose profile curve issued by space environmentsoftware used. The data set is presented in Section II. The
0018-9499 © 2015 IEEE. Personal use is permitted, but republication/redistribution requires IEEE permission.See http://www.ieee.org/publications_standards/publications/rights/index.html for more information.
This article has been accepted for inclusion in a future issue of this journal. Content is final as presented, with the exception of pagination.
2 IEEE TRANSACTIONS ON NUCLEAR SCIENCE
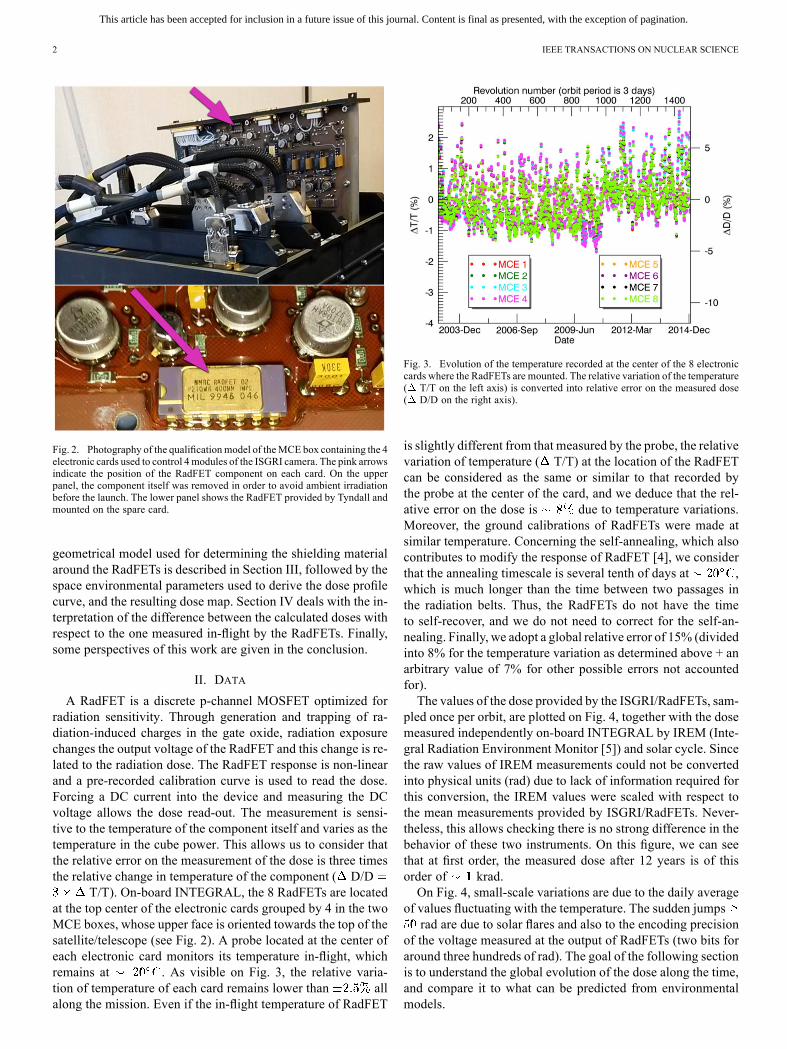
Fig. 2. Photography of the qualificationmodel of theMCE box containing the 4electronic cards used to control 4 modules of the ISGRI camera. The pink arrowsindicate the position of the RadFET component on each card. On the upperpanel, the component itself was removed in order to avoid ambient irradiationbefore the launch. The lower panel shows the RadFET provided by Tyndall andmounted on the spare card.
geometrical model used for determining the shielding materialaround the RadFETs is described in Section III, followed by thespace environmental parameters used to derive the dose profilecurve, and the resulting dose map. Section IV deals with the in-terpretation of the difference between the calculated doses withrespect to the one measured in-flight by the RadFETs. Finally,some perspectives of this work are given in the conclusion.
II. DATA
A RadFET is a discrete p-channel MOSFET optimized forradiation sensitivity. Through generation and trapping of ra-diation-induced charges in the gate oxide, radiation exposurechanges the output voltage of the RadFET and this change is re-lated to the radiation dose. The RadFET response is non-linearand a pre-recorded calibration curve is used to read the dose.Forcing a DC current into the device and measuring the DCvoltage allows the dose read-out. The measurement is sensi-tive to the temperature of the component itself and varies as thetemperature in the cube power. This allows us to consider thatthe relative error on the measurement of the dose is three timesthe relative change in temperature of the component ( D/D
T/T). On-board INTEGRAL, the 8 RadFETs are locatedat the top center of the electronic cards grouped by 4 in the twoMCE boxes, whose upper face is oriented towards the top of thesatellite/telescope (see Fig. 2). A probe located at the center ofeach electronic card monitors its temperature in-flight, whichremains at . As visible on Fig. 3, the relative varia-tion of temperature of each card remains lower than allalong the mission. Even if the in-flight temperature of RadFET
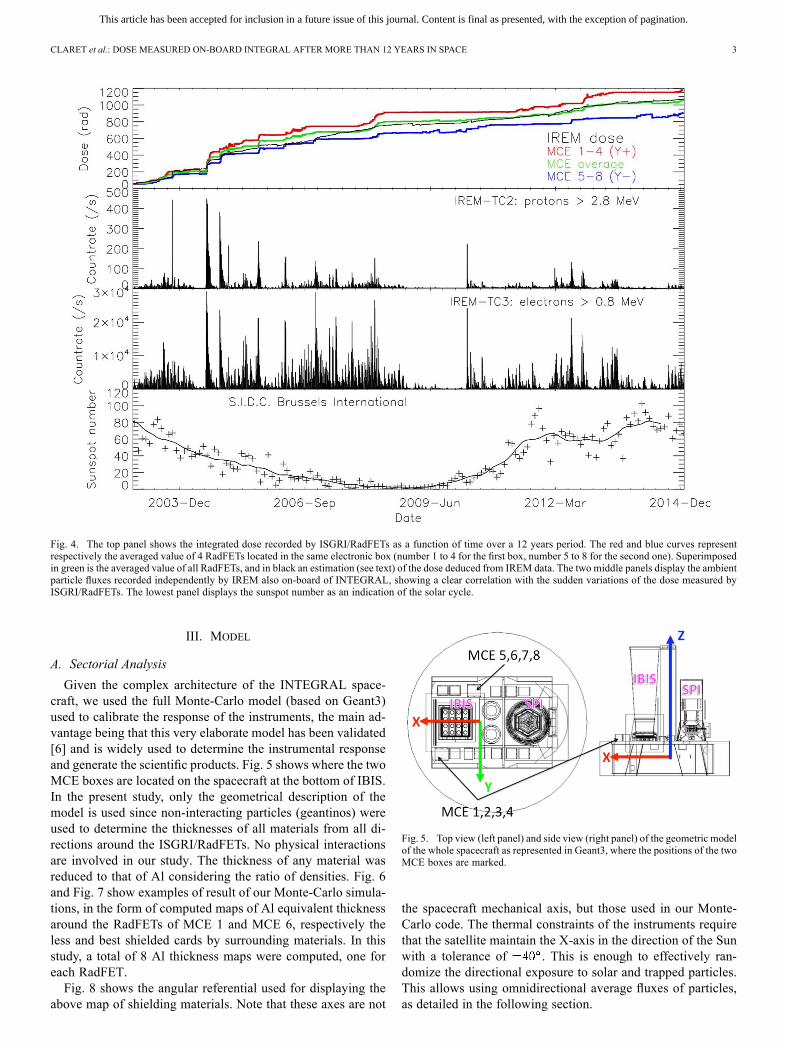
Fig. 3. Evolution of the temperature recorded at the center of the 8 electroniccards where the RadFETs are mounted. The relative variation of the temperature( T/T on the left axis) is converted into relative error on the measured dose( D/D on the right axis).
is slightly different from that measured by the probe, the relativevariation of temperature ( T/T) at the location of the RadFETcan be considered as the same or similar to that recorded bythe probe at the center of the card, and we deduce that the rel-ative error on the dose is due to temperature variations.Moreover, the ground calibrations of RadFETs were made atsimilar temperature. Concerning the self-annealing, which alsocontributes to modify the response of RadFET [4], we considerthat the annealing timescale is several tenth of days at ,which is much longer than the time between two passages inthe radiation belts. Thus, the RadFETs do not have the timeto self-recover, and we do not need to correct for the self-an-nealing. Finally, we adopt a global relative error of 15% (dividedinto 8% for the temperature variation as determined above + anarbitrary value of 7% for other possible errors not accountedfor).The values of the dose provided by the ISGRI/RadFETs, sam-
pled once per orbit, are plotted on Fig. 4, together with the dosemeasured independently on-board INTEGRAL by IREM (Inte-gral Radiation Environment Monitor [5]) and solar cycle. Sincethe raw values of IREM measurements could not be convertedinto physical units (rad) due to lack of information required forthis conversion, the IREM values were scaled with respect tothe mean measurements provided by ISGRI/RadFETs. Never-theless, this allows checking there is no strong difference in thebehavior of these two instruments. On this figure, we can seethat at first order, the measured dose after 12 years is of thisorder of krad.On Fig. 4, small-scale variations are due to the daily average
of values fluctuating with the temperature. The sudden jumpsrad are due to solar flares and also to the encoding precision
of the voltage measured at the output of RadFETs (two bits foraround three hundreds of rad). The goal of the following sectionis to understand the global evolution of the dose along the time,and compare it to what can be predicted from environmentalmodels.
This article has been accepted for inclusion in a future issue of this journal. Content is final as presented, with the exception of pagination.
CLARET et al.: DOSE MEASURED ON-BOARD INTEGRAL AFTER MORE THAN 12 YEARS IN SPACE 3
Fig. 4. The top panel shows the integrated dose recorded by ISGRI/RadFETs as a function of time over a 12 years period. The red and blue curves representrespectively the averaged value of 4 RadFETs located in the same electronic box (number 1 to 4 for the first box, number 5 to 8 for the second one). Superimposedin green is the averaged value of all RadFETs, and in black an estimation (see text) of the dose deduced from IREM data. The two middle panels display the ambientparticle fluxes recorded independently by IREM also on-board of INTEGRAL, showing a clear correlation with the sudden variations of the dose measured byISGRI/RadFETs. The lowest panel displays the sunspot number as an indication of the solar cycle.
III. MODEL
A. Sectorial AnalysisGiven the complex architecture of the INTEGRAL space-
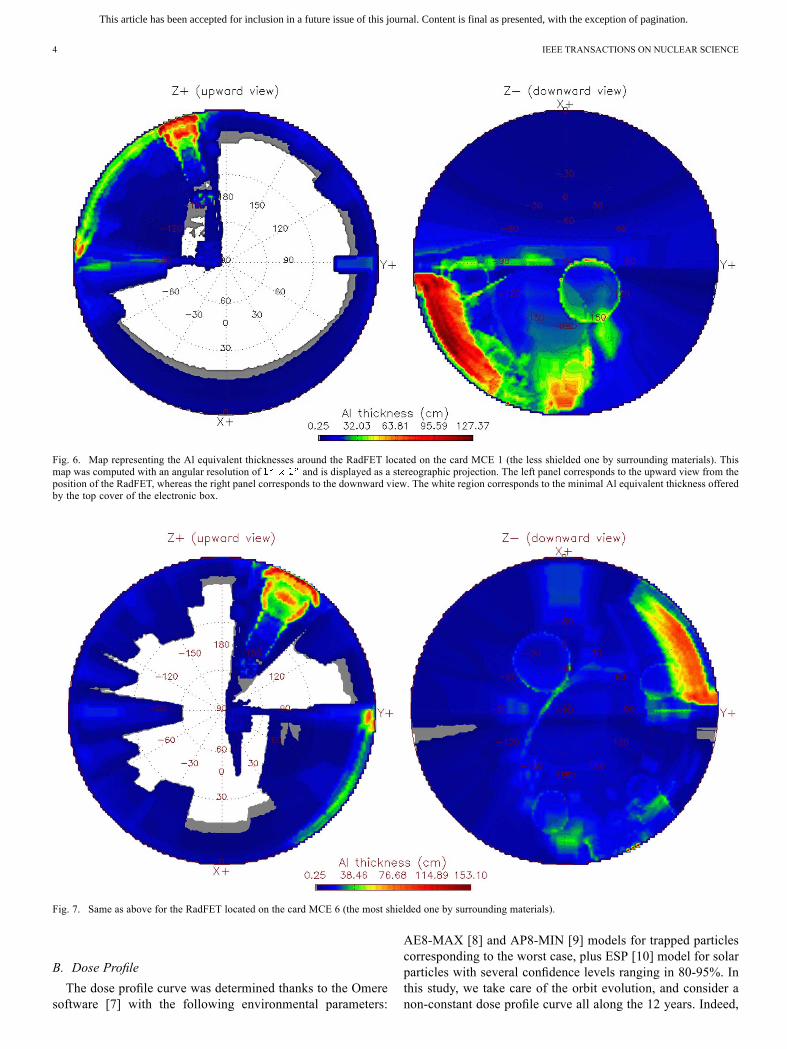
craft, we used the full Monte-Carlo model (based on Geant3)used to calibrate the response of the instruments, the main ad-vantage being that this very elaborate model has been validated[6] and is widely used to determine the instrumental responseand generate the scientific products. Fig. 5 shows where the twoMCE boxes are located on the spacecraft at the bottom of IBIS.In the present study, only the geometrical description of themodel is used since non-interacting particles (geantinos) wereused to determine the thicknesses of all materials from all di-rections around the ISGRI/RadFETs. No physical interactionsare involved in our study. The thickness of any material wasreduced to that of Al considering the ratio of densities. Fig. 6and Fig. 7 show examples of result of our Monte-Carlo simula-tions, in the form of computed maps of Al equivalent thicknessaround the RadFETs of MCE 1 and MCE 6, respectively theless and best shielded cards by surrounding materials. In thisstudy, a total of 8 Al thickness maps were computed, one foreach RadFET.Fig. 8 shows the angular referential used for displaying the
above map of shielding materials. Note that these axes are not
Fig. 5. Top view (left panel) and side view (right panel) of the geometric modelof the whole spacecraft as represented in Geant3, where the positions of the twoMCE boxes are marked.
the spacecraft mechanical axis, but those used in our Monte-Carlo code. The thermal constraints of the instruments requirethat the satellite maintain the X-axis in the direction of the Sunwith a tolerance of . This is enough to effectively ran-domize the directional exposure to solar and trapped particles.This allows using omnidirectional average fluxes of particles,as detailed in the following section.
This article has been accepted for inclusion in a future issue of this journal. Content is final as presented, with the exception of pagination.
4 IEEE TRANSACTIONS ON NUCLEAR SCIENCE
Fig. 6. Map representing the Al equivalent thicknesses around the RadFET located on the card MCE 1 (the less shielded one by surrounding materials). Thismap was computed with an angular resolution of and is displayed as a stereographic projection. The left panel corresponds to the upward view from theposition of the RadFET, whereas the right panel corresponds to the downward view. The white region corresponds to the minimal Al equivalent thickness offeredby the top cover of the electronic box.
Fig. 7. Same as above for the RadFET located on the card MCE 6 (the most shielded one by surrounding materials).
B. Dose ProfileThe dose profile curve was determined thanks to the Omere
software [7] with the following environmental parameters:
AE8-MAX [8] and AP8-MIN [9] models for trapped particlescorresponding to the worst case, plus ESP [10] model for solarparticles with several confidence levels ranging in 80-95%. Inthis study, we take care of the orbit evolution, and consider anon-constant dose profile curve all along the 12 years. Indeed,
This article has been accepted for inclusion in a future issue of this journal. Content is final as presented, with the exception of pagination.
CLARET et al.: DOSE MEASURED ON-BOARD INTEGRAL AFTER MORE THAN 12 YEARS IN SPACE 5
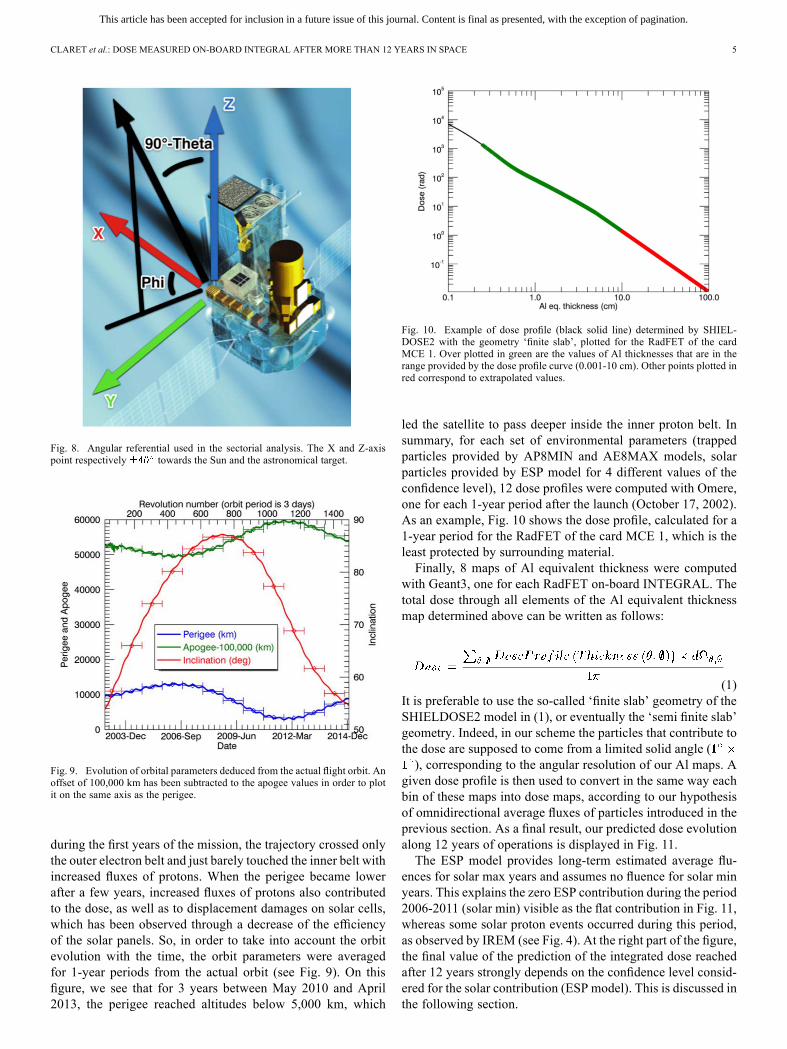
Fig. 8. Angular referential used in the sectorial analysis. The X and Z-axispoint respectively towards the Sun and the astronomical target.
Fig. 9. Evolution of orbital parameters deduced from the actual flight orbit. Anoffset of 100,000 km has been subtracted to the apogee values in order to plotit on the same axis as the perigee.
during the first years of the mission, the trajectory crossed onlythe outer electron belt and just barely touched the inner belt withincreased fluxes of protons. When the perigee became lowerafter a few years, increased fluxes of protons also contributedto the dose, as well as to displacement damages on solar cells,which has been observed through a decrease of the efficiencyof the solar panels. So, in order to take into account the orbitevolution with the time, the orbit parameters were averagedfor 1-year periods from the actual orbit (see Fig. 9). On thisfigure, we see that for 3 years between May 2010 and April2013, the perigee reached altitudes below 5,000 km, which
Fig. 10. Example of dose profile (black solid line) determined by SHIEL-DOSE2 with the geometry ‘finite slab’, plotted for the RadFET of the cardMCE 1. Over plotted in green are the values of Al thicknesses that are in therange provided by the dose profile curve (0.001-10 cm). Other points plotted inred correspond to extrapolated values.
led the satellite to pass deeper inside the inner proton belt. Insummary, for each set of environmental parameters (trappedparticles provided by AP8MIN and AE8MAX models, solarparticles provided by ESP model for 4 different values of theconfidence level), 12 dose profiles were computed with Omere,one for each 1-year period after the launch (October 17, 2002).As an example, Fig. 10 shows the dose profile, calculated for a1-year period for the RadFET of the card MCE 1, which is theleast protected by surrounding material.Finally, 8 maps of Al equivalent thickness were computed
with Geant3, one for each RadFET on-board INTEGRAL. Thetotal dose through all elements of the Al equivalent thicknessmap determined above can be written as follows:
(1)It is preferable to use the so-called ‘finite slab’ geometry of theSHIELDOSE2 model in (1), or eventually the ‘semi finite slab’geometry. Indeed, in our scheme the particles that contribute tothe dose are supposed to come from a limited solid angle (), corresponding to the angular resolution of our Al maps. A
given dose profile is then used to convert in the same way eachbin of these maps into dose maps, according to our hypothesisof omnidirectional average fluxes of particles introduced in theprevious section. As a final result, our predicted dose evolutionalong 12 years of operations is displayed in Fig. 11.The ESP model provides long-term estimated average flu-
ences for solar max years and assumes no fluence for solar minyears. This explains the zero ESP contribution during the period2006-2011 (solar min) visible as the flat contribution in Fig. 11,whereas some solar proton events occurred during this period,as observed by IREM (see Fig. 4). At the right part of the figure,the final value of the prediction of the integrated dose reachedafter 12 years strongly depends on the confidence level consid-ered for the solar contribution (ESP model). This is discussed inthe following section.
This article has been accepted for inclusion in a future issue of this journal. Content is final as presented, with the exception of pagination.
6 IEEE TRANSACTIONS ON NUCLEAR SCIENCE
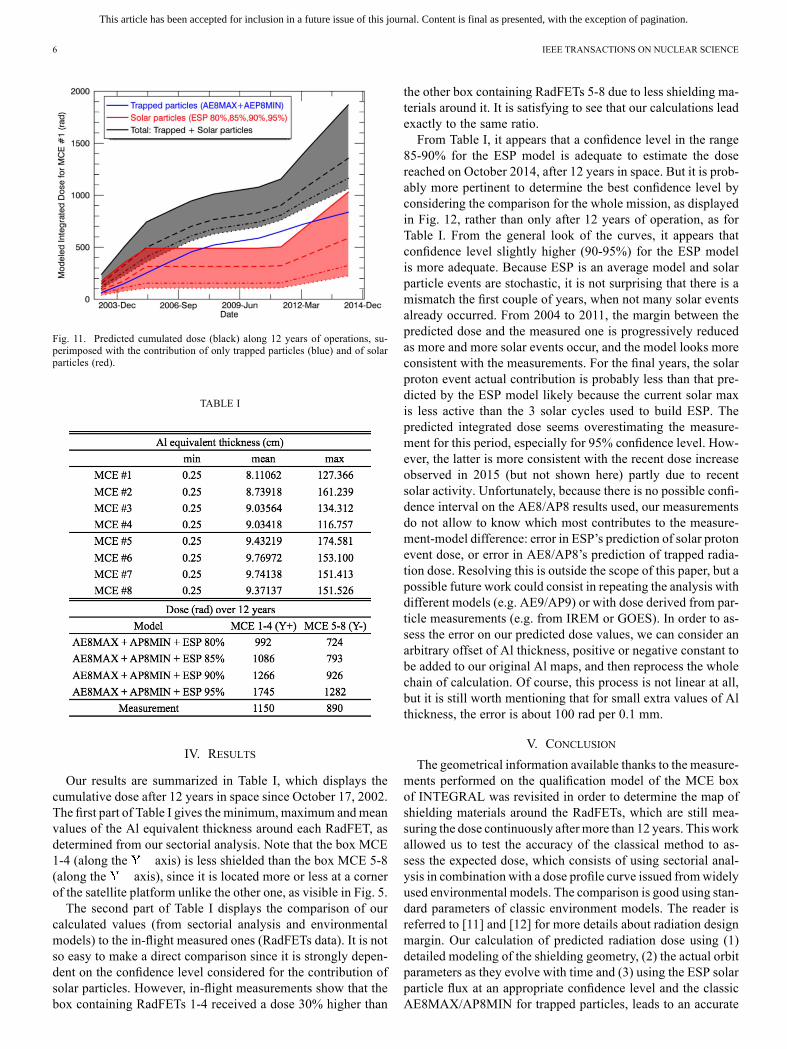
Fig. 11. Predicted cumulated dose (black) along 12 years of operations, su-perimposed with the contribution of only trapped particles (blue) and of solarparticles (red).
TABLE I
IV. RESULTS
Our results are summarized in Table I, which displays thecumulative dose after 12 years in space since October 17, 2002.The first part of Table I gives the minimum, maximum andmeanvalues of the Al equivalent thickness around each RadFET, asdetermined from our sectorial analysis. Note that the box MCE1-4 (along the axis) is less shielded than the box MCE 5-8(along the axis), since it is located more or less at a cornerof the satellite platform unlike the other one, as visible in Fig. 5.The second part of Table I displays the comparison of our
calculated values (from sectorial analysis and environmentalmodels) to the in-flight measured ones (RadFETs data). It is notso easy to make a direct comparison since it is strongly depen-dent on the confidence level considered for the contribution ofsolar particles. However, in-flight measurements show that thebox containing RadFETs 1-4 received a dose 30% higher than
the other box containing RadFETs 5-8 due to less shielding ma-terials around it. It is satisfying to see that our calculations leadexactly to the same ratio.From Table I, it appears that a confidence level in the range
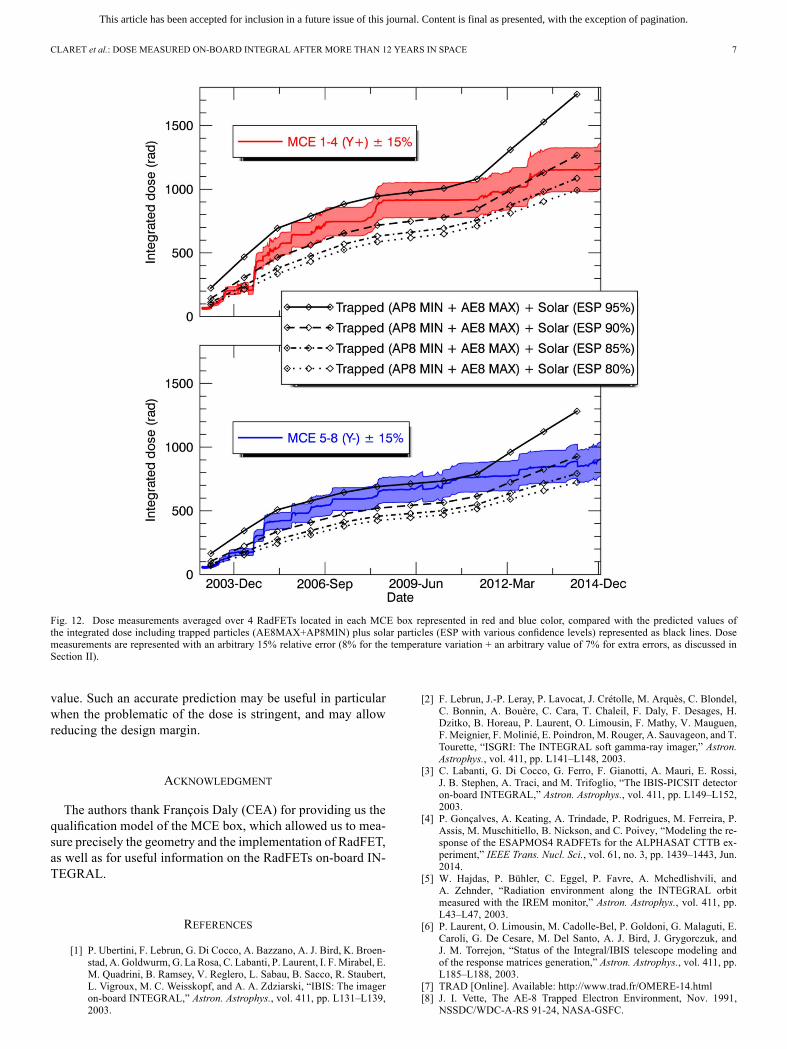
85-90% for the ESP model is adequate to estimate the dosereached on October 2014, after 12 years in space. But it is prob-ably more pertinent to determine the best confidence level byconsidering the comparison for the whole mission, as displayedin Fig. 12, rather than only after 12 years of operation, as forTable I. From the general look of the curves, it appears thatconfidence level slightly higher (90-95%) for the ESP modelis more adequate. Because ESP is an average model and solarparticle events are stochastic, it is not surprising that there is amismatch the first couple of years, when not many solar eventsalready occurred. From 2004 to 2011, the margin between thepredicted dose and the measured one is progressively reducedas more and more solar events occur, and the model looks moreconsistent with the measurements. For the final years, the solarproton event actual contribution is probably less than that pre-dicted by the ESP model likely because the current solar maxis less active than the 3 solar cycles used to build ESP. Thepredicted integrated dose seems overestimating the measure-ment for this period, especially for 95% confidence level. How-ever, the latter is more consistent with the recent dose increaseobserved in 2015 (but not shown here) partly due to recentsolar activity. Unfortunately, because there is no possible confi-dence interval on the AE8/AP8 results used, our measurementsdo not allow to know which most contributes to the measure-ment-model difference: error in ESP’s prediction of solar protonevent dose, or error in AE8/AP8’s prediction of trapped radia-tion dose. Resolving this is outside the scope of this paper, but apossible future work could consist in repeating the analysis withdifferent models (e.g. AE9/AP9) or with dose derived from par-ticle measurements (e.g. from IREM or GOES). In order to as-sess the error on our predicted dose values, we can consider anarbitrary offset of Al thickness, positive or negative constant tobe added to our original Al maps, and then reprocess the wholechain of calculation. Of course, this process is not linear at all,but it is still worth mentioning that for small extra values of Althickness, the error is about 100 rad per 0.1 mm.
V. CONCLUSIONThe geometrical information available thanks to the measure-
ments performed on the qualification model of the MCE boxof INTEGRAL was revisited in order to determine the map ofshielding materials around the RadFETs, which are still mea-suring the dose continuously aftermore than 12 years. This workallowed us to test the accuracy of the classical method to as-sess the expected dose, which consists of using sectorial anal-ysis in combination with a dose profile curve issued fromwidelyused environmental models. The comparison is good using stan-dard parameters of classic environment models. The reader isreferred to [11] and [12] for more details about radiation designmargin. Our calculation of predicted radiation dose using (1)detailed modeling of the shielding geometry, (2) the actual orbitparameters as they evolve with time and (3) using the ESP solarparticle flux at an appropriate confidence level and the classicAE8MAX/AP8MIN for trapped particles, leads to an accurate
This article has been accepted for inclusion in a future issue of this journal. Content is final as presented, with the exception of pagination.
CLARET et al.: DOSE MEASURED ON-BOARD INTEGRAL AFTER MORE THAN 12 YEARS IN SPACE 7
Fig. 12. Dose measurements averaged over 4 RadFETs located in each MCE box represented in red and blue color, compared with the predicted values ofthe integrated dose including trapped particles (AE8MAX+AP8MIN) plus solar particles (ESP with various confidence levels) represented as black lines. Dosemeasurements are represented with an arbitrary 15% relative error (8% for the temperature variation + an arbitrary value of 7% for extra errors, as discussed inSection II).
value. Such an accurate prediction may be useful in particularwhen the problematic of the dose is stringent, and may allowreducing the design margin.
ACKNOWLEDGMENT
The authors thank François Daly (CEA) for providing us thequalification model of the MCE box, which allowed us to mea-sure precisely the geometry and the implementation of RadFET,as well as for useful information on the RadFETs on-board IN-TEGRAL.
REFERENCES
[1] P. Ubertini, F. Lebrun, G. Di Cocco, A. Bazzano, A. J. Bird, K. Broen-stad, A. Goldwurm, G. La Rosa, C. Labanti, P. Laurent, I. F.Mirabel, E.M. Quadrini, B. Ramsey, V. Reglero, L. Sabau, B. Sacco, R. Staubert,L. Vigroux, M. C. Weisskopf, and A. A. Zdziarski, “IBIS: The imageron-board INTEGRAL,” Astron. Astrophys., vol. 411, pp. L131–L139,2003.
[2] F. Lebrun, J.-P. Leray, P. Lavocat, J. Crétolle, M. Arquès, C. Blondel,C. Bonnin, A. Bouère, C. Cara, T. Chaleil, F. Daly, F. Desages, H.Dzitko, B. Horeau, P. Laurent, O. Limousin, F. Mathy, V. Mauguen,F. Meignier, F. Molinié, E. Poindron, M. Rouger, A. Sauvageon, and T.Tourette, “ISGRI: The INTEGRAL soft gamma-ray imager,” Astron.Astrophys., vol. 411, pp. L141–L148, 2003.
[3] C. Labanti, G. Di Cocco, G. Ferro, F. Gianotti, A. Mauri, E. Rossi,J. B. Stephen, A. Traci, and M. Trifoglio, “The IBIS-PICSIT detectoron-board INTEGRAL,” Astron. Astrophys., vol. 411, pp. L149–L152,2003.
[4] P. Gonçalves, A. Keating, A. Trindade, P. Rodrigues, M. Ferreira, P.Assis, M. Muschitiello, B. Nickson, and C. Poivey, “Modeling the re-sponse of the ESAPMOS4 RADFETs for the ALPHASAT CTTB ex-periment,” IEEE Trans. Nucl. Sci., vol. 61, no. 3, pp. 1439–1443, Jun.2014.
[5] W. Hajdas, P. Bühler, C. Eggel, P. Favre, A. Mchedlishvili, andA. Zehnder, “Radiation environment along the INTEGRAL orbitmeasured with the IREM monitor,” Astron. Astrophys., vol. 411, pp.L43–L47, 2003.
[6] P. Laurent, O. Limousin, M. Cadolle-Bel, P. Goldoni, G. Malaguti, E.Caroli, G. De Cesare, M. Del Santo, A. J. Bird, J. Grygorczuk, andJ. M. Torrejon, “Status of the Integral/IBIS telescope modeling andof the response matrices generation,” Astron. Astrophys., vol. 411, pp.L185–L188, 2003.
[7] TRAD [Online]. Available: http://www.trad.fr/OMERE-14.html[8] J. I. Vette, The AE-8 Trapped Electron Environment, Nov. 1991,
NSSDC/WDC-A-RS 91-24, NASA-GSFC.

This article has been accepted for inclusion in a future issue of this journal. Content is final as presented, with the exception of pagination.
8 IEEE TRANSACTIONS ON NUCLEAR SCIENCE
[9] D. M. Sawyer and J. I. Vette, AP-8 Trapped Proton Environment forSolar Maximum and Solar Minimum, Dec. 1976, NSSDC/WDC-A-RS76-06, NASA-GSFC.
[10] M. A. Xapsos, J. L. Barth, E. G. Stassinopoulos, E. A. Burke, and G.B. Gee, “Space environment effects: Model for emission of solar pro-tons (ESP)—cumulative and worst case event fluences,” NASA-Mar-shall Space Flight Center SEE Program, Dec. 1999 [Online]. Available:http://see.msfc.nasa.gov/publications/tp-1999-209763.pdf
[11] H. Garrett and I. Jun, “Spacecraft environment interactions,” in Proc.NSREC Short Course, Las Vegas, NV, USA, Jul. 2011.
[12] R. Ecoffet, “On-orbit anomalies: Investigations and root cause deter-mination,” in Proc. NSREC Short Course, Las Vegas, NV, USA, Jul.2011.


![[DAN letterhead] TLD POSTAL DOSE QUALITY AUDIT FOR X-R ...€¦ · The TLD measured absorbed doses will be compared to the dose calculations from the hospital’s TPS for each of](https://img.pdfslide.us/doc/110x75/5fa0b361514ae42756474160/dan-letterhead-tld-postal-dose-quality-audit-for-x-r-the-tld-measured-absorbed.jpg)
![SABINSA CORPORATION - Herbamedica › media › forslean › 06-Forslean.pdf · forskohlii Extract (mg/day) [dose of forskolin (mg/day)] Study Design Study Length Measured Outcome(s)](https://img.pdfslide.us/doc/110x75/5f26a7c7b03ed80b222d3d20/sabinsa-corporation-a-media-a-forslean-a-06-forsleanpdf-forskohlii-extract.jpg)