Embed Size (px)
Citation preview
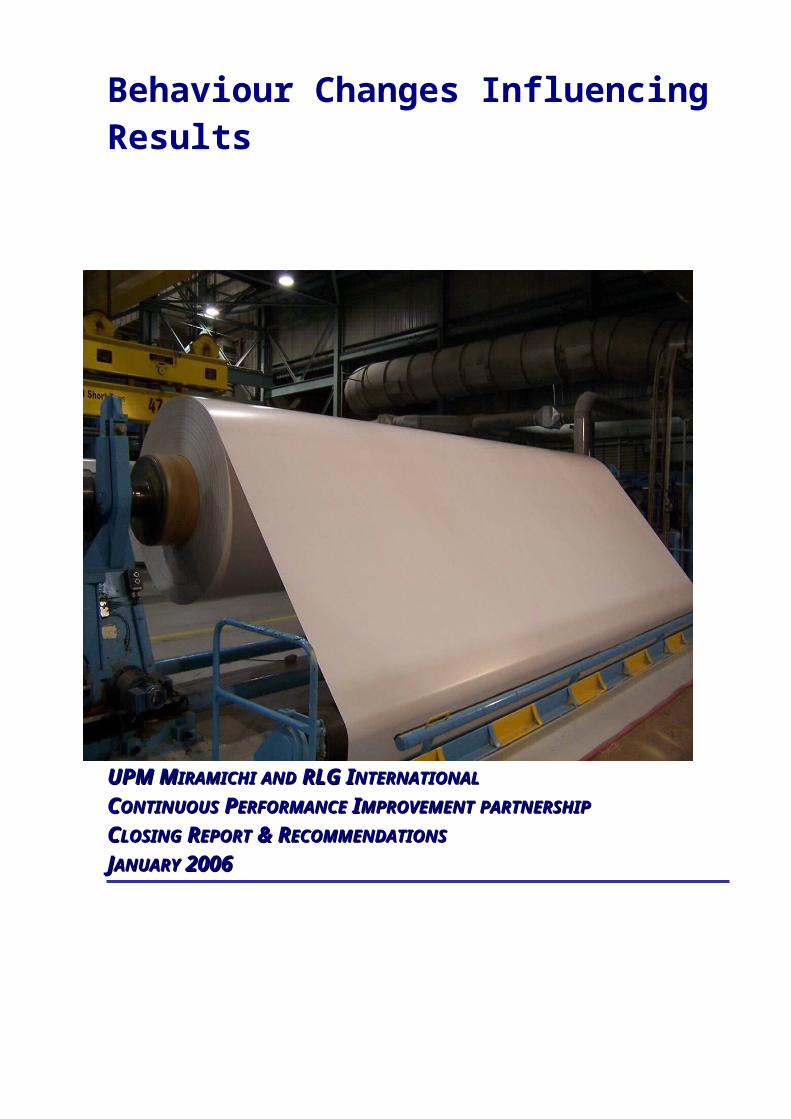
Behaviour Changes Influencing Results
UPM MUPM MIRAMICHIIRAMICHI ANDAND RLG I RLG INTERNATIONALNTERNATIONALCCONTINUOUSONTINUOUS P PERFORMANCEERFORMANCE I IMPROVEMENTMPROVEMENT PARTNERSHIPPARTNERSHIPCCLOSINGLOSING R REPORTEPORT & R & RECOMMENDATIONSECOMMENDATIONS JJANUARYANUARY 2006 2006
Executive Summary In October 2005, RLG resources were deployed at UPM – Miramichi to assist mill
management with their target of achieving a world class operating level by the end of 2006. This was to be achieved by attaining behaviour changes that would impact the results. The plan was to initially work with PM 1 personnel, since they commenced operations on September 15, 2005 and then transfer the knowledge and experience over to PM 2 with a targeted start date of November 15, 2005. The Focus Area: Coaching to support the improvement of PM 1 & PM 2 operating results with an emphasis on inter-mill communications and data sharing.
Snapshot of Results to Date
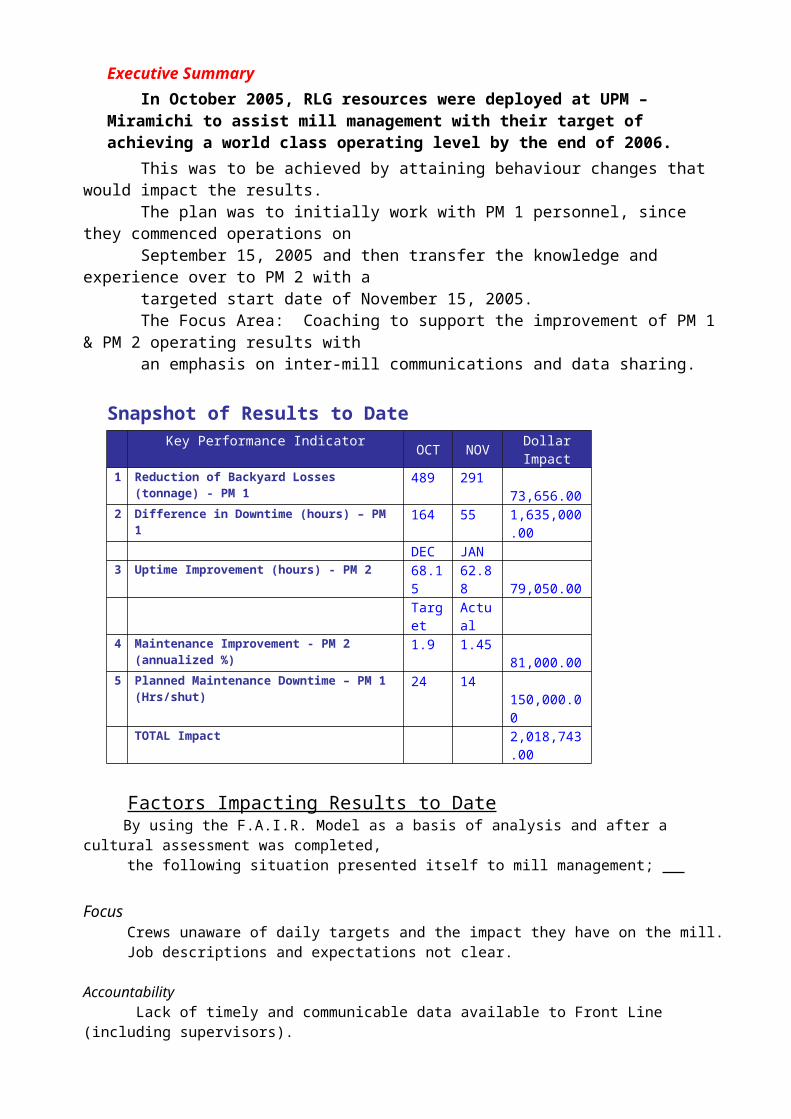
Key Performance Indicator OCT NOV Dollar Impact1 Reduction of Backyard Losses (tonnage) - PM 1 489 291 73,656.002 Difference in Downtime (hours) – PM 1 164 55 1,635,000.00
DEC JAN3 Uptime Improvement (hours) - PM 2 68.15 62.88 79,050.00
Target Actual4 Maintenance Improvement - PM 2 (annualized %) 1.9 1.45 81,000.005 Planned Maintenance Downtime – PM 1
(Hrs/shut)24 14 150,000.00
TOTAL Impact 2,018,743.00
Factors Impacting Results to Date By using the F.A.I.R. Model as a basis of analysis and after a cultural assessment was completed, the following situation presented itself to mill management;
Focus Crews unaware of daily targets and the impact they have on the mill. Job descriptions and expectations not clear.
Accountability Lack of timely and communicable data available to Front Line (including supervisors).
Involvement Crews not actively engaged in improvement initiatives.
Response Feedback and recognition not a common practice.
With the input from supervisors and managers the following course of action took place;
Focus Revised job descriptions Daily plans discussed at crew meetings.
Accountability Clear and timely KPI charts and scorecards developed to highlight key metrics and targets. KPI’s posted in crew areas.
Involvement Coached meeting format changes. Implemented Improvement Work Teams.
Response Coached increased feedback and communication from senior management. Regular discussion of result trends.
DETAILED RESULTS
1. Wrapline PM 1 & PM 2 Supervisor - Terry Morrison
Mr. Morrison held information sessions with his crews and put up data charts in the lunch room after having several coaching sessions with RLG personnel.
At the morning meetings diligence to work and proper execution of tasks was reinforced Expectations to follow the work instructions was discussed, along
What People are saying about RLG"Thanks Peter for the great work you have been doing on posting the pertinent information that is needed to succeed in our paper business. Some guys are glad that this information is being conveyed so they now can keep track of what's happening." TJM
with attention to detail and area cleanliness Crew were informed that data was being tracked and the results would be posted weekly at a minimum Inspection of rail cars has increased and diligence during loading has improved shift by shift
2. OMC 1 Supervisor - Terry Doyle
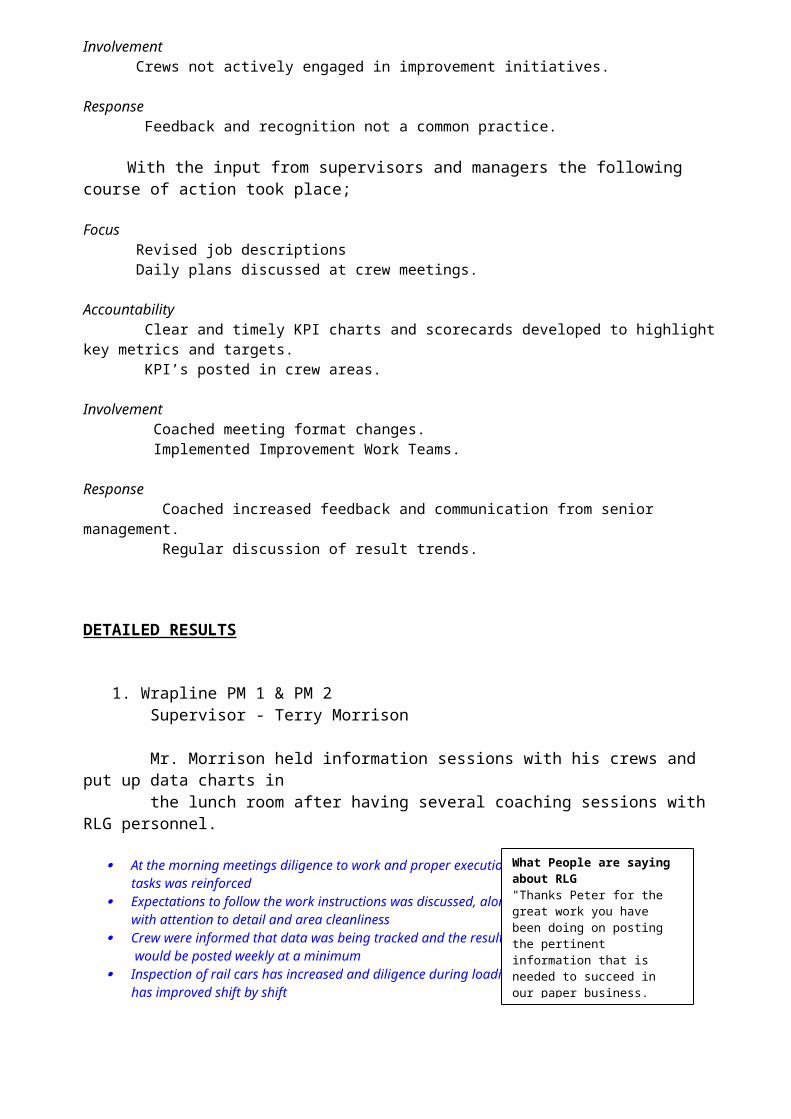
The point of concern with this unit was runnability. After discussing the issue with the area supervisor, along with issuing revised job descriptions, charts were put up in the area of operations as a method of informing the operators about the financial consequences of missing production targets. Feedback was generous off the floor."Guys We have made some progress in November, especially on the last several days of the month. I have quite a few graphs that show our improvements, and the type of breaks that are keeping us from reaching our targets. The past few months have been difficult; hopefully we haverounded a corner and can look forward to some better runnability. I
UPM - MiramichiPM1 Backyard Losses (Oct-Dec05)
-20
0
20
40
60
80
100
Tonn
es
Actual 2 per. Mov. Avg. (Actual)
What People are saying about RLGPeter, I was supposed to pass along some feedback from the guys on the floor. They were appreciative of the graphs on the cost and PC posted at the coater board. Although they are as upset as we are that they aren't making target they like having the feedback and the target to work towards. They especially liked the graph showing the positive and negative days. That graph truly represents reality as one guy put it. Thanks for posting it. We had
thank you and your crews for the effort put forth during these difficult times".
Terry
OMC1 Speed September 14 To November 30/05
30003200340036003800400042004400460048005000
9/14
/05
9/16
/05
9/18
/05
9/20
/05
9/22
/05
9/24
/05
9/26
/05
9/28
/05
9/30
/05
10/2
/05
10/4
/05
10/6
/05
10/8
/05
10/1
0/05
10/1
2/05
10/1
4/05
10/1
6/05
10/1
8/05
10/2
0/05
10/2
2/05
10/2
4/05
10/2
6/05
10/2
8/05
10/3
0/05
11/1
/05
11/3
/05
11/5
/05
11/7
/05
11/9
/05
11/1
1/05
11/1
3/05
11/1
5/05
11/1
7/05
11/1
9/05
11/2
1/05
11/2
3/05
11/2
5/05
11/2
7/05
11/2
9/05
0102030405060708090
Pick
out
Blad
e Cu
t
Splic
e
Ram
pN/
Load
MTU
Ram
pLo
adad
Edge
Tea
r
Load
Top Break Causes OMC1 OCT 2005 - Jan 2006
OCT NOV DEC JAN
3. PM 2 Supervisor – Mike Dickie
At the request of the PM 2 line manager Stephen L, RLG began posting charts and graphs within the PM 2 operations area in-sight of the operators. Supervisors commented that the workers were taking notice of the charts and graphs and a change in behaviour was noticed. They were eager to know the dollar impact of attaining daily targets.
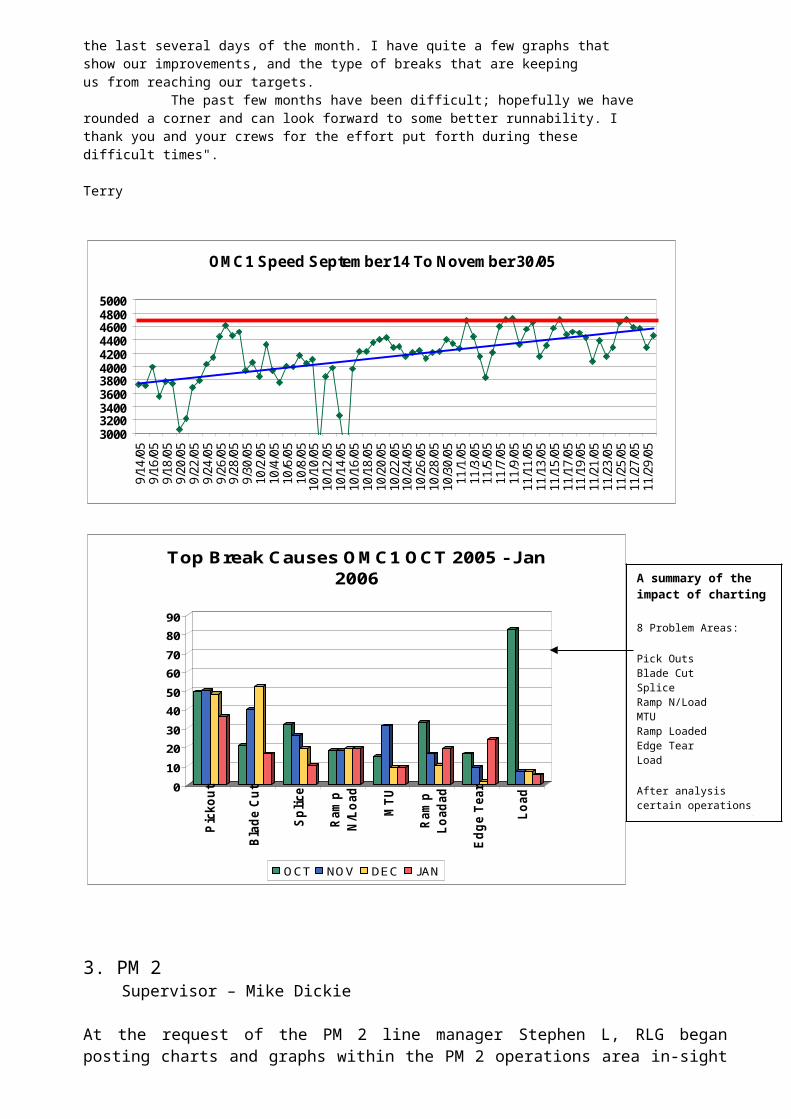
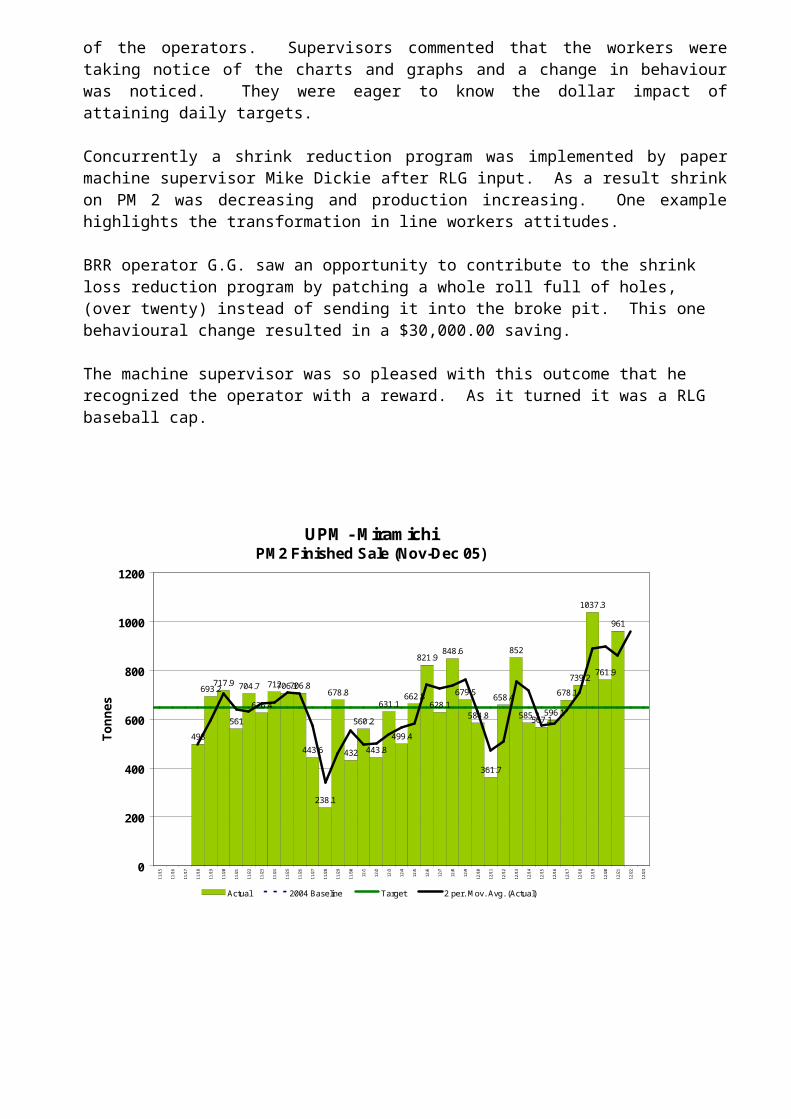
Concurrently a shrink reduction program was implemented by paper machine supervisor Mike Dickie after RLG input. As a result shrink on PM 2 was decreasing and production increasing. One example highlights the transformation in line workers attitudes.
BRR operator G.G. saw an opportunity to contribute to the shrink loss reduction program by
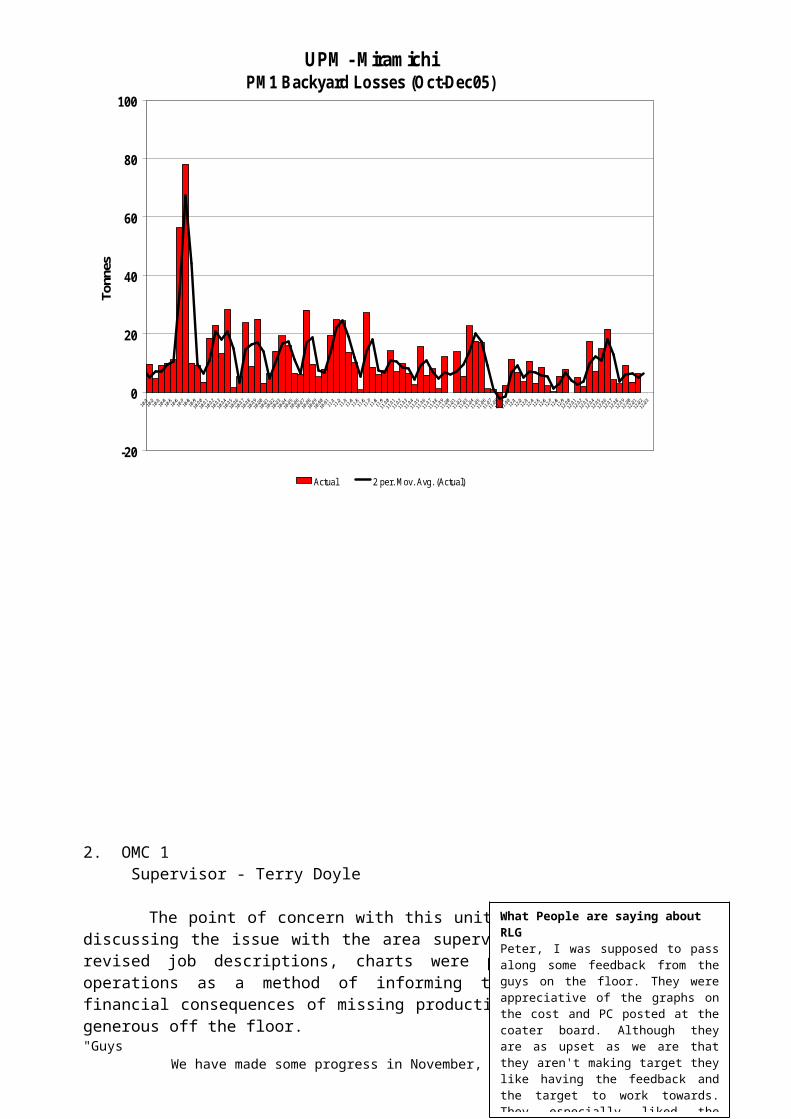
A summary of the impact of charting
8 Problem Areas:
Pick OutsBlade CutSpliceRamp N/LoadMTURamp LoadedEdge TearLoad
After analysis certain operations were automated and logic changed, thereby impacting the results.T.D.
patching a whole roll full of holes, (over twenty) instead of sending it into the broke pit. This one behavioural change resulted in a $30,000.00 saving.
The machine supervisor was so pleased with this outcome that he recognized the operator with a reward. As it turned it was a RLG baseball cap.
4 /5. Maintenance Department Supervisor – Lorne Smith
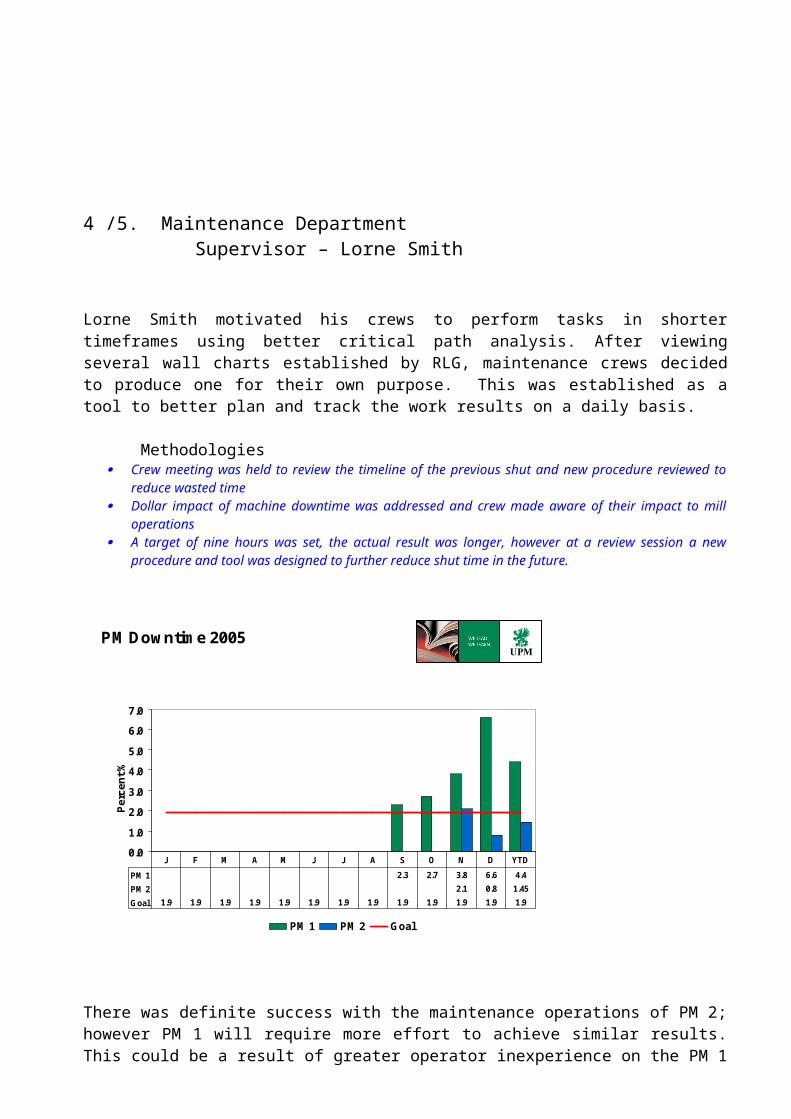
Lorne Smith motivated his crews to perform tasks in shorter timeframes using better critical path analysis. After viewing several wall charts established by RLG, maintenance crews decided to produce one for their own purpose. This was established as a tool to better plan and track the work results on a daily basis. Methodologies
Crew meeting was held to review the timeline of the previous shut and new procedure reviewed to reduce wasted time
Dollar impact of machine downtime was addressed and crew made aware of their impact to mill operations
UPM - MiramichiPM2 Finished Sale (Nov-Dec 05)
498
693.2717.9
561
704.7
626.4
712706.1706.8
443.6
238.1
678.8
432
560.2
443.8
631.1
499.4
662.8
821.9
628.1
848.6
679.5
584.8
361.7
658.4
852
585.3567.1596.1
678.1
739.2
1037.3
761.9
961
0
200
400
600
800
1000
1200
11/1
5
11/1
6
11/1
7
11/1
8
11/1
9
11/2
0
11/2
1
11/2
2
11/2
3
11/2
4
11/2
5
11/2
6
11/2
7
11/2
8
11/2
9
11/3
0
12/1
12/2
12/3
12/4
12/5
12/6
12/7
12/8
12/9
12/1
0
12/1
1
12/1
2
12/1
3
12/1
4
12/1
5
12/1
6
12/1
7
12/1
8
12/1
9
12/2
0
12/2
1
12/2
2
12/2
3
Tonn
es
Actual 2004 Baseline Target 2 per. Mov. Avg. (Actual)
A target of nine hours was set, the actual result was longer, however at a review session a new procedure and tool was designed to further reduce shut time in the future.
UPM 1
PM Downtime 2005
0.0
1.0
2.0
3.0
4.0
5.0
6.0
7.0
Perc
ent %
PM 1 PM 2 Goal
PM 1 2.3 2.7 3.8 6.6 4.4PM 2 2.1 0.8 1.45Goal 1.9 1.9 1.9 1.9 1.9 1.9 1.9 1.9 1.9 1.9 1.9 1.9 1.9
J F M A M J J A S O N D YTD
There was definite success with the maintenance operations of PM 2; however PM 1 will require more effort to achieve similar results. This could be a result of greater operator inexperience on the PM 1 side as compared to PM 2, due to the changes in personnel after the start-up.
Steps in the Right Direction A) EIT:
During the month of October a team comprised of personnel from UPM & RLG set out to create a tracking tool that would be "forward looking" in its nature. The was to give the supervisors the ability to project completion dates of cost reduction ideas that are deemed necessary for future success. With the support of RLG the project was completed and implemented to demonstrate its functionality. This will be a useful tool for supervisors during and after the shutdown to stay on track with their set goals of cost reduction. (click on tab below to view an example)
B) Floor Charts
Sensing an opportunity to pass down pertinent information to the line workers, RLG began setting up data charts around the mill in key areas. The goal was to let supervisors and line workers have a common set of information that they could discuss professionally. The future intent is to have either the supervisors or workers keep updating the data and continue to find methods of improving productivity. This initiative should be successful given some of the feedback from the floor:
"Just a note to say what a good idea it was to post the progress charts at the bulletin boards near the coater. This gives us a good idea on what our goals and objectives are and where we have to be in order to make this mill profitable".
Thank youBlair Clancy
C) Crew Meetings
To better communicate the data information with the crews, which they were asking for RLG decided to kick-start "crew info session".
Winder 4 operator Randy O'Shea commented that at first he found RLG's presence a waste of time, but after several weeks he commented that he and the crews find the information from the meetings, charts and graphs as very beneficial.
Later Dennis Lirette, PM 1 Area Supervisor picked up on this initiative, meeting with his crews on a daily basis to keep them up to date and discuss the initiatives for the day.George Sproul, PM 1 Line Supervisor redesigned morning meetings to give the shift supervisors more authority over daily floor operations. This move encouraged more communication & cooperation between Area Supervisors and Shift Supervisors which was lacking and causing tension on the floor and confusion for the operators.
D) Communication from Mill General Manager
Information from management to the line operators became more prevalent after ideas were exchanged between the mill communication's officer and RLG. The employee information forums prior to the shut was a positive step in keeping the lines of communication open in such a difficult time. This should have dividends on start-up.
Example:
What People are saying about RLG“I find that the graphs are very informative and helpful in understanding how we are doing on a day to day basis”Thank–you, A1 CRR Operator
Letter to employees from General Manager Timo Suutarla The challenge we face at Miramichi this year makes it more crucial than ever before for all employees to work together. I want to personally thank the nearly 300 employees who attended UPM Miramichi Employee Forums this week. …. Timo Suutarla
Peter ChaburskyProject ManagerMiramichi, N.B.UPM-Miramichi 2005/06