Embed Size (px)
Citation preview

LEROY COLLINS INSTITUTE
DOING IT RIGHT:RECOGNIZING BEST PRACTICES IN FLORIDA’S MUNICIPAL PENSIONS
August 2013
In recent years, Floridians have grown accustomed to bad news about the condition of their municipal pension plans. They are wise to be concerned. Pension costs have increased and are straining city budgets throughout the state. Annual contributions and the returns on pension investments have not kept up with growing liabilities, and we are in a 10-year trend of pension plans that are deeper in the red.1
But, not all of Florida’s municipal pension plans are in trouble. Many plans are relatively healthy and well-funded. This report identifies municipal pension plans in Florida that are in “good condition” and examines whether those plans tend to be better than others at following nationally-recognized “best practices” in public pension management.
HOW WE IDENTIFY PENSION PLANS IN "GOOD CONDITION"
We use actuarial funded ratios (the ratio of actuarial pension assets to actuarial liabilities) to determine the condition of municipal pension plans and to select plans that are in “good condition.”2 Our sample is limited to plans that are open to new participants and that use the most common actuarial cost method, the so-called Entry-Age Normal Cost Method3, which is the same method used by the Florida Retirement System. The total number of pension plans in our study is 254. For more information on our selection process and the source of our data, please see the note titled “Our Data” on page 9 of this report.

2 | Tough Choices Facing Florida's Governments
We place the plans into one of five categories based on their funded ratio: plans with funded ratios that are greater than 90 percent (24 plans), those with funded ratios between 80 percent and 90 percent (42 plans), those between 70 percent and 80 percent (63 plans), those between 60 percent and 70 percent (62 plans), and those lower than 60 percent (63 plans). See Chart 1 for a presentation of the distribution of plans among the five categories.
The U.S. Government Accountability Office states that “many experts consider a funded ratio of about 80 percent or better to be sound for government pensions.”4 Therefore, we identified pension plans with funded ratios equal to 80 percent or greater as being in good condition, approximately 26 percent of the plans in our sample.
CHART 1: Distribution of Funded Ratio Categories
Ninety-eight percent of the plans in our study cover general employees (25 percent), police officers (32 percent), firefighters (32 percent), or police officers and firefighters combined (9 percent). The other two percent cover lifeguards (1 plan), correctional officers (1 plan), and all employee types (3 plans). Chart 2 illustrates the proportion of plans in each funded ratio category for the four most common employee classifications. Nearly 30 percent of general and police plans are in good condition. Approximately 25 percent of the firefighter plans are in good condition. Only about 15 percent of the combined police and firefighter plans are in good condition.
This information supports previous reports that found general employees and public safety plans to have comparable funded ratios. Strong performance (or weak performance) is not limited to certain types of plans.
CHART 2: Which Plans Are Better Funded?
Note: See “Our Data” on page 9 for information on the plans we included in this study. We included the most recent valuation for plans. Most of the plans were most recently valuated in 2011 but a few were valued in 2010 or 2012. If a plan’s most recent valuation was prior to 2010, it was not included in the study.
Source: DMS annual reports, appendix G.
Note: We included the most recent valuation for plans. Most of the plans were most recently valuated in 2011 but a few were valued in 2010 or 2012. If a plan’s most recent valuation was prior to 2010, it was not included in the study.
Source: DMS annual reports, appendix G.

DOING IT RIGHT: Recognizing Best Practices In Florida’s Municipal Pensions | 3
HOW WE SELECTED “BEST PRACTICES”
We identified “best practices” from a review of recent publications by the National Institute on Retirement Security and the Center for Retirement Research at Boston College.5 Those reports identify practices that are common among the best-funded pension plans. We selected five of those practices that yielded sufficient data on Florida’s municipal pension plans to examine how well these practices are represented in our state’s best-funded municipal pension plans. The practices that we selected are:
1. Funding annual pension contributions at 100 percent (or more) of the annual required contribution (ARC)
2. Requiring that employees share in the cost of their pension plans3. Limiting the size of cost-of-living adjustments (COLAs)4. Limiting the ability of employees to engage in pension spiking5. Setting realistic actuarial assumptions
Readers should be careful not to expect that implementing these best practices will solve pension funding problems and should recognize that there are many other actions that can easily counteract these practices. When found together, however, these practices are expected to identify pension plans with more stable and affordable policies and practices.
Readers should also recognize that some of these best practices—such as selecting more realistic (usually meaning “less optimistic”) actuarial assumptions—are likely to increase the calculated liability and thereby reduce funded ratios and increase contribution costs in the short-term, though such a change should improve a plan’s ability to meet its long-term pension obligations. Other actions may take many years to significantly improve the funded ratio, such as reducing pension spiking activity.
In the following paragraphs, we look at how each of these best practices applies to Florida’s municipal pension plans. We compare plans in good condition with other plans in order to identify whether plans in good condition are better at following the best practices and, if they are, whether the differences appear to be meaningful.
1. FUNDING ANNUAL PENSION CONTRIBUTIONS
Municipal governments and pension boards work with professional actuaries to determine how much money needs to be contributed into a pension plan each year in order to cover benefits that are already earned. The amount that is identified is called the Annual Required Contribution (ARC).
The ARC is comprised of two parts.
The first part is called the “normal cost” and represents the cost of future benefits that are earned in the current year by active participants.6
The second part is an amortized portion of benefits that were earned in prior years but for which there are insufficient assets currently available to pay the benefits – the plan’s unfunded liability or Unfunded Actuarially Accrued Liability (UAAL).
A pension plan with a funded ratio that is 100 percent or greater has no unfunded liability and only requires a contribution that will cover the normal cost. If a pension plan is less than 100 percent funded, it has an unfunded liability, and its annual contribution will include the normal cost and an amortized portion of the unfunded liability.
The amortization period for the unfunded liability is usually 30 years. The 30-year amortization period is the reason many officials compare paying down their unfunded liability to paying off a mortgage. Theoretically, if the sponsor of an underfunded pension plan pays its full ARC every year over the entire amortization period, its pension plan will eventually be fully funded. That is only true, however, if the plan’s actuarial assumptions are met or exceeded, on average, over the amortization period; the plan does not grant retroactive benefit increases to its participants or retirees, including cost-of-living adjustments that were not included in the actuarial calculations; and, the plan does not re-amortize its unfunded liability

4 | Tough Choices Facing Florida's Governments
prior to completing its original amortization period (like refinancing a 30-year fixed mortgage over another 30 years before the mortgage is paid in full).
Florida Statute requires that public pension plans are funded on an actuarially sound basis (see Chapter VII, Section 112, Florida Statute). As such, annual contributions for local pension plans in Florida are made at no less than 100 percent of the ARC. Plans in good condition do not differ from other plans in paying their full annual contribution.
2. EMPLOYEES SHARE IN CONTRIBUTION COSTS
There are usually three contributors to public pension funds: plan sponsors (i.e., employers), participants (i.e., employees), and investment returns. In Florida, most city police officer and firefighter plans also receive contributions from insurance premium taxes collected by the state and partially disbursed to plans that satisfy the statutory standards (Chapters 175 and 185, Florida Statute).7
Experts suggest that both employees and employers should share in contributions. It is rare for a plan to completely exempt its employee participants from contributing to their own pension. There are only four plans in our sample that do not require any contribution from their employees.
Employees’ contributions are usually calculated as a fixed percent of their salaries and these rates rarely change. In comparison, employers’ contribution rates change regularly in order to cover their annual required contribution. The employees’ portion is also usually much smaller than the employers’.
There are several reasons for requiring employees to contribute to their pensions. Some of those reasons include: (A) a perspective that pensions provide public workers with private benefits and so it is reasonable and fair to expect them to contribute toward their own private benefit; (B) pension costs are significant causes of budgetary stress and employers ask their workers to contribute in order to reduce budgetary pressure; (C) employee contributions are a stable, predictable revenue source; and, (D) employee contributions allow unions and employers to pursue various negotiating preferences when bargaining benefits.
Charts 3 and 4 provide the typical contribution rates for general employees (Chart 3) and public safety employees (Chart 4) by funded ratios and the typical value for all general employee plans and public safety employee plans.8
CHART 3: General Employee Median Contribution Rates
FUNDED RATIO Employee Contribution Employer Contribution
More than 90% 4.8% 11.5%
80 to 90% 4.6% 16.5%
70 to 80% 6.0% 19.9%
60 to 70% 6.5% 30.1%
Less than 60% 8.0% 35.7%
Median 6.0% 22.9%Source: DMS annual reports, appendix A
CHART 4: Public Safety Employee Median Contribution Rates
FUNDED RATIO Employee Contribution Employer Contribution State Contribution
More than 90% 5.2% 15.1% 5.5%
80 to 90% 6.1% 26.7% 5.5%
70 to 80% 6.0% 31.2% 5.9%
60 to 70% 8.0% 38.1% 6.1%
Less than 60% 7.5% 46.9% 5.7%
Median 7.0% 33.7% 5.8%
Source: DMS annual reports, appendix A

DOING IT RIGHT: Recognizing Best Practices In Florida’s Municipal Pensions | 5
The evidence suggests that poorly funded plans tend to require higher contributions from their employees than well-funded plans.
We use a simple statistical regression model to examine whether employee contribution rates are correlated with normal costs (as a percent of payroll) or amortized liability contributions (as a percent of payroll). We find a positive correlation between increased employee contribution rates and increased normal costs among plans with below average employee contribution rates, but the effect goes away among plans with average employee contribution rates and even declines among those plans with particularly high employee contribution rates.
There is also a positive correlation between employee contribution rates and annual costs associated with unfunded liabilities. However, that effect does not change across different levels of employee contribution rates. On average, as annual costs to cover unfunded liabilities increase, current employees are asked to pay more.
The findings suggest that current employees are paying the price for unfunded liabilities by as much as 2 to 4 percent of their salary. Well-funded plans allow workers to take home more of their pay and give them more confidence that their benefits will be there when they retire. We should be skeptical of claims that poorly funded plans are the result of insufficient employee contributions. Instead, when we see a poorly funded plan, there is reason to think that the current employees are paying more into that plan because of burdens created by the plan’s liabilities. We may also question whether efforts to increase employee contributions are truly about matching individual contributions with their private benefits, or whether it is more about shifting the liabilities for benefits promised to previous workers onto current employees.
3. CONTAINING COST-OF-LIVING ADJUSTMENTS (COLAs)
Over time, inflation reduces the purchasing power of pension benefits. Retirees who received $50,000 a year in 1995, and did not receive cost-of-living adjustments, would have lost about one third of their purchasing power by 2012 (based on Consumer Price Index or CPI-adjusted dollars). Their 2012 pension would still be $50,000, but they would need approximately $75,300 to purchase as many goods and services in 2012 as they could have purchased with $50,000 in 1995. Pension plans address this problem, so-called inflationary risk, by providing retirees with cost-of-living-adjustments (COLAs) to help cover rising prices in fuel, groceries, utilities and other goods and services.
There are three approaches to providing COLAs: fixed percentage rate, where retirees receive an automatic COLA every year at a fixed compounding interest rate (i.e., 3 percent); indexed percentage rate, where retirees receive an automatic COLA every year and the rate of compound growth is determined by an economic index (i.e., consumer price index); and ad-hoc, where COLAs are not automatically provided but are considered on a regular basis.
COLAs that increase pension benefits by a fixed percentage rate each year can create significant cost increases if the rate is set too high. In our prior example, if retirees with $50,000 annual pensions had a fixed 3 percent COLA from 1995 to 2012, their 2012 benefits would be approximately $82,600. That is much more than the $75,300 they needed to keep the purchasing power of their original pension. In comparison, if their fixed-COLA was 2 percent, they would have approximately $70,000 in 2012, which is a reduction in purchasing power but closer to the actual inflation-adjusted dollar value of the original benefit. This example shows how important a single percentage point can be when setting a COLA policy. For this reason, many encourage governments to consider linking their COLAs to an economic index that matches pension benefits with the actual economy. Indexed COLAs, however, create significant risk to pension sponsors. If the economy goes through a period of rapid inflation, pension costs may skyrocket. This explains why many plan sponsors prefer ad-hoc COLAs where they can consider economic trends and budgetary conditions when providing COLAs.
Unfortunately, the Department of Management Services’ (DMS) annual report does not provide systematic information on the size of COLAs, but we can assess whether plans in good condition are less likely to provide automatic increases.
Chart 5 shows the percentage of plans in each funded ratio that have automatic annual COLAs and those with ad-hoc COLAs. The proportion of plans in good condition is not particularly better than those that have funding levels between 60 and 80 percent funded. However, the plans that are the least well-funded are much more

6 | Tough Choices Facing Florida's Governments
likely to provide an automatic COLA.
CHART 5: COLA Policy Characteristics
FUNDED RATIO Automatic Annual COLA Ad-Hoc COLA
More than 90% 46% 54%
80 to 90% 57% 43%
70 to 80% 48% 52%
60 to 70% 52% 48%
Less than 60% 70% 30%
SOURCE: DMS annual reports, appendix B1
4. LIMITING PENSION “SPIKING”
Pension “spiking” refers to strategies that permit employees to significantly increase their pension benefit in a short period of time by taking advantage of the way pension benefits are calculated. The term is most commonly used in reference to employees working many extra hours of overtime in their last years of employment in order to “spike” the salary measurement that is used to calculate their retirement benefit.
The basic formula for calculating pension benefits is to multiply an employee’s Average Final Compensation (AFC) by a weighted percentage (called a multiplier) and then by the number of years of service the worker provided to the employer.
A worker who has 30 years of service credits and averaged $50,000 in their final years of employment with a multiplier rate of 2 percent will receive an annual retirement benefit of $30,000 ($50,000 x 2 percent x 30).
Workers who are near retirement cannot easily increase their years of credited service and they have little influence over the multiplier rate. However, workers may be able to increase their average final compensation (AFC) by increasing their qualified earnings in their final years. Their ability to increase qualified earnings depends on two components: (1) plan specific policies that identify the types of earnings that can be included in the AFC, and (2) the time period that is used to average the earnings.
The first component – plan specific policies that define qualified income – receives the most public attention. The most recognized case of pension spiking in Florida is likely the 911 call center operator in Miami Beach who reportedly turned a $60,000 a year income into a $150,000 a year pension benefit by spiking her income in the final years before retirement.9
Overtime is just one way to potentially spike pension benefits. Other strategies include payouts of unused vacation or sick leave, providing large pay raises in the years prior to retirement, and banking deferred compensation. Unfortunately, we are unable to use the DMS report to identify whether plan policies are an important cause of differences in funded ratios.
In recognition of the importance of limiting the inclusion of extra earnings in pension calculations, the LeRoy Collins Institute recommended that localities exclude overtime and additional earnings/bonus pay in the base salary used to calculate pension benefits.10 As part of a 2011 reform of public pensions, the Florida Legislature limited overtime and sick/annual leave that can be used in most general employee, police and firefighter pensions. Affected workers can include up to 300 hours of overtime and must exclude sick and annual leave.
The second component in pension spiking - the time period used to calculate the AFC - receives far less attention. When pension plans calculate the average final compensation over shorter periods of time, and average over years (the most common) instead of months, it is much easier for workers to game the calculated average. Cities may reduce pension spiking by increasing the total number of years used to calculate average final compensation and by calculating on average months rather than years.

DOING IT RIGHT: Recognizing Best Practices In Florida’s Municipal Pensions | 7
CHART 6: Service Years Included in Average Final Compensation (AFC)
FUNDED RATIO 2 years 3 years 4 years 5 years Varies
More than 90% 8% 33% 0% 58% 0%
80 to 90% 10% 19% 0% 60% 12%
70 to 80% 3% 25% 2% 60% 10%
60 to 70% 8% 19% 2% 60% 11%
Less than 60% 3% 38% 0% 49% 10%
SOURCE: DMS annual reports, appendix B1
Chart 6 shows the proportion of plans within each funded ratio category by Average Final Compensation (AFC) calculations over varying years of service. Whether these are the last years of service or the highest earning years of service is not identified in the DMS data.
These results demonstrate little difference between plans in good condition and other plans. Averaging compensation over five years is the most common time period across all funded ratio categories. The worst funded plans tend to use five year averaging periods the least often. Plans in good condition are the most common among those using just two years to calculate the average final compensation, though this result may be due to the relatively low number of plans reporting that their time period “varies” among the best-funded category. These findings may support suggestions that pension spiking is not a systematic source of poorly-funded plans, though it doesn't suggest that pension spiking is not a problem among all plans.
WHAT’S THE DIFFERENCE?
The importance of AFCs and multipliers can be shown in a simple example of four hypothetical workers who will retire with 30 years of credited service.
All four employees earned $60,000 in their final year before retirement. In the four years leading up to retirement, they each made $48,000, $51,000, $54,000, and $57,000. The AFC for Workers A & B is calculated on the highest three years of earnings while the AFC for Workers C & D is calculated on the highest five years of earnings. As such, the calculated final compensation for Workers A & B is $57,000, and the calculated final compensation for Workers C & D is $54,000.
The multiplier rate for Workers A & C is 2 percent and the rate for Workers B & D is 3 percent.
Their retirement benefits are calculated in Chart 8 below.
CHART 8: Illustration of Importance of Retirement Benefit Components
Worker AFC Years AFC MultiplierService Credits
Annual Pension Benefit
A 3 $57,000 2 30 Years $34,200
B 3 $57,000 3 30 Years $51,300
C 5 $54,000 2 30 Years $32,400
D 5 $54,000 3 30 Years $48,600
The calculated pension benefits in Chart 8 demonstrate the significant effect of multiplier rates on annual pension benefits. When the multiplier in our example increases by one percentage point, the benefit increases by 50 percent. In comparison, the pension benefits in our example only increases by about 5.5 percent when the AFC is calculated on the highest three years of earnings instead of the highest five years.
What if all four workers are able to spike their pensions by including an extra $10,000 in overtime in their last two years of work? The benefits would look like this:
8 | Tough Choices Facing Florida's Governments
CHART 9: Expanded Illustration of Importance of Retirement Benefit Components
Worker AFC Years AFC MultiplierService Credits
Annual Pension Benefit
Annual Benefit Increase Due to
Spiking
A 3 $63,667 2 30 Years $38,200 $4,000
B 3 $63,667 3 30 Years $57,300 $6,000
C 5 $58,000 2 30 Years $34,800 $2,400
D 5 $58,000 3 30 Years $52,200 $3,600
Chart 9 indicates that the effect of spiking activities can significantly increase the annual pension benefit and that plans that calculate AFC over fewer years are more susceptible to pension spiking. Workers A & B were able to capture approximately half of their two years of spiked earnings into their pension. Workers C & D were only able to capture approximately one-fourth to one-third of their spiked earnings. As a dollar amount, these pension increases do not appear to be large. However, as a proportion, these increases provided a 10 percent increase to annual benefits throughout retirement and could have a comparable increase to a plan's liabilities if most workers are able to spike their pensions in a similar way. As workers are able to include more earnings into their AFC, the size of this difference increases.
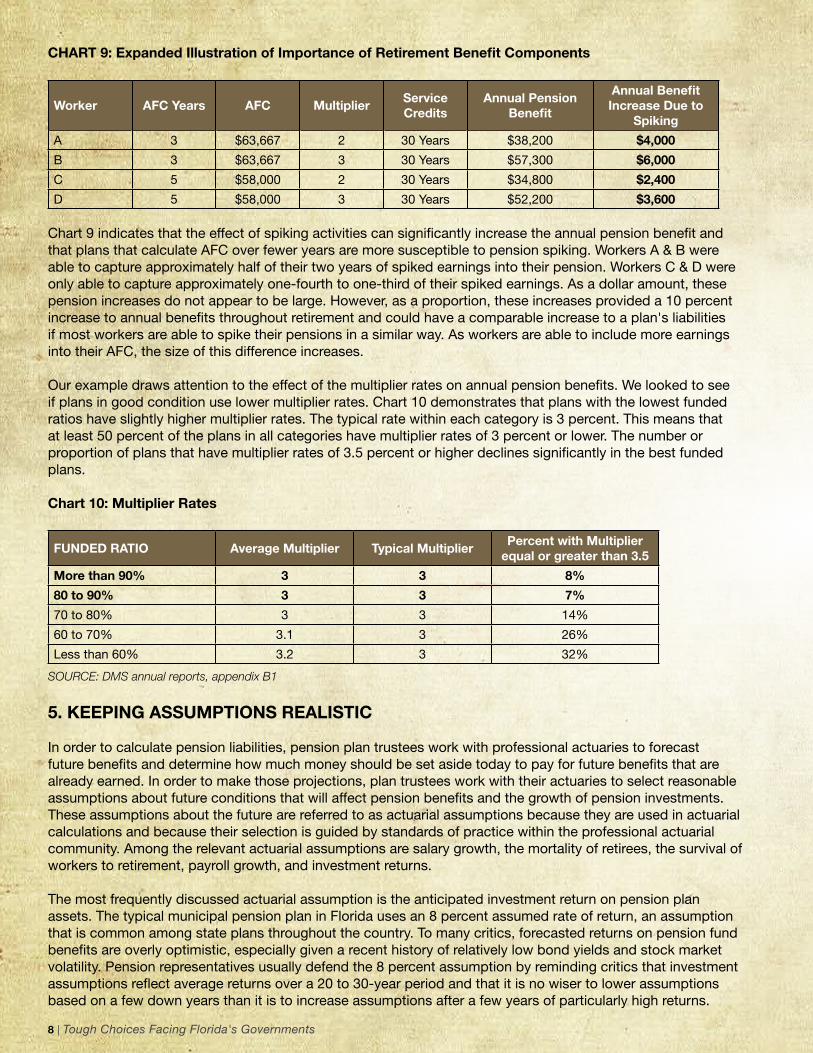
Our example draws attention to the effect of the multiplier rates on annual pension benefits. We looked to see if plans in good condition use lower multiplier rates. Chart 10 demonstrates that plans with the lowest funded ratios have slightly higher multiplier rates. The typical rate within each category is 3 percent. This means that at least 50 percent of the plans in all categories have multiplier rates of 3 percent or lower. The number or proportion of plans that have multiplier rates of 3.5 percent or higher declines significantly in the best funded plans.
Chart 10: Multiplier Rates
FUNDED RATIO Average Multiplier Typical MultiplierPercent with Multiplier
equal or greater than 3.5
More than 90% 3 3 8%
80 to 90% 3 3 7%
70 to 80% 3 3 14%
60 to 70% 3.1 3 26%
Less than 60% 3.2 3 32%
SOURCE: DMS annual reports, appendix B1
5. KEEPING ASSUMPTIONS REALISTIC
In order to calculate pension liabilities, pension plan trustees work with professional actuaries to forecast future benefits and determine how much money should be set aside today to pay for future benefits that are already earned. In order to make those projections, plan trustees work with their actuaries to select reasonable assumptions about future conditions that will affect pension benefits and the growth of pension investments. These assumptions about the future are referred to as actuarial assumptions because they are used in actuarial calculations and because their selection is guided by standards of practice within the professional actuarial community. Among the relevant actuarial assumptions are salary growth, the mortality of retirees, the survival of workers to retirement, payroll growth, and investment returns.
The most frequently discussed actuarial assumption is the anticipated investment return on pension plan assets. The typical municipal pension plan in Florida uses an 8 percent assumed rate of return, an assumption that is common among state plans throughout the country. To many critics, forecasted returns on pension fund benefits are overly optimistic, especially given a recent history of relatively low bond yields and stock market volatility. Pension representatives usually defend the 8 percent assumption by reminding critics that investment assumptions reflect average returns over a 20 to 30-year period and that it is no wiser to lower assumptions based on a few down years than it is to increase assumptions after a few years of particularly high returns.

DOING IT RIGHT: Recognizing Best Practices In Florida’s Municipal Pensions | 9
Of course, no one really knows how stock and bond investments will perform in the future. Supporters of keeping investment assumptions at their current levels assume that the future will be similar to the past and argue that historic returns favor their current assumptions. Critics contend that plans' assumptions should be based on conservative expectations of the future in order to protect future taxpayers.
In Chart 11, we look at whether the best-funded plans tend to use more optimistic or conservative investment assumptions. We also evaluated the difference between the assumed investment returns and actual investment returns from 2004 to 2012 (the only years of comparable data). The purpose of this analysis is to see if better-funded plans tend to be more successful at meeting their assumptions.
CHART 11: Are Their Assumptions More or Less Conservative and How Well Do Their Assumptions Match Actual Results?11
FUNDED RATIO INVESTMENT RETURNS SALARY GROWTHASSUMPTION ACTUAL VARIANCE SINCE 2003 ASSUMPTION ACTUAL VARIANCE SINCE 2003
More than 90% 7.8% 4.7% 3.1% UV 6% 4.6% 1.4% FV
80 to 90% 8% 4.2% 3.8% UV 6.3% 4.8% 1.5% FV
70 to 80% 8% 3.9% 4.1% UV 6% 5.0% 1.0% FV
60 to 70% 8% 3.8% 4.2% UV 6.3% 6.1% .2% FV
Less than 60% 8% 3.1% 4.9% UV 6% 6.4% .4% UV
SOURCE: DMS annual reports, appendix E
Our results indicate that the best-funded plans (those funded at 90 percent or more) tend to have slightly lower assumed investment returns. This goes against claims that plans with better-funded ratios are manipulating their funded ratio by assuming overly optimistic rates of return. That may be true in some cases, but as a group, those plans tend to use slightly lower rates of return. The reason may be because plans with higher funded ratios are under less financial pressure to maintain higher rates of return, even when their governing bodies know that their current assumptions are too high. Or, better-funded plans may have a history of investing in less risky securities which would require a lower investment return assumption.
Another result in Chart 11 is that better-funded plans tend to have better returns over the 10 years we examined. Given that all returns were depressed due to the recent recession, the typical returns across all plans were less than assumed, but the better-funded plans missed their assumptions by a smaller margin. What accounts for this finding? It may be that better-funded plans are managed better than other plans. It may be that they were just luckier than other plans during the time period we analyzed. Or, it may be that better-funded plans tend to be invested in more conservative securities because they do not need to seek above-average investment returns in order to improve their funded ratio and reduce the budgetary costs of pensions.
Chart 11 also presents our analysis on salary growth assumptions across the different funded ratio categories. Unfavorable Variances (UV) indicate the average number of percentage points that the salary assumptions under-estimated actual salary increases. Favorable Variances (FV) indicate the average number of percentage points that the salary assumptions over-estimated actual salary increases.
The results do not indicate a trend in salary growth assumptions by funded ratio, but the results do show that, over the time period studied, better-funded plans tended to over-estimate salary growth. This means that the employees in the better-funded plans tended to experience salary growth that was less than projected, by about 1.5 percent, and the typical poorly-funded plan increased salaries at the assumed level or even more than was assumed.
SUMMARY
In recent months, attention to public sector pensions (including our own work) has focused on the financial sustainability of the promises Florida cities have made to their retirees. The next step is delving more deeply into the commitments made and the administration of the plans, including management of the funds. We have

10 | Tough Choices Facing Florida's Governments
highlighted best practice suggestions for good pension plan management and looked at how those practices are represented in the better-funded municipal plans in Florida.
There is no clear blueprint for good public pension plan management. Rather, there are a number of different options available to be considered a well-funded plan. The variation in the plans examined here highlights the mixture in approaches. However, we do know that well-funded plans tend to make decisions that balance the needs and expectations of retirees with realistic financial commitments for the public’s purse. The five approaches we examined help municipalities successfully balance public and retiree interests. They include:
• ARC payments were, for the most part, made at or above the 100% level• Employees shared the cost of their plans, allowing the plan to avoid costly increases in
contributions• The cost-of-living adjustments were kept at low, manageable levels• Pension spiking was limited, both by exclusions of overtime and pension calculation controls• Actuarial assumptions were realistic
OUR DATA
The data in this report are collected from the Florida Local Government Retirement Systems annual reports published by the Florida Department of Management Services (DMS). In the 2012 annual report, DMS states that it oversees "492 municipal and special district plans and school boards’ early retirement programs for actuarially sound funding” (p.1).
Our final sample includes 254 of the 492 plans. We reduced the sample for the following reasons:
We included only plans with actuarial valuations of their funded ratio in 2010, or more recently. This reduced our sample to 460. Eighty-three percent of the valuations in our sample occurred in 2011 and 16 percent occurred in 2010.
Our study also includes only plans that use the most common actuarial cost method (Entry Age Normal or EAN). This is the same method used by the Florida Retirement System and provides the most conservative presentation of the funded ratio. That reduced our sample to 317 plans.
We also removed: three plans that were early retirement plans sponsored by county governments, 40 plans that are closed to new participants, four plans that are for voluntary firefighters, five plans that are for public authorities, and 11 plans from governments that issued pension obligation bonds prior to their most recent actuarial valuation.
ENDNOTES
1See LeRoy Collins Institute. February 2011. Trouble Ahead: Florida Local Governments and Retirement Obligations (http://tinyurl.com/c5hrunt) and LeRoy Collins Institute. September 2012. Years in the Making: Florida's Underfunded Municipal Pension Plans (http://tinyurl.com/but68rw).
2This approach is similar to studies conducted by the U.S. Government Accountability Office, Boston College's Center for Retirement Research, the National Institute on Retirement Security, the PEW Center on the States, and other well-respected research institutions. However, this approach also has its critics. There are reasonable concerns based on the variability in actuarial assumptions and plan characteristics as well as on the way that common actuarial cost methods recognize salary earnings that are not yet earned. These criticisms, and others, suggest that actuarial funding levels are rough approximations and that liabilities tend to be overstated. Others, however, counter that it is more often that liabilities are understated, espe-cially because of overly optimistic assumptions.
3Entry age normal (EAN) is a cost allocation method performed on an individual participant using the participant’s entry age as the starting point for cost allocation. Through the use of salary projections, the participant’s total prospective pension benefit is estimated and then the actuarial present value of that benefit at the participant’s entry age is determined. This
Tough Choices: A research series focused on state and local government relationships
from the LeRoy Collins Institute.

DOING IT RIGHT: Recognizing Best Practices In Florida’s Municipal Pensions | 11
Tough Choices: A research series focused on state and local government relationships
from the LeRoy Collins Institute.
value (or cost) is then allocated to each year of the participant’s service years from entry age to retirement age in an amount that is either a level dollar or level percentage of the participant’s estimated salary from entry age to final retirement age. (p. 66, Jun Peng, (2008) State and Local Pension Fund Management, CRC Press.)
4U.S. Government Accountability Office. 2008. "State and Local Government Retiree Benefits: Current Funded Status of Pension and Health Benefits."
5Jun Peng and Illana Boivie, 2011. “Lessons from Well-Funded Public Pensions: An Analysis of Six Plans that Weathered the Financial Storm.” Washington, DC: National Institute on Retirement Security; Alicia H. Munnell, Kelly Haverstick and Jean-Pierre Aubry. 2008. “Why Does Funding Status Vary Among State and Local Plans?” Boston: Center for Retirement Research at Boston College.
6The funding of public pension plans follows the “matching principle” of accounting. That means that pension plans should recognize the cost of pension benefits during the time period when the benefits are earned rather than the time period when the benefits are paid. This perspective recognizes pension benefits as a type of deferred compensation for work that was provided in previous years and assigns the cost of financing those benefits to the time periods when the work was performed that earned the future benefit. The alternative would be a pay-as-you-go system, where retirement benefits were recognized as costs when retirees received payments. The pay-as-you-go system creates a condition called “intergenerational inequity” because future taxpayers are required to pay for the retirement benefits that resulted from services that they never received. In order to follow the matching principle, pension plans obtain the services of a professional actuary who forecasts the size of future retirement benefits and then calculates the current year’s portion of those future benefits. That calculated amount is called the “normal cost.”
7There are several types of Chapter 175 and 185 plans for firefighters and police officers in Florida. The chapter plan has a defined benefit plan incorporating provisions of Chapters 175 and 185 in state law; the local law plan sets forth a defined benefit plan established by ordinance, and special act of the legislature, and must meet or exceed Chapters 175/185 mini-mum standards and benefits; a supplemental plan provides extra benefits in a separate plan. Ronald C. Cohen. 2012. Over-view of Florida Law. Florida Public Pension Trustees Association Trustees School. Feb. 6. Jacksonville, FL.
8This report uses the term “typical” in reference to the median value. The median value is the middle observation—half of the values are larger than the median and half of the values are smaller. The median differs from the average because it is not disproportionately affected by extremely high or extremely low values (so-called outliers).
9See David Smiley and Daniel Chang. 2011. “Municipal Pensions a Bonanza for Employees, a Burden for Cities.” Miami Her-ald. Sept. 17.
10LeRoy Collins Institute. 2011. Trouble Ahead: Florida Local Governments and Retirement Obligations (http://tinyurl.com/c5hrunt).
11The assumption figures in Chart 11 are from the most recently published pension reports. The variance figures are actual differences since 2003, and the actual figures are the mathematical difference between the two.

LEROY COLLINS INSTITUTE
Established in 1988, the LeRoy Collins Institute is an independent, nonpartisan, non-profit organization which studies and promotes creative solutions to key private and public issues facing the people of Florida and the nation. The Institute, located in Tallahassee at Florida State University, is affiliated and works in collaboration with the State University System of Florida.
Named in honor of former Florida Governor LeRoy Collins, the Institute is governed by a distinguished board of directors, chaired by Allison DeFoor, D.Min. Other board members include executives, local elected officials, and senior professionals from throughout the state.
Beginning in 2005, the Institute published several reports in a series called, Tough Choices: Shaping Florida’s Future. These publications provided an in-depth analysis of Florida tax and spending policy including Medicaid, PreK-12 education, higher education, and children’s health and welfare. The research concluded Florida’s pattern of low spending and low taxes conflicted with the growing demands of the state’s residents, predicting trouble may be ahead.
In the newest research series, Tough Choices: Facing Florida’s Governments, the Institute takes an objective look at the often tumultuous relationship between state and local governments in Florida. This report Trouble Ahead: Florida Local Governments and Retirement Obligations is the initial release in this research series. This report was written by David Matkin, Ph.D., assistant professor in the Askew School of Public Administration and Policy, who is the lead researcher on the local retirement component of the Institute’s state-local analysis.
Future reports will examine trends in municipal and county spending and revenue, the effects of state mandates on Florida’s local governments, state proposals to limit local revenues, and differential effects of the economy and state mandates on fiscally distressed communities. The Tough Choices research series is funded by the Jessie Ball duPont Fund.
All publications from the Institute can be found at the Institute’s website: CollinsInstitute.fsu.edu
LEROY COLLINS INSTITUTE
The past few years have been tumultuous ones for Floridians and their governments. Florida has faced near-record unemployment, housing prices have plummeted, the number of foreclosures has skyrocketed, and government revenues have fallen substantially. Realistic expectations would indicate a slow recovery for Florida and its citizens.
Florida local governments have seen their revenues fall, the demands for services increase, and the public increasingly critical of how they do their job. State legislators have piled on, putting measures on the November 2012 ballot that can substantially lower the property tax levies that make up the majority of local governments’ revenue. Local officials are calling “foul,” but who is listening?
The timing seems right for a careful assessment of financial trends in Florida local governments’ revenues and spending. As part of a larger project on state-local relationships in Florida funded by the Jessie Ball duPont Fund, the LeRoy Collins Institute (LCI) is examining these fiscal trends across the state’s counties, municipalities, and school districts spanning the mid-1970s to the 2000s. This report analyzes these financial trends for Florida’s counties and how prepared they are for the current tough times. It provides an assessment of important financial trends in Florida counties leading up to the current financial downturn and puts this crisis in context. This analysis clearly shows what a difference the past three years has made to Florida counties. In the thirty-year period between 1976 and 2006, with only one exception in the early 1990s, revenues and spending increased for Florida’s counties, accelerating during
THE DOUBLE WHAMMY FACING FLORIDA’S COUNTIES
August 2011LeRoy Collins Institute - FSU Campus P: 850.644.1441 • F: 850.644.1442
506 West Pensacola Street • Tallahassee, Florida 32306-1601http://collinsinstitute.fsu.edu - Follow us on Twitter: @LCInstitute_FL
Chairman Lester Abberger, Tallahassee
Vice Chairman Allison DeFoor, D.Min, Tallahassee
Director Carol S. Weissert, Ph.D., Tallahassee
Clarence Anthony, West Palm Beach
Jim Apthorp, Tallahassee
Jane Collins Aurell, Tallahassee
Jeffrey Bartel, Miami
Colleen Castille, Tallahassee
Betty Castor, Tallahassee
Rena Coughlin, Jacksonville
Richard Crotty, Orlando
Sandy D’Alemberte, Tallahassee
Brian Dassler, New Orleans, LA
Rick Edmonds, St. Petersburg
Joel Embry, Fernandina Beach
Pegeen Hanrahan, Gainesville
Patricia Levesque, Tallahassee
Jim Ley, Sarasota
John Marks, III, Tallahassee
Audrey Moran, Jacksonville
John Padget, Key West
David Rasmussen, Ph.D., Tallahassee
Don Slesnick, Miami
Hansel Tookes, Palm Beach
Ken van Assenderp, Tallahassee
Established in 1988, the LeRoy Collins Institute is a nonpartisan, statewide policy organization which studies and promotes creative solutions to key private and public issues facing the people of Florida and the nation. The Institute, located in Tallahassee at Florida State University (FSU), is affiliated and works in collaboration with the State University System of Florida.
Named in honor of Florida Governor LeRoy Collins, the Institute is governed by a distinguished board of directors, chaired by Lester Abberger. Other board members include executives, local elected officials, and senior professionals from throughout the state.
Beginning in 2005, the Institute produced several reports in a series called Tough Choices: Shaping Florida’s Future. These publications provided an in-depth analysis of Florida tax and spending policy and concluded that Florida’s pattern of low spending and low taxes conflicted with the growing demands of the state’s residents, predicting trouble might be ahead.
Recent work in this series has examined local retirement benefits, including both pensions and other post-employment benefits, including health benefits, and ethics policy, another timely issue in state and local relationships. The Institute collaborated with Integrity Florida on the most recent report, Florida Counties Bridge the Ethics Policy Gap, which surveyed Florida counties, citing seven case studies, pointing out that a number of them have taken the lead in ethics policy in the absence of state law. This year, the legislature passed two bills for ethics reform in the state.
This report, Doing it Right: Recognizing Best Practices In Florida’s Municipal Pensions, is the latest effort to look into municipal pension funding in the state. It identifies municipal pension plans in Florida that are in “good condition” and examines whether those plans tend to be better than others at following nationally-recognized “best practices” in public pension management. The report was written by Dr. David Matkin, Assistant Professor in the FSU Askew School for Public Administration and Public Policy, with assistance from Institute Director Carol Weissert, Ph.D., and Stefan Massol, student researcher and recent FSU Master of Public Administration graduate. Lindsay Potvin, Jennifer Fennell and Stacie Linley contributed to the editing, proofing and production of the report.
The Tough Choices research series is funded by the Jessie Ball duPont Fund. Future reports in the series will examine local health benefits, special districts, and state intergovernmental aid.
All publications from the Institute can be found on the Institute’s website: http://CollinsInstitute.fsu.edu.
LeRoy Collins Institute Board of Directors: