Embed Size (px)
Citation preview
Does the internet improve lives?
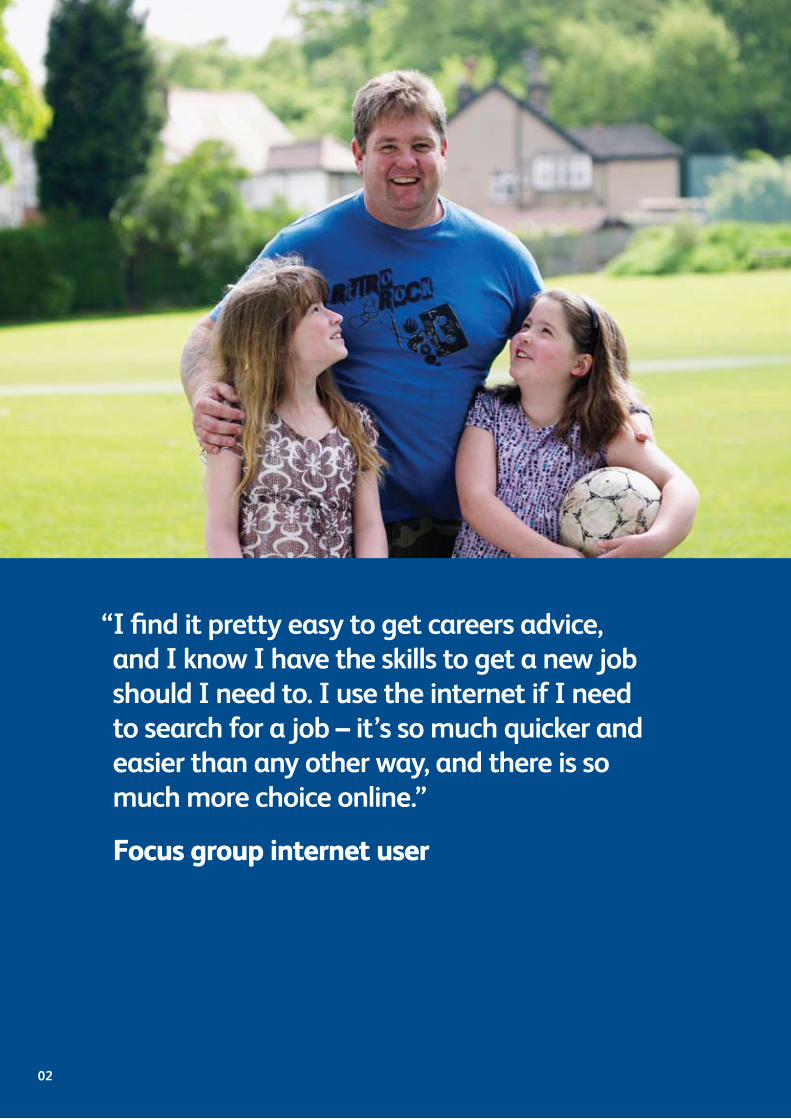
“ I find it pretty easy to get careers advice, and I know I have the skills to get a new job should I need to. I use the internet if I need to search for a job – it’s so much quicker and easier than any other way, and there is so much more choice online.”
Focus group internet user
02
Table of contents
1. Foreword 04–05
2. Introduction 06–08 2.1 The approach
2.2 Background to the research 2.3 The wider digital inclusion research context 2.4 What’s in this report?
3. Executive summary 09–11 3.1 Key findings
3.2 Does the internet improve lives? 3.3 What this means for delivering digital inclusion
4. Introducing the characters 12–15 4.1 Internet user
4.2 Internet non-user
5. How do different groups view the internet? 16–23 5.1 Perceptions and motivations – users
5.2 Perceptions and motivations – non-users 5.3 Comparing users and non-users
6. Impact on lives 24–35 6.1 Social capital
6.2 Confidence and quality of life 6.3 Employment 6.4 Health 6.5 Savings
7. Concluding remarks 36–38 7.1 What this research has shown
7.2 Next steps
References 39
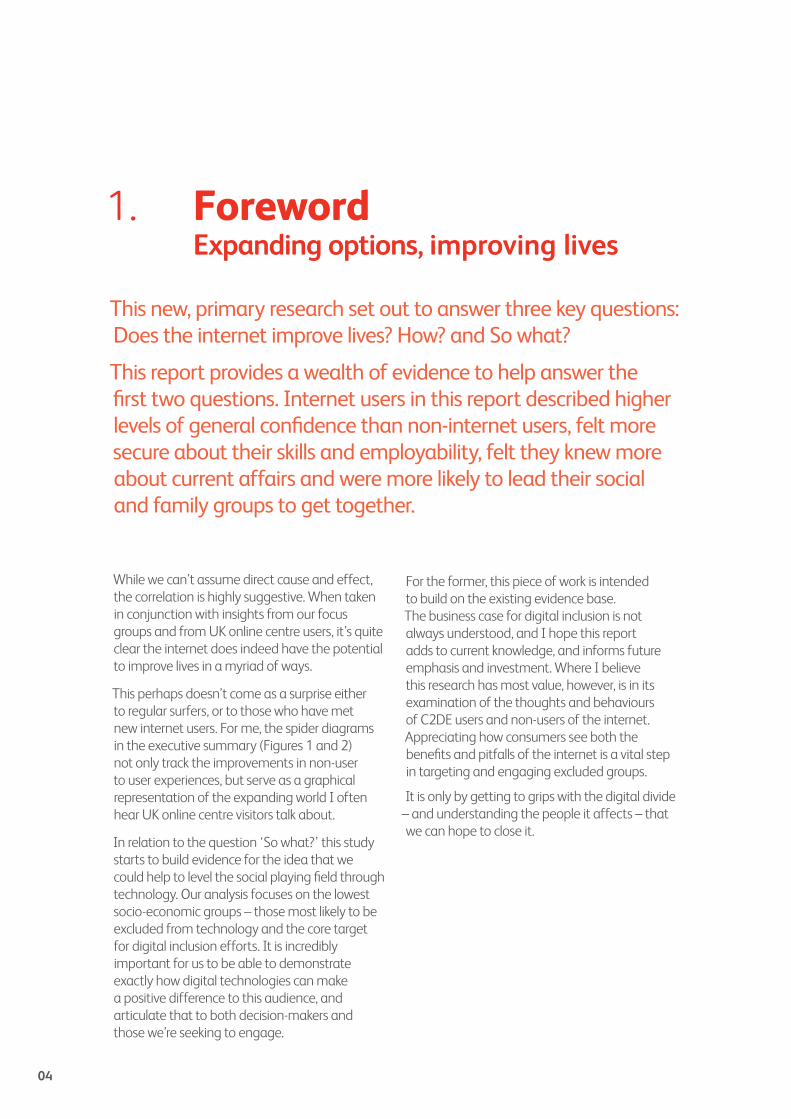
1. Foreword Expanding options, improving lives
This new, primary research set out to answer three key questions: Does the internet improve lives? How? and So what?
This report provides a wealth of evidence to help answer the first two questions. Internet users in this report described higher levels of general confidence than non-internet users, felt more secure about their skills and employability, felt they knew more about current affairs and were more likely to lead their social and family groups to get together.
While we can’t assume direct cause and effect, the correlation is highly suggestive. When taken in conjunction with insights from our focus groups and from UK online centre users, it’s quite clear the internet does indeed have the potential to improve lives in a myriad of ways.
This perhaps doesn’t come as a surprise either to regular surfers, or to those who have met new internet users. For me, the spider diagrams in the executive summary (Figures 1 and 2) not only track the improvements in non-user to user experiences, but serve as a graphical representation of the expanding world I often hear UK online centre visitors talk about.
In relation to the question ‘So what?’ this study starts to build evidence for the idea that we could help to level the social playing field through technology. Our analysis focuses on the lowest socio-economic groups – those most likely to be excluded from technology and the core target for digital inclusion efforts. It is incredibly important for us to be able to demonstrate exactly how digital technologies can make a positive difference to this audience, and articulate that to both decision-makers and those we’re seeking to engage.
For the former, this piece of work is intended to build on the existing evidence base. The business case for digital inclusion is not always understood, and I hope this report adds to current knowledge, and informs future emphasis and investment. Where I believe this research has most value, however, is in its examination of the thoughts and behaviours of C2DE users and non-users of the internet. Appreciating how consumers see both the benefits and pitfalls of the internet is a vital step in targeting and engaging excluded groups.
It is only by getting to grips with the digital divide – and understanding the people it affects – that we can hope to close it.
04
To complicate matters, digital inclusion remains something of a moving target. As technology, society and the economy change around us, so do people’s motivations, attitudes and even access to technology. Skills fade, priorities alter, and new software or online trends hit our streets, offices, schools and homes. This is not an area where research will ever be completed, and where we can sit back satisfied we’ve got it all figured out. It is vital that we keep asking questions, and that we put the right questions to the right people.
Over the last few years, the emerging digital inclusion sector has come a long way in scoping its field. The evidence base includes research from Ofcom, the Office for National Statistics, the Oxford Internet Institute, CapGemini, Intel, BT, Citizens Online and many more, and it has already changed how digital inclusion is seen and tackled. From this work we know 70% of the off-line population come from social groups C2, D and E1. We also know a lot about the lives of people in this group, their homes and habits, media consumption and use. This piece of work helps us understand more about their attitudes to the internet in particular, and explores the how and why of their use or non-use.
It is a particularly crucial time for us to check and then act upon our understanding of digital exclusion. The current recession is hitting those at the bottom of the social pile harder than anyone else, and it is therefore increasingly urgent that we act in whatever way we can to improve their situation. Digital inclusion does have a role to play here, and in this report we see internet users’ confidence in their ability to find work outstripping non-users by around 25%, and around 50% of internet users reporting annual savings through online shopping and price comparison of at least £240 – a figure not to be sniffed at.
In October 2008, in their document Delivering Digital Inclusion: an Action Plan for Consultation, government recognised digital exclusion for the first time as both a factor in and root cause of social exclusion. The economic downturn has seen this agenda subsequently gain both momentum and attention. Perhaps most significantly, media literacy and digital take up – digital inclusion by any other name – also featured alongside economic growth plans, next generation access and content development in Lord Carter’s flagship Digital Britain interim report.
The key to making a difference to people’s lives through use of the internet has been identified in both these documents as a combination of skills, access and motivation. This research shows that C2DE non-users of the internet fall relatively evenly into two camps; the Excluded – who lack access or skills, and the Rejectors – who lack motivation.
Here we propose that it is the latter group who pose the greatest challenge for digital inclusion action moving forward. We can build the pipes, we can create the sites and we can deliver the skills, but unless the 17 million people currently off-line2 are motivated to take that first step on a digital journey, we will achieve very little. For the six million digitally and socially excluded3, that task only gets tougher.
I consider UK online centres to be at the forefront of work on motivation, as one of the few organisations ‘marketing’ digital inclusion on a large scale. We run several campaigns, including the now annual Get online day each Autumn. Drawing on this report and other marketing research, our basic model involves a national PR campaign to raise awareness, backed by local marketing from UK online centres under our umbrella theme to attract digitally excluded people into their centre. It is the people and organisations on the ground who are best placed to work on deep seated Rejector attitudes and fears, and that local action is essential in helping the excluded get online and stay online.
As Digital Britain and the Digital Inclusion Action Plan move into policy and delivery, I hope to see increased leadership for research into, and delivery of, digital inclusion. We must keep up-to-date with the divide and respond to it accordingly, but to achieve that sort of agility, we all need to be working together. Government leadership from Carter and Murphy will give us a unique opportunity to pool cross-sector research insights and plans, and more importantly to amalgamate cross-sector resources and expertise.
It is our best chance to make sure digital inclusion – and the internet – fulfils the potential identified here to improve real lives and life chances.
I do hope you enjoy reading this report, and I hope it helps the sector take another step on its own digital journey.
Helen Milner Managing Director, UK online centres
05
2. Introduction
This research aims to build on our understanding of digital inclusion by exploring the impact or benefits of inclusion – specifically use of the internet – through the collection and analysis of new primary research.
06
2.1 The approachThere is a multitude of factors that can impact, shape and help determine an individual’s life. This creates significant methodological challenges when trying to isolate and understand the impact of one – the use or non-use of the internet. This study attempts to deal with these challenges by investigating and then comparing individual self-perceptions across a range of common life experiences – health, social capital and well-being, price comparison and purchasing, communication with friends and family, work, education and interaction with public and private services. This allowed the study to explore differences in the responses between internet users and non-users and, through detailed analysis of the results, highlight any correlations.
FreshMinds developed an approach to tackle this task based on:
• Establishing a base for comparison –To enable the study to measure differences between the two groups (C2DE internet users and non-users) FreshMinds developed a set of comparable measures. These were designed to help identify differences in attitudes and behaviours across a broad range of life experiences. A questionnaire was then developed to explore the experiences of each group.
• Exploring differences – A quantitative telephone survey of 810 respondents based on random samples of internet users and non-users from C2, D, and E grades in England.
– Internet users (n = 410, weighted) – Non-users (n = 400, weighted)
• Gaining insight – While the survey helped establish a quantitative base, FreshMinds sought further, more grounded explanations for attitudes and behaviours within the two key groups. To this end we ran two focus groups with samples drawn from the target populations (C2DE internet users, non-users, balanced for grade, age and gender) and incorporated the outcomes in our overall analysis. Information has also been taken from UK online centres users, where this can add insight to some of our findings11.
2.2 Background to the researchOver the last three years, UK online centres have sought to further general understanding of digital inclusion issues through a programme of research. That work has included project analysis, market profiling, centre and user satisfaction. It has also included exploration of the links between digital and social exclusion, and the impact of exclusion on individual lives and life chances, on communities, society, and on the wider economy.
These studies, in particular Transformational Government for the Citizen4 , Understanding Digital Inclusion5, Economic benefits of digital inclusion6 , and Digital inclusion, social impact7 offered an intellectual stimulus for this report. Transformational Government highlighted the complexity of use and non-use of the internet as a combination of access, skills, motivation and confidence, and introduced the concept of those digitally constrained or dismissive of technology.
Understanding Digital Inclusion helped to shape thinking about digital inclusion as a socio-demographic issue, and Economic benefits of digital inclusion looked at costs and benefits of digital inclusion for individuals, government, the private sector and country as a whole. Finally, Digital inclusion, social impact gave us a framework for thinking about how the internet can affect people’s lives, and how that can be captured and tracked.
It is the second of these reports, Understanding Digital Inclusion, which has perhaps – in conjunction with research from across the sector – most significantly changed how we now see and approach digital inclusion. A third of the UK population – an estimated 17 million people over the age of 15 – are counted as digitally excluded. More worryingly, there is a consistent correlation between digital and social exclusion, with those already at a social disadvantage more than three times more likely to be digitally excluded. At least 15% of the population – some six million people8 – are both socially and digitally excluded.
Since that research, UK online centres have done further work with ICM9 to find out more about this 15% as a key target for their activities. More than 30,000 interviews later, we know that of the total off-line population:
• 28% live in social housing• 70% are in social group C2DE – 21% C2 – 49% DE• 36% are both C2DE and over 65• 42% are C2DE and retired• 11% are C2DE and working full-time• 40% are C2DE and either widowed,
separated, divorced or single.
We know who the most deeply digitally excluded people are, how old they are, where they live, if they work, and who they live with. From wider demographic information we know what media they consume, what products they buy, and much more. What we don’t understand as fully is what motivates these groups in their use or non-use of the internet, and how to target, engage and convert non-users to users.
FreshMinds was commissioned to help explore the attitudes, characteristics and behaviours of the C2DE demographic segments of the population in order to establish if the internet really does make a difference, how it changes people’s lives, and what leads to its adoption. Of particular interest was the enabling effect of the internet across a range of common experiences and tasks, and the specific factors which cause one set of people to become internet users while another set remain excluded.
07
2.3 The wider digital inclusion research contextIn addition to building on previous UK online centres work, this research sits in a broader context of other research into the internet and digital media consumption.
There are several key studies within this field that need to be mentioned as a backdrop to this report. The communications regulator Ofcom conducts the influential Media Literacy audits and The Communications Market reports10 which show the uptake of different digital technologies across the country. Ofcom’s studies feature demographic profiles of internet users and non-users, similar to those you will read here, and introduce a very crucial distinction of voluntary and involuntary non-use of the internet. Ofcom also proposes attitudinal categorisation of digital media users, which features a spectrum ranging from technological Resisters, through Hesitants, Economisers and Pragmatists, right through to the end goal of the Engaged.
This report endorses the Ofcom studies, and indeed is meant to build on and into this work. However, there are areas we felt worthy of further exploration, and this piece of work differs in a few, fundamental ways:
• Our focus is on the social groups C2, D and E – those at the highest risk of exclusion, and generally assumed to have the most to gain from inclusion.
• Our attitudinal categorisation is based on attitudes and behaviours towards the internet very specifically rather than digital media in general.
• This report examines differences between user and non-user groups in terms of everyday life, activities and tasks.
These differences mean that while this research fits alongside the flagship studies of the field, it puts forward a slightly different perspective intended to add value to the debate.
2.4 What’s in this report?This study starts by introducing the main ‘characters’ – the users and non-users of the internet. This has been done by constructing profiles for a typical member of each group.
The report then proceeds to discuss some underlying attitudes to the internet and the reasons behind its use and non-use, putting forward several sub-segments or categorisations for each group. The subsequent section forms the bulk of the report and discusses the differences between internet users and non-users across the range of real life domains.
08
3. Executive summary
This research has highlighted a number of points which are of considerable significance for strategies aiming to tackle digital exclusion. In particular, it provides further evidence about what may motivate non-users to start using the internet.
09
3.1 Key findings• Non-use of the internet is still clustered in
particular demographic groups
Non-users of the internet are most likely to be from social grades D or E, have low educational attainment, and be female over the age of 65.
• There are significant differences in how internet users’ and non-users’ perceive their own lives
There are marked differences between the two groups on a range of everyday life experiences and tasks. Those who use the internet are likely to be generally more confident, find it easier to plan travel and organise social gatherings, and feel much better informed about current affairs.
• The biggest difference comes in users’ and non-users’ perspectives on employment
In the current economic climate, one of the most significant differences between users and non-users was in their confidence to find information about jobs, do their current job, and find a new job should the need arise. Internet users’ confidence in their ability to find work outstripped non-users by 25%.
• Non-use of the internet is often rooted in prejudice or rejection
A significant proportion of our survey and focus group respondents consisted of Rejectors – those who simply don’t want to use the internet.
They made up nearly half of the non-user group, and their negative perceptions were often rooted in prejudices and media coverage rather than direct experience. They are generally more confident and happier in life than the Excluded – the other 55% of non-users who feel they don’t have the access, skills or resources to use the internet.
• Users of the internet typically have a specific reason to be online
Internet users from our survey and focus groups usually started using the internet for a specific reason, and the motivational types cover Communicators, Hobbyists, Transactors, Functionalists, Knowledge-seekers, Family-orientated users and Technophiles, who use technology for its own sake or in order to keep up with the times. See section 5.1.3 for an explanation of these terms.
• Knowledge-seeking and family are key motivational hooks
Staying in touch with family and friends was the main reason people cited for getting online in the first place, and most internet users tended to keep using the internet for Communication or Knowledge-seeking purposes.
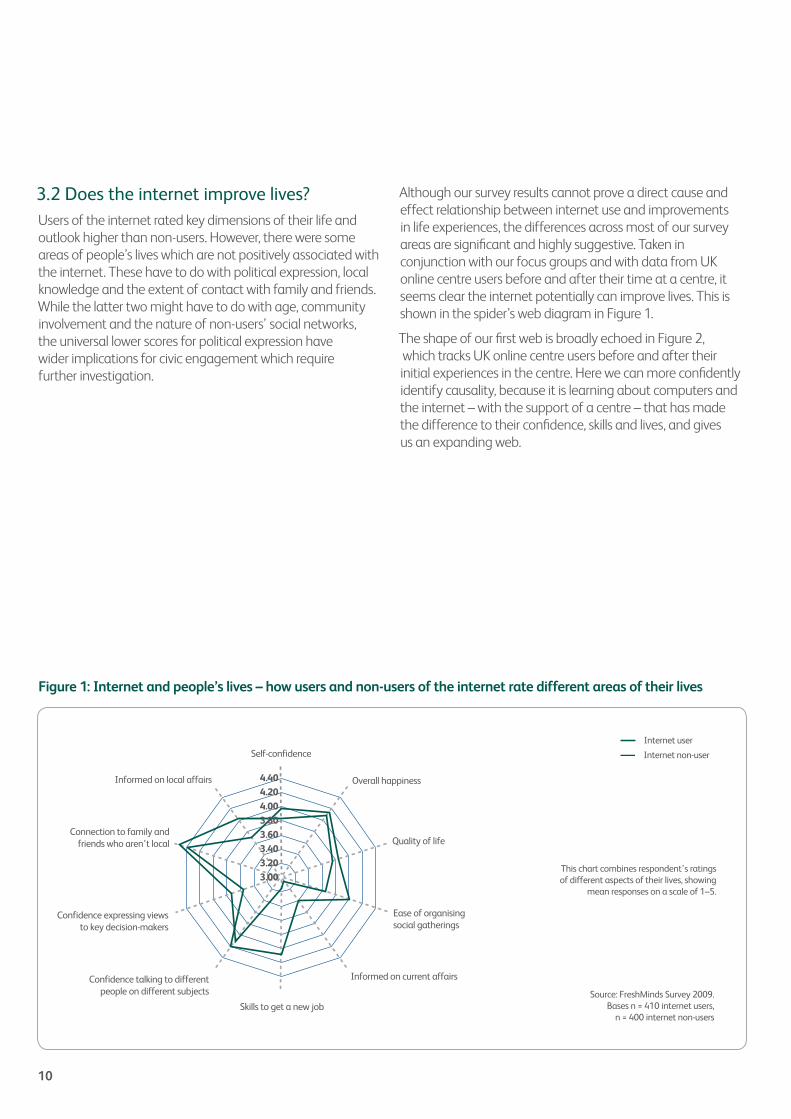
3.2 Does the internet improve lives? Users of the internet rated key dimensions of their life and outlook higher than non-users. However, there were some areas of people’s lives which are not positively associated with the internet. These have to do with political expression, local knowledge and the extent of contact with family and friends. While the latter two might have to do with age, community involvement and the nature of non-users’ social networks, the universal lower scores for political expression have wider implications for civic engagement which require further investigation.
Although our survey results cannot prove a direct cause and effect relationship between internet use and improvements in life experiences, the differences across most of our survey areas are significant and highly suggestive. Taken in conjunction with our focus groups and with data from UK online centre users before and after their time at a centre, it seems clear the internet potentially can improve lives. This is shown in the spider’s web diagram in Figure 1.
The shape of our first web is broadly echoed in Figure 2, which tracks UK online centre users before and after their initial experiences in the centre. Here we can more confidently identify causality, because it is learning about computers and the internet – with the support of a centre – that has made the difference to their confidence, skills and lives, and gives us an expanding web.
Figure 1: Internet and people’s lives – how users and non-users of the internet rate different areas of their livesFigure 1: Internet and people's lives – summary of mean responses.
Source: FreshMinds Survey 2009. Bases n = 410 internet users,
n = 400 internet non-users
This chart combines respondent’s ratingsof different aspects of their lives, showing
mean responses on a scale of 1–5.
Self-confidenceInternet user
Internet non-user
Quality of life
Ease of organisingsocial gatherings
Informed on current affairs
Skills to get a new job
Informed on local affairs Overall happiness
Connection to family andfriends who aren’t local
Confidence expressing viewsto key decision-makers
Confidence talking to differentpeople on different subjects
3.003.203.403.603.804.004.204.40
10
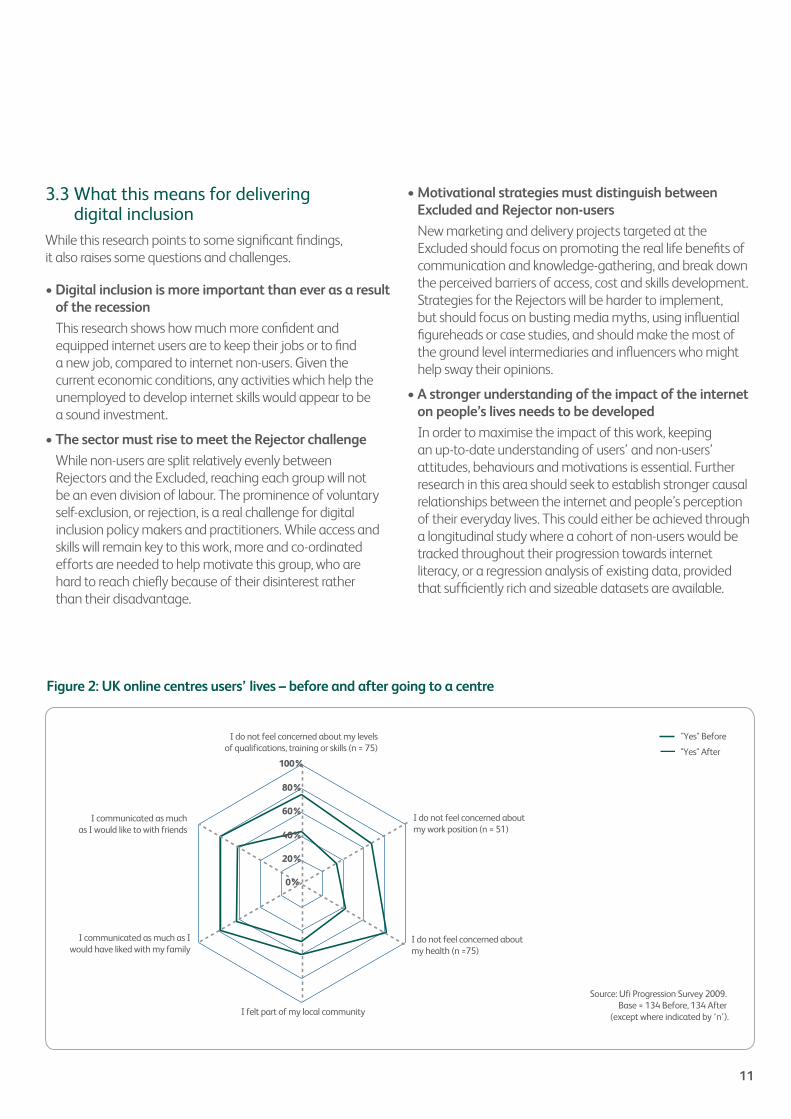
Figure 2: UK online centres users’ lives – before and after going to a centre
I do not feel concerned about my levelsof qualifications, training or skills (n = 75)
I do not feel concerned aboutmy work position (n = 51)
I do not feel concerned aboutmy health (n =75)
I felt part of my local community
I communicated as much as Iwould have liked with my family
I communicated as muchas I would like to with friends
Figure 2: UK online centres users’ lives – before and after.
"Yes" Before
"Yes" After
Source: Ufi Progression Survey 2009. Base = 134 Before, 134 After
(except where indicated by ‘n’).
0%
20%
40%
60%
80%
100%
3.3 What this means for delivering digital inclusion
While this research points to some significant findings, it also raises some questions and challenges.
• Digital inclusion is more important than ever as a result of the recession
This research shows how much more confident and equipped internet users are to keep their jobs or to find a new job, compared to internet non-users. Given the current economic conditions, any activities which help the unemployed to develop internet skills would appear to be a sound investment.
• The sector must rise to meet the Rejector challenge
While non-users are split relatively evenly between Rejectors and the Excluded, reaching each group will not be an even division of labour. The prominence of voluntary self-exclusion, or rejection, is a real challenge for digital inclusion policy makers and practitioners. While access and skills will remain key to this work, more and co-ordinated efforts are needed to help motivate this group, who are hard to reach chiefly because of their disinterest rather than their disadvantage.
• Motivational strategies must distinguish between Excluded and Rejector non-users
New marketing and delivery projects targeted at the Excluded should focus on promoting the real life benefits of communication and knowledge-gathering, and break down the perceived barriers of access, cost and skills development. Strategies for the Rejectors will be harder to implement, but should focus on busting media myths, using influential figureheads or case studies, and should make the most of the ground level intermediaries and influencers who might help sway their opinions.
• A stronger understanding of the impact of the internet on people’s lives needs to be developed
In order to maximise the impact of this work, keeping an up-to-date understanding of users’ and non-users’ attitudes, behaviours and motivations is essential. Further research in this area should seek to establish stronger causal relationships between the internet and people’s perception of their everyday lives. This could either be achieved through a longitudinal study where a cohort of non-users would be tracked throughout their progression towards internet literacy, or a regression analysis of existing data, provided that sufficiently rich and sizeable datasets are available.
11
4. Introducing the characters
This research focused on two main respondent groups:
• Internet users – a randomly selected sample of members of the C2DE English population who use the internet.
• Internet non-users – a randomly selected sample of members of the C2DE English population who do not use the internet at all.
Our analysis of the non-user group revealed trends consistent with previous research; internet non-users tend to be older, of lower social grade, with low educational attainment.
This section contains a short profile of both groups. They were compiled from a mixture of survey and focus group evidence. The demographic variables featured here were derived as ‘typical’ of each respondent group by using median responses.
12
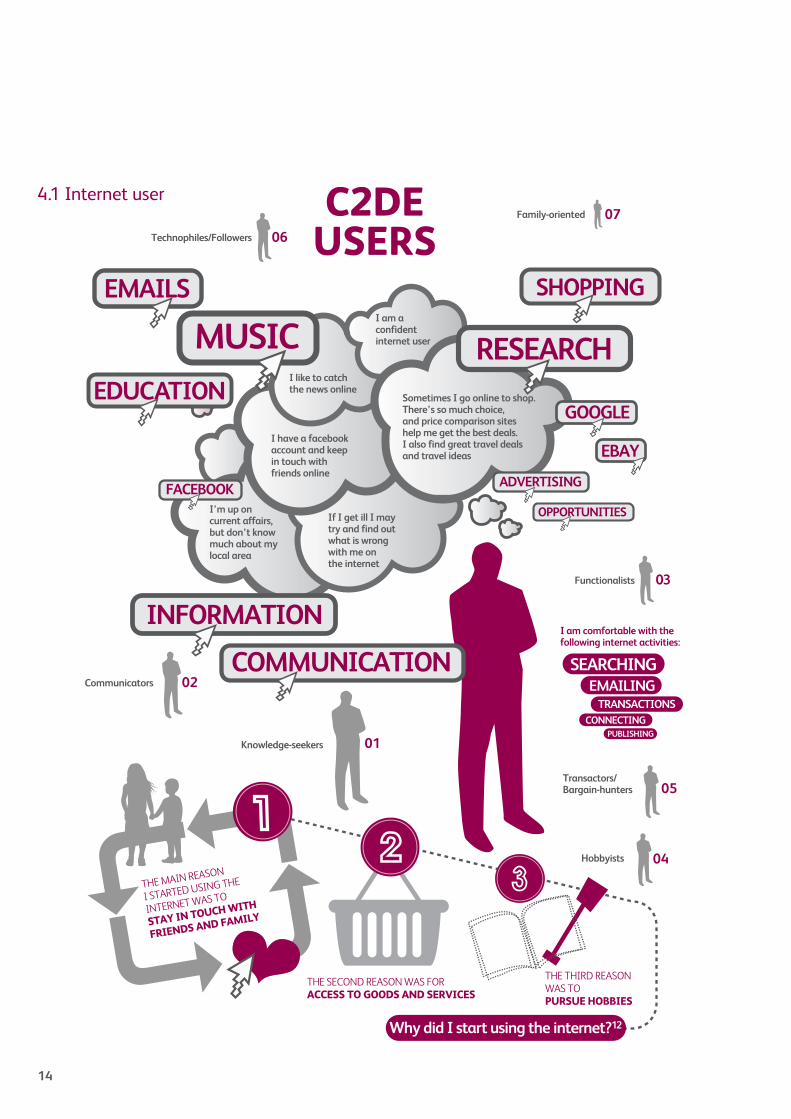
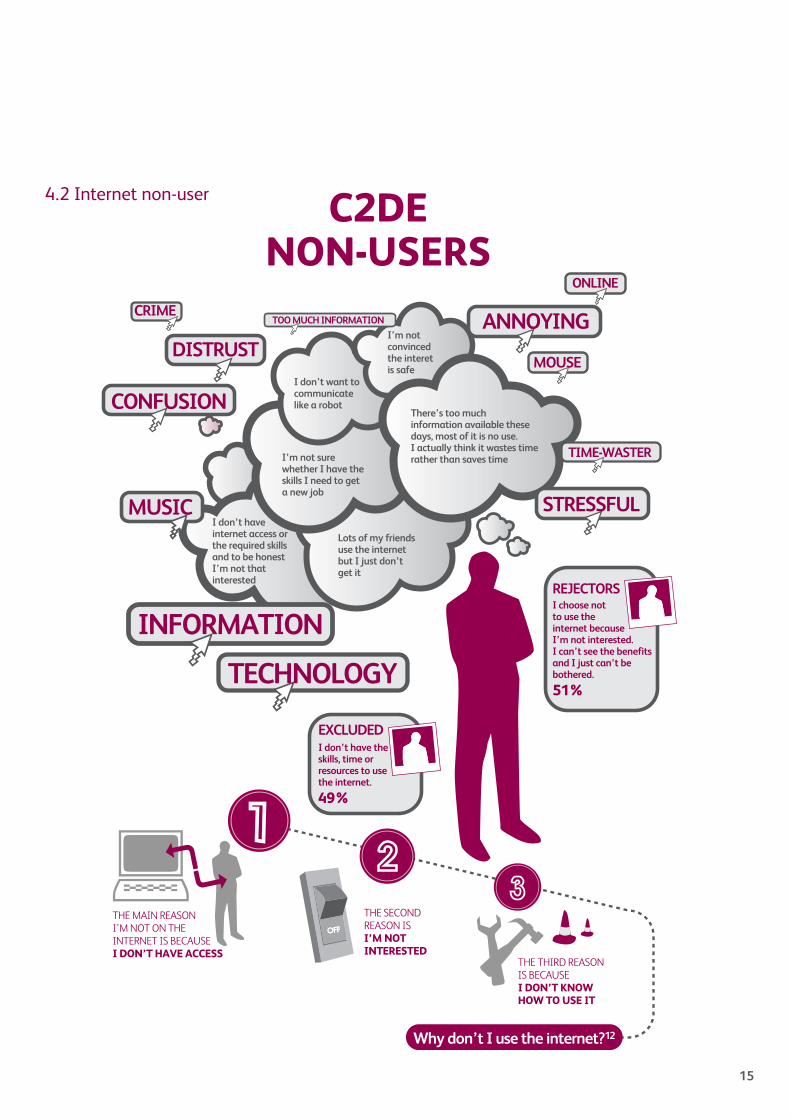
The graphics overleaf represent typical characteristics of users and non-users of the internet. They feature key spontaneous associations that each group has with the internet, present characteristic attitudinal statements in relation to it, highlight the reasons for use and non-use of the internet and briefly introduce the user and non-user behavioural categories that are discussed later in the report.
They feature: • Key spontaneous associations that each group has
with the internet• Characteristic attitudinal statements in relation to it• Reasons for use and non-use of the internet• An introduction of user and non-user behavioural categories
that are discussed later in this report.
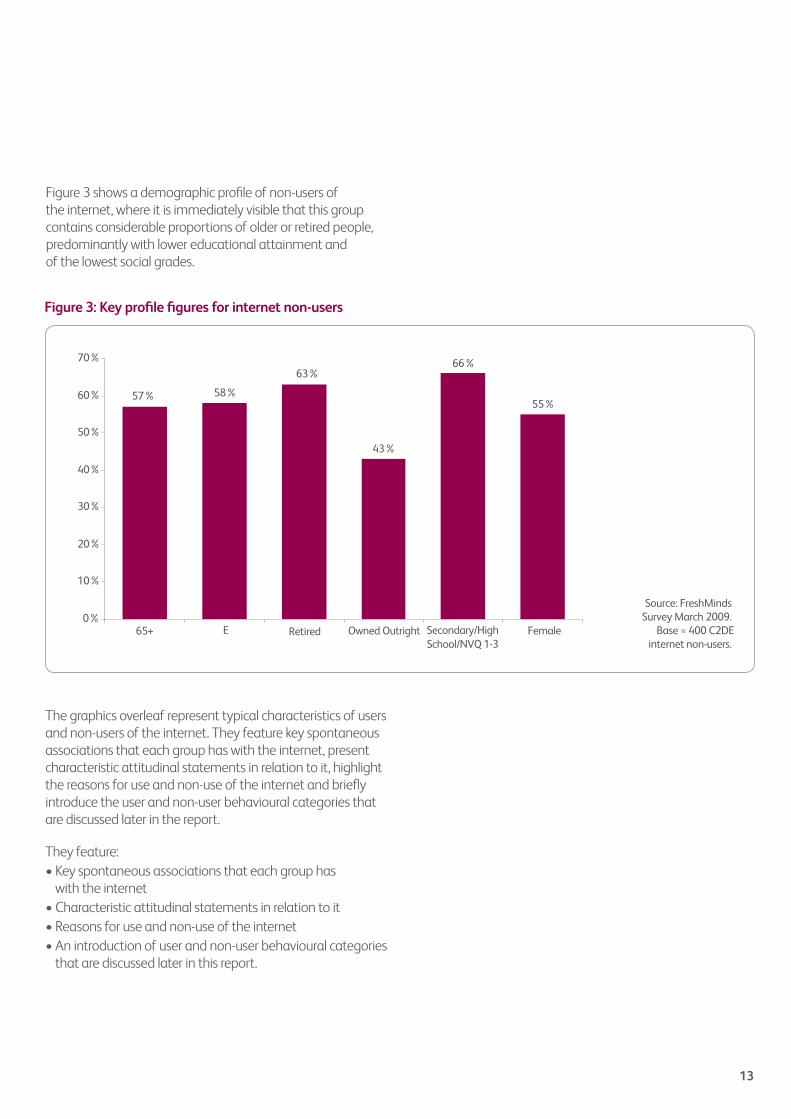
Figure 3: Key profile figures for internet non-usersFigure 3: Key profile figures for internet non-users.
Source: FreshMinds Survey March 2009.
Base = 400 C2DEinternet non-users.
57% 58%
63%
43%
66%
55%
0%
10%
20%
30%
40%
50%
60%
70%
65+ E Retired Owned Outright Secondary/HighSchool/NVQ 1-3
Female
13
Figure 3 shows a demographic profile of non-users of the internet, where it is immediately visible that this group contains considerable proportions of older or retired people, predominantly with lower educational attainment and of the lowest social grades.
SHOPPINGEMAILS
RESEARCH
EBAY
MUSIC
ADVERTISING
OPPORTUNITIES
COMMUNICATION
INFORMATION
EDUCATION
I am aconfidentinternet user
Sometimes I go online to shop.There’s so much choice,and price comparison siteshelp me get the best deals.I also find great travel dealsand travel ideas
If I get ill I maytry and find outwhat is wrongwith me onthe internet
I have a facebookaccount and keepin touch withfriends online
I like to catchthe news online
I’m up oncurrent affairs,but don’t knowmuch about mylocal area
C2DEUSERS
SEARCHINGEMAILING
TRANSACTIONSCONNECTING
PUBLISHING
I am comfortable with thefollowing internet activities:
Functionalists
Transactors/Bargain-hunters
Hobbyists
03
Family-oriented
05
04
THE MAIN REASON
I STARTED USING THE
INTERNET WAS TO
STAY IN TOUCH WITH
FRIENDS AND FAMILY
THE SECOND REASON WAS FORACCESS TO GOODS AND SERVICES
THE THIRD REASONWAS TOPURSUE HOBBIES
Why did I start using the internet?12
07
Technophiles/Followers 06
Communicators 02
Knowledge-seekers 01
4.1 Internet user
14
ANNOYING
MOUSE
ONLINE
TIME-WASTER
STRESSFUL
TOO MUCH INFORMATION CRIME
CONFUSION
DISTRUST
MUSIC
INFORMATION
TECHNOLOGY
I’m notconvincedthe interetis safe
There’s too muchinformation available thesedays, most of it is no use.I actually think it wastes timerather than saves time
Lots of my friendsuse the internetbut I just don’tget it
I’m not surewhether I have theskills I need to geta new job
I don’t want tocommunicatelike a robot
I don’t haveinternet access orthe required skillsand to be honestI’m not thatinterested
REJECTORS I choose notto use theinternet becauseI’m not interested.I can’t see the benefits and I just can’t bebothered.
51%
EXCLUDED I don’t have theskills, time orresources to usethe internet.
49%
Why don’t I use the internet?12
THE MAIN REASONI’M NOT ON THEINTERNET IS BECAUSE I DON’T HAVE ACCESS
THE SECONDREASON IS I’M NOTINTERESTED
THE THIRD REASONIS BECAUSEI DON’T KNOWHOW TO USE IT
C2DENON-USERS
4.2 Internet non-user
15
5. How do different groups view the internet?
In this section we look at how our two key groups view the internet. This is done through examining their spontaneous associations with the concept of the internet, coupled with their reasons for use and non-use. From here we explore a potential way of further categorising internet users and non-users on the basis of their attitudes and behaviour.
16
5.1 Perceptions and motivations – users
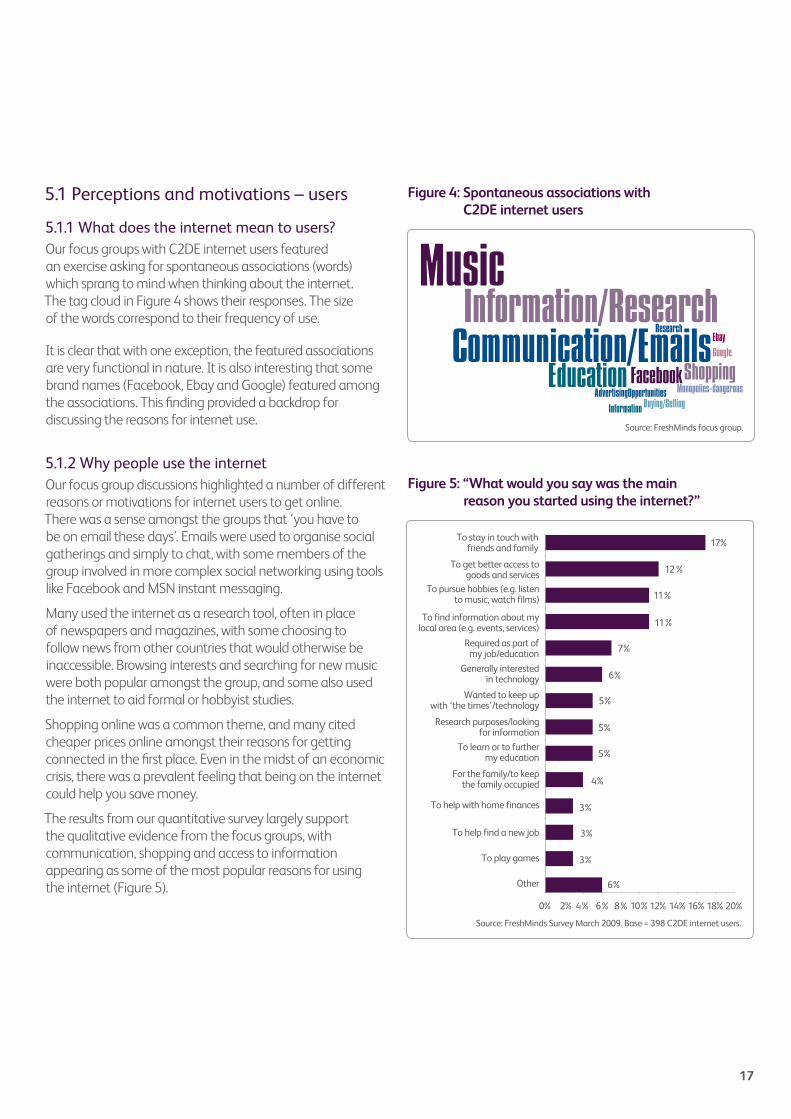
5.1.1 What does the internet mean to users?Our focus groups with C2DE internet users featured an exercise asking for spontaneous associations (words) which sprang to mind when thinking about the internet. The tag cloud in Figure 4 shows their responses. The size of the words correspond to their frequency of use.
It is clear that with one exception, the featured associations are very functional in nature. It is also interesting that some brand names (Facebook, Ebay and Google) featured among the associations. This finding provided a backdrop for discussing the reasons for internet use.
5.1.2 Why people use the internetOur focus group discussions highlighted a number of different reasons or motivations for internet users to get online. There was a sense amongst the groups that ‘you have to be on email these days’. Emails were used to organise social gatherings and simply to chat, with some members of the group involved in more complex social networking using tools like Facebook and MSN instant messaging.
Many used the internet as a research tool, often in place of newspapers and magazines, with some choosing to follow news from other countries that would otherwise be inaccessible. Browsing interests and searching for new music were both popular amongst the group, and some also used the internet to aid formal or hobbyist studies.
Shopping online was a common theme, and many cited cheaper prices online amongst their reasons for getting connected in the first place. Even in the midst of an economic crisis, there was a prevalent feeling that being on the internet could help you save money.
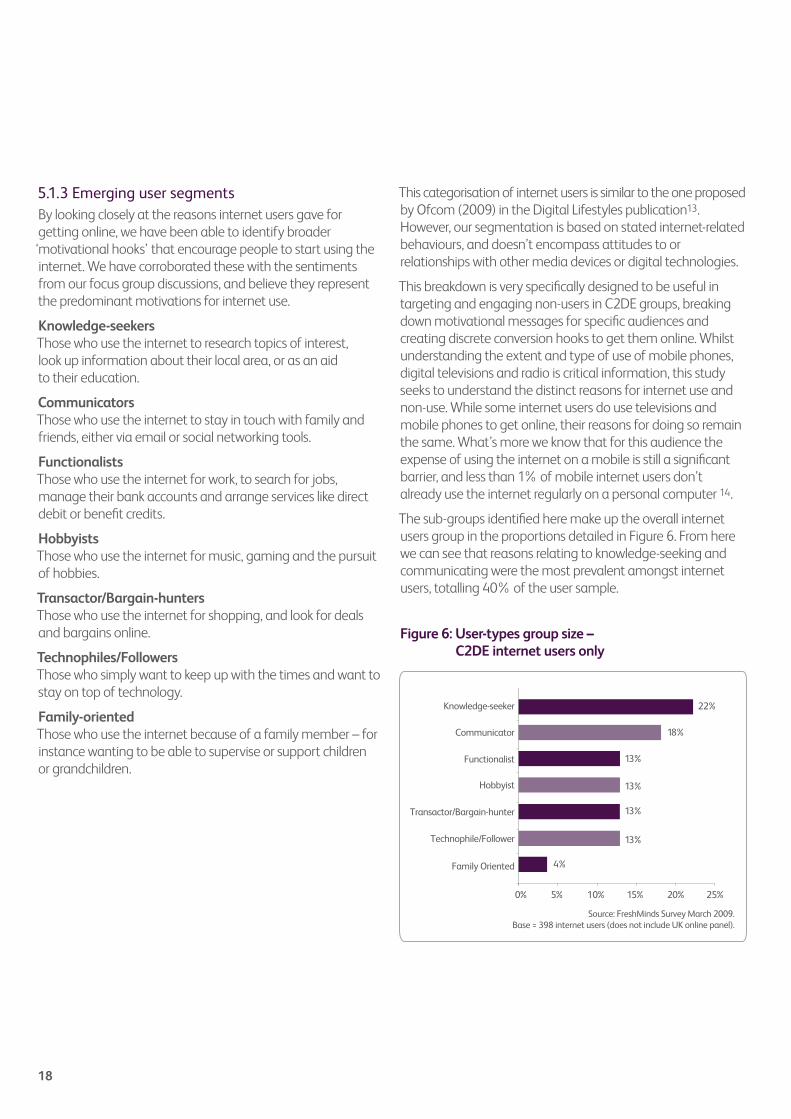
The results from our quantitative survey largely support the qualitative evidence from the focus groups, with communication, shopping and access to information appearing as some of the most popular reasons for using the internet (Figure 5).
Figure 5: “What would you say was the main reason you started using the internet?”Figure 5: “What would you say was the main reason you started using the internet?”
Source: FreshMinds Survey March 2009. Base = 398 C2DE internet users.
Other
To play games
To help find a new job
To help with home finances
For the family/to keepthe family occupied
To learn or to furthermy education
Research purposes/lookingfor information
Wanted to keep upwith ‘the times’/technology
Generally interestedin technology
Required as part ofmy job/education
To find information about mylocal area (e.g. events, services)
To pursue hobbies (e.g. listento music, watch films)
To get better access togoods and services
To stay in touch withfriends and family
0% 2% 4% 6% 8% 10%12% 14%16%18%20%
6%
3%
3%
3%
4%
5%
5%
5%
6%
7%
11%
11%
12%
17%
Figure 4: Spontaneous associations with C2DE internet users
MusicResearch
Ebay
ShoppingMonopolies-dangerous
Information Buying/SellingAdvertisingOpportunities
Information/ResearchCommunication/Emails
FacebookEducationSource: FreshMinds focus group.
17
This categorisation of internet users is similar to the one proposed by Ofcom (2009) in the Digital Lifestyles publication13. However, our segmentation is based on stated internet-related behaviours, and doesn’t encompass attitudes to or relationships with other media devices or digital technologies.
This breakdown is very specifically designed to be useful in targeting and engaging non-users in C2DE groups, breaking down motivational messages for specific audiences and creating discrete conversion hooks to get them online. Whilst understanding the extent and type of use of mobile phones, digital televisions and radio is critical information, this study seeks to understand the distinct reasons for internet use and non-use. While some internet users do use televisions and mobile phones to get online, their reasons for doing so remain the same. What’s more we know that for this audience the expense of using the internet on a mobile is still a significant barrier, and less than 1% of mobile internet users don’t already use the internet regularly on a personal computer 14.
The sub-groups identified here make up the overall internet users group in the proportions detailed in Figure 6. From here we can see that reasons relating to knowledge-seeking and communicating were the most prevalent amongst internet users, totalling 40% of the user sample.
5.1.3 Emerging user segmentsBy looking closely at the reasons internet users gave for getting online, we have been able to identify broader ‘motivational hooks’ that encourage people to start using the internet. We have corroborated these with the sentiments from our focus group discussions, and believe they represent the predominant motivations for internet use.
Knowledge-seekersThose who use the internet to research topics of interest, look up information about their local area, or as an aid to their education.
CommunicatorsThose who use the internet to stay in touch with family and friends, either via email or social networking tools.
FunctionalistsThose who use the internet for work, to search for jobs, manage their bank accounts and arrange services like direct debit or benefit credits.
HobbyistsThose who use the internet for music, gaming and the pursuit of hobbies.
Transactor/Bargain-huntersThose who use the internet for shopping, and look for deals and bargains online.
Technophiles/FollowersThose who simply want to keep up with the times and want to stay on top of technology.
Family-orientedThose who use the internet because of a family member – for instance wanting to be able to supervise or support children or grandchildren.
18
Figure 6: User-types group size – C2DE Internet users only (percentages).
4%
13%
13%
13%
13%
18%
22%
0% 5% 10% 15% 20% 25%
Family Oriented
Technophile/Follower
Transactor/Bargain-hunter
Hobbyist
Functionalist
Communicator
Knowledge-seeker
Source: FreshMinds Survey March 2009.Base = 398 internet users (does not include UK online panel).
Figure 6: User-types group size – C2DE internet users only
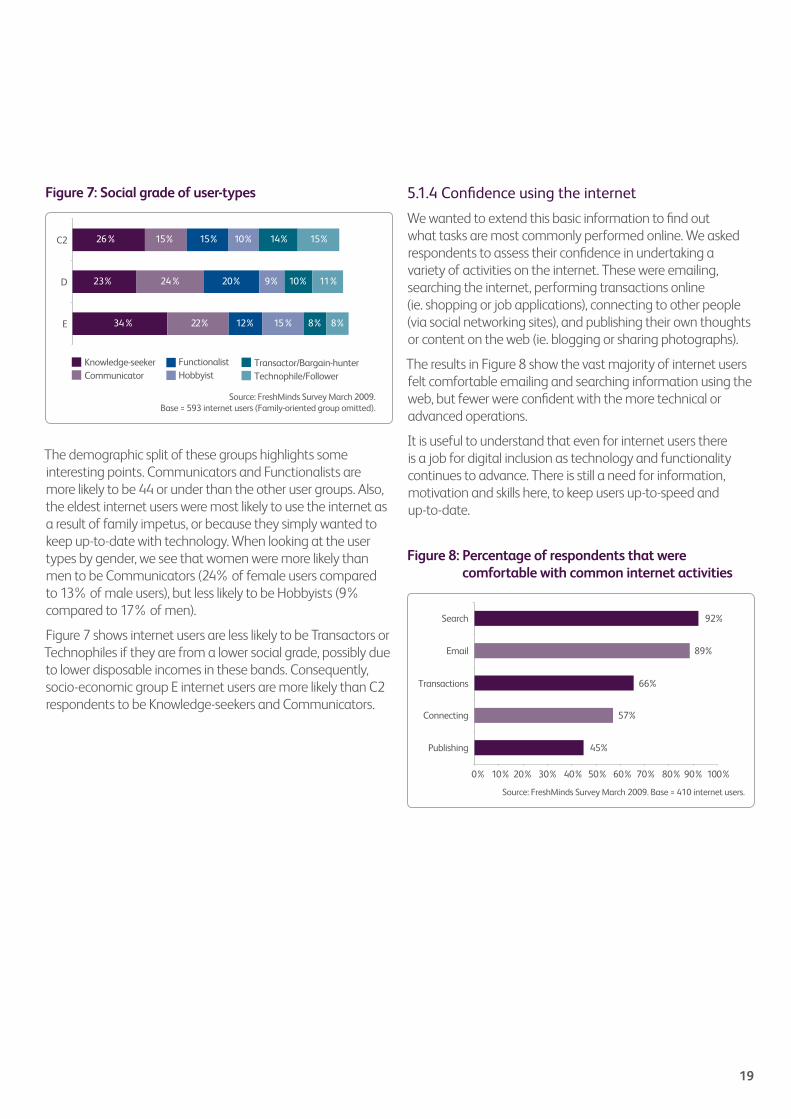
The demographic split of these groups highlights some interesting points. Communicators and Functionalists are more likely to be 44 or under than the other user groups. Also, the eldest internet users were most likely to use the internet as a result of family impetus, or because they simply wanted to keep up-to-date with technology. When looking at the user types by gender, we see that women were more likely than men to be Communicators (24% of female users compared to 13% of male users), but less likely to be Hobbyists (9% compared to 17% of men).
Figure 7 shows internet users are less likely to be Transactors or Technophiles if they are from a lower social grade, possibly due to lower disposable incomes in these bands. Consequently, socio-economic group E internet users are more likely than C2 respondents to be Knowledge-seekers and Communicators.
Figure 7: Social grade of user-types
Figure 8: Percentage of respondents that were comfortable with common internet activities.
0% 10% 20% 30% 40% 50% 60% 70% 80% 90% 100%
45%Publishing
57%Connecting
66%Transactions
89%Email
92%Search
Source: FreshMinds Survey March 2009. Base = 410 internet users.
Figure 8: Percentage of respondents that were comfortable with common internet activities
19
Figure 7: Social grade of user-types.
34%
23%
26%
22%
24%
15%
12%
20%
15%
15%
9%
10%
8%
10%
14%
8%
11%
15%
E
D
C2
Knowledge-seekerCommunicator
FunctionalistHobbyist
Transactor/Bargain-hunterTechnophile/Follower
Source: FreshMinds Survey March 2009.Base = 593 internet users (Family-oriented group omitted).
5.1.4 Confidence using the internet
We wanted to extend this basic information to find out what tasks are most commonly performed online. We asked respondents to assess their confidence in undertaking a variety of activities on the internet. These were emailing, searching the internet, performing transactions online (ie. shopping or job applications), connecting to other people (via social networking sites), and publishing their own thoughts or content on the web (ie. blogging or sharing photographs).
The results in Figure 8 show the vast majority of internet users felt comfortable emailing and searching information using the web, but fewer were confident with the more technical or advanced operations.
It is useful to understand that even for internet users there is a job for digital inclusion as technology and functionality continues to advance. There is still a need for information, motivation and skills here, to keep users up-to-speed and up-to-date.
5.2 Perceptions and motivations – non-users
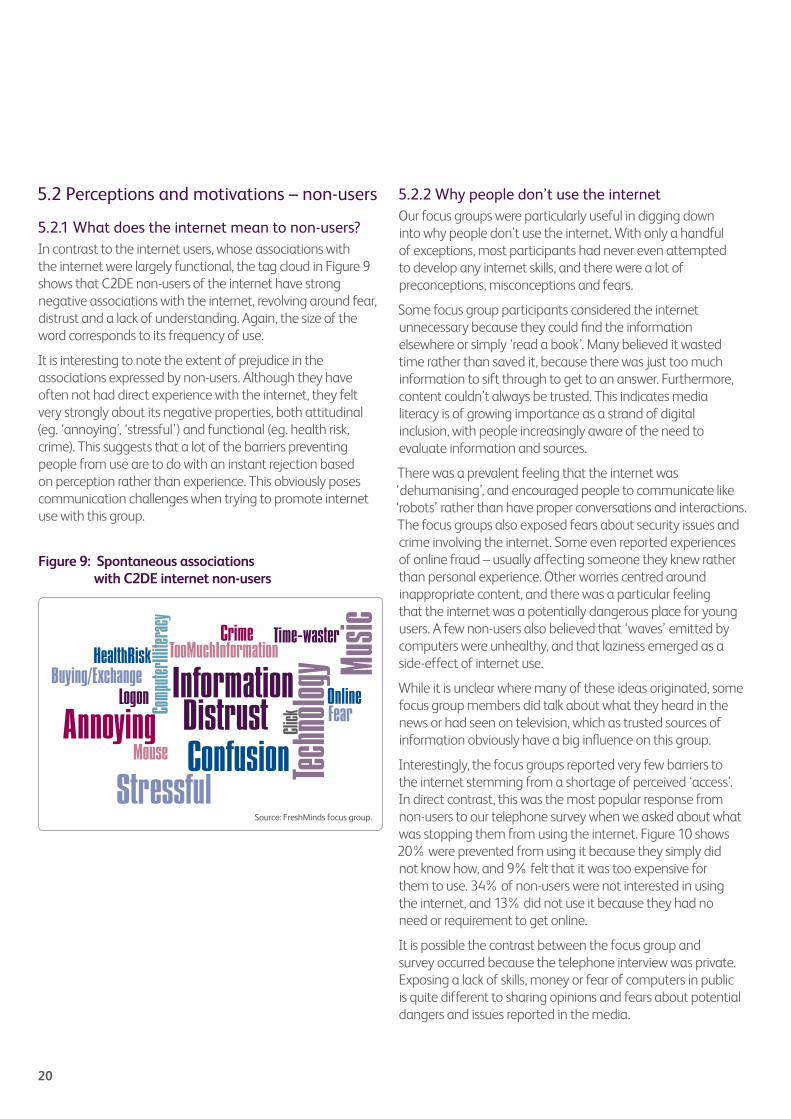
5.2.1 What does the internet mean to non-users?In contrast to the internet users, whose associations with the internet were largely functional, the tag cloud in Figure 9 shows that C2DE non-users of the internet have strong negative associations with the internet, revolving around fear, distrust and a lack of understanding. Again, the size of the word corresponds to its frequency of use.
It is interesting to note the extent of prejudice in the associations expressed by non-users. Although they have often not had direct experience with the internet, they felt very strongly about its negative properties, both attitudinal (eg. ‘annoying’, ‘stressful’) and functional (eg. health risk, crime). This suggests that a lot of the barriers preventing people from use are to do with an instant rejection based on perception rather than experience. This obviously poses communication challenges when trying to promote internet use with this group.
Source: FreshMinds focus group.
Music
Techn
ology
ClickCo
mpute
rIllite
racy
FearOnline
Crime Time-wasterTooMuchInformationHealthRisk
Buying/ExchangeLogon
Mouse
Stressful
AnnoyingInformationDistrustConfusion
5.2.2 Why people don’t use the internetOur focus groups were particularly useful in digging down into why people don’t use the internet. With only a handful of exceptions, most participants had never even attempted to develop any internet skills, and there were a lot of preconceptions, misconceptions and fears.
Some focus group participants considered the internet unnecessary because they could find the information elsewhere or simply ‘read a book’. Many believed it wasted time rather than saved it, because there was just too much information to sift through to get to an answer. Furthermore, content couldn’t always be trusted. This indicates media literacy is of growing importance as a strand of digital inclusion, with people increasingly aware of the need to evaluate information and sources.
There was a prevalent feeling that the internet was ‘dehumanising’, and encouraged people to communicate like ‘robots’ rather than have proper conversations and interactions. The focus groups also exposed fears about security issues and crime involving the internet. Some even reported experiences of online fraud – usually affecting someone they knew rather than personal experience. Other worries centred around inappropriate content, and there was a particular feeling that the internet was a potentially dangerous place for young users. A few non-users also believed that ‘waves’ emitted by computers were unhealthy, and that laziness emerged as a side-effect of internet use.
While it is unclear where many of these ideas originated, some focus group members did talk about what they heard in the news or had seen on television, which as trusted sources of information obviously have a big influence on this group.
Interestingly, the focus groups reported very few barriers to the internet stemming from a shortage of perceived ‘access’. In direct contrast, this was the most popular response from non-users to our telephone survey when we asked about what was stopping them from using the internet. Figure 10 shows 20% were prevented from using it because they simply did not know how, and 9% felt that it was too expensive for them to use. 34% of non-users were not interested in using the internet, and 13% did not use it because they had no need or requirement to get online.
It is possible the contrast between the focus group and survey occurred because the telephone interview was private. Exposing a lack of skills, money or fear of computers in public is quite different to sharing opinions and fears about potential dangers and issues reported in the media.
Figure 9: Spontaneous associations with C2DE internet non-users
20
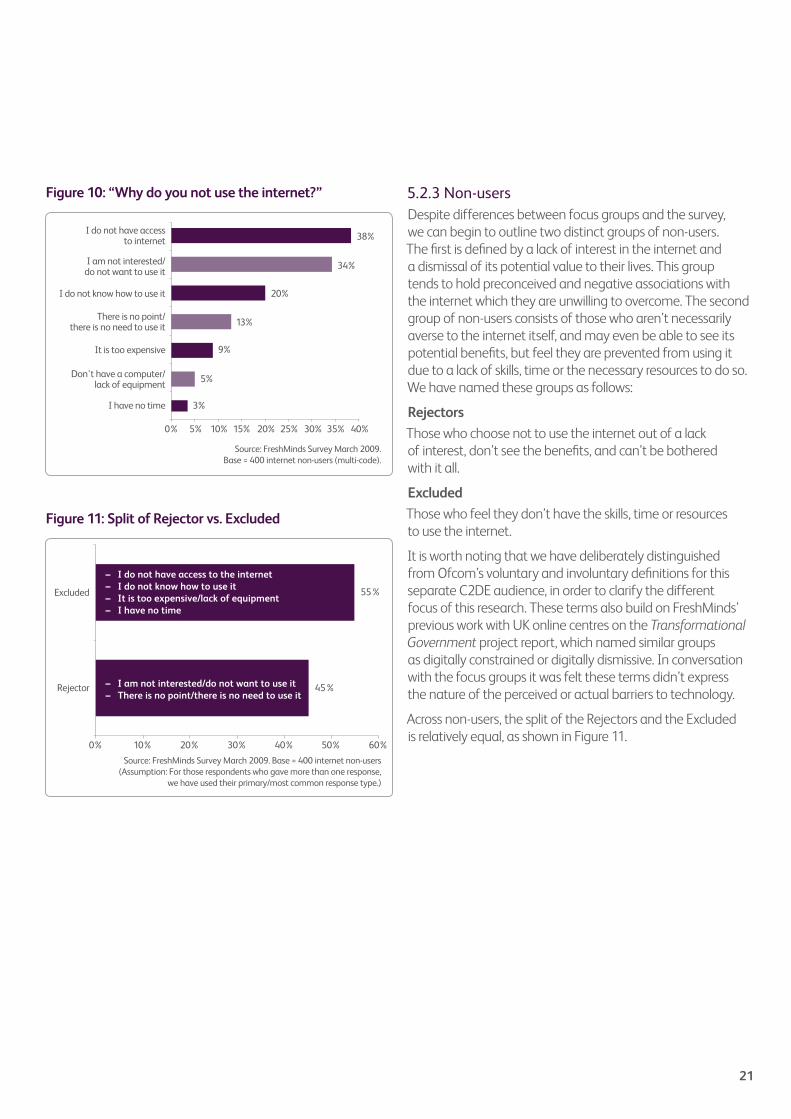
Figure 10: “Why do you not use the internet?”Figure 10: “Why do you not use the internet?”
0% 5% 10% 15% 20% 25% 30% 35% 40%
5%
13%
34%
3%I have no time
Don't have a computer/lack of equipment
9%It is too expensive
There is no point/there is no need to use it
20%I do not know how to use it
I am not interested/do not want to use it
38%I do not have access
to internet
Source: FreshMinds Survey March 2009. Base = 400 internet non-users (multi-code).
5.2.3 Non-usersDespite differences between focus groups and the survey, we can begin to outline two distinct groups of non-users. The first is defined by a lack of interest in the internet and a dismissal of its potential value to their lives. This group tends to hold preconceived and negative associations with the internet which they are unwilling to overcome. The second group of non-users consists of those who aren’t necessarily averse to the internet itself, and may even be able to see its potential benefits, but feel they are prevented from using it due to a lack of skills, time or the necessary resources to do so. We have named these groups as follows:
Rejectors
Those who choose not to use the internet out of a lack of interest, don’t see the benefits, and can’t be bothered with it all.
Excluded
Those who feel they don’t have the skills, time or resources to use the internet.
It is worth noting that we have deliberately distinguished from Ofcom’s voluntary and involuntary definitions for this separate C2DE audience, in order to clarify the different focus of this research. These terms also build on FreshMinds’ previous work with UK online centres on the Transformational Government project report, which named similar groups as digitally constrained or digitally dismissive. In conversation with the focus groups it was felt these terms didn’t express the nature of the perceived or actual barriers to technology.
Across non-users, the split of the Rejectors and the Excluded is relatively equal, as shown in Figure 11.
Figure 11: Split of Rejectors vs. Excluded.
45%
55%
0% 10% 20% 30% 40% 50% 60%
Rejector
Excluded
– I am not interested/do not want to use it– There is no point/there is no need to use it
– I do not have access to the internet– I do not know how to use it – It is too expensive/lack of equipment– I have no time
Source: FreshMinds Survey March 2009. Base = 400 internet non-users (Assumption: For those respondents who gave more than one response,
we have used their primary/most common response type.)
Figure 11: Split of Rejector vs. Excluded
21
22
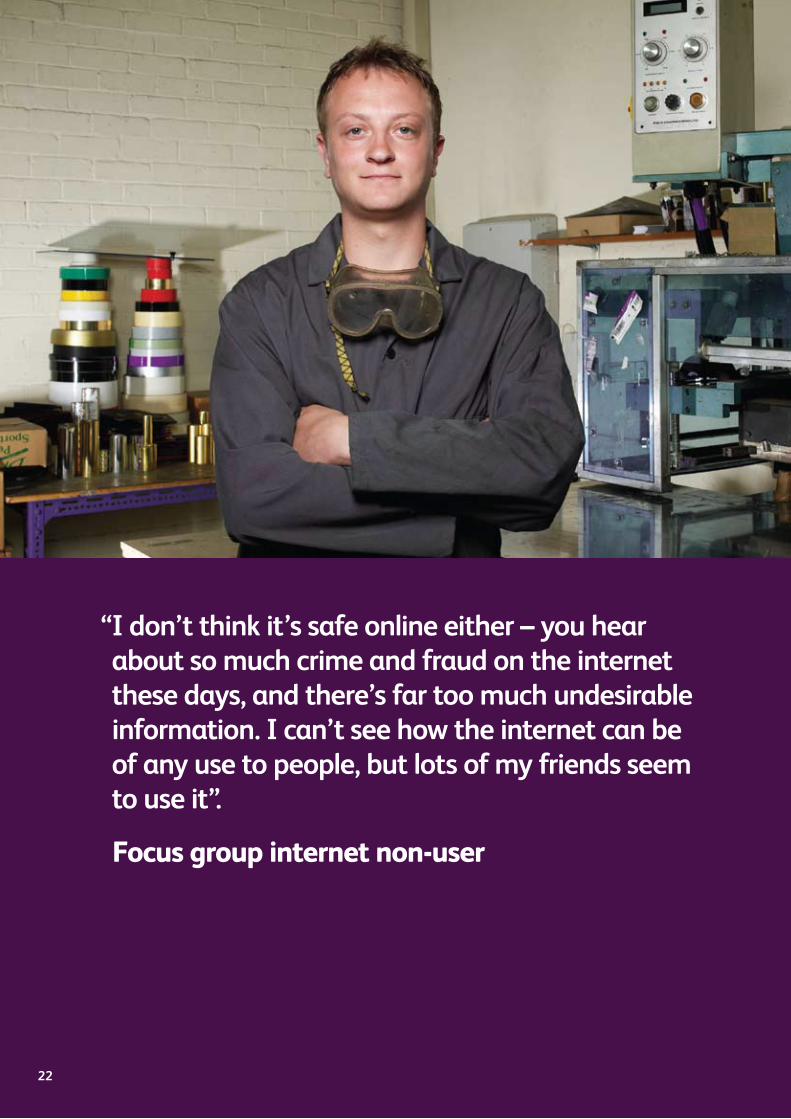
“ I don’t think it’s safe online either – you hear about so much crime and fraud on the internet these days, and there’s far too much undesirable information. I can’t see how the internet can be of any use to people, but lots of my friends seem to use it”.
Focus group internet non-user
We can surmise from this information that the Excluded group can quite easily be provided with the necessary facilities and training to become ‘digitally included’. In removing those barriers of access and cost, and by focussing communications on local support, free or low cost access, this group can potentially be quite simply motivated to give getting online a go.
The Rejectors, however, present an entirely different challenge for digital inclusion. Closed to the idea of the internet, this group first need to be convinced being online could be of some value to their everyday lives, and dissuaded of the deep-held, negative associations they currently hold. Addressing those myriad issues and reassuring this audience is a far more complex communications task.
Recognition of these differences will help UK online centres and other organisations focus and address their messages, maximising their impact amongst internet non-users.
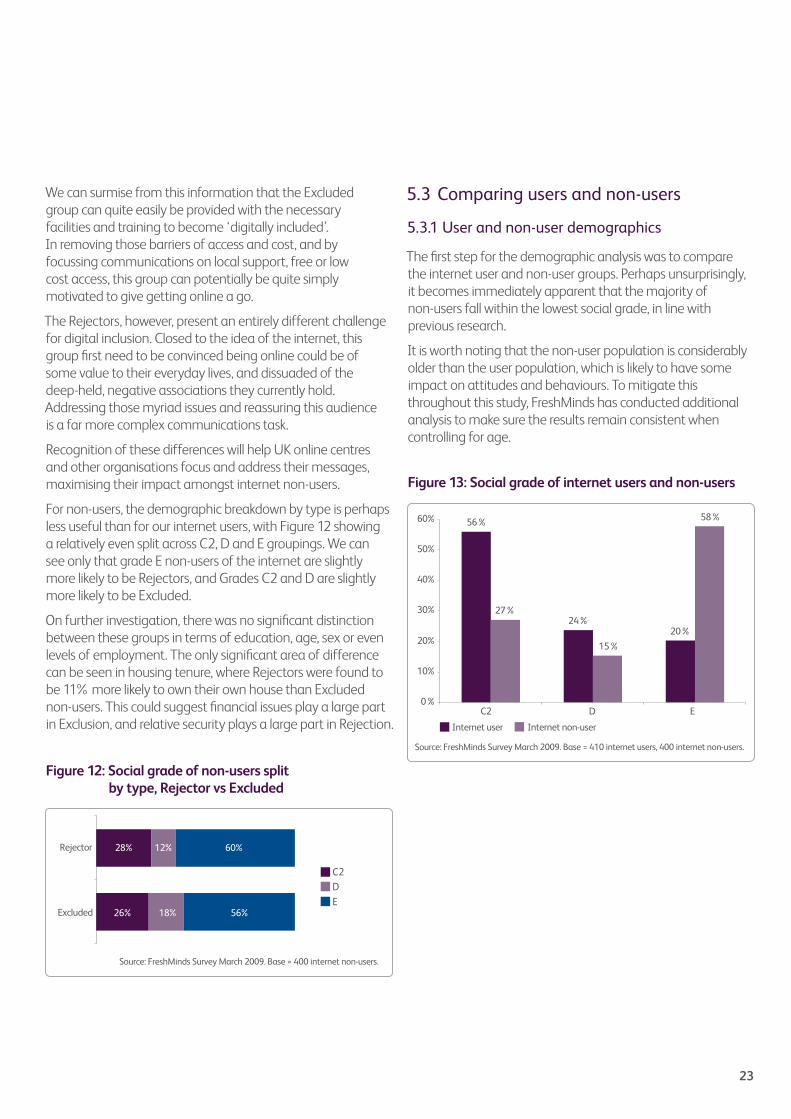
For non-users, the demographic breakdown by type is perhaps less useful than for our internet users, with Figure 12 showing a relatively even split across C2, D and E groupings. We can see only that grade E non-users of the internet are slightly more likely to be Rejectors, and Grades C2 and D are slightly more likely to be Excluded.
On further investigation, there was no significant distinction between these groups in terms of education, age, sex or even levels of employment. The only significant area of difference can be seen in housing tenure, where Rejectors were found to be 11% more likely to own their own house than Excluded non-users. This could suggest financial issues play a large part in Exclusion, and relative security plays a large part in Rejection.
Figure 12: Social grade of non users split by type, Rejector vs Excluded.
26%
28%
18%
12%
56%
60%
Excluded
Rejector
C2DE
Source: FreshMinds Survey March 2009. Base = 400 internet non-users.
Figure 13: Social grade of internet users and non-users.
Source: FreshMinds Survey March 2009. Base = 410 internet users, 400 internet non-users.
56%
24%20%
27%
15%
58%
0%
10%
20%
30%
40%
50%
60%
C2 D E
Internet user Internet non-user
Figure 12: Social grade of non-users split by type, Rejector vs Excluded
Figure 13: Social grade of internet users and non-users
5.3 Comparing users and non-users
5.3.1 User and non-user demographics
The first step for the demographic analysis was to compare the internet user and non-user groups. Perhaps unsurprisingly, it becomes immediately apparent that the majority of non-users fall within the lowest social grade, in line with previous research.
It is worth noting that the non-user population is considerably older than the user population, which is likely to have some impact on attitudes and behaviours. To mitigate this throughout this study, FreshMinds has conducted additional analysis to make sure the results remain consistent when controlling for age.
23
6. Impact on lives
The core aim of this report is to address the impact internet use can have on people’s everyday lives. To this end we will compare our survey responses from users and non-users across five core areas:
• Social capital• Self-confidence and quality of life• Employment• Health• Savings
These areas draw significantly on the UK online centres and Ipsos MORI research report Digital inclusion, social impact16, which looked at user progression across similar areas. We will also refer to sentiments and experiences gathered at our focus group discussions to qualify our survey data.
Finally, where appropriate, we will bring in data from separate UK online centres research, tracking the progress and attitudes of UK online centre users before and after their time at a centre17.
24
6.1 Social capital
Our aim in this section is to assess the impact of the internet on users’ and non-users’ social capital – the extent of their social lives and their sense of connection, community and civic involvement.
To highlight this impact, we provided respondents with a series of statements that related to their knowledge of current affairs and local news, their social life and their communication skills. We then asked them to rate how strongly they agreed with each statement on a scale of 1 to 518.
Overall the results show respondents were positive about their social lives and their connection to both local and wider communities.
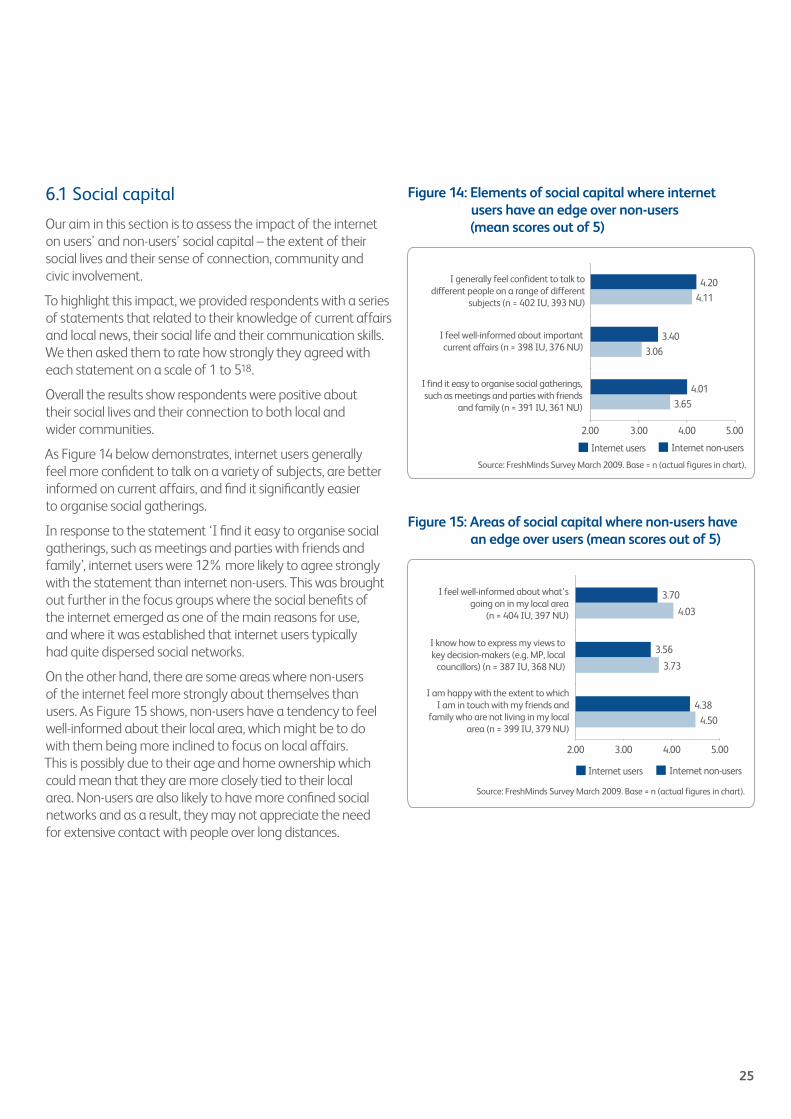
As Figure 14 below demonstrates, internet users generally feel more confident to talk on a variety of subjects, are better informed on current affairs, and find it significantly easier to organise social gatherings.
In response to the statement ‘I find it easy to organise social gatherings, such as meetings and parties with friends and family’, internet users were 12% more likely to agree strongly with the statement than internet non-users. This was brought out further in the focus groups where the social benefits of the internet emerged as one of the main reasons for use, and where it was established that internet users typically had quite dispersed social networks.
On the other hand, there are some areas where non-users of the internet feel more strongly about themselves than users. As Figure 15 shows, non-users have a tendency to feel well-informed about their local area, which might be to do with them being more inclined to focus on local affairs. This is possibly due to their age and home ownership which could mean that they are more closely tied to their local area. Non-users are also likely to have more confined social networks and as a result, they may not appreciate the need for extensive contact with people over long distances.
Figure 14: Elements of social capital where internet users have an edge over non-users (mean scores out of 5)Figure 14: Elements of social capital where internet users have an edge over non-users (mean scores out of 5).
3.65
3.06
4.11
4.01
3.40
4.20
2.00 3.00 4.00 5.00
Internet users Internet non-users
I generally feel confident to talk todifferent people on a range of different
subjects (n = 402 IU, 393 NU)
I feel well-informed about important current affairs (n = 398 IU, 376 NU)
I find it easy to organise social gatherings, such as meetings and parties with friends
and family (n = 391 IU, 361 NU)
Source: FreshMinds Survey March 2009. Base = n (actual figures in chart).
Figure 15: Areas of social capital where non-users have an edge over users (mean scores out of 5).
4.50
3.73
4.03
4.38
3.56
3.70
2.00 3.00 4.00 5.00
I know how to express my views tokey decision-makers (e.g. MP, local
councillors) (n = 387 IU, 368 NU)
I feel well-informed about what'sgoing on in my local area
(n = 404 IU, 397 NU)
I am happy with the extent to which I am in touch with my friends and
family who are not living in my local area (n = 399 IU, 379 NU)
Source: FreshMinds Survey March 2009. Base = n (actual figures in chart).
Internet users Internet non-users
Figure 15: Areas of social capital where non-users have an edge over users (mean scores out of 5)
25
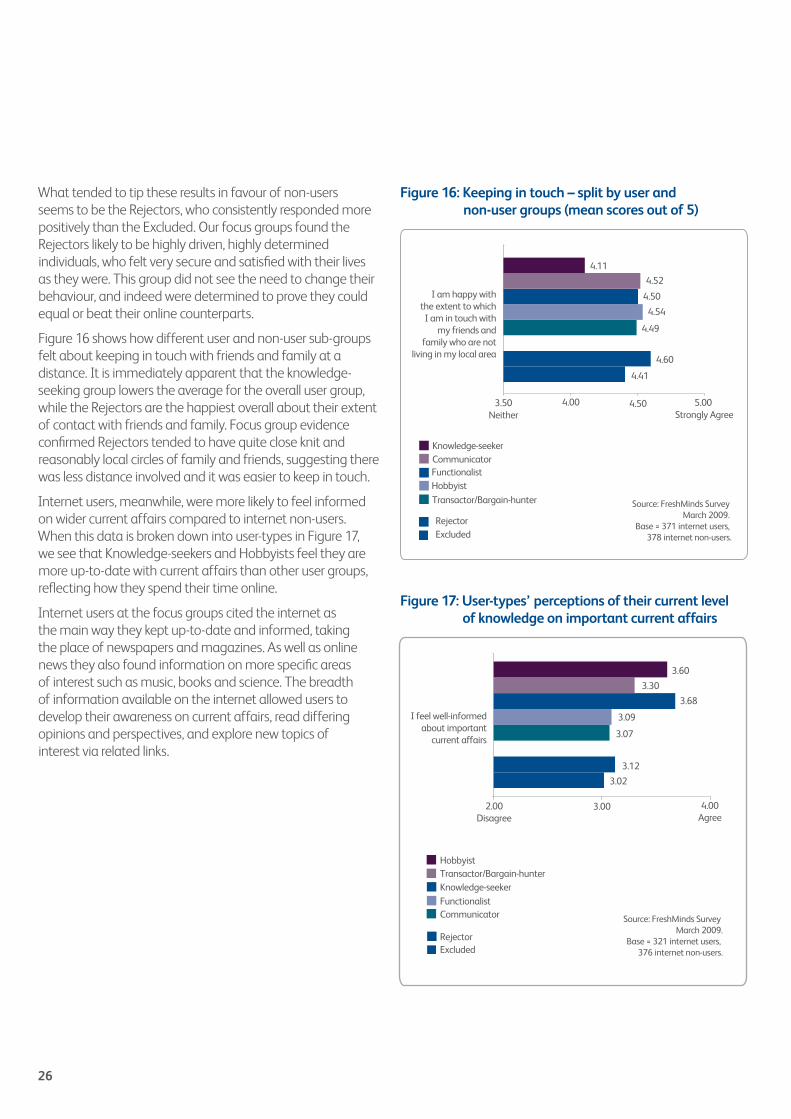
What tended to tip these results in favour of non-users seems to be the Rejectors, who consistently responded more positively than the Excluded. Our focus groups found the Rejectors likely to be highly driven, highly determined individuals, who felt very secure and satisfied with their lives as they were. This group did not see the need to change their behaviour, and indeed were determined to prove they could equal or beat their online counterparts.
Figure 16 shows how different user and non-user sub-groups felt about keeping in touch with friends and family at a distance. It is immediately apparent that the knowledge-seeking group lowers the average for the overall user group, while the Rejectors are the happiest overall about their extent of contact with friends and family. Focus group evidence confirmed Rejectors tended to have quite close knit and reasonably local circles of family and friends, suggesting there was less distance involved and it was easier to keep in touch.
Internet users, meanwhile, were more likely to feel informed on wider current affairs compared to internet non-users. When this data is broken down into user-types in Figure 17, we see that Knowledge-seekers and Hobbyists feel they are more up-to-date with current affairs than other user groups, reflecting how they spend their time online.
Internet users at the focus groups cited the internet as the main way they kept up-to-date and informed, taking the place of newspapers and magazines. As well as online news they also found information on more specific areas of interest such as music, books and science. The breadth of information available on the internet allowed users to develop their awareness on current affairs, read differing opinions and perspectives, and explore new topics of interest via related links.
Figure 16: Keeping in touch – split by user and non-user groups (mean scores out of 5)Figure 16: Keeping in touch - split by user and non-user groups (mean scores out of 5).
4.41
4.60
4.49
4.54
4.50
4.52
4.11
3.50Neither
4.00 4.50 5.00 Strongly Agree
I am happy withthe extent to whichI am in touch with
my friends andfamily who are not
living in my local area
Source: FreshMinds Survey March 2009.
Base = 371 internet users, 378 internet non-users.
Knowledge-seekerCommunicatorFunctionalistHobbyist
RejectorExcluded
Transactor/Bargain-hunter
Figure 17: User-types perceptions of their current level of knowledge on important current affairs.
I feel well-informedabout important
current affairs
3.02
3.12
3.07
3.09
3.68
3.30
3.60
HobbyistTransactor/Bargain-hunterKnowledge-seekerFunctionalistCommunicator
RejectorExcluded
Source: FreshMinds Survey March 2009.
Base = 321 internet users, 376 internet non-users.
2.00Disagree
3.00 4.00Agree
Figure 17: User-types’ perceptions of their current level of knowledge on important current affairs
26
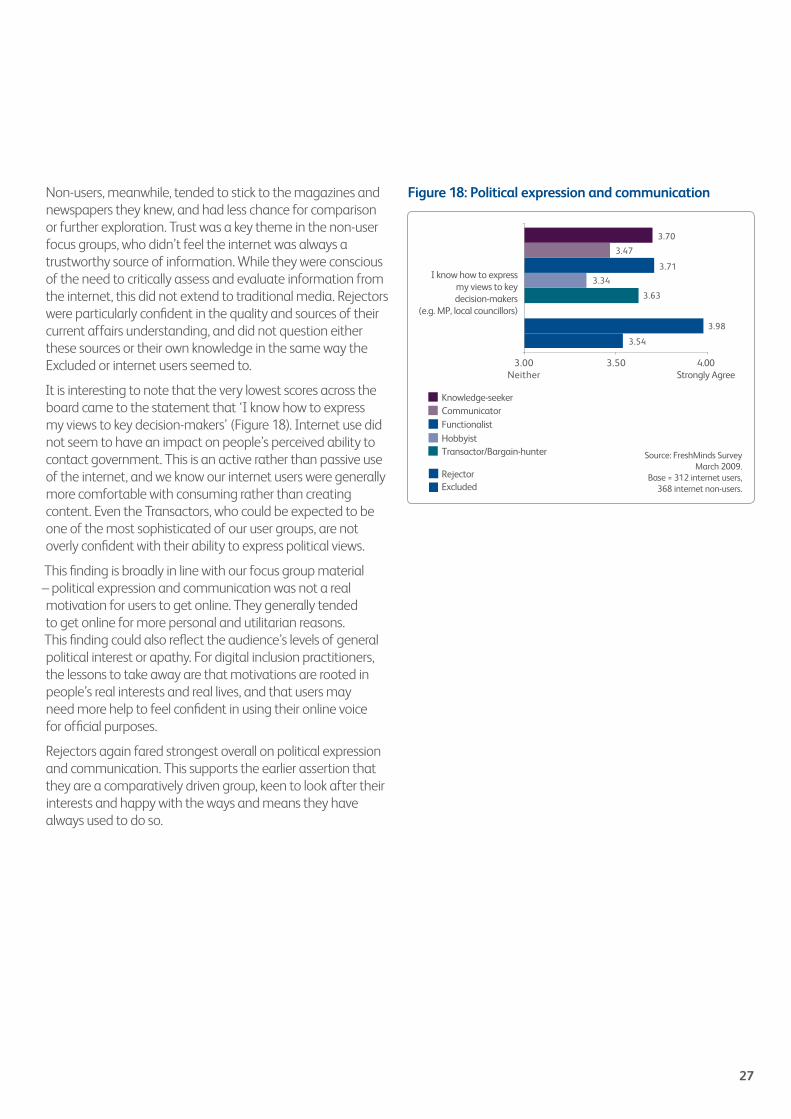
Figure 18: Political expression and communication Figure 18: Political expression and communication (mean scores out of 5).
Source: FreshMinds SurveyMarch 2009.
Base = 312 internet users,368 internet non-users.
3.54
3.98
3.63
3.34
3.71
3.47
3.70
3.00Neither
3.50 4.00Strongly Agree
I know how to expressmy views to keydecision-makers
(e.g. MP, local councillors)
Knowledge-seekerCommunicatorFunctionalistHobbyistTransactor/Bargain-hunter
RejectorExcluded
Non-users, meanwhile, tended to stick to the magazines and newspapers they knew, and had less chance for comparison or further exploration. Trust was a key theme in the non-user focus groups, who didn’t feel the internet was always a trustworthy source of information. While they were conscious of the need to critically assess and evaluate information from the internet, this did not extend to traditional media. Rejectors were particularly confident in the quality and sources of their current affairs understanding, and did not question either these sources or their own knowledge in the same way the Excluded or internet users seemed to.
It is interesting to note that the very lowest scores across the board came to the statement that ‘I know how to express my views to key decision-makers’ (Figure 18). Internet use did not seem to have an impact on people’s perceived ability to contact government. This is an active rather than passive use of the internet, and we know our internet users were generally more comfortable with consuming rather than creating content. Even the Transactors, who could be expected to be one of the most sophisticated of our user groups, are not overly confident with their ability to express political views.
This finding is broadly in line with our focus group material – political expression and communication was not a real motivation for users to get online. They generally tended to get online for more personal and utilitarian reasons. This finding could also reflect the audience’s levels of general political interest or apathy. For digital inclusion practitioners, the lessons to take away are that motivations are rooted in people’s real interests and real lives, and that users may need more help to feel confident in using their online voice for official purposes.
Rejectors again fared strongest overall on political expression and communication. This supports the earlier assertion that they are a comparatively driven group, keen to look after their interests and happy with the ways and means they have always used to do so.
27
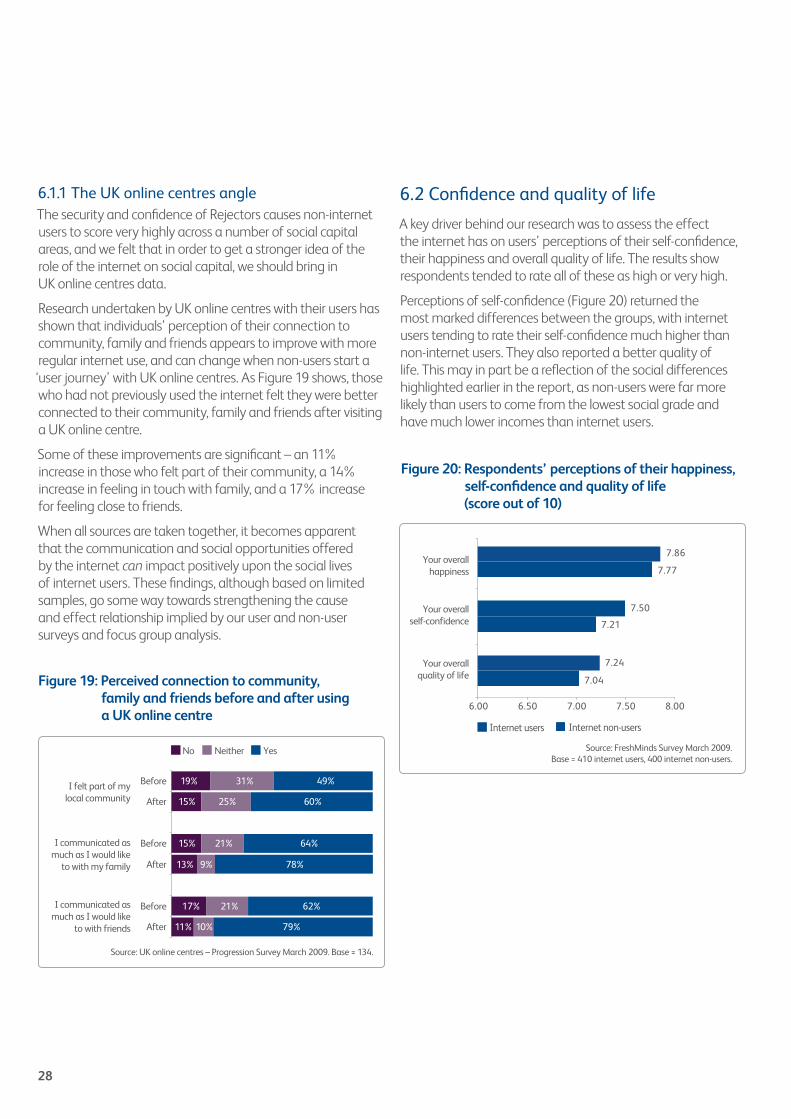
Figure 19: Perceived connection to community, family and friends before and after using a UK online centre.
Source: UK online centres – Progression Survey March 2009. Base = 134.
I felt part of mylocal community
I communicated asmuch as I would like
to with my family
I communicated asmuch as I would like
to with friends 11%
17%
13%
15%
15%
19%
21%
9%
21%
25%
31%
79%
62%
78%
64%
60%
49%
10%After
Before
After
Before
After
Before
No Neither Yes
6.1.1 The UK online centres angle The security and confidence of Rejectors causes non-internet users to score very highly across a number of social capital areas, and we felt that in order to get a stronger idea of the role of the internet on social capital, we should bring in UK online centres data.
Research undertaken by UK online centres with their users has shown that individuals’ perception of their connection to community, family and friends appears to improve with more regular internet use, and can change when non-users start a
‘user journey’ with UK online centres. As Figure 19 shows, those who had not previously used the internet felt they were better connected to their community, family and friends after visiting a UK online centre.
Some of these improvements are significant – an 11% increase in those who felt part of their community, a 14% increase in feeling in touch with family, and a 17% increase for feeling close to friends.
When all sources are taken together, it becomes apparent that the communication and social opportunities offered by the internet can impact positively upon the social lives of internet users. These findings, although based on limited samples, go some way towards strengthening the cause and effect relationship implied by our user and non-user surveys and focus group analysis.
6.2 Confidence and quality of life
A key driver behind our research was to assess the effect the internet has on users’ perceptions of their self-confidence, their happiness and overall quality of life. The results show respondents tended to rate all of these as high or very high.
Perceptions of self-confidence (Figure 20) returned the most marked differences between the groups, with internet users tending to rate their self-confidence much higher than non-internet users. They also reported a better quality of life. This may in part be a reflection of the social differences highlighted earlier in the report, as non-users were far more likely than users to come from the lowest social grade and have much lower incomes than internet users.
Internet users Internet non-users
Figure 20: Self confidence levels reported by respondents (scores out of 10).
7.04
7.21
7.77
7.24
7.50
7.86
6.00 6.50 7.00 7.50 8.00
Your overallquality of life
Your overallself-confidence
Your overallhappiness
Source: FreshMinds Survey March 2009.Base = 410 internet users, 400 internet non-users.
Figure 19: Perceived connection to community, family and friends before and after using a UK online centre
Figure 20: Respondents’ perceptions of their happiness, self-confidence and quality of life (score out of 10)
28
Hobbyist
Transactor/Bargain-hunter
CommunicatorKnowledge-seeker
Functionalist
RejectorExcluded
Figure 21: Respondents’ perceived self-confidence.
Source: FreshMinds Survey March 2009.
Base = 395 internet users, 400 internet non-users.
7.07
7.38
6.82
7.35
7.40
7.57
8.07
5.00Medium
6.00 7.00High
8.00 9.00Very High
Your overallself-confidence
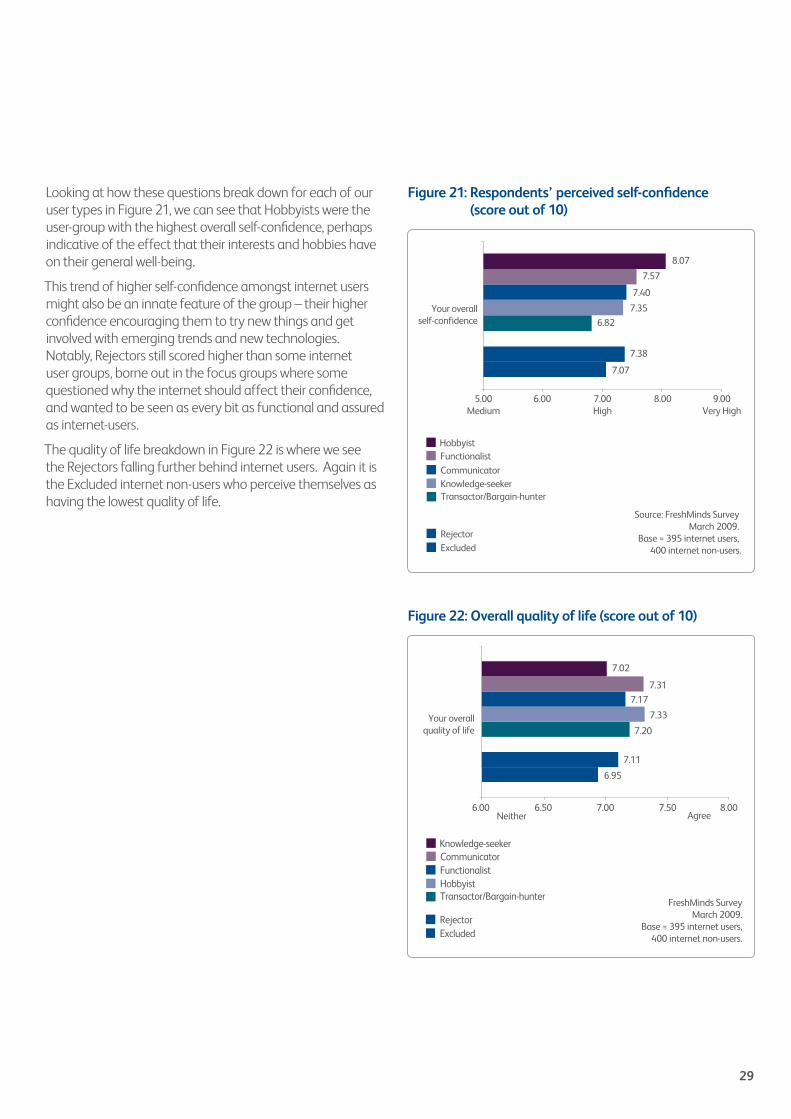
Looking at how these questions break down for each of our user types in Figure 21, we can see that Hobbyists were the user-group with the highest overall self-confidence, perhaps indicative of the effect that their interests and hobbies have on their general well-being.
This trend of higher self-confidence amongst internet users might also be an innate feature of the group – their higher confidence encouraging them to try new things and get involved with emerging trends and new technologies. Notably, Rejectors still scored higher than some internet user groups, borne out in the focus groups where some questioned why the internet should affect their confidence, and wanted to be seen as every bit as functional and assured as internet-users.
The quality of life breakdown in Figure 22 is where we see the Rejectors falling further behind internet users. Again it is the Excluded internet non-users who perceive themselves as having the lowest quality of life.
FreshMinds SurveyMarch 2009.
Base = 395 internet users,400 internet non-users.
Figure 22: Overall quality of life (score out of 10).
6.95
7.11
7.20
7.33
7.17
7.31
Your overallquality of life
7.02
6.00 Neither Agree
6.50 7.00 8.007.50
Knowledge-seeker
Transactor/Bargain-hunter
FunctionalistHobbyist
Communicator
RejectorExcluded
Figure 21: Respondents’ perceived self-confidence (score out of 10)
Figure 22: Overall quality of life (score out of 10)
29
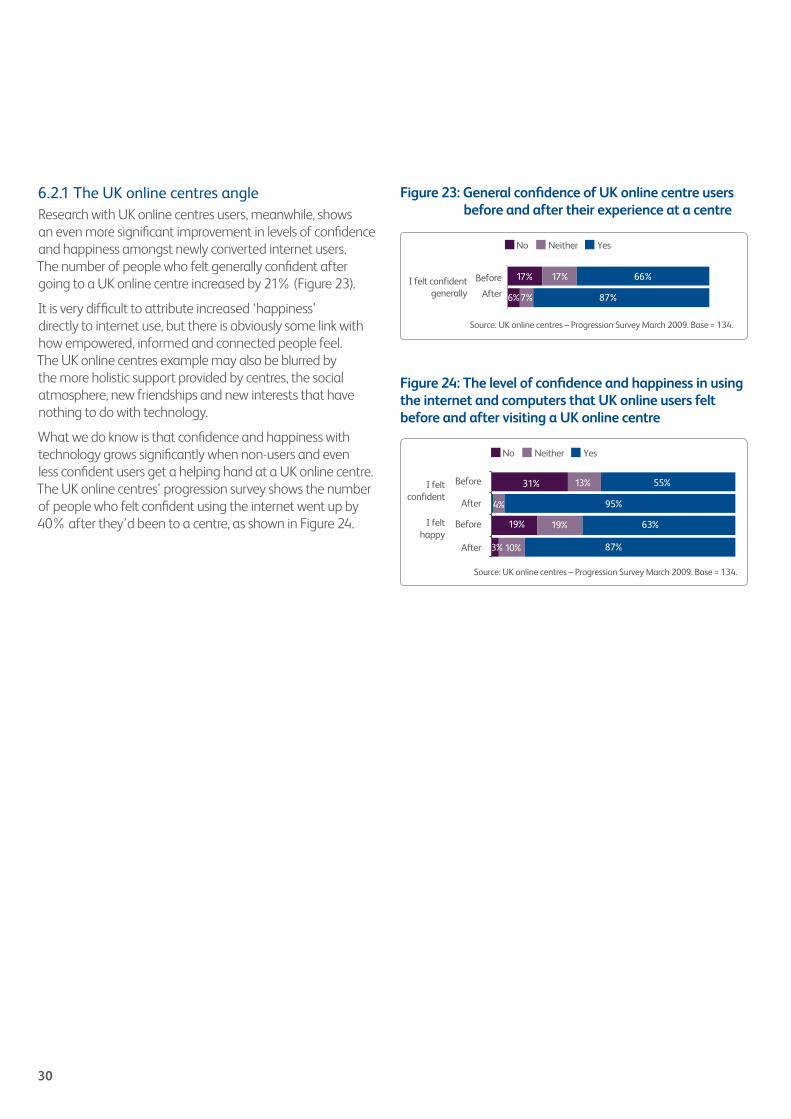
Figure 24: The level of confidence and happiness in using the internet and computers thatUK online users felt before and after visiting a UK online centre.
3%
19%
31%
19%
4%
13%
87%
63%
95%
55%
10%After
Before
After
BeforeI feltconfident
I felthappy
Source: UK online centres – Progression Survey March 2009. Base = 134.
No Neither Yes
Figure 23: The level of general confidence that UK online users felt before and after visiting a UK online centre.
6%
17% 17%
87%
66%
7%After
BeforeI felt confidentgenerally
Source: UK online centres – Progression Survey March 2009. Base = 134.
No Neither Yes
6.2.1 The UK online centres angleResearch with UK online centres users, meanwhile, shows an even more significant improvement in levels of confidence and happiness amongst newly converted internet users. The number of people who felt generally confident after going to a UK online centre increased by 21% (Figure 23).
It is very difficult to attribute increased ‘happiness’ directly to internet use, but there is obviously some link with how empowered, informed and connected people feel. The UK online centres example may also be blurred by the more holistic support provided by centres, the social atmosphere, new friendships and new interests that have nothing to do with technology.
What we do know is that confidence and happiness with technology grows significantly when non-users and even less confident users get a helping hand at a UK online centre. The UK online centres’ progression survey shows the number of people who felt confident using the internet went up by 40% after they’d been to a centre, as shown in Figure 24.
Figure 23: General confidence of UK online centre users before and after their experience at a centre
Figure 24: The level of confidence and happiness in using the internet and computers that UK online users felt before and after visiting a UK online centre
30
6.3 Employment
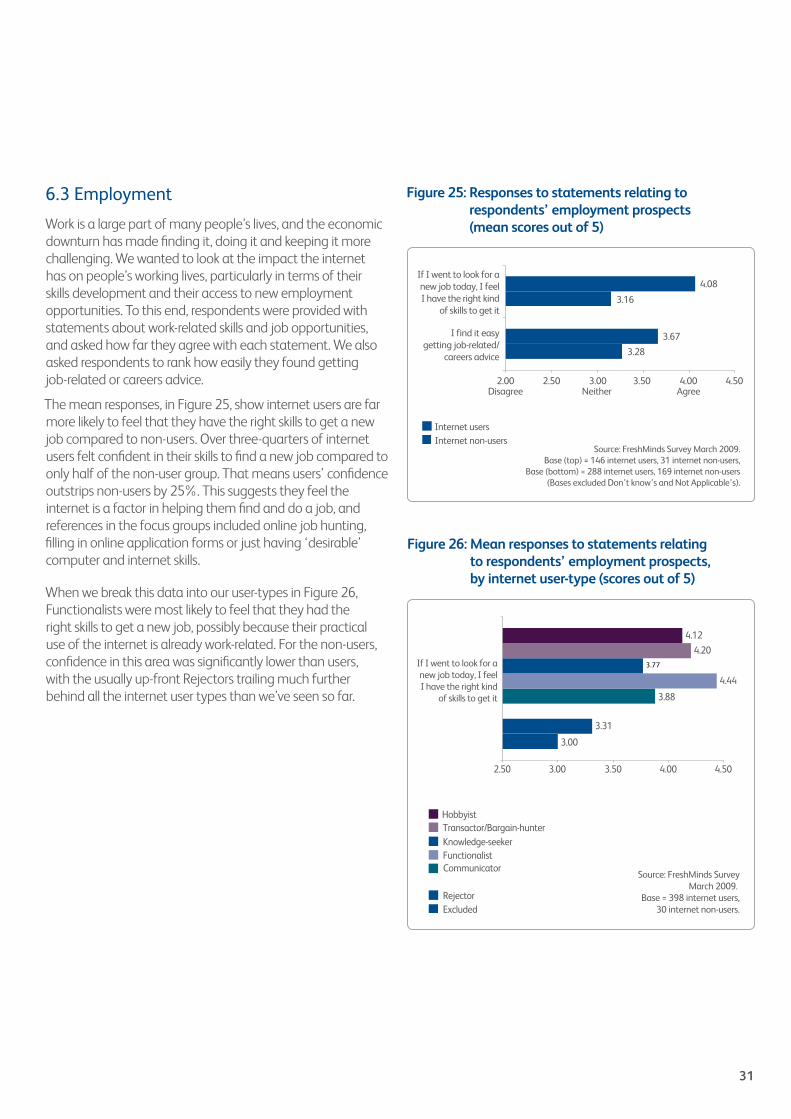
Work is a large part of many people’s lives, and the economic downturn has made finding it, doing it and keeping it more challenging. We wanted to look at the impact the internet has on people’s working lives, particularly in terms of their skills development and their access to new employment opportunities. To this end, respondents were provided with statements about work-related skills and job opportunities, and asked how far they agree with each statement. We also asked respondents to rank how easily they found getting job-related or careers advice.
The mean responses, in Figure 25, show internet users are far more likely to feel that they have the right skills to get a new job compared to non-users. Over three-quarters of internet users felt confident in their skills to find a new job compared to only half of the non-user group. That means users’ confidence outstrips non-users by 25%. This suggests they feel the internet is a factor in helping them find and do a job, and references in the focus groups included online job hunting, filling in online application forms or just having ‘desirable’ computer and internet skills.
When we break this data into our user-types in Figure 26, Functionalists were most likely to feel that they had the right skills to get a new job, possibly because their practical use of the internet is already work-related. For the non-users, confidence in this area was significantly lower than users, with the usually up-front Rejectors trailing much further behind all the internet user types than we’ve seen so far.
Internet usersInternet non-users
Figure 25: Responses to statements relating to respondents’ employment prospects (score out of 5).
If I went to look for anew job today, I feelI have the right kind
of skills to get it
3.28
3.16
3.67
4.08
2.00Disagree
2.50 3.00Neither
3.50 4.504.00Agree
I find it easygetting job-related/
careers advice
Source: FreshMinds Survey March 2009.Base (top) = 146 internet users, 31 internet non-users,
Base (bottom) = 288 internet users, 169 internet non-users(Bases excluded Don’t know’s and Not Applicable’s).
Figure 26: Mean responses to statements relating to respondents’ employment prospects,by internet user-type (scores out of 5 ).
If I went to look for anew job today, I feelI have the right kind
of skills to get it
Source: FreshMinds SurveyMarch 2009.
Base = 398 internet users,30 internet non-users.
Hobbyist
Communicator
Knowledge-seekerFunctionalist
Transactor/Bargain-hunter
RejectorExcluded
3.00
3.31
3.88
4.44
3.77
2.50 3.00 3.50 4.00 4.50
4.20
4.12
Figure 26: Mean responses to statements relating to respondents’ employment prospects, by internet user-type (scores out of 5)
Figure 25: Responses to statements relating to respondents’ employment prospects (mean scores out of 5)
31
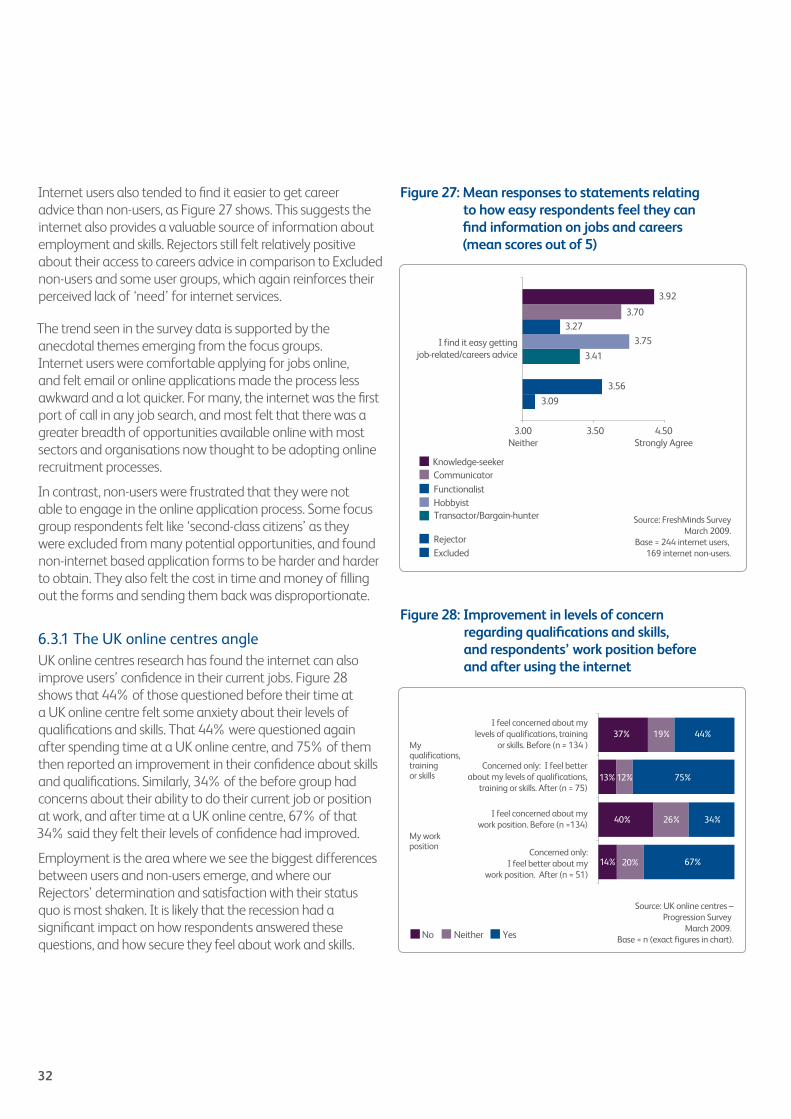
Internet users also tended to find it easier to get career advice than non-users, as Figure 27 shows. This suggests the internet also provides a valuable source of information about employment and skills. Rejectors still felt relatively positive about their access to careers advice in comparison to Excluded non-users and some user groups, which again reinforces their perceived lack of ‘need’ for internet services.
The trend seen in the survey data is supported by the anecdotal themes emerging from the focus groups. Internet users were comfortable applying for jobs online, and felt email or online applications made the process less awkward and a lot quicker. For many, the internet was the first port of call in any job search, and most felt that there was a greater breadth of opportunities available online with most sectors and organisations now thought to be adopting online recruitment processes.
In contrast, non-users were frustrated that they were not able to engage in the online application process. Some focus group respondents felt like ‘second-class citizens’ as they were excluded from many potential opportunities, and found non-internet based application forms to be harder and harder to obtain. They also felt the cost in time and money of filling out the forms and sending them back was disproportionate.
6.3.1 The UK online centres angle UK online centres research has found the internet can also improve users’ confidence in their current jobs. Figure 28 shows that 44% of those questioned before their time at a UK online centre felt some anxiety about their levels of qualifications and skills. That 44% were questioned again after spending time at a UK online centre, and 75% of them then reported an improvement in their confidence about skills and qualifications. Similarly, 34% of the before group had concerns about their ability to do their current job or position at work, and after time at a UK online centre, 67% of that 34% said they felt their levels of confidence had improved.
Employment is the area where we see the biggest differences between users and non-users emerge, and where our Rejectors’ determination and satisfaction with their status quo is most shaken. It is likely that the recession had a significant impact on how respondents answered these questions, and how secure they feel about work and skills.
I find it easy gettingjob-related/careers advice
Figure 27: Mean responses to statements relating to how easy respondents’ feel they can find information on jobs and careers (scores out of 5).
Source: FreshMinds SurveyMarch 2009.
Base = 244 internet users, 169 internet non-users.
Knowledge-seeker
Transactor/Bargain-hunter
FunctionalistHobbyist
Communicator
RejectorExcluded
3.09
3.56
3.41
3.75
3.273.70
3.92
3.503.00Neither
4.50Strongly Agree
Figure 27: Mean responses to statements relating to how easy respondents feel they can find information on jobs and careers (mean scores out of 5)
Figure 28: Improvement in levels of concern regarding qualifications and skills,and respondents’ work position before and after using the internet.
37% 19%
40% 26% 34%
13%12% 75%
44%
14% 67%20%
I feel concerned about mylevels of qualifications, training
or skills. Before (n = 134 )Myqualifications,trainingor skills
My workposition
Source: UK online centres –Progression Survey
March 2009. Base = n (exact figures in chart).
Concerned only: I feel betterabout my levels of qualifications,
training or skills. After (n = 75)
I feel concerned about mywork position. Before (n =134)
Concerned only:I feel better about my
work position. After (n = 51)
No Neither Yes
Figure 28: Improvement in levels of concern regarding qualifications and skills, and respondents’ work position before and after using the internet
32
6.4 Health
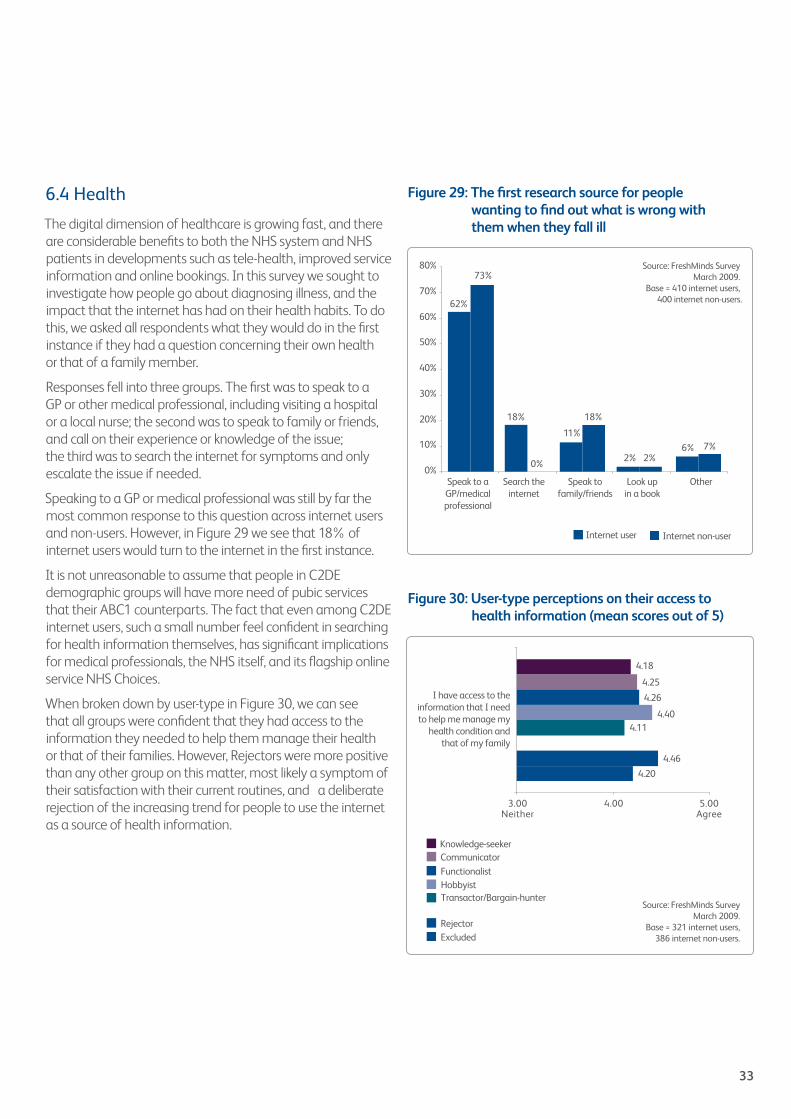
The digital dimension of healthcare is growing fast, and there are considerable benefits to both the NHS system and NHS patients in developments such as tele-health, improved service information and online bookings. In this survey we sought to investigate how people go about diagnosing illness, and the impact that the internet has had on their health habits. To do this, we asked all respondents what they would do in the first instance if they had a question concerning their own health or that of a family member.
Responses fell into three groups. The first was to speak to a GP or other medical professional, including visiting a hospital or a local nurse; the second was to speak to family or friends, and call on their experience or knowledge of the issue; the third was to search the internet for symptoms and only escalate the issue if needed.
Speaking to a GP or medical professional was still by far the most common response to this question across internet users and non-users. However, in Figure 29 we see that 18% of internet users would turn to the internet in the first instance.
It is not unreasonable to assume that people in C2DE demographic groups will have more need of pubic services that their ABC1 counterparts. The fact that even among C2DE internet users, such a small number feel confident in searching for health information themselves, has significant implications for medical professionals, the NHS itself, and its flagship online service NHS Choices.
When broken down by user-type in Figure 30, we can see that all groups were confident that they had access to the information they needed to help them manage their health or that of their families. However, Rejectors were more positive than any other group on this matter, most likely a symptom of their satisfaction with their current routines, and a deliberate rejection of the increasing trend for people to use the internet as a source of health information.
Internet user Internet non-user
Figure 29: The first research source for people wanting to find out what is wrong with them when they fall ill.
62%
18%
11%
2%6%
73%
0%
18%
2%7%
0%
10%
20%
30%
40%
50%
60%
70%
80%
Speak to aGP/medicalprofessional
Search theinternet
Speak tofamily/friends
Look upin a book
Other
Source: FreshMinds Survey March 2009.
Base = 410 internet users, 400 internet non-users.
Figure 29: The first research source for people wanting to find out what is wrong with them when they fall ill
Figure 30: User-type perceptions on their access to health information (mean scores out of 5)Figure 30: User-type perceptions on their access to health information (mean scores out of 5).
Source: FreshMinds SurveyMarch 2009.
Base = 321 internet users,386 internet non-users.
Knowledge-seeker
Transactor/Bargain-hunter
FunctionalistHobbyist
Communicator
RejectorExcluded
3.00Neither
4.00 5.00Agree
4.20
4.46
4.114.40
4.26
4.25
4.18
I have access to theinformation that I needto help me manage my
health condition andthat of my family
33
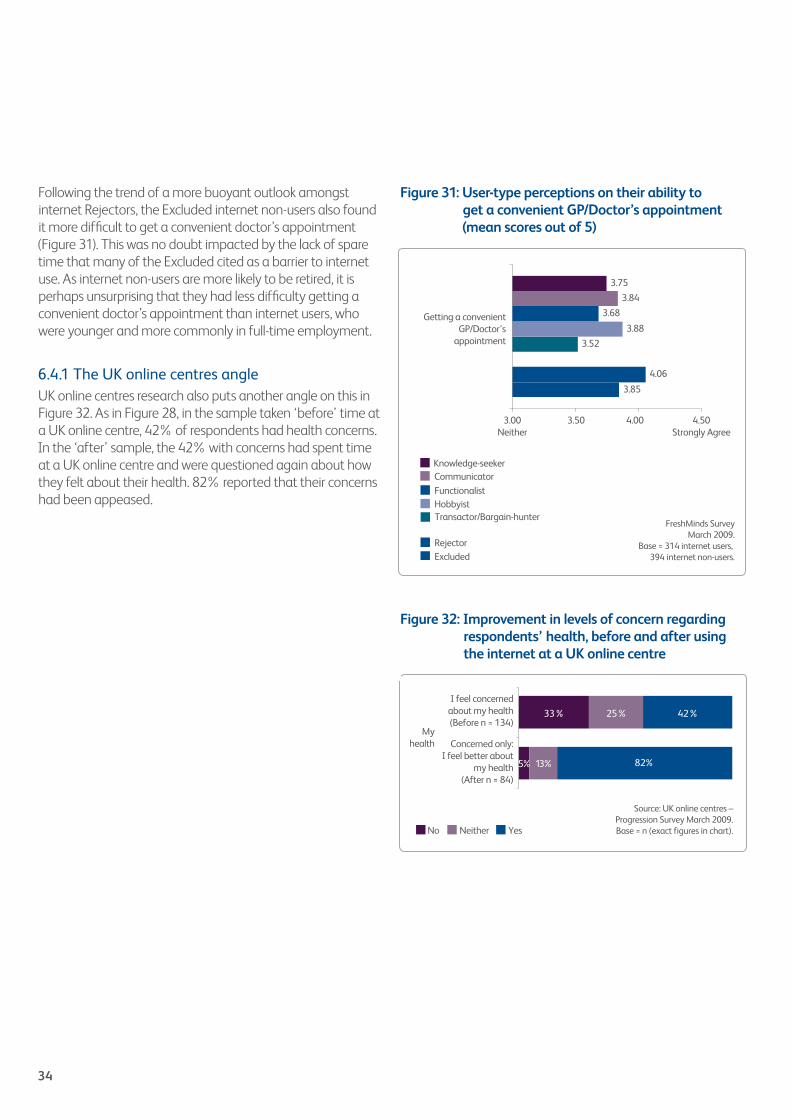
Following the trend of a more buoyant outlook amongst internet Rejectors, the Excluded internet non-users also found it more difficult to get a convenient doctor’s appointment (Figure 31). This was no doubt impacted by the lack of spare time that many of the Excluded cited as a barrier to internet use. As internet non-users are more likely to be retired, it is perhaps unsurprising that they had less difficulty getting a convenient doctor’s appointment than internet users, who were younger and more commonly in full-time employment.
6.4.1 The UK online centres angle UK online centres research also puts another angle on this in Figure 32. As in Figure 28, in the sample taken ‘before’ time at a UK online centre, 42% of respondents had health concerns. In the ‘after’ sample, the 42% with concerns had spent time at a UK online centre and were questioned again about how they felt about their health. 82% reported that their concerns had been appeased.
Figure 32: Improvement in levels of concern regarding respondents’ health,before and after using the internet at UK online.
5%
33% 25%
82%
42%
13%
I feel concernedabout my health(Before n = 134)
Concerned only:I feel better about
my health(After n = 84)
Myhealth
Source: UK online centres – Progression Survey March 2009. Base = n (exact figures in chart). No Neither Yes
Figure 31: User-type perceptions on their ability to get a convenient GP/Doctor’s appointment.
3.00Neither
3.50 4.00 4.50Strongly Agree
3.85
4.06
3.52
3.88
3.68
3.84
Getting a convenientGP/Doctor’s
appointment
3.75
FreshMinds SurveyMarch 2009.
Base = 314 internet users, 394 internet non-users.
Knowledge-seeker
Transactor/Bargain-hunter
FunctionalistHobbyist
Communicator
RejectorExcluded
Figure 31: User-type perceptions on their ability to get a convenient GP/Doctor’s appointment (mean scores out of 5)
Figure 32: Improvement in levels of concern regarding respondents’ health, before and after using the internet at a UK online centre
34
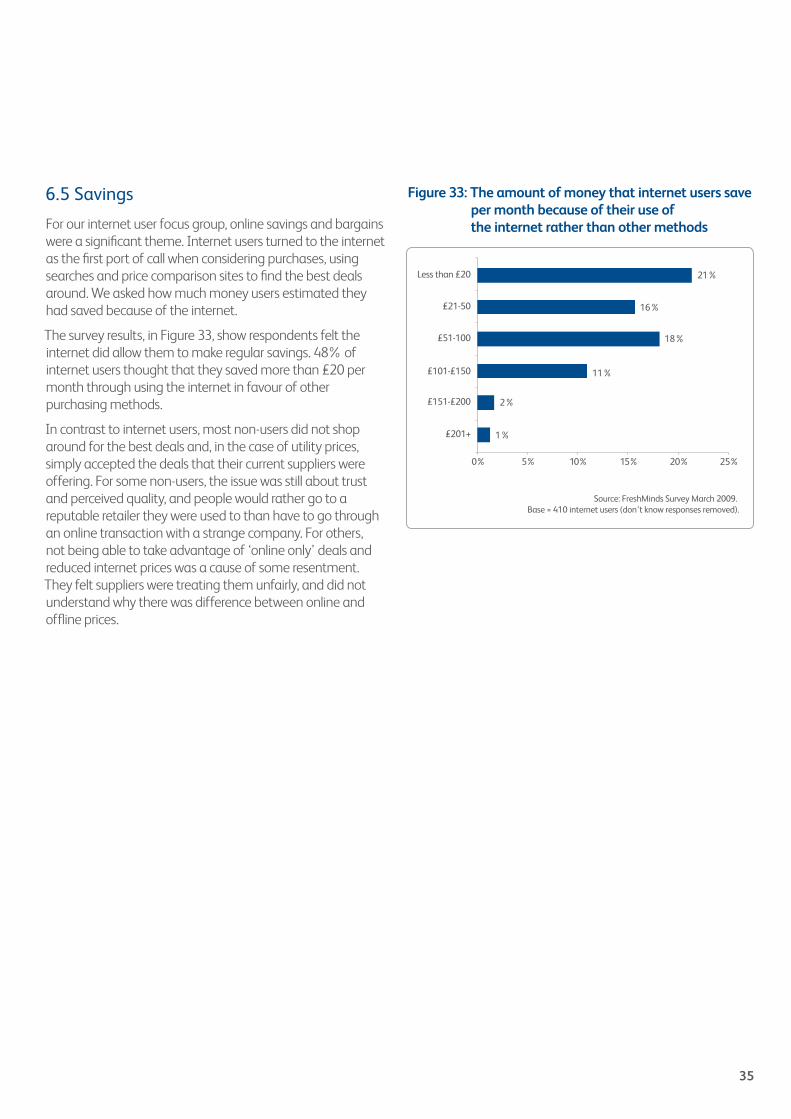
6.5 Savings
For our internet user focus group, online savings and bargains were a significant theme. Internet users turned to the internet as the first port of call when considering purchases, using searches and price comparison sites to find the best deals around. We asked how much money users estimated they had saved because of the internet.
The survey results, in Figure 33, show respondents felt the internet did allow them to make regular savings. 48% of internet users thought that they saved more than £20 per month through using the internet in favour of other purchasing methods.
In contrast to internet users, most non-users did not shop around for the best deals and, in the case of utility prices, simply accepted the deals that their current suppliers were offering. For some non-users, the issue was still about trust and perceived quality, and people would rather go to a reputable retailer they were used to than have to go through an online transaction with a strange company. For others, not being able to take advantage of ‘online only’ deals and reduced internet prices was a cause of some resentment. They felt suppliers were treating them unfairly, and did not understand why there was difference between online and offline prices.
Figure 33: The amount of money that internet users and UK online users save per monthbecause of their use of the internet rather than other methods.
1%
2%
11%
18%
16%
21%
0% 5% 10% 15% 20% 25%
£201+
£151-£200
£101-£150
£51-100
£21-50
Less than £20
Source: FreshMinds Survey March 2009. Base = 410 internet users (don’t know responses removed).
Figure 33: The amount of money that internet users save per month because of their use of the internet rather than other methods
35
7. Concluding remarks
This research has built a more detailed picture of internet use and non-use among people in the socio-economic groups C2DE. In this section we summarise the findings and suggest next steps for moving this study on.
36
7.1 What this research has shown
7.1.1 Who are the users and non users?Our research has confirmed the findings of the majority of the studies in this field, namely that non-users of the internet are likely to come from the lowest income households, to be older than internet users, tend to be retired and are more likely to be female than male.
In contrast, our internet users were more likely to be male, younger than non-users, and a large proportion of them came from the highest social grade that we surveyed – C2. In addition, they are less likely to be connected to their local community.
7.1.2 Why do people use or not use the internet?Reasons for starting to use the internet can be categorised into a number of ‘motivational hooks’:
• Knowledge-seekers
• Communicators
• Functionalists
• Hobbyists
• Transactor/Bargain-hunters
• Technophiles/Followers
• Family-oriented
Knowledge-seekers and Communicators were the largest groups amongst our internet users. These hooks provide key information which could potentially guide UK online centres and the wider sector – in product development, training and project delivery, marketing and communications.
The associations that internet users have with the internet are largely functional and positive, whereas internet non-users have far more negative associations. These centre around feelings of fear and distrust, despite having minimal personal experience of the internet. This suggests that many members of the non-user group display strong attitudinal barriers towards the internet, which will present challenges in extending digital inclusion. Their reasons for being off-line are many and varied, but they can broadly be categorised into two groups:
• Rejectors
• Excluded
The Excluded are internet non-users because they perceive a lack of access, skills or resources. The Rejectors are those who don’t see the value of the internet, or why or how it could be relevant to their lives. Our focus groups, which featured a number of Rejectors, indicate that this group is likely to be made up of highly driven people, who tend to be set in their ways and resistant to change. Although some may realise that exclusion from the internet is putting them at a disadvantage in life, they do not see the benefits of changing their behaviour as significant enough to outweigh the cost and effort of adjusting their routine. On the whole, they have a more positive outlook on their lives than the Excluded group across the major impact areas our survey studies, and indeed as we have seen, a more positive outlook than some groups of internet users. Again this has significant implications for how non-users of the internet are targeted, and what messages are used by digital inclusion practitioners to facilitate or encourage conversion to internet use.
7.1.3 Does the internet improve lives?The addition of focus group insights and UK online centres user data helps us understand more about the cause and effect relationship between different behaviours, attitudes and the use of the internet, but care must be taken not to imply causal links to the survey data. Nevertheless, this study has been able to show an overarching correlation between internet use and positive experiences across most of our areas of enquiry.
Internet users reported an easier social life than non-users, and a stronger awareness of important current affairs. They also tended to have higher self confidence than non-users, and perhaps most significantly were more confident that they had the right skills to find and secure a new job – scoring themselves 25% higher than internet non-users. Internet users also felt they benefitted financially from online shopping and price comparisons, with 48% saying their internet use allowed them to save over £240 a year. With the UK in the midst of recession, these findings are particularly poignant.
As well as advantages for the individual, the data also suggests internet use has wider reaching benefits. Nearly a fifth of internet users used the internet as their first port of call when investigating a health concern. This could have enormous implications for the health service, in terms of general health awareness and General Practitioners’ time.
37
7.2 Next steps
This research has built on previous knowledge and introduced an additional explanatory element to use and non-use of the internet among groups who are at risk of digital exclusion. While it has established an interesting baseline, there are some other courses of further investigation which are worth pursuing:
• Strengthening causality – the findings concerning impact of the internet on people’s lives are only correlational. The digital inclusion knowledge base would benefit from a further study aiming to establish stronger causality. This could either be done through a longitudinal study of a converted non-user cohort, or a regression study of existing data.
• Tackling the Rejector challenge – this research clearly establishes the challenge presented by a significant proportion of Rejectors – or in Ofcom’s terms ‘voluntary non-users’. More work needs to be done either through research or ground level projects, to determine if and how this audience can be converted to internet use.
• Understanding the specific benefits of the internet – this research tackled generic correlations between people’s perceptions of their lives, and use of the internet. However, there is a shortage of UK specific data about how the internet does impact on individuals and on the country as a whole. There is more scope to build a knowledge base and business case for the true value of digital inclusion, and this is something the sector should consider.
7.1.4 Future strategies and the ‘Rejector challenge’There is no doubt that digital technologies will continue to pervade every aspect of our lives as employees, employers, parents, grandparents, consumers, citizens, as members of a family and community. As they become the main medium for working, socialising and for public and private services, non-users risk becoming isolated from, and left behind by, the rest of society. This danger is all the more pressing under the current economic conditions, as service providers rush to the internet as a cost-saving device, and wind down their ‘traditional’ forms of service provision.
Strategies for targeting and reaching the Excluded should focus on the concrete benefits of being online, easy access, support and free or low cost training opportunities. These messages can be easily incorporated into marketing materials, and it is likely – given the experiences of our internet users – that the response rate would be reasonably high.
Rejectors, however, tend to be more insular and content with the status quo than the Excluded, and thus less open to marketing and persuasion. Strategies for reaching the Rejectors will need to focus on reassurance and overcoming very precise barriers. This is a much more complicated communications task, and traditional marketing methods may not be the best way to reach this audience. It is likely to require a longer term approach, local action, possibly incentives, and almost certainly the support of community or family intermediaries.
Overcoming the ‘Rejector challenge’ is a key challenge for digital inclusion moving forwards. Failing to motivate this group can only result in deepening digital and social exclusion. Understanding this audience, and exploring channels for reaching them will be vital next steps in developing digital inclusion policy and practice.
38
References
01 UK online centres, ICM (Jan – April 2008)
02 Based on Oxford Internet Survey (2007). The Internet In Britain 2007 Based on Digital Inclusion Team (2007)
03 Research referred to here is taken from the body of evidence presented in the Digital Inclusion Action Plan www.communities.gov.uk/publications/communities/deliveringdigitalinclusion; see also The Digital Inclusion Landscape in England: Delivering Social Impact through Information and Communications Technology. London: Digital Inclusion Team
04 UK online centres, Simpson&Carpenter, Regenesis (2006), Transformational Government for the Citizen, http://www.ukonlinecentres.com/corporate/images/stories/downloads/ukonlineegovresearchreport.pdf
05 UK online centres, FreshMinds (2007), Understanding Digital Inclusion, http://www.ukonlinecentres.com/corporate/images/stories/downloads/uk_online_digitalinclusion.pdf
06 UK online centres, FreshMinds (2008), Economic benefits of digital inclusion: building the evidence http://www.ukonlinecentres.com/corporate/images/stories/downloads/economic%20benefits%20of%20digital%20inclusion%20-%20building%20the%20evidence.pdf
07 UK online centres, Ipsos Mori (2008), Digital inclusion, social impact; http://www.ukonlinecentres.com/corporate/images/stories/downloads/digital_inclusion_research_report.pdf
08 Research referred to here is taken from the body of evidence presented in the Digital Inclusion Action Plan www.communities.gov.uk/publications/communities/deliveringdigitalinclusion
09 UK online centres, ICM (Jan – April 2008) Sample base: 7,655
10 Ofcom (2008), Media Literacy Audit: Report on UK children’s media literacy, www.ofcom.org.uk/advice/ media_literacy/medlitpub/medlitpubrss/ml_childrens08/ml_childrens08.pdf; Ofcom (2007c), The Communications Market 2007: Broadband, www.ofcom.org.uk/research/cm/broadband_rpt/broadband_rpt.pdf; Ofcom (2009), Media Literacy Audit – Digital Lifestyles, http://www.ofcom.org.uk/advice/media_literacy/medlitpub/medlitpubrss/digital_lifestyles/
11 UK online centres Progression Report (March 2009)
12 Graphical representation from on:fire (April 2009). Based on evidence from FreshMinds Survey and Focus Groups. Size of text in boxes corresponds to frequency of reoccurrence of each word. Size of silhouettes corresponds to size of each user group.
13 Ofcom (2009), Digital Lifestyles: Hesitants, Resistors and Economisers, http://www.ofcom.org.uk/advice/media_literacy/medlitpub/medlitpubrss/digital_lifestyles/
14 UK online centres, FreshMinds (2007), Understanding Digital Inclusion, http://www.ukonlinecentres.com/corporate/images/stories/downloads/uk_online_digitalinclusion.pdf
15 UK online centres and FreshMinds, Transformational Government for the Citizen, November 2006
16 UK online centres, Ipsos Mori (2008), ; http://www.ukonlinecentres.com/corporate/images/stories/downloads/digital_inclusion_research_report.pdf
17 Ufi Progression Survey, March 2009
18 With 1 being ‘Strongly disagree’, 3 ‘Neither agree nor disagree’ and 5 ‘Strongly agree’
39

For more information about UK online centres,please visit: www.ukonlinecentres.comor email us at: [email protected]
© Ufi Ltd, April 2009. All rights reserved. All information correct at time of going to press.


![5 Ways Additive Manufacturing Will Improve Our Lives [Infographic]](https://img.pdfslide.us/doc/110x75/55b8b19abb61ebbd038b4648/5-ways-additive-manufacturing-will-improve-our-lives-infographic.jpg)