Embed Size (px)
Citation preview
Does Technology Adoption Save Regulatory Compliance Costs?
Ty Leverty and Junhao Liu∗
September 17, 2019
ABSTRACT
We study whether digital technology streamlines the regulatory process and reducesthe costs of complying with regulation. To identify the effect of digital technologyon regulatory compliance costs, we leverage a quasi-experimental policy change whichmandates the use of an internet-based flow management tool that enables insurers andregulators to exchange policy form and rate filing information. We find that digiti-zation lowers the costs of complying with regulation. The average insurer per line ofbusiness and year in the highest quartile regarding the proportion of business underthe mandate saves 5.4 percent of general expenses. Our results also suggest a fixedcost of adopting the technology, with larger cost-saving accruing to firms that adoptthe new technology more widely.
Keywords: Technology Adoption; Financial Regulation; Insurance Regulation; Gov-ernment Policy and RegulationJEL Codes: D78, G22, G28
∗Leverty: Department of Risk and Insurance, Wisconsin School of Business, University of Wiscon-sin–Madison, WI 53706, U.S.A. E-mail: [email protected]. Liu: Discipline of Finance, University ofSydney Business School, University of Sydney. Email: [email protected]. We thank Patricia Born,J. Michael Collins, Martin Grace, Rob Hoyt, Robert Klein, Anita Mukherjee, Lars Powell, Joan Schmit,Stephen Shore, Justin Sydnor, and seminar participants at the 2019 ARIA conference and the 2019 EALE-Geneva Association joint seminar for comments.
1 Introduction
In the past decades, digitization and the internet have impacted almost all economic activ-
ities and reduced a variety of economic costs. Besides the commercial world, government
regulators are increasingly adopting digital technology to make the regulatory process more
efficient. Yet new technology requires additional investment in human capital for both the
regulator and the regulated entity, and it remains an open question whether technology
adoption reduces the cost of regulation, at least in the short term. In this study, we estimate
the impact of technology adoption on the costs of complying with product regulation in the
U.S. property-liability (P/L) insurance market by exploiting quasi-experimental variation in
when states adopt the technology.
The U.S. insurance industry provides an ideal laboratory to study the effects of regulation.
The industry is large – with $534 billion of direct premiums written in 2016 (it comprises
2.88% of U.S. GDP1) – and heavily regulated – about half of the lines of insurance are
subject to product regulation.2 In contrast to other financial sectors that are subject to
federal regulation, the insurance industry is primarily regulated at the state level and states
experiment with different forms of regulation. A major action by state insurance regulators
is the review and approval of insurance rates and policy forms, and there are substantial
costs associated with complying with these regulations (Leverty and Liu 2019). As part of
the National Association of Insurance Commissioners (NAIC)’s “Speed to Market” initiative,
the NAIC developed an online platform for regulatory compliance, the System for Electronic
Rate and Form Filing (SERFF). SERFF is a web-based flow management tool that enables
insurers and regulators to exchange policy form and rate filings and review information within
the application.3 The objective of SERFF is to standardize the form and rate filing process,
1Data source: Federal Insurance Office (2017); Bureau of Economic Analysis (2017).2Authors’ calculation based on the U.S. insurer data (1992-2014). A line of insurance is classified as
regulated if the insurer is required to obtain regulatory approval of their rating plans or policy forms priorto using them.
3SERFF also houses other Speed to Market tools, including the Uniform Product Coding Matrices andUniform Transmittal Documents.
1
improve regulatory efficiency, and save financial and human resources for both regulators and
insurers. Twenty-eight states mandated the adoption of SERFF, at different times, between
2007 and 2014.
This study exploits the variation in when and if states mandate the use of SERFF for
insurer product (i.e. policy form and rate) filings to cleanly identify the effect of technology
on the costs of complying with regulation. While there may be heterogeneity in regulatory
compliance costs across insurers, lines of business, states, and years, we argue that the
adoption of SERFF is plausibly exogenous to other factors along these dimensions. Our
empirical strategy uses fixed effects regression models to isolate the compliance costs from
other operating expenses incurred by firms over 23 years, 1992-2014. As insurance firms
may be heterogeneous in their ability to minimize compliance costs, firm fixed effects control
for the average compliance costs of each firm. Compliance costs may also vary by line of
business (e.g., auto liability or homeowners insurance), and line fixed effects control for
the average compliance costs of each line. Finally, compliance costs may vary over time,
and year fixed effects control for the average compliance costs for each year. Our results
suggest that digitization reduces the costs of complying with regulation with statistical and
economic significance. The average insurer in the highest quartile regarding the proportion
of business under a SERFF mandate saves 5.4 percent of general expenses, which translates
to about $442,000 per year and line of business. We also find evidence suggesting a fixed
cost of technology adoption, as firms adopting the new technology more widely show larger
cost-saving.
This study makes three contributions to the literature. First, while there is extensive re-
search on how regulation affects the regulated entity’s technology adoption in environmental
economics and financial economics (Popp et al. 2010; Bohme et al. 2015), little research has
been conducted on how the adoption of technology by regulators impacts market partici-
pants. This study provides empirical evidence on whether a mandate to use technology for
regulatory purposes reduces the costs of complying with regulation. Second, this study adds
2
to the literature on the costs of insurance regulation. Several studies document substantial
costs associated with state insurance regulation (Grace and Klein 2000; Pottier 2011; Leverty
2012). We extend this literature by estimating how the introduction of digital technology
affects the costs of complying with regulation. Finally, this study also joins the broad litera-
ture on the economics of digitization (e.g., Goldfarb et al. 2015; Goldfarb and Tucker 2019)
and provides additional evidence on whether the adoption of information technology reduces
firm’s operating costs in an economically important industry.
2 Institutional Background
2.1 Policy Form and Rate Filing System
In this section, we discuss the institutional features of the U.S. P/L insurance industry that
make it an ideal environment to study the compliance costs of regulation and technology
adoption.4 In the U.S., insurance is regulated at the state level. Each state has an insur-
ance department that oversees the regulation of insurance. A substantial part of insurance
regulation focuses on the rates and policy forms of insurance policies to ensure they comply
with state laws and are reasonable and fair for consumers.
The regulation of policy forms and rates is conducted through a filing system in each
state. The process starts with a filer (an insurer or third-party consultant) submitting the
proposed rates and policy form to the regulator. Then the insurance department will review
the rate and form filing information and decide whether to approve the filing or request
further information. The state insurance commissioner has the ultimate authority.
An important covariate to be controlled for is the regulatory stringency, i.e. the different
timelines of filing and approval by state, as it is closely related to insurer compliance costs
(Leverty and Liu 2019). In states with a prior-approval (stringent) system, the insurer must
receive the regulator’s approval before the policy can be used in the market. In states with
4See Klein (2005) for an extensive discussion on insurance regulation in the U.S.
3
a file-and-use system, a policy can be used in the market without the regulator’s approval,
but the insurer must file the rates and forms a certain number of days prior to using the
policy. In states with a use-and-file system, the filing only needs to be done after the use of
the policy. In almost every state, a filing is required for a policy to be used.
The stringency of form and rate regulation also differs within a state at the line of
business level. In general, personal lines are more stringently regulated than commercial
lines. In addition, within a state-line, regulatory stringency varies over time. For example,
twenty-two states deregulated their form filing system from prior approval to other types of
regulation, for at least one line of insurance within our sample period. Tables A.1 to A.4
report the distribution of stringent form and rate regulation by state and year for personal
and commercial lines of insurance.5
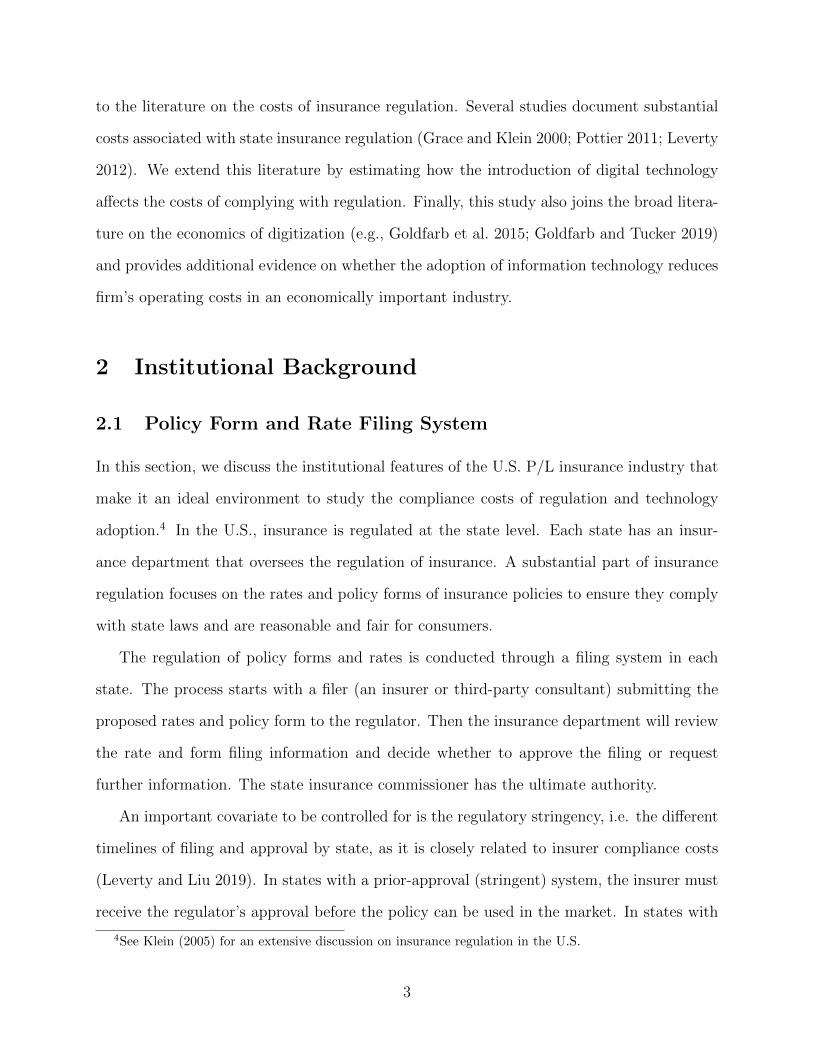
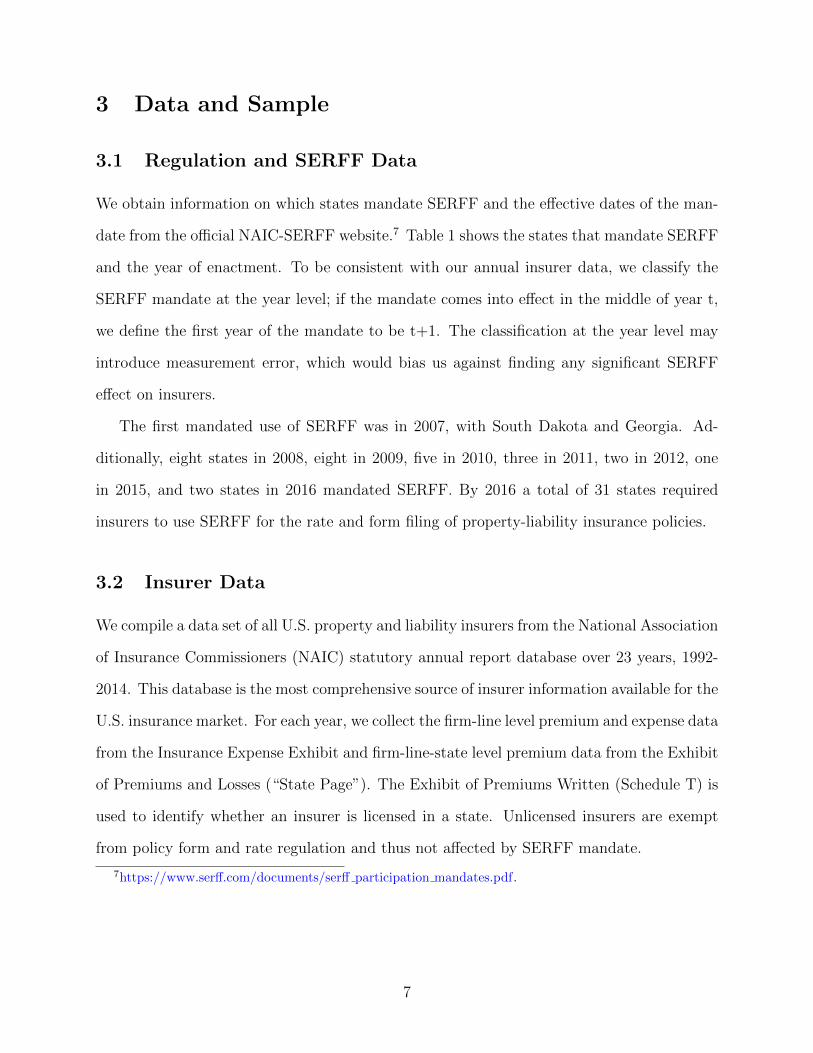
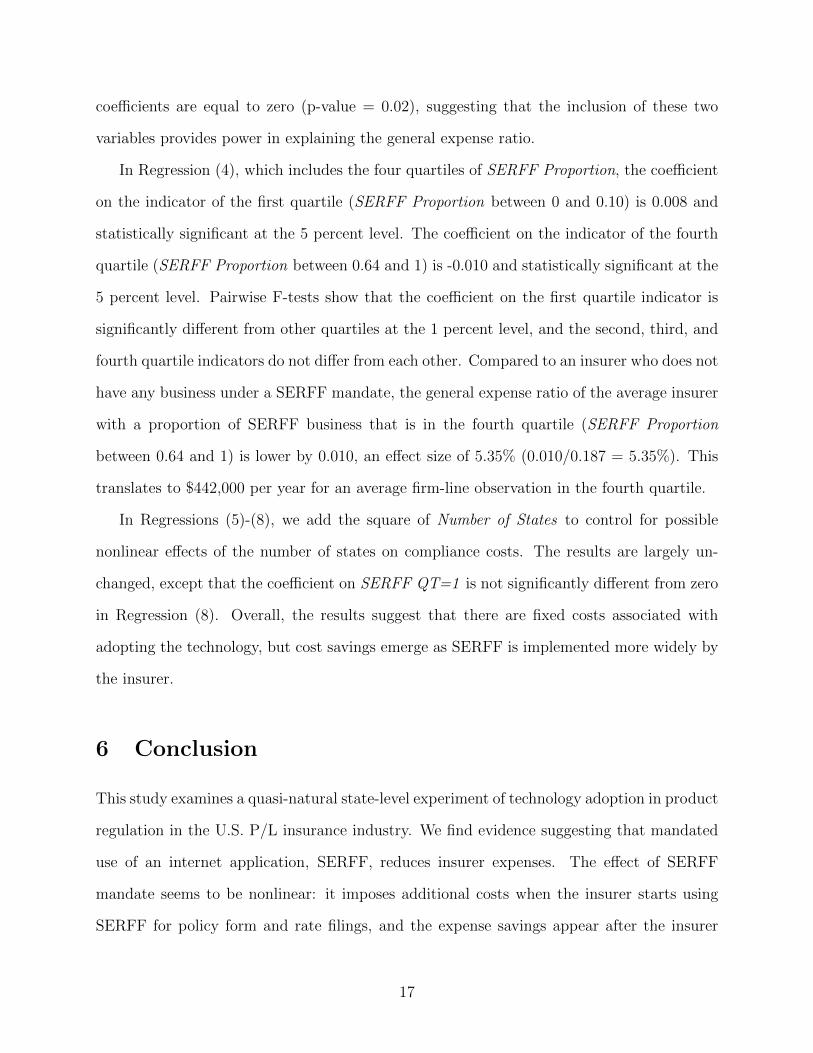
Figure 1 shows the cross-sectional and time-series variation in the stringency of form
regulation in our sample. It documents the number of lines under stringent form regulation
at the beginning (1992) and end (2014) of our study period. A line-year observation is
defined as under stringent form regulation if the state requires the prior approval of policy
forms. The variation in colors across the U.S. in a given year shows the cross-sectional
heterogeneity in stringent form regulation among states. A comparison between 1992 and
2014 shows the time-series variation, as many states change how they regulate forms over
time. For example, in 1992, Wisconsin required prior approval of policy forms in 14 lines of
insurance, while Illinois did not require policy form regulation for any lines of insurance. In
2014, Wisconsin required prior approval of policy forms in only one line, while Illinois still
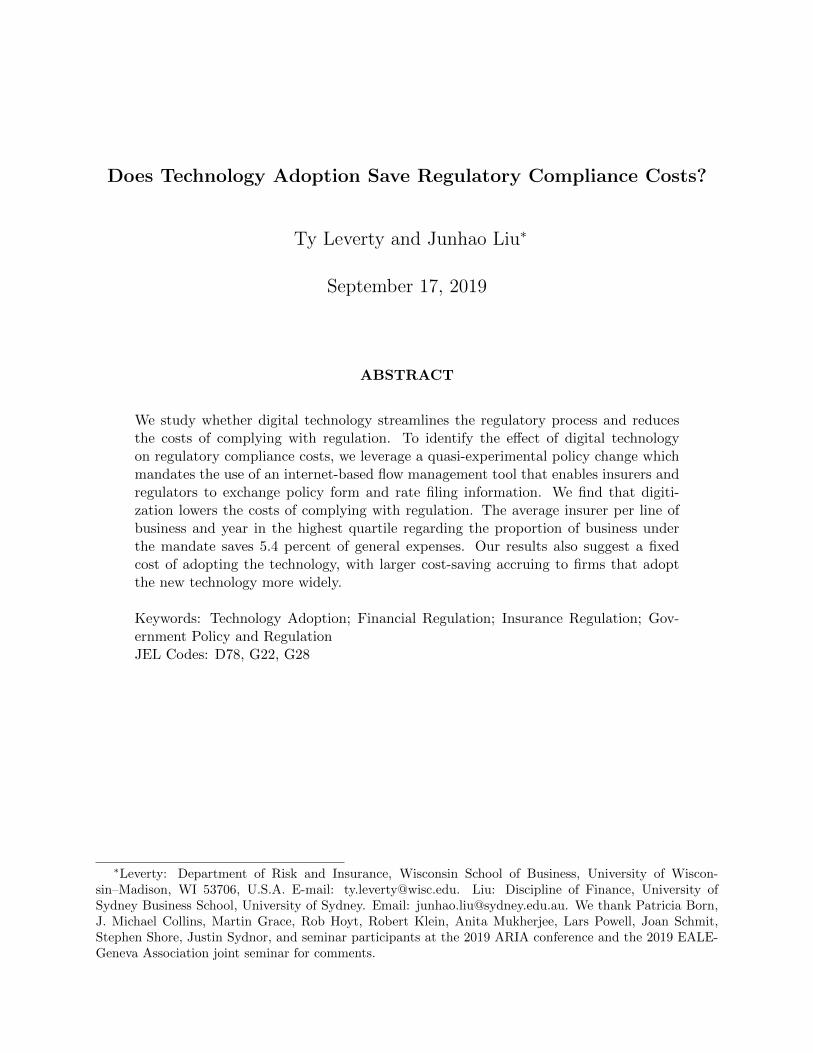
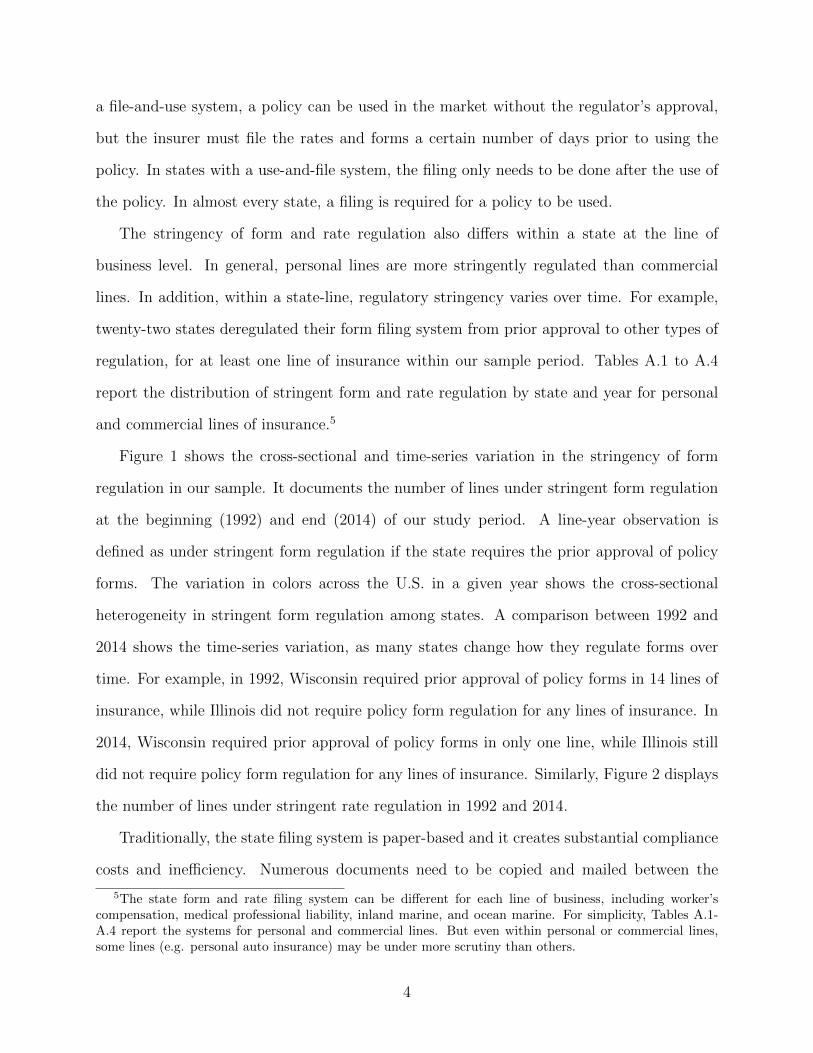
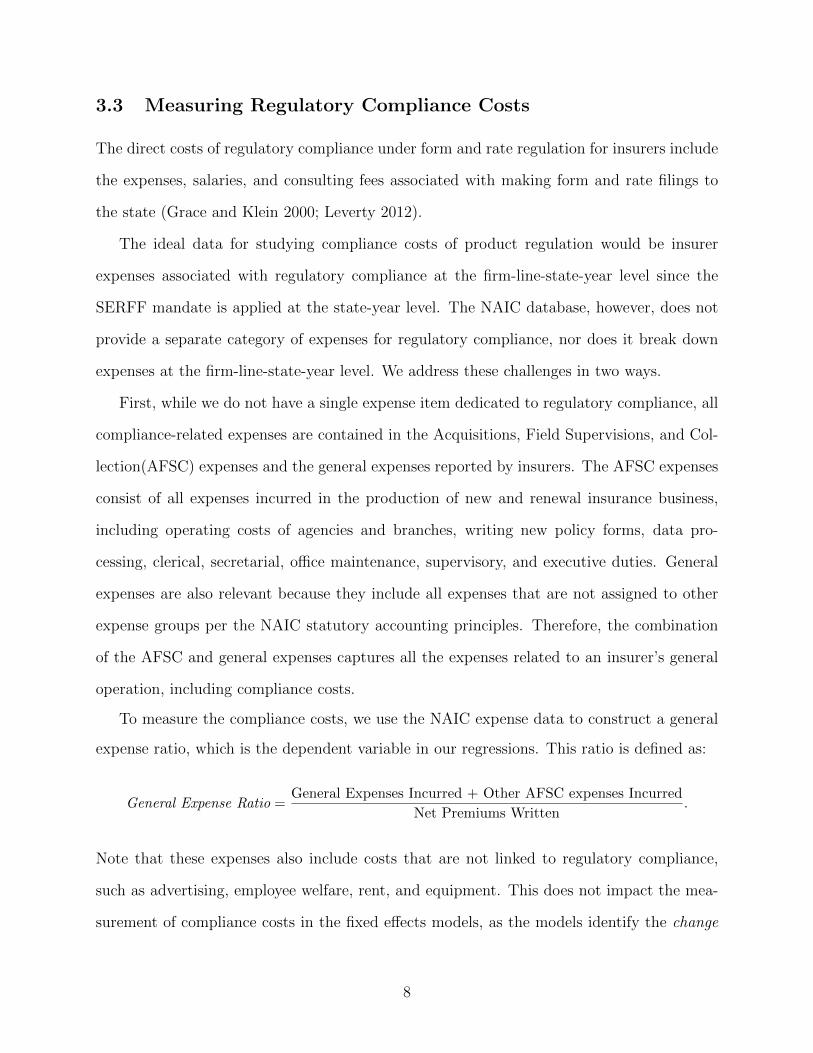
did not require policy form regulation for any lines of insurance. Similarly, Figure 2 displays
the number of lines under stringent rate regulation in 1992 and 2014.
Traditionally, the state filing system is paper-based and it creates substantial compliance
costs and inefficiency. Numerous documents need to be copied and mailed between the
5The state form and rate filing system can be different for each line of business, including worker’scompensation, medical professional liability, inland marine, and ocean marine. For simplicity, Tables A.1-A.4 report the systems for personal and commercial lines. But even within personal or commercial lines,some lines (e.g. personal auto insurance) may be under more scrutiny than others.
4
filer and the regulator. This is especially true for multi-state insurers who need to make a
separate filing in each state in which they operate for the same policy.
2.2 SERFF
To improve the efficiency of insurer filing the policy forms and rates with regulators, state
regulators and the NAIC started a “Speed to Market for Insurance Products” initiative in
the mid-1990s. The initiative led to the establishment of the System for Electronic Rate and
Form Filing (SERFF) in 1998. SERFF is an internet platform designed to streamline the
rate and form filing and review process. The NAIC has promoted SERFF as a major Speed
to Market tool since its first product release.
SERFF replaces the traditional paper-based system by digitizing the entire filing process.
Filers log onto SERFF, identify the filing requirements promulgated by each state, and
submit an electronic filing to the regulator with all supporting documents uploaded in a
digital format. The regulator receives the filing on SERFF and can start reviewing them
instantly. In the case where a change is needed, the regulator can contact the filer using
a messaging system in SERFF, and the filer can make changes and submit a revised filing
in SERFF. In short, SERFF provides a one-stop interface for regulators and insurers to
exchange information and complete rate and form filings electronically.
When the first version of SERFF was released in 1998, eight states and sixteen insurers
participated. A total of 294 filings were made in 1998. In 2000, an enhanced version of
SERFF was released and it quickly expanded across the states in the early 2000s. By the
end of 2004, SERFF was accepted in 49 states and the District of Columbia and over 1,400
insurers were licensed to use SERFF. Many states have mandated the use of SERFF for
insurance rate and form filings. Under a SERFF mandate, insurers can no longer make
paper filings and must file their proposed rates and forms via SERFF. Between 2007 and
2016, 31 states have enacted SERFF mandate in P/L insurance. Florida is the only state
that does not accept SERFF, as it adopts its own electronic filing system named I-File (later
5
replaced by the Insurance Regulation Filing System (IRFS)).
On the one hand, SERFF has several advantages over the traditional filing system. First,
SERFF improves the efficiency of the information exchange by providing a single online
platform for insurers and regulators to communicate, manage, and store policy form and rate
filings electronically. Insurers no longer need to mail hard copies of product information to
the regulator and wait for a response in the mail. Second, SERFF makes insurer compliance
more manageable, as insurers have easy access to the current filing requirements promulgated
by the state, which helps insurers submit more accurate and complete filings. Moreover,
SERFF is particularly helpful to multi-state insurers, as they can comply with the regulations
in different states in a much easier fashion and even use a single filing if it meets the regulatory
requirements of those states. Industry reports suggest that the adoption of SERFF leads
to considerable cost savings, including a reduction in internal IT and database maintenance
costs and product filing worker hours (NAIC 2016).
On the other hand, insurers incur fixed and variable costs when they transition from the
traditional filing method to SERFF. For an insurer to implement SERFF, it needs to spend
resources on staff training and possibly upgrade its technology. Also, insurers pay a filing fee
for each filing they make, either on a pay-as-you-go basis or paying for a “block” of filings at a
lower price in advance.6 Insurers vary in when (and to what extent) they transfer to SERFF
from the traditional method. Some insurers (e.g., the sixteen original participating firms)
implement SERFF as soon as it becomes available and well before SERFF is mandated,
while other insurers implement SERFF when it is mandated. Some multi-state insurers that
are subject to a SERFF mandate in some states but not others may implement SERFF in
the states with mandates, but not in the others, while other multi-state insurers completely
transfer to SERFF once they are subject to a SERFF mandate in one state.
6As of May 2019, the pay-as-you-go rate is $13.50 per filing, and the prepaid rate is $9.50/$8.00/$6.50per filing for a block of 500/1,000/1,500 filings.
6
3 Data and Sample
3.1 Regulation and SERFF Data
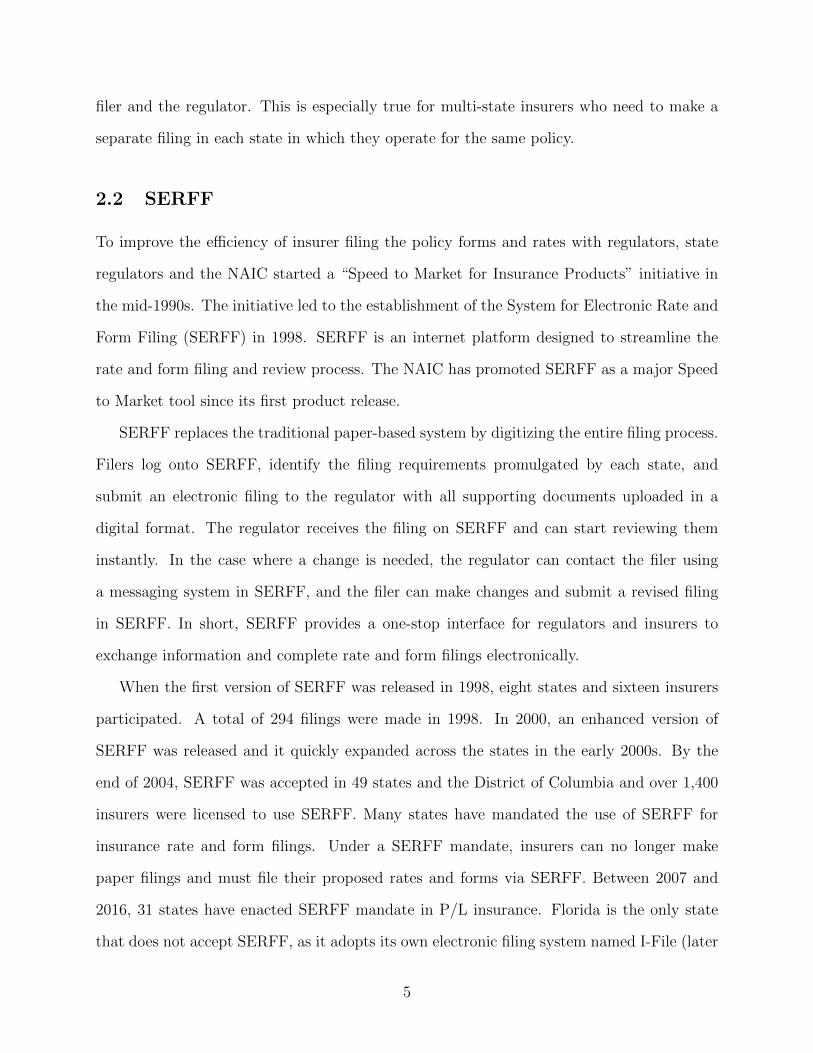
We obtain information on which states mandate SERFF and the effective dates of the man-
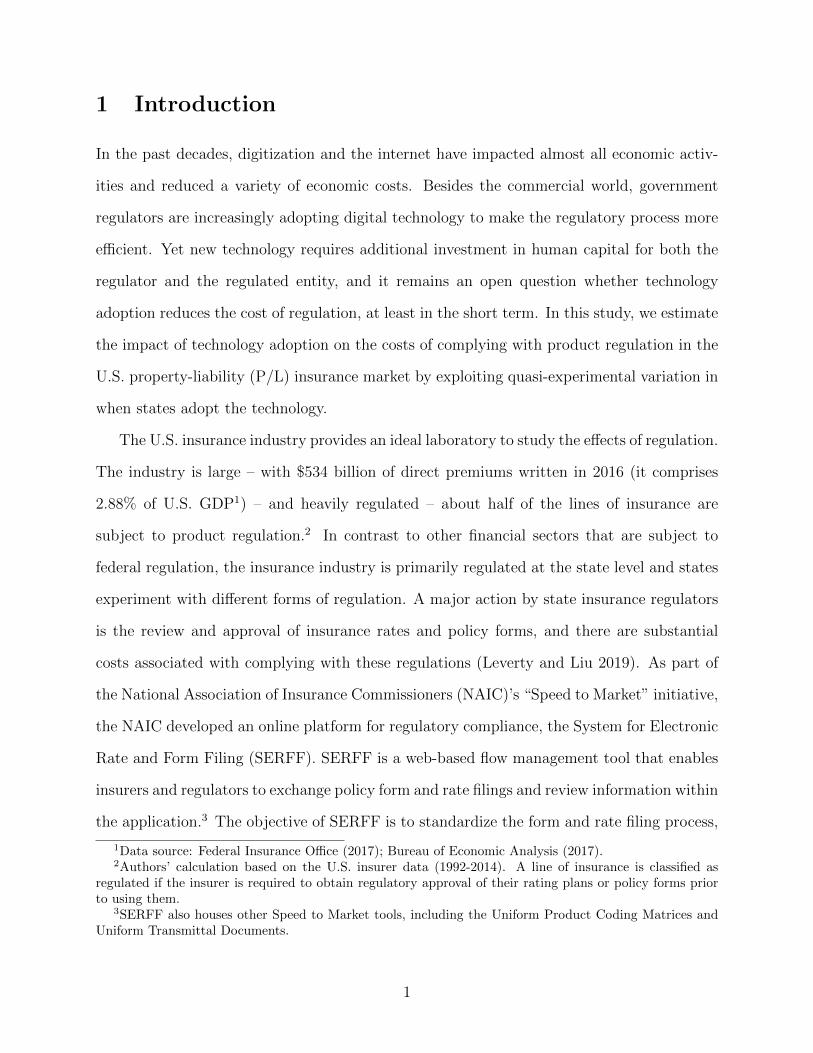
date from the official NAIC-SERFF website.7 Table 1 shows the states that mandate SERFF
and the year of enactment. To be consistent with our annual insurer data, we classify the
SERFF mandate at the year level; if the mandate comes into effect in the middle of year t,
we define the first year of the mandate to be t+1. The classification at the year level may
introduce measurement error, which would bias us against finding any significant SERFF
effect on insurers.
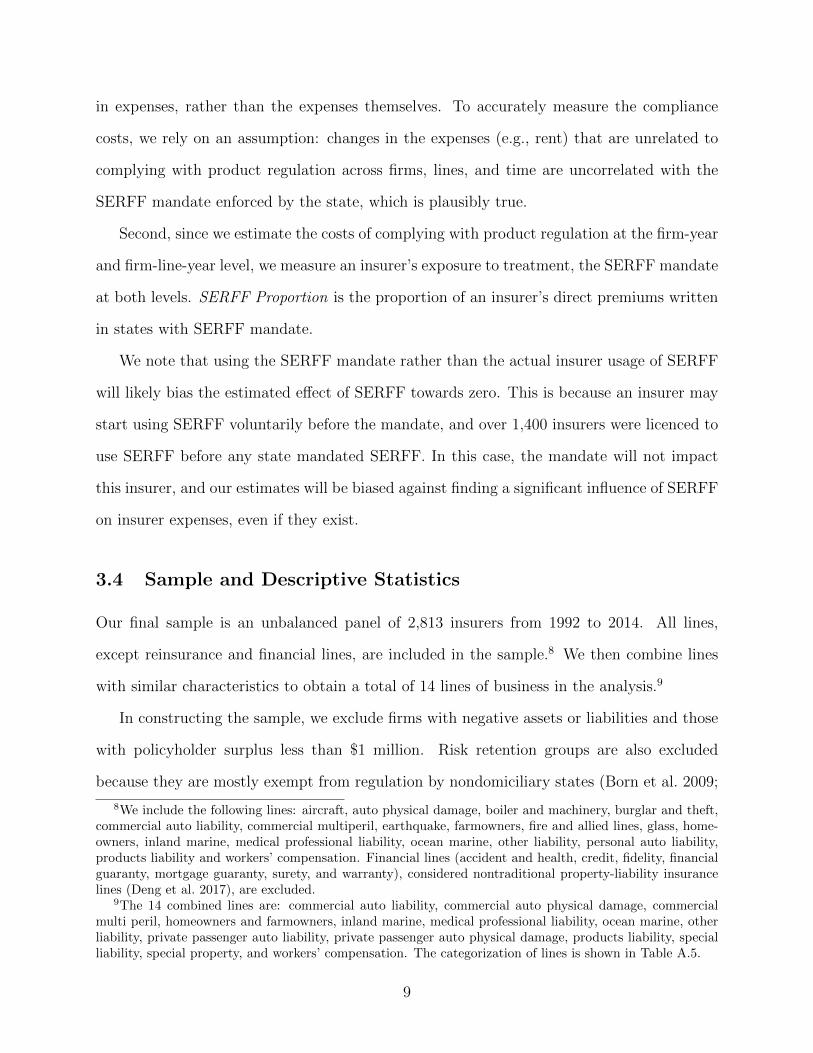
The first mandated use of SERFF was in 2007, with South Dakota and Georgia. Ad-
ditionally, eight states in 2008, eight in 2009, five in 2010, three in 2011, two in 2012, one
in 2015, and two states in 2016 mandated SERFF. By 2016 a total of 31 states required
insurers to use SERFF for the rate and form filing of property-liability insurance policies.
3.2 Insurer Data
We compile a data set of all U.S. property and liability insurers from the National Association
of Insurance Commissioners (NAIC) statutory annual report database over 23 years, 1992-
2014. This database is the most comprehensive source of insurer information available for the
U.S. insurance market. For each year, we collect the firm-line level premium and expense data
from the Insurance Expense Exhibit and firm-line-state level premium data from the Exhibit
of Premiums and Losses (“State Page”). The Exhibit of Premiums Written (Schedule T) is
used to identify whether an insurer is licensed in a state. Unlicensed insurers are exempt
from policy form and rate regulation and thus not affected by SERFF mandate.
7https://www.serff.com/documents/serff participation mandates.pdf.
7
3.3 Measuring Regulatory Compliance Costs
The direct costs of regulatory compliance under form and rate regulation for insurers include
the expenses, salaries, and consulting fees associated with making form and rate filings to
the state (Grace and Klein 2000; Leverty 2012).
The ideal data for studying compliance costs of product regulation would be insurer
expenses associated with regulatory compliance at the firm-line-state-year level since the
SERFF mandate is applied at the state-year level. The NAIC database, however, does not
provide a separate category of expenses for regulatory compliance, nor does it break down
expenses at the firm-line-state-year level. We address these challenges in two ways.
First, while we do not have a single expense item dedicated to regulatory compliance, all
compliance-related expenses are contained in the Acquisitions, Field Supervisions, and Col-
lection(AFSC) expenses and the general expenses reported by insurers. The AFSC expenses
consist of all expenses incurred in the production of new and renewal insurance business,
including operating costs of agencies and branches, writing new policy forms, data pro-
cessing, clerical, secretarial, office maintenance, supervisory, and executive duties. General
expenses are also relevant because they include all expenses that are not assigned to other
expense groups per the NAIC statutory accounting principles. Therefore, the combination
of the AFSC and general expenses captures all the expenses related to an insurer’s general
operation, including compliance costs.
To measure the compliance costs, we use the NAIC expense data to construct a general
expense ratio, which is the dependent variable in our regressions. This ratio is defined as:
General Expense Ratio =General Expenses Incurred + Other AFSC expenses Incurred
Net Premiums Written.
Note that these expenses also include costs that are not linked to regulatory compliance,
such as advertising, employee welfare, rent, and equipment. This does not impact the mea-
surement of compliance costs in the fixed effects models, as the models identify the change
8
in expenses, rather than the expenses themselves. To accurately measure the compliance
costs, we rely on an assumption: changes in the expenses (e.g., rent) that are unrelated to
complying with product regulation across firms, lines, and time are uncorrelated with the
SERFF mandate enforced by the state, which is plausibly true.
Second, since we estimate the costs of complying with product regulation at the firm-year
and firm-line-year level, we measure an insurer’s exposure to treatment, the SERFF mandate
at both levels. SERFF Proportion is the proportion of an insurer’s direct premiums written
in states with SERFF mandate.
We note that using the SERFF mandate rather than the actual insurer usage of SERFF
will likely bias the estimated effect of SERFF towards zero. This is because an insurer may
start using SERFF voluntarily before the mandate, and over 1,400 insurers were licenced to
use SERFF before any state mandated SERFF. In this case, the mandate will not impact
this insurer, and our estimates will be biased against finding a significant influence of SERFF
on insurer expenses, even if they exist.
3.4 Sample and Descriptive Statistics
Our final sample is an unbalanced panel of 2,813 insurers from 1992 to 2014. All lines,
except reinsurance and financial lines, are included in the sample.8 We then combine lines
with similar characteristics to obtain a total of 14 lines of business in the analysis.9
In constructing the sample, we exclude firms with negative assets or liabilities and those
with policyholder surplus less than $1 million. Risk retention groups are also excluded
because they are mostly exempt from regulation by nondomiciliary states (Born et al. 2009;
8We include the following lines: aircraft, auto physical damage, boiler and machinery, burglar and theft,commercial auto liability, commercial multiperil, earthquake, farmowners, fire and allied lines, glass, home-owners, inland marine, medical professional liability, ocean marine, other liability, personal auto liability,products liability and workers’ compensation. Financial lines (accident and health, credit, fidelity, financialguaranty, mortgage guaranty, surety, and warranty), considered nontraditional property-liability insurancelines (Deng et al. 2017), are excluded.
9The 14 combined lines are: commercial auto liability, commercial auto physical damage, commercialmulti peril, homeowners and farmowners, inland marine, medical professional liability, ocean marine, otherliability, private passenger auto liability, private passenger auto physical damage, products liability, specialliability, special property, and workers’ compensation. The categorization of lines is shown in Table A.5.
9
Leverty 2012). At the firm-line-year level, we require net premiums written to be at least
$100,000 and that total expenses and general expenses are positive. Expense ratios are
winsorized at the first and ninety-ninth percentile to reduce the effect of outliers.
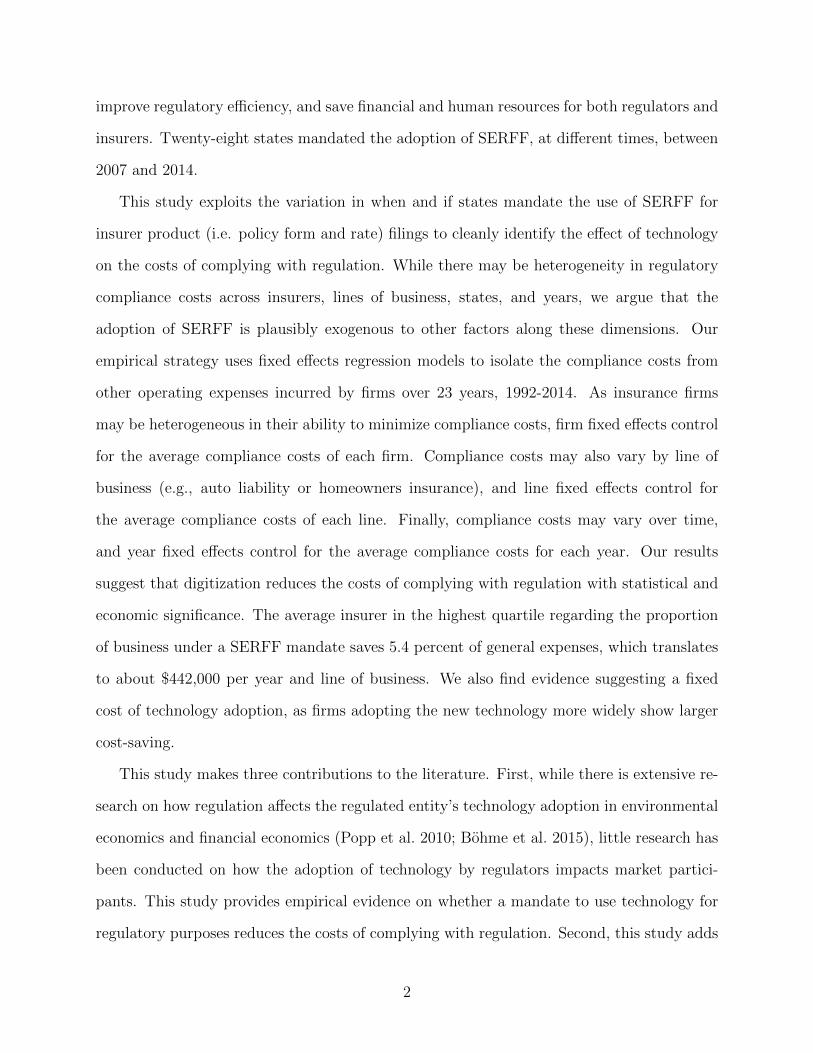
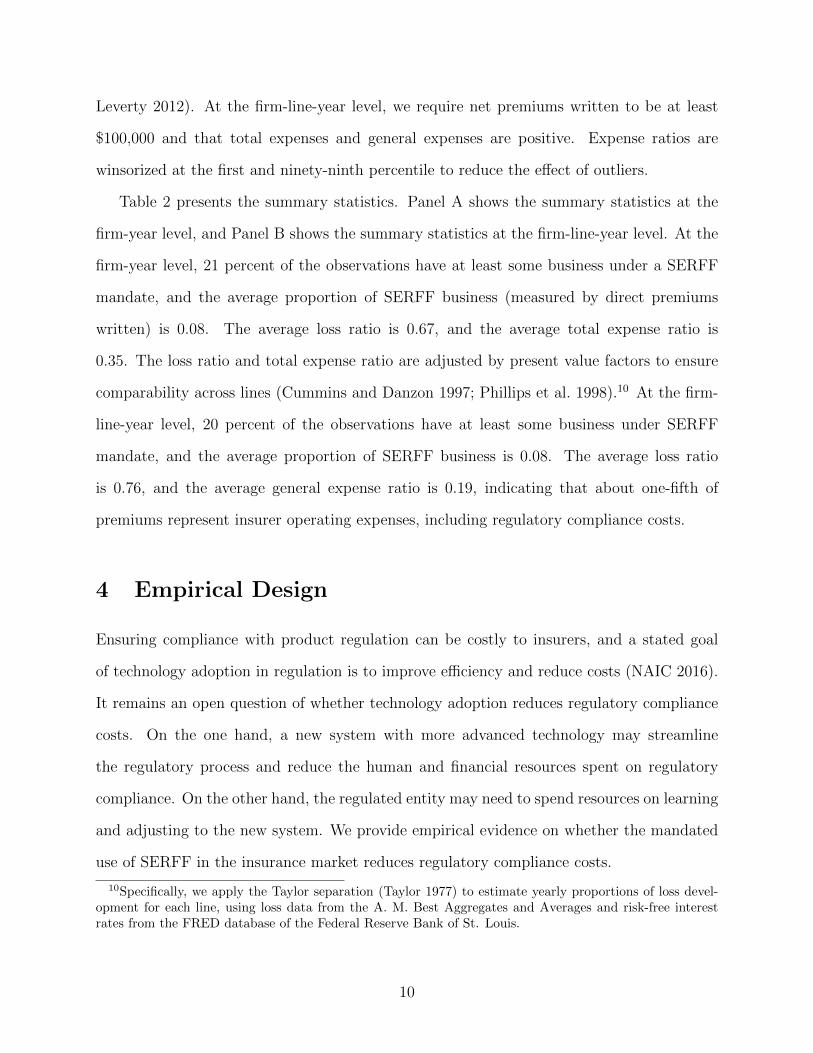
Table 2 presents the summary statistics. Panel A shows the summary statistics at the
firm-year level, and Panel B shows the summary statistics at the firm-line-year level. At the
firm-year level, 21 percent of the observations have at least some business under a SERFF
mandate, and the average proportion of SERFF business (measured by direct premiums
written) is 0.08. The average loss ratio is 0.67, and the average total expense ratio is
0.35. The loss ratio and total expense ratio are adjusted by present value factors to ensure
comparability across lines (Cummins and Danzon 1997; Phillips et al. 1998).10 At the firm-
line-year level, 20 percent of the observations have at least some business under SERFF
mandate, and the average proportion of SERFF business is 0.08. The average loss ratio
is 0.76, and the average general expense ratio is 0.19, indicating that about one-fifth of
premiums represent insurer operating expenses, including regulatory compliance costs.
4 Empirical Design
Ensuring compliance with product regulation can be costly to insurers, and a stated goal
of technology adoption in regulation is to improve efficiency and reduce costs (NAIC 2016).
It remains an open question of whether technology adoption reduces regulatory compliance
costs. On the one hand, a new system with more advanced technology may streamline
the regulatory process and reduce the human and financial resources spent on regulatory
compliance. On the other hand, the regulated entity may need to spend resources on learning
and adjusting to the new system. We provide empirical evidence on whether the mandated
use of SERFF in the insurance market reduces regulatory compliance costs.
10Specifically, we apply the Taylor separation (Taylor 1977) to estimate yearly proportions of loss devel-opment for each line, using loss data from the A. M. Best Aggregates and Averages and risk-free interestrates from the FRED database of the Federal Reserve Bank of St. Louis.
10
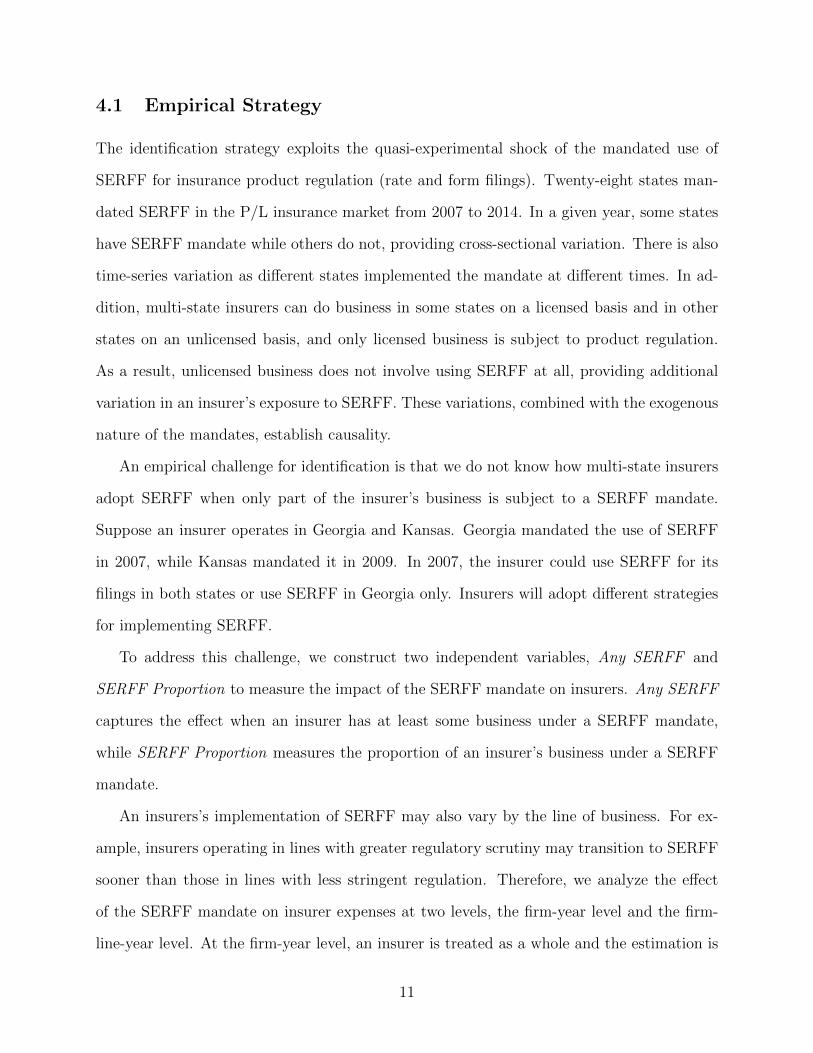
4.1 Empirical Strategy
The identification strategy exploits the quasi-experimental shock of the mandated use of
SERFF for insurance product regulation (rate and form filings). Twenty-eight states man-
dated SERFF in the P/L insurance market from 2007 to 2014. In a given year, some states
have SERFF mandate while others do not, providing cross-sectional variation. There is also
time-series variation as different states implemented the mandate at different times. In ad-
dition, multi-state insurers can do business in some states on a licensed basis and in other
states on an unlicensed basis, and only licensed business is subject to product regulation.
As a result, unlicensed business does not involve using SERFF at all, providing additional
variation in an insurer’s exposure to SERFF. These variations, combined with the exogenous
nature of the mandates, establish causality.
An empirical challenge for identification is that we do not know how multi-state insurers
adopt SERFF when only part of the insurer’s business is subject to a SERFF mandate.
Suppose an insurer operates in Georgia and Kansas. Georgia mandated the use of SERFF
in 2007, while Kansas mandated it in 2009. In 2007, the insurer could use SERFF for its
filings in both states or use SERFF in Georgia only. Insurers will adopt different strategies
for implementing SERFF.
To address this challenge, we construct two independent variables, Any SERFF and
SERFF Proportion to measure the impact of the SERFF mandate on insurers. Any SERFF
captures the effect when an insurer has at least some business under a SERFF mandate,
while SERFF Proportion measures the proportion of an insurer’s business under a SERFF
mandate.
An insurers’s implementation of SERFF may also vary by the line of business. For ex-
ample, insurers operating in lines with greater regulatory scrutiny may transition to SERFF
sooner than those in lines with less stringent regulation. Therefore, we analyze the effect
of the SERFF mandate on insurer expenses at two levels, the firm-year level and the firm-
line-year level. At the firm-year level, an insurer is treated as a whole and the estimation is
11
based on the assumption that the insurer does not adopt different strategies for implementing
SERFF across lines. At the firm-line-year level, the unit of analysis is a firm-line observation,
and the estimation is based on the assumption that an insurer’s strategy for implementing
SERFF in one line is independent of its strategy in another line. We recognize that neither
assumption holds perfectly in the real world, and the reality may lie somewhere in between.
Therefore, these two frameworks complement each other and when combined, they provide
an upper and a lower bound of the estimate of SERFF’s effect on insurer expenses.
Our coefficient estimates on the effect of technology adoption may be biased towards
zero for two reasons. First, insurers can transition to SERFF before the SERFF mandate is
enacted. Second, insurers in Florida may use other digital platforms to file rates and policy
forms, but our measures of technology adoption only captures the use of SERFF. In both
cases, there will be measurement errors that would bias us against finding any significant
effect of technology adoption on insurer expenses.
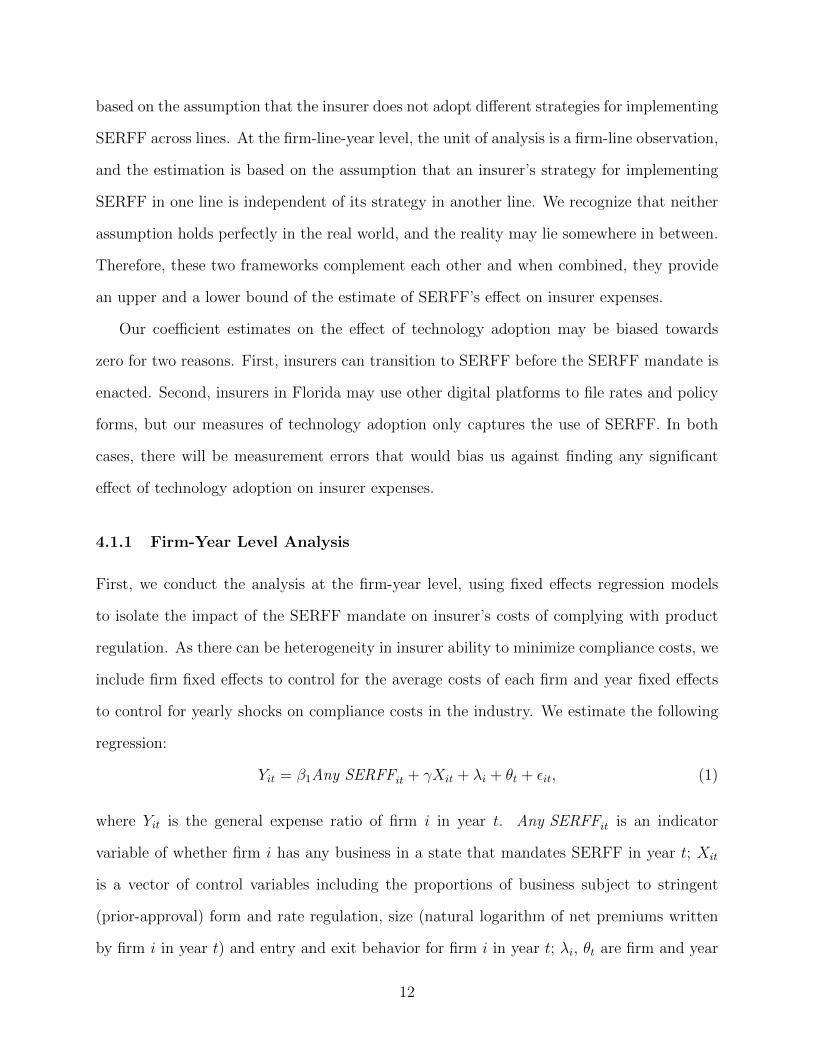
4.1.1 Firm-Year Level Analysis
First, we conduct the analysis at the firm-year level, using fixed effects regression models
to isolate the impact of the SERFF mandate on insurer’s costs of complying with product
regulation. As there can be heterogeneity in insurer ability to minimize compliance costs, we
include firm fixed effects to control for the average costs of each firm and year fixed effects
to control for yearly shocks on compliance costs in the industry. We estimate the following
regression:
Yit = β1Any SERFFit + γXit + λi + θt + εit, (1)
where Yit is the general expense ratio of firm i in year t. Any SERFFit is an indicator
variable of whether firm i has any business in a state that mandates SERFF in year t; Xit
is a vector of control variables including the proportions of business subject to stringent
(prior-approval) form and rate regulation, size (natural logarithm of net premiums written
by firm i in year t) and entry and exit behavior for firm i in year t; λi, θt are firm and year
12
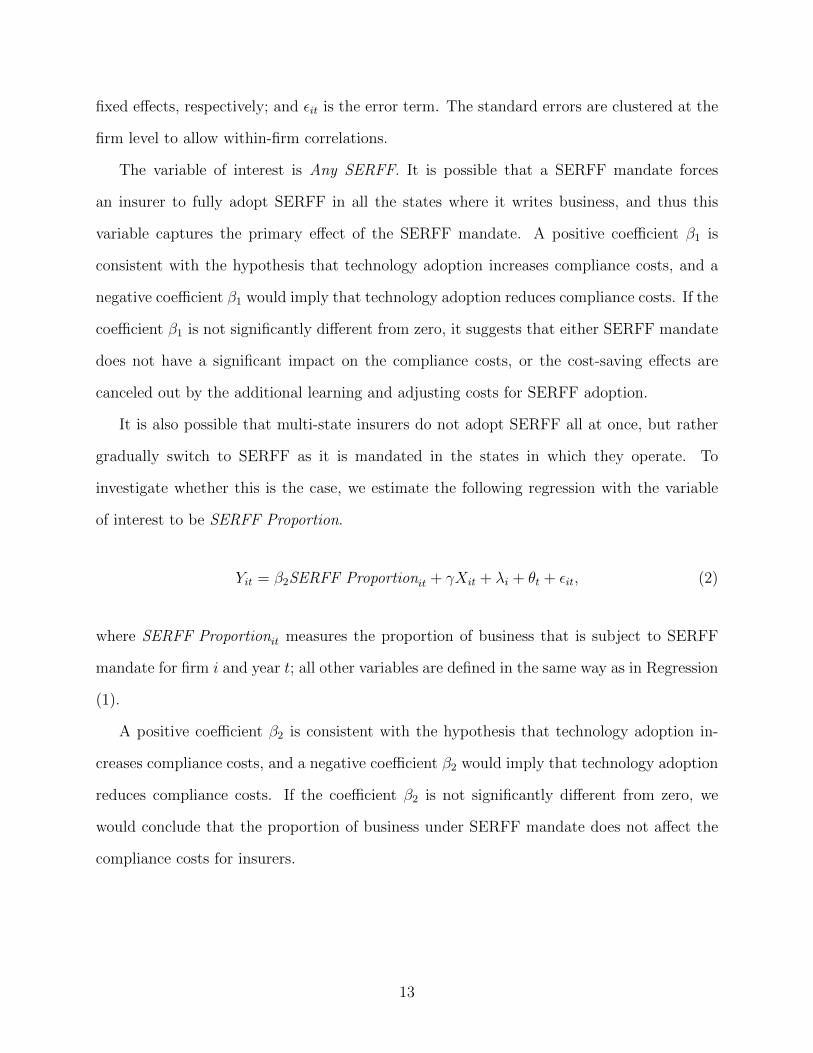
fixed effects, respectively; and εit is the error term. The standard errors are clustered at the
firm level to allow within-firm correlations.
The variable of interest is Any SERFF. It is possible that a SERFF mandate forces
an insurer to fully adopt SERFF in all the states where it writes business, and thus this
variable captures the primary effect of the SERFF mandate. A positive coefficient β1 is
consistent with the hypothesis that technology adoption increases compliance costs, and a
negative coefficient β1 would imply that technology adoption reduces compliance costs. If the
coefficient β1 is not significantly different from zero, it suggests that either SERFF mandate
does not have a significant impact on the compliance costs, or the cost-saving effects are
canceled out by the additional learning and adjusting costs for SERFF adoption.
It is also possible that multi-state insurers do not adopt SERFF all at once, but rather
gradually switch to SERFF as it is mandated in the states in which they operate. To
investigate whether this is the case, we estimate the following regression with the variable
of interest to be SERFF Proportion.
Yit = β2SERFF Proportionit + γXit + λi + θt + εit, (2)
where SERFF Proportionit measures the proportion of business that is subject to SERFF
mandate for firm i and year t; all other variables are defined in the same way as in Regression
(1).
A positive coefficient β2 is consistent with the hypothesis that technology adoption in-
creases compliance costs, and a negative coefficient β2 would imply that technology adoption
reduces compliance costs. If the coefficient β2 is not significantly different from zero, we
would conclude that the proportion of business under SERFF mandate does not affect the
compliance costs for insurers.
13

4.1.2 Firm-Line-Year Level Analysis
While the firm-year level analysis captures the SERFF effect on compliance costs for an
insurer as a whole, a multi-line insurer may implement SERFF differently across lines. To
explore the cross-line heterogeneity within a firm, we use the firm-line-year level data to esti-
mate the following regressions, adding line fixed effects to control for the average compliance
costs within each line of business:
Yilt = β1Any SERFFilt + γXilt + λi + δl + θt + εilt, (3)
Yilt = β1SERFF Proportionilt + γXilt + λi + δl + θt + εilt, (4)
where Yilt is the general expense ratio of firm i in line l and year t. Any SERFFilt is an
indicator variable of whether firm i has any business in a state that mandates SERFF in
line l and year t; Xilt is a vector of control variables including the proportions of business
subject to stringent (prior-approval) form and rate regulation, size (natural logarithm of net
premiums written by firm i in line l and year t) and entry and exit behavior for firm i in
line l and year t; λi, δl, and θt are firm, line, and year fixed effects, respectively; and εilt
is the error term. The standard errors are clustered at the firm level to allow within-firm
correlations.
5 Effects of Technology Adoption on Regulatory Com-
pliance Costs
5.1 Firm-Year Level Results
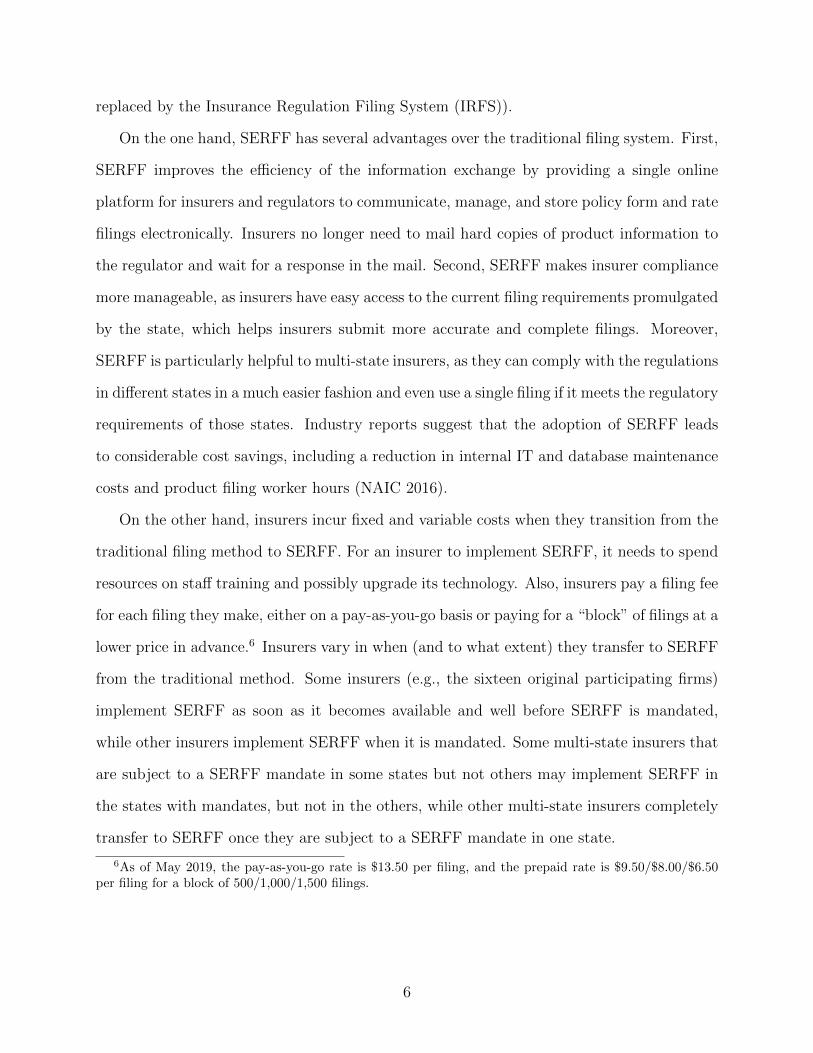
Table 3 shows the results of the firm-year level regressions. The primary finding is that
SERFF reduces insurer expenses. In Regression (1), the coefficient on Any SERFF is neg-
ative and statistically significant at the 5 percent level. Given that the average expense
14

ratio in the sample is 0.205, the coefficient (-0.013) implies that a SERFF mandate in at
least one state in which an insurer operates lowers the average insurer’s expense ratio by
6.34% (-0.013/0.205 = -6.34%). For the average firm in our sample, which has net premiums
written of $206.34 million, the cost savings associated with a SERFF mandate is $2,682,000
per year. In Regression (2), the coefficient on SERFF Proportion (-0.022) is negative and
statistically significant at the 5 percent level, suggesting a negative relationship between the
proportion of business subject to a SERFF mandate and insurer expenses. For the aver-
age insurer, a 50% increase in SERFF Proportion translates to a reduction of $2,270,000 in
general expenses per year.
To explore the possibility of a nonlinear effect of SERFF Proportion, we include SERFF
Proportion Squared in Regression (3). The coefficients on SERFF Proportion and SERFF
Proportion Squared are -0.098 and 0.081 respectively, and both coefficients are statistically
significant at the 5 percent level. The fitted quadratic function of SERFF Proportion is a
U-shaped curve, which achieves a minimum at 0.605 (0.098/(2*0.081) = 0.605). Thus, the
expense saving effect of SERFF is the strongest when an insurer’s SERFF Proportion equals
0.605.
In Regression (4), we further explore the effects of different proportions of SERFF busi-
ness by regressing the general expense ratio on quartile indicator variables of SERFF Propor-
tion, and the reference group is the insurers who have no business that is subject to a SERFF
mandate. The coefficients on the second, third, and fourth quartile of SERFF Proportion
are -0.016, -0.025, and -0.020, and statistically significant at the 10, 1, and 5 percent levels,
respectively. Pairwise F-tests show that the coefficients on Q2, Q3, and Q4 are statistically
significantly different from Q1 at the 5 percent level, while these three coefficients are not
significantly different from each other. If an insurer’s SERFF Proportion is in the second
quartile of the distribution, its expenses are, on average, lower than an insurer that has no
business that is subject to a SERFF mandate by 0.016, an effect size of 7.80%. The effect
sizes for the third and fourth quartile are 12.20% and 9.76%, respectively. For the average
15
insurer, moving from no business subject to a SERFF mandate to the second quartile trans-
lates to a reduction of $3,301,000 in expenses per year. The corresponding economic effects
for the third and fourth quartile are $5,159,000 and $4,127,000.
In Regressions (5)-(8), we add the proportions of business in each line of insurance to
control for possible heterogeneity across lines within a firm-year. The results are robust to the
inclusion of insurer business mix. We also find evidence of economies of scale in regulatory
compliance, as the coefficient on Firm Size is negative and statistically significant. Also,
we find that insurer expenses increase with the number of states in which it does business,
which is consistent with previous literature on the costs of complying with multiple insurance
regulators (Grace and Klein 2000; Leverty 2012).
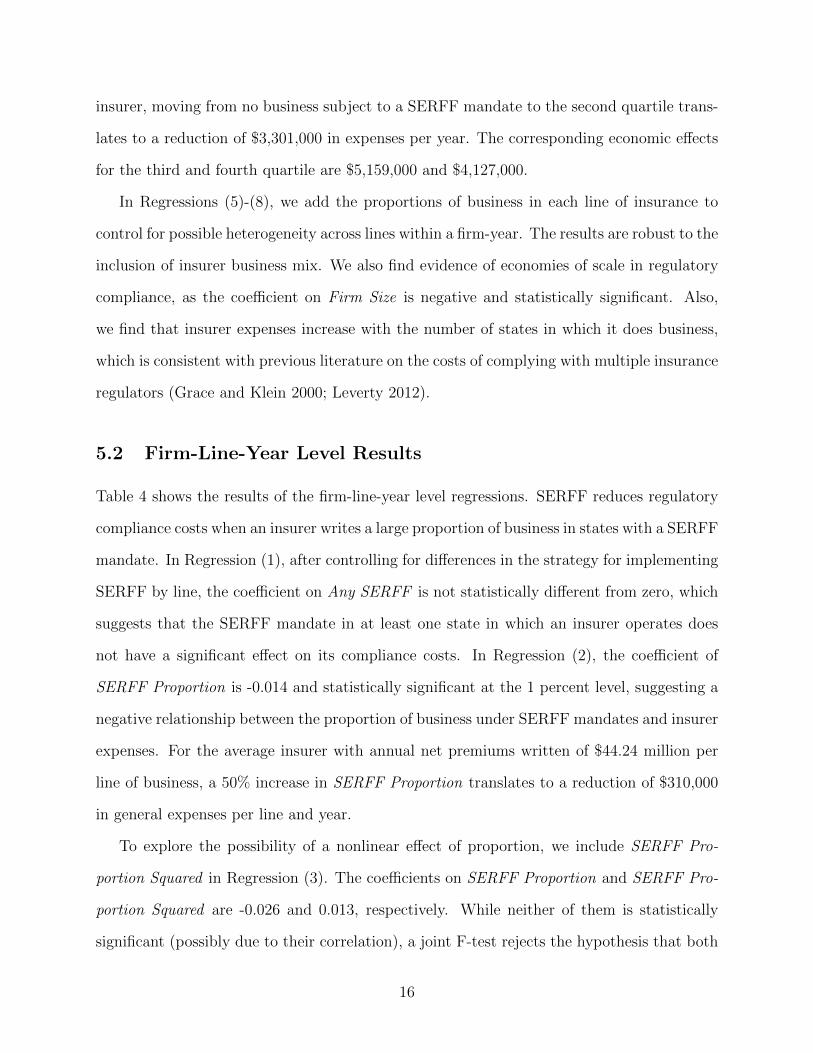
5.2 Firm-Line-Year Level Results
Table 4 shows the results of the firm-line-year level regressions. SERFF reduces regulatory
compliance costs when an insurer writes a large proportion of business in states with a SERFF
mandate. In Regression (1), after controlling for differences in the strategy for implementing
SERFF by line, the coefficient on Any SERFF is not statistically different from zero, which
suggests that the SERFF mandate in at least one state in which an insurer operates does
not have a significant effect on its compliance costs. In Regression (2), the coefficient of
SERFF Proportion is -0.014 and statistically significant at the 1 percent level, suggesting a
negative relationship between the proportion of business under SERFF mandates and insurer
expenses. For the average insurer with annual net premiums written of $44.24 million per
line of business, a 50% increase in SERFF Proportion translates to a reduction of $310,000
in general expenses per line and year.
To explore the possibility of a nonlinear effect of proportion, we include SERFF Pro-
portion Squared in Regression (3). The coefficients on SERFF Proportion and SERFF Pro-
portion Squared are -0.026 and 0.013, respectively. While neither of them is statistically
significant (possibly due to their correlation), a joint F-test rejects the hypothesis that both
16
coefficients are equal to zero (p-value = 0.02), suggesting that the inclusion of these two
variables provides power in explaining the general expense ratio.
In Regression (4), which includes the four quartiles of SERFF Proportion, the coefficient
on the indicator of the first quartile (SERFF Proportion between 0 and 0.10) is 0.008 and
statistically significant at the 5 percent level. The coefficient on the indicator of the fourth
quartile (SERFF Proportion between 0.64 and 1) is -0.010 and statistically significant at the
5 percent level. Pairwise F-tests show that the coefficient on the first quartile indicator is
significantly different from other quartiles at the 1 percent level, and the second, third, and
fourth quartile indicators do not differ from each other. Compared to an insurer who does not
have any business under a SERFF mandate, the general expense ratio of the average insurer
with a proportion of SERFF business that is in the fourth quartile (SERFF Proportion
between 0.64 and 1) is lower by 0.010, an effect size of 5.35% (0.010/0.187 = 5.35%). This
translates to $442,000 per year for an average firm-line observation in the fourth quartile.
In Regressions (5)-(8), we add the square of Number of States to control for possible
nonlinear effects of the number of states on compliance costs. The results are largely un-
changed, except that the coefficient on SERFF QT=1 is not significantly different from zero
in Regression (8). Overall, the results suggest that there are fixed costs associated with
adopting the technology, but cost savings emerge as SERFF is implemented more widely by
the insurer.
6 Conclusion
This study examines a quasi-natural state-level experiment of technology adoption in product
regulation in the U.S. P/L insurance industry. We find evidence suggesting that mandated
use of an internet application, SERFF, reduces insurer expenses. The effect of SERFF
mandate seems to be nonlinear: it imposes additional costs when the insurer starts using
SERFF for policy form and rate filings, and the expense savings appear after the insurer
17
applies SERFF on a sufficiently large proportion of business.
At the firm-year level, the estimated cost savings of SERFF for an average firm in the
fourth quartile of the distribution of business subject to a SERFF mandate is 9.76%, and
on the firm-line-year level the estimate is 5.35%. A possible explanation of the difference
between these two estimates is that we do not know to what extent insurers implement
SERFF differently across lines. If insurers always implement SERFF simultaneously across
all the lines that they write in, the estimate of 9.76% might be closer to the real effect size, but
if insurers implement SERFF differently across lines, the estimate of 5.35% would be more
reliable. Importantly, since we only observe the years when SERFF was mandated by the
states rather than the time of SERFF implementation by the insurers, both estimates might
be understating the actual cost-saving effect of SERFF due to the measurement error. In
summary, our findings indicate that digitization significantly reduces the costs of complying
with regulation.
18

References
Bohme, R., N. Christin, B. Edelman, and T. Moore (2015). Bitcoin: Economics, technology,
and governance. Journal of Economic Perspectives 29 (2), 213–38.
Born, P., M. M. Boyer, and M. M. Barth (2009). Risk retention groups in medical malpractice
insurance: A test of the national chartering option. Journal of Insurance Regulation 27 (4).
Bureau of Economic Analysis (2017). Gross Domestic Product: Fourth Quarter and An-
nual 2016 (Third Estimate) Corporate Profits: Fourth Quarter and Annual 2016. U.S.
Department of Commerce.
Cummins, J. D. and P. M. Danzon (1997). Price, financial quality, and capital flows in
insurance markets. Journal of financial intermediation 6 (1), 3–38.
Deng, Y., J. T. Leverty, and G. H. Zanjani (2017). Market discipline and government
guarantees: Evidence from the insurance industry. Available at SSRN 2736397 .
Federal Insurance Office (2017). Annual Report on the Insurance Industry. U.S. Department
of the Treasury.
Goldfarb, A., S. M. Greenstein, and C. E. Tucker (2015). Economic analysis of the digital
economy. University of Chicago Press.
Goldfarb, A. and C. Tucker (2019). Digital economics. Journal of Economic Literature 57 (1),
3–43.
Grace, M. F. and R. W. Klein (2000). Efficiency implications of alternative regulatory
structures for insurance. In Optional Federal Chartering and Regulation of Insurance
Companies, pp. 79–131. American Enterprise Institute.
Klein, R. W. (2005). A Regulator’s Introduction to the Insurance Industry. National Asso-
ciation Of Insurance Commissioners.
19
Leverty, J. T. (2012). The cost of duplicative regulation: evidence from risk retention groups.
Journal of Risk and Insurance 79 (1), 105–128.
Leverty, J. T. and J. Liu (2019). Compliance costs of contract regulation. Working Paper .
NAIC (2016). Product Filing Review Handbook. National Association of Insurance Commis-
sioners.
Phillips, R. D., J. D. Cummins, and F. Allen (1998). Financial pricing of insurance in the
multiple-line insurance company. Journal of Risk and Insurance 65 (4), 597–636.
Popp, D., R. G. Newell, and A. B. Jaffe (2010). Energy, the environment, and technological
change. In Handbook of the Economics of Innovation, Volume 2, pp. 873–937. Elsevier.
Pottier, S. W. (2011). Life insurer efficiency and state regulation: evidence of optimal firm
behavior. Journal of Regulatory Economics 39 (2), 169–193.
Taylor, G. C. (1977). Separation of inflation and other effects from the distribution of non-life
insurance claim delays. ASTIN Bulletin: The Journal of the IAA 9 (1-2), 219–230.
20
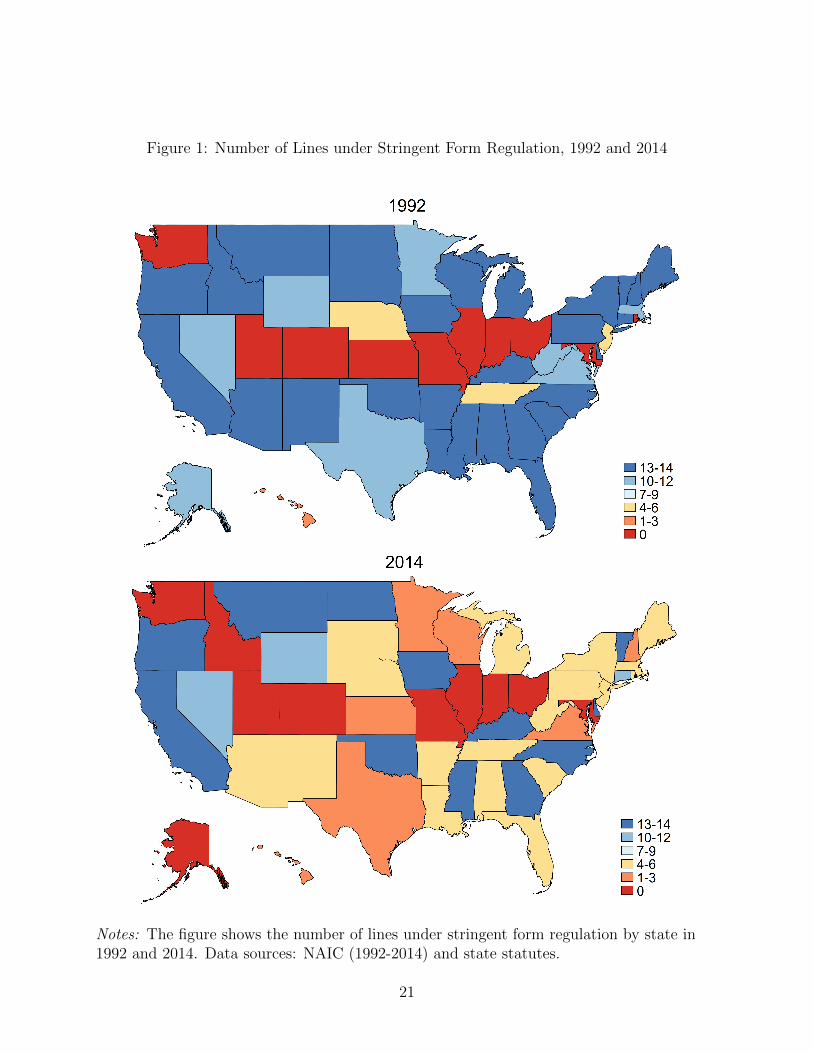
Figure 1: Number of Lines under Stringent Form Regulation, 1992 and 2014
Notes: The figure shows the number of lines under stringent form regulation by state in1992 and 2014. Data sources: NAIC (1992-2014) and state statutes.
21
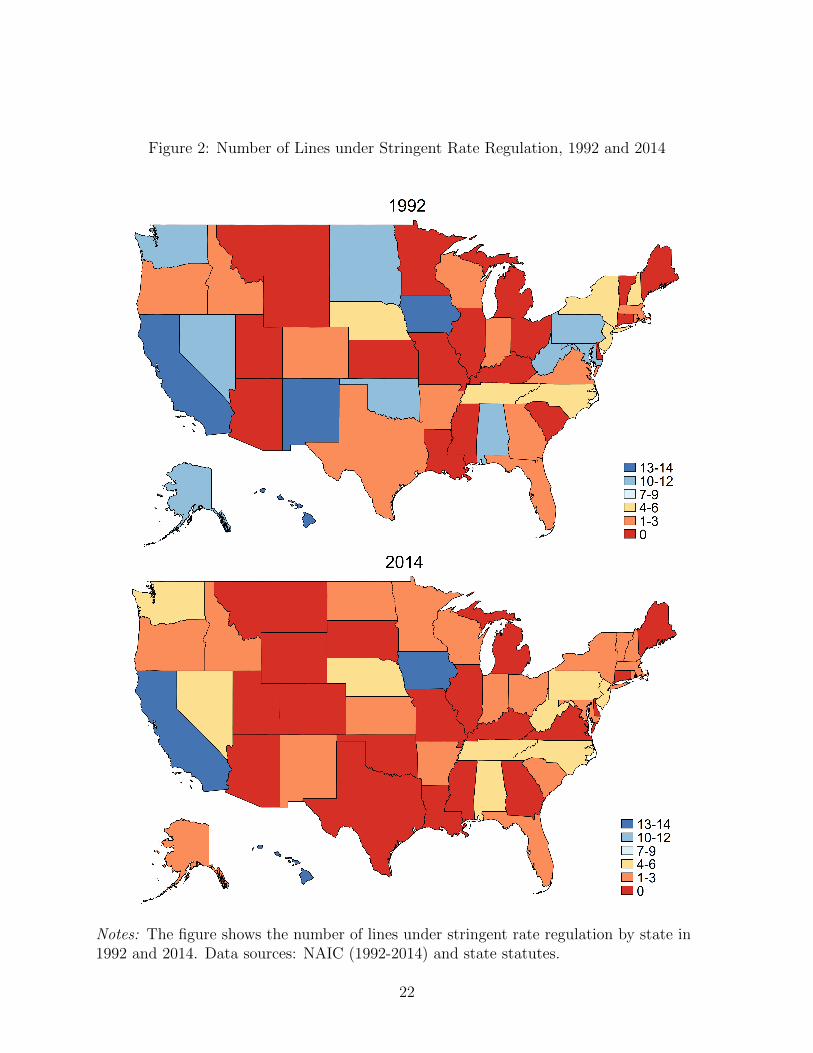
Figure 2: Number of Lines under Stringent Rate Regulation, 1992 and 2014
Notes: The figure shows the number of lines under stringent rate regulation by state in1992 and 2014. Data sources: NAIC (1992-2014) and state statutes.
22
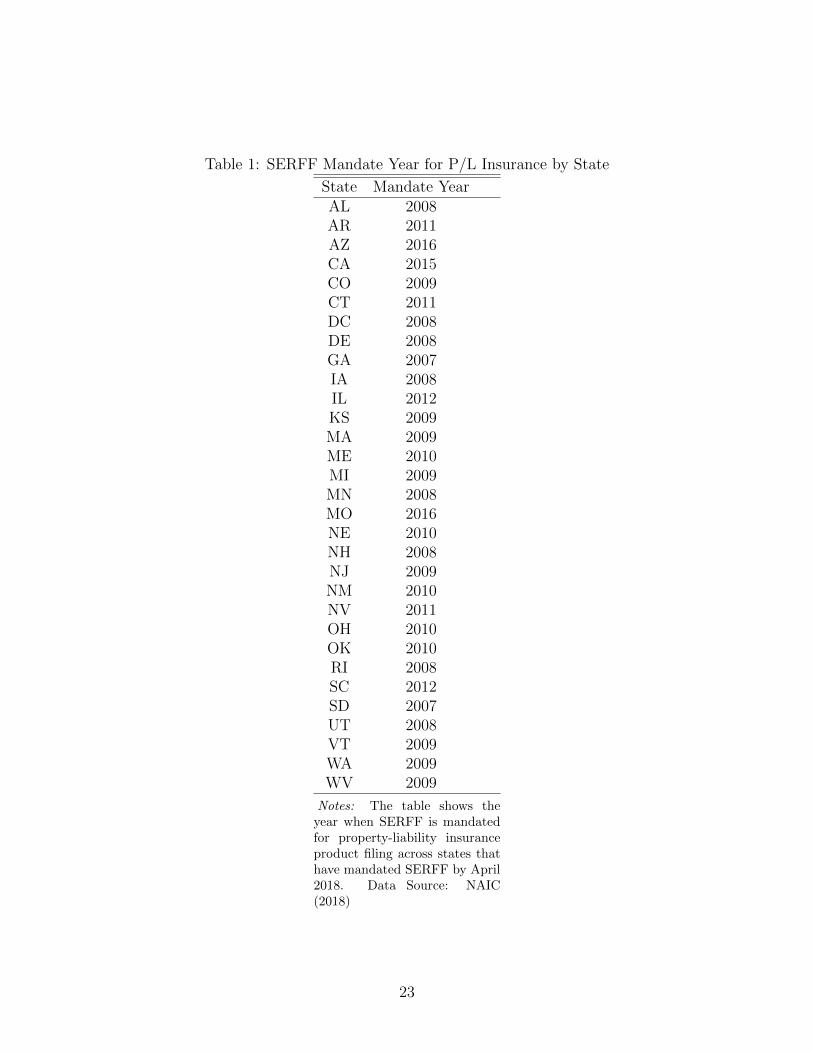
Table 1: SERFF Mandate Year for P/L Insurance by State
State Mandate YearAL 2008AR 2011AZ 2016CA 2015CO 2009CT 2011DC 2008DE 2008GA 2007IA 2008IL 2012KS 2009MA 2009ME 2010MI 2009MN 2008MO 2016NE 2010NH 2008NJ 2009NM 2010NV 2011OH 2010OK 2010RI 2008SC 2012SD 2007UT 2008VT 2009WA 2009WV 2009
Notes: The table shows theyear when SERFF is mandatedfor property-liability insuranceproduct filing across states thathave mandated SERFF by April2018. Data Source: NAIC(2018)
23
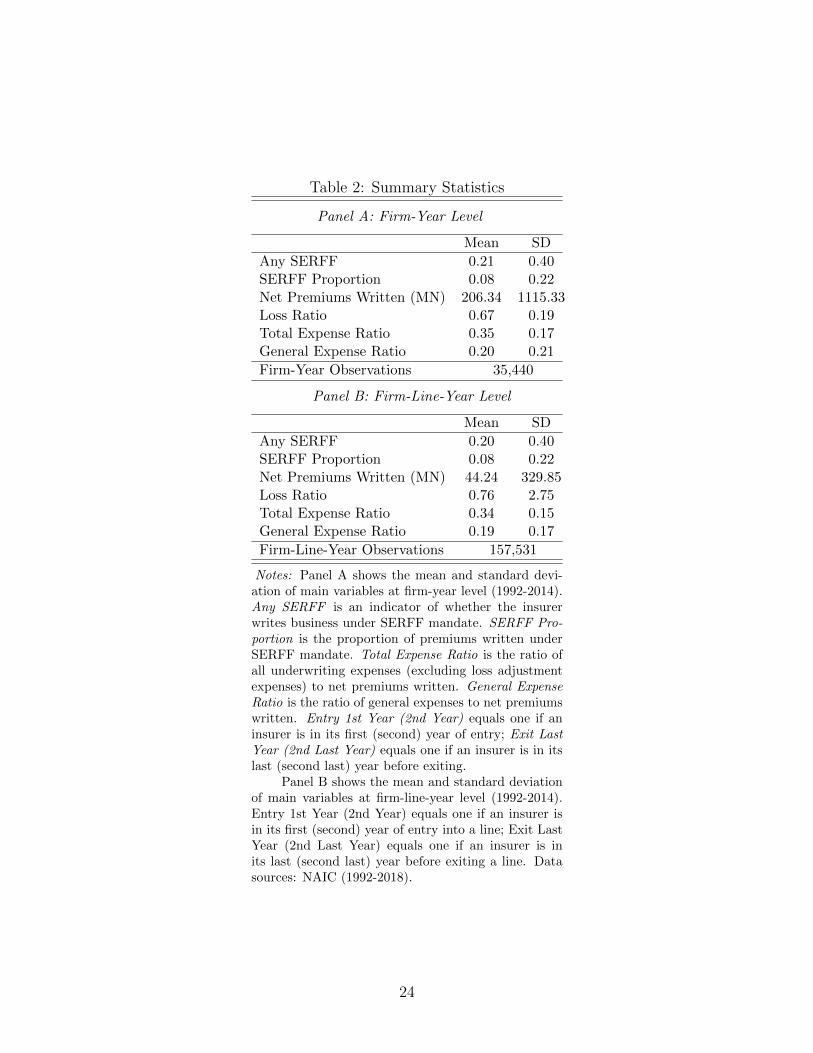
Table 2: Summary Statistics
Panel A: Firm-Year Level
Mean SD
Any SERFF 0.21 0.40SERFF Proportion 0.08 0.22Net Premiums Written (MN) 206.34 1115.33Loss Ratio 0.67 0.19Total Expense Ratio 0.35 0.17General Expense Ratio 0.20 0.21
Firm-Year Observations 35,440
Panel B: Firm-Line-Year Level
Mean SD
Any SERFF 0.20 0.40SERFF Proportion 0.08 0.22Net Premiums Written (MN) 44.24 329.85Loss Ratio 0.76 2.75Total Expense Ratio 0.34 0.15General Expense Ratio 0.19 0.17
Firm-Line-Year Observations 157,531
Notes: Panel A shows the mean and standard devi-ation of main variables at firm-year level (1992-2014).Any SERFF is an indicator of whether the insurerwrites business under SERFF mandate. SERFF Pro-portion is the proportion of premiums written underSERFF mandate. Total Expense Ratio is the ratio ofall underwriting expenses (excluding loss adjustmentexpenses) to net premiums written. General ExpenseRatio is the ratio of general expenses to net premiumswritten. Entry 1st Year (2nd Year) equals one if aninsurer is in its first (second) year of entry; Exit LastYear (2nd Last Year) equals one if an insurer is in itslast (second last) year before exiting.
Panel B shows the mean and standard deviationof main variables at firm-line-year level (1992-2014).Entry 1st Year (2nd Year) equals one if an insurer isin its first (second) year of entry into a line; Exit LastYear (2nd Last Year) equals one if an insurer is inits last (second last) year before exiting a line. Datasources: NAIC (1992-2018).
24
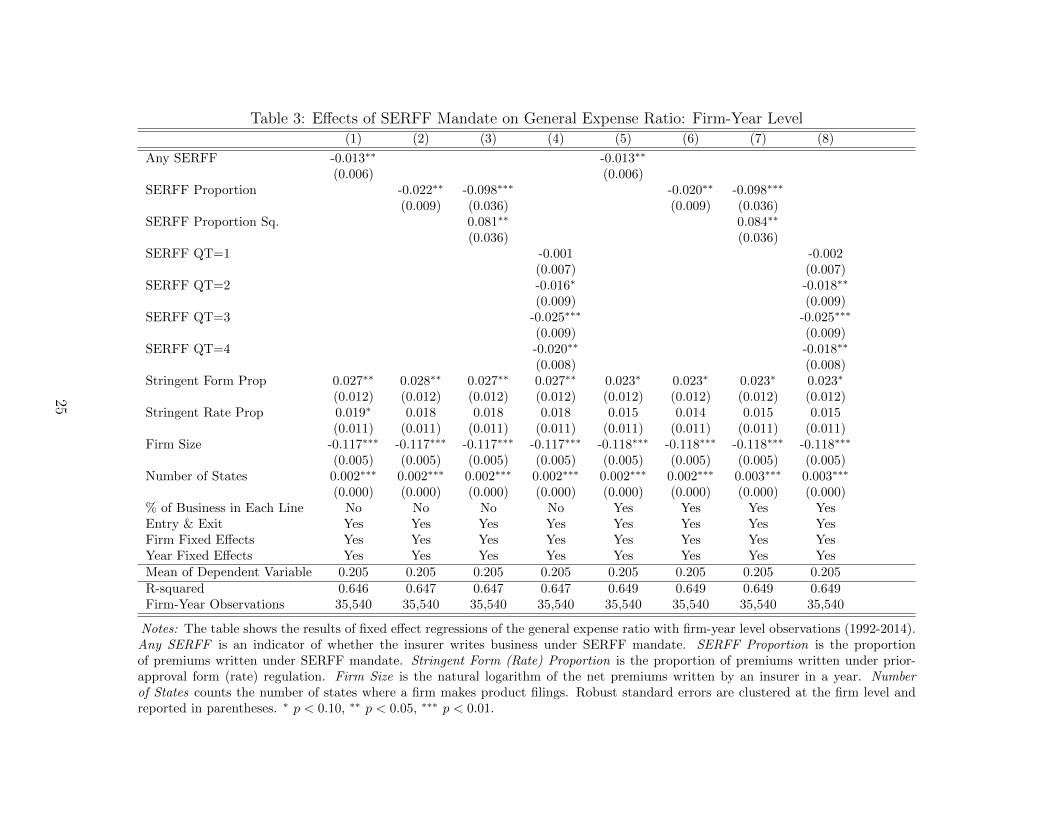
Table 3: Effects of SERFF Mandate on General Expense Ratio: Firm-Year Level(1) (2) (3) (4) (5) (6) (7) (8)
Any SERFF -0.013∗∗ -0.013∗∗
(0.006) (0.006)SERFF Proportion -0.022∗∗ -0.098∗∗∗ -0.020∗∗ -0.098∗∗∗
(0.009) (0.036) (0.009) (0.036)SERFF Proportion Sq. 0.081∗∗ 0.084∗∗
(0.036) (0.036)SERFF QT=1 -0.001 -0.002
(0.007) (0.007)SERFF QT=2 -0.016∗ -0.018∗∗
(0.009) (0.009)SERFF QT=3 -0.025∗∗∗ -0.025∗∗∗
(0.009) (0.009)SERFF QT=4 -0.020∗∗ -0.018∗∗
(0.008) (0.008)Stringent Form Prop 0.027∗∗ 0.028∗∗ 0.027∗∗ 0.027∗∗ 0.023∗ 0.023∗ 0.023∗ 0.023∗
(0.012) (0.012) (0.012) (0.012) (0.012) (0.012) (0.012) (0.012)Stringent Rate Prop 0.019∗ 0.018 0.018 0.018 0.015 0.014 0.015 0.015
(0.011) (0.011) (0.011) (0.011) (0.011) (0.011) (0.011) (0.011)Firm Size -0.117∗∗∗ -0.117∗∗∗ -0.117∗∗∗ -0.117∗∗∗ -0.118∗∗∗ -0.118∗∗∗ -0.118∗∗∗ -0.118∗∗∗
(0.005) (0.005) (0.005) (0.005) (0.005) (0.005) (0.005) (0.005)Number of States 0.002∗∗∗ 0.002∗∗∗ 0.002∗∗∗ 0.002∗∗∗ 0.002∗∗∗ 0.002∗∗∗ 0.003∗∗∗ 0.003∗∗∗
(0.000) (0.000) (0.000) (0.000) (0.000) (0.000) (0.000) (0.000)% of Business in Each Line No No No No Yes Yes Yes YesEntry & Exit Yes Yes Yes Yes Yes Yes Yes YesFirm Fixed Effects Yes Yes Yes Yes Yes Yes Yes YesYear Fixed Effects Yes Yes Yes Yes Yes Yes Yes YesMean of Dependent Variable 0.205 0.205 0.205 0.205 0.205 0.205 0.205 0.205R-squared 0.646 0.647 0.647 0.647 0.649 0.649 0.649 0.649Firm-Year Observations 35,540 35,540 35,540 35,540 35,540 35,540 35,540 35,540
Notes: The table shows the results of fixed effect regressions of the general expense ratio with firm-year level observations (1992-2014).Any SERFF is an indicator of whether the insurer writes business under SERFF mandate. SERFF Proportion is the proportionof premiums written under SERFF mandate. Stringent Form (Rate) Proportion is the proportion of premiums written under prior-approval form (rate) regulation. Firm Size is the natural logarithm of the net premiums written by an insurer in a year. Numberof States counts the number of states where a firm makes product filings. Robust standard errors are clustered at the firm level andreported in parentheses. ∗ p < 0.10, ∗∗ p < 0.05, ∗∗∗ p < 0.01.
25
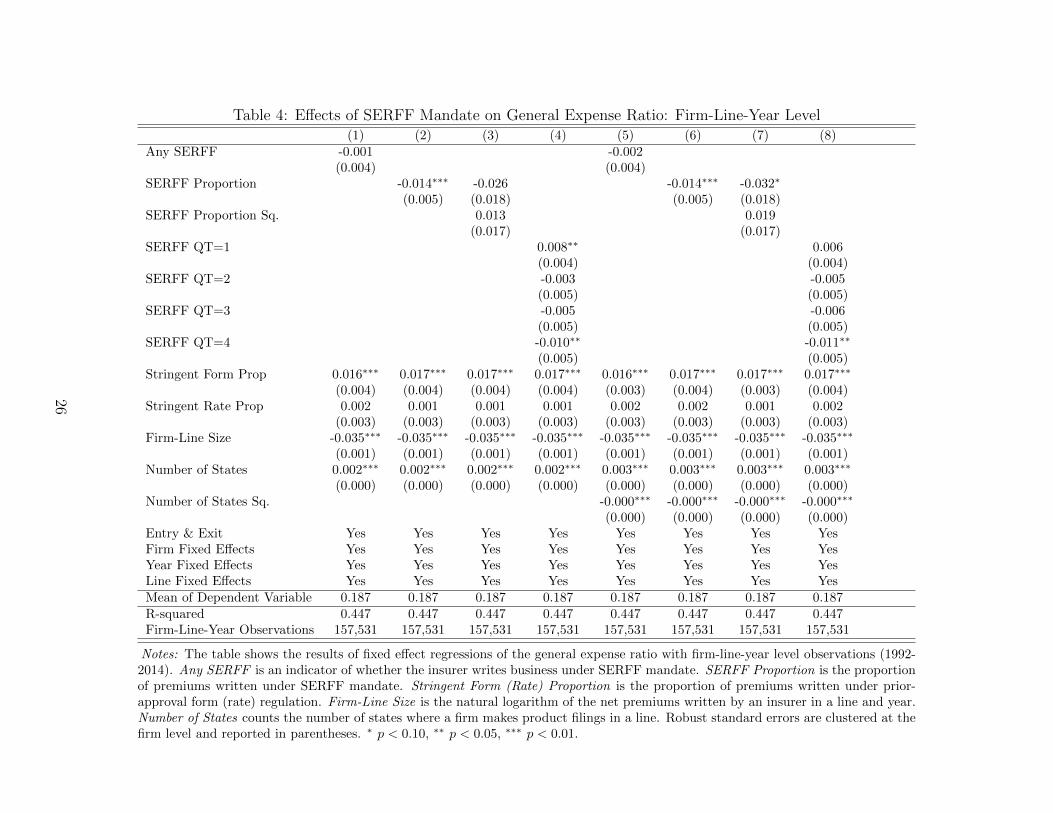
Table 4: Effects of SERFF Mandate on General Expense Ratio: Firm-Line-Year Level(1) (2) (3) (4) (5) (6) (7) (8)
Any SERFF -0.001 -0.002(0.004) (0.004)
SERFF Proportion -0.014∗∗∗ -0.026 -0.014∗∗∗ -0.032∗
(0.005) (0.018) (0.005) (0.018)SERFF Proportion Sq. 0.013 0.019
(0.017) (0.017)SERFF QT=1 0.008∗∗ 0.006
(0.004) (0.004)SERFF QT=2 -0.003 -0.005
(0.005) (0.005)SERFF QT=3 -0.005 -0.006
(0.005) (0.005)SERFF QT=4 -0.010∗∗ -0.011∗∗
(0.005) (0.005)Stringent Form Prop 0.016∗∗∗ 0.017∗∗∗ 0.017∗∗∗ 0.017∗∗∗ 0.016∗∗∗ 0.017∗∗∗ 0.017∗∗∗ 0.017∗∗∗
(0.004) (0.004) (0.004) (0.004) (0.003) (0.004) (0.003) (0.004)Stringent Rate Prop 0.002 0.001 0.001 0.001 0.002 0.002 0.001 0.002
(0.003) (0.003) (0.003) (0.003) (0.003) (0.003) (0.003) (0.003)Firm-Line Size -0.035∗∗∗ -0.035∗∗∗ -0.035∗∗∗ -0.035∗∗∗ -0.035∗∗∗ -0.035∗∗∗ -0.035∗∗∗ -0.035∗∗∗
(0.001) (0.001) (0.001) (0.001) (0.001) (0.001) (0.001) (0.001)Number of States 0.002∗∗∗ 0.002∗∗∗ 0.002∗∗∗ 0.002∗∗∗ 0.003∗∗∗ 0.003∗∗∗ 0.003∗∗∗ 0.003∗∗∗
(0.000) (0.000) (0.000) (0.000) (0.000) (0.000) (0.000) (0.000)Number of States Sq. -0.000∗∗∗ -0.000∗∗∗ -0.000∗∗∗ -0.000∗∗∗
(0.000) (0.000) (0.000) (0.000)Entry & Exit Yes Yes Yes Yes Yes Yes Yes YesFirm Fixed Effects Yes Yes Yes Yes Yes Yes Yes YesYear Fixed Effects Yes Yes Yes Yes Yes Yes Yes YesLine Fixed Effects Yes Yes Yes Yes Yes Yes Yes YesMean of Dependent Variable 0.187 0.187 0.187 0.187 0.187 0.187 0.187 0.187R-squared 0.447 0.447 0.447 0.447 0.447 0.447 0.447 0.447Firm-Line-Year Observations 157,531 157,531 157,531 157,531 157,531 157,531 157,531 157,531
Notes: The table shows the results of fixed effect regressions of the general expense ratio with firm-line-year level observations (1992-2014). Any SERFF is an indicator of whether the insurer writes business under SERFF mandate. SERFF Proportion is the proportionof premiums written under SERFF mandate. Stringent Form (Rate) Proportion is the proportion of premiums written under prior-approval form (rate) regulation. Firm-Line Size is the natural logarithm of the net premiums written by an insurer in a line and year.Number of States counts the number of states where a firm makes product filings in a line. Robust standard errors are clustered at thefirm level and reported in parentheses. ∗ p < 0.10, ∗∗ p < 0.05, ∗∗∗ p < 0.01.
26
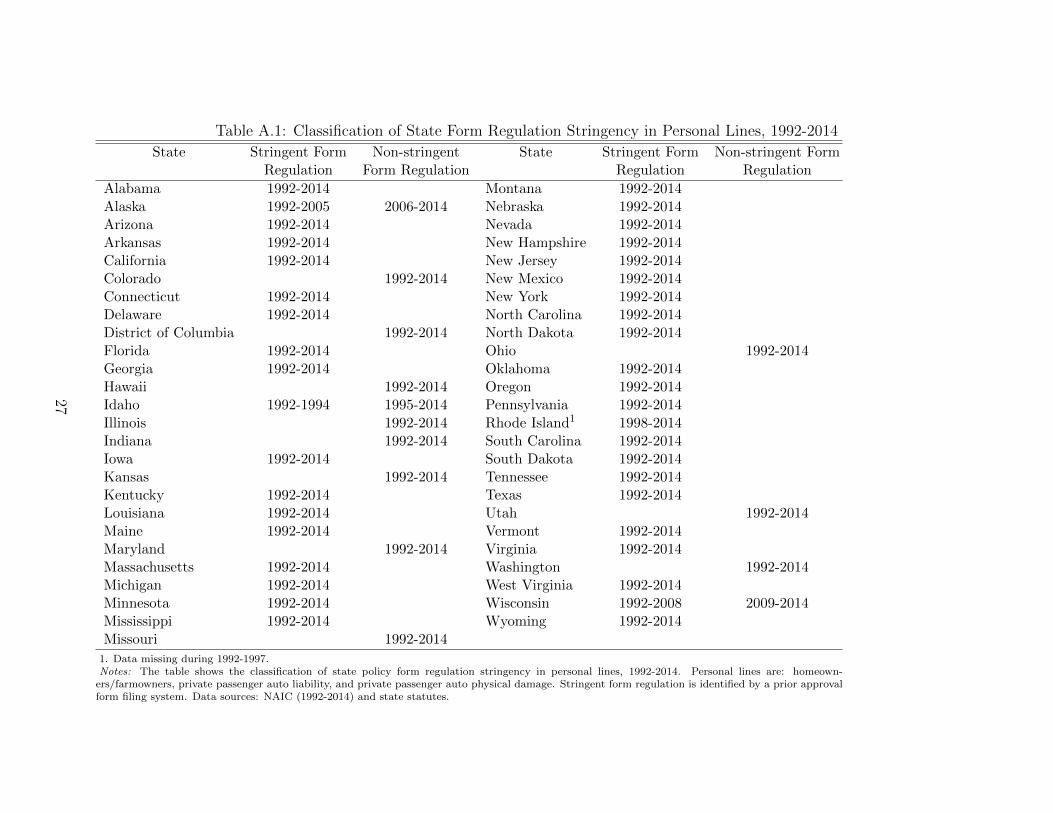
Table A.1: Classification of State Form Regulation Stringency in Personal Lines, 1992-2014
State Stringent Form Non-stringent State Stringent Form Non-stringent FormRegulation Form Regulation Regulation Regulation
Alabama 1992-2014 Montana 1992-2014Alaska 1992-2005 2006-2014 Nebraska 1992-2014Arizona 1992-2014 Nevada 1992-2014Arkansas 1992-2014 New Hampshire 1992-2014California 1992-2014 New Jersey 1992-2014Colorado 1992-2014 New Mexico 1992-2014Connecticut 1992-2014 New York 1992-2014Delaware 1992-2014 North Carolina 1992-2014District of Columbia 1992-2014 North Dakota 1992-2014Florida 1992-2014 Ohio 1992-2014Georgia 1992-2014 Oklahoma 1992-2014Hawaii 1992-2014 Oregon 1992-2014Idaho 1992-1994 1995-2014 Pennsylvania 1992-2014Illinois 1992-2014 Rhode Island1 1998-2014Indiana 1992-2014 South Carolina 1992-2014Iowa 1992-2014 South Dakota 1992-2014Kansas 1992-2014 Tennessee 1992-2014Kentucky 1992-2014 Texas 1992-2014Louisiana 1992-2014 Utah 1992-2014Maine 1992-2014 Vermont 1992-2014Maryland 1992-2014 Virginia 1992-2014Massachusetts 1992-2014 Washington 1992-2014Michigan 1992-2014 West Virginia 1992-2014Minnesota 1992-2014 Wisconsin 1992-2008 2009-2014Mississippi 1992-2014 Wyoming 1992-2014Missouri 1992-2014
1. Data missing during 1992-1997.Notes: The table shows the classification of state policy form regulation stringency in personal lines, 1992-2014. Personal lines are: homeown-
ers/farmowners, private passenger auto liability, and private passenger auto physical damage. Stringent form regulation is identified by a prior approvalform filing system. Data sources: NAIC (1992-2014) and state statutes.
27
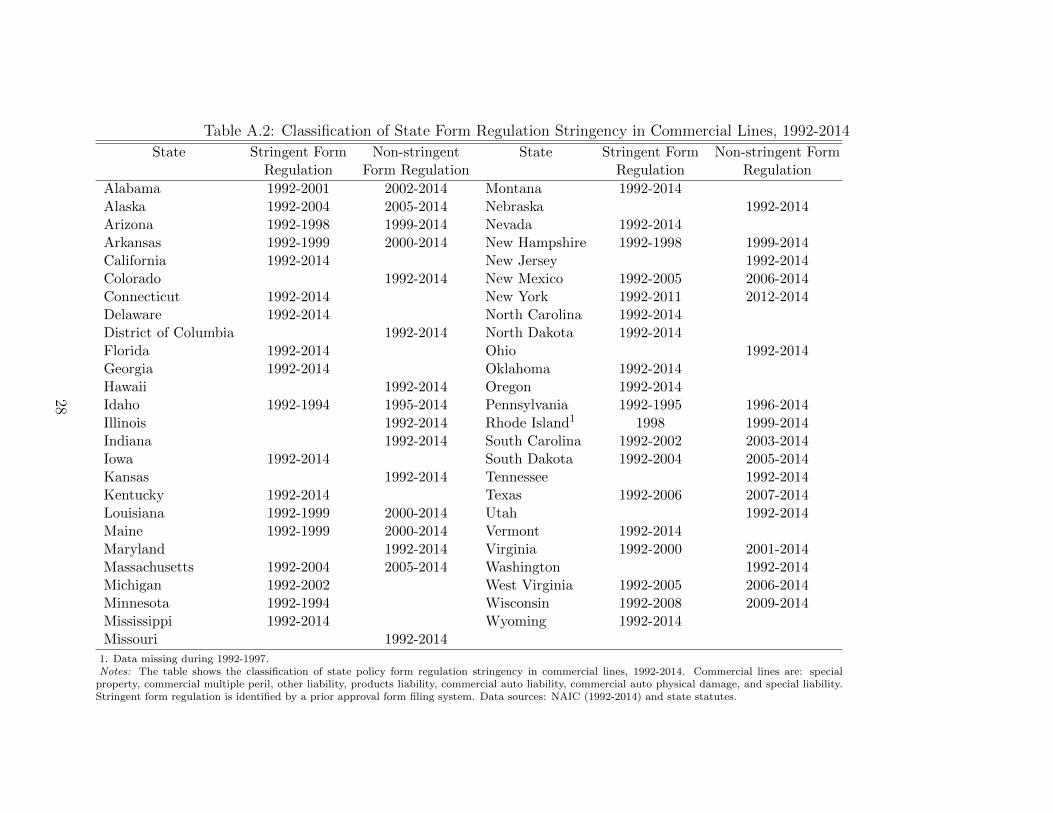
Table A.2: Classification of State Form Regulation Stringency in Commercial Lines, 1992-2014
State Stringent Form Non-stringent State Stringent Form Non-stringent FormRegulation Form Regulation Regulation Regulation
Alabama 1992-2001 2002-2014 Montana 1992-2014Alaska 1992-2004 2005-2014 Nebraska 1992-2014Arizona 1992-1998 1999-2014 Nevada 1992-2014Arkansas 1992-1999 2000-2014 New Hampshire 1992-1998 1999-2014California 1992-2014 New Jersey 1992-2014Colorado 1992-2014 New Mexico 1992-2005 2006-2014Connecticut 1992-2014 New York 1992-2011 2012-2014Delaware 1992-2014 North Carolina 1992-2014District of Columbia 1992-2014 North Dakota 1992-2014Florida 1992-2014 Ohio 1992-2014Georgia 1992-2014 Oklahoma 1992-2014Hawaii 1992-2014 Oregon 1992-2014Idaho 1992-1994 1995-2014 Pennsylvania 1992-1995 1996-2014Illinois 1992-2014 Rhode Island1 1998 1999-2014Indiana 1992-2014 South Carolina 1992-2002 2003-2014Iowa 1992-2014 South Dakota 1992-2004 2005-2014Kansas 1992-2014 Tennessee 1992-2014Kentucky 1992-2014 Texas 1992-2006 2007-2014Louisiana 1992-1999 2000-2014 Utah 1992-2014Maine 1992-1999 2000-2014 Vermont 1992-2014Maryland 1992-2014 Virginia 1992-2000 2001-2014Massachusetts 1992-2004 2005-2014 Washington 1992-2014Michigan 1992-2002 West Virginia 1992-2005 2006-2014Minnesota 1992-1994 Wisconsin 1992-2008 2009-2014Mississippi 1992-2014 Wyoming 1992-2014Missouri 1992-2014
1. Data missing during 1992-1997.Notes: The table shows the classification of state policy form regulation stringency in commercial lines, 1992-2014. Commercial lines are: special
property, commercial multiple peril, other liability, products liability, commercial auto liability, commercial auto physical damage, and special liability.Stringent form regulation is identified by a prior approval form filing system. Data sources: NAIC (1992-2014) and state statutes.
28
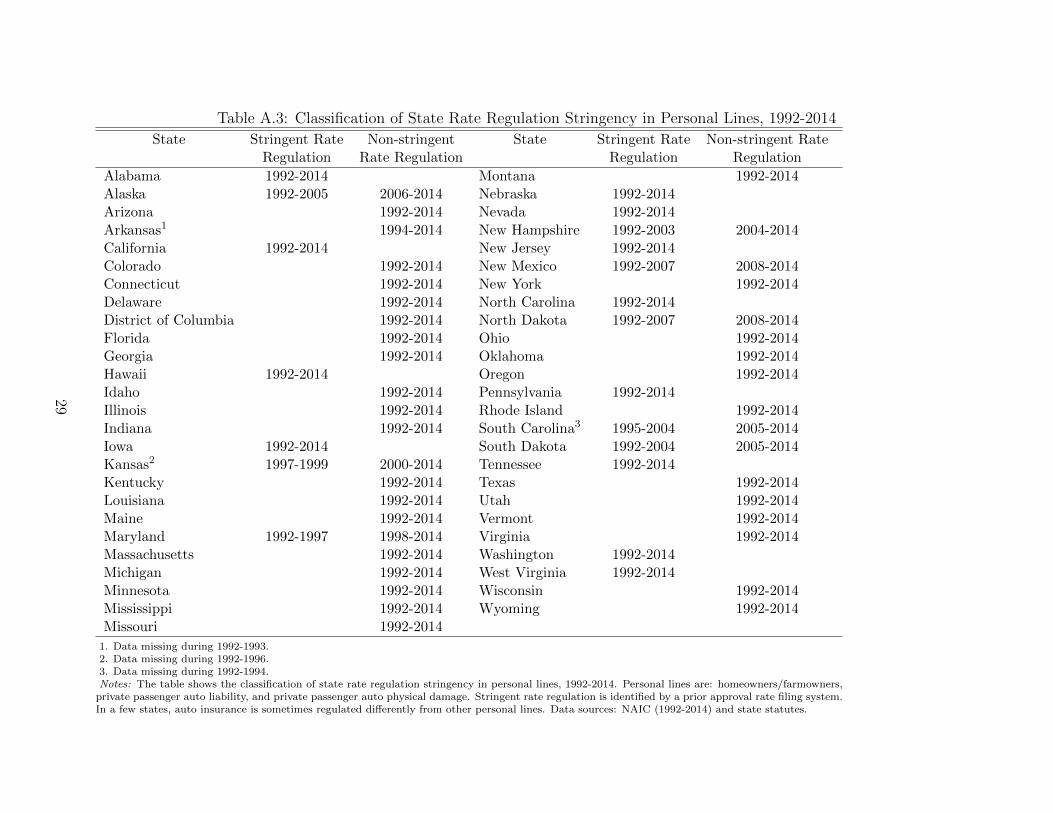
Table A.3: Classification of State Rate Regulation Stringency in Personal Lines, 1992-2014
State Stringent Rate Non-stringent State Stringent Rate Non-stringent RateRegulation Rate Regulation Regulation Regulation
Alabama 1992-2014 Montana 1992-2014Alaska 1992-2005 2006-2014 Nebraska 1992-2014Arizona 1992-2014 Nevada 1992-2014Arkansas1 1994-2014 New Hampshire 1992-2003 2004-2014California 1992-2014 New Jersey 1992-2014Colorado 1992-2014 New Mexico 1992-2007 2008-2014Connecticut 1992-2014 New York 1992-2014Delaware 1992-2014 North Carolina 1992-2014District of Columbia 1992-2014 North Dakota 1992-2007 2008-2014Florida 1992-2014 Ohio 1992-2014Georgia 1992-2014 Oklahoma 1992-2014Hawaii 1992-2014 Oregon 1992-2014Idaho 1992-2014 Pennsylvania 1992-2014Illinois 1992-2014 Rhode Island 1992-2014Indiana 1992-2014 South Carolina3 1995-2004 2005-2014Iowa 1992-2014 South Dakota 1992-2004 2005-2014Kansas2 1997-1999 2000-2014 Tennessee 1992-2014Kentucky 1992-2014 Texas 1992-2014Louisiana 1992-2014 Utah 1992-2014Maine 1992-2014 Vermont 1992-2014Maryland 1992-1997 1998-2014 Virginia 1992-2014Massachusetts 1992-2014 Washington 1992-2014Michigan 1992-2014 West Virginia 1992-2014Minnesota 1992-2014 Wisconsin 1992-2014Mississippi 1992-2014 Wyoming 1992-2014Missouri 1992-2014
1. Data missing during 1992-1993.2. Data missing during 1992-1996.3. Data missing during 1992-1994.Notes: The table shows the classification of state rate regulation stringency in personal lines, 1992-2014. Personal lines are: homeowners/farmowners,
private passenger auto liability, and private passenger auto physical damage. Stringent rate regulation is identified by a prior approval rate filing system.In a few states, auto insurance is sometimes regulated differently from other personal lines. Data sources: NAIC (1992-2014) and state statutes.
29
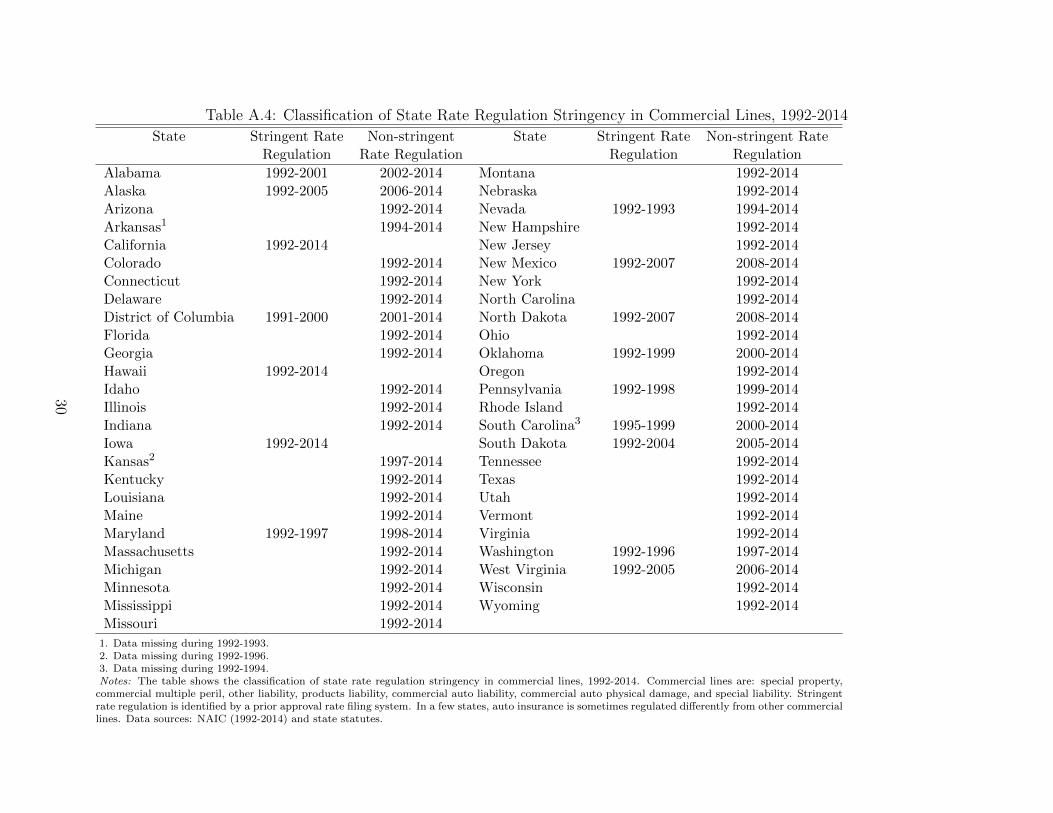
Table A.4: Classification of State Rate Regulation Stringency in Commercial Lines, 1992-2014
State Stringent Rate Non-stringent State Stringent Rate Non-stringent RateRegulation Rate Regulation Regulation Regulation
Alabama 1992-2001 2002-2014 Montana 1992-2014Alaska 1992-2005 2006-2014 Nebraska 1992-2014Arizona 1992-2014 Nevada 1992-1993 1994-2014Arkansas1 1994-2014 New Hampshire 1992-2014California 1992-2014 New Jersey 1992-2014Colorado 1992-2014 New Mexico 1992-2007 2008-2014Connecticut 1992-2014 New York 1992-2014Delaware 1992-2014 North Carolina 1992-2014District of Columbia 1991-2000 2001-2014 North Dakota 1992-2007 2008-2014Florida 1992-2014 Ohio 1992-2014Georgia 1992-2014 Oklahoma 1992-1999 2000-2014Hawaii 1992-2014 Oregon 1992-2014Idaho 1992-2014 Pennsylvania 1992-1998 1999-2014Illinois 1992-2014 Rhode Island 1992-2014Indiana 1992-2014 South Carolina3 1995-1999 2000-2014Iowa 1992-2014 South Dakota 1992-2004 2005-2014Kansas2 1997-2014 Tennessee 1992-2014Kentucky 1992-2014 Texas 1992-2014Louisiana 1992-2014 Utah 1992-2014Maine 1992-2014 Vermont 1992-2014Maryland 1992-1997 1998-2014 Virginia 1992-2014Massachusetts 1992-2014 Washington 1992-1996 1997-2014Michigan 1992-2014 West Virginia 1992-2005 2006-2014Minnesota 1992-2014 Wisconsin 1992-2014Mississippi 1992-2014 Wyoming 1992-2014Missouri 1992-2014
1. Data missing during 1992-1993.2. Data missing during 1992-1996.3. Data missing during 1992-1994.Notes: The table shows the classification of state rate regulation stringency in commercial lines, 1992-2014. Commercial lines are: special property,
commercial multiple peril, other liability, products liability, commercial auto liability, commercial auto physical damage, and special liability. Stringentrate regulation is identified by a prior approval rate filing system. In a few states, auto insurance is sometimes regulated differently from other commerciallines. Data sources: NAIC (1992-2014) and state statutes.
30

Table A.5: Line of Insurance CategoryLine Group Line of Insurance in the Sample Orignial Line in NAIC Data Note
Personal
Homeowners/ FarmownersFarmowners multiple perilHomeowners multiple peril
Private Passenger Auto LiabilityPrivate passenger auto no-fault (personal injury protection)
Other private passenger auto liabilityPrivate Passenger Auto Physical Damage Privatepassenger auto physical damage
Commercial
Special Property
FireAllied linesEarthquake
GlassBurglary and theft
Commercial Multiple PerilCommercial multiple peril (non-liability portion)
Commercial multiple peril (liability portion)
Financial /Mortgage GuarantyMortgage guaranty Not usedFinancial guaranty Not used
Other LiabilityOther liability
Other liability - occurrenceOther liability - claims made
Products Liability Products Liability
Commercial Auto LiabilityCommercial auto no-fault (personal injury protection)
Other commercial auto liabilityCommercial Auto Physical Damage Commercial auto physical damage
Fidelity/SuretyFidelity Not usedSurety Not used
Special LiabilityAircraft (all perils)
Boiler and machineryCredit Credit Not used
Warranty Warranty Not usedWorkers’ comp Workers’ compensation Workers’ compensation
Med Mal Medical Professional Liability Medical Professional LiabilityOcean Marine Ocean Marine Ocean MarineInland Marine Inland Marine Inland Marine
Notes: The table shows the categorization of lines of insurance in this study.
31