Embed Size (px)
Citation preview
Broadband Adoption:Trends & Consequences
Presented at National Association for Regulatory Utility Commissioners meetingNew York, July 17, 2007
John B. Horrigan, PhDAssociate Director for Research
July 2007 2
Basic facts about communication technology adoptionBasic facts about communication technology adoption
• 71% of American adults are internet users (Feb. ’07)– 67% of adults have online access from home
• 93% of teens (ages 12 through 17) are online users (Nov. 2006)
• 70% of Americans who go online from home connect via high-speed (mostly cable modem or DSL)– That translates into 47% of all Americans with high-speed
at home• 34% of online users have used a wireless network to go
online (as of December 2006)• 74% of adults have cell phones• 63% of teens (ages 12-17) have cell phones
July 2007 3
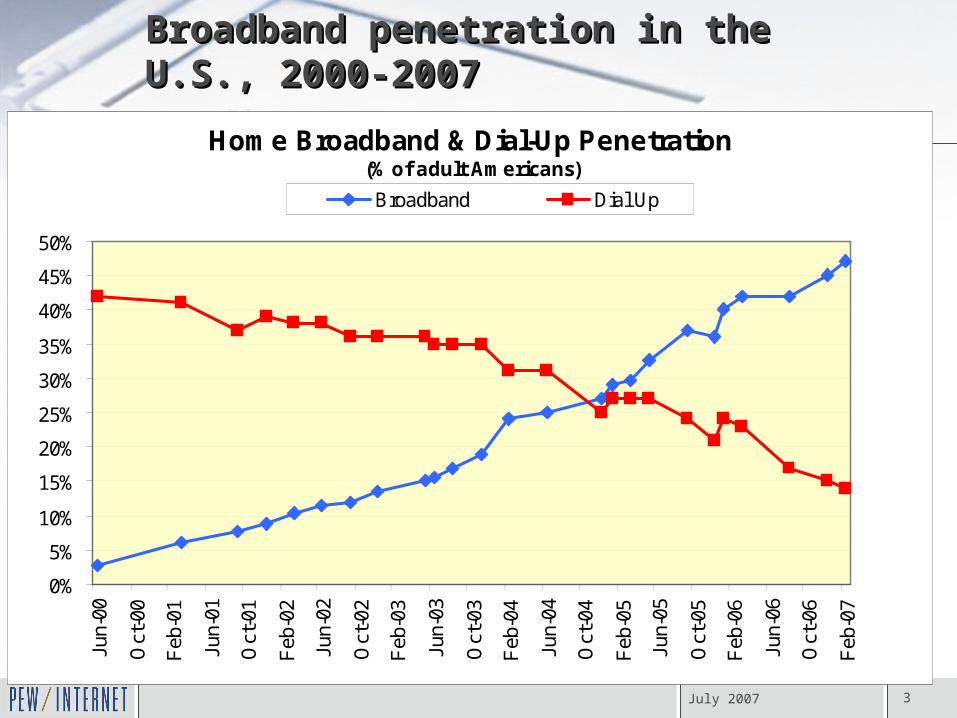
Broadband penetration in the U.S., 2000-2007Broadband penetration in the U.S., 2000-2007
Home Broadband & Dial-Up Penetration (% of adult Americans)
0%
5%
10%
15%
20%
25%
30%
35%
40%
45%
50%
Jun-
00
Oct
-00
Feb
-01
Jun-
01
Oct
-01
Feb
-02
Jun-
02
Oct
-02
Feb
-03
Jun-
03
Oct
-03
Feb
-04
Jun-
04
Oct
-04
Feb
-05
Jun-
05
Oct
-05
Feb
-06
Jun-
06
Oct
-06
Feb
-07
Broadband Dial Up
July 2007 4
How does broadband adoption rate stack up?
• To reach 50% to consumer adoption it took:– 18 years for color TV– 15 years for the cell phone– 14 years for the VCR– 10 ½ years for the CD player
• Broadband should hit 50% by 9-10 year mark.• Happy dial-up users?
– Some 60% of dial-up users say they don’t want broadband, a figure that held constant from 2002-2005
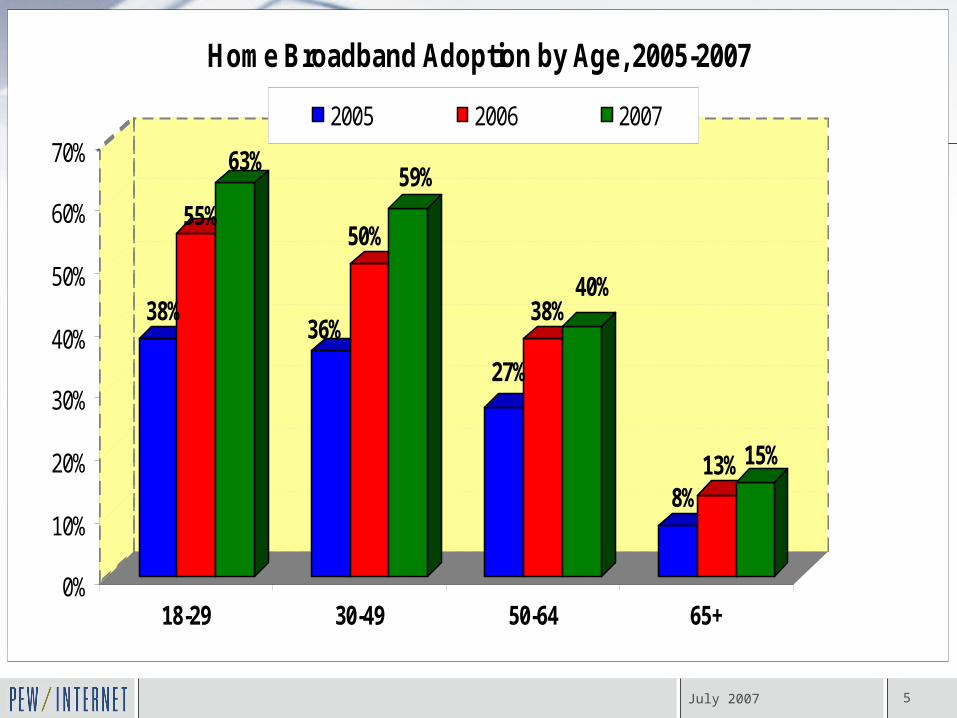
July 2007 5
38%
55%
63%
36%
50%
59%
27%
38%40%
8%13%15%
0%
10%
20%
30%
40%
50%
60%
70%
18-29 30-49 50-64 65+
Home Broadband Adoption by Age, 2005-2007
2005 2006 2007
July 2007 6
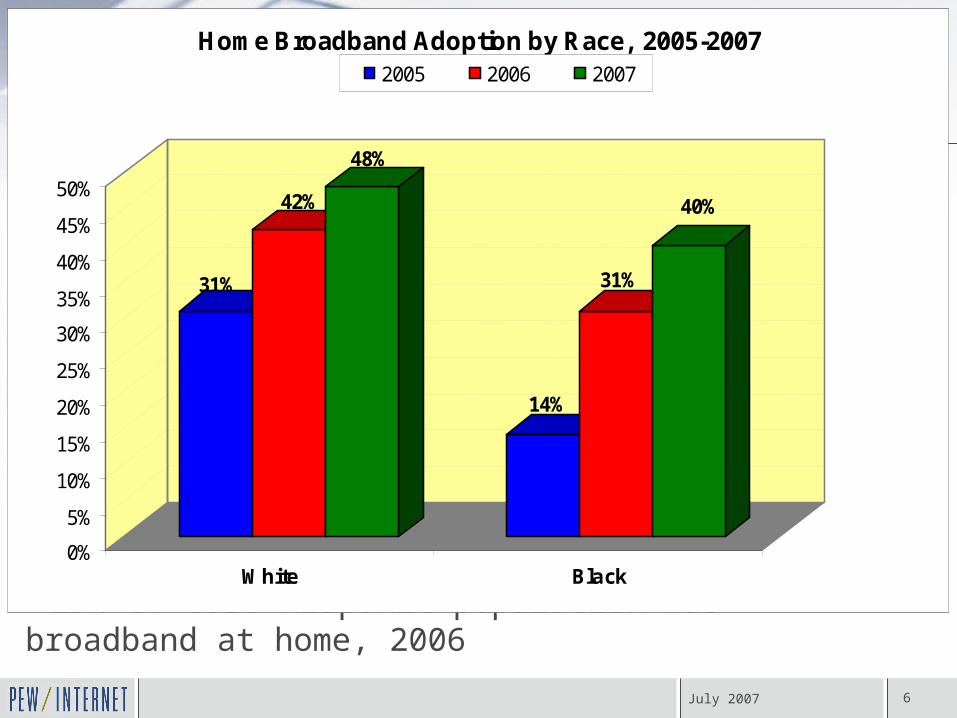
29% of U.S. Hispanic population has broadband at home, 2006
31%
42%
48%
14%
31%
40%
0%
5%
10%
15%
20%
25%
30%
35%
40%
45%
50%
White Black
Home Broadband Adoption by Race, 2005-20072005 2006 2007
July 2007 7
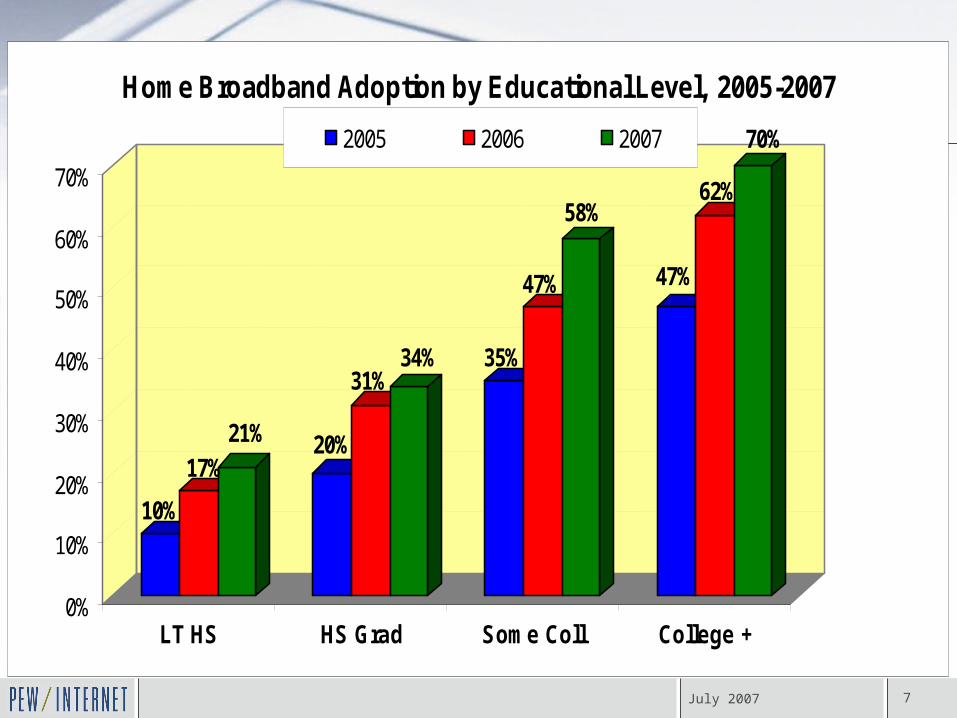
10%
17%21% 20%
31%34% 35%
47%
58%
47%
62%
70%
0%
10%
20%
30%
40%
50%
60%
70%
LT HS HS Grad Some Coll College +
Home Broadband Adoption by Educational Level, 2005-2007
2005 2006 2007
July 2007 8
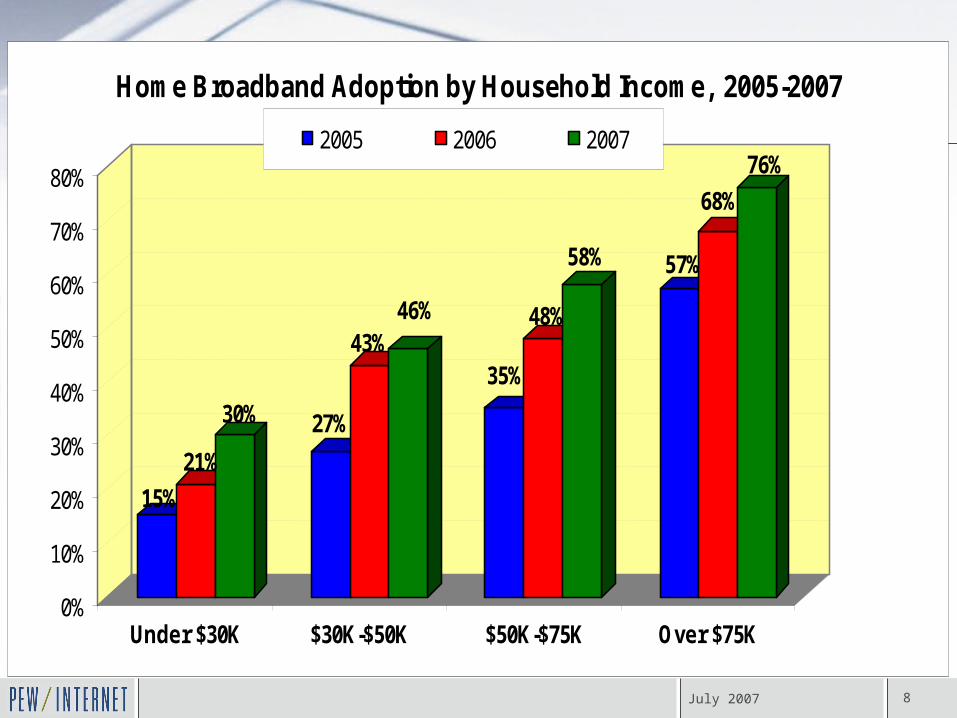
15%
21%
30% 27%
43%46%
35%
48%
58% 57%
68%
76%
0%
10%
20%
30%
40%
50%
60%
70%
80%
Under $30K $30K-$50K $50K-$75K Over $75K
Home Broadband Adoption by Household Income, 2005-2007
2005 2006 2007
July 2007 9
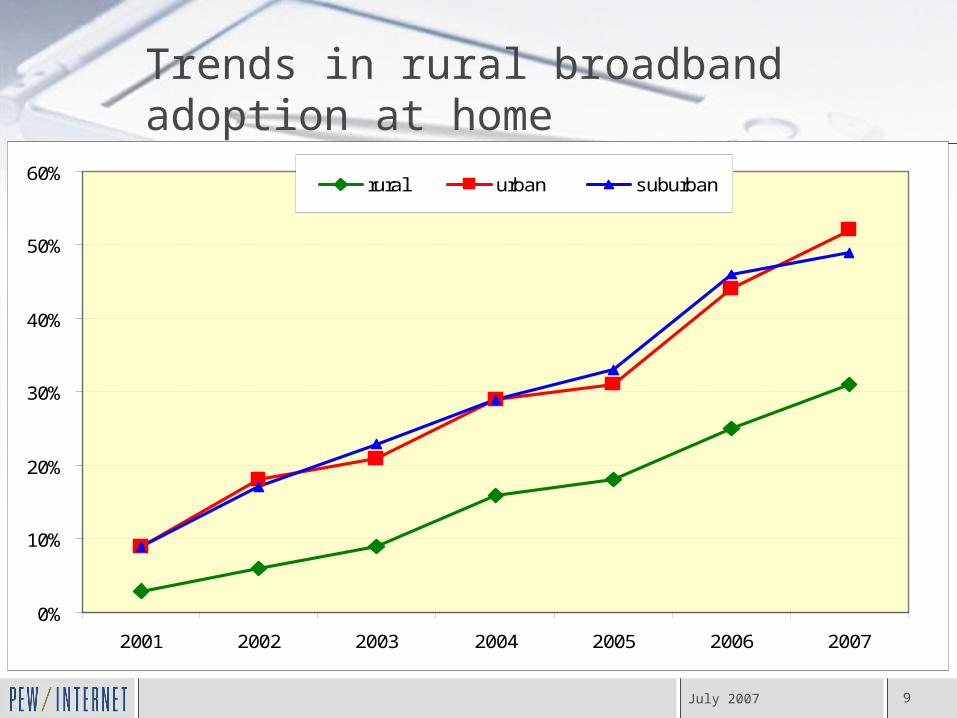
Trends in rural broadband adoption at home
0%
10%
20%
30%
40%
50%
60%
2001 2002 2003 2004 2005 2006 2007
rural urban suburban
July 2007 10
Broadband: What for?– Home high-speed connection is key differentiator
in explaining internet usage patterns• Do more things online on the typical day than
dial-up users• Spend more time online than dial-up users
– Higher levels of internet impacts in:• Maintaining social networks• Helping in major life decisions• Information gathering (news, civic engagement,
research)• Gathering information about a health or medical
condition
July 2007 11
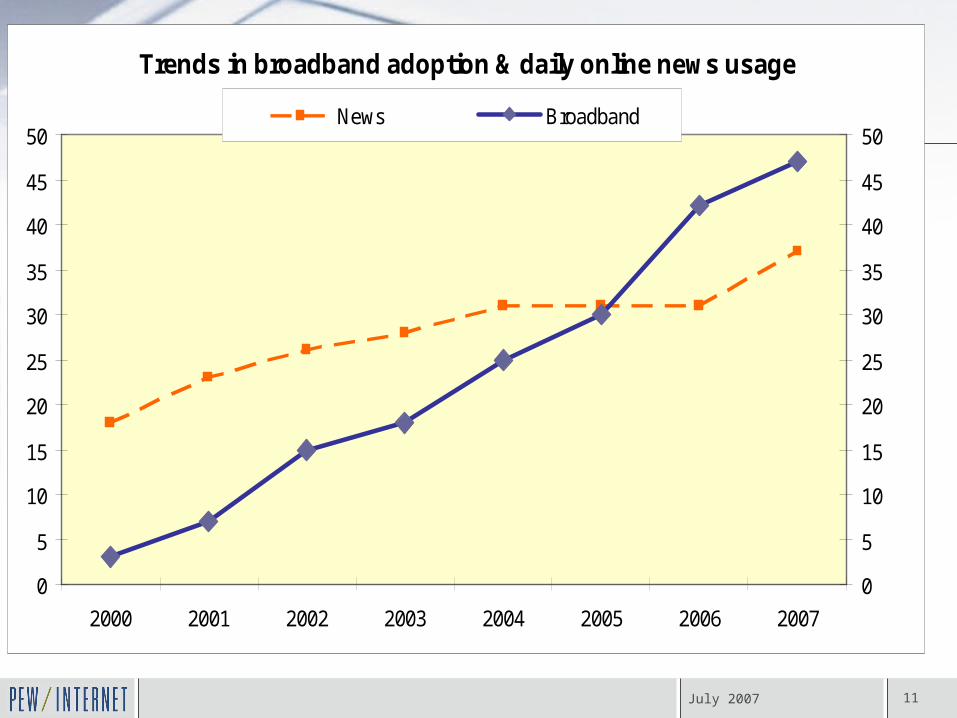
Trends in broadband adoption & daily online news usage
0
5
10
15
20
25
30
35
40
45
50
2000 2001 2002 2003 2004 2005 2006 2007
0
5
10
15
20
25
30
35
40
45
50News Broadband
July 2007 12
Reasons for gaps
• Availability of offline substitutes• Usability• Relevance of content • Infrastructure availability