Embed Size (px)
Citation preview

Mark Milner, Chief Executive OfficerRichard Amos, Chief Financial Officer
INTERIM RESULTS 2019/20
London, 20 February 2020

SAFE HARBOUR STATEMENT.
2
This presentation and the subsequent question and answer session may contain forward-looking statements that are based on current expectations or beliefs, as well as assumptions about future events. There are risk factors that could cause results to differ materially from those expressed or implied by such statements.
Wilmington disclaims any intention or obligation to revise or update any forward-looking statements that may be made during this presentation or the subsequent question and answer session, regardless of whether those statements are affected as a result of new information, future events or otherwise.
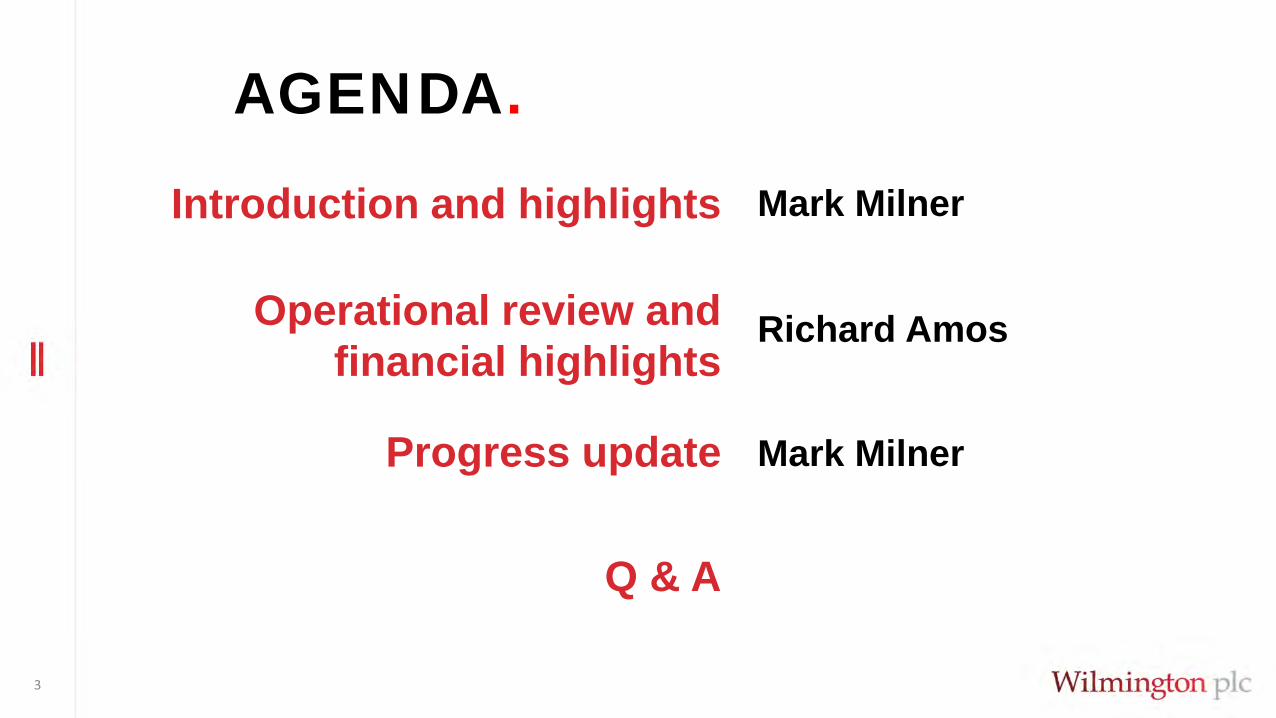
AGENDA.
3
Mark Milner
Richard Amos
Mark Milner
Introduction and highlights
Operational review and financial highlights
Q & A
Progress update

INTRODUCTION AND HIGHLIGHTS.
HIGHLIGHTS.
5
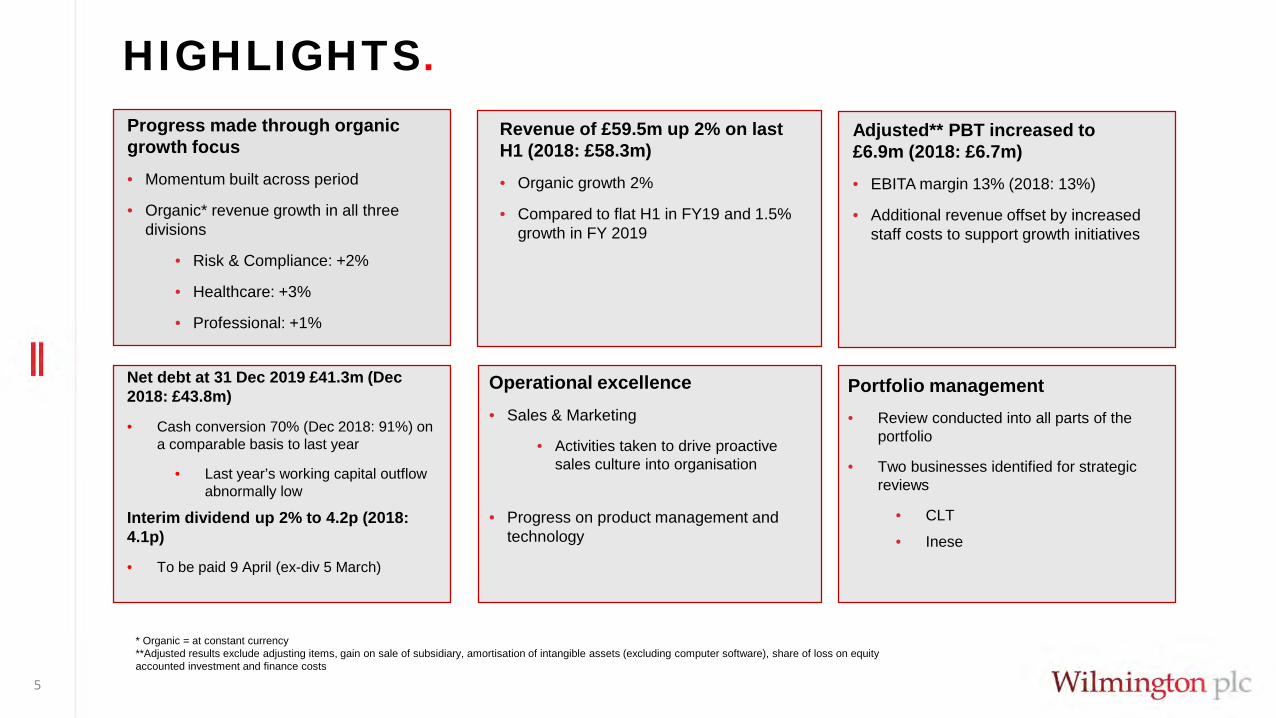
Revenue of £59.5m up 2% on last H1 (2018: £58.3m)• Organic growth 2%
• Compared to flat H1 in FY19 and 1.5% growth in FY 2019
Adjusted** PBT increased to £6.9m (2018: £6.7m)• EBITA margin 13% (2018: 13%)
• Additional revenue offset by increased staff costs to support growth initiatives
Net debt at 31 Dec 2019 £41.3m (Dec 2018: £43.8m)
• Cash conversion 70% (Dec 2018: 91%) on a comparable basis to last year
• Last year’s working capital outflow abnormally low
Interim dividend up 2% to 4.2p (2018: 4.1p)
• To be paid 9 April (ex-div 5 March)
Progress made through organic growth focus• Momentum built across period
• Organic* revenue growth in all three divisions
• Risk & Compliance: +2%
• Healthcare: +3%
• Professional: +1%
* Organic = at constant currency**Adjusted results exclude adjusting items, gain on sale of subsidiary, amortisation of intangible assets (excluding computer software), share of loss on equity accounted investment and finance costs
Operational excellence • Sales & Marketing
• Activities taken to drive proactive sales culture into organisation
• Progress on product management and technology
Portfolio management• Review conducted into all parts of the
portfolio
• Two businesses identified for strategic reviews
• CLT
• Inese

OPERATIONAL REVIEW.
47%50%
3%
Information 47%Training 50%Networking 3%
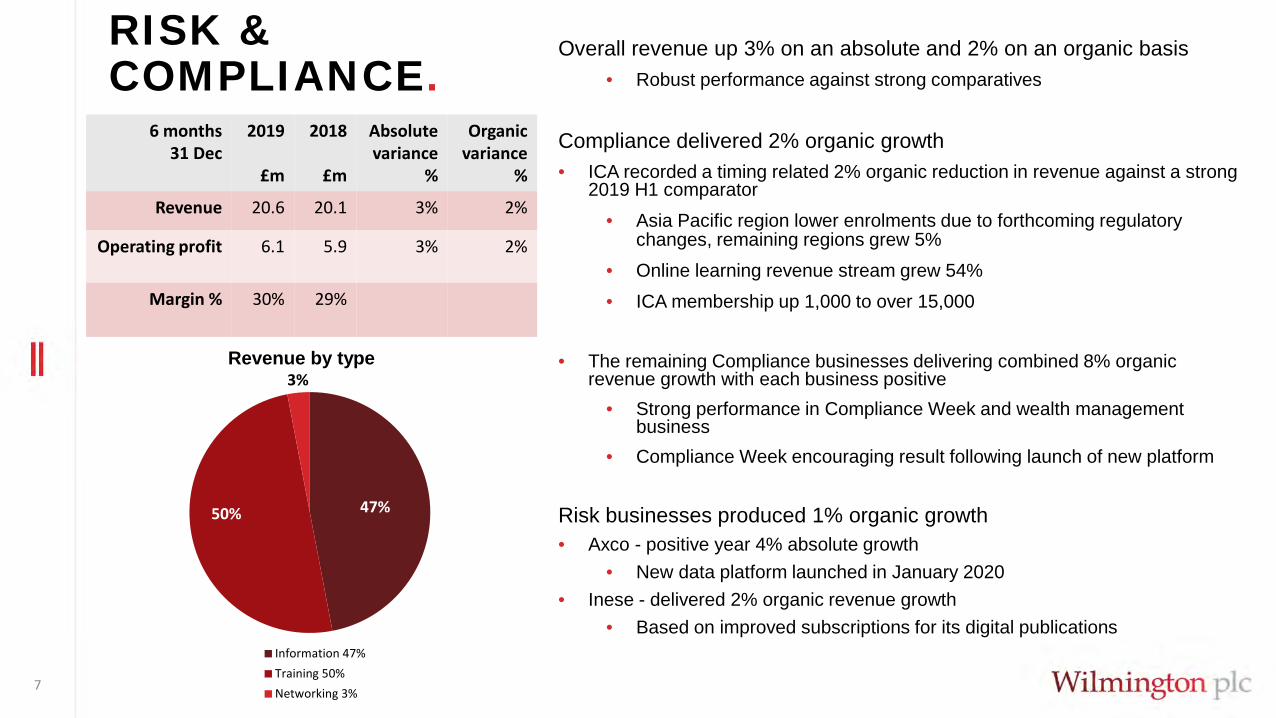
RISK & COMPLIANCE.
7
Overall revenue up 3% on an absolute and 2% on an organic basis • Robust performance against strong comparatives
Compliance delivered 2% organic growth• ICA recorded a timing related 2% organic reduction in revenue against a strong
2019 H1 comparator • Asia Pacific region lower enrolments due to forthcoming regulatory
changes, remaining regions grew 5%• Online learning revenue stream grew 54%• ICA membership up 1,000 to over 15,000
• The remaining Compliance businesses delivering combined 8% organic revenue growth with each business positive
• Strong performance in Compliance Week and wealth management business
• Compliance Week encouraging result following launch of new platform
Risk businesses produced 1% organic growth• Axco - positive year 4% absolute growth
• New data platform launched in January 2020 • Inese - delivered 2% organic revenue growth
• Based on improved subscriptions for its digital publications
Revenue by type
6 months31 Dec
2019
£m
2018
£m
Absolutevariance
%
Organicvariance
%
Revenue 20.6 20.1 3% 2%
Operating profit 6.1 5.9 3% 2%
Margin % 30% 29%
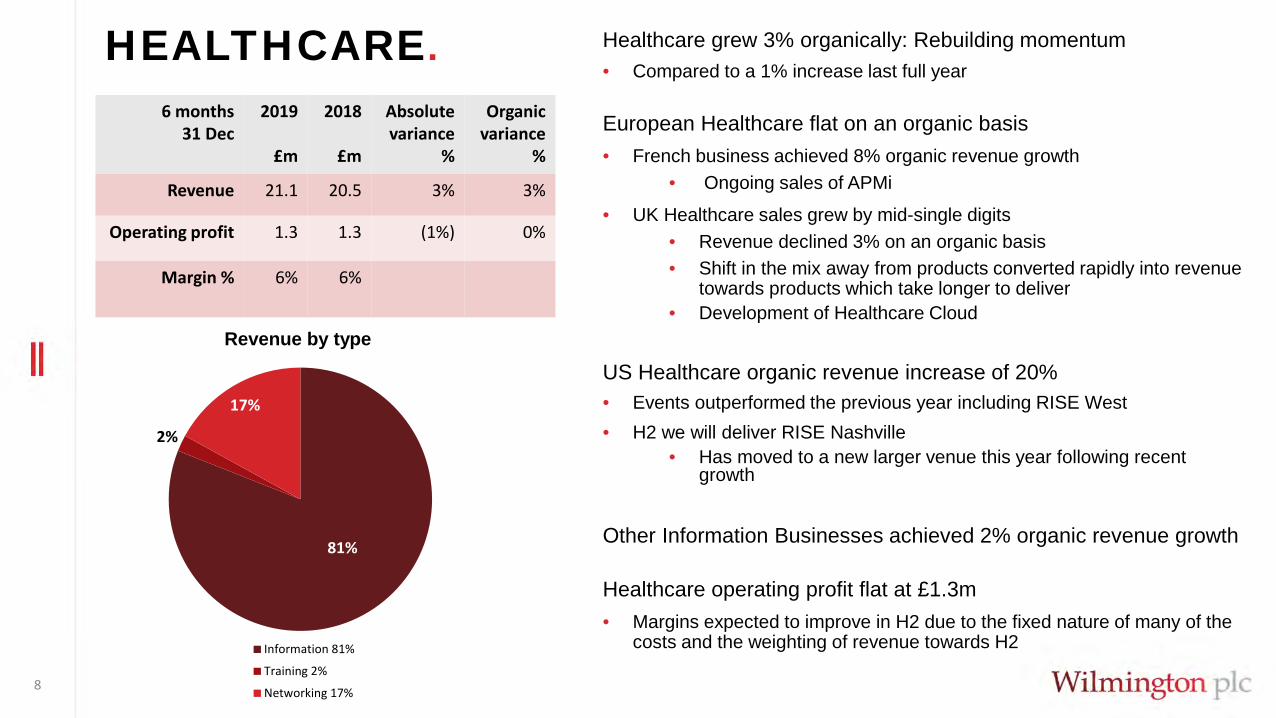
HEALTHCARE.
8
Healthcare grew 3% organically: Rebuilding momentum• Compared to a 1% increase last full year
European Healthcare flat on an organic basis • French business achieved 8% organic revenue growth
• Ongoing sales of APMi
• UK Healthcare sales grew by mid-single digits• Revenue declined 3% on an organic basis• Shift in the mix away from products converted rapidly into revenue
towards products which take longer to deliver• Development of Healthcare Cloud
US Healthcare organic revenue increase of 20%• Events outperformed the previous year including RISE West• H2 we will deliver RISE Nashville
• Has moved to a new larger venue this year following recent growth
Other Information Businesses achieved 2% organic revenue growth
Healthcare operating profit flat at £1.3m• Margins expected to improve in H2 due to the fixed nature of many of the
costs and the weighting of revenue towards H2
6 months31 Dec
2019
£m
2018
£m
Absolutevariance
%
Organicvariance
%
Revenue 21.1 20.5 3% 3%
Operating profit 1.3 1.3 (1%) 0%
Margin % 6% 6%
Revenue by type
81%
2%
17%
Information 81%
Training 2%
Networking 17%
18%
79%
3%
Information 18%Training 79%Networking 3%
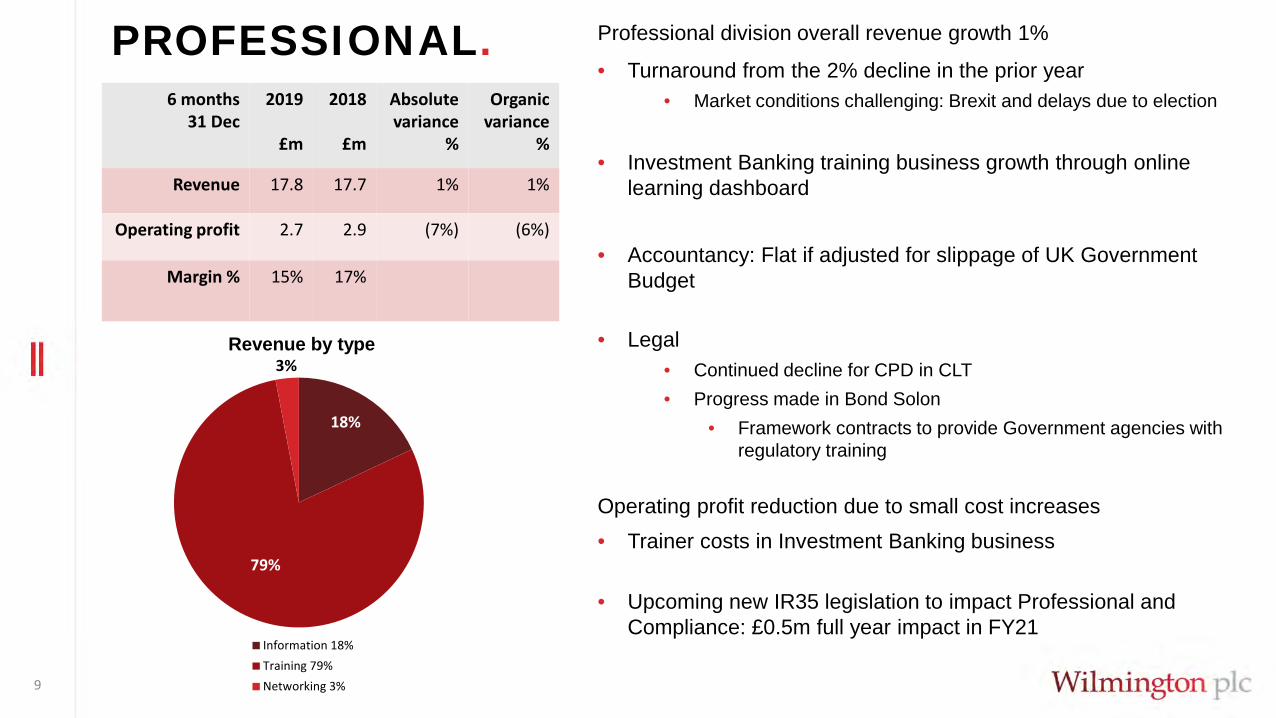
PROFESSIONAL.
9
6 months31 Dec
2019
£m
2018
£m
Absolutevariance
%
Organicvariance
%
Revenue 17.8 17.7 1% 1%
Operating profit 2.7 2.9 (7%) (6%)
Margin % 15% 17%
Revenue by type
Professional division overall revenue growth 1%
• Turnaround from the 2% decline in the prior year• Market conditions challenging: Brexit and delays due to election
• Investment Banking training business growth through online learning dashboard
• Accountancy: Flat if adjusted for slippage of UK Government Budget
• Legal• Continued decline for CPD in CLT• Progress made in Bond Solon
• Framework contracts to provide Government agencies with regulatory training
Operating profit reduction due to small cost increases• Trainer costs in Investment Banking business
• Upcoming new IR35 legislation to impact Professional and Compliance: £0.5m full year impact in FY21

FINANCIAL HIGHLIGHTS.
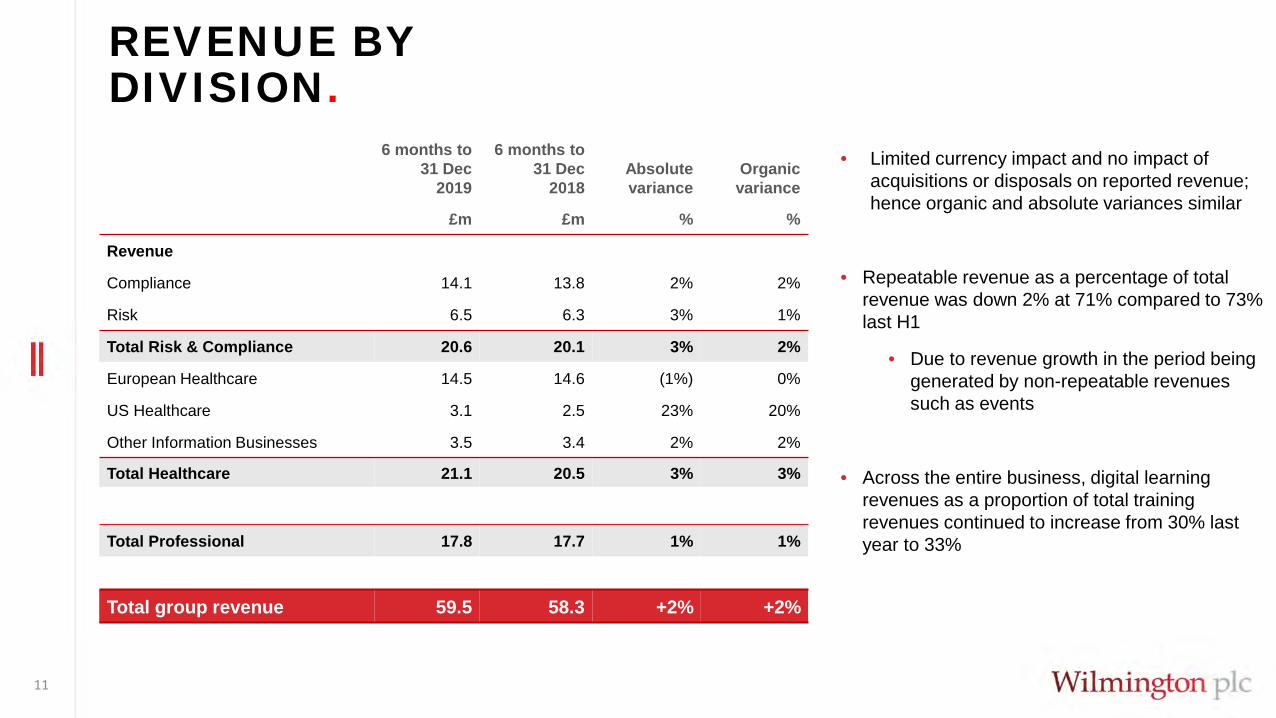
REVENUE BY DIVISION.
11
6 months to 31 Dec
2019
6 months to 31 Dec
2018Absolute variance
Organic variance
£m £m % %
Revenue
Compliance 14.1 13.8 2% 2%
Risk 6.5 6.3 3% 1%
Total Risk & Compliance 20.6 20.1 3% 2%
European Healthcare 14.5 14.6 (1%) 0%
US Healthcare 3.1 2.5 23% 20%
Other Information Businesses 3.5 3.4 2% 2%
Total Healthcare 21.1 20.5 3% 3%
Total Professional 17.8 17.7 1% 1%
Total group revenue 59.5 58.3 +2% +2%
• Limited currency impact and no impact of acquisitions or disposals on reported revenue; hence organic and absolute variances similar
• Repeatable revenue as a percentage of total revenue was down 2% at 71% compared to 73% last H1
• Due to revenue growth in the period being generated by non-repeatable revenues such as events
• Across the entire business, digital learning revenues as a proportion of total training revenues continued to increase from 30% last year to 33%
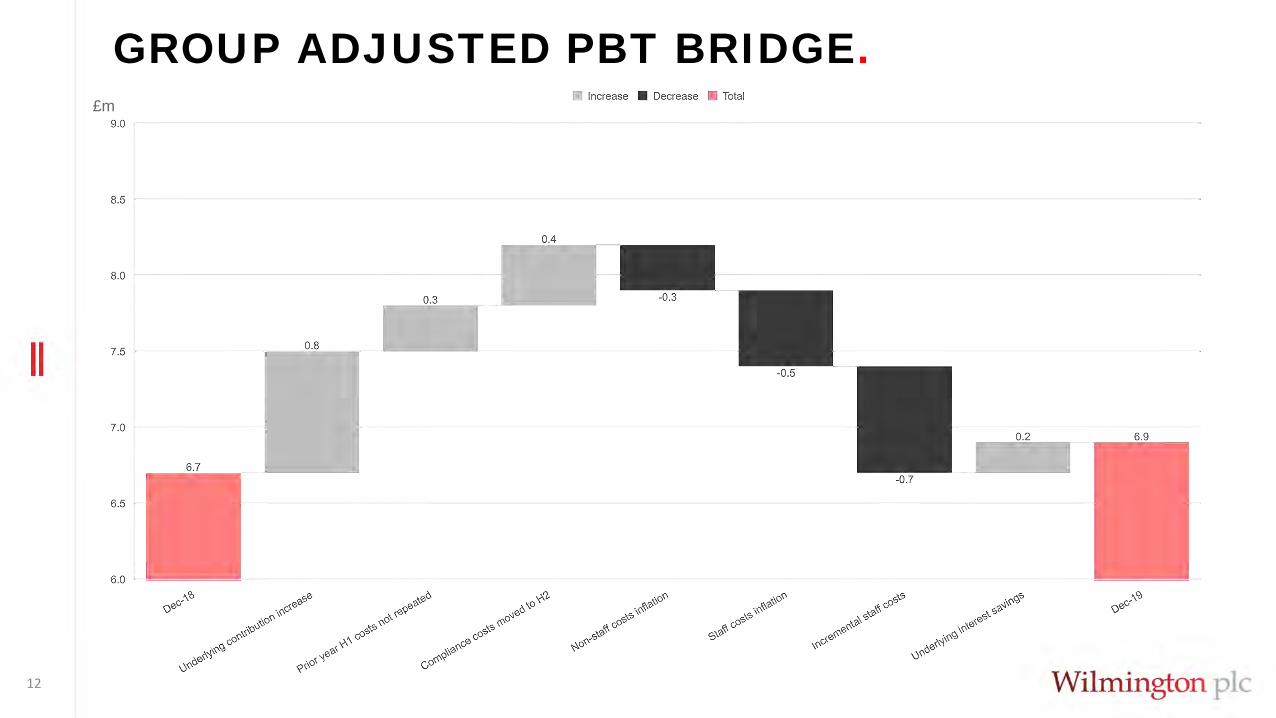
GROUP ADJUSTED PBT BRIDGE.
12
£m
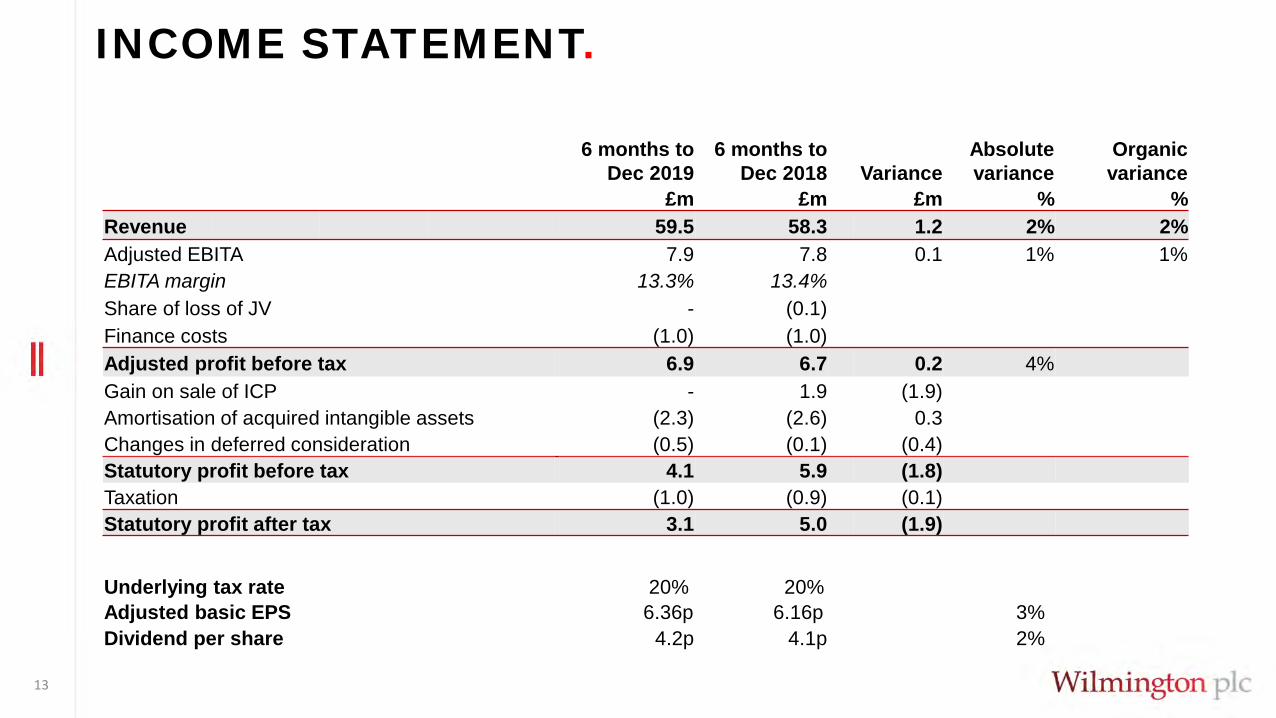
INCOME STATEMENT.
13
6 months to Dec 2019
6 months to Dec 2018 Variance
Absolute variance
Organic variance
£m £m £m % %Revenue 59.5 58.3 1.2 2% 2%Adjusted EBITA 7.9 7.8 0.1 1% 1%EBITA margin 13.3% 13.4%Share of loss of JV - (0.1)Finance costs (1.0) (1.0) Adjusted profit before tax 6.9 6.7 0.2 4%Gain on sale of ICP - 1.9 (1.9) Amortisation of acquired intangible assets (2.3) (2.6) 0.3Changes in deferred consideration (0.5) (0.1) (0.4)Statutory profit before tax 4.1 5.9 (1.8) Taxation (1.0) (0.9) (0.1)Statutory profit after tax 3.1 5.0 (1.9)
Underlying tax rate 20% 20%Adjusted basic EPS 6.36p 6.16p 3%Dividend per share 4.2p 4.1p 2%
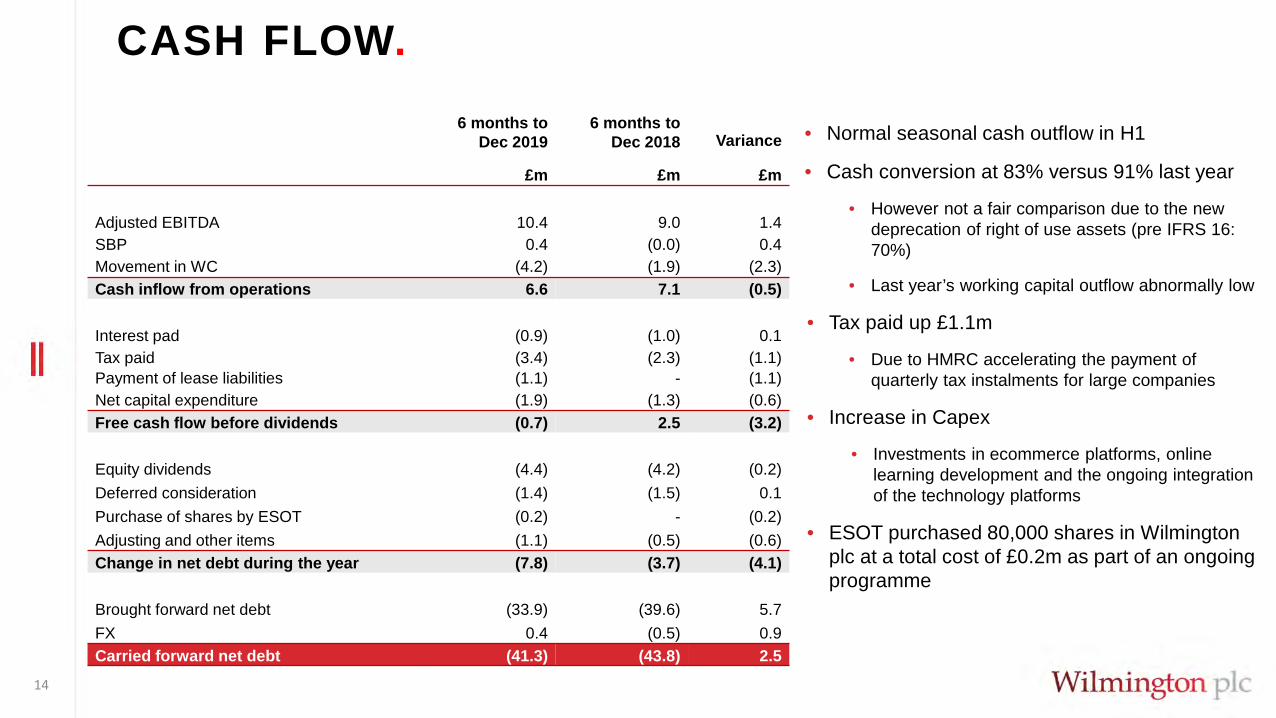
CASH FLOW.
14
6 months toDec 2019
6 months to Dec 2018 Variance
£m £m £m
Adjusted EBITDA 10.4 9.0 1.4SBP 0.4 (0.0) 0.4Movement in WC (4.2) (1.9) (2.3) Cash inflow from operations 6.6 7.1 (0.5)
Interest pad (0.9) (1.0) 0.1 Tax paid (3.4) (2.3) (1.1) Payment of lease liabilities (1.1) - (1.1)Net capital expenditure (1.9) (1.3) (0.6) Free cash flow before dividends (0.7) 2.5 (3.2)
Equity dividends (4.4) (4.2) (0.2)Deferred consideration (1.4) (1.5) 0.1Purchase of shares by ESOT (0.2) - (0.2) Adjusting and other items (1.1) (0.5) (0.6)Change in net debt during the year (7.8) (3.7) (4.1)
Brought forward net debt (33.9) (39.6) 5.7FX 0.4 (0.5) 0.9Carried forward net debt (41.3) (43.8) 2.5
• Normal seasonal cash outflow in H1
• Cash conversion at 83% versus 91% last year
• However not a fair comparison due to the new deprecation of right of use assets (pre IFRS 16: 70%)
• Last year’s working capital outflow abnormally low
• Tax paid up £1.1m
• Due to HMRC accelerating the payment of quarterly tax instalments for large companies
• Increase in Capex
• Investments in ecommerce platforms, online learning development and the ongoing integration of the technology platforms
• ESOT purchased 80,000 shares in Wilmington plc at a total cost of £0.2m as part of an ongoing programme
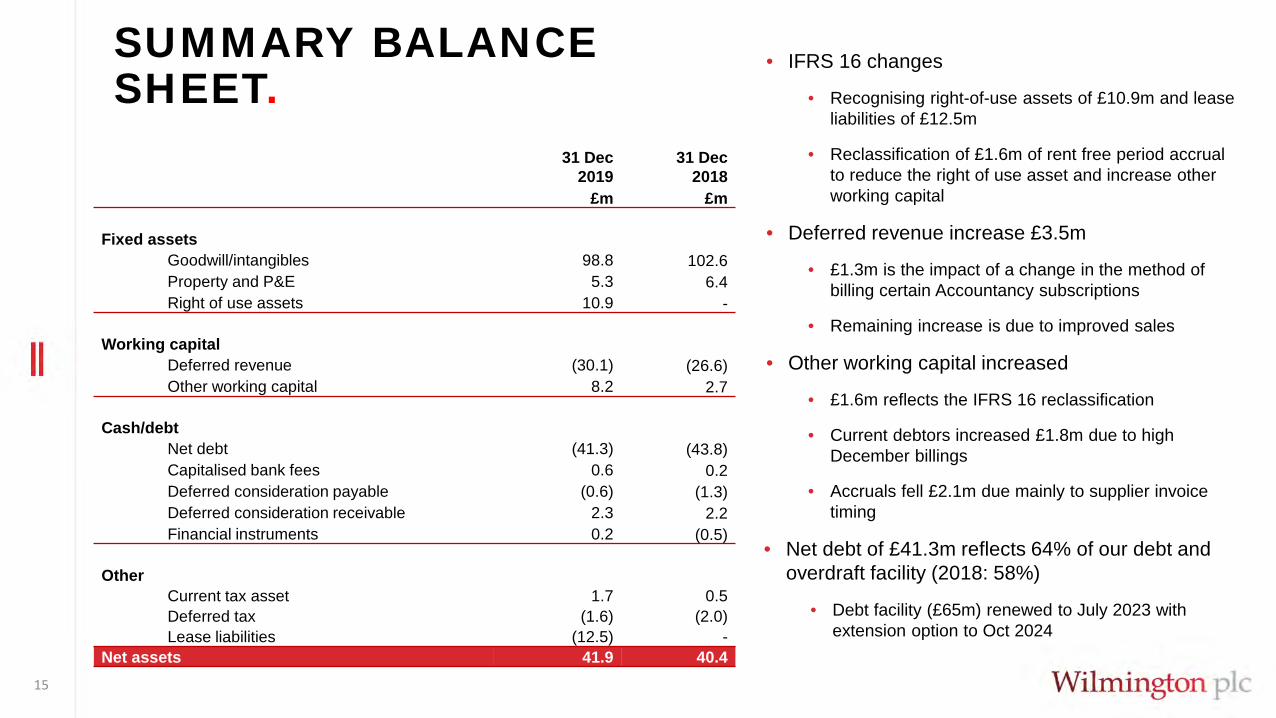
SUMMARY BALANCE SHEET.
15
31 Dec2019
31 Dec2018
£m £m
Fixed assetsGoodwill/intangibles 98.8 102.6Property and P&E 5.3 6.4 Right of use assets 10.9 -
Working capitalDeferred revenue (30.1) (26.6)Other working capital 8.2 2.7
Cash/debtNet debt (41.3) (43.8)Capitalised bank fees 0.6 0.2Deferred consideration payable (0.6) (1.3)Deferred consideration receivable 2.3 2.2Financial instruments 0.2 (0.5)
OtherCurrent tax asset 1.7 0.5Deferred tax (1.6) (2.0)Lease liabilities (12.5) -
Net assets 41.9 40.4
• IFRS 16 changes
• Recognising right-of-use assets of £10.9m and lease liabilities of £12.5m
• Reclassification of £1.6m of rent free period accrual to reduce the right of use asset and increase other working capital
• Deferred revenue increase £3.5m
• £1.3m is the impact of a change in the method of billing certain Accountancy subscriptions
• Remaining increase is due to improved sales
• Other working capital increased
• £1.6m reflects the IFRS 16 reclassification
• Current debtors increased £1.8m due to high December billings
• Accruals fell £2.1m due mainly to supplier invoice timing
• Net debt of £41.3m reflects 64% of our debt and overdraft facility (2018: 58%)
• Debt facility (£65m) renewed to July 2023 with extension option to Oct 2024

PROGRESS UPDATE.
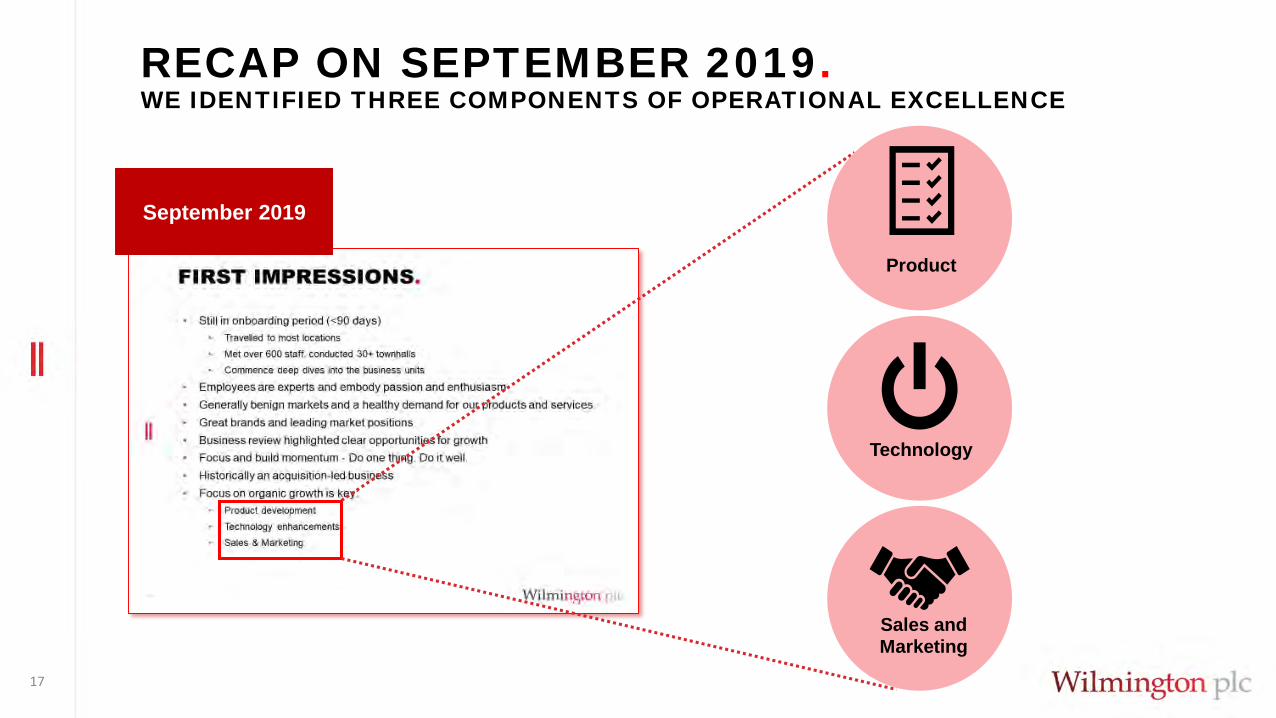
RECAP ON SEPTEMBER 2019.WE IDENTIFIED THREE COMPONENTS OF OPERATIONAL EXCELLENCE
17
Technology
Product
Sales and Marketing
September 2019
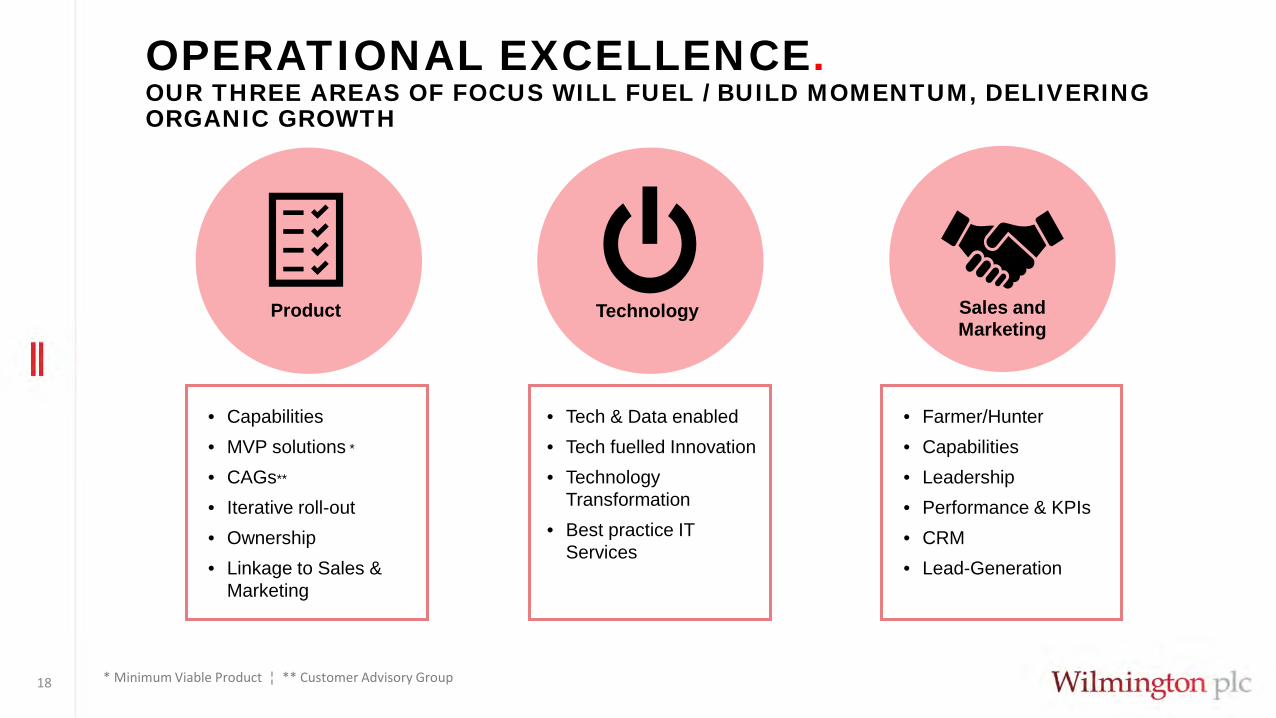
OPERATIONAL EXCELLENCE.OUR THREE AREAS OF FOCUS WILL FUEL / BUILD MOMENTUM, DELIVERING ORGANIC GROWTH
18
Technology Product Sales and Marketing
• Farmer/Hunter• Capabilities • Leadership• Performance & KPIs• CRM• Lead-Generation
• Capabilities• MVP solutions *
• CAGs**
• Iterative roll-out• Ownership• Linkage to Sales &
Marketing
• Tech & Data enabled • Tech fuelled Innovation• Technology
Transformation • Best practice IT
Services
* Minimum Viable Product ¦ ** Customer Advisory Group

19
• Roll-out of Product requirement processes• Key projects have MVPs at their core• Increased adoption of CAGs (Customer Advisory
Groups)• Improved investment decisioning with pre-agreed
ROI measures• Re-prioritised roadmap
• Several product upgrades delivered or in flight in H1:• AMT Dashboard• Axco database upgrade
H1 Milestones
PRODUCT MANAGEMENT - PROGRESS.
H2 Priorities• Professional development – launch of the
Wilmington Product Academy
• Assessment of H1 launch stage gates
• Cross-group collaboration opportunities
• Continue the digitisation programme• Online learning solutions • Blended learning• Microlearning• Modular learning
IMPROVED PROCESSES, CUSTOMER ENGAGEMENT & DELIVERY
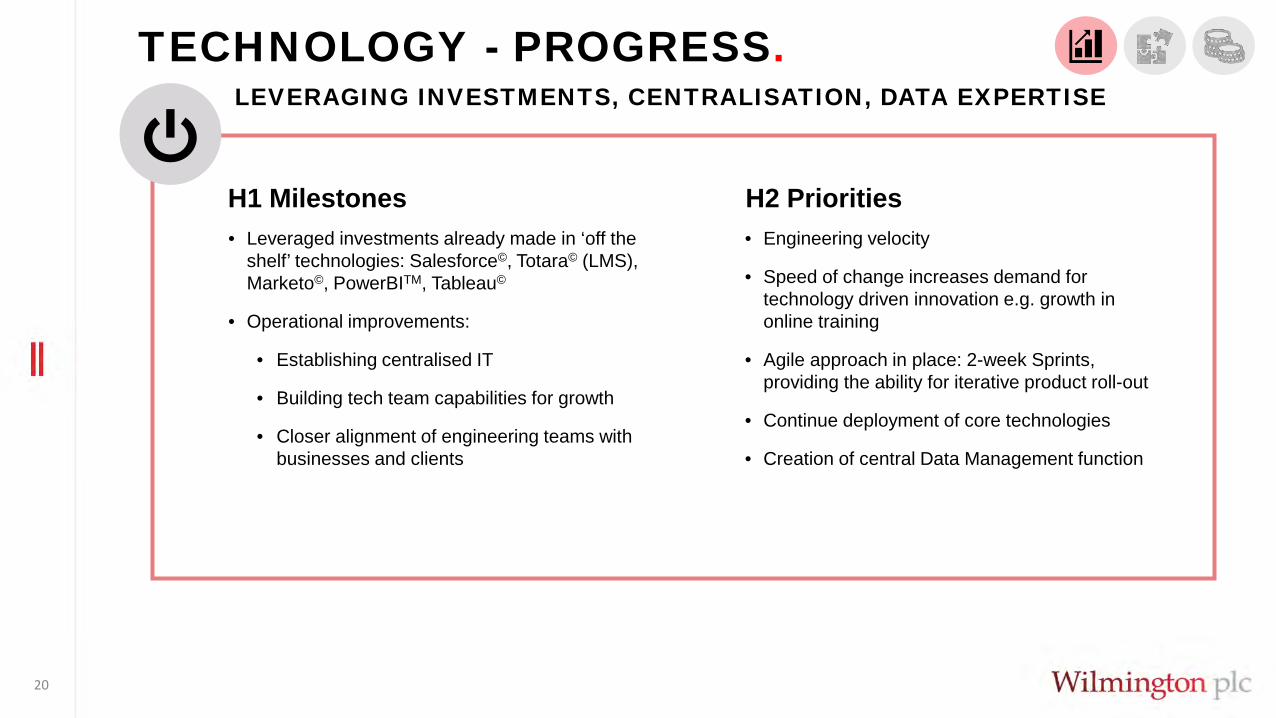
20
• Leveraged investments already made in ‘off the shelf’ technologies: Salesforce©, Totara© (LMS), Marketo©, PowerBITM, Tableau©
• Operational improvements:
• Establishing centralised IT
• Building tech team capabilities for growth
• Closer alignment of engineering teams with businesses and clients
H1 Milestones
TECHNOLOGY - PROGRESS.
H2 Priorities• Engineering velocity
• Speed of change increases demand for technology driven innovation e.g. growth in online training
• Agile approach in place: 2-week Sprints, providing the ability for iterative product roll-out
• Continue deployment of core technologies
• Creation of central Data Management function
LEVERAGING INVESTMENTS, CENTRALISATION, DATA EXPERTISE
21
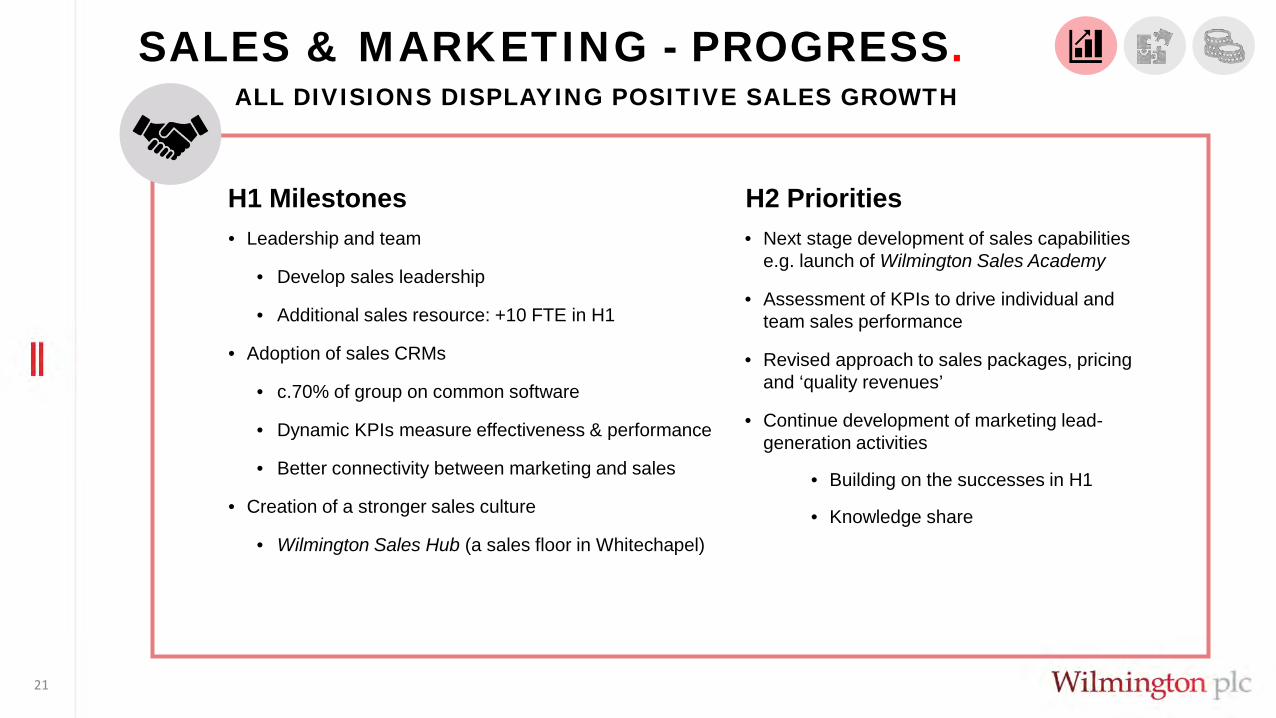
• Leadership and team
• Develop sales leadership
• Additional sales resource: +10 FTE in H1
• Adoption of sales CRMs
• c.70% of group on common software
• Dynamic KPIs measure effectiveness & performance
• Better connectivity between marketing and sales
• Creation of a stronger sales culture
• Wilmington Sales Hub (a sales floor in Whitechapel)
H1 Milestones
SALES & MARKETING - PROGRESS.
H2 Priorities• Next stage development of sales capabilities
e.g. launch of Wilmington Sales Academy
• Assessment of KPIs to drive individual and team sales performance
• Revised approach to sales packages, pricing and ‘quality revenues’
• Continue development of marketing lead-generation activities
• Building on the successes in H1
• Knowledge share
ALL DIVISIONS DISPLAYING POSITIVE SALES GROWTH
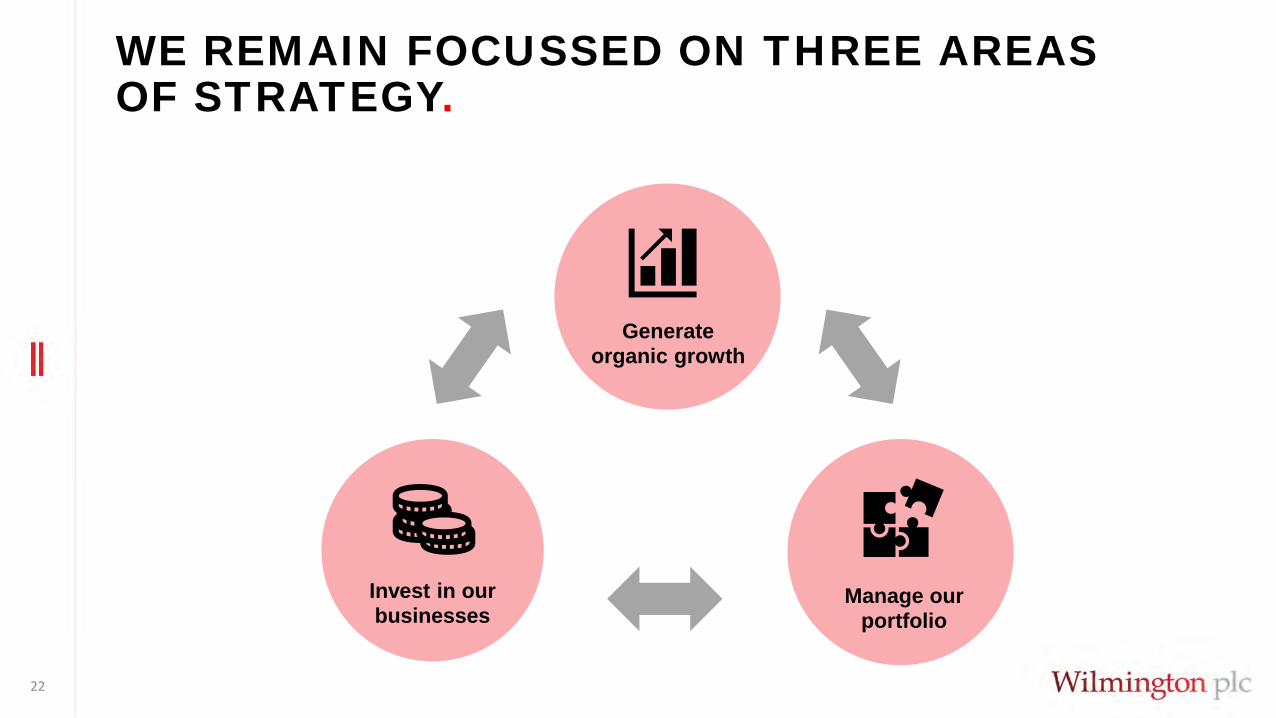
WE REMAIN FOCUSSED ON THREE AREAS OF STRATEGY.
22
Generate organic growth
Manage our portfolio
Invest in our businesses

MANAGING OUR PORTFOLIO.CHARACTERISTICS OF A WILMINGTON BUSINESS
23
• Differentiated offering• Market-leading position – within top 3• Defendable moat developed with owned IP• Strong brand positioning and high value to customers
• Attractive markets• Macro fit with Wilmington core markets • Micro fit with a growing end-user base – our solutions integrated into customer systems
• Product and revenue model• Attractive economics• Repeatable revenues • Benefits from and to Wilmington
• Strong leadership• Innovative• Sector knowledge
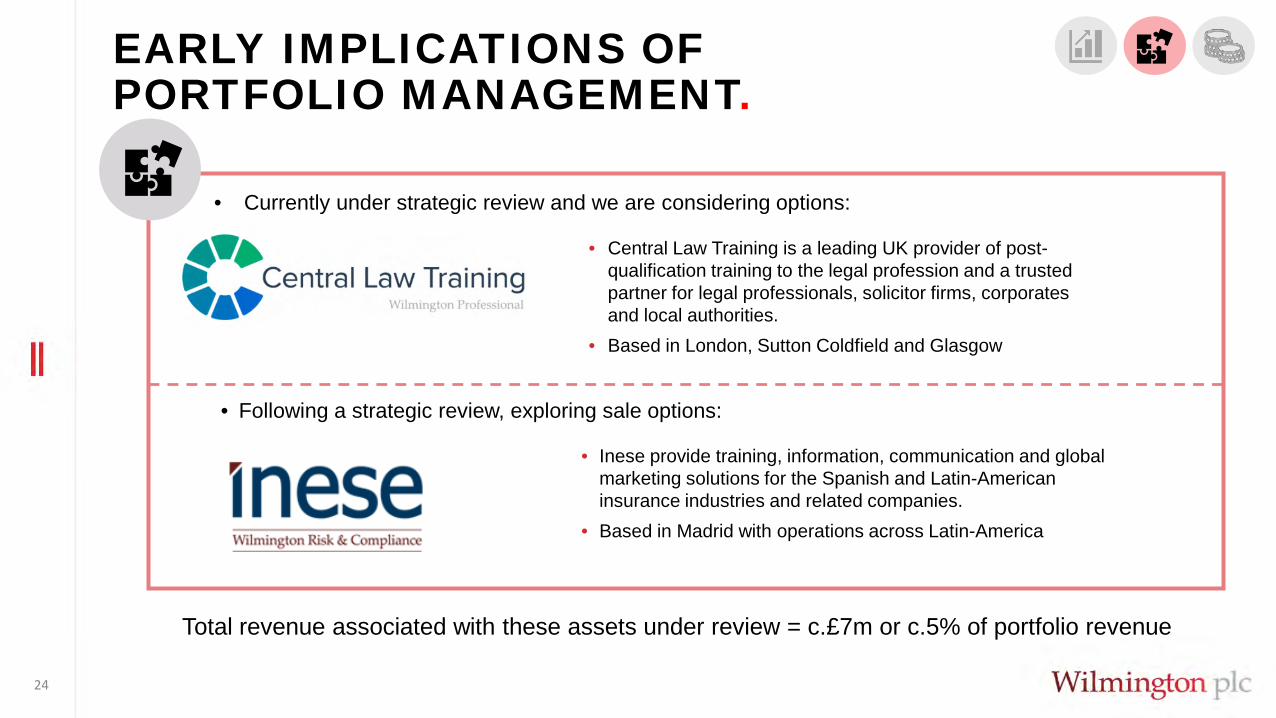
EARLY IMPLICATIONS OF PORTFOLIO MANAGEMENT.
24
• Currently under strategic review and we are considering options:
• Central Law Training is a leading UK provider of post-qualification training to the legal profession and a trusted partner for legal professionals, solicitor firms, corporates and local authorities.
• Based in London, Sutton Coldfield and Glasgow
• Inese provide training, information, communication and global marketing solutions for the Spanish and Latin-American insurance industries and related companies.
• Based in Madrid with operations across Latin-America
• Following a strategic review, exploring sale options:
Total revenue associated with these assets under review = c.£7m or c.5% of portfolio revenue
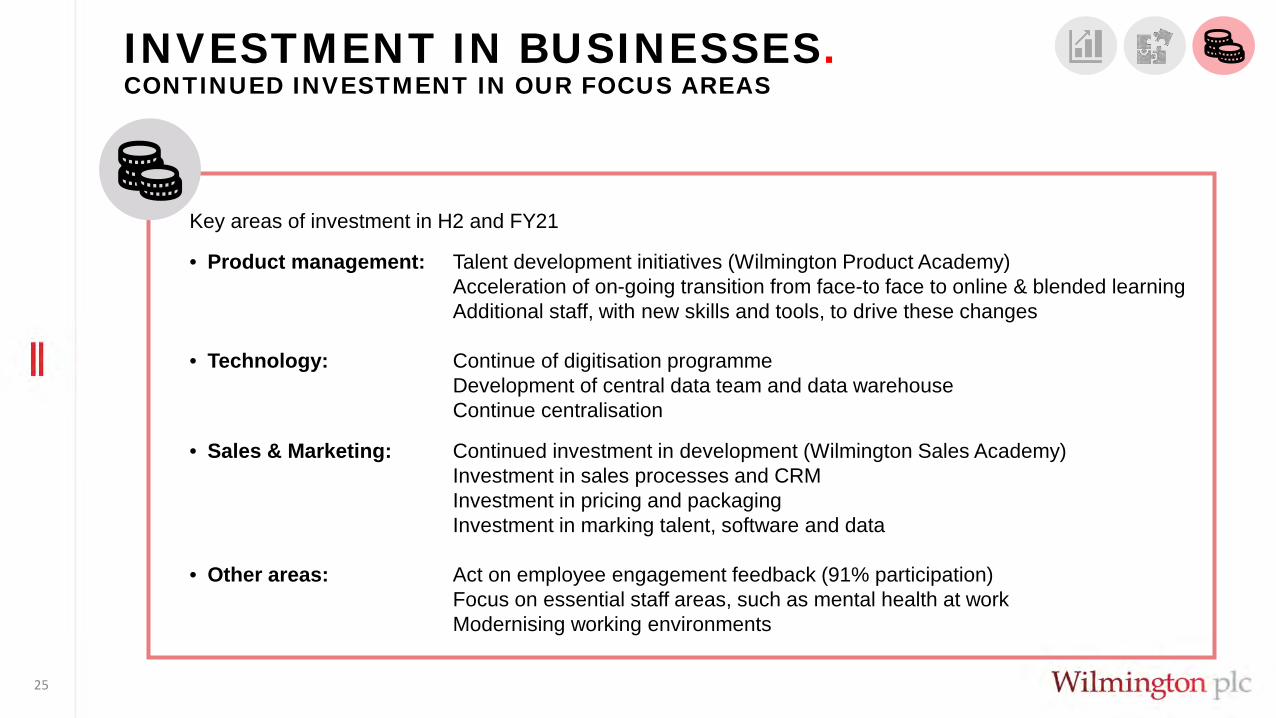
INVESTMENT IN BUSINESSES.CONTINUED INVESTMENT IN OUR FOCUS AREAS
25
Key areas of investment in H2 and FY21
• Product management: Talent development initiatives (Wilmington Product Academy)Acceleration of on-going transition from face-to face to online & blended learningAdditional staff, with new skills and tools, to drive these changes
• Technology: Continue of digitisation programmeDevelopment of central data team and data warehouseContinue centralisation
• Sales & Marketing: Continued investment in development (Wilmington Sales Academy)Investment in sales processes and CRMInvestment in pricing and packagingInvestment in marking talent, software and data
• Other areas: Act on employee engagement feedback (91% participation)Focus on essential staff areas, such as mental health at workModernising working environments
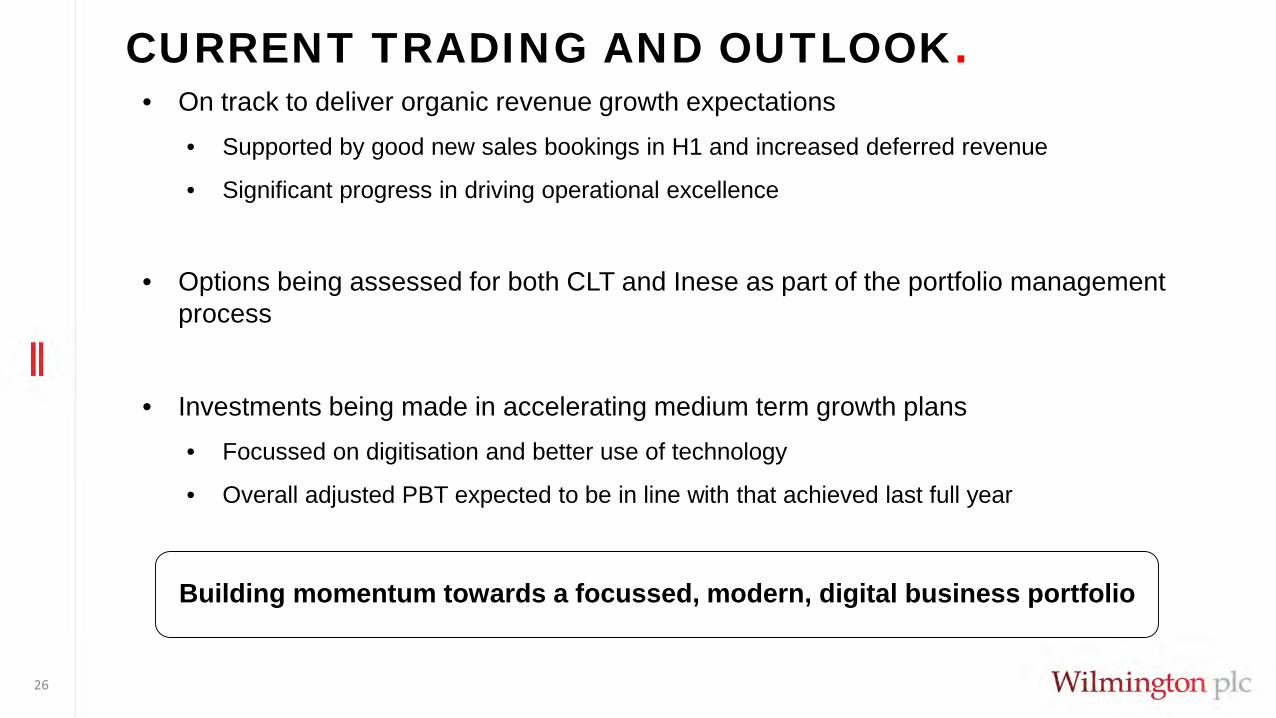
CURRENT TRADING AND OUTLOOK.
26
• On track to deliver organic revenue growth expectations• Supported by good new sales bookings in H1 and increased deferred revenue
• Significant progress in driving operational excellence
• Options being assessed for both CLT and Inese as part of the portfolio management process
• Investments being made in accelerating medium term growth plans• Focussed on digitisation and better use of technology
• Overall adjusted PBT expected to be in line with that achieved last full year
Building momentum towards a focussed, modern, digital business portfolio

Q & A.

APPENDICES.
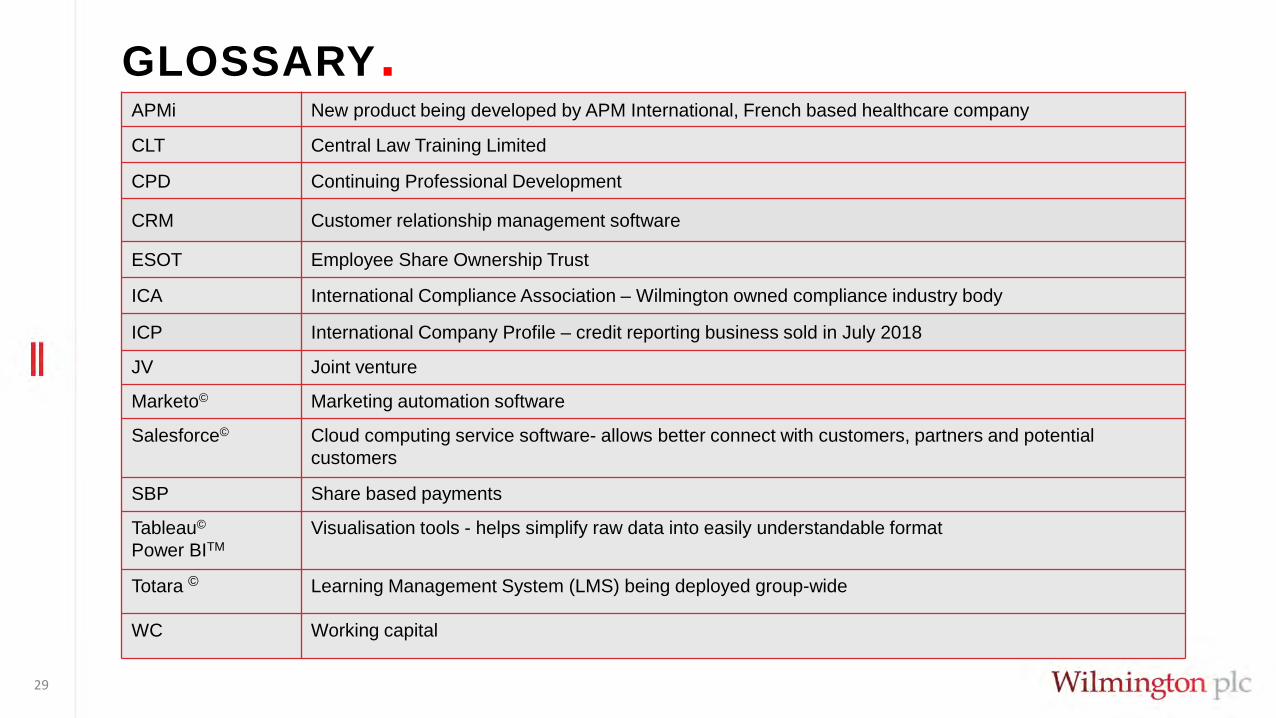
APMi New product being developed by APM International, French based healthcare company
CLT Central Law Training Limited
CPD Continuing Professional Development
CRM Customer relationship management software
ESOT Employee Share Ownership Trust
ICA International Compliance Association – Wilmington owned compliance industry body
ICP International Company Profile – credit reporting business sold in July 2018
JV Joint venture
Marketo© Marketing automation software
Salesforce© Cloud computing service software- allows better connect with customers, partners and potential customers
SBP Share based payments
Tableau©
Power BITMVisualisation tools - helps simplify raw data into easily understandable format
Totara © Learning Management System (LMS) being deployed group-wide
WC Working capital
GLOSSARY.
29
FINANCIAL PROGRESS OVERVIEW.
30
Revenue up(% of Group Revenue)
EBITA anticipated reduction(% of Group EBITA)
OVERALL MARGINS
13%
Wilmington plc (adjusted EBITA margin)
13%
30%
6%
15%
29%
6%
17%
EBITAMargin
Dec 2019
EBITAMargin
Dec 2018
30%
35%
35%Risk &Compliance
Professional
Healthcare
ReportedGrowth
3%
3%
1%
Revenue
£59.5m 2%
27%
13%
60%Risk &
Compliance
Professional
Healthcare
ReportedGrowth
3%
(1%)
(7%)
EBITA
Adj EBITA £7.9m 1%
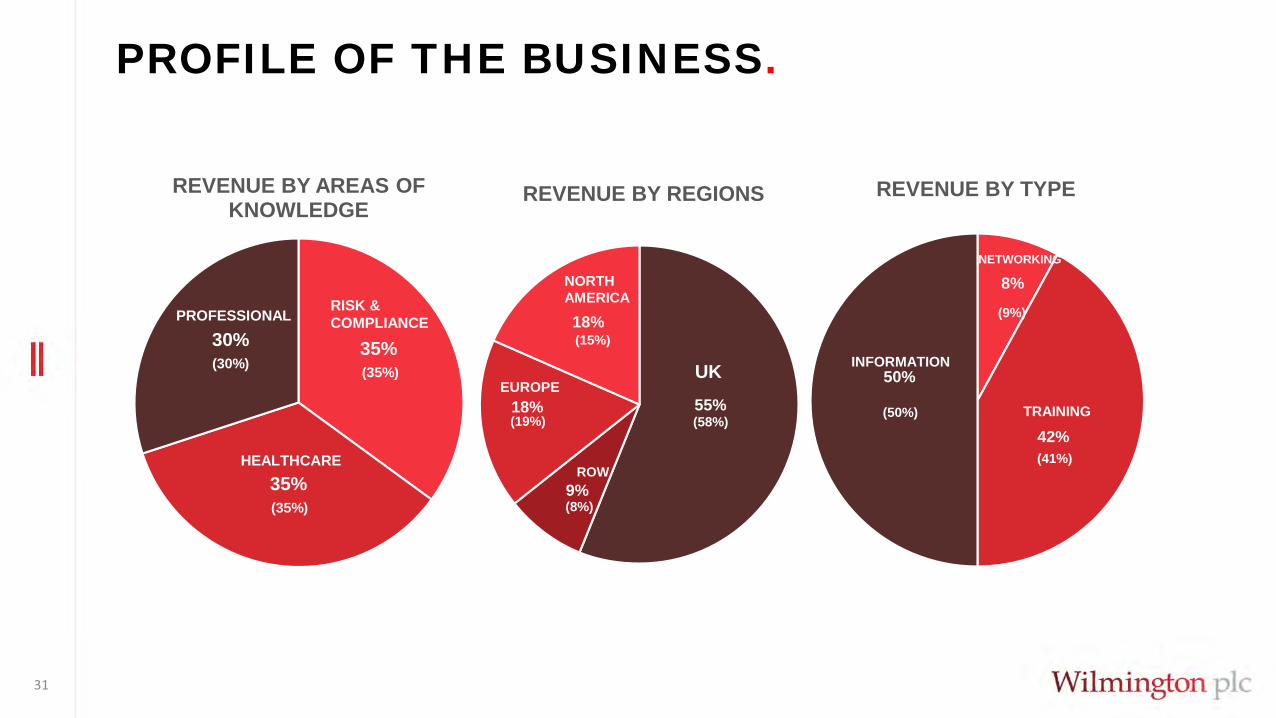
PROFILE OF THE BUSINESS.
31
35%
35%
30%
REVENUE BY AREAS OF KNOWLEDGE
(35%)
RISK &COMPLIANCEPROFESSIONAL
HEALTHCARE
8%
42%
50%
REVENUE BY TYPE
NETWORKING
INFORMATION
TRAINING(50%)
(9%)
(41%)
55%
9%
18%
18%
REVENUE BY REGIONS
ROW
NORTHAMERICA
UKEUROPE
(58%)(19%)
(8%)
(15%)
(30%) (35%)
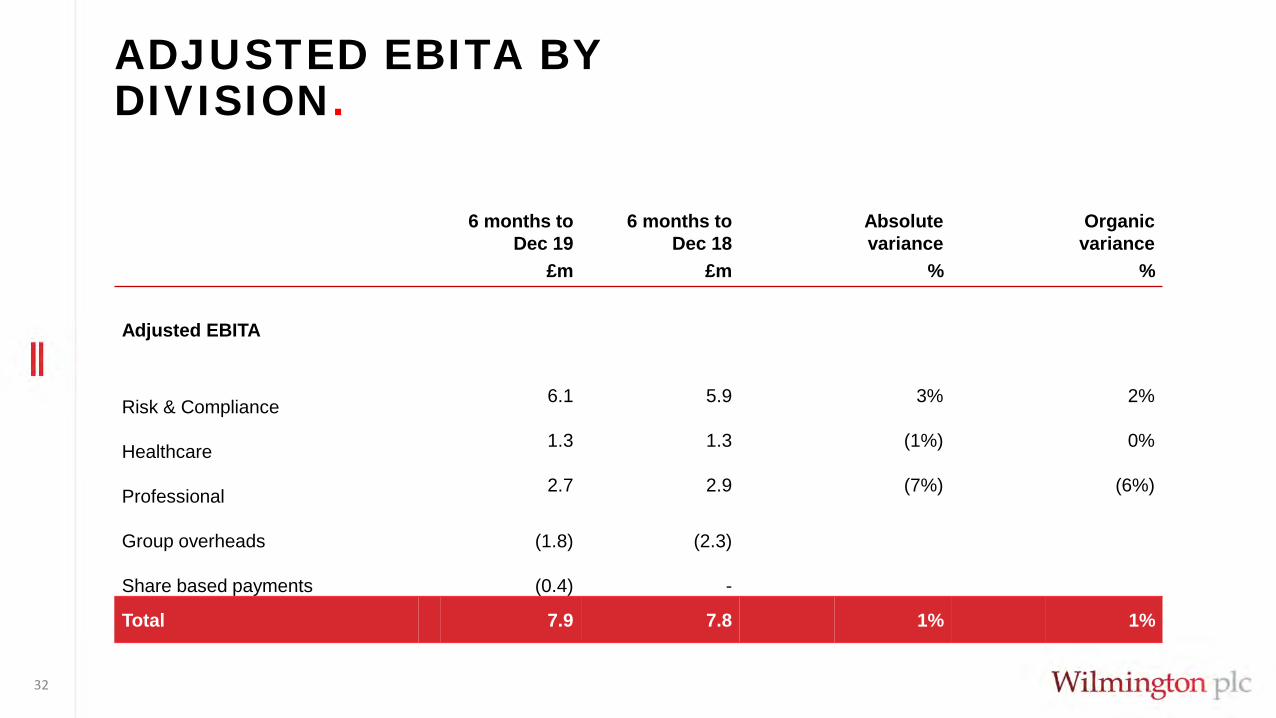
ADJUSTED EBITA BY DIVISION.
32
6 months to Dec 19
6 months to Dec 18
Absolutevariance
Organicvariance
£m £m % %
Adjusted EBITA
Risk & Compliance 6.1 5.9 3% 2%
Healthcare 1.3 1.3 (1%) 0%
Professional 2.7 2.9 (7%) (6%)
Group overheads (1.8) (2.3)
Share based payments (0.4) -
Total 7.9 7.8 1% 1%
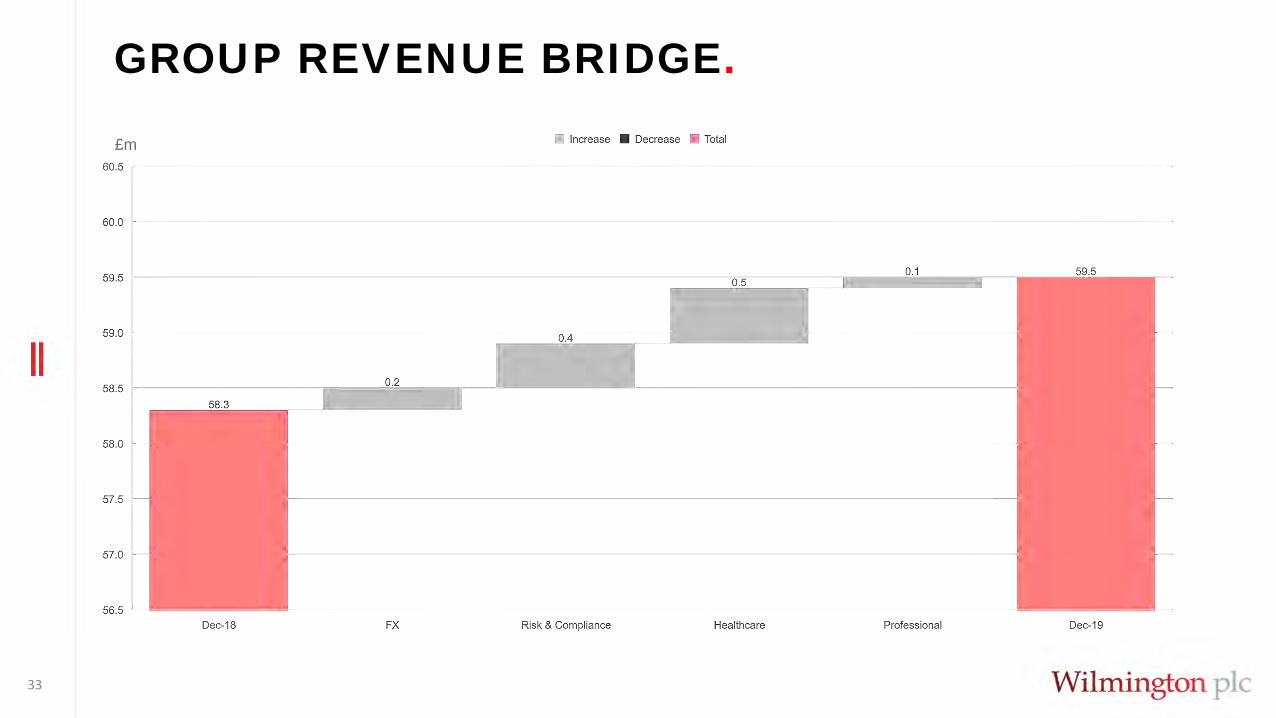
GROUP REVENUE BRIDGE.
33
£m
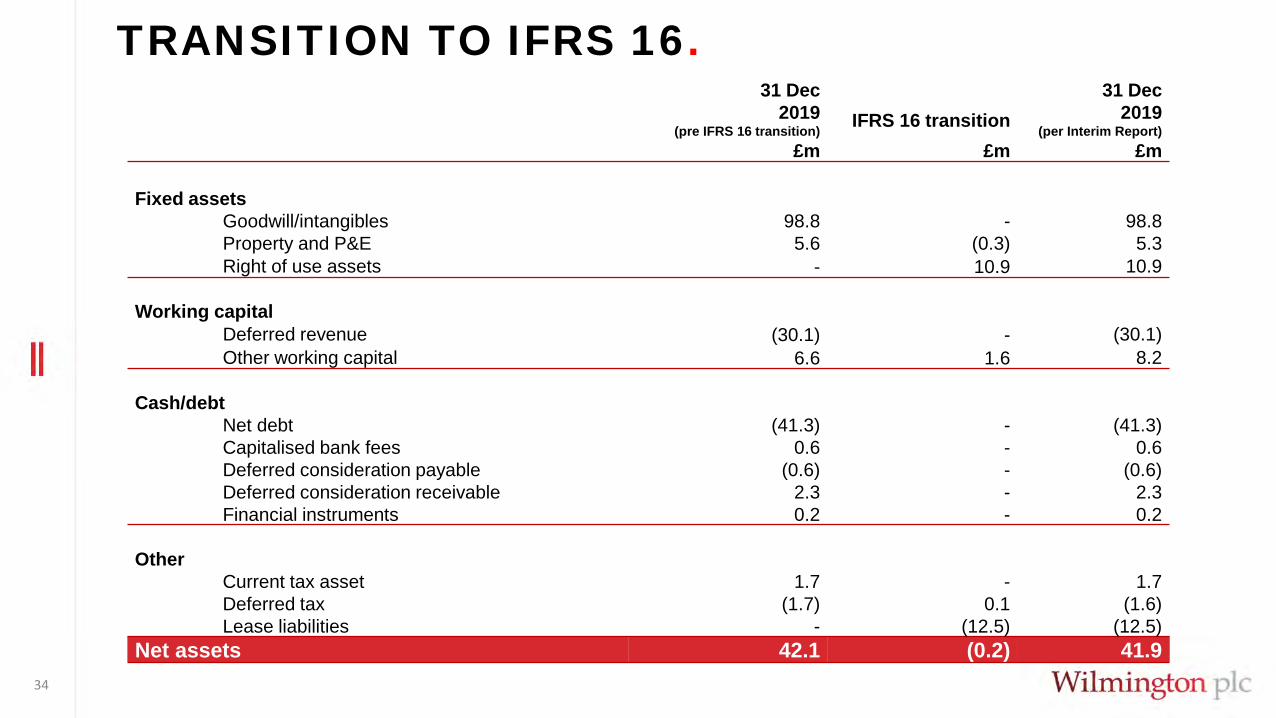
TRANSITION TO IFRS 16.
34
31 Dec2019
(pre IFRS 16 transition) IFRS 16 transition 31 Dec
2019(per Interim Report)
£m £m £m
Fixed assetsGoodwill/intangibles 98.8 - 98.8Property and P&E 5.6 (0.3) 5.3Right of use assets - 10.9 10.9
Working capitalDeferred revenue (30.1) - (30.1)Other working capital 6.6 1.6 8.2
Cash/debtNet debt (41.3) - (41.3)Capitalised bank fees 0.6 - 0.6Deferred consideration payable (0.6) - (0.6)Deferred consideration receivable 2.3 - 2.3Financial instruments 0.2 - 0.2
OtherCurrent tax asset 1.7 - 1.7Deferred tax (1.7) 0.1 (1.6)Lease liabilities - (12.5) (12.5)
Net assets 42.1 (0.2) 41.9

THANK YOU.