Embed Size (px)
Citation preview
Does Democracy Promote the Rule of Law?
Andreas Assiotis1
Department of Economics
Southern Illinois University – Carbondale
and
Kevin Sylwester2
Department of Economics
Southern Illinois University - Carbondale
JEL Classification: O40, O43, O55
Keywords: Democratization, Institutions, Economic Growth and Development
1 Corresponding Author: Andreas Assiotis, Department of Economics, MC 4515, Southern Illinois
University, Carbondale, IL 62901, 618-453-5038, [email protected]
2 Kevin Sylwester, Department of Economics, MC 4515 , Southern Illinois University, Carbondale, IL
62901, 618-453-5075, [email protected]
1
Does democracy promote the rule of law?
Abstract
Recent studies find that democratization increases economic growth. However, these
studies do not always consider the channels through which democratization raises
growth. This study considers whether or not democratization improves institutions that
have often been argued to increase economic growth. Utilizing a panel dataset from 1984
to 2007 for 127 countries, we examine whether democratization promotes the rule of law.
We generally find a positive influence from democratization upon the rule of law
although effects are strongest for sub-Saharan Africa.
JEL Classification: O40, O43, O55
Keywords: Democracy, Institutions, Rule of Law, Economic Development
2
1. Introduction
Many recent studies point to the importance of institutions for determining
economic growth rates or long run income levels.1 Acemoglu et al. (2005) and Acemoglu
(2010) provides surveys of this literature. North (1990) defines institutions as "the
humanly devised constraints that shape human interaction". He asserts that institutions
that secure property rights promote economic development and enhance growth. One
specific component of institutions that has received attention is adherence to the rule of
law. By “rule of law” we mean a judicial regime in which no one is above the law and
everyone is equal before the law (Dicey, 1885).2 People abide by judicial decisions and
people’s day-to-day actions are generally lawful in that they do not conflict with legal
codes. One reason to focus on the rule of law is its importance in protecting property and
promoting productive activities. Rodrik, Subramanian and Trebb (2004) state that in
principle the rule of law captures more elements describing institutional quality than do
other measures.
But a question then arises as to why the rule of law is more prevalent in some
countries than in others. Some have examined the effects of long-run historical factors
such as the degree of European influence or geographic factors. These factors then
determine the type of institutions which then affect long-run income levels. See Hall and
Jones (1999) and Acemoglu et al. (2001) as examples. This paper takes a different
approach, examining more contemporaneous factors. Specifically, we consider whether
1 On the other hand, others suggest that growth and accumulation of human capital cause
institutional improvement. See Glaeser et al. (2004) and Lipset (1960) for further details. 2 Also, see Stiglitz and Hoff (2004).
3
democracy promotes the rule of law and so whether democratization could then improve
the rule of law. Recent studies show that democratization raises economic growth3. Our
study explores whether promoting the rule of law could be a channel that explains these
findings. Some, on the other hand, have argued that the best way to improve these
institutions is under a benevolent dictator as opposed to a chaotic democracy. Olson et al.
(1996) claim that an autocrat with a long time horizon has incentives to protect property
rights because this increases the future income of his domain which in turn increases his
tax collections. Although long-lasting democracies, they claim, usually better secure
property rights than do new democracies or autocracies, instituting a longstanding
democracy is not feasible for an existing autocratic country. Under this view,
democratizations could then even worsen property rights, at least in the short run. But is
this the case or might democracy be better able to promote the rule of law both in the
short run and in the long run? Barro (1996) considered a similar issue. He found that
although greater maintenance of the rule of law is favorable to economic growth, he
found little evidence that democracy promotes the rule of law.
Our study differs from Barro`s in several dimensions. First, Barro utilizes cross-
sectional variation to identify long-run patterns. A possible problem from this
specification could arise from omitted variable bias and reverse causality (Giavazzi and
Tabellini, 2005). We will take steps below to more greatly mitigate these concerns.
Second, a cross-country sample does not utilize the within country variation in the degree
of democracy or adherence to the rule of law. A panel can exploit such variation. This
3 See Papaioannou and Siourounis (2008), Giavazzi and Tabellini (2005), Rodrik and Wacziarg
(2005) for examples and surveys of this literature.
4
could be especially important given Barro’s application. His democracy variable comes
from 1975 whereas his rule of law variable is from 1980. Therefore, he does not
incorporate the post-1980 events into his analysis, including the large number of
countries that democratized when the Soviet Union fell. Our study considers a panel
dataset, spanning 1984 to 2007, and so considers these changes. Use of a panel also
allows us to examine timing issues which were not feasible given Barro’s approach. We
consider short versus long-run effects of democratization upon the rule of law. Perhaps
democratization initially supports the rule of law but then the effects of democratization
turn negative as rent-seeking becomes more frequent. Or, perhaps effects become
stronger as democracies solidify. As a final distinction from Barro`s work, we examine
whether the effects of democratization upon the rule of law differ across regions such as
Sub-Saharan Africa and Latin America. Any differences could be a sign that cultures and
histories that differentiate global regions have a significant role on the association
between the two.
The remainder of the paper is organized as follows: Section 2 presents an
overview of the different studies on political and economic institutions. Section 3
provides a detailed description of our data. The methodology is outlined in Section 4.
The results are presented in Section 5. Finally, section 6 summarizes the core findings of
this study and provides suggestions for future work.
2. Literature Review
One research path has been to examine the role of economic institutions in
economic growth and development. Acemoglu, Johnson, and Robinson (2001), Hall and
5
Jones (1999), Engermann and Sokoloff (1997), Dollar and Kraay (2000), and many
others show that institutions enhance economic growth.
On the other hand, there has been a long debate on whether political institutions,
namely a democratic versus an authoritarian regime, influence economic growth. Earlier
studies do not show unambiguous associations between democracy and growth as
findings are mixed.4 Rodrik (1997) did not find any significant impact of democratization
on growth. Similarly, Przeworski et al. (2000) did not find any differences on long-run
growth across political regimes. On the other hand, more recent studies such as
Papaioannou and Siourounis (2008), Giavazzi and Tabellini (2005) and Rodrik and
Wacziarg (2005) employ panel data techniques and show a positive impact of
democratization upon economic growth. However, such findings then beg the question as
to why democratizations could increase economic growth.
Another focus of study has been to examine the association between political and
economic institutions. Tavares (2005) shows that democratization followed by rapid trade
liberalization decreases the level of corruption. According to Musila (2007), authoritarian
countries are slightly less prone to corruption than countries at intermediate levels of
democracy, but beyond the threshold level of democracy, more democratic countries are
less prone to corruption.5 Rivera-Batiz (2002), using a theoretical model, shows that
stronger democratic institutions influence governance by constraining the actions of
corrupt executives. On the other hand, Sunde, Cervellati and Fortunato (2008) examine
the role of interactions between political environment and inequality for the rule of law.
4 See Przeworski and Limongi (1993) for a survey of this earlier literature.
5 See also Rock (2008) where he claims an inverted U relationship between the age of democracy and corruption.
6
Their results suggest that democracy is associated with a better rule of law when
inequality is lower.
Our study complements these studies by exploring the impact that political
regimes have on the rule of law. Rodrik, Subramanian and Trebb (2004) state that in
principle the rule of law captures more elements determining institutional quality than do
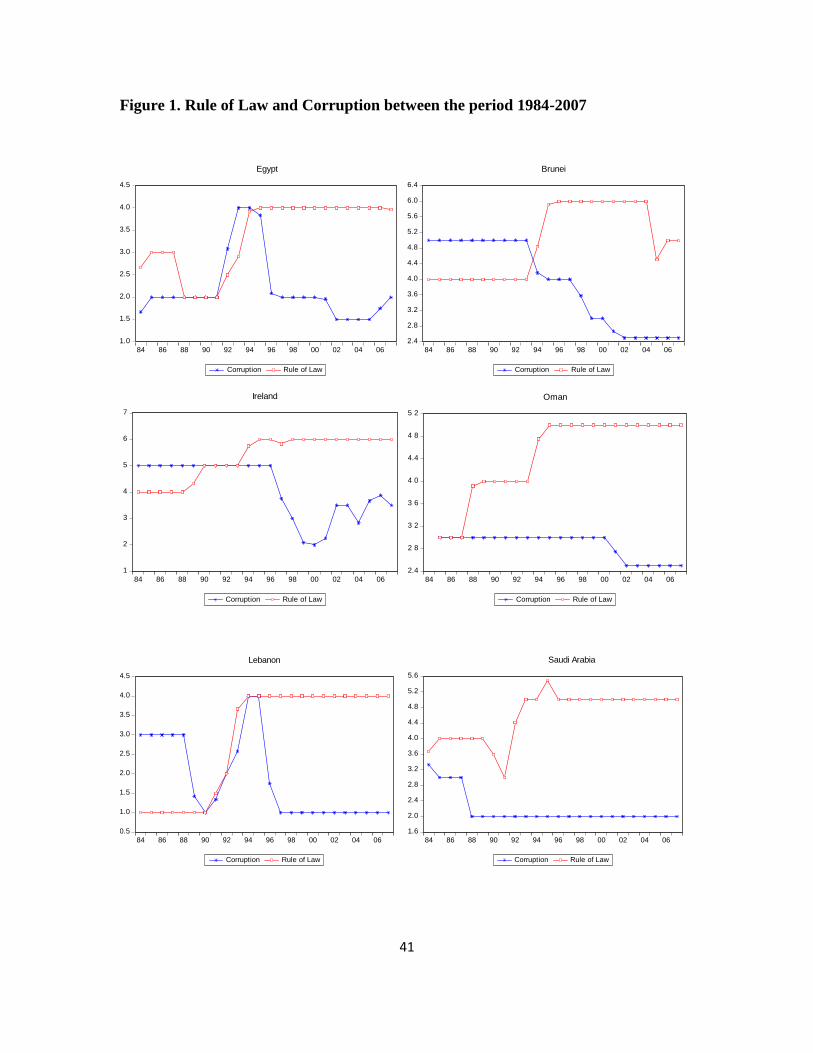
other measures, and so we focus on the rule of law in this paper. Moreover, these
institutional measures tend to be correlated with one another but important differences
can also arise. Figure 1 presents examples where movements in the rule of law and
corruption (another widely studied measure of institutional quality) greatly differ.6
3. Data
We analyze annual data from 127 countries during the period 1984-2007. Since
our measure of the rule of law starts from 1984 we cannot include earlier years. We use
annual data to most precisely pinpoint changes in political regime. The democracy and
rule of law variables are described below. We also follow the classification from the
World Bank in order to construct regional dummies7. Appendix 1 provides definitions
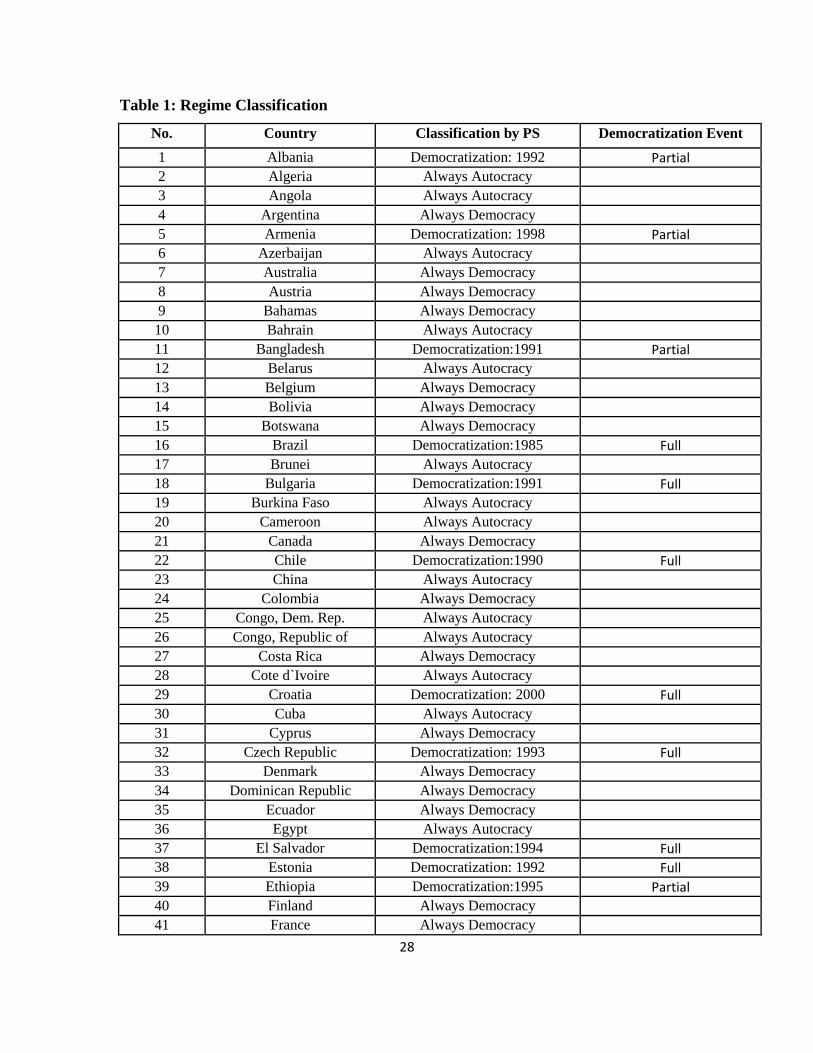
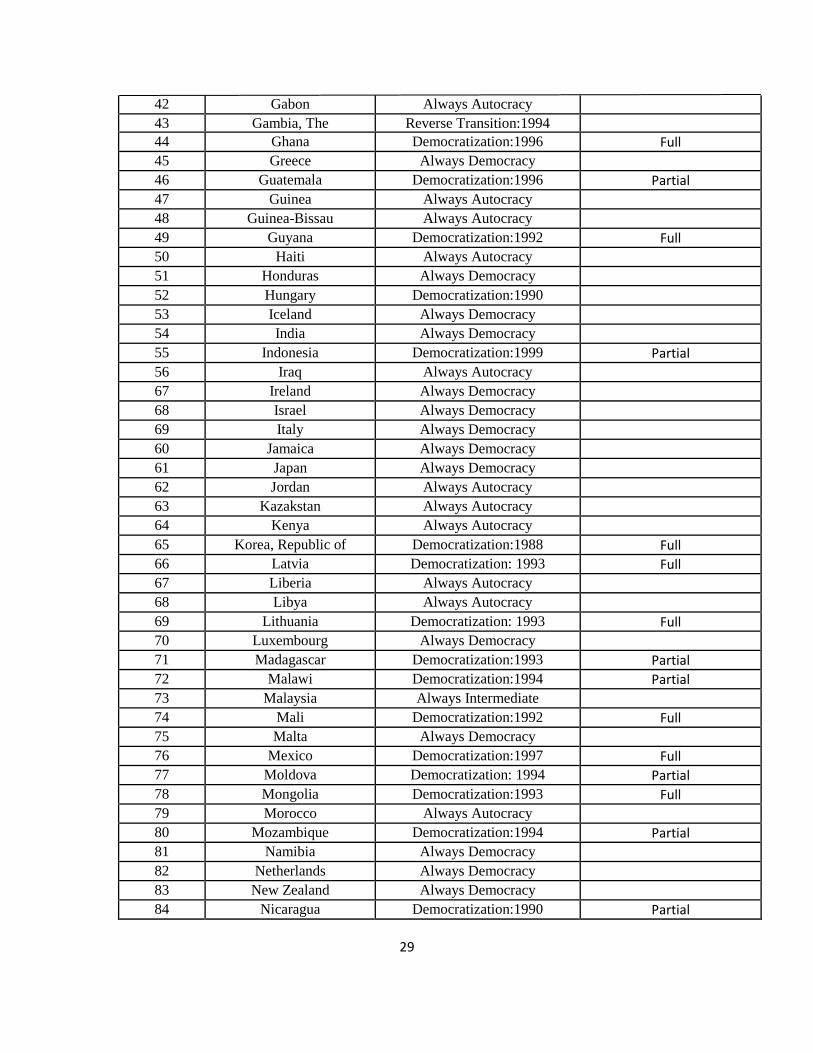
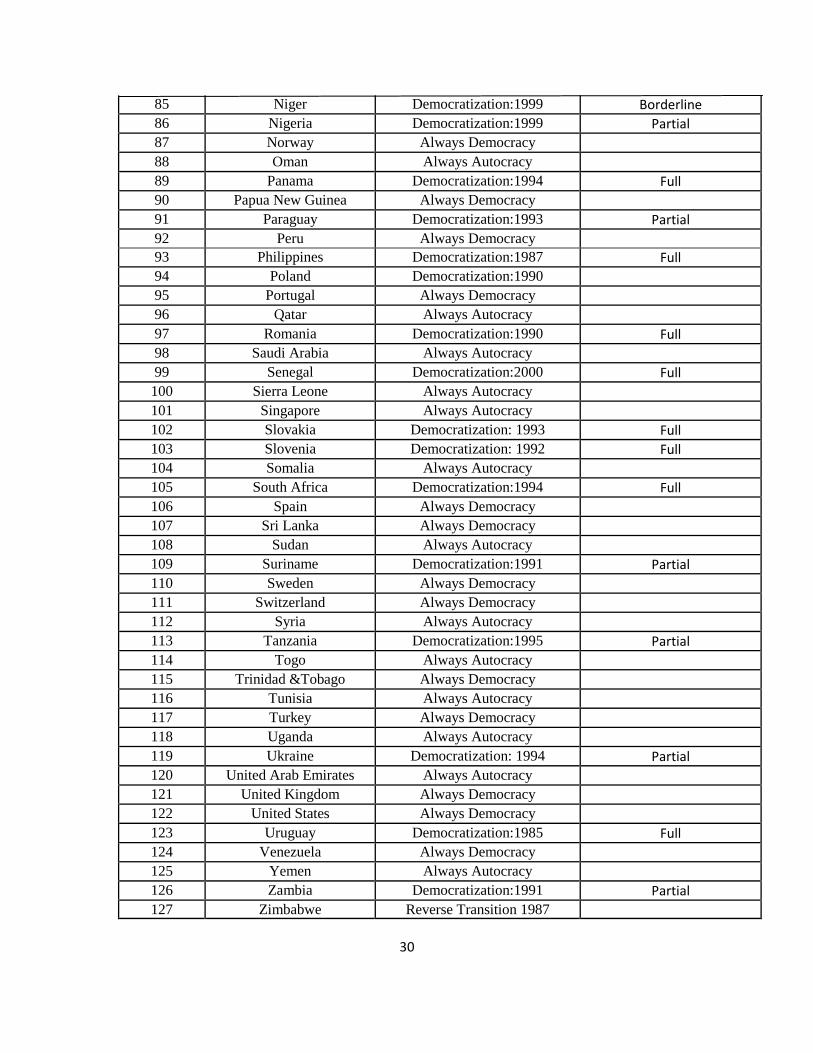
and sources of the data used in this study. Table 1 lists all the countries included in our
sample and categorizes their political regime according to Papaioannou and Siourounis
(2008).
6 The variable of corruption is compiled by Political Risk Services. This variable is constructed on
a scale from 0 to 6, with higher numbers indicating less corruption.
7 These are East Asia and Pacific (EAP), Europe and Central Asia (ECA), Latin America and Caribbean (LAC), Middle East and North Africa (MENA), South Asia (SE), Sub-Saharan Africa (SSA), and Western Europe (WE).
7
The rule of law [RULE] variable comes from the International Country Risk
Guide8,9
from Political Risk Services. This index reflects the degree to which the citizens
of a country are willing to accept established institutions to make and implement laws
and adjudicate disputes (Sunde et al., 2008). The ratings range from 0 to 6, where higher
scores indicate “sound political institutions, a strong court system, and provisions for an
orderly succession of power” (see Knack and Keefer, 1995). According to the ICRG, the
rule of law (law and order) is constructed as follows:
“Law and Order are assessed separately, with each subcomponent comprising
zero to three points. The Law subcomponent is an assessment of the strength and
impartiality of the legal system, while the Order sub-component is an assessment of
popular observance of the law. Thus, a country can enjoy a high rating — 3 — in
terms of its judicial system, but a low rating — 1 — if it suffers from a very high crime
rate or if the law is routinely ignored without effective sanction (for example,
widespread illegal strikes).”
Democracy [DEM] is measured using the dataset compiled by Papaioannou and
Siourounis (2008). They do not proffer any specific definition of democracy but they do
8 As an alternative measure for rule of law, we use the World Bank indicator (World Governance Indicators – WGI, rule of law) even though it only begins from 1996 (see Kaufmann et al., 1999). This variable ranges from -2.5 to +2.5 where higher numbers denote better institutional quality. 9 While the ICRG and WGI variables have been widely used in the literature, Glaeser et al. (2004) consider these variables as inappropriate to measure institutions such as adherence to the rule of law. They claim that these variables are outcome measures and do not measure institutions North (1990 defines as constraints on human interactions. More to the point, they claim that these measures do not code dictators, who choose to respect property rights, any differently than democratically elected leaders who have no choice but to respect them. However, we consider these variables as suitable proxies for institutions because they still provide constraints within society. For example, an impartial judicial system whose rulings are enforced still provide constraints for the majority of the populace.
8
list four criteria that a democracy must have: free, competitive, and fair elections;
elections involving actual transfers of power (as opposed to the military, for example,
setting aside the results of an election); broad suffrage in that no sizable part of the
population is excluded as in South Africa during apartheid; and political stability. Using a
variety of sources, PS then ascertain when a democratization episode occurred. They
further divide democracies into “full” and “partial” ones. A full democracy occurs when
Freedom House designates the country as fully free AND when the country has a Polity
IV score above seven (on a -10 to +10 scale) on its composite democracy index.10
See
Marshall and Jaeggers (2004) for a description of the Polity IV political data.11
Like PS,
DEMit equals one for country i at time t if country i fully or partially democratized during
or before time t. We will later examine full and partial democracies individually. Finally,
the democracy must be sustained to be classified as such according to PS. Zimbabwe, for
example, is not considered to be a democracy pre-1987 because it suffered a reversal
during that year.
We use the PS classification for several reasons. First, it can be used in a panel
since DEM varies over time. Second, the incorporation of both the Freedom House and
10 The Freedom House measure contains two indices: political rights (opportunities to vote in free and competitive elections) and civil liberties (freedom of speech, of the press, etc). Each is measured on a 1 to 7 integer scale with higher values denoting less political freedom. Freedom House then averages these measures to classify countries as free (2.5 or below), partially free (3.0 to 5.0), and not free (5.5 and above). 11 The PS data only extends to 2003. Therefore, in order to complete the missing years in our sample period we follow their methodology. Most countries do not change status since few countries lost democratic freedoms after 2003. However, an exception is Thailand that suffered a coup in 2007. Therefore, we removed Thailand from the set of democracies. We also removed Pakistan since the country underwent serious political challenges throughout our sample period.

9
the Polity IV measures creates a stricter standard of democracy thereby diminishing the
presence of ambiguous cases. On the other hand, this classification is still built upon
these commonly used measures in the growth literature. Not only are they familiar within
this literature but their widespread use makes comparisons with other studies more
straightforward. One disadvantage, of course, of using dummy variables relative to a
measure that can take on several values is that dummy variables are more coarse
measures of political change. However, a benefit is that political classifications of
countries are often given as “either/or” and so dummy variables get to the heart of this
dichotomy. It is also not clear how one should interpret indices such as the Freedom
House indices. Does the 1-7 Freedom House categorization of political rights merely
represent ordinal groupings? Or, can its increments be taken literally in that, for example,
the move from 3 to 2 represents the same degree of movement towards democracy as a
move from 4 to 3? If the Freedom House categorization is merely ordinal, then the direct
use of these indices to measure change becomes more problematic. Therefore, due to
these concerns we focus on the PS classification but will later consider other measures as
robustness checks such as the Freedom House average of the civil liberties and political
rights sub-indices, denoted as FH, and the Polity IV measure, denoted as POLITY. Use of
these additional variables can also account for temporary democratic episodes that use of
the PS measures miss (since a country must remain democratic to be classified as a
democracy).
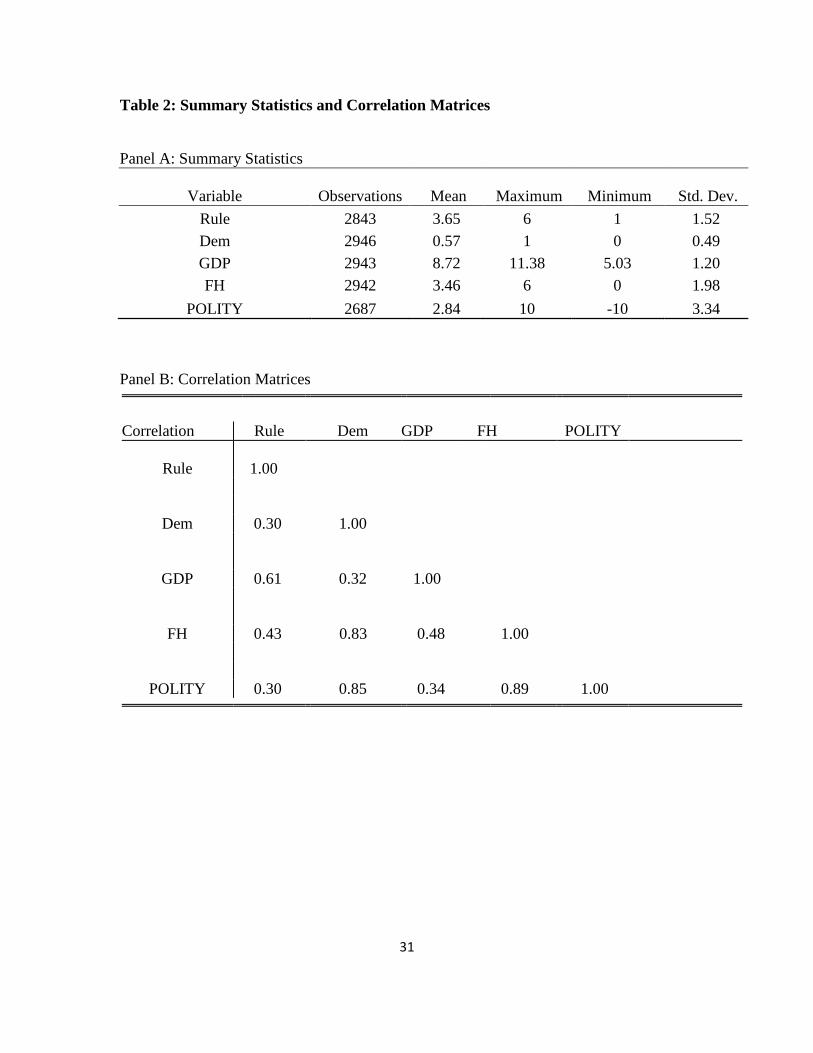
Table 2 contains descriptive statistics and correlations across the key variables.
Another control variable included in many specifications is the natural log of real GDP
per capita [INCOME], taken from the Penn World Tables, version 6.3. This variable is
10
used as a proxy for the level of economic development. Other control variables included
as robustness checks will be discussed below.
5. Methodology
This study will closely follow the empirical specification provided by Tavares
(2007) who examined the effect of democratization upon corruption. We apply this
approach since rule of law and corruption are measures of institutional quality although
not necessarily measures of the same aspect of institutions. Our specification is:
RULEit = β0i + β1t + β2 Xit + β3 RULE it-1 + β4 DEMit + εit …………… (1)
where i and t subscripts denote country and year, respectively. The intercepts β0i and β1t
indicate country and year fixed effects in order to capture the time-invariant country-
specific heterogeneity and the unobservable country-invariant time effects. RULE is the
rule of law and DEM denotes democratization. Matrix X will initially be empty but we
later control for other explanatory variables. The residual has zero mean but not
necessarily identical variance across countries. We also allow for arbitrary correlation
over time and so calculate standard errors as in Arellano (1987)12
.
Of note in (1) is that the right hand side contains the lagged dependent variable.
We include the lag for two reasons. First, there is likely to be persistence in the rule of
law even after controlling for time-invariant factors. Second, RULE is bounded between
12 Bertrand et al. (2004) find that use of such standard errors adequately accounts for serial correlation in the residuals.
11
zero and six, making it impossible for countries at zero to move downward or for
countries at six to move upwards. Therefore, future movements in RULE depend on its
current value and so we control for RULEit-1 when examining RULEit. Unfortunately, the
presence of a lagged dependent variable increases the potential for biased coefficient
estimates.13
Therefore, we also employ a dynamic GMM estimation model, the Arellano
and Bond (1991) first-difference GMM estimator, to test the robustness of our findings
where RULE and DEM are considered endogenous variables. We use the second lags of
these variables in levels to serve as instruments for the first differences.14
We compute
robust standard errors that allow for heteroskedasticity and serial correlation within
countries.
Equation (1) represents our baseline specification. However, to address other
issues we also consider the following extensions.
5.1 Full versus Partial Democratizations
Our democratization variable DEM does not distinguish full democracies from
partial ones. However, do further democratic reforms improve the rule of law relative to
initial steps toward democracy? Barro (1996) shows that partial democracies have higher
growth rates than do full democracies. To address this issue, we construct two new
13 However, Judson and Owen (1999) report that biases from the inclusion of lagged dependent variables on the right hand side are less than 3% when using more than 20 periods. We have over 20 years of data for many of the countries included in our sample. Nickell (1981) shows that biases from the inclusion of lagged dependent variables on the right hand side are small when the time dimension goes to infinity. Tavares (2007) does not utilize dynamic GMM methodologies. 14 We also consider the second and third lags in a subsequent specification. We do not consider further lags to keep the approach parsimonious and because Hansen test statistics approach one, raising concerns about the appropriateness of so many instruments in the model.
12
variables. DEM_P equals one for partial democracies only and DEM_F equals one only
for full democracies. The baseline specification becomes:
RULEit = β0i + β1t + β2Xit + β3RULEit-1 + β4DEM_Pit + β5DEM_Fit + εit ……(2)
If β4 and β5 differ, then the association between democracy and RULE depends upon the
degree of democracy.
5.2 Regional Differences
It is also possible that the effects of democratization upon the rule of law differ
across regions. Rodrik and Wacziarg (2005) find that democratization is more beneficial
upon growth in sub-Saharan Africa. Sylwester (2008) suggests that the effects of
democracy on growth are more positive in newer countries. Englebert (2000) argues that
many sub-Saharan African countries lack pre-colonial antecedents. Without traditional
power structures to serve as a political foundation, leaders must curry favor with various
groups to stay in power. In some cases, this could involve weakening (or eliminating)
property rights for some groups so as to benefit others. A recent example is Robert
Mugabe in Zimbabwe, confiscating land from some groups to give to his supporters.
Such policies politically benefit the leader in the short run at the expense of long-run
growth. Davidson (1982) provides a similar diagnosis as to why Africa has not grown as
quickly as other regions but also argues that democratization could provide a partial
solution as popular legitimacy could give leaders sufficient political power so that they
do not need to engage in such rent seeking activities. Perhaps leaders could then be better
13
able to enact institutional reforms that could further benefit the economy.15
If so, then the
effects of democratization upon the rule of law could be stronger for sub-Saharan African
than for other regions. Effects upon the rule of law could also differ for Eastern European
countries as their transitions occurred alongside the fall of the Soviet Union as well as
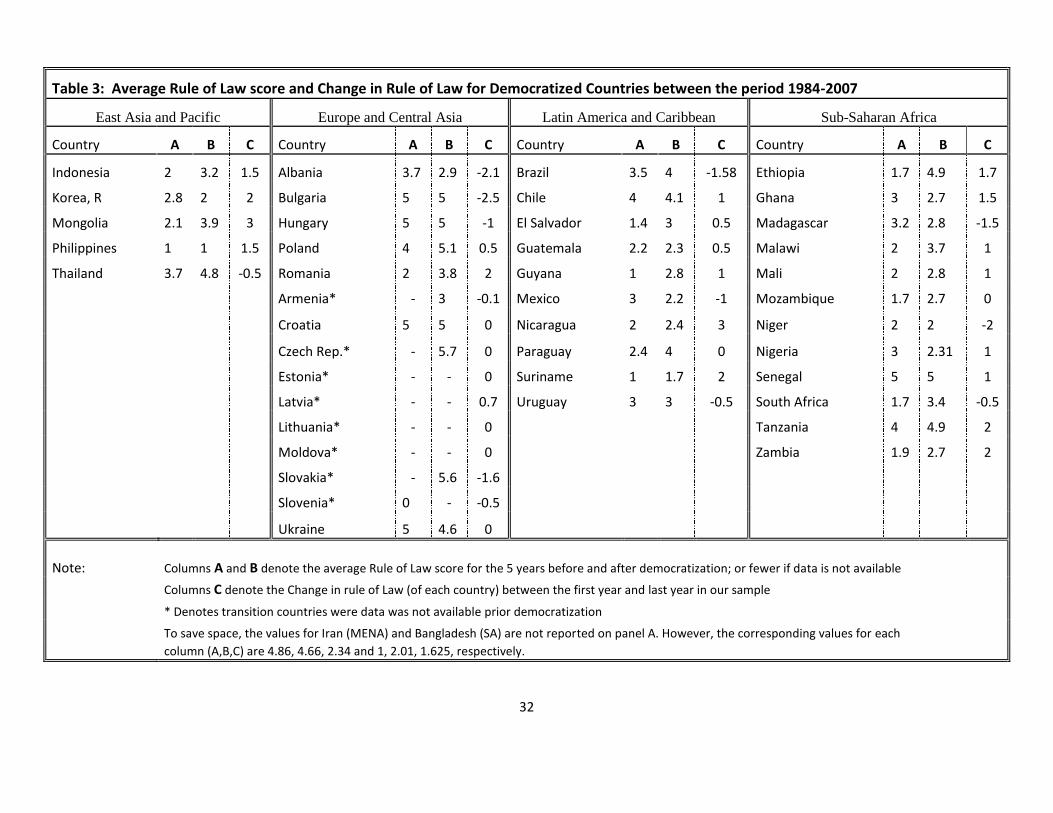
various economic reforms. Table 3 presents the change in the rule of law score for
democratized countries in each region of the world between 1984 and 2007. It also
reports the average rule of law score for the 5 years before and after democratization (or
for fewer years for the countries where data is not available). For some countries the rule
of law score went up and for others down. However, it appears that the effects of
democratization have greater improvements on the rule of law score for the Sub-Saharan
African countries.
To formally account for such differences, we include interactive terms in (1) that
include DEM and the respective regional dummies. These regions are:
East Asia and Pacific (EAP), Latin America and Caribbean (LAC), South Asia (SA), and
Sub-Saharan Africa (SSA).16
15 On the other hand, Zakaria (2003) claims that “although democracy has in many ways opened up Africa politics and brought people liberty, it has also produced a degree of chaos and instability…” Such effects are likely to diminish the rule of law.
16 With these groupings, the control group appears to be quite disjoint containing the Middle East and North Africa, Eastern Europe and Central Asia, Western Europe, the United States, and Canada. However, of these regions democratizations only occurred within Eastern Europe and Central Asia and so the coefficients on the interactive terms compare how democratization affects growth in the respective regions to that in Eastern Europe and Central Asia.
14
5.3 Short run versus long run effects
It is also possible that the effects of democratization upon the rule of law are not
instantaneous but appear gradually over time. Therefore, we construct seven dummy
variables based on the variable DEM: DPRIOR, DT, D1, D2, D3, D4, D5, and D6.
DPRIOR = 1 in the year before a democratization occurs. DT = 1 in the year when DEM
first goes to one from zero. D1 = 1 for the first year after democratization. D2, D3, D4,
and D5 equal one for the second, third, fourth, and fifth years (respectively) following
democratization. D6 equals one for the sixth year following democratization as well as
for all subsequent years. We consider D6 to capture the long run effect of
democratization upon the rule of law. DPRIOR controls for changes to the rule of law in
the year prior to democratization. Its inclusion is important if breakdowns in the rule of
law precede nontrivial political changes. The coefficient upon DT captures the change in
the rule of law during the transition year. The coefficients on D1 through D5 consider
short-run changes to the rule of law in the years following democratization. If
democratization quickly improves the rule of law, then at least some of these coefficients
are expected to be positive.
6. Results
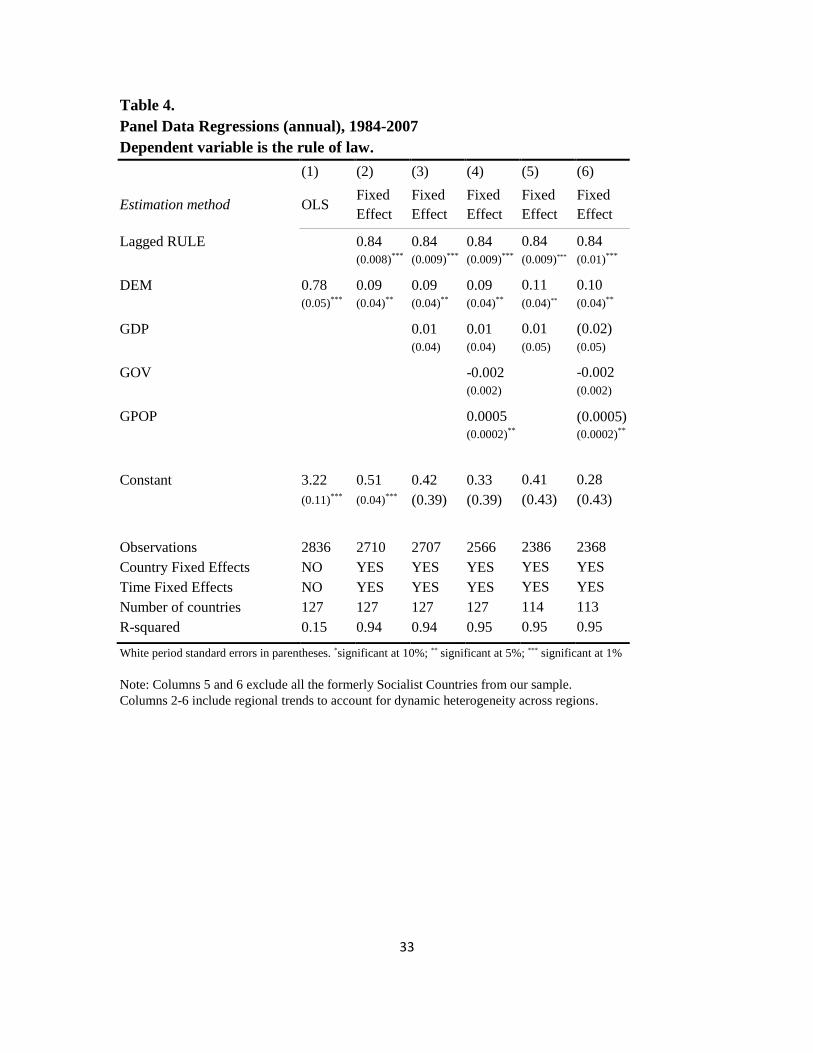
Table 4 presents results from our initial specifications. Column 1 provides the
simplest specification, omitting all control variables including the fixed effects which are
then added in columns 2 and 3. Our baseline specification is given in column 4 as both
country and year fixed effects are included but no other controls besides income. Column
5 shows that the results in column 4 are robust to the removal of the formerly socialist
15
countries. Giavazzi and Tabellini (2005) remove these countries due to the very special
circumstance, namely the fall of the Soviet Union, accompanying democratization.
Columns 6-8 include other control variables such as GOV and POPG. POPG
denotes the annual population growth rate from the World Bank’s World Development
Indicators. GOV denotes the share of government purchases in GDP and is from the Penn
World Tables.17
Coefficient estimates upon DEM remain robust.
To put the coefficient estimates into context, consider a country that
democratizes. A coefficient estimate of 0.10 predicts that RULE increases by 0.1 points.
This change is not large since RULE ranges from zero to six with a standard deviation of
1.5. However, this standard deviation partly stems from cross-country variation. Taking
the standard deviation of RULE for each country and then averaging across countries
produces a value of 0.7. That is, 0.7 is the average standard deviation of RULE for each
country. Therefore, a change in RULE of 0.1 represents just under 15% of the average
within country standard deviation. This magnitude suggests that democratization can
positively affect the rule of law but that one should not expect large improvements in the
rule of law. Democratization helps but is not a silver bullet. Similar magnitudes are found
in many of the below robustness checks.
In order to make control and treatment groups more similar we remove in Table 5
the countries that were always democratic throughout our sample period, 1984 – 2007.
Therefore, the coefficients on DEM now compare the effect of democracy on the rule of
17 We also added the adult (over 15) literacy rate as an additional control to account for human
capital. We do not report these results since many observations are missing. Nevertheless, the
coefficient on DEM remains robust.
16
law in countries that became democratic relative to those countries remaining
nondemocratic. The previous specifications compared the change in the rule of law in
countries that became democratic after 1984 to those that did not, either because they
were already democratic or because they remained nondemocratic. Columns one through
four of Table 5 present these results. The coefficient estimates upon DEM remain
positive and statistically significant. Columns five and six repeat these specifications but
again exclude all the former socialist countries.
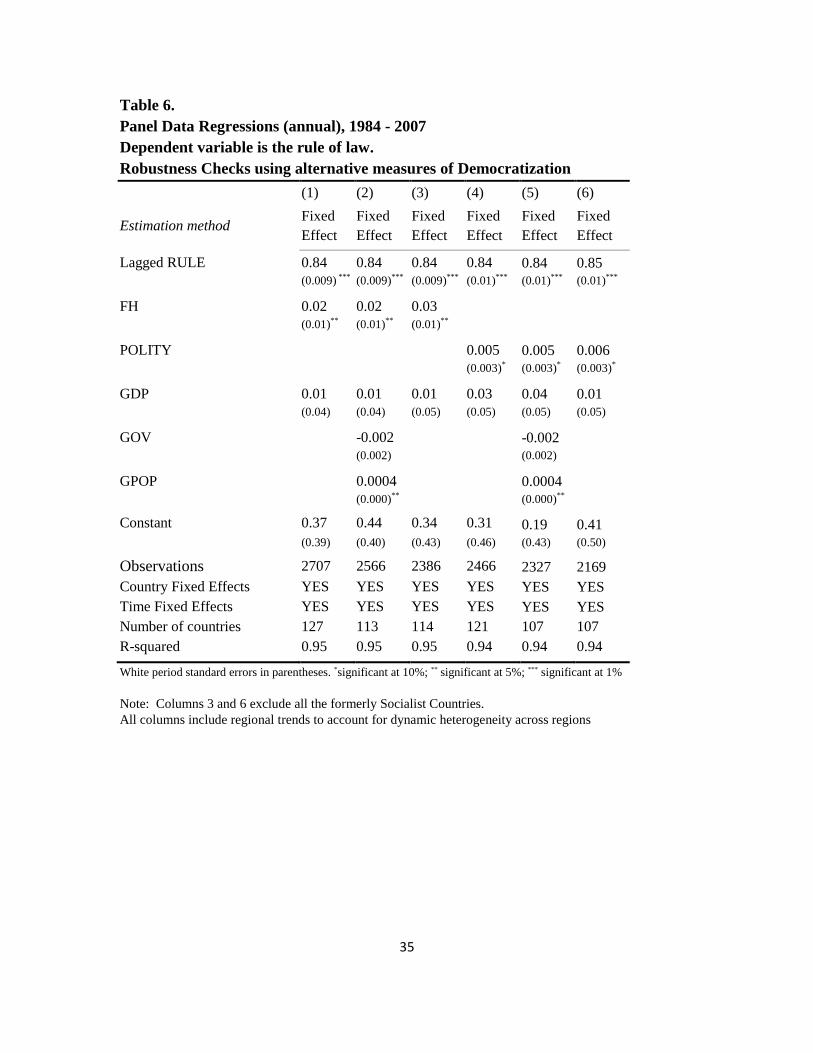
We further check the robustness of our results by replacing the variable DEM
with two alternative measures of democracy, namely the Freedom House [FH] and the
Polity IV [POLITY] indices. The estimates in Table 6 confirm the findings of our earlier
analysis. More specifically, in columns one through three, where the FH index is
employed to measure democracy, the results show a positive relationship between
democracy and the rule of law. Columns four through six of Table 6 use the POLITY
measure of democracy. The estimated coefficient on POLITY remains positive but only
significant at the 10% level.
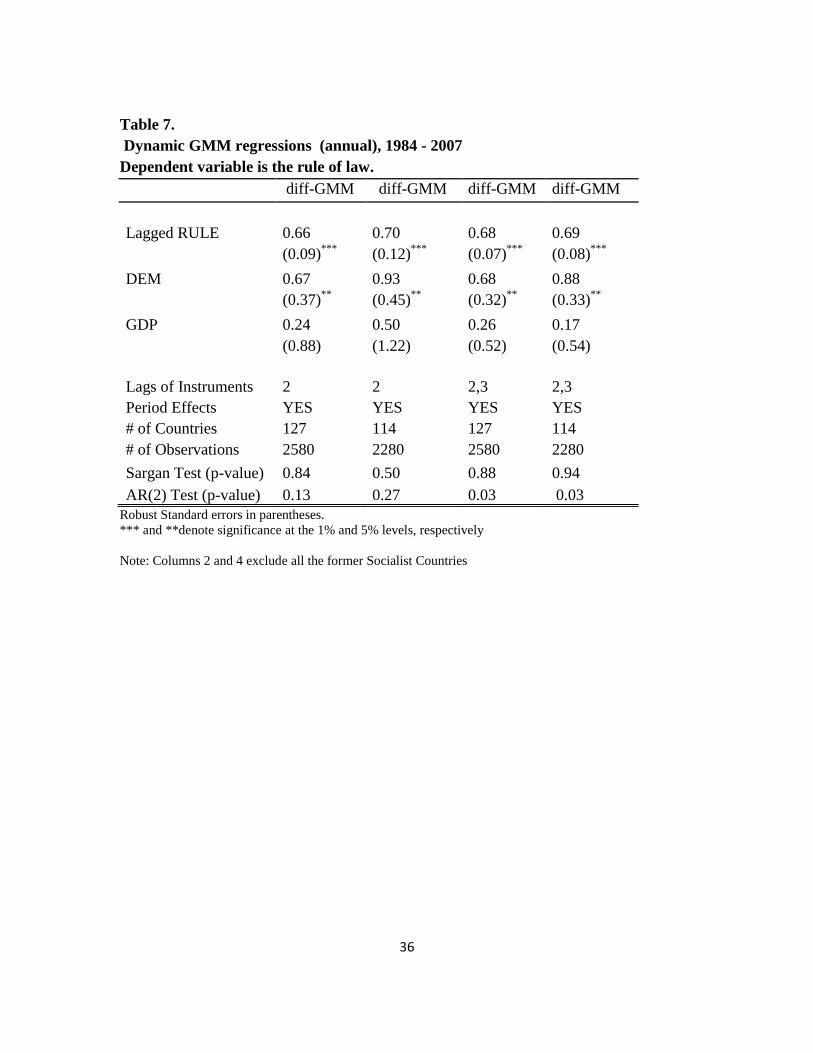
As described above, a potential problem is the presence of right hand side
endogenous variables. Therefore, we utilize dynamic GMM estimation as discussed
earlier. Table 7 presents the results of this methodology. In both specifications the only
regressors are the values of lagged rule of law, democratization and per capita GDP. The
results of the GMM estimation remain robust. The coefficient on DEM is positive and
significant. However, the GMM estimates of the coefficients are much larger than our
OLS estimates, nearly equaling the average within-country standard deviation. One
possibility for the increase in coefficient estimates is due to reverse causation. Perhaps
17
autocratic countries although ones with some adherence to a rule of law are less likely to
become democratic as citizens have less desire to change the status quo. If the GMM
methodology better “removes” (relative to least squares estimation) this negative effect
from rule of law to democracy then one would expect coefficient estimates to increase in
magnitude.
Therefore, we generally find a positive association between democracy and the
rule of law. Countries that became democratic during the sample period experienced
improvements in the rule of law relative both to countries that never underwent a change
in status (that is, remained democratic or nondemocratic) and to only those countries that
remained nondemocratic (as in Table 5). These results are robust to excluding former
socialist countries and so findings are not solely driven by the fall of the Soviet Union.
However, to what extent are these findings applicable to specific regions and how fast
does the rule of law improve following democratization? Do partial democracies affect
the rule of law differently than do full democracies? We now consider these issues.
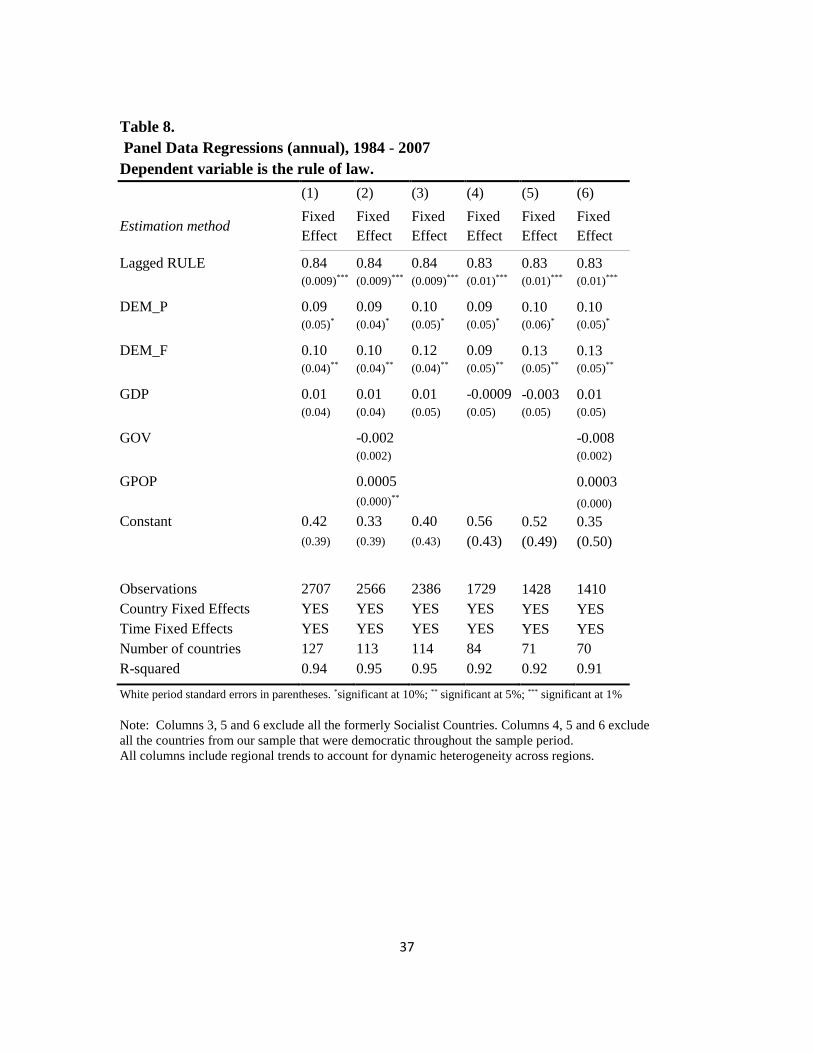
Table 8 presents the results under the specification in equation (2). We replace
DEM with two variables, DEM_P (partial democracies) and DEM_F (full democracies)
and re-run some of the above specifications. In column 1, when we do not control for
period effects, the coefficient estimates for both variables are positively and statistically
significant. Column two includes both period and country fixed effects. The coefficient
estimate on DEM_F is positive and significant at the 5% level. On the other hand, the
parameter estimate for DEM_P is positive but only significant at the 10% level.
However, the magnitudes of the coefficient estimates of both variables are very similar.
Therefore, we find some evidence that the rule of law improves when countries first
18
become democratic even if democratic reforms are not complete. Evidence is statistically
stronger that countries becoming fully democratic improve the rule of law. Nevertheless,
no evidence arises that the effect upon the rule of law differs between the set of countries
becoming partially democratic and those becoming fully democratic. That is, the benefit
of democratic reforms appears to come with initial reforms, regardless of whether the
democracy becomes stronger.
These results also better explain a finding from Assiotis and Sylwester (2010).
They do not find a strong association between (their analogs of) DEM_F and RULE.
However, the focus of that study was upon full democratization and so their control
group consisted of three groups of countries: countries that remained nondemocratic,
countries that were fully democratic throughout the sample period, and countries that
became only partially democratic. The similarity of coefficient estimates between
DEM_F and DEM_P in Table 8 provides a possible explanation for their results. With
little difference between the two groups of democracies, relegating partial democracies to
the control group would then lessen differences between full democracies and the control
group.
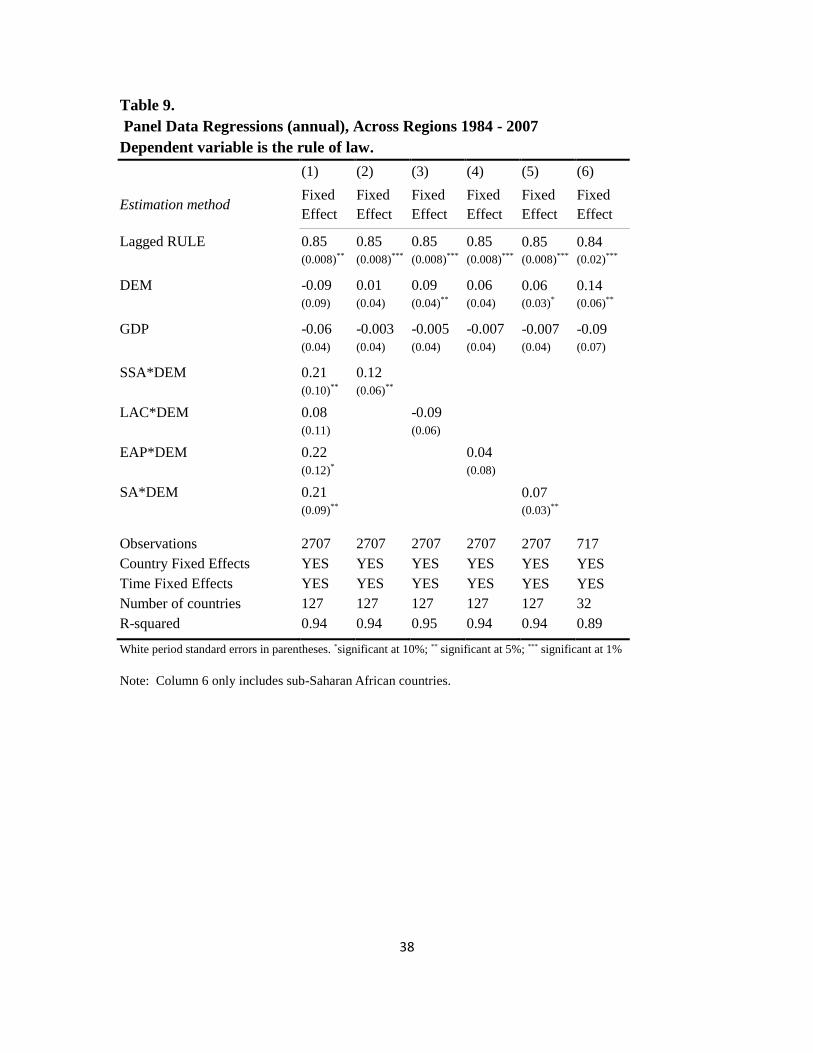
To explore whether the effects of democratization upon the rule of law are
parallel across regions we interact DEM with regional dummies. Columns one through
five of Table 9 present various specifications allowing for such interactions.
Alternatively, in column six we run our baseline specification only for sub-Saharan
African countries. We find that democratization in East Asia and Pacific and sub-Saharan
Africa promotes the rule of law more than it does in other regions. This finding, at least
for sub-Saharan Africa, possibly stems from the fact that institutions in these countries
19
were relatively weaker prior to democratization and so perhaps political reforms sparked
reforms along other dimensions as well. Our results can directly speak to findings from
past studies suggesting that the benefits of democratization are higher in African
countries compared to the rest of the world as in Rodrik and Wacziarg (2005) and
Sylwester (2009). Our results suggest that these findings for sub-Saharan Africa can be
explained by the greater improvement in the rule of law within this region following
democratization.
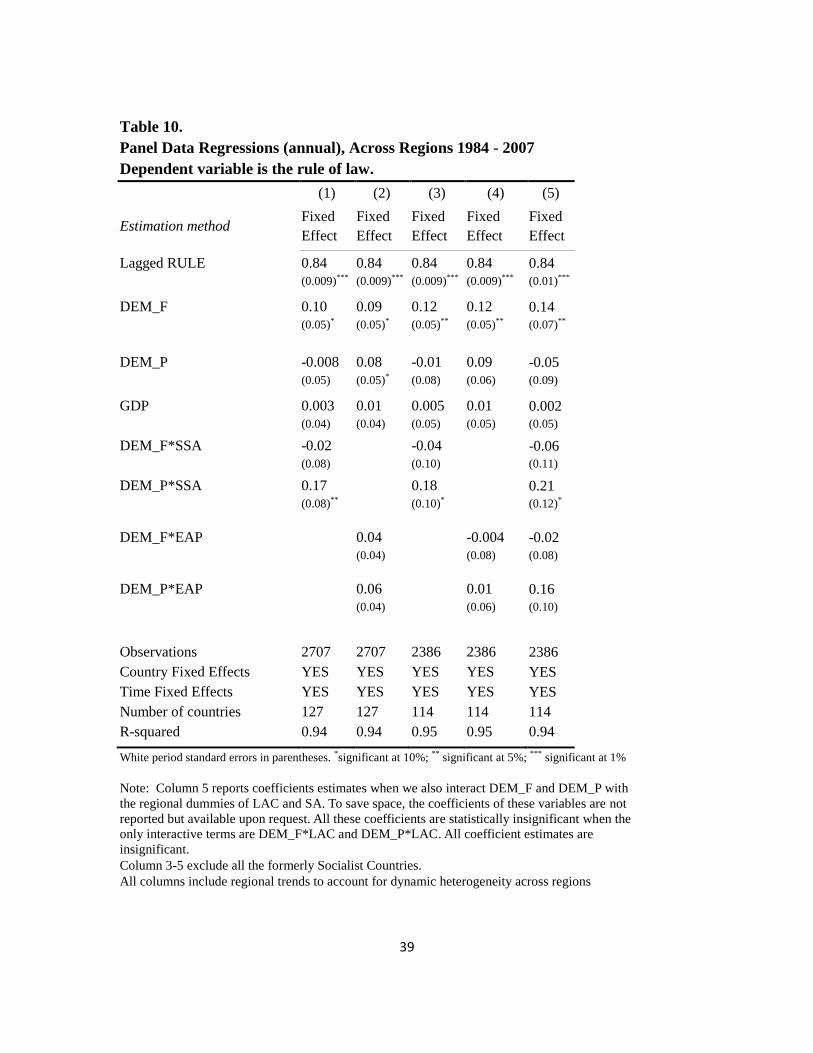
We also considered a combination of the two extensions described above. We
again allow for differences across regions but replace DEM with DEM_F and DEM_P.
Perhaps some types of democratizations are more beneficial in some regions versus
others. Table 10 presents the results which somewhat support this contention. In all
specifications DEM_F is always positive and significant either at the 5% or 10% level.
However, coefficient estimates on the DEM_P – SSA interactive terms are large in
magnitude and statistically significant. Perhaps in Africa, unlike other regions, the
marginal benefits of democratization upon the rule of law come from the initial steps
toward democratization.
The above analysis generally finds evidence that democratization promotes the
rule of law. However, a weakness of this specification is that the effects of
democratization on the rule of law are constrained to be instantaneous. But this might not
be the case. For example, democratization could initially have negative effects due to
transitional costs. Effects could then become stronger as democracies solidify. Of course,
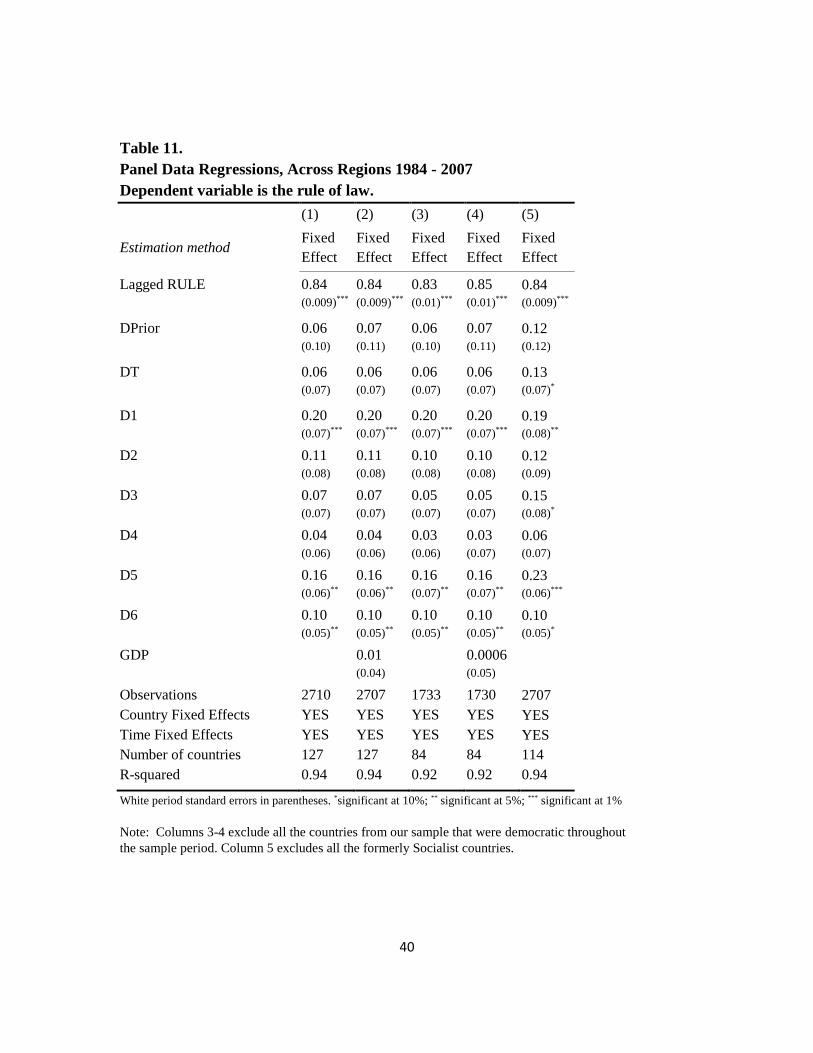
other possibilities exist as well. To address these issues, we apply the model of section
20
5.3. Table 11 provides the results. As expected, coefficients estimates across these
dummies differ.
While for the first year following democratization (D1) the coefficient estimates
are positive and statistically significant, the results appear inconclusive for the three
subsequent years. For some specifications the estimates appear to have a positive and
significant effect and for others insignificant. It is not clear what these results imply. One
possibility is that the rule of law truly improves following democratization but then
deteriorates for some reason as the democracy solidifies. Another possibility, however, is
that the increase in the rule of law is not “real” but stems from a presumption of the
analysts creating the RULE index that the rule of law should be higher when a country
becomes democratic. Perhaps such analysts give the benefit of the doubt in such cases
when information is limited as to the changes that democratization creates. In the
following years, if more information become available that changes to the rule of law are
small or nonexistent, then their re-assessments better reflect this fact. If the latter
interpretation is correct, then the fifth year following democratization provides the
strongest evidence as to when improvements in the rule of law actually occur.
Nevertheless, in all specifications our results suggest that the benefits of democratization
upon the rule of law are greater in the long-run as the democracy solidifies. This finding
is in line with empirical findings from past research. More specifically, Papaioannou and
Siourounis (2008) provide empirical evidence suggesting that the merits of
democratization on growth come in the long-run. It is also less likely that the larger
coefficient on D6 stems from analyst error since, presumably, assessments should
become more accurate with a longer time frame of information to identify changes.
21
7. Conclusions
This paper investigates the association between democratization and rule of law.
We generally find that the rule of law increases as countries become democratic although
results are strongest for sub-Saharan Africa and the East Asian-Pacific region. Utilizing
various panel data techniques we find that democratization does, indeed, positively
influence the rule of law. Additionally, our results reveal that the timing of the effects of
democratization upon the rule of law also matters. More specifically, we show that
adherence to the rule of law strengthens as democracies consolidate. These results can
help us better understand why democratization could raise economic growth as found in
the recent literature. Nevertheless, investigating other channels through which democracy
could affect growth is warranted.
Also, we take a step further and explore whether the effects of democratization on
the rule of law differ across regions. We find the strongest effects of democratization
upon the rule of law for sub-Saharan African countries. Moreover, we also find evidence
that even partial democratic reforms can improve the rule of law in this region. Many
sub-Sahara African countries remain nondemocratic. Our results suggest that democratic
reforms in these countries could be particularly beneficial, at least to the extent that the
rule of law also increases economic growth rates as found by others. From a policy
perspective, sub-Saharan Africa could be a focus of the international community in
promoting democratic reforms, since the payoffs to such reforms could be relatively
larger in this region than in others. Of course, the devil is in the details. Future work will
22
consider what aspects of democratic reforms are most conducive to improvements in
economic institutions such as the rule of law.
.
23
Appendix
Variable Definitions and Sources
GDP: Natural log of GDP per capita adjusted for PPP. Source: Penn World Tables,
version 6.3 (Constant prices: Chain Series).
GOV: Annual Government Share of Real GDP per capita. Source: Penn World Tables,
version 6.3 (Constant $).
GPOP: Annual Population Growth. Source: World Bank World Development Indicators
CD-ROM (2009 Edition).
LIT: Literacy rates (% of people ages 15 and above). Source: World Bank World
Development Indicators CD-ROM (2009 Edition).
RULE: International Country Risk Guide indicator of the rule of law from Political Risk
Services, Inc.
POLITY: Polity IV measure of democracy from the Polity IV project from Marshall and
Jaggers (2004).
FH: Average of the Freedom House political rights and civil liberties indices. To ease
interpretation of the coefficient estimates we reversed the scaling so that a “1” indicates
fewest political freedoms and “7” the most. Source: www.freedomhouse.org.
DEM: Dummy variable that equals one for a partial or full democracy and equals zero
otherwise. Source: Papaioannou & Siourounis (2008). See Table 1 for their
classification. From DEM, we also derive DEM_P and DEM_F. The former equals one
only for partial democracies and the latter equals one only for full democracies.
The classification of countries in Table 1 between democratic and authoritarian regimes
is taken from Papaioannou and Siourounis (2008).

24
References
Acemoglu, Daron. (2010) “Theory, General Equilibium, and Political Economy in
Development in Economics,” Journal of Economic Perspectices 24, 17-32.
Acemoglu, Daron, Johnson, Simon, and Robinson, James A. (2001) "The Colonial
Origins of Comparative Development: An empirical Investigation," American Economic
Review 91, 1369-1401.
Acemoglu, Daron, Johnson, Simon, and Robinson, James A. (2005) “Institutions as the
Fundamental Cause of Long-Run Growth,” In (P. Aghion and S. Durlauf, eds.)
Handbook of Economic Growth Amsterdam: Elsevier, pp. 385-472.
Arellano, M. (1987) “Computing Robust Standard Error for Within-groups Estimators,”
Oxford Bulletin of Economics and Statistics 49, 431-434.
Arellano, Manuel, and Bond, Stephen. (1991) "Some Tests of Specification for Panel
Data: Monte Carlo Evidence and an Application to Employment Equations," Review of
Economic Studies 58, 277-97.
Assiotis, Andreas and Sylwester, Kevin (2010) “Do Good Institutions Lower the Benefit
of Democratization,” Working Paper, Dept. of Economics, Southern Illinois University-
Carbondale.
Barro, Robert J. (1996) "Democracy and Growth," Journal of Economic Growth 1, 1-27.
Barro, Robert J. (1999) "The Determinants of Democracy," Journal of Political Economy
107, 158-283.
Bertrand, M., Duflo, E., and Mullainathan, S. (2004) “How Much Should We Trust
Differences-in-Differences Estimates,” Quarterly Journal of Economics 119, 249-275.
Davidson, Basil. (1992) The Black Man’s Burden: Africa and the Curse of the Nation
State, New York, NY, Three Rivers Press.
Dicey Albert V. (1982) Introduction to the Study of the Law of the Constitution, (ed.
Roger E. Michener) Indianapolis: Liberty Fund.
Dollar, David and Kraay, Aart. (2003) "Institutions, Trade, and Growth," Journal of
Monetary Economics 50, 133-162.
25
Engerman, Stanley L. and Kenneth L. Sokoloff. (1997) Factor Endowments, Institutions,
and Differential Paths of Growth Among New World Economies: A View from Economic
Historians of the United States. Stanford: Stanford University Press.
Englebert, Pierre (2000) State Legitimacy and Development in Africa. Boulder,
CO: Lynne Rienner Publishers.
Gastil, John. (1989) In: Freedom in the World: Political Rights and Civil Liberties.
Freedom House, Lanham.
Giavazzi, Francesco and Tabellini, Guido. (2005) “Economic and Political
Liberalizations,” Journal of Monetary Economics 52, 1297-1330.
Glaeser, Edward L., La Porta, Raphael, Lopez-de-Silanes, Florencio, and Shleifer, Andrei
(2004) “Do Institutions Cause Growth?” Journal of Economic Growth 9, 271-303.
Hall, Robert E. and Jones, Charles, I. (1999) "Why do some Countries Produce So Much
More Output Per Worker than Others?" Quarterly Journal of Economics 114, 83-116.
Hoff, Karla and Stiglitz, Joseph E. (2004) “After the Big Bang? Obstacles to the
Emergence of the Rule of Law in Post-Communist Societies,” American Economic
Review 94, 753-763.
Huntington, Samuel. (1968) Political Order in changing societies. New York: Yale
University Press.
Judson, R. and Owen, A. (1999) “Estimating Dynamic Panel Models: A Practical Guide
for Macroeconomists,” Economics Letters 65, 9-15.
Knack, Stephen, and Keefer Phillip. (1995)"Institutions and economic performance:
cross-country tests using alternative institutional measures," Economics & Politics 7,
207-227.
Kaufmann, Dani, Aart Kraay, and P. Zoido-Lobaton. (1999) “Governance Matters.”
World Bank, Research Development Group, Washington, D.C. Processed.
La Porta, Rafael, Lopez-de-Silanes, Florencio, Shleifer, Andrei, and Vishy, Robert.
(1999) “The Quality of Government,” Journal of Law, Economics and Organization 15,
222-279.
Lipset, Seymour M. (1960). Political Man: The Social Basis of Modern Politics. New
York: Doubleday.
26
Marshall, Monty G. and Jaggers, Keith J. (2004) “Polity IV Project: Political Regime
Characteristics and Transitions, 1800-2004 Dataset Users’ Manual. Center for Global
Policy School of Public Policy, George Mason University.
Musila, Jacob. (2007) "Democracy and Corruption: Some new Evidence," Unpublished
Manuscript.
Nickell, S. (1981) “Biases in Dynamic Models with Fixed Effects,” Econometrica 49,
1417-1426.
North, Douglas C. (1990) Institutions, Institutional Change and Economic Performance.
Cambridge: Cambridge University Press.
Olson, Mancur, Knack, Stephen, Keefer Philip, and Clague Christopher. (1996) “Property
and contract rights in autocracies and democracies,” Journal of Economic Growth 1, 243-
276.
Papaioannou, Elias and Siourounis, Gregorios. (2008) "Democratization and Growth,"
Economic Journal 118,1520-1551.
Przeworski, Adam, Michael E. Alvarez, Jose Antonio Cheibub, and Limongi, Fernando.
(2000) Democracy and Development: Politicl Institutions and Well-Being in the World,
1950-1990. New York: Cambridge University Press.
Przeworski, Adam and Limongi, Fernando (1993) “Political Regimes and Economic Growth,”
Journal of Economic Perspectives 7 (Summer), 51-69.
Rigobon, Roberto and Rodrik, Dani. (2005) "Rule of Law, Democracy, Openness, and
Income: Estimating the interrelationships." NBER Working Paper, 10750.
Rivera-Batiz, Francisco. (2002) "Democracy, Governance and Economic Growth:Theory
and Evidence," Review of Development Economics 6, 225-247.
Rock, Michael. (2009) “Corruption and Democracy,” Journal of Development Studies 45,
55-75.
Rodrik, Dani, Subramanian, Arvind, and Trebbi, Francesco. (2004) “Institutions Rule:
The Primacy of Institutions Over Geography and Integration in Economic Development,”
Journal of Economic Growth 9, 135-165
Rodrik, Dani. (1997) “Democracy and Economic Performance,” Prepared for a
conference on Democratization and Economic Reform in South Africa, Cape Town,
1998.
27
Rodrik, Dani and Wacziarg, Romain. (2005) "Do democratic Transitions produce bad
economic outcomes?" American Economic Review 95, 50-57.
Roodman, David. (2009) "A Note on the Theme of Too Many Instruments" Oxford
Bulletin of Economics and Statistics 71, 135-158.
Sunde, Uwe, Cervellati, Matteo, and Fortunato, Piergiuseppe. (2008) "Are all
democracies equally good? The role of interactions between political environment and
inequality for rule of law." Economic Letters 99, 552-556.
Sylwester, Kevin (2009) “Democratization and Economic Growth: why Africa is
Different,” Unpublished Manuscript.
Tavares, Samia. (2007) “Do rapid political and trade liberalizations increase corruption?”
European Journal of Political Economy 23, 1053-1076.
Wacziarg, Romain, and Tavares, Jose. (2001) "How Democracy Affects Growth,"
European Economic Review 45,1341-1378.
Zakaria, Fareed (2004) The Future of Freedom: Illiberal Democracy at Home and
Abroad. W.W. Norton & Co.: New York.
28
Table 1: Regime Classification
No. Country Classification by PS Democratization Event
1 Albania Democratization: 1992 Partial
2 Algeria Always Autocracy
3 Angola Always Autocracy
4 Argentina Always Democracy
5 Armenia Democratization: 1998 Partial
6 Azerbaijan Always Autocracy
7 Australia Always Democracy
8 Austria Always Democracy
9 Bahamas Always Democracy
10 Bahrain Always Autocracy
11 Bangladesh Democratization:1991 Partial
12 Belarus Always Autocracy
13 Belgium Always Democracy
14 Bolivia Always Democracy
15 Botswana Always Democracy
16 Brazil Democratization:1985 Full
17 Brunei Always Autocracy
18 Bulgaria Democratization:1991 Full
19 Burkina Faso Always Autocracy
20 Cameroon Always Autocracy
21 Canada Always Democracy
22 Chile Democratization:1990 Full
23 China Always Autocracy
24 Colombia Always Democracy
25 Congo, Dem. Rep. Always Autocracy
26 Congo, Republic of Always Autocracy
27 Costa Rica Always Democracy
28 Cote d`Ivoire Always Autocracy
29 Croatia Democratization: 2000 Full
30 Cuba Always Autocracy
31 Cyprus Always Democracy
32 Czech Republic Democratization: 1993 Full
33 Denmark Always Democracy
34 Dominican Republic Always Democracy
35 Ecuador Always Democracy
36 Egypt Always Autocracy
37 El Salvador Democratization:1994 Full
38 Estonia Democratization: 1992 Full
39 Ethiopia Democratization:1995 Partial
40 Finland Always Democracy
41 France Always Democracy
29
42 Gabon Always Autocracy
43 Gambia, The Reverse Transition:1994 44 Ghana Democratization:1996 Full
45 Greece Always Democracy
46 Guatemala Democratization:1996 Partial
47 Guinea Always Autocracy
48 Guinea-Bissau Always Autocracy
49 Guyana Democratization:1992 Full
50 Haiti Always Autocracy
51 Honduras Always Democracy
52 Hungary Democratization:1990
53 Iceland Always Democracy
54 India Always Democracy
55 Indonesia Democratization:1999 Partial
56 Iraq Always Autocracy
67 Ireland Always Democracy
68 Israel Always Democracy
69 Italy Always Democracy
60 Jamaica Always Democracy
61 Japan Always Democracy
62 Jordan Always Autocracy
63 Kazakstan Always Autocracy
64 Kenya Always Autocracy
65 Korea, Republic of Democratization:1988 Full
66 Latvia Democratization: 1993 Full
67 Liberia Always Autocracy
68 Libya Always Autocracy
69 Lithuania Democratization: 1993 Full
70 Luxembourg Always Democracy
71 Madagascar Democratization:1993 Partial
72 Malawi Democratization:1994 Partial
73 Malaysia Always Intermediate
74 Mali Democratization:1992 Full
75 Malta Always Democracy
76 Mexico Democratization:1997 Full
77 Moldova Democratization: 1994 Partial
78 Mongolia Democratization:1993 Full
79 Morocco Always Autocracy
80 Mozambique Democratization:1994 Partial
81 Namibia Always Democracy
82 Netherlands Always Democracy
83 New Zealand Always Democracy
84 Nicaragua Democratization:1990 Partial
30
85 Niger Democratization:1999 Borderline
86 Nigeria Democratization:1999 Partial
87 Norway Always Democracy
88 Oman Always Autocracy
89 Panama Democratization:1994 Full
90 Papua New Guinea Always Democracy
91 Paraguay Democratization:1993 Partial
92 Peru Always Democracy 93 Philippines Democratization:1987 Full
94 Poland Democratization:1990
95 Portugal Always Democracy
96 Qatar Always Autocracy
97 Romania Democratization:1990 Full
98 Saudi Arabia Always Autocracy
99 Senegal Democratization:2000 Full
100 Sierra Leone Always Autocracy
101 Singapore Always Autocracy
102 Slovakia Democratization: 1993 Full
103 Slovenia Democratization: 1992 Full
104 Somalia Always Autocracy
105 South Africa Democratization:1994 Full
106 Spain Always Democracy
107 Sri Lanka Always Democracy
108 Sudan Always Autocracy
109 Suriname Democratization:1991 Partial
110 Sweden Always Democracy
111 Switzerland Always Democracy
112 Syria Always Autocracy
113 Tanzania Democratization:1995 Partial
114 Togo Always Autocracy
115 Trinidad &Tobago Always Democracy
116 Tunisia Always Autocracy
117 Turkey Always Democracy
118 Uganda Always Autocracy
119 Ukraine Democratization: 1994 Partial
120 United Arab Emirates Always Autocracy
121 United Kingdom Always Democracy
122 United States Always Democracy
123 Uruguay Democratization:1985 Full
124 Venezuela Always Democracy
125 Yemen Always Autocracy
126 Zambia Democratization:1991 Partial
127 Zimbabwe Reverse Transition 1987
31
Table 2: Summary Statistics and Correlation Matrices
Panel A: Summary Statistics
Variable
Observations Mean Maximum Minimum Std. Dev.
Rule 2843 3.65 6 1 1.52
Dem 2946 0.57 1 0 0.49
GDP 2943 8.72 11.38 5.03 1.20
FH 2942 3.46 6 0 1.98
POLITY 2687 2.84 10 -10 3.34
Panel B: Correlation Matrices
Correlation Rule Dem GDP FH POLITY
Rule 1.00
Dem 0.30 1.00
GDP 0.61 0.32 1.00
FH 0.43 0.83 0.48 1.00
POLITY 0.30 0.85 0.34 0.89 1.00
32
Table 3: Average Rule of Law score and Change in Rule of Law for Democratized Countries between the period 1984-2007
East Asia and Pacific Europe and Central Asia Latin America and Caribbean Sub-Saharan Africa
Country A B C Country A B C Country A B C Country A B C
Indonesia 2 3.2 1.5 Albania 3.7 2.9 -2.1 Brazil 3.5 4 -1.58 Ethiopia 1.7 4.9 1.7
Korea, R 2.8 2 2 Bulgaria 5 5 -2.5 Chile 4 4.1 1 Ghana 3 2.7 1.5
Mongolia 2.1 3.9 3 Hungary 5 5 -1 El Salvador 1.4 3 0.5 Madagascar 3.2 2.8 -1.5
Philippines 1 1 1.5 Poland 4 5.1 0.5 Guatemala 2.2 2.3 0.5 Malawi 2 3.7 1
Thailand 3.7 4.8 -0.5 Romania 2 3.8 2 Guyana 1 2.8 1 Mali 2 2.8 1
Armenia* - 3 -0.1 Mexico 3 2.2 -1 Mozambique 1.7 2.7 0
Croatia 5 5 0 Nicaragua 2 2.4 3 Niger 2 2 -2
Czech Rep.* - 5.7 0 Paraguay 2.4 4 0 Nigeria 3 2.31 1
Estonia* - - 0 Suriname 1 1.7 2 Senegal 5 5 1
Latvia* - - 0.7 Uruguay 3 3 -0.5 South Africa 1.7 3.4 -0.5
Lithuania* - - 0
Tanzania 4 4.9 2
Moldova* - - 0
Zambia 1.9 2.7 2
Slovakia* - 5.6 -1.6
Slovenia* 0 - -0.5
Ukraine 5 4.6 0
Note: Columns A and B denote the average Rule of Law score for the 5 years before and after democratization; or fewer if data is not available
Columns C denote the Change in rule of Law (of each country) between the first year and last year in our sample
* Denotes transition countries were data was not available prior democratization
To save space, the values for Iran (MENA) and Bangladesh (SA) are not reported on panel A. However, the corresponding values for each
column (A,B,C) are 4.86, 4.66, 2.34 and 1, 2.01, 1.625, respectively.
33
Table 4.
Panel Data Regressions (annual), 1984-2007
Dependent variable is the rule of law.
(1) (2) (3) (4) (5) (6)
Estimation method OLS
Fixed
Effect
Fixed
Effect
Fixed
Effect
Fixed
Effect
Fixed
Effect
Lagged RULE 0.84 0.84 0.84 0.84 0.84
(0.008)*** (0.009)*** (0.009)*** (0.009)*** (0.01)***
DEM 0.78 0.09 0.09 0.09 0.11 0.10
(0.05)*** (0.04)** (0.04)** (0.04)** (0.04)** (0.04)**
GDP 0.01 0.01 0.01 (0.02)
(0.04) (0.04) (0.05) (0.05)
GOV -0.002 -0.002
(0.002) (0.002)
GPOP 0.0005 (0.0005)
(0.0002)** (0.0002)**
Constant 3.22 0.51 0.42 0.33 0.41 0.28
(0.11)*** (0.04)*** (0.39) (0.39) (0.43) (0.43)
Observations 2836 2710 2707 2566 2386 2368
Country Fixed Effects NO YES YES YES YES YES
Time Fixed Effects NO YES YES YES YES YES
Number of countries 127 127 127 127 114 113
R-squared 0.15 0.94 0.94 0.95 0.95 0.95
White period standard errors in parentheses. *significant at 10%; ** significant at 5%; *** significant at 1%
Note: Columns 5 and 6 exclude all the formerly Socialist Countries from our sample.
Columns 2-6 include regional trends to account for dynamic heterogeneity across regions.

34
Table 5.
Panel Data Regressions (annual), 1984 - 2007
Dependent variable is the rule of law.
(1) (2) (3) (4) (5) (6)
Estimation method OLS
Fixed
Effect
Fixed
Effect
Fixed
Effect
Fixed
Effect
Fixed
Effect
Lagged RULE 0.83 0.83 0.83 0.83 0.83
(0.01)** (0.01)*** (0.01)*** (0.01)*** (0.01)***
DEM 0.75 0.09 0.09 0.10 0.11 0.11
(0.06)*** (0.04)** (0.04)** (0.04)** (0.05)** (0.05)**
GDP (0.003) 0.009 -0.004 0.008
(0.051) (0.05) (0.05) (0.05)
GOV -0.001 -0.0009
(0.002) (0.002)
GPOP (0.0004) 0.00003
(0.000) (0.000)
Constant 3.00 0.51 0.48 0.35 0.52 0.36
(0.11)*** (0.06)*** (0.43) (0.45) (0.49) (0.49)
Observations 1816 1733 1730 1589 1428 1410
Country Fixed Effects NO YES YES YES YES YES
Time Fixed Effects NO YES YES YES YES YES
Number of countries 84 84 84 70 71 70
R-squared 0.92 0.92 0.92 0.91 0.91 0.91
0 83 White period standard errors in parentheses. *significant at 10%; ** significant at 5%; *** significant at 1%
Note: Columns 1-6 exclude all the countries from our sample that were democratic throughout
the sample period. Also, columns 5 and 6 exclude all the formerly Socialist Countries. Columns
2-6 include regional trends to account for dynamic heterogeneity across regions.
35
Table 6.
Panel Data Regressions (annual), 1984 - 2007
Dependent variable is the rule of law.
Robustness Checks using alternative measures of Democratization
(1) (2) (3) (4) (5) (6)
Estimation method
Fixed
Effect
Fixed
Effect
Fixed
Effect
Fixed
Effect
Fixed
Effect
Fixed
Effect
Lagged RULE 0.84 0.84 0.84 0.84 0.84 0.85
(0.009) *** (0.009)*** (0.009)*** (0.01)*** (0.01)*** (0.01)***
FH 0.02 0.02 0.03
(0.01)** (0.01)** (0.01)**
POLITY 0.005 0.005 0.006
(0.003)* (0.003)* (0.003)*
GDP 0.01 0.01 0.01 0.03 0.04 0.01
(0.04) (0.04) (0.05) (0.05) (0.05) (0.05)
GOV -0.002 -0.002
(0.002) (0.002)
GPOP 0.0004 0.0004
(0.000)** (0.000)**
Constant 0.37 0.44 0.34 0.31 0.19 0.41
(0.39) (0.40) (0.43) (0.46) (0.43) (0.50)
Observations 2707 2566 2386 2466 2327 2169
Country Fixed Effects YES YES YES YES YES YES
Time Fixed Effects YES YES YES YES YES YES
Number of countries 127 113 114 121 107 107
R-squared 0.95 0.95 0.95 0.94 0.94 0.94
White period standard errors in parentheses. *significant at 10%; ** significant at 5%; *** significant at 1%
Note: Columns 3 and 6 exclude all the formerly Socialist Countries.
All columns include regional trends to account for dynamic heterogeneity across regions
36
Table 7.
Dynamic GMM regressions (annual), 1984 - 2007
Dependent variable is the rule of law.
diff-GMM diff-GMM diff-GMM diff-GMM
Lagged RULE 0.66 0.70 0.68 0.69
(0.09)***
(0.12)***
(0.07)***
(0.08)***
DEM 0.67 0.93 0.68 0.88
(0.37)**
(0.45)**
(0.32)**
(0.33)**
GDP 0.24 0.50 0.26 0.17
(0.88) (1.22) (0.52) (0.54)
Lags of Instruments 2 2 2,3 2,3
Period Effects YES YES YES YES
# of Countries 127 114 127 114
# of Observations 2580 2280 2580 2280
Sargan Test (p-value) 0.84 0.50 0.88 0.94
AR(2) Test (p-value) 0.13 0.27 0.03 0.03
Robust Standard errors in parentheses.
*** and **denote significance at the 1% and 5% levels, respectively
Note: Columns 2 and 4 exclude all the former Socialist Countries
37
Table 8.
Panel Data Regressions (annual), 1984 - 2007
Dependent variable is the rule of law.
(1) (2) (3) (4) (5) (6)
Estimation method
Fixed
Effect
Fixed
Effect
Fixed
Effect
Fixed
Effect
Fixed
Effect
Fixed
Effect
Lagged RULE 0.84 0.84 0.84 0.83 0.83 0.83
(0.009)*** (0.009)*** (0.009)*** (0.01)*** (0.01)*** (0.01)***
DEM_P 0.09 0.09 0.10 0.09 0.10 0.10
(0.05)* (0.04)* (0.05)* (0.05)* (0.06)* (0.05)*
DEM_F 0.10 0.10 0.12 0.09 0.13 0.13
(0.04)** (0.04)** (0.04)** (0.05)** (0.05)** (0.05)**
GDP 0.01 0.01 0.01 -0.0009 -0.003 0.01
(0.04) (0.04) (0.05) (0.05) (0.05) (0.05)
GOV -0.002 -0.008
(0.002) (0.002)
GPOP 0.0005 0.0003
(0.000)** (0.000)
Constant 0.42 0.33
0.40 0.56 0.52 0.35
(0.39) (0.39) (0.43) (0.43) (0.49) (0.50)
Observations 2707 2566 2386 1729 1428 1410
Country Fixed Effects YES YES YES YES YES YES
Time Fixed Effects YES YES YES YES YES YES
Number of countries 127 113 114 84 71 70
R-squared 0.94 0.95 0.95 0.92 0.92 0.91
White period standard errors in parentheses. *significant at 10%; ** significant at 5%; *** significant at 1%
Note: Columns 3, 5 and 6 exclude all the formerly Socialist Countries. Columns 4, 5 and 6 exclude
all the countries from our sample that were democratic throughout the sample period.
All columns include regional trends to account for dynamic heterogeneity across regions.
38
Table 9.
Panel Data Regressions (annual), Across Regions 1984 - 2007
Dependent variable is the rule of law.
(1) (2) (3) (4) (5) (6)
Estimation method
Fixed
Effect
Fixed
Effect
Fixed
Effect
Fixed
Effect
Fixed
Effect
Fixed
Effect
Lagged RULE 0.85 0.85 0.85 0.85 0.85 0.84
(0.008)** (0.008)*** (0.008)*** (0.008)*** (0.008)*** (0.02)***
DEM -0.09 0.01 0.09 0.06 0.06 0.14
(0.09) (0.04) (0.04)** (0.04) (0.03)* (0.06)**
GDP -0.06 -0.003 -0.005 -0.007 -0.007 -0.09
(0.04) (0.04) (0.04) (0.04) (0.04) (0.07)
SSA*DEM 0.21 0.12
(0.10)** (0.06)**
LAC*DEM 0.08 -0.09
(0.11) (0.06)
EAP*DEM 0.22 0.04
(0.12)* (0.08)
SA*DEM 0.21 0.07
(0.09)** (0.03)**
Observations 2707 2707 2707 2707 2707 717
Country Fixed Effects YES YES YES YES YES YES
Time Fixed Effects YES YES YES YES YES YES
Number of countries 127 127 127 127 127 32
R-squared 0.94 0.94 0.95 0.94 0.94 0.89
White period standard errors in parentheses. *significant at 10%; ** significant at 5%; *** significant at 1%
Note: Column 6 only includes sub-Saharan African countries.
39
Table 10.
Panel Data Regressions (annual), Across Regions 1984 - 2007
Dependent variable is the rule of law.
(1) (2) (3) (4) (5)
Estimation method
Fixed
Effect
Fixed
Effect
Fixed
Effect
Fixed
Effect
Fixed
Effect
Lagged RULE 0.84 0.84 0.84 0.84 0.84
(0.009)*** (0.009)*** (0.009)*** (0.009)*** (0.01)***
DEM_F 0.10 0.09 0.12 0.12 0.14
(0.05)* (0.05)* (0.05)** (0.05)** (0.07)**
DEM_P -0.008 0.08 -0.01 0.09 -0.05
(0.05) (0.05)* (0.08) (0.06) (0.09)
GDP 0.003 0.01 0.005 0.01 0.002
(0.04) (0.04) (0.05) (0.05) (0.05)
DEM_F*SSA -0.02 -0.04 -0.06
(0.08) (0.10) (0.11)
DEM_P*SSA 0.17 0.18 0.21
(0.08)** (0.10)* (0.12)*
DEM_F*EAP 0.04 -0.004 -0.02
(0.04) (0.08) (0.08)
DEM_P*EAP 0.06 0.01 0.16
(0.04) (0.06) (0.10)
Observations 2707 2707 2386 2386 2386
Country Fixed Effects YES YES YES YES YES
Time Fixed Effects YES YES YES YES YES
Number of countries 127 127 114 114 114
R-squared 0.94 0.94 0.95 0.95 0.94
White period standard errors in parentheses. *significant at 10%; ** significant at 5%; *** significant at 1%
Note: Column 5 reports coefficients estimates when we also interact DEM_F and DEM_P with
the regional dummies of LAC and SA. To save space, the coefficients of these variables are not
reported but available upon request. All these coefficients are statistically insignificant when the
only interactive terms are DEM_F*LAC and DEM_P*LAC. All coefficient estimates are
insignificant.
Column 3-5 exclude all the formerly Socialist Countries.
All columns include regional trends to account for dynamic heterogeneity across regions
40
Table 11.
Panel Data Regressions, Across Regions 1984 - 2007
Dependent variable is the rule of law.
(1) (2) (3) (4) (5)
Estimation method
Fixed
Effect
Fixed
Effect
Fixed
Effect
Fixed
Effect
Fixed
Effect
Lagged RULE 0.84 0.84 0.83 0.85 0.84
(0.009)*** (0.009)*** (0.01)*** (0.01)*** (0.009)***
DPrior 0.06 0.07 0.06 0.07 0.12
(0.10) (0.11) (0.10) (0.11) (0.12)
DT 0.06 0.06 0.06 0.06 0.13
(0.07) (0.07) (0.07) (0.07) (0.07)*
D1 0.20 0.20 0.20 0.20 0.19
(0.07)*** (0.07)*** (0.07)*** (0.07)*** (0.08)**
D2 0.11 0.11 0.10 0.10 0.12
(0.08) (0.08) (0.08) (0.08) (0.09)
D3 0.07 0.07 0.05 0.05 0.15
(0.07) (0.07) (0.07) (0.07) (0.08)*
D4 0.04 0.04 0.03 0.03 0.06
(0.06) (0.06) (0.06) (0.07) (0.07)
D5 0.16 0.16 0.16 0.16 0.23
(0.06)** (0.06)** (0.07)** (0.07)** (0.06)***
D6 0.10 0.10 0.10 0.10 0.10
(0.05)** (0.05)** (0.05)** (0.05)** (0.05)*
GDP 0.01 0.0006
(0.04) (0.05)
Observations 2710 2707 1733 1730 2707
Country Fixed Effects YES YES YES YES YES
Time Fixed Effects YES YES YES YES YES
Number of countries 127 127 84 84 114
R-squared 0.94 0.94 0.92 0.92 0.94
White period standard errors in parentheses. *significant at 10%; ** significant at 5%; *** significant at 1%
Note: Columns 3-4 exclude all the countries from our sample that were democratic throughout
the sample period. Column 5 excludes all the formerly Socialist countries.
41
Figure 1. Rule of Law and Corruption between the period 1984-2007
1.0
1.5
2.0
2.5
3.0
3.5
4.0
4.5
84 86 88 90 92 94 96 98 00 02 04 06
Corruption Rule of Law
Egypt
2.4
2.8
3.2
3.6
4.0
4.4
4.8
5.2
5.6
6.0
6.4
84 86 88 90 92 94 96 98 00 02 04 06
Corruption Rule of Law
Brunei
1
2
3
4
5
6
7
84 86 88 90 92 94 96 98 00 02 04 06
Corruption Rule of Law
Ireland
2.4
2 8
3 2
3 6
4 0
4.4
4 8
5 2
84 86 88 90 92 94 96 98 00 02 04 06
Corruption Rule of Law
Oman
0.5
1.0
1.5
2.0
2.5
3.0
3.5
4.0
4.5
84 86 88 90 92 94 96 98 00 02 04 06
Corruption Rule of Law
Lebanon
1.6
2.0
2.4
2.8
3.2
3.6
4.0
4.4
4.8
5.2
5.6
84 86 88 90 92 94 96 98 00 02 04 06
Corruption Rule of Law
Saudi Arabia