Embed Size (px)
Citation preview
Does Corporate Social Responsibility Affect the Cost of Capital? *
Sadok El Ghoul University of Alberta, Edmonton, AB T6C 4G9, Canada
Omrane Guedhami Moore School of Business, University of South Carolina, Columbia, SC 29208, USA
Chuck C. Y. Kwok Moore School of Business, University of South Carolina, Columbia, SC 29208, USA
Dev Mishra University of Saskatchewan, Saskatoon, SK S7N 4M5, Canada
Abstract We examine the effect of corporate social responsibility (CSR) on the cost of equity capital for a large sample of U.S. firms. Using several approaches to estimate firms’ ex ante cost of equity, we find that firms with better CSR scores exhibit cheaper equity financing. In particular, our findings suggest that investment in improving responsible employee relations, environmental policies, and product strategies contributes substantially to reducing firms’ cost of equity. Our results also show that participation in two “sin” industries, namely, tobacco and nuclear power, increases firms’ cost of equity. These findings support arguments in the literature that firms with socially responsible practices have higher valuation and lower risk.
July 2010 JEL classification: G32, G34, M14 Keywords: Corporate social responsibility, Cost of equity capital
_________________________________
* We thank Najah Attig, Narjess Boubakri, Jean-Marie Gagnon, Oumar Sy, participants at the 2010 Academy of International Business Meeting, and especially an anonymous referee for their comments. We acknowledge generous financial support from Canada’s Social Sciences and Humanities Research Council.
Does Corporate Social Responsibility Affect the Cost of Capital?
Abstract
We examine the effect of corporate social responsibility (CSR) on the cost of equity capital for a large sample of U.S. firms. Using several approaches to estimate firms’ ex ante cost of equity, we find that firms with better CSR scores exhibit cheaper equity financing. In particular, our findings suggest that investment in improving responsible employee relations, environmental policies, and product strategies contributes substantially to reducing firms’ cost of equity. Our results also show that participation in two “sin” industries, namely, tobacco and nuclear power, increases firms’ cost of equity. These findings support arguments in the literature that firms with socially responsible practices have higher valuation and lower risk.
July 2010
JEL classification: G32, G34, M14 Keywords: Corporate social responsibility, Cost of equity capital
1. Introduction
Corporate social responsibility (CSR) has become increasingly important in recent years
owing to the dramatic growth in the number of institutes, mutual funds, and online resources
and other publications that specialize in encouraging corporations to improve their practices
according to various responsibility criteria (Bassen et al., 2006).1 To cope with the increased
attention given to corporations’ impact on society, more than half of the Fortune 1,000
companies in the U.S. regularly issue CSR reports, and nearly 10% of U.S. investments are
screened to ensure that they meet CSR-related criteria (Galema et al., 2008). Moreover, a
growing number of firms worldwide have undertaken serious efforts to integrate CSR into
various aspects of their businesses (Harjoto and Jo, 2007).2
As summarized in Robinson et al. (2008), numerous theoretical arguments have been put
forward to explain why CSR activities may enhance firm value. For instance, McGuire et al.
(1988) argue that a perceived decline in CSR may lead investors to increase explicit claims on
the firm, whereas an increase in perceived CSR may improve a firm’s reputation and thus
permit it to swap costly explicit claims for less costly implicit charges. Fombrun and Shanely
(1990) suggest further that building a positive reputation in the product and labor markets can
generate subsequent benefits by allowing companies to charge customers premium prices and
by attracting better job applicants. Customers are likely to pay premium prices for products
from high-reputation firms, thereby increasing revenues, because reputation serves as a signal
of product quality. Similarly, because employees generally prefer to work for firms with a good
reputation, they are likely to either work harder or accept lower compensation, thereby 1 How is CSR defined? Hill et al. (2007) define corporate social responsibility as the economic, legal, moral, and philanthropic actions of firms that influence the quality of life of relevant stakeholders. The World Bank Council for Sustainable Development defines CSR as “the continuing commitment by business to behave ethically and contribute to economic development while improving the quality of life of the workforce and their families as well as of the local community and society at large.” While the definition of CSR may vary across organizations, it generally refers to “actions that appear to further some social good, beyond the interests of the firm and that which is required by law”(McWilliams and Siegel, 2001, p. 117).
2 In her keynote speech to the Eastern Financial Association, Starks (2009) described a new acronym that has been developed to capture a company’s corporate social responsibility activities: ESG (environmental, social, and governance). Starks referred to a 2006 survey conducted by Mercer Consulting in which investors were asked how important they viewed various ESG factors to be for investment. The percentage of survey respondents indicating that these factors were very important were, respectively, corporate governance (64%), sustainability (39%), employee relations (33%), human rights (26%), water (25%), environmental management (18%), and climate change (7%).
1
reducing the firm’s costs (Roberts and Dowling, 2002). Taken together, this thread of the
literature suggests that CSR can increase firm value through positive reputation effects.
However, CSR activities may not always be value-increasing. For instance, a firm that
invests in pollution-control equipment while its rivals do not may be putting itself at a
competitive disadvantage (Waddock and Graves, 1997). Agency issues may exacerbate this
problem as corporate executives may seek to enhance their public image and pursue other
private benefits at the expense of shareholders. For instance, Brown et al. (2006) find that agency
costs play a major role in corporate philanthropic practices. They document that firms with
larger boards of directors give more cash to charities and are more likely to establish corporate
foundations.
Apart from the theoretical arguments, researchers have empirically examined the extent
to which firm CSR activities are value-increasing, decreasing, or neutral. The results are mixed.
For instance, Feldman et al. (1997) find that investors perceive firms with better environmental
performance as less risky. Alternatively, Brammer et al. (2006) find that firms with higher social
performance scores achieve lower returns. However, Hamilton et al. (1993) find that the excess
returns of socially responsible mutual funds do not differ statistically from those of
conventional mutual funds. Nelling and Webb (2009) also find no evidence that CSR activities
affect financial performance.
After reviewing a number of CSR studies, Renneboog et al. (2008) conclude that whether
CSR is priced by capital markets remains an open question. They thus join previous calls for
research that directly examines how CSR influences firms’ cost of equity capital (e.g., Kempf
and Osthoff, 2007). In this paper we seek to answer this call. Building on the theoretical
frameworks of Merton (1987) and Heinkel et al. (2001), we hypothesize that ceteris paribus, high
CSR firms have lower cost of equity capital than low CSR firms owing to low CSR firms being
associated with a smaller investor base and higher perceived risks. To compute firms’ cost of
equity capital, we follow an increasing number of studies in accounting and finance (e.g., Hail
and Leuz, 2006; Chen et al., 2009a) and use the ex ante cost of equity implied in analyst earnings
forecasts and stock prices. This accounting-based approach offers two main advantages. First,
unlike traditional measures of firm value (e.g., Tobin’s Q), it allows one to control for
differences in growth rates and expected future cash flows when estimating firms’ cost of equity
2
(Hail and Leuz, 2006). Second, it circumvents the failure of traditional asset pricing models to
deliver accurate estimates of firm-level cost of equity capital as well as the use of noisy realized
returns (Pástor et al., 2008). Additionally, the cost of equity represents investors’ required rate of
return on corporate investments and thus is a key input in firms’ long-term investment
decisions. Examining the link between CSR and the cost of equity should therefore help
managers understand the effect of CSR investment on firms’ financing costs, and hence has
important implications for strategic planning. Indeed, the cost of capital could be the channel
through which financial markets encourage firms to become socially more responsible (e.g.,
Heinkel et al., 2001).
Using a sample of 12,915 U.S. firm-year observations from 1992 to 2007, we find that
firms with a better CSR score exhibit lower cost of equity capital after controlling for other firm-
specific determinants as well as industry and year fixed effects. Moreover, we find that CSR
investment in improving responsible employee relations, environmental policies, and product
strategies substantially contributes to reducing firms’ cost of equity. We also show that firms
related to two “sin” business sectors, namely, tobacco and nuclear power, appear to observe
higher equity financing costs. Our evidence is robust to a battery of sensitivity tests, including
alternative assumptions and model specifications, additional controls for noise in analyst
forecasts and corporate governance, and various approaches to address endogeneity. Our
findings therefore support arguments in the literature that CSR enhances firm value.
Our study contributes to the literature in several ways. First, while previous studies
investigate whether CSR affects firm value, this is the first study to our knowledge to use a large
panel of U.S. firms to examine the effect of CSR on the ex ante cost of equity capital. Our
investigation is motivated by prior research suggesting that an important mechanism through
which CSR affects firm value is its effects on firm risk (e.g., Spicer, 1978; McGuire et al., 1988;
Starks, 2009). Our empirical findings provide supportive evidence. Second, we extend prior
research that shows that firms with better corporate governance ratings enjoy lower equity
financing costs (e.g., Chen et al., 2009a; Guedhami and Mishra, 2009). In particular, our finding
that the impact of CSR continues to hold even after controlling for firm-level corporate
governance suggests that firms are likely to benefit from improving not only their corporate
governance, but also their social responsibility. Third, using a more direct proxy of expected
returns, we confirm the findings of Hong and Kacperczyk (2009) that “sin” stocks generally
3
have higher expected returns as they are less preferred by norm-constrained investors and are
more likely to face greater litigation risk. Our results suggest that, among the “sin” stocks, firms
related to the tobacco and nuclear power industries have a significantly higher cost of equity
capital.
The remainder of the paper is organized as follows. Section 2 motivates how a firm’s
CSR activities may affect its cost of equity capital. Section 3 describes our sample and discusses
the regression variables. Section 4 presents the empirical evidence. Section 5 concludes the
paper.
2. Corporate Social Responsibility and Cost of Equity Capital
In this section, we provide theoretical arguments motivating our expectation that ceteris
paribus, the cost of equity capital is lower for high CSR firms than low CSR firms. The
arguments involve: i) the relative size of a firm’s investor base, and ii) a firm’s perceived risk.
2.1 Relative Size of a Firm’s Investor Base
The capital market equilibrium model of Merton (1987, p. 500) implies that increasing
the relative size of a firm’s investor base will result in lower cost of capital and higher market
value for the firm. In a similar vein, Heinkel et al. (2001) develop an equilibrium model that
implies that when fewer investors hold the stock of a firm, the opportunities for risk
diversification are reduced and hence the firm’s cost of capital will be higher. In this paper, we
argue that low CSR firms tend to have smaller investor base due to investor preferences and
information asymmetry.
First, with respect to investor preferences, prior work argues that socially conscious
investors prefer not to include low CSR firms in their investment portfolios. For instance, based
on their equilibrium model, Heinkel et al. (2001) argue theoretically that exclusionary investing
by green investors leads polluting firms to be held only by neutral, and thus fewer, investors.
As a result, polluting firms have to offer neutral investors higher expected returns to
compensate them for the lack of risk sharing. Empirically, Hong and Kacperczyk (2009) study
“sin” stocks, i.e., publicly listed firms operating in the alcohol, tobacco, and gaming industries,
4
and find that norm-constrained institutional investors (e.g., pension plans) include fewer “sin”
stocks in their portfolios compared to arbitrageurs (e.g., mutual or hedge funds).
Second, with respect to information asymmetry, we argue that information asymmetry
is likely to be more severe for low CSR firms. Departing from the traditional perfect markets
model, which assumes that information is complete and instantaneous, Merton (1987) develops
a capital market equilibrium model that allows for incomplete information. In particular,
Merton’s model relies on the behavioral assumption that, in constructing his optimal portfolio,
an investor takes security k into account only if he knows about security k. Merton explains that
for information to be transmitted from firm k to the investor, certain costs are incurred, for
example, the cost of gathering and processing data and the cost of transmitting information
from one party to another (p. 489). Following Merton’s analysis, we can break the information
transmission process down into three parts: a) signaling by the firm; b) coverage by the media
and analysts; and c) reception by investors. Dhaliwal et al. (2009) show empirically that high
CSR firms tend to disclose more information, as these firms want to project their positive image
as a responsible corporate citizen to investors and other stakeholders. Furthermore, Hong and
Kacperczyk (2009) find that “sin” firms receive less coverage from analysts, which implies that
analysts and the media are more inclined to spend time analyzing and reporting news about
“good” firms. Finally, when information reaches investors, socially conscious investors are
likely to pay more attention to information related to high CSR firms while neglecting
information related to low CSR firms.
2.2 A Firm’s Perceived Risk
Prior work suggests that investors perceive socially irresponsible firms as having a
higher level of risk (Frederick, 1995; King, 1995; Robinson et al., 2008; Starks, 2009). Waddock
and Graves (1997) argue that socially irresponsible firms may face uncertain future explicit
claims. For example, if a firm does not invest in product safety and sells an unsafe product, this
will increase the chance of future lawsuits against the firm and in turn the firm’s expected
future costs. Hong and Kacperczyk (2009) further argue that “sin” firms face higher litigation
risks. As an illustration, they point to the case of tobacco companies, which faced substantial
litigation risk until they reached a settlement with state governments in 1997. Feldman et al.
(1997) find supportive evidence. In particular, they show that firms adopting a more
5
environmentally pro-active posture experience a significant reduction in perceived riskiness to
investors.
The question that remains is whether low CSR firms’ higher perceived risks can be
diversified away in an investor’s portfolio and therefore not be priced in the cost of capital. As
discussed in Section 2.1, socially conscious investors prefer not to invest in low CSR firms. Hong
and Kacperczyk (2009, p. 17) stress that an implication of Merton’s model is that idiosyncratic
risk —and not just beta— matters for pricing because of either neglect or limited risk sharing.
With a higher level of non-diversifiable risk, low CSR firms will thus face a higher cost of equity
capital.
Based on the aforementioned arguments, we hypothesize that ceteris paribus, high CSR
firms have lower cost of equity capital than low CSR firms.
3. Data and Variables
3.1 Sample Construction
To examine the relation between CSR and the cost of equity financing, we begin by
merging four databases: Thompson Institutional Brokers Earnings Services (I/B/E/S), which
provides analyst forecast data, Compustat North America, which provides industry affiliation
and financial data, KLD STATS (created and maintained by KLD Research & Analytics, Inc.
(KLD)), which provides CSR data, and CRSP monthly return files, which provide information
on stock returns. We follow Gebhardt et al. (2001) and Dhaliwal et al. (2006) and estimate the
cost of equity in June of each year. To do so, we extract from the I/B/E/S summary file forecast
data recorded in June for all firms that have positive one- and two-year-ahead consensus
earnings forecasts and a positive long-term growth forecast. For these firms, we further require
that I/B/E/S provide a share price as of June, that Compustat report a positive book value per
share, and that the firm belong to one of the Fama and French (1997) 48 industries. We then
follow Hail and Leuz (2006) and Dhaliwal et al. (2006) and estimate the cost of equity capital
using four models. These models are discussed below and summarized in Appendix A. Finally,
we retain in our sample firms with valid cost of equity estimates under all four models and with
sufficient available data to construct the CSR and control variables. This procedure yields a final
6
sample of 12,915 observations representing 2,809 unique firms between 1992 and 2007.3 Table 1
summarizes the sample composition by Fama and French (1997) 48 industry groups (Panel A)
and by year (Panel B). The banking, business services, electronic equipment, and utilities
industries dominate the sample, with each accounting for more than 5% of the observations.
Reflecting the enhanced coverage of firms in KLD STATS over time, the number of observations
has increased over the sample period with a peak in 2004.4
3.2 Regression Variables
3.2.1 Cost of Equity Capital
We follow recent research in accounting and finance to estimate the ex ante cost of equity
implied in current stock prices and analyst forecasts.5 This design choice is motivated by prior
research. Fama and French (1997) show that both the standard single-factor model and the
Fama and French (1993) three-factor model provide poor proxies for the cost of equity capital.
Elton (1999) raises additional concerns about conventional proxies for realized returns and
hence calls for alternative proxies for expected returns. Hail and Leuz (2006, 2009) and Chen et
al. (2009a) argue that the implied cost of capital approach is particularly useful because it makes
an explicit attempt to isolate cost of capital effects from growth and cash flow effects. Pástor et
al. (2008) provide consistent evidence, showing that the class of implied cost of capital models
reasonably captures the time-variation in expected returns.
Although prior research proposes various models to calculate firms’ implied cost of
equity capital, to date it provides little guidance on the relative performance of these models.
We therefore follow Hail and Leuz (2006) and estimate the cost of equity using four different
models: the Claus and Thomas model (2001, CT), the Gebhardt et al. model (2001, GLS), the
3 The final sample comprises 62% of the firm-year observations represented in the KLD database.
4 In 2003, KLD added the Russel 2000 index and the Broad Market Social Index to KLD STATS.
5 The implied cost of capital approach has been used to examine the effects of, for example, legal institutions and securities regulations (Hail and Leuz, 2006), disclosure and earnings quality (Francis et al., 2005), dividends and taxes (Dhaliwal et al., 2006), tax enforcement (El Ghoul et al., 2010), corporate governance (Chen et al., 2009a,b), and ownership structure (Attig et al., 2008; Guedhami and Mishra, 2009; Boubakri et al., 2010), and has also been used in event studies that examine cross-listings (Hail and Leuz, 2009) and earnings restatements (Hirbar and Jenkins, 2004).
7
Ohlson and Juettner-Nauroth model (2005, OJ), and the Easton model (2004, ES).6 Then, in line
with Dhaliwal et al. (2006) and Chen et al. (2009b), we subtract the ten-year U.S. Treasury bond
yield from the estimated cost of equity of each model. We denote the resulting cost of equity
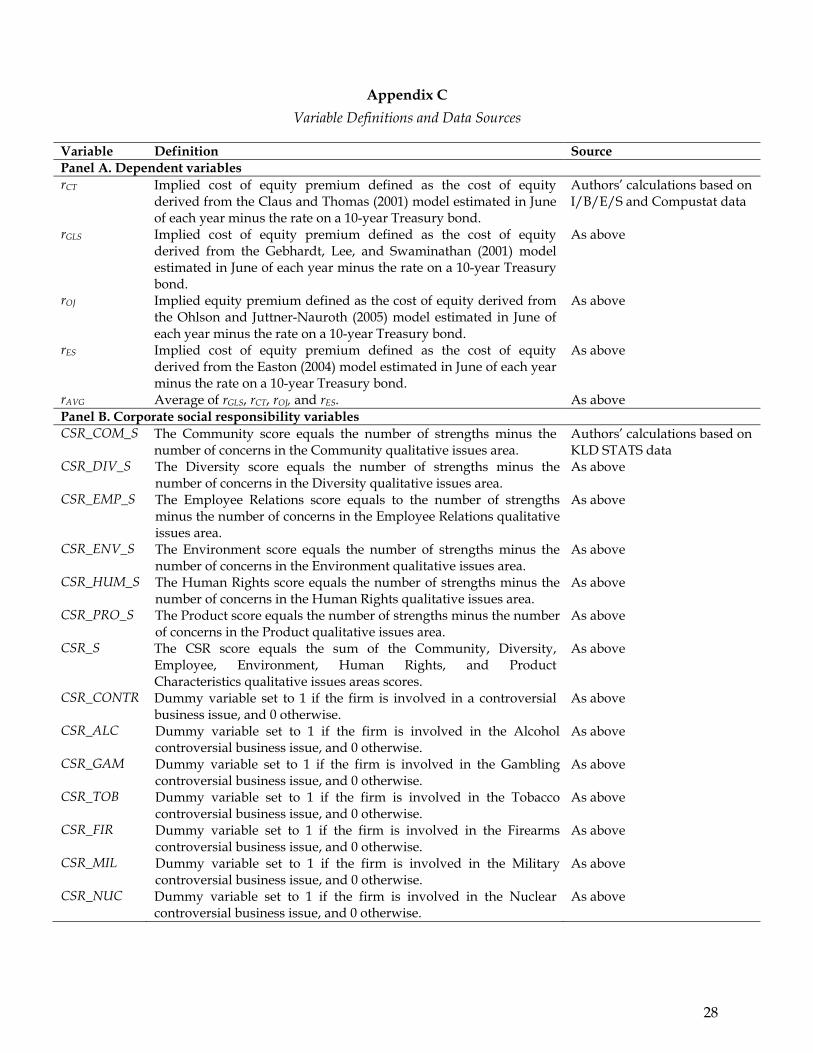
premiums as rCT, rGLS, rOJ, and rES, respectively. Appendix A provides details on the
implementation of the four models. rOJ is estimated in closed form. For the three other models,
we employ numerical techniques to search for rCT, rGLS, and rES while restricting the solution to
be between 0% and 100%. To reduce the possibility of spurious results associated with the use
of a particular model (Dhaliwal et al., 2006), we compute the average cost of equity premium
based on the four models. This yields rAVG, which is the implied equity risk premium that we
use as our dependent variable. Note that we use the terms equity premium and cost of equity
interchangeably in the rest of this paper.
Table 2 reports descriptive statistics for the implied cost of equity premium. Panel A
shows the equity premium estimates based on the four models. The average estimate across the
four models is 4.75%. The ES and OJ models produce higher average equity premiums (5.71%
and 5.61%, respectively) compared to the CT and GLS models (3.92% and 3.76%, respectively).
These figures are consistent with Dhaliwal et al. (2006) and Gode and Mohanram (2003), who
show that the GLS model provides a lower bound and the OJ model often provides an upper
bound for the implied cost of equity estimates. Panel B reports Pearson correlation coefficients
between the four models’ cost of equity estimates and our ultimate measure of the cost of equity
capital (rAVG). Consistent with Dhaliwal et al. (2006), we find that rOJ and rES exhibit higher
correlations with rAVG, while rCT and rGLS exhibit lower correlations with rAVG.
3.2.2 Corporate Social Responsibility
To specify our proxy for CSR, we rely on KLD STATS, which is a statistical summary of
KLD’s in-depth research. Founded in 1988, KLD is an independent firm that has been providing
research and consulting services to investors interested in integrating social responsibility
features into their investment decisions. KLD STATS contains ratings on a wide range of CSR-
related items compiled from various sources such as government agencies, non-governmental
6 Evaluating which model is best is beyond the scope of our paper. In the sensitivity analyses, however, we examine whether our findings are robust to using each individual implied cost of equity model and to alternative approaches to estimating the cost of equity.
8
organizations, global media publications, annual reports, regulatory filings, proxy statements,
and company disclosures. Firm coverage in KLD STATS has increased steadily over time.
During the 1991-2000 period, coverage consisted of the S&P 500 and the Domini Social Index.
Since then, KLD has sequentially added the Russell 1000 Index (in 2001), the Large Cap Social
Index (in 2002), and both the Russell 2000 Index and the Broad Market Social Index (in 2003).
KLD STATS organizes the various CSR-related items into two major categories:
qualitative issue areas and controversial business issues. Qualitative issue areas include: the
community, corporate governance, diversity, employee relations, the environment, human
rights, and product characteristics. For each qualitative issue area, KLD assigns a binary (0/1)
rating to a set of concerns and strengths as illustrated in Panel A of Appendix B. Controversial
business issues include: alcohol, gambling, tobacco, firearms, the military, and nuclear power.
For each controversial business issue, KLD assigns a binary (0/1) rating for whether a firm is
involved in (at least one of) a set of concerns as illustrated in Panel B of Appendix B. We capture
a firm’s involvement in controversial business issues with a dummy variable that takes the
value of 1 if a firm is involved in any of the six controversial business areas (CSR_CONTR).
Because qualitative issue areas and controversial business issues are inherently different, we
examine them separately. We calculate a score for each qualitative issue area equal to the
number of strengths minus the number of concerns. We then sum the qualitative issue areas’
scores to obtain an overall CSR score (CSR_S). In estimating CSR_S, we exclude corporate
governance as our definition of CSR does not include conflicts of interest between insiders and
shareholders. Nonetheless, in robustness tests we show that our inferences remain unchanged if
we include corporate governance.
3.2.3 Control Variables
In our multivariate analysis we follow prior studies (e.g., Hail and Leuz, 2006; Gebhardt
et al., 2001; Dhaliwal et al., 2006) in specifying controls shown to affect the cost of equity capital.
These controls include: beta (BETA), estimated using the market model;7 size (SIZE), measured
7 We estimate BETA by regressing 60 monthly excess stock returns ending in June of year t on the corresponding monthly CRSP value-weighted index excess returns. Monthly excess returns are monthly returns minus the one-month Treasury bill rate obtained from Professor Ken French’s website (http://mba.tuck.dartmouth.edu/pages/faculty/ken.french/data_library.html). In these estimations, we require a minimum of 24 months of observations.
9
as the natural logarithm of total assets; the book-to-market ratio (BTM); and leverage (LEV),
computed as the ratio of total debt to the market value of equity. According to prior research,
the predicted signs of these controls are as follows: BETA (+), SIZE (-), BTM (+), and LEV (+).8 In
addition, we control for analyst forecast attributes, where we use both forecast dispersion
(DISP), measured as the coefficient of variation of one-year-ahead earnings forecasts,9 and the
consensus long-term growth forecast (LTG). Given the evidence in Gode and Mohanram (2003),
Dhaliwal et al. (2006), and Guedhami and Mishra (2009), we expect these two variables to be
positively related to the cost of equity. Finally, we control for year and industry effects using
Fama-French (1997) 48 industry groups. All variables are defined in Appendix C.
3.3 Descriptive Statistics
Table 3 provides descriptive statistics for the CSR variables. Panel A reports the
statistical properties of the overall CSR score over time. This score exhibits large variation over
time. However, the overall median is zero, suggesting a relatively balanced distribution of firms
with negative and positive CSR performance. Panel B reports the frequency distribution of the
controversial business issues and suggests that involvement in these controversial issues has
decreased over time.
Table 4 reports descriptive statistics for the other explanatory variables (Panel A) and for
the pairwise correlations (Panel B) between the cost of equity estimates and the regression
variables. We find that our CSR proxy (CSR_S) is associated with a lower equity risk premium.
Additionally, all of the explanatory variables show the expected relations with our dependent
variable, rAVG. Finally, we do not find high correlations between the explanatory variables,
which suggests that multicollinearity is not a serious concern in our regressions.
8 These predictions reflect prior findings that: a firm’s beta is positively associated with its expected stock returns (e.g., Sharpe, 1964, Lintner, 1965); larger firms attract wider media and analyst coverage, which reduces information asymmetry and the cost of equity capital (Bowen et al., 2008); higher book-to-market firms are expected to earn higher ex post returns (Fama and French, 1992); and levered firms earn higher subsequent stock returns (Modigliani and Miller, 1958; Fama and French, 1992).
9 In our analysis, we include all firms for which we can estimate the cost of equity, irrespective of the number of analysts that provide forecasts of future earnings and growth. The quality of our models’ cost of equity estimates, however, is likely to depend on the quality of earnings forecasts: a consensus forecast from several analysts is likely to provide a more accurate prediction of expected cash flows than the forecast of a single analyst. As a robustness check, we repeat our analysis after excluding firm-years covered by fewer than three analysts or fewer than five analysts. Our conclusions remain unchanged.
10
4. Empirical Results
As we discuss in the introduction, despite increased academic interest in CSR, we still
know very little about how CSR performance affects firm valuation. The purpose of our study is
to address this gap in the literature by empirically examining the link between firms’ CSR
activities and their cost of equity capital. We proceed as follows. In Section 4.1 we perform
univariate tests that compare the cost of equity of firms with a below-median CSR score against
the cost of equity of firms with an above-median CSR score. Next, in Section 4.2 we conduct
multivariate regression analysis in which we regress firms’ cost of equity on a number of CSR
proxies and control variables. In Section 4.3 we report the results of sensitivity tests.
4.1 Univariate Analysis
Our univariate analysis compares the mean (Table 5, Panel A) and median (Table 5,
Panel B) cost of equity premiums (rAVG) of firms with low and high CSR scores based on the
median CSR value. The mean (median) equity premium of firms with a high CSR score is 4.54%
(4.25%), while it is 5.10% (4.64%) for firms with a low CSR score. These results suggest that the
mean (median) cost of equity for firms with a high CSR score is 56 (39) basis points lower than
that for firms with a low CSR score. These differences are significant at the 1% level. We find
similar evidence when we examine differences in means and medians using the four individual
cost of equity estimates. These preliminary findings suggest that firms with better CSR ratings
have significantly lower cost of equity.
4.2 Multivariate Regression Analysis
To examine the cost of capital effects of CSR, we regress the cost of equity premium ravg
on various CSR proxies and control variables using pooled cross-sectional time-series
regressions with robust standard errors clustered at the firm level. Table 6 reports our main
results. In each model, our dependent variable is the average equity premium, ravg. The
explanatory variables include various CSR metrics, six firm-specific control variables, as well as
year and industry fixed effects. Consistent with our univariate evidence in Table 5, the results
show strong evidence of CSR effects on the cost of equity.
Our test variable in Models 1 through 6 is the overall CSR score (CSR_S). In Model 1, our
basic regression, we examine the impact of CSR on the cost of equity capital while controlling
11
for year and industry fixed effects. We find that the coefficient on CSR_S is negative and
statistically significant at the 1% level, suggesting that firms showing better social responsibility
have significantly lower cost of equity capital. This significant relation remains when we further
include in Model 2 the additional firm-specific controls discussed above (BETA, SIZE, BTM,
LEV, LTG, and DISP).10 Economically, the estimated coefficient in Model 2 implies that a one-
standard deviation increase in CSR_S leads firms’ equity premium to decrease, on average, by
10 basis points.11 We interpret this result as evidence that the cost of capital is an important
channel through which the market prices CSR.
Next, we examine whether the documented relation between CSR and the cost of equity
changes over time. Given the growth of socially responsible investing and increasing awareness
among investors of risks related to CSR-related practices and violations, we would expect this
relation to change over time. Accordingly, we partition the full sample period into four sub-
periods: 1992-1995 (Model 3), 1996-1999 (Model 4), 2000-2003 (Model 5), and 2004-2007 (Model
6). In Models 3 and 4, we find that the coefficient on CSR_S is negative but statistically
insignificant. In contrast, we find that CSR_S loads negative and statistically significant (at the
5% level or better) in Models 5 and 6. These sub-period results indicate that the inverse relation
between CSR and firms’ equity financing costs is more significant in recent years, which we
interpret as consistent with an increase in investor awareness about socially responsible stocks
over time.
In the rest of Table 6, we extend our analysis to examine the association between the cost
of equity capital and individual components of the overall social performance score (CSR_S).12
Specifically, we look at the following six attributes: community relations (CSR_COM_S),
diversity (CSR_DIV_S), employee relations (CSR_EMP_S), environmental performance
(CSR_ENV_S), human rights (CSR_HUM_S), and product characteristics (CSR_PRO_S). For
10 Although we attempt to control for all common factors shown in prior research to affect the cost of equity capital, we note that all our inferences remain when we use various combinations of these control variables or when we separately drop each of these controls. Indeed, as explained below, one could argue that the cost of equity could be related to CSR through various economic channels, such as leverage.
11 This is comparable to the economic effect of firm risk (BETA) on the cost of equity as shown below.
12 Motivating our analysis, Galema et al. (2008) explain that aggregating various dimensions of CSR may lead to confounding effects of the individual dimensions of social responsibility.
12
each attribute, we compute a yearly score similar to the aggregate CSR_S (i.e., to the number of
strengths minus the number of concerns). Our empirical objective is to determine whether
certain attributes are more important than others in affecting a firm’s cost of equity capital. The
regression results on the cost of capital effects of the six CSR attributes are presented in Models
7 through 12 in Table 6. The results suggest that not all six items are relevant.
Our test variable in Model 7 is community relations (CSR_COM_S). The coefficient on
CSR_COM_S is negative, but statistically indistinguishable from zero. We obtain similar results
when we focus in Model 8 on CSR_DIV_S, which measures a firm’s net performance in
promoting diversity. Model 11 also reveals that the human rights score (CSR_HUM_S) does not
load significantly. These findings suggest that the social performance attributes community
relations, diversity, and human rights do not affect firms’ equity financing costs. In contrast,
employee relations, environmental performance, and product strategies do appear to matter for
firms’ cost of capital. In Model 9, we find a negative and statistically significant relation (at the
5% level) between the cost of equity and a firm’s standing in employee relations (CSR_EMP_S).
Similarly, the environmental performance proxy CSR_ENV_S is negative and highly significant
in Model 10 suggesting that the market discounts the cash flows of firms with good
environmental performance. 13 Model 12 also shows a negative and statistically significant
relation between the cost of equity capital and a firm’s standing in product characteristics,
CSR_PRO_S. In summary, the results in Models 7 through 12 suggest that firms that exhibit
superior performance with respect to employee relations, environmental policies, and product
strategies enjoy lower financing costs. However, the social performance attributes community
relations, diversity, and human rights appear not to affect firms’ cost of equity capital.
To better isolate the effect of CSR on the cost of capital, in each of the regressions in
Table 6 (except regression (1)) we include a host of firm-specific characteristics, including size,
risk, book-to-market, and leverage. We generally find that these control variables enter the
13 Recall that in the 2006 survey conducted by Mercer Consulting, the percentages of survey respondents who indicated that various CSR attributes are important to investment decisions are as follows: sustainability (39%), employee relations (33%), human rights (26%), water (25%), environmental management (18%), and climate change (7%). Our findings are generally consistent with their survey results, except that our coefficient on CSR_HUM_S is negative but insignificant.
13
models with the expected signs, and all are statistically significant at the 1% level. 14 In
particular, the results show positive and significant coefficients for firm risk (BETA) and book-
to-market (BTM), and a negative and significant coefficient for firm size (SIZE). Additionally,
we find that consistent with Gode and Mohanram (2003) and Dhaliwal et al. (2006), firm
leverage (LEV) loads positive and significant across all models. Finally, also in line with prior
studies (e.g., Dhaliwal et al., 2006), we find that the two analyst forecast variables, forecast
dispersion (DISP) and the consensus long-term growth forecast (LTG), have significantly
positive effects on the cost of equity. Our findings on the control variables therefore reveal that
our cost of equity estimates exhibit the expected relations with common risk factors.
Accordingly, the significant relations between our CSR metrics and the cost of equity in Table 6
imply that the market prices a firm’s CSR along with the other risk factors.
As we discuss above, Hong and Kacperczyk (2009) find evidence that firms operating in
“sin” industries (e.g., alcohol, tobacco, and gambling) are held less by norm-constrained
institutions such as pension funds, receive less coverage from analysts, and have higher
expected returns. Accordingly, in Table 7 we analyze the effects of involvement in six
controversial business areas, namely, alcohol, gambling, tobacco, firearms, the military, and
nuclear power. We specify a dummy variable for each controversial business area, which we
separately include in Models 2 through 7. We start in Model 1 by including the dummy variable
CSR_CONTR to identify firms involved in any of the six controversial business areas. The
coefficient estimate on CSR_CONTR is positive and statistically significant at the 10% level,
suggesting that, consistent with Hong and Kacperczyk, firms involved in “sin” industries have
higher cost of equity capital. In Models 2 through 7, we further find that except for gambling
involvement in Model 3 (CSR_GAM), the coefficients on all other dummy variables are positive,
although the statistical significance varies across the controversial business areas. Specifically,
we find that alcohol (CSR_ALC in Model 2), firearms (CSR_FIR in Model 5), and military
(CSR_MIL in Model 6) involvement are not significantly related to the cost of equity capital,
14 These effects are also economically significant. For example, the estimated coefficients of BETA, BTM, LEV, LTG, and DISP in Model 2 of Table 6 indicate that a one-standard deviation increase in each of these variables, while other variables are held at their mean values, increases the equity premium by 11.8, 52.5, 56.9, 25.1, and 48.5 basis points, respectively. Additionally, the estimated coefficient of SIZE implies that a one-standard deviation increase in firm size is associated with an 18.7 basis point decline in equity premium.
14
suggesting that these businesses are not perceived to affect a firm’s risk profile. In contrast, we
find that tobacco (CSR_TOB in Model 4) and nuclear power (CSR_NUC in Model 7)
involvement are associated with significantly (at the 5% level or better) higher cost of equity
capital. This suggests that the market perceives these two controversial business sectors to be
riskier and thus assigns a higher risk premium to firms involved in these industries. Overall,
these findings are consistent with the theoretical prediction that exclusionary investing by green
investors reduces demand for the stock of firms with poor social responsibility, thus limiting the
risk-sharing opportunities of investors holding these stocks and increasing their required rate of
return (Heinkel et al., 2001).
To summarize, three main results emerge from the analysis in Tables 6 and 7. First, CSR
is priced, and is associated with cheaper equity financing. Second, the only CSR attributes that
affect equity pricing are employee relations, environmental performance, and product
characteristics; all other attributes exhibit little or no significant impact on firms’ cost of equity.
Third, firms related to the tobacco and nuclear power industries have significantly higher cost
of equity.
4.3 Robustness Checks
In this section, we run a battery of sensitivity tests to examine whether our core evidence
in Table 6 (Model 2) that CSR decreases the cost of equity is robust to alternative assumptions
and model specifications, noise in analyst forecasts, and endogeneity, among other sensitivity
checks. Overall, the results from these sensitivity tests reported in Tables 8 through 11 are not
materially different from those of the primary analysis.
Alternative Assumptions and Model Specifications. Above, we specify our dependent variable as
the average cost of equity premium (rAVG) based on four widely used implied cost of equity
models to mitigate spurious results arising from the use of a single model. Nevertheless, here
we examine whether our core finding in Table 6 is sensitive to using the individual cost of
equity premiums. Models 1 through 4 in Table 8 replicate our base model (Model 1, Table 6)
after replacing the dependent variable rAVG with the individual risk premiums rCT, rGLS, rOJ, and
rES, respectively. We find that the coefficient on CSR_S is generally negative and statistically
significant. These results reinforce our earlier evidence that improved CSR results in cheaper
equity financing.
15
As detailed in Appendix A the implied cost of equity models employ various
assumptions about earnings growth rates and forecast horizons. To mitigate concerns that the
assumptions underlying these four models are driving our results, in the remainder of Table 8
we report results from re-estimating our baseline model after replacing rAVG with cost of equity
estimates from alternative models. In Model 5, we use the equity premium estimate based on
the finite horizon expected return model described in Gordon and Gordon (1997). In Models 6
and 7, we apply the Price-Earnings-Growth (PEG) model, which assumes no dividend
payments, to estimate the equity premium using short-term earnings forecasts and longer-term
forecasts, respectively. Finally, in Model 8 we measure the cost of equity using the earnings-to-
price ratio following Francis et al. (2005). We find that across Models 5 to 8, CSR_S loads
negative and statistically significant at the 1% level, reinforcing our earlier conclusion that CSR
performance reduces the cost of equity capital.
Noise in Analyst Forecasts. Despite the growing body of literature using the implied cost of
capital approach, recent research has criticized this approach on the grounds that analyst
forecasts are poor proxies for the market’s expectations of future earnings, resulting in biased
estimates of the cost of equity. More specifically, prior studies distinguish two sources of noise
associated with analyst forecasts. The first suggests that analyst forecasts are overly optimistic,
which causes the implied cost of equity to be biased upward (e.g., Kothari, 2001; Easton and
Sommers, 2007). We address this concern in three ways. First, we explicitly control for forecast
optimism bias (FBIAS), measured as the difference between the one-year-ahead consensus
earnings forecast and realized earnings deflated by the June-end stock price. The results, which
are reported in Model 1 of Table 9, show that the coefficient on CSR_S is negative and
significant at the 1% level (t-statistic = -3.38) after we include FBIAS. In this regression we also
find, as expected, that FBIAS is positively and significantly associated with the cost of equity.
Second, we successively exclude the top 5%, 10%, 25%, and 50% of the firm-year observations in
the FBIAS distribution (i.e., highly optimistic earnings forecasts). The results reported in Models
2 through 5 show that CSR_S is negatively and significantly (at the 1% level) related to the cost
of equity. Third, we address optimism in long-term forecasts by successively excluding the top
5%, 10%, 25%, and 50% of the firm-year observations in the LTG distribution. The results,
reported in Models 6 through 9, corroborate our earlier findings.
16
The second source of noise in analyst forecasts is associated with analysts’
sluggishness—i.e., their tendency to react slowly to publicly available information (e.g., Ali et
al., 1992). We confront this concern in Table 10 using two approaches. First, we follow Guay et
al. (2005) and Hail and Leuz (2006) and re-estimate the implied cost of equity using January-end
prices instead of June-end prices, which gives analysts extra time to update their forecasts by
incorporating the information in recent price movements. The results of this approach, which
appear in Model 1, suggest that the negative and statistically significant effect of CSR on the
cost of equity continues to hold. The second approach consists of including as an additional
explanatory variable recent stock returns as suggested by Guay et al. (2005) and Chen et al.
(2009a). Accordingly, in Models 2 through 4 we control for price momentum computed as the
compound stock returns over the past 3, 6, and 12 months, respectively. In each of these
regressions we continue to find that the coefficient on CSR_S is negative and highly statistically
significant. Overall, the results in Table 10 help mitigate concerns that noise in analyst forecasts
is driving our core findings.
Endogeneity. Similar to related CSR studies, one concern in relation to the analysis is the
potential endogeneity and omitted variables bias, which may cloud the interpretation of the
causal relation between CSR and the cost of equity capital. For example, although we control for
several important factors affecting the cost of equity capital, our evidence on the importance of
CSR to equity pricing may be driven by omitted variables that are correlated with both CSR and
the cost of equity capital. In particular, prior research suggests that firm-level corporate
governance, analyst following, and financial constraints are correlated with both CSR and the
cost of equity (Barnea and Rubin, 2006; Brown et al., 2006; Guedhami and Mishra, 2009; Chen et
al., 2009a). Thus, omitting these factors from our regressions may lead to a bias of unknown
magnitude in the CSR coefficients. Additionally, a firm’s choice regarding whether to engage in
CSR activities may not be independent of its cost of equity capital, in which case our analysis
may be subject to reverse causality concerns. Waddock and Graves (1997) put forward two
alternative hypotheses for the direction of causality. According to the good management
hypothesis, enhancing CSR performance improves the firm’s relationships with key
stakeholders, leading to better financial performance (in our case, lower cost of equity). The
slack resource hypothesis, in contrast, argues that better financial performance results in
resource slack, which allows firms to increase their CSR performance.
17
In Table 11, we report the results of various tests that address these concerns. To
mitigate the potential omitted variable bias and improve the precision of our estimates, we
begin by separately adding to our baseline regression (Table 6, Model 2) various firm-level
variables related to corporate governance and financial constraints: the logarithm of one plus
the number of institutional investors (Model 1), the fraction of CEO compensation arising from
a 1% increase in the stock price (Model 2),15 Bebchuk et al.’s (2009) antitakeover provisions
index (Model 3), the logarithm of one plus the number of analysts following the firm (Model 4),
and Kaplan and Zingales’ (1997) index of financial constraints (Model 5).16 We find that these
additional controls load with the predicted sign, although the antitakeover provisions index is
statistically insignificant. Most important for our purposes, we find that the coefficient on
CSR_S is negative and statistically significant at the 1% level in all of the models.
We also rely on two additional, conventional approaches to ensure the robustness of our
results to endogeneity and reverse causality concerns. First, in Model 6 we employ the
instrumental variables estimation method. As instruments for CSR_S, we use the industry
average CSR score and a dummy variable for whether the previous year’s earnings is negative
(loss). Second, to mitigate the issue of reverse causality (i.e., the cost of equity in the previous
period affects current CSR investment), in Model 7 we follow Chen et al. (2009b) and include
the lagged risk premium as an independent variable. This dynamic panel model is estimated
using the system GMM technique developed in Blundell and Bond (1998). In both of these
models, we find that CSR_S continues to load negatively at the 5% level or better, reinforcing
our previous findings of a negative association between CSR and the cost of equity capital.
15 Specifically, we calculate the sensitivity of a CEO’s stock and option portfolios to a 1% increase in the underlying stock price, which we label EBC_SENS. Following Bergstresser and Philippon (2006), we then construct the variable CEO_INC, which reflects the fraction of the CEO’s total compensation stemming from a 1% increase in the firm’s stock price: CEO_INC= EBC_SENS/(EBC_SENS+SALARY+BONUS). The CEO’s stock portfolio comprises restricted and unrestricted stock. The sensitivity of this portfolio is calculated as the market value of the portfolio times 1%. We follow the methodology proposed by Core and Guay (2002) to estimate option portfolio sensitivity. In particular, we estimate option sensitivities separately for newly granted options, exercisable options, and unexercisable options. We then obtain total option portfolio sensitivity by summing the individual sensitivities. An appendix outlining calculation details is available from the authors upon request.
16 We follow Lamont et al. (2001), who adapt the index to large samples. Specifically, KZt=-1.002(CFt/At-1)-39.368(Dt/At-1)-1.315*(Ct/At-1)+3.139*LEVt+0.283*Qt, where CF is cash flow, D denotes cash dividends, C stands for cash holdings, LEV is total debt, Q is Tobin’s Q, and A denotes total assets.
18
Collectively, the results from these tests indicate that endogeneity concerns are not likely to be
driving our core evidence. 17
Other Sensitivity Tests. We also perform additional robustness checks, which are unreported for
the sake of space. First, in our previous analysis we exclude corporate governance when
constructing our CSR metric because we do not consider good corporate governance practices
as an indicator of socially responsible behavior. When we recode CSR_S including the corporate
governance qualitative area, we find similar results.
Second, prior research suggests that the level of CSR may vary according to industry
characteristics (e.g., Waddock and Graves, 1997; McWilliams and Siegel, 2001; Fisman et al.,
2005). Therefore, in an attempt to make our proxies for CSR more comparable across industries,
we adjust CSR_S for the industry median in each year. The results corroborate our earlier
findings, suggesting that industry effects in CSR scores are not driving our results.
Third, a potential issue inherent with the KLD STATS database is that KLD has been
adding and eliminating item ratings over time. For instance, reporting on the South Africa
strength and concern in the human rights qualitative issue area was stopped in 1995, while the
climate change concern in the environment qualitative issue area was added in 1999. As a result,
the CSR scores may not be comparable over time. To address this issue, we transform the
qualitative issues areas’ scores and the overall CSR score into decile ranks computed in each
year. A higher value of this variable indicates that the firm’s net CSR performance is relatively
higher. Corroborating our earlier evidence in Table 6, we find that the CSR decile rank is
negatively and significantly (at the 1% level) associated with the cost of equity capital.
Fourth, there is some evidence that firm-level cost of equity is positively related to
industry-level cost of equity (e.g., Gebhardt et al., 2001). We therefore control for the median
industry risk premium and find that CSR_S still loads with a negative and significant
coefficient.
17 In untabulated robustness tests that further rule out endogeneity, we estimate a negative and statistically significant (at the 5% level) coefficient on CSR_S when (i) we include the initial CSR score recorded when the firm enters the sample, which can be viewed as exogenous with respect to the contemporaneous cost of equity, and (ii) we use the change in the cost of equity as our dependent variable. We thank a reviewer for suggesting these insightful approaches to address endogeneity.
19
Fifth, we examine the robustness of our results to alternative methodologies to control
for cross-sectional and serial dependence including Newey-West, Prais-Winsten, and Fama-
MacBeth methodologies. In each of these specifications, CSR_S loads negative at the 1% level.
Sixth, prior research suggests that large and mature firms have greater needs to engage
in socially responsible behavior relative to smaller firms (Waddock and Graves, 1997). Similarly,
CSR activities may be more important for firms followed by a large number of analysts. Since
large firms and firms with high analyst coverage benefit from lower cost of equity capital, our
earlier results may simply reflect the dominance in our sample of large U.S. firms with better
analyst coverage. Although we control for size in all of our main regressions, we further
mitigate this concern by examining the effect of CSR after excluding large firms and firms with
high analyst coverage using cutoffs corresponding to the top 1%, 5%, 10%, 25%, and 50% of
firms. All of our core evidence remains unaffected using these smaller subsamples.
Seventh, evidence in Dhaliwal et al. (2009), Hong and Kacperczyk (2009), and
Verwijmeren and Derwall (2010) implies that social norms may affect financing decisions (i.e.,
decisions to issue debt or equity) and in turn the cost of equity financing. In other words, the
cost of equity capital could be related to CSR through other economic channels such as leverage.
Although all our regressions control for the debt-equity mix (LEV), we repeat our analysis after
excluding firms that issue debt or equity in a given year.18 The results continue to show a strong
negative association between CSR and the cost of equity.
Eighth, our core evidence holds when we re-estimate our main regression after
dropping all observations for which the CSR score equals zero, given the possibility that KLD
might report zeros for some firms because the staff of KLD have not evaluated them, rather
than because the firms have zero performance (Statman and Glushkov, 2009). The results from
this robustness test indicate that CSR continues to load negative and significant at the 1% level
(coefficient = -0.043 and t-statistic = -3.141).
18 We obtain the proceeds from (net) equity and debt issues from the cash flow statement reported in Compustat. When this information is missing, we rely on the indirect balance sheet approach described in Baker and Wurgler (2002). We consider a firm as an equity (debt) issuer if the proceeds from equity (debt) issues in a given year is higher than 1% of lagged assets.
20
Finally, we check and find that our results are not sensitive to excluding firms related to
tobacco as well as all “sin”-industries, which may have high returns given that they are
associated with high litigation risk and positive outcomes from litigation (Hong and
Kacperczyk, 2009).
5. Conclusion
This paper examines whether corporate social responsibility affects firms’ ex ante cost of
equity implied in stock prices and analysts’ earnings forecasts. We contend that ceteris paribus,
high CSR firms should have lower cost of equity capital than low CSR firms owing to low CSR
firms having a reduced investor base and higher perceived risk. Using a sample of 12,915 U.S.
firm-year observations from 1992 to 2007 and controlling for other firm-specific determinants as
well as industry and year fixed effects, we find that firms with higher CSR scores enjoy
significantly lower cost of equity capital. The empirical results are consistent with our
hypothesis. Furthermore, we find that not all six dimensions of the KLD social performance
index are related to the cost of equity. In particular, while CSR investment in employee
relations, environmental policies, and product strategies contribute to lowering firms’ cost of
equity, CSR-related actions in the areas of community relations, diversity, and human rights do
not. We also find that, consistent with Hong and Kacperczyk (2009), firms related to the tobacco
and nuclear power industries have higher equity financing costs.
In summary, our findings contribute to the debate on whether CSR investments are
value–increasing, decreasing, or neutral by showing that improved CSR can enhance firm value
by reducing the firm’s cost of equity capital. Thus, while prior research emphasizes the
importance of corporate governance for firms’ valuation and access to external financing, our
research suggests that investment in CSR activities is also important to firms as it has power to
explain a firm’s cost of equity beyond corporate governance and other risk factors.
21
Appendix A
Models of Cost of Equity Capital
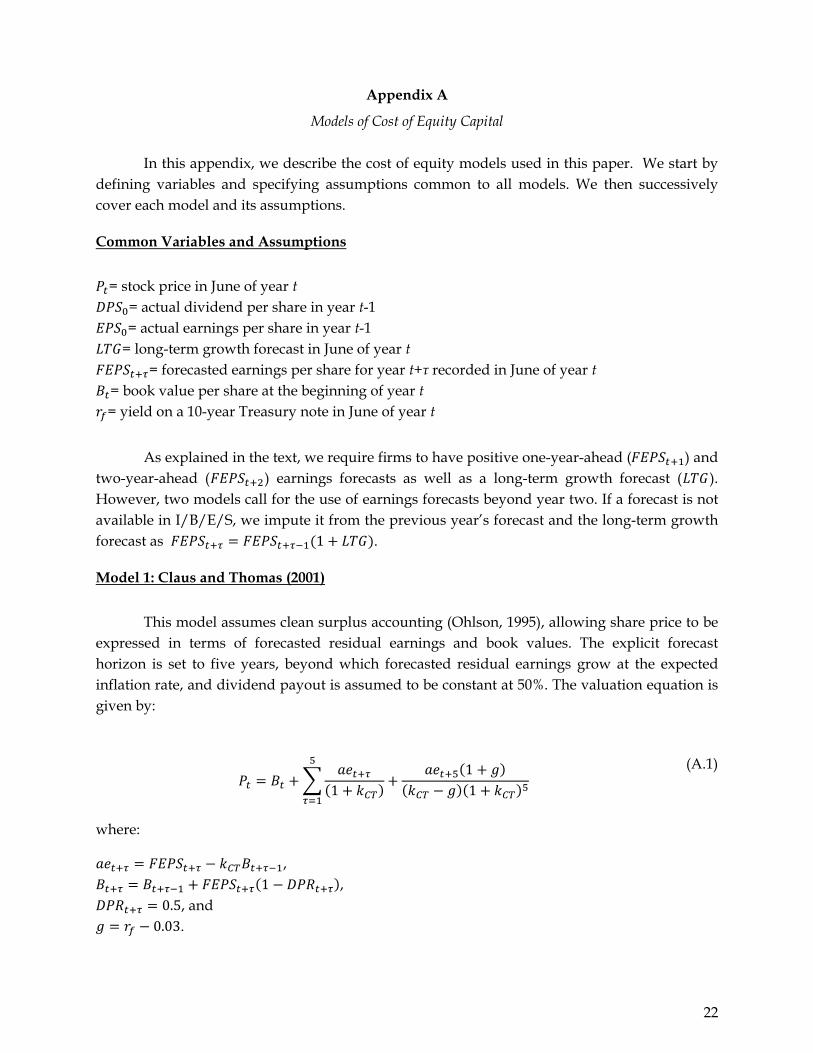
In this appendix, we describe the cost of equity models used in this paper. We start by defining variables and specifying assumptions common to all models. We then successively cover each model and its assumptions.
Common Variables and Assumptions
= stock price in June of year t = actual dividend per share in year t-1 = actual earnings per share in year t-1
= long-term growth forecast in June of year t = forecasted earnings per share for year t+τ recorded in June of year t
= book value per share at the beginning of year t = yield on a 10-year Treasury note in June of year t
As explained in the text, we require firms to have positive one-year-ahead ( ) and two-year-ahead ( ) earnings forecasts as well as a long-term growth forecast ( ). However, two models call for the use of earnings forecasts beyond year two. If a forecast is not available in I/B/E/S, we impute it from the previous year’s forecast and the long-term growth forecast as 1 .
Model 1: Claus and Thomas (2001)
This model assumes clean surplus accounting (Ohlson, 1995), allowing share price to be expressed in terms of forecasted residual earnings and book values. The explicit forecast horizon is set to five years, beyond which forecasted residual earnings grow at the expected inflation rate, and dividend payout is assumed to be constant at 50%. The valuation equation is given by:
111
(A.1)
where:
, 1 ,
0.5, and 0.03.
22
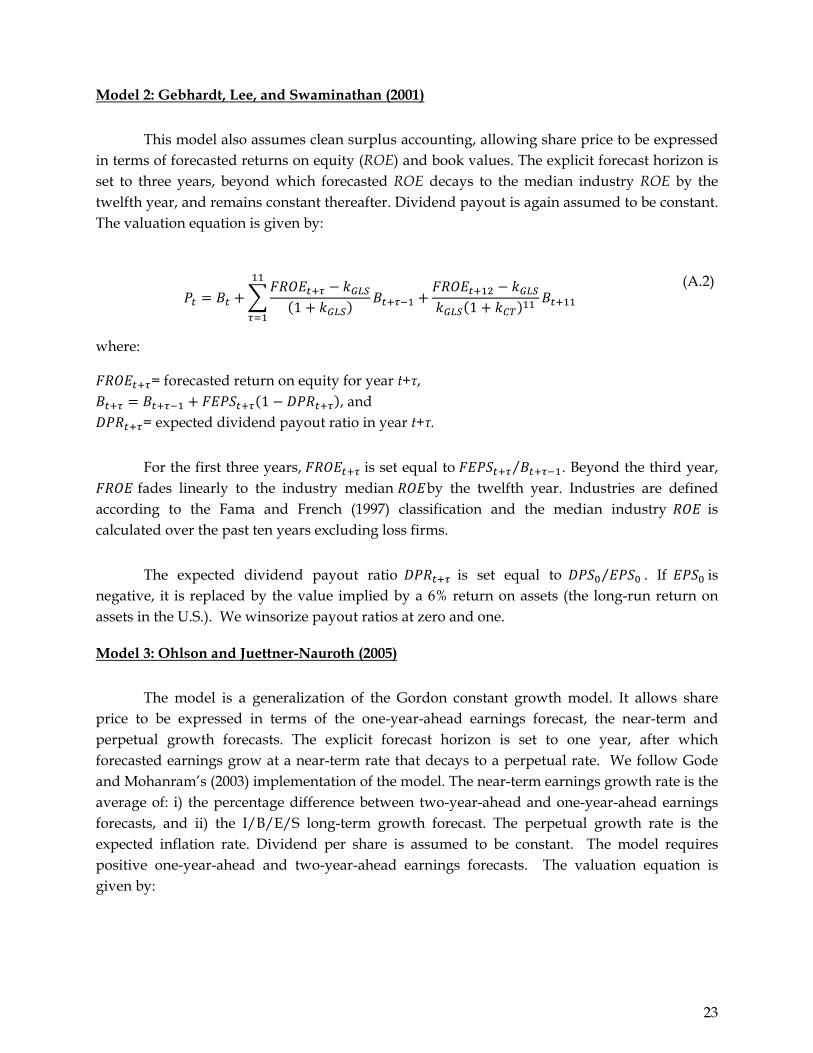
Model 2: Gebhardt, Lee, and Swaminathan (2001)
This model also assumes clean surplus accounting, allowing share price to be expressed in terms of forecasted returns on equity (ROE) and book values. The explicit forecast horizon is set to three years, beyond which forecasted ROE decays to the median industry ROE by the twelfth year, and remains constant thereafter. Dividend payout is again assumed to be constant. The valuation equation is given by:
1 1
(A.2)
where:
= forecasted return on equity for year t+τ, 1 , and
= expected dividend payout ratio in year t+τ.
For the first three years, is set equal to ⁄ . Beyond the third year,
fades linearly to the industry median by the twelfth year. Industries are defined according to the Fama and French (1997) classification and the median industry is calculated over the past ten years excluding loss firms.
The expected dividend payout ratio is set equal to ⁄ . If is negative, it is replaced by the value implied by a 6% return on assets (the long-run return on assets in the U.S.). We winsorize payout ratios at zero and one.
Model 3: Ohlson and Juettner-Nauroth (2005)
The model is a generalization of the Gordon constant growth model. It allows share price to be expressed in terms of the one-year-ahead earnings forecast, the near-term and perpetual growth forecasts. The explicit forecast horizon is set to one year, after which forecasted earnings grow at a near-term rate that decays to a perpetual rate. We follow Gode and Mohanram’s (2003) implementation of the model. The near-term earnings growth rate is the average of: i) the percentage difference between two-year-ahead and one-year-ahead earnings forecasts, and ii) the I/B/E/S long-term growth forecast. The perpetual growth rate is the expected inflation rate. Dividend per share is assumed to be constant. The model requires positive one-year-ahead and two-year-ahead earnings forecasts. The valuation equation is given by:
23
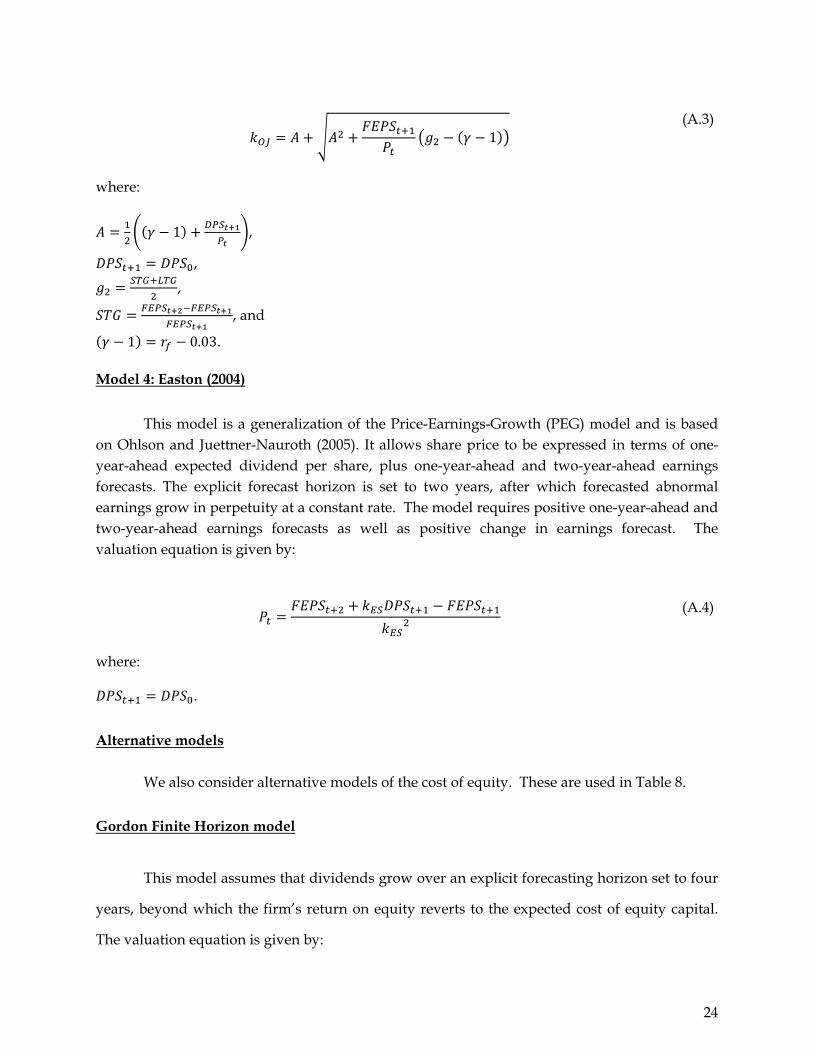
1 (A.3)
where:
1 ,
,
,
, and
1 0.03.
Model 4: Easton (2004)
This model is a generalization of the Price-Earnings-Growth (PEG) model and is based on Ohlson and Juettner-Nauroth (2005). It allows share price to be expressed in terms of one-year-ahead expected dividend per share, plus one-year-ahead and two-year-ahead earnings forecasts. The explicit forecast horizon is set to two years, after which forecasted abnormal earnings grow in perpetuity at a constant rate. The model requires positive one-year-ahead and two-year-ahead earnings forecasts as well as positive change in earnings forecast. The valuation equation is given by:
(A.4)
where:
.
Alternative models
We also consider alternative models of the cost of equity. These are used in Table 8.
Gordon Finite Horizon model
This model assumes that dividends grow over an explicit forecasting horizon set to four
years, beyond which the firm’s return on equity reverts to the expected cost of equity capital.
The valuation equation is given by:
24
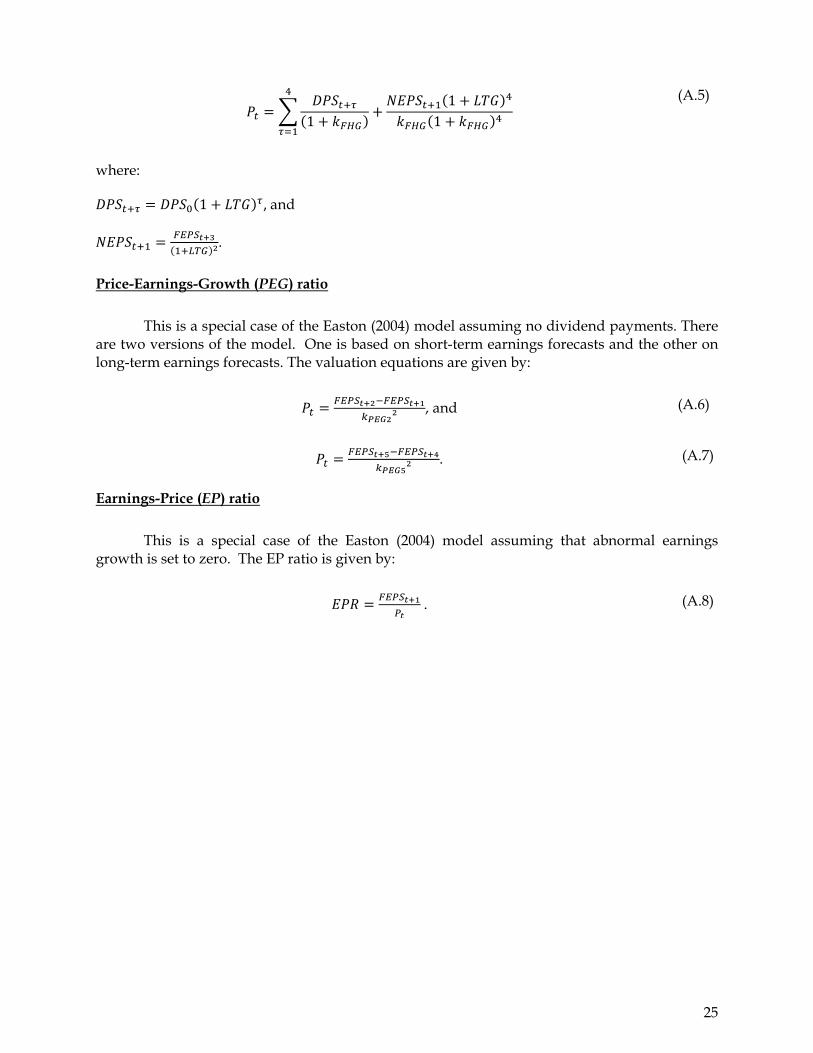
11
1
(A.5)
where:
1 , and
.
Price-Earnings-Growth (PEG) ratio
This is a special case of the Easton (2004) model assuming no dividend payments. There are two versions of the model. One is based on short-term earnings forecasts and the other on long-term earnings forecasts. The valuation equations are given by:
, and (A.6)
. (A.7)
Earnings-Price (EP) ratio
This is a special case of the Easton (2004) model assuming that abnormal earnings growth is set to zero. The EP ratio is given by:
. (A.8)
25
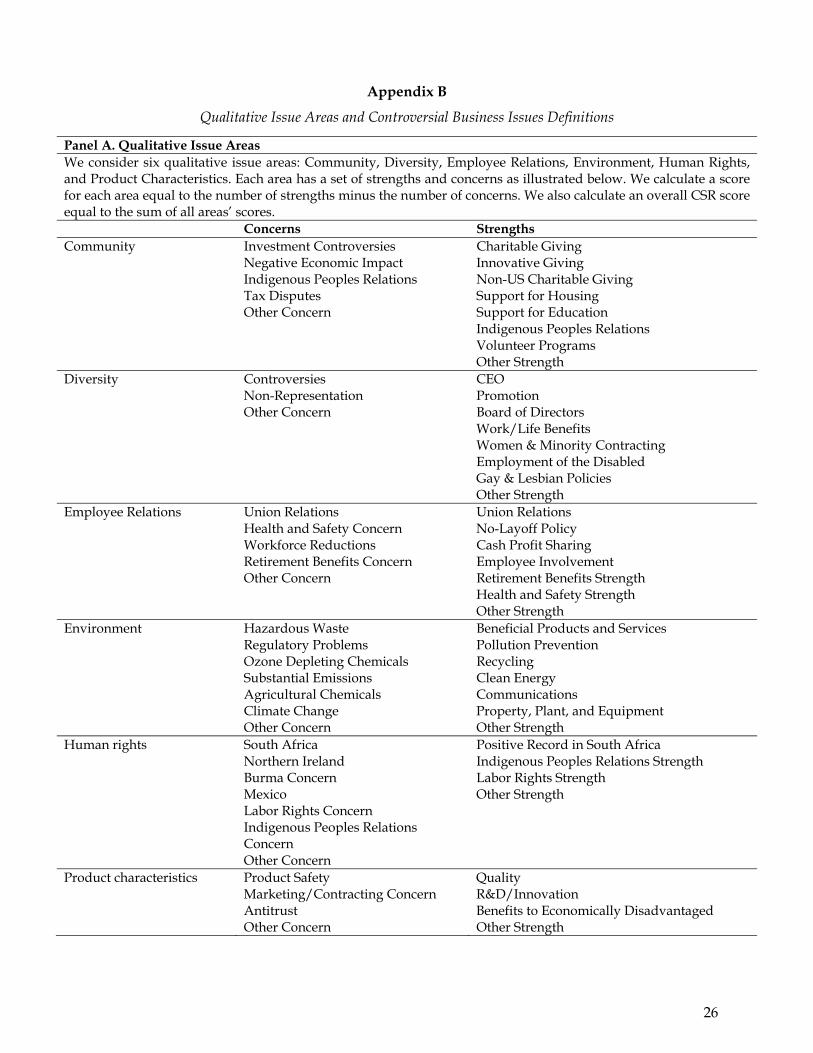
Appendix B
Qualitative Issue Areas and Controversial Business Issues Definitions
Panel A. Qualitative Issue Areas We consider six qualitative issue areas: Community, Diversity, Employee Relations, Environment, Human Rights, and Product Characteristics. Each area has a set of strengths and concerns as illustrated below. We calculate a score for each area equal to the number of strengths minus the number of concerns. We also calculate an overall CSR score equal to the sum of all areas’ scores.
Concerns Strengths Community Investment Controversies Charitable Giving Negative Economic Impact Innovative Giving Indigenous Peoples Relations Non-US Charitable Giving Tax Disputes Support for Housing Other Concern Support for Education Indigenous Peoples Relations Volunteer Programs Other Strength Diversity Controversies CEO Non-Representation Promotion Other Concern Board of Directors Work/Life Benefits Women & Minority Contracting Employment of the Disabled Gay & Lesbian Policies Other Strength Employee Relations Union Relations Union Relations Health and Safety Concern No-Layoff Policy Workforce Reductions Cash Profit Sharing Retirement Benefits Concern Employee Involvement Other Concern Retirement Benefits Strength Health and Safety Strength Other Strength Environment Hazardous Waste Beneficial Products and Services Regulatory Problems Pollution Prevention Ozone Depleting Chemicals Recycling Substantial Emissions Clean Energy Agricultural Chemicals Communications Climate Change Property, Plant, and Equipment Other Concern Other Strength Human rights South Africa Positive Record in South Africa Northern Ireland Indigenous Peoples Relations Strength Burma Concern Labor Rights Strength Mexico Other Strength Labor Rights Concern Indigenous Peoples Relations
Concern
Other Concern Product characteristics Product Safety Quality Marketing/Contracting Concern R&D/Innovation Antitrust Benefits to Economically Disadvantaged Other Concern Other Strength
26
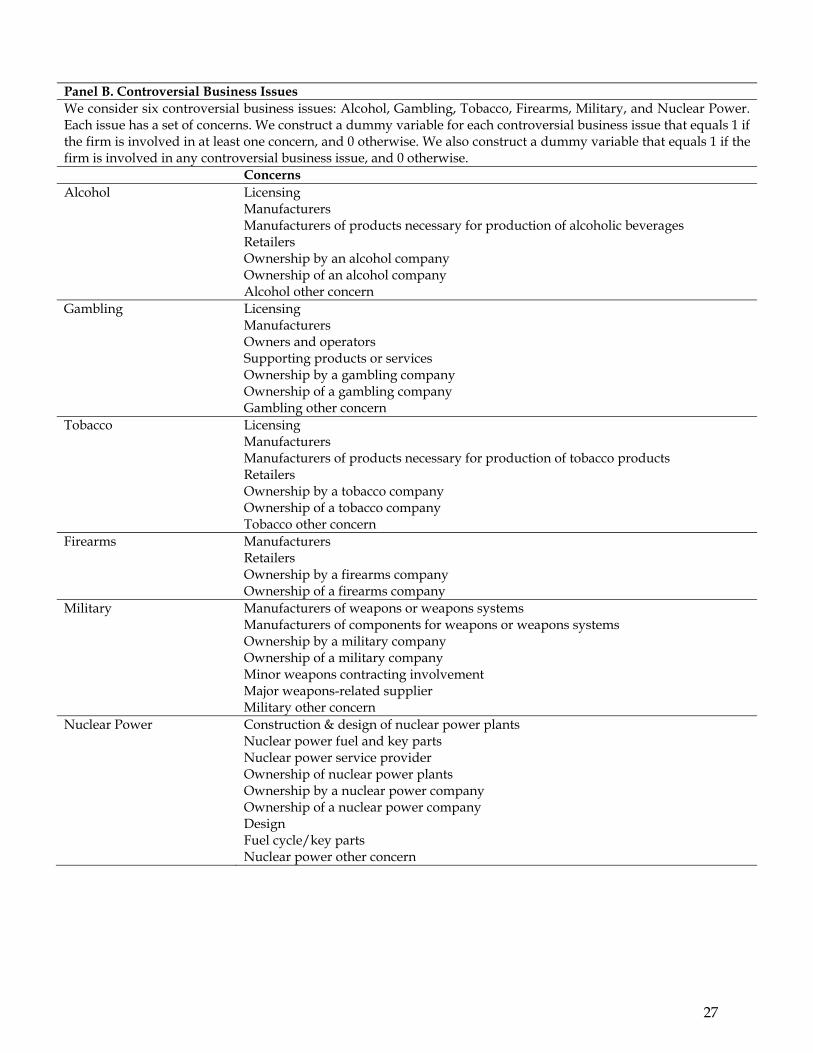
Panel B. Controversial Business Issues We consider six controversial business issues: Alcohol, Gambling, Tobacco, Firearms, Military, and Nuclear Power. Each issue has a set of concerns. We construct a dummy variable for each controversial business issue that equals 1 if the firm is involved in at least one concern, and 0 otherwise. We also construct a dummy variable that equals 1 if the firm is involved in any controversial business issue, and 0 otherwise. Concerns Alcohol Licensing Manufacturers Manufacturers of products necessary for production of alcoholic beverages Retailers Ownership by an alcohol company Ownership of an alcohol company Alcohol other concern Gambling Licensing Manufacturers Owners and operators Supporting products or services Ownership by a gambling company Ownership of a gambling company Gambling other concern Tobacco Licensing Manufacturers Manufacturers of products necessary for production of tobacco products Retailers Ownership by a tobacco company Ownership of a tobacco company Tobacco other concern Firearms Manufacturers Retailers Ownership by a firearms company Ownership of a firearms company Military Manufacturers of weapons or weapons systems Manufacturers of components for weapons or weapons systems Ownership by a military company Ownership of a military company Minor weapons contracting involvement Major weapons-related supplier Military other concern Nuclear Power Construction & design of nuclear power plants Nuclear power fuel and key parts Nuclear power service provider Ownership of nuclear power plants Ownership by a nuclear power company Ownership of a nuclear power company Design Fuel cycle/key parts Nuclear power other concern
27
Appendix C
Variable Definitions and Data Sources
Variable Definition Source Panel A. Dependent variables rCT Implied cost of equity premium defined as the cost of equity
derived from the Claus and Thomas (2001) model estimated in June of each year minus the rate on a 10-year Treasury bond.
Authors’ calculations based on I/B/E/S and Compustat data
rGLS Implied cost of equity premium defined as the cost of equity derived from the Gebhardt, Lee, and Swaminathan (2001) model estimated in June of each year minus the rate on a 10-year Treasury bond.
As above
rOJ Implied equity premium defined as the cost of equity derived from the Ohlson and Juttner-Nauroth (2005) model estimated in June of each year minus the rate on a 10-year Treasury bond.
As above
rES Implied cost of equity premium defined as the cost of equity derived from the Easton (2004) model estimated in June of each year minus the rate on a 10-year Treasury bond.
As above
rAVG Average of rGLS, rCT, rOJ, and rES. As above Panel B. Corporate social responsibility variables CSR_COM_S The Community score equals the number of strengths minus the
number of concerns in the Community qualitative issues area. Authors’ calculations based on KLD STATS data
CSR_DIV_S The Diversity score equals the number of strengths minus the number of concerns in the Diversity qualitative issues area.
As above
CSR_EMP_S The Employee Relations score equals to the number of strengths minus the number of concerns in the Employee Relations qualitative issues area.
As above
CSR_ENV_S The Environment score equals the number of strengths minus the number of concerns in the Environment qualitative issues area.
As above
CSR_HUM_S The Human Rights score equals the number of strengths minus the number of concerns in the Human Rights qualitative issues area.
As above
CSR_PRO_S The Product score equals the number of strengths minus the number of concerns in the Product qualitative issues area.
As above
CSR_S The CSR score equals the sum of the Community, Diversity, Employee, Environment, Human Rights, and Product Characteristics qualitative issues areas scores.
As above
CSR_CONTR Dummy variable set to 1 if the firm is involved in a controversial business issue, and 0 otherwise.
As above
CSR_ALC Dummy variable set to 1 if the firm is involved in the Alcohol controversial business issue, and 0 otherwise.
As above
CSR_GAM Dummy variable set to 1 if the firm is involved in the Gambling controversial business issue, and 0 otherwise.
As above
CSR_TOB Dummy variable set to 1 if the firm is involved in the Tobacco controversial business issue, and 0 otherwise.
As above
CSR_FIR Dummy variable set to 1 if the firm is involved in the Firearms controversial business issue, and 0 otherwise.
As above
CSR_MIL Dummy variable set to 1 if the firm is involved in the Military controversial business issue, and 0 otherwise.
As above
CSR_NUC Dummy variable set to 1 if the firm is involved in the Nuclear controversial business issue, and 0 otherwise.
As above
28
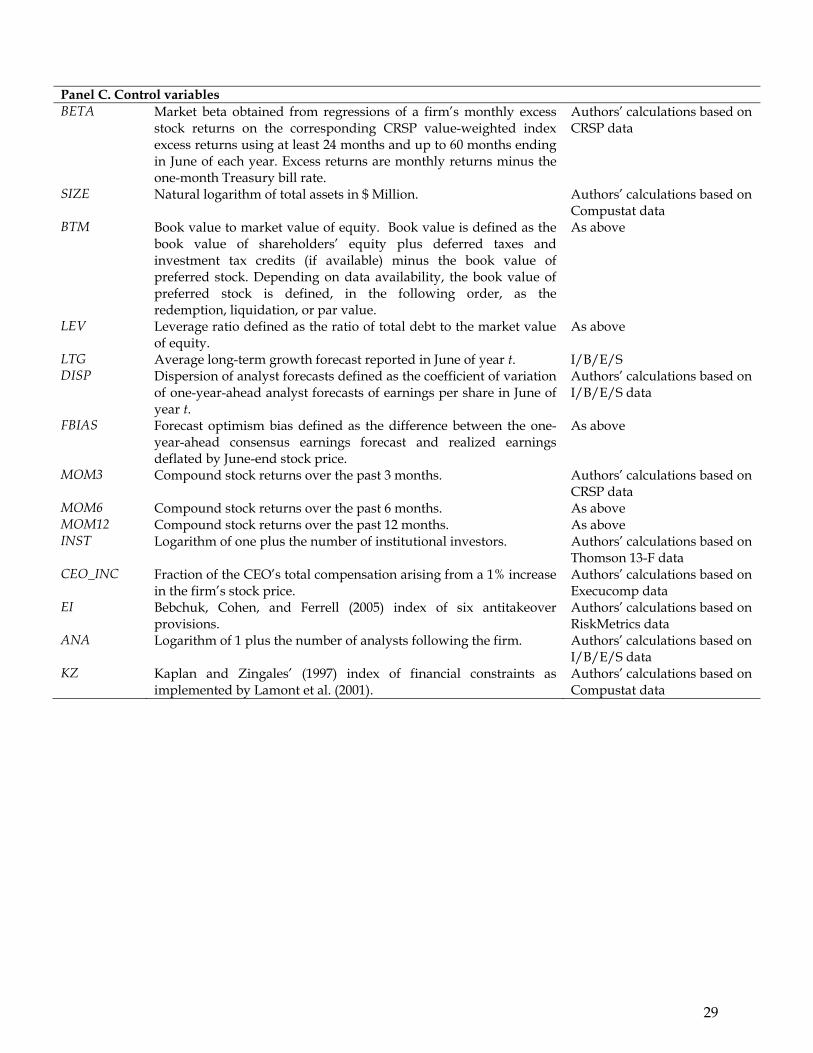
Panel C. Control variables BETA Market beta obtained from regressions of a firm’s monthly excess
stock returns on the corresponding CRSP value-weighted index excess returns using at least 24 months and up to 60 months ending in June of each year. Excess returns are monthly returns minus the one-month Treasury bill rate.
Authors’ calculations based on CRSP data
SIZE Natural logarithm of total assets in $ Million. Authors’ calculations based on Compustat data
BTM Book value to market value of equity. Book value is defined as the book value of shareholders’ equity plus deferred taxes and investment tax credits (if available) minus the book value of preferred stock. Depending on data availability, the book value of preferred stock is defined, in the following order, as the redemption, liquidation, or par value.
As above
LEV Leverage ratio defined as the ratio of total debt to the market value of equity.
As above
LTG Average long-term growth forecast reported in June of year t. I/B/E/S DISP Dispersion of analyst forecasts defined as the coefficient of variation
of one-year-ahead analyst forecasts of earnings per share in June of year t.
Authors’ calculations based on I/B/E/S data
FBIAS Forecast optimism bias defined as the difference between the one-year-ahead consensus earnings forecast and realized earnings deflated by June-end stock price.
As above
MOM3 Compound stock returns over the past 3 months. Authors’ calculations based on CRSP data
MOM6 Compound stock returns over the past 6 months. As above MOM12 Compound stock returns over the past 12 months. As above INST Logarithm of one plus the number of institutional investors. Authors’ calculations based on
Thomson 13-F data CEO_INC Fraction of the CEO’s total compensation arising from a 1% increase
in the firm’s stock price. Authors’ calculations based on Execucomp data
EI Bebchuk, Cohen, and Ferrell (2005) index of six antitakeover provisions.
Authors’ calculations based on RiskMetrics data
ANA Logarithm of 1 plus the number of analysts following the firm. Authors’ calculations based on I/B/E/S data
KZ Kaplan and Zingales’ (1997) index of financial constraints as implemented by Lamont et al. (2001).
Authors’ calculations based on Compustat data
29
References
Ali, A., A. Klein, and J. Rosenfeld, 1992, Analysts’ Use of Information about Permanent and Transitory Earnings Components in Forecasting Annual EPS, The Accounting Review 67, 183-198.
Attig, N., O. Guedhami, and D. Mishra, 2008, Multiple Large Shareholders, Control Contests, and Implied Cost of Equity, Journal of Corporate Finance 14, 721-737.
Baker, M. and J. Wurgler, 2002, Market Timing and Capital Structure, Journal of Finance 57, 1-32.
Barnea, A. and A. Rubin, 2006, Corporate Social Responsibility as a Conflict between Shareholders, Working Paper, Simon Fraser University.
Bassen, A., H.-M. Hölz, and J. Schlange, 2006, The Influence of Corporate Responsibility on the Cost of Capital: An Empirical Analysis, Hamburg: Schlange & Co, Universität Hamburg, Deutsche Bank.
Bebchuk, L., A. Cohen and A. Ferrell, 2009, What Matters in Corporate Governance?, Review of Financial Studies 22, 783-827.
Bergstresser, D. and T. Philippon, 2006, CEO Incentives and Earnings Management, Journal of Financial Economics 80, 511-529.
Blundell, R. and S. Bond, 1998, Initial Conditions and Moment Restrictions in Dynamic Panel Data Models, Journal of Econometrics 87, 115-143.
Boubakri, N., O. Guedhami and D. Mishra, 2010, Family Control and the Implied Cost of Equity: Evidence Before and After the Asian Financial Crisis, Journal of International Business Studies 41, 451-474.
Bowen, R., X. Chen, and Q. Cheng, 2008, Analyst Coverage and the Cost of Raising Equity Capital: Evidence from Underpricing of Seasoned Equity Offerings, Contemporary Accounting Research 25, 657-699.
Brammer, S., C. Brooks, and S. Pavelin, 2006, Corporate Social Performance and Stock Returns: UK Evidence from Disaggregate Measures, Financial Management 35, 97-116.
Brown, W., E. Helland and J. Smith, 2006, Corporate Philanthropic Practices, Journal of Corporate Finance 12, 855-877.
Chen, K., Z. Chen, and K. Wei, 2009a, Legal Protection of Investors, Corporate Governance, and the Cost of Equity Capital. Journal of Corporate Finance 15, 273–289.
Chen, K., Z. Chen, and K. Wei, 2009b, Agency Costs of Free Cash Flow and the Effect of Shareholder Rights on the Implied Cost of Equity Capital, Journal of Financial and Quantitative Analysis, forthcoming.
Claus, J. and J. Thomas, 2001, Equity Premia as Low as Three Percent? Evidence from Analysts’ Earnings Forecasts for Domestic and International Stock Markets, Journal of Finance 56, 1629-1666.
Core, J. and W. Guay, 2002, Estimating the Value of Employee Stock Option Portfolios and Their Sensitivities to Price and Volatility, Journal of Accounting Research 40, 613-630.
Dhaliwal, D., S. Eheitzman, and O. Z. Li, 2006, Taxes, Leverage, and the Cost of Equity Capital, Journal of Accounting Research 44, 691-723.
30
Dhaliwal, D., O. Z. Li, A. H. Tsang, and Y. G. Yang, 2009, Voluntary Non-Financial Disclosure and the Cost of Equity Capital: The Case of Corporate Social Responsibility Reporting, Working Paper, University of Arizona.
Easton, P. D., 2004, PE Ratios, PEG Ratios, and Estimating the Implied Expected Rate of Return on Equity Capital, The Accounting Review 79, 73-95.
Easton, P. D. and G. A. Sommers, 2007, Effect of Analysts' Optimism on Estimates of the Expected Rate of Return Implied by Earnings Forecasts, Journal of Accounting Research 45, 983-1015.
El Ghoul, S., O. Guedhami, and J. Pittman, 2010, The Role of IRS Monitoring in Equity Pricing in Public Firms, Contemporary Accounting Research, forthcoming.
Elton, E., 1999, Expected Return, Realized Return, and Asset Pricing Tests, Journal of Finance 54, 1199 -1220.
Fama, E. F. and K. R. French, 1992, The Cross Section of Expected Stock Returns, Journal of Finance 47, 427-466.
Fama, E. F and K. R. French, 1993, Common Risk Factors in the Returns on Stocks and Bonds, Journal of Financial Economics 33, 3-56.
Fama, E. F. and K. R. French, 1997, Industry Costs of Equity, Journal of Financial Economics 43, 153-194.
Feldman, S. J., P. A. Soyka, and P. Ameer, 1997, Does Improving a Firm’s Environmental Management System and Environmental Performance Result in a Higher Stock Price?, Journal of Investing 6, 87-97.
Fisman, R., G. Heal, and V. B. Nair, 2005, A Model of Corporate Philanthropy, Working Paper, Columbia University.
Fombrun, C. and M. Shanely, 1990, What’s in a Name? Reputation Building and Corporate Strategy, Academy of Management Journal 33, 233-258.
Francis, J., R. Lafond, P. M. Olsson, and K. Schipper, 2005, The Market Pricing of Accruals Quality, Journal of Accounting and Economics 39, 295-327.
Frederick, W.C., 1995, Values, Nature and Culture in the American Corporation, Oxford University Press, New York.
Galema R., A. Plantinga and B. Scholtens, 2008, The Stocks at Stake: Return and Risk in Socially Responsible Investment, Journal of Banking and Finance 32, 2646–2654.
Gebhardt, W., C. Lee, and B. Swaminathan, 2001, Towards an Implied Cost of Capital, Journal of Accounting Research 39, 135-176.
Gode, D. and P. Mohanram, 2003, Inferring the Cost of Capital Using the Ohlson-Juettner Model, Review of Accounting Studies 8, 399-431.
Gordon, J. and M. Gordon, 1997, The Finite Horizon Expected Return Model, Financial Analysts Journal 53, 52-61.
Guay, W., S.P. Kothari, and S. Shu, 2005, Properties of Implied Cost of Capital Using Analysts’ Forecasts, Working Paper, University of Pennsylvania.
31
Guedhami, O. and D. Mishra, 2009, Excess Control, Corporate Governance, and Implied Cost of Equity: International Evidence, Financial Review 44,489-524.
Hail, L. and C. Leuz, 2006, International Differences in Cost of Equity Capital: Do Legal Institutions and Securities Regulations Matter?, Journal of Accounting Research 44, 485-531.
Hail, L. and C. Leuz, 2009, Cost of Capital Effects and Changes in Growth Expectations around U.S. Cross-Listings, Journal of Financial Economics 93, 428-454.
Hamilton, S., H. Jo and M. Statman, 1993, Doing Well While Doing Good? The Investment Performance of Socially Responsible Mutual Funds, Financial Analysis Journal 49, 62-97.
Harjoto, M. and H. Jo, 2007, Corporate Governance and Firm Value: The Impact of Corporate Social Responsibility, Working Paper, Santa Clara University.
Heinkel, R., A. Kraus and J. Zechner, 2001, The Effect of Green Investment on Corporate Behavior, Journal of Financial and Quantitative Analysis 36, 431-449.
Hill, R., T. Ainscough, T. Shank, and D. Manullang, 2007, Corporate Social Responsibility and Socially Responsible Investing: A Global Perspective, Journal of Business Ethics 70, 165-174.
Hong, H. and M. Kacperczyk, 2009, The Price of Sin: The Effects of Social Norms on Markets, Journal of Financial Economics 93, 15-36.
Hribar, P. and N. Jenkins, 2004, The Effect of Accounting Restatements on Earnings Revisions and the Estimated Cost of Capital, Review of Accounting Studies 9, 337-356.
Kaplan, S. N., and L. Zingales, 1997, Do Investment-Cash Flow Sensitivities Provide Useful Measures of Financing Constraints?, Quarterly Journal of Economics 112, 169–215.
Kempf, A. and P. Osthoff, 2007, The Effect of Socially Responsible Investing on Financial Performance, European Financial Management 13, 908-922.
King, A., 1995, Avoiding Ecological Surprise: Lessons from Long Standing Communities, Academy of Management Review 20, 961-985.
Kothari, S. P. 2001, Capital Markets Research in Accounting, Journal of Accounting and Economics 31, 105-231.
Lamont, O., C. Polk, and J. Saa-Requejo, 2001, Financial Constraints and Stock Returns, Review of Financial Studies 14, 529–554.
Lintner, J., 1965, The Valuation of Risk Assets and the Selection of Risky Investments in Stock Portfolios and Capital Budgets, Review of Economics and Statistics 47, 13-37.
McGuire, J., A. Sundgren, and T. Schneeweis, 1988, Corporate Social Responsibility and Firm Financial Performance. Academy of Management Journal 31, 854-872.
McWilliams, A. and D. Siegel, 2001, Corporate Social Responsibility: A Theory of the Firm Perspective, Academy of Management Review 28, 117-127.
Merton, R.C., 1987, A Simple Model of Capital Market Equilibrium with Incomplete Information, Journal of Finance 42, 483–510.
Modigliani, F. and M. Miller, 1958, The Cost of Capital, Corporation Finance and the Theory of Investment, American Economic Review 48, 261-297.
32
Nelling, E. and E. Webb, 2009, Corporate Social Responsibility and Financial Performance: The 'Virtuous Circle' Revisited, Review of Quantitative Finance and Accounting 32, 197-209.
Ohlson, J. and B. Juettner-Nauroth, 2005, Expected EPS and EPS Growth as Determinants of Value, Review of Accounting Studies 10, 349–65.
Ohlson, J., 1995, Earnings, Book Value, and Dividends in Security Valuation, Contemporary Accounting Research 11, 661-687.
Pástor, L., M. Sinha, and B. Swaminathan, 2008, Estimating the Intertemporal Risk-Return Tradeoff Using the Implied Cost of Capital, Journal of Finance 63: 2859-2897.
Renneboog, L., J. Horst, and C. Zhang, 2008, Socially Responsible Investments: Institutional Aspects, Performance, and Investor Behavior, Journal of Banking and Finance 32, 1723–1742.
Roberts, P. and G. Dowling. 2002, Corporate Reputation and Sustained Superior Financial Performance, Strategic Management Journal 23, 1077-1093.
Robinson, M., A. Kleffner, and S. Bertels, 2008, The Value of a Reputation for Corporate Social Responsibility: Empirical Evidence, Working Paper, University of Michigan.
Sharpe, W., 1964, Capital Asset Prices: A Theory of Market Equilibrium under Conditions of Risk, Journal of Finance 19, 425-442.
Spicer, B. H., 1978, Investors, Corporate Social Performance and Information Disclosure: An Empirical Study, The Accounting Review 53, 94-111.
Starks, L. T., 2009, EFA Keynote Speech: “Corporate Governance and Corporate Social Responsibility: What Do Investors Care about? What Should Investors Care about?”, Financial Review 44, 461-468.
Statman, M. and D. Glushkov, 2009, The Wages of Social Responsibility, Financial Analysts Journal 65, 33-46.
Verwijmeren, P. and J. Derwall, 2010, Employee Well-being, Firm Leverage, and Bankruptcy Risk, Journal of Banking and Finance 34, 956-964.
Waddock, S. and S. Graves, 1997, The Corporate Social Performance-Financial Performance Link, Strategic Management Journal 18, 303-319.
33
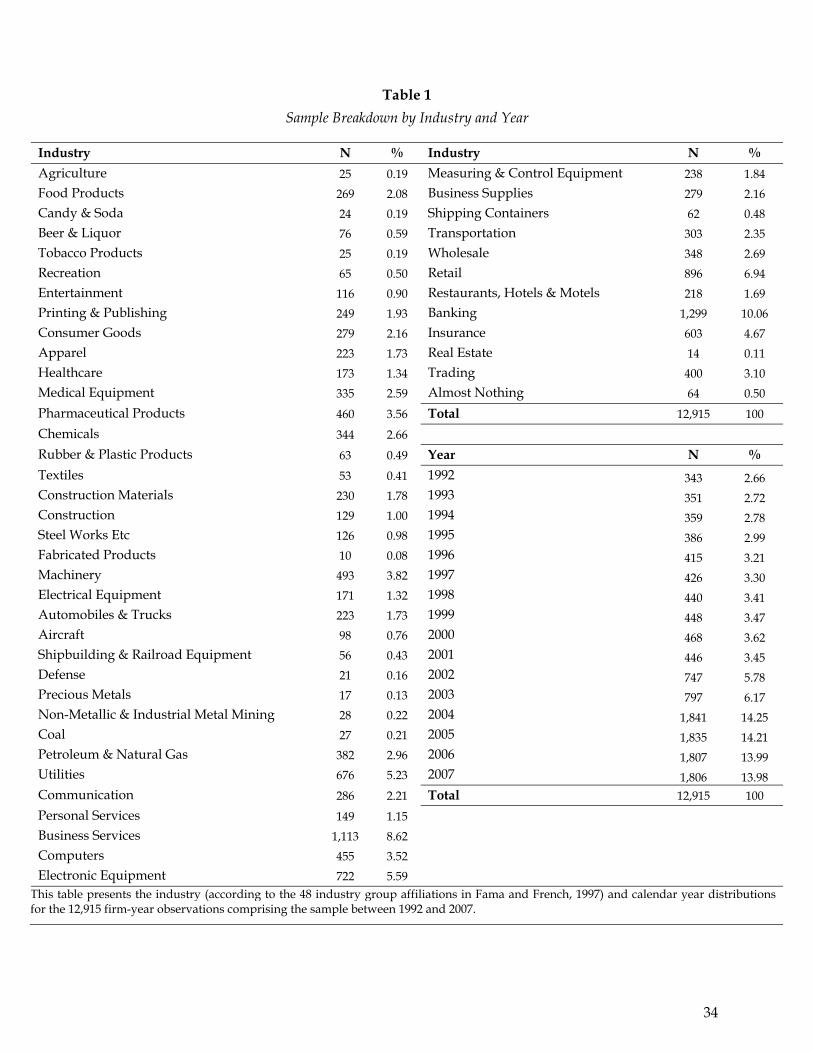
Table 1
Sample Breakdown by Industry and Year
Industry N % Industry N %
Agriculture 25 0.19 Measuring & Control Equipment 238 1.84
Food Products 269 2.08 Business Supplies 279 2.16
Candy & Soda 24 0.19 Shipping Containers 62 0.48
Beer & Liquor 76 0.59 Transportation 303 2.35
Tobacco Products 25 0.19 Wholesale 348 2.69
Recreation 65 0.50 Retail 896 6.94
Entertainment 116 0.90 Restaurants, Hotels & Motels 218 1.69
Printing & Publishing 249 1.93 Banking 1,299 10.06
Consumer Goods 279 2.16 Insurance 603 4.67
Apparel 223 1.73 Real Estate 14 0.11
Healthcare 173 1.34 Trading 400 3.10
Medical Equipment 335 2.59 Almost Nothing 64 0.50
Pharmaceutical Products 460 3.56 Total 12,915 100
Chemicals 344 2.66
Rubber & Plastic Products 63 0.49 Year N %
Textiles 53 0.41 1992 343 2.66 Construction Materials 230 1.78 1993 351 2.72 Construction 129 1.00 1994 359 2.78 Steel Works Etc 126 0.98 1995 386 2.99 Fabricated Products 10 0.08 1996 415 3.21 Machinery 493 3.82 1997 426 3.30 Electrical Equipment 171 1.32 1998 440 3.41 Automobiles & Trucks 223 1.73 1999 448 3.47 Aircraft 98 0.76 2000 468 3.62 Shipbuilding & Railroad Equipment 56 0.43 2001 446 3.45 Defense 21 0.16 2002 747 5.78 Precious Metals 17 0.13 2003 797 6.17 Non-Metallic & Industrial Metal Mining 28 0.22 2004 1,841 14.25 Coal 27 0.21 2005 1,835 14.21 Petroleum & Natural Gas 382 2.96 2006 1,807 13.99 Utilities 676 5.23 2007 1,806 13.98 Communication 286 2.21 Total 12,915 100
Personal Services 149 1.15
Business Services 1,113 8.62
Computers 455 3.52
Electronic Equipment 722 5.59 This table presents the industry (according to the 48 industry group affiliations in Fama and French, 1997) and calendar year distributions for the 12,915 firm-year observations comprising the sample between 1992 and 2007.
34
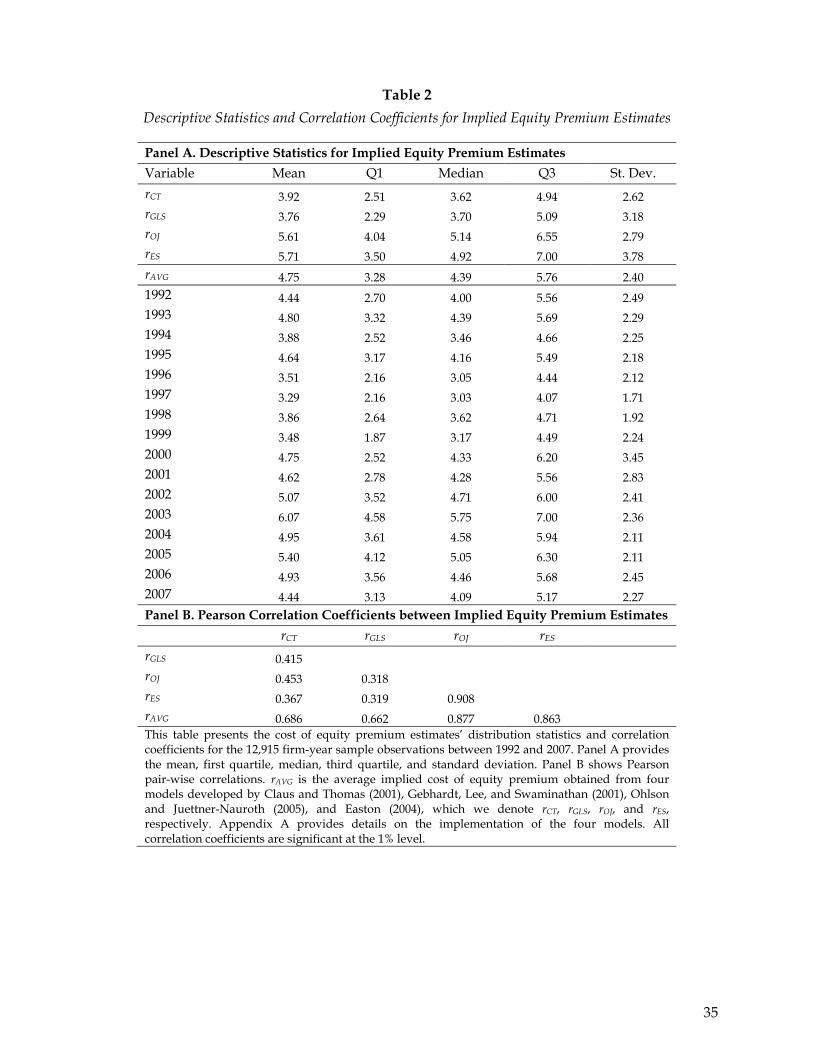
Table 2
Descriptive Statistics and Correlation Coefficients for Implied Equity Premium Estimates
Panel A. Descriptive Statistics for Implied Equity Premium Estimates
Variable Mean Q1 Median Q3 St. Dev.
rCT 3.92 2.51 3.62 4.94 2.62 rGLS 3.76 2.29 3.70 5.09 3.18 rOJ 5.61 4.04 5.14 6.55 2.79 rES 5.71 3.50 4.92 7.00 3.78 rAVG 4.75 3.28 4.39 5.76 2.40 1992 4.44 2.70 4.00 5.56 2.49 1993 4.80 3.32 4.39 5.69 2.29 1994 3.88 2.52 3.46 4.66 2.25 1995 4.64 3.17 4.16 5.49 2.18 1996 3.51 2.16 3.05 4.44 2.12 1997 3.29 2.16 3.03 4.07 1.71 1998 3.86 2.64 3.62 4.71 1.92 1999 3.48 1.87 3.17 4.49 2.24 2000 4.75 2.52 4.33 6.20 3.45 2001 4.62 2.78 4.28 5.56 2.83 2002 5.07 3.52 4.71 6.00 2.41 2003 6.07 4.58 5.75 7.00 2.36 2004 4.95 3.61 4.58 5.94 2.11 2005 5.40 4.12 5.05 6.30 2.11 2006 4.93 3.56 4.46 5.68 2.45 2007 4.44 3.13 4.09 5.17 2.27
Panel B. Pearson Correlation Coefficients between Implied Equity Premium Estimates
rCT rGLS rOJ rES
rGLS 0.415 rOJ 0.453 0.318 rES 0.367 0.319 0.908 rAVG 0.686 0.662 0.877 0.863 This table presents the cost of equity premium estimates’ distribution statistics and correlation coefficients for the 12,915 firm-year sample observations between 1992 and 2007. Panel A provides the mean, first quartile, median, third quartile, and standard deviation. Panel B shows Pearson pair-wise correlations. rAVG is the average implied cost of equity premium obtained from four models developed by Claus and Thomas (2001), Gebhardt, Lee, and Swaminathan (2001), Ohlson and Juettner-Nauroth (2005), and Easton (2004), which we denote rCT, rGLS, rOJ, and rES, respectively. Appendix A provides details on the implementation of the four models. All correlation coefficients are significant at the 1% level.
35
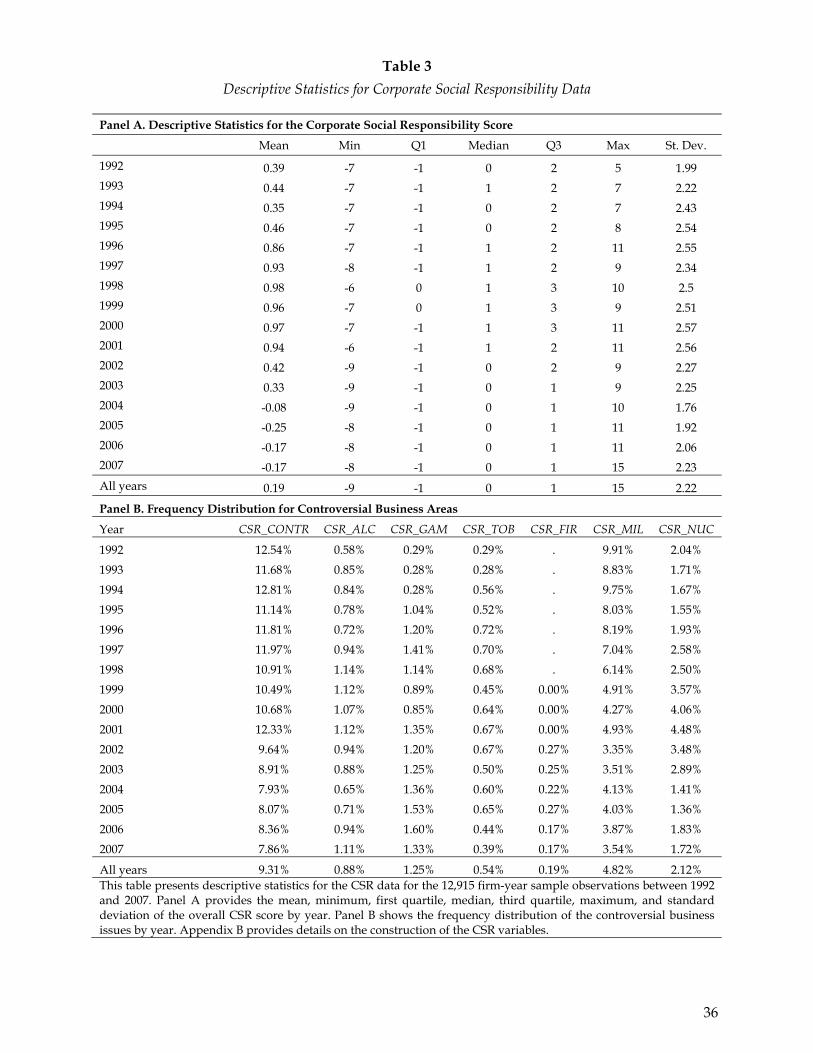
Table 3
Descriptive Statistics for Corporate Social Responsibility Data
Panel A. Descriptive Statistics for the Corporate Social Responsibility Score
Mean Min Q1 Median Q3 Max St. Dev.
1992 0.39 -7 -1 0 2 5 1.99 1993 0.44 -7 -1 1 2 7 2.22 1994 0.35 -7 -1 0 2 7 2.43 1995 0.46 -7 -1 0 2 8 2.54 1996 0.86 -7 -1 1 2 11 2.55 1997 0.93 -8 -1 1 2 9 2.34 1998 0.98 -6 0 1 3 10 2.5 1999 0.96 -7 0 1 3 9 2.51 2000 0.97 -7 -1 1 3 11 2.57 2001 0.94 -6 -1 1 2 11 2.56 2002 0.42 -9 -1 0 2 9 2.27 2003 0.33 -9 -1 0 1 9 2.25 2004 -0.08 -9 -1 0 1 10 1.76 2005 -0.25 -8 -1 0 1 11 1.92 2006 -0.17 -8 -1 0 1 11 2.06 2007 -0.17 -8 -1 0 1 15 2.23
All years 0.19 -9 -1 0 1 15 2.22
Panel B. Frequency Distribution for Controversial Business Areas
Year CSR_CONTR CSR_ALC CSR_GAM CSR_TOB CSR_FIR CSR_MIL CSR_NUC
1992 12.54% 0.58% 0.29% 0.29% . 9.91% 2.04%
1993 11.68% 0.85% 0.28% 0.28% . 8.83% 1.71%
1994 12.81% 0.84% 0.28% 0.56% . 9.75% 1.67%
1995 11.14% 0.78% 1.04% 0.52% . 8.03% 1.55%
1996 11.81% 0.72% 1.20% 0.72% . 8.19% 1.93%
1997 11.97% 0.94% 1.41% 0.70% . 7.04% 2.58%
1998 10.91% 1.14% 1.14% 0.68% . 6.14% 2.50%
1999 10.49% 1.12% 0.89% 0.45% 0.00% 4.91% 3.57%
2000 10.68% 1.07% 0.85% 0.64% 0.00% 4.27% 4.06%
2001 12.33% 1.12% 1.35% 0.67% 0.00% 4.93% 4.48%
2002 9.64% 0.94% 1.20% 0.67% 0.27% 3.35% 3.48%
2003 8.91% 0.88% 1.25% 0.50% 0.25% 3.51% 2.89%
2004 7.93% 0.65% 1.36% 0.60% 0.22% 4.13% 1.41%
2005 8.07% 0.71% 1.53% 0.65% 0.27% 4.03% 1.36%
2006 8.36% 0.94% 1.60% 0.44% 0.17% 3.87% 1.83%
2007 7.86% 1.11% 1.33% 0.39% 0.17% 3.54% 1.72%
All years 9.31% 0.88% 1.25% 0.54% 0.19% 4.82% 2.12% This table presents descriptive statistics for the CSR data for the 12,915 firm-year sample observations between 1992 and 2007. Panel A provides the mean, minimum, first quartile, median, third quartile, maximum, and standard deviation of the overall CSR score by year. Panel B shows the frequency distribution of the controversial business issues by year. Appendix B provides details on the construction of the CSR variables.
36
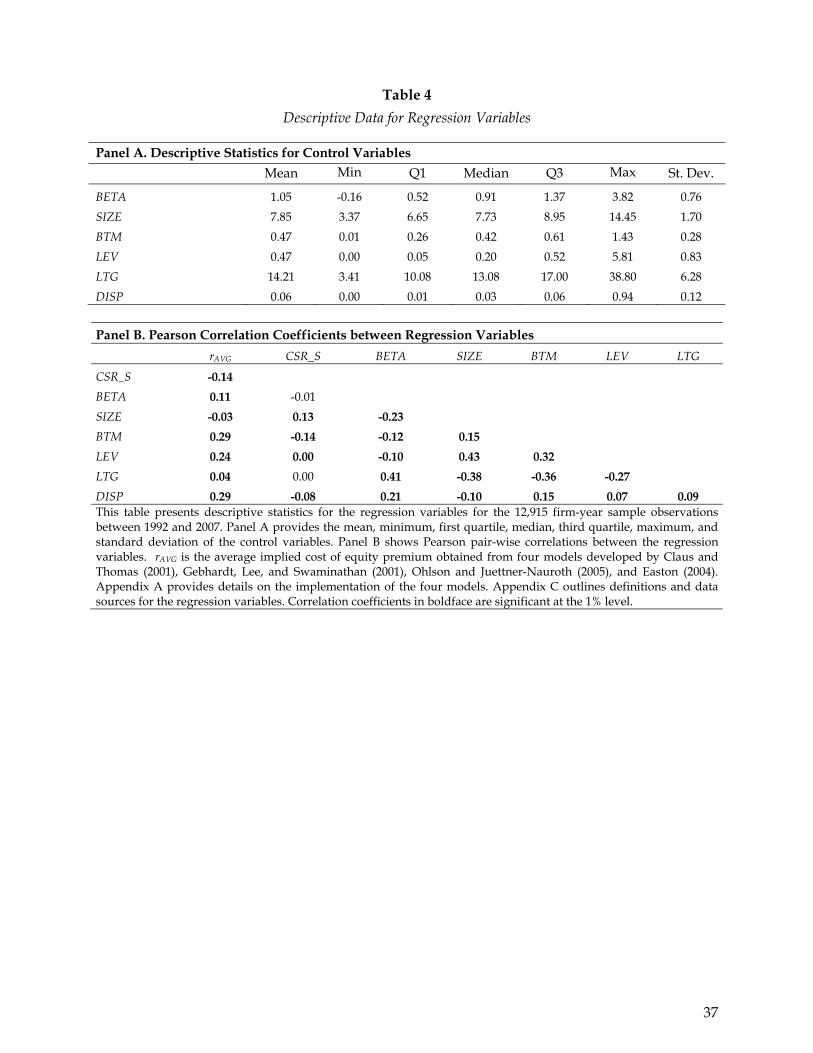
Table 4
Descriptive Data for Regression Variables
Panel A. Descriptive Statistics for Control Variables
Mean Min Q1 Median Q3 Max St. Dev.
BETA 1.05 -0.16 0.52 0.91 1.37 3.82 0.76
SIZE 7.85 3.37 6.65 7.73 8.95 14.45 1.70
BTM 0.47 0.01 0.26 0.42 0.61 1.43 0.28
LEV 0.47 0.00 0.05 0.20 0.52 5.81 0.83
LTG 14.21 3.41 10.08 13.08 17.00 38.80 6.28
DISP 0.06 0.00 0.01 0.03 0.06 0.94 0.12
Panel B. Pearson Correlation Coefficients between Regression Variables
rAVG CSR_S BETA SIZE BTM LEV LTG
CSR_S -0.14
BETA 0.11 -0.01
SIZE -0.03 0.13 -0.23
BTM 0.29 -0.14 -0.12 0.15
LEV 0.24 0.00 -0.10 0.43 0.32
LTG 0.04 0.00 0.41 -0.38 -0.36 -0.27
DISP 0.29 -0.08 0.21 -0.10 0.15 0.07 0.09 This table presents descriptive statistics for the regression variables for the 12,915 firm-year sample observations between 1992 and 2007. Panel A provides the mean, minimum, first quartile, median, third quartile, maximum, and standard deviation of the control variables. Panel B shows Pearson pair-wise correlations between the regression variables. rAVG is the average implied cost of equity premium obtained from four models developed by Claus and Thomas (2001), Gebhardt, Lee, and Swaminathan (2001), Ohlson and Juettner-Nauroth (2005), and Easton (2004). Appendix A provides details on the implementation of the four models. Appendix C outlines definitions and data sources for the regression variables. Correlation coefficients in boldface are significant at the 1% level.
37
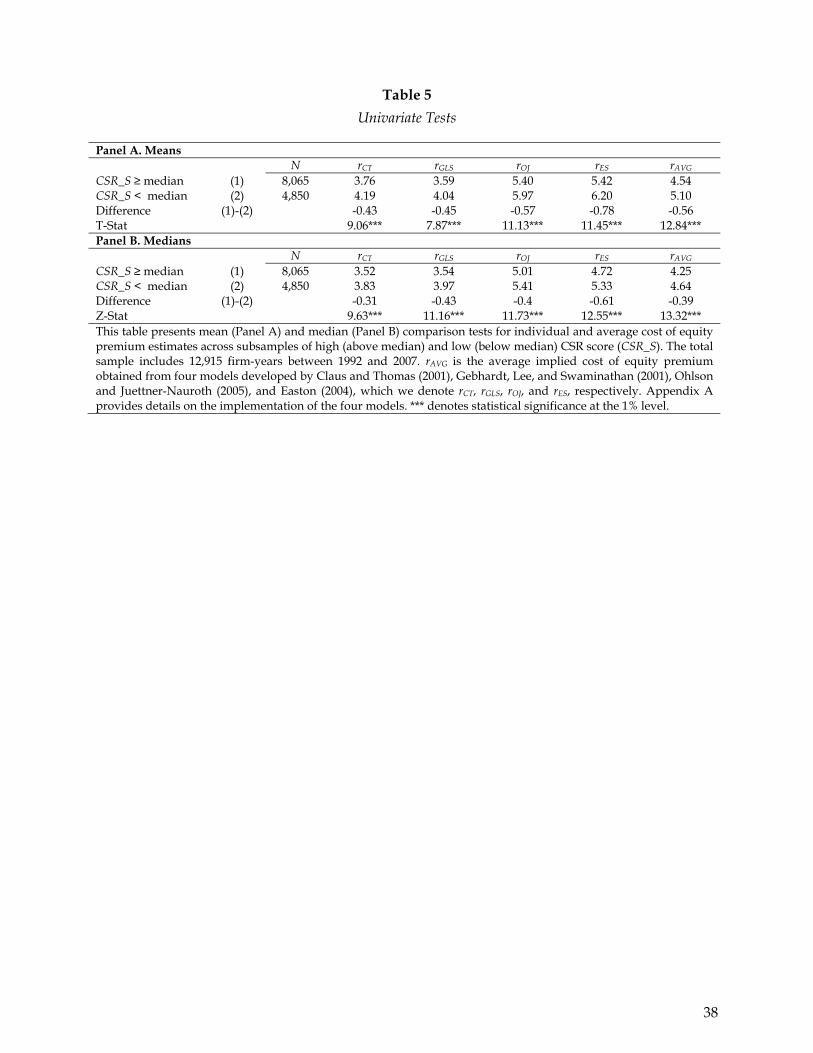
Table 5
Univariate Tests
Panel A. Means N rCT rGLS rOJ rES rAVG
CSR_S ≥ median (1) 8,065 3.76 3.59 5.40 5.42 4.54 CSR_S < median (2) 4,850 4.19 4.04 5.97 6.20 5.10 Difference (1)-(2) -0.43 -0.45 -0.57 -0.78 -0.56 T-Stat 9.06*** 7.87*** 11.13*** 11.45*** 12.84*** Panel B. Medians
N rCT rGLS rOJ rES rAVG CSR_S ≥ median (1) 8,065 3.52 3.54 5.01 4.72 4.25 CSR_S < median (2) 4,850 3.83 3.97 5.41 5.33 4.64 Difference (1)-(2) -0.31 -0.43 -0.4 -0.61 -0.39 Z-Stat 9.63*** 11.16*** 11.73*** 12.55*** 13.32*** This table presents mean (Panel A) and median (Panel B) comparison tests for individual and average cost of equity premium estimates across subsamples of high (above median) and low (below median) CSR score (CSR_S). The total sample includes 12,915 firm-years between 1992 and 2007. rAVG is the average implied cost of equity premium obtained from four models developed by Claus and Thomas (2001), Gebhardt, Lee, and Swaminathan (2001), Ohlson and Juettner-Nauroth (2005), and Easton (2004), which we denote rCT, rGLS, rOJ, and rES, respectively. Appendix A provides details on the implementation of the four models. *** denotes statistical significance at the 1% level.
38
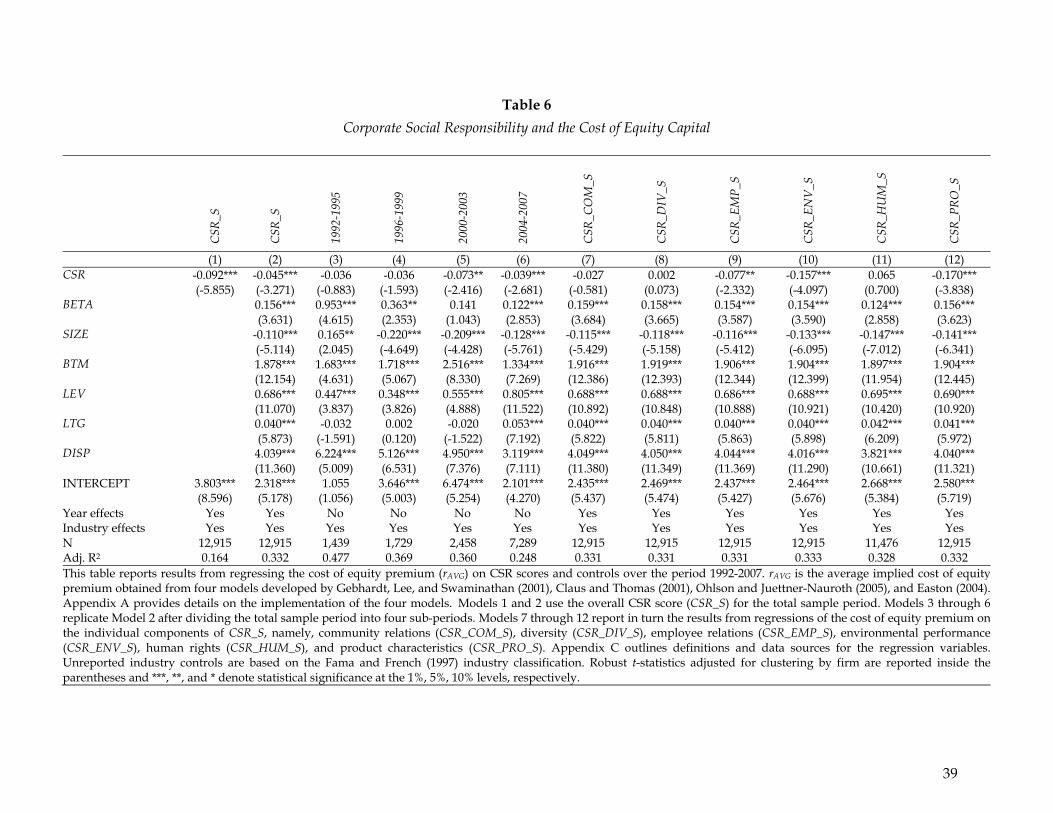
Table 6
Corporate Social Responsibility and the Cost of Equity Capital
CSR
_S
CSR
_S
1992
-199
5
1996
-199
9
2000
-200
3
2004
-200
7
CSR
_CO
M_S
CSR
_DIV
_S
CSR
_EM
P_S
CSR
_EN
V_S
CSR
_HU
M_S
CSR
_PR
O_S
(1) (2) (3) (4) (5) (6) (7) (8) (9) (10) (11) (12) CSR -0.092*** -0.045*** -0.036 -0.036 -0.073** -0.039*** -0.027 0.002 -0.077** -0.157*** 0.065 -0.170*** (-5.855) (-3.271) (-0.883) (-1.593) (-2.416) (-2.681) (-0.581) (0.073) (-2.332) (-4.097) (0.700) (-3.838) BETA 0.156*** 0.953*** 0.363** 0.141 0.122*** 0.159*** 0.158*** 0.154*** 0.154*** 0.124*** 0.156*** (3.631) (4.615) (2.353) (1.043) (2.853) (3.684) (3.665) (3.587) (3.590) (2.858) (3.623) SIZE -0.110*** 0.165** -0.220*** -0.209*** -0.128*** -0.115*** -0.118*** -0.116*** -0.133*** -0.147*** -0.141*** (-5.114) (2.045) (-4.649) (-4.428) (-5.761) (-5.429) (-5.158) (-5.412) (-6.095) (-7.012) (-6.341) BTM 1.878*** 1.683*** 1.718*** 2.516*** 1.334*** 1.916*** 1.919*** 1.906*** 1.904*** 1.897*** 1.904*** (12.154) (4.631) (5.067) (8.330) (7.269) (12.386) (12.393) (12.344) (12.399) (11.954) (12.445) LEV 0.686*** 0.447*** 0.348*** 0.555*** 0.805*** 0.688*** 0.688*** 0.686*** 0.688*** 0.695*** 0.690*** (11.070) (3.837) (3.826) (4.888) (11.522) (10.892) (10.848) (10.888) (10.921) (10.420) (10.920) LTG 0.040*** -0.032 0.002 -0.020 0.053*** 0.040*** 0.040*** 0.040*** 0.040*** 0.042*** 0.041*** (5.873) (-1.591) (0.120) (-1.522) (7.192) (5.822) (5.811) (5.863) (5.898) (6.209) (5.972) DISP 4.039*** 6.224*** 5.126*** 4.950*** 3.119*** 4.049*** 4.050*** 4.044*** 4.016*** 3.821*** 4.040*** (11.360) (5.009) (6.531) (7.376) (7.111) (11.380) (11.349) (11.369) (11.290) (10.661) (11.321) INTERCEPT 3.803*** 2.318*** 1.055 3.646*** 6.474*** 2.101*** 2.435*** 2.469*** 2.437*** 2.464*** 2.668*** 2.580*** (8.596) (5.178) (1.056) (5.003) (5.254) (4.270) (5.437) (5.474) (5.427) (5.676) (5.384) (5.719) Year effects Yes Yes No No No No Yes Yes Yes Yes Yes Yes Industry effects Yes Yes Yes Yes Yes Yes Yes Yes Yes Yes Yes Yes N 12,915 12,915 1,439 1,729 2,458 7,289 12,915 12,915 12,915 12,915 11,476 12,915 Adj. R2 0.164 0.332 0.477 0.369 0.360 0.248 0.331 0.331 0.331 0.333 0.328 0.332 This table reports results from regressing the cost of equity premium (rAVG) on CSR scores and controls over the period 1992-2007. rAVG is the average implied cost of equity premium obtained from four models developed by Gebhardt, Lee, and Swaminathan (2001), Claus and Thomas (2001), Ohlson and Juettner-Nauroth (2005), and Easton (2004). Appendix A provides details on the implementation of the four models. Models 1 and 2 use the overall CSR score (CSR_S) for the total sample period. Models 3 through 6 replicate Model 2 after dividing the total sample period into four sub-periods. Models 7 through 12 report in turn the results from regressions of the cost of equity premium on the individual components of CSR_S, namely, community relations (CSR_COM_S), diversity (CSR_DIV_S), employee relations (CSR_EMP_S), environmental performance (CSR_ENV_S), human rights (CSR_HUM_S), and product characteristics (CSR_PRO_S). Appendix C outlines definitions and data sources for the regression variables.Unreported industry controls are based on the Fama and French (1997) industry classification. Robust t-statistics adjusted for clustering by firm are reported inside theparentheses and ***, **, and * denote statistical significance at the 1%, 5%, 10% levels, respectively.
39
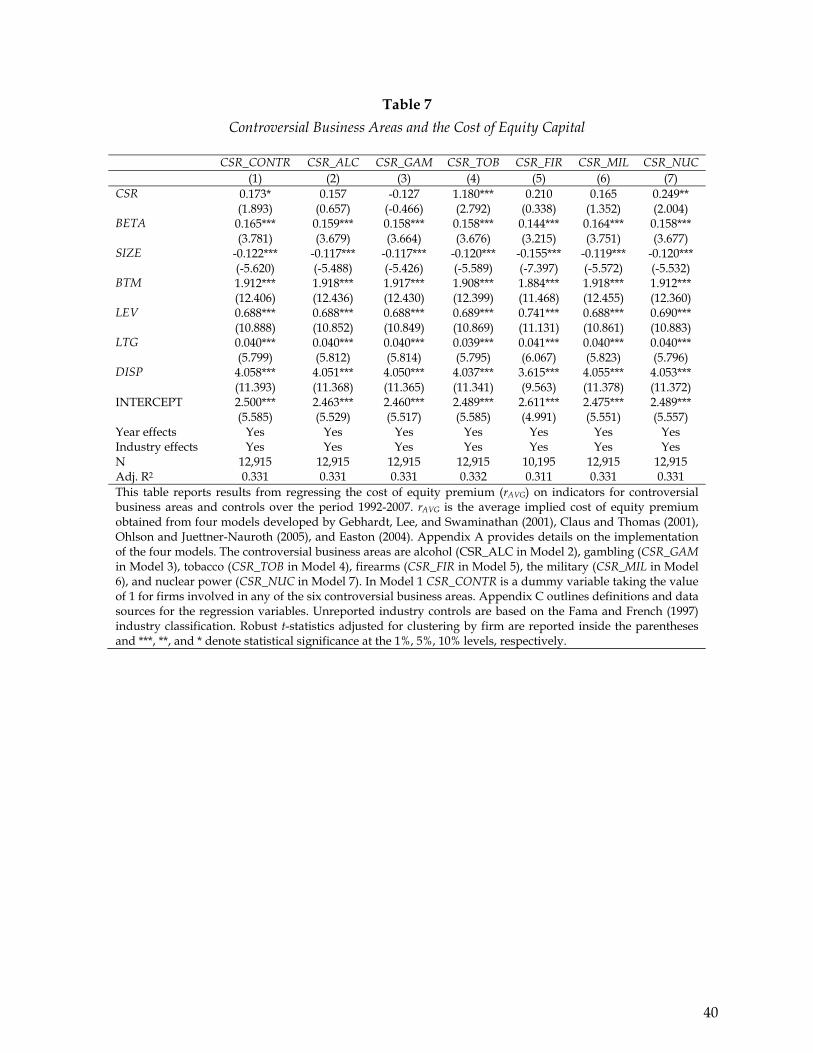
Table 7
Controversial Business Areas and the Cost of Equity Capital
CSR_CONTR CSR_ALC CSR_GAM CSR_TOB CSR_FIR CSR_MIL CSR_NUC (1) (2) (3) (4) (5) (6) (7) CSR 0.173* 0.157 -0.127 1.180*** 0.210 0.165 0.249** (1.893) (0.657) (-0.466) (2.792) (0.338) (1.352) (2.004) BETA 0.165*** 0.159*** 0.158*** 0.158*** 0.144*** 0.164*** 0.158*** (3.781) (3.679) (3.664) (3.676) (3.215) (3.751) (3.677) SIZE -0.122*** -0.117*** -0.117*** -0.120*** -0.155*** -0.119*** -0.120*** (-5.620) (-5.488) (-5.426) (-5.589) (-7.397) (-5.572) (-5.532) BTM 1.912*** 1.918*** 1.917*** 1.908*** 1.884*** 1.918*** 1.912*** (12.406) (12.436) (12.430) (12.399) (11.468) (12.455) (12.360) LEV 0.688*** 0.688*** 0.688*** 0.689*** 0.741*** 0.688*** 0.690*** (10.888) (10.852) (10.849) (10.869) (11.131) (10.861) (10.883) LTG 0.040*** 0.040*** 0.040*** 0.039*** 0.041*** 0.040*** 0.040*** (5.799) (5.812) (5.814) (5.795) (6.067) (5.823) (5.796) DISP 4.058*** 4.051*** 4.050*** 4.037*** 3.615*** 4.055*** 4.053*** (11.393) (11.368) (11.365) (11.341) (9.563) (11.378) (11.372) INTERCEPT 2.500*** 2.463*** 2.460*** 2.489*** 2.611*** 2.475*** 2.489*** (5.585) (5.529) (5.517) (5.585) (4.991) (5.551) (5.557) Year effects Yes Yes Yes Yes Yes Yes Yes Industry effects Yes Yes Yes Yes Yes Yes Yes N 12,915 12,915 12,915 12,915 10,195 12,915 12,915 Adj. R2 0.331 0.331 0.331 0.332 0.311 0.331 0.331 This table reports results from regressing the cost of equity premium (rAVG) on indicators for controversial business areas and controls over the period 1992-2007. rAVG is the average implied cost of equity premium obtained from four models developed by Gebhardt, Lee, and Swaminathan (2001), Claus and Thomas (2001), Ohlson and Juettner-Nauroth (2005), and Easton (2004). Appendix A provides details on the implementation of the four models. The controversial business areas are alcohol (CSR_ALC in Model 2), gambling (CSR_GAM in Model 3), tobacco (CSR_TOB in Model 4), firearms (CSR_FIR in Model 5), the military (CSR_MIL in Model 6), and nuclear power (CSR_NUC in Model 7). In Model 1 CSR_CONTR is a dummy variable taking the value of 1 for firms involved in any of the six controversial business areas. Appendix C outlines definitions and data sources for the regression variables. Unreported industry controls are based on the Fama and French (1997) industry classification. Robust t-statistics adjusted for clustering by firm are reported inside the parentheses and ***, **, and * denote statistical significance at the 1%, 5%, 10% levels, respectively.
40
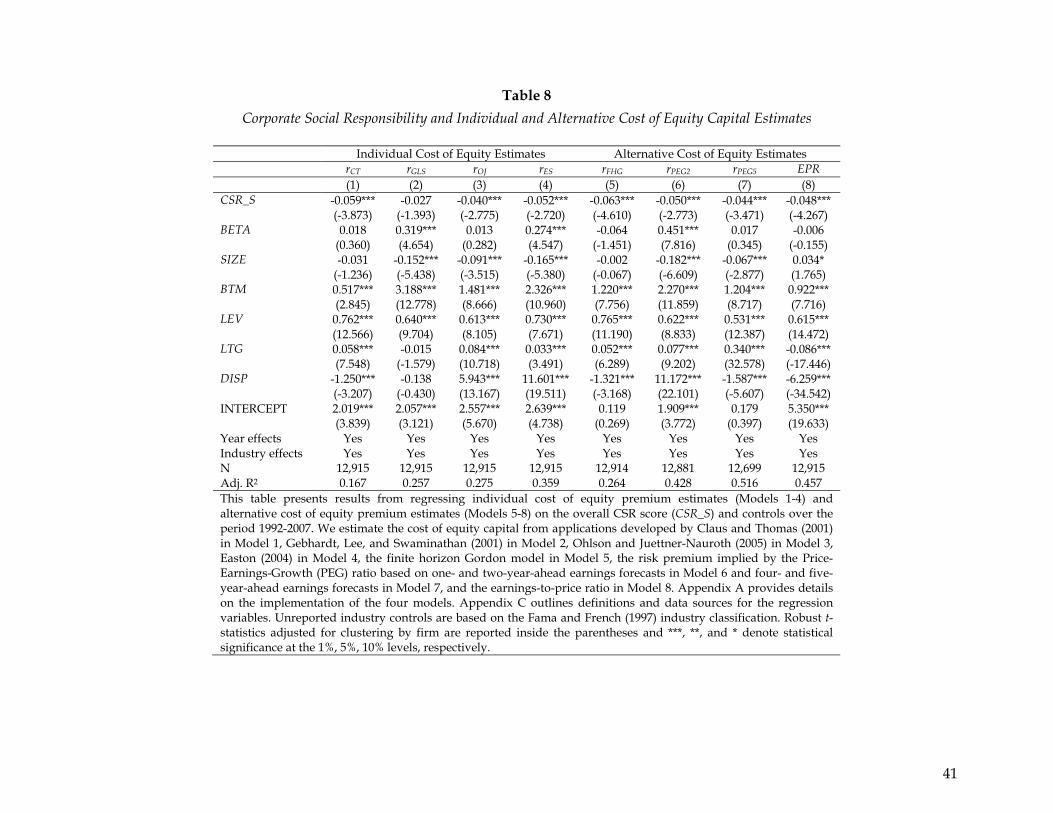
Table 8
Corporate Social Responsibility and Individual and Alternative Cost of Equity Capital Estimates
Individual Cost of Equity Estimates Alternative Cost of Equity Estimates rCT rGLS rOJ rES rFHG rPEG2 rPEG5 EPR (1) (2) (3) (4) (5) (6) (7) (8) CSR_S -0.059*** -0.027 -0.040*** -0.052*** -0.063*** -0.050*** -0.044*** -0.048*** (-3.873) (-1.393) (-2.775) (-2.720) (-4.610) (-2.773) (-3.471) (-4.267) BETA 0.018 0.319*** 0.013 0.274*** -0.064 0.451*** 0.017 -0.006 (0.360) (4.654) (0.282) (4.547) (-1.451) (7.816) (0.345) (-0.155) SIZE -0.031 -0.152*** -0.091*** -0.165*** -0.002 -0.182*** -0.067*** 0.034* (-1.236) (-5.438) (-3.515) (-5.380) (-0.067) (-6.609) (-2.877) (1.765) BTM 0.517*** 3.188*** 1.481*** 2.326*** 1.220*** 2.270*** 1.204*** 0.922*** (2.845) (12.778) (8.666) (10.960) (7.756) (11.859) (8.717) (7.716) LEV 0.762*** 0.640*** 0.613*** 0.730*** 0.765*** 0.622*** 0.531*** 0.615*** (12.566) (9.704) (8.105) (7.671) (11.190) (8.833) (12.387) (14.472) LTG 0.058*** -0.015 0.084*** 0.033*** 0.052*** 0.077*** 0.340*** -0.086*** (7.548) (-1.579) (10.718) (3.491) (6.289) (9.202) (32.578) (-17.446) DISP -1.250*** -0.138 5.943*** 11.601*** -1.321*** 11.172*** -1.587*** -6.259*** (-3.207) (-0.430) (13.167) (19.511) (-3.168) (22.101) (-5.607) (-34.542) INTERCEPT 2.019*** 2.057*** 2.557*** 2.639*** 0.119 1.909*** 0.179 5.350*** (3.839) (3.121) (5.670) (4.738) (0.269) (3.772) (0.397) (19.633) Year effects Yes Yes Yes Yes Yes Yes Yes Yes Industry effects Yes Yes Yes Yes Yes Yes Yes Yes N 12,915 12,915 12,915 12,915 12,914 12,881 12,699 12,915 Adj. R2 0.167 0.257 0.275 0.359 0.264 0.428 0.516 0.457 This table presents results from regressing individual cost of equity premium estimates (Models 1-4) and alternative cost of equity premium estimates (Models 5-8) on the overall CSR score (CSR_S) and controls over the period 1992-2007. We estimate the cost of equity capital from applications developed by Claus and Thomas (2001) in Model 1, Gebhardt, Lee, and Swaminathan (2001) in Model 2, Ohlson and Juettner-Nauroth (2005) in Model 3, Easton (2004) in Model 4, the finite horizon Gordon model in Model 5, the risk premium implied by the Price-Earnings-Growth (PEG) ratio based on one- and two-year-ahead earnings forecasts in Model 6 and four- and five-year-ahead earnings forecasts in Model 7, and the earnings-to-price ratio in Model 8. Appendix A provides details on the implementation of the four models. Appendix C outlines definitions and data sources for the regression variables. Unreported industry controls are based on the Fama and French (1997) industry classification. Robust t-statistics adjusted for clustering by firm are reported inside the parentheses and ***, **, and * denote statistical significance at the 1%, 5%, 10% levels, respectively.
41
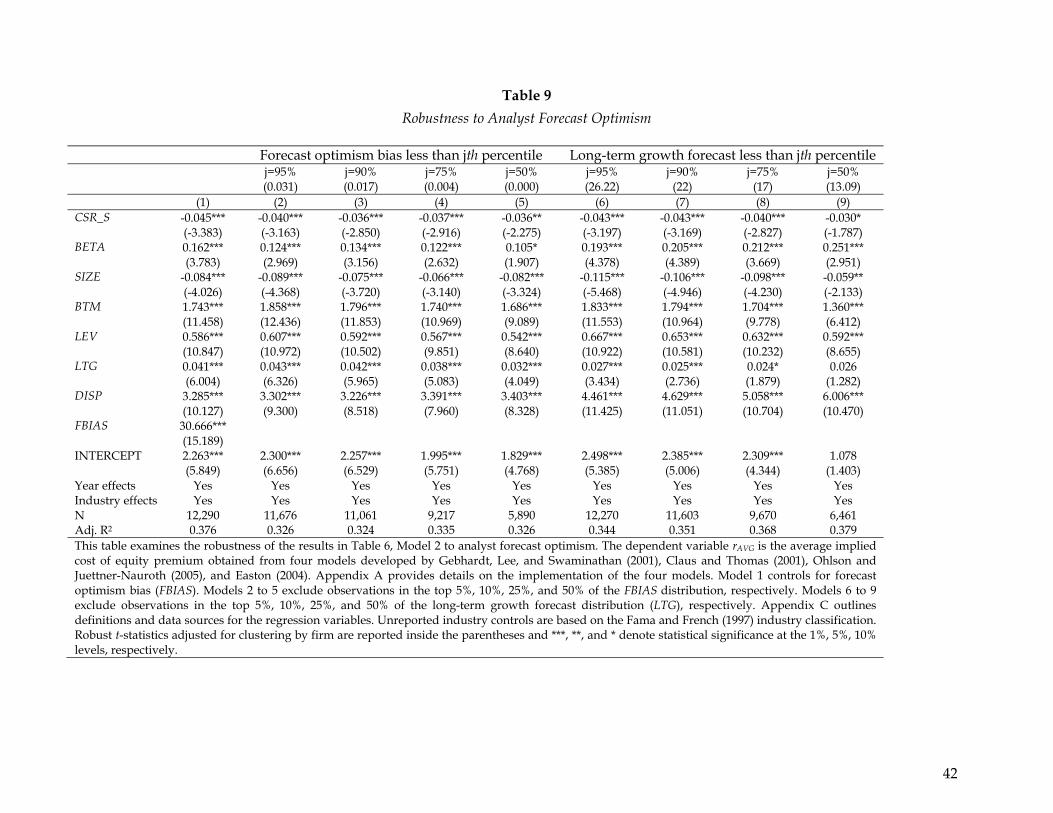
Table 9
Robustness to Analyst Forecast Optimism
Forecast optimism bias less than jth percentile Long-term growth forecast less than jth percentile j=95%
(0.031) j=90% (0.017)
j=75% (0.004)
j=50% (0.000)
j=95% (26.22)
j=90% (22)
j=75% (17)
j=50% (13.09)
(1) (2) (3) (4) (5) (6) (7) (8) (9) CSR_S -0.045*** -0.040*** -0.036*** -0.037*** -0.036** -0.043*** -0.043*** -0.040*** -0.030* (-3.383) (-3.163) (-2.850) (-2.916) (-2.275) (-3.197) (-3.169) (-2.827) (-1.787) BETA 0.162*** 0.124*** 0.134*** 0.122*** 0.105* 0.193*** 0.205*** 0.212*** 0.251*** (3.783) (2.969) (3.156) (2.632) (1.907) (4.378) (4.389) (3.669) (2.951) SIZE -0.084*** -0.089*** -0.075*** -0.066*** -0.082*** -0.115*** -0.106*** -0.098*** -0.059** (-4.026) (-4.368) (-3.720) (-3.140) (-3.324) (-5.468) (-4.946) (-4.230) (-2.133) BTM 1.743*** 1.858*** 1.796*** 1.740*** 1.686*** 1.833*** 1.794*** 1.704*** 1.360*** (11.458) (12.436) (11.853) (10.969) (9.089) (11.553) (10.964) (9.778) (6.412) LEV 0.586*** 0.607*** 0.592*** 0.567*** 0.542*** 0.667*** 0.653*** 0.632*** 0.592*** (10.847) (10.972) (10.502) (9.851) (8.640) (10.922) (10.581) (10.232) (8.655) LTG 0.041*** 0.043*** 0.042*** 0.038*** 0.032*** 0.027*** 0.025*** 0.024* 0.026 (6.004) (6.326) (5.965) (5.083) (4.049) (3.434) (2.736) (1.879) (1.282) DISP 3.285*** 3.302*** 3.226*** 3.391*** 3.403*** 4.461*** 4.629*** 5.058*** 6.006*** (10.127) (9.300) (8.518) (7.960) (8.328) (11.425) (11.051) (10.704) (10.470) FBIAS 30.666*** (15.189) INTERCEPT 2.263*** 2.300*** 2.257*** 1.995*** 1.829*** 2.498*** 2.385*** 2.309*** 1.078 (5.849) (6.656) (6.529) (5.751) (4.768) (5.385) (5.006) (4.344) (1.403) Year effects Yes Yes Yes Yes Yes Yes Yes Yes Yes Industry effects Yes Yes Yes Yes Yes Yes Yes Yes Yes N 12,290 11,676 11,061 9,217 5,890 12,270 11,603 9,670 6,461 Adj. R2 0.376 0.326 0.324 0.335 0.326 0.344 0.351 0.368 0.379 This table examines the robustness of the results in Table 6, Model 2 to analyst forecast optimism. The dependent variable rAVG is the average implied cost of equity premium obtained from four models developed by Gebhardt, Lee, and Swaminathan (2001), Claus and Thomas (2001), Ohlson and Juettner-Nauroth (2005), and Easton (2004). Appendix A provides details on the implementation of the four models. Model 1 controls for forecast optimism bias (FBIAS). Models 2 to 5 exclude observations in the top 5%, 10%, 25%, and 50% of the FBIAS distribution, respectively. Models 6 to 9 exclude observations in the top 5%, 10%, 25%, and 50% of the long-term growth forecast distribution (LTG), respectively. Appendix C outlines definitions and data sources for the regression variables. Unreported industry controls are based on the Fama and French (1997) industry classification. Robust t-statistics adjusted for clustering by firm are reported inside the parentheses and ***, **, and * denote statistical significance at the 1%, 5%, 10% levels, respectively.
42
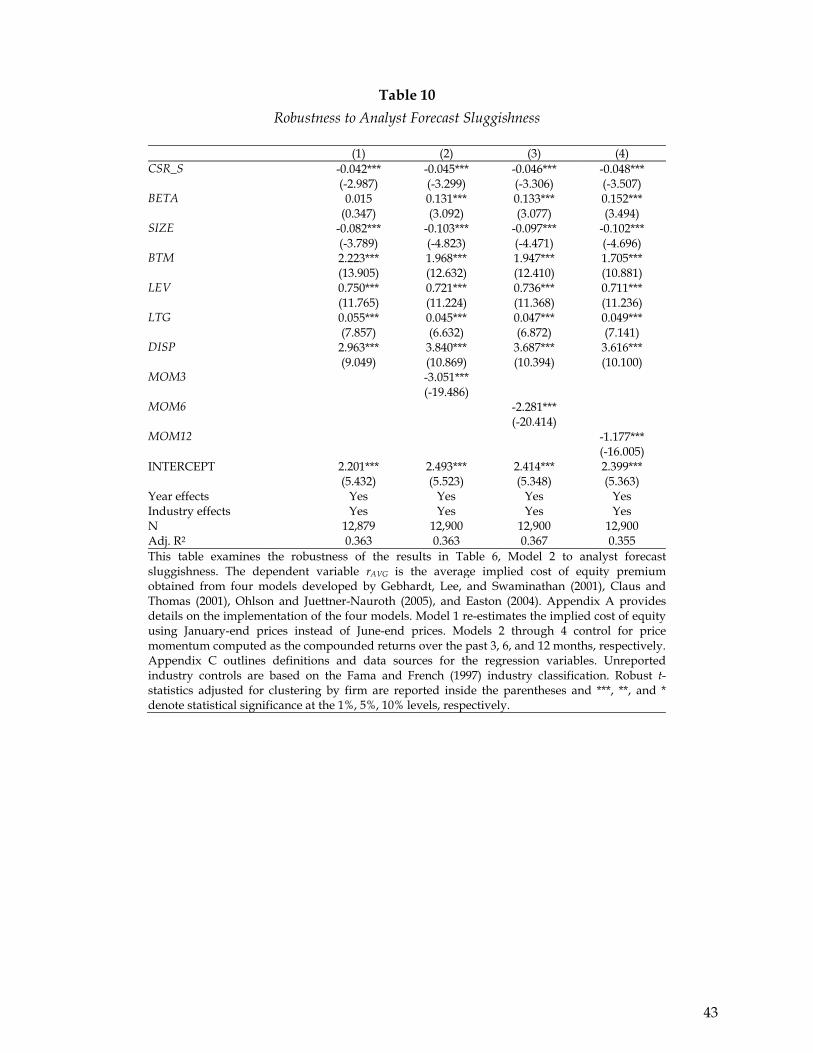
Table 10
Robustness to Analyst Forecast Sluggishness
(1) (2) (3) (4) CSR_S -0.042*** -0.045*** -0.046*** -0.048*** (-2.987) (-3.299) (-3.306) (-3.507) BETA 0.015 0.131*** 0.133*** 0.152*** (0.347) (3.092) (3.077) (3.494) SIZE -0.082*** -0.103*** -0.097*** -0.102*** (-3.789) (-4.823) (-4.471) (-4.696) BTM 2.223*** 1.968*** 1.947*** 1.705*** (13.905) (12.632) (12.410) (10.881) LEV 0.750*** 0.721*** 0.736*** 0.711*** (11.765) (11.224) (11.368) (11.236) LTG 0.055*** 0.045*** 0.047*** 0.049*** (7.857) (6.632) (6.872) (7.141) DISP 2.963*** 3.840*** 3.687*** 3.616*** (9.049) (10.869) (10.394) (10.100) MOM3 -3.051*** (-19.486) MOM6 -2.281*** (-20.414) MOM12 -1.177*** (-16.005) INTERCEPT 2.201*** 2.493*** 2.414*** 2.399*** (5.432) (5.523) (5.348) (5.363) Year effects Yes Yes Yes Yes Industry effects Yes Yes Yes Yes N 12,879 12,900 12,900 12,900 Adj. R2 0.363 0.363 0.367 0.355 This table examines the robustness of the results in Table 6, Model 2 to analyst forecast sluggishness. The dependent variable rAVG is the average implied cost of equity premium obtained from four models developed by Gebhardt, Lee, and Swaminathan (2001), Claus and Thomas (2001), Ohlson and Juettner-Nauroth (2005), and Easton (2004). Appendix A provides details on the implementation of the four models. Model 1 re-estimates the implied cost of equity using January-end prices instead of June-end prices. Models 2 through 4 control for price momentum computed as the compounded returns over the past 3, 6, and 12 months, respectively. Appendix C outlines definitions and data sources for the regression variables. Unreportedindustry controls are based on the Fama and French (1997) industry classification. Robust t-statistics adjusted for clustering by firm are reported inside the parentheses and ***, **, and * denote statistical significance at the 1%, 5%, 10% levels, respectively.
43
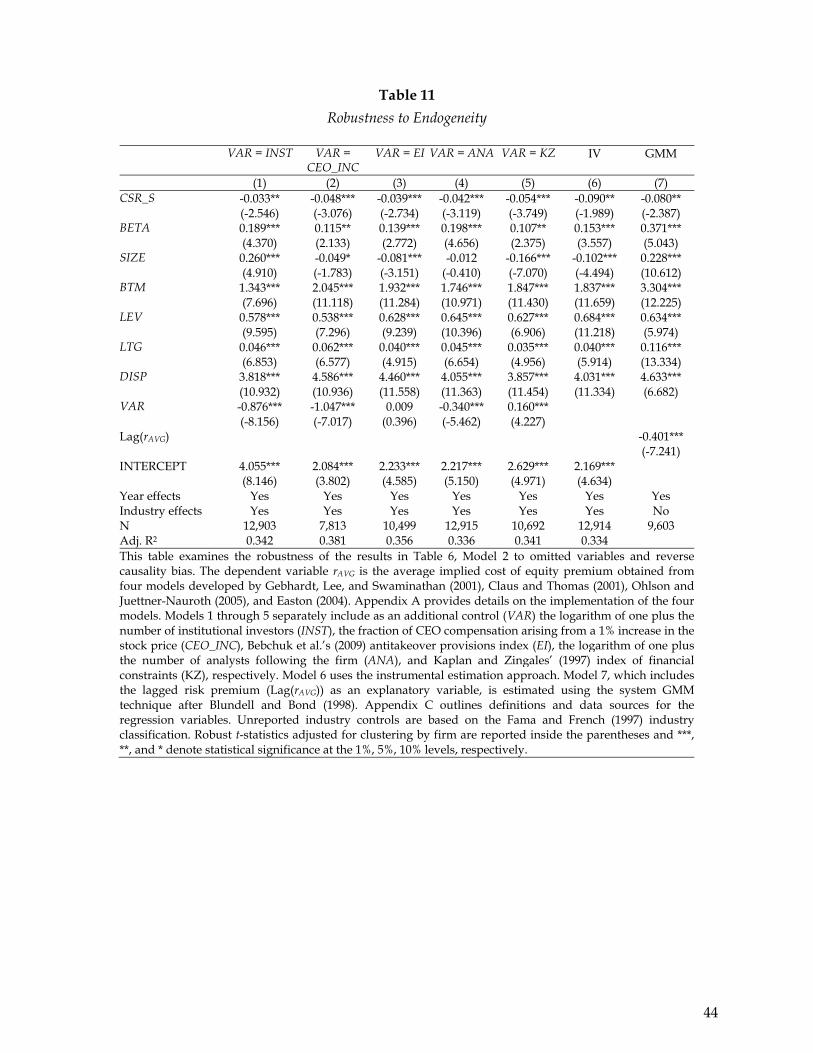
Table 11
Robustness to Endogeneity
VAR = INST VAR = CEO_INC
VAR = EI VAR = ANA VAR = KZ IV GMM
(1) (2) (3) (4) (5) (6) (7) CSR_S -0.033** -0.048*** -0.039*** -0.042*** -0.054*** -0.090** -0.080** (-2.546) (-3.076) (-2.734) (-3.119) (-3.749) (-1.989) (-2.387) BETA 0.189*** 0.115** 0.139*** 0.198*** 0.107** 0.153*** 0.371*** (4.370) (2.133) (2.772) (4.656) (2.375) (3.557) (5.043) SIZE 0.260*** -0.049* -0.081*** -0.012 -0.166*** -0.102*** 0.228*** (4.910) (-1.783) (-3.151) (-0.410) (-7.070) (-4.494) (10.612) BTM 1.343*** 2.045*** 1.932*** 1.746*** 1.847*** 1.837*** 3.304*** (7.696) (11.118) (11.284) (10.971) (11.430) (11.659) (12.225) LEV 0.578*** 0.538*** 0.628*** 0.645*** 0.627*** 0.684*** 0.634*** (9.595) (7.296) (9.239) (10.396) (6.906) (11.218) (5.974) LTG 0.046*** 0.062*** 0.040*** 0.045*** 0.035*** 0.040*** 0.116*** (6.853) (6.577) (4.915) (6.654) (4.956) (5.914) (13.334) DISP 3.818*** 4.586*** 4.460*** 4.055*** 3.857*** 4.031*** 4.633*** (10.932) (10.936) (11.558) (11.363) (11.454) (11.334) (6.682) VAR -0.876*** -1.047*** 0.009 -0.340*** 0.160*** (-8.156) (-7.017) (0.396) (-5.462) (4.227) Lag(rAVG) -0.401*** (-7.241) INTERCEPT 4.055*** 2.084*** 2.233*** 2.217*** 2.629*** 2.169*** (8.146) (3.802) (4.585) (5.150) (4.971) (4.634) Year effects Yes Yes Yes Yes Yes Yes Yes Industry effects Yes Yes Yes Yes Yes Yes No N 12,903 7,813 10,499 12,915 10,692 12,914 9,603 Adj. R2 0.342 0.381 0.356 0.336 0.341 0.334 This table examines the robustness of the results in Table 6, Model 2 to omitted variables and reverse causality bias. The dependent variable rAVG is the average implied cost of equity premium obtained from four models developed by Gebhardt, Lee, and Swaminathan (2001), Claus and Thomas (2001), Ohlson and Juettner-Nauroth (2005), and Easton (2004). Appendix A provides details on the implementation of the four models. Models 1 through 5 separately include as an additional control (VAR) the logarithm of one plus the number of institutional investors (INST), the fraction of CEO compensation arising from a 1% increase in the stock price (CEO_INC), Bebchuk et al.’s (2009) antitakeover provisions index (EI), the logarithm of one plus the number of analysts following the firm (ANA), and Kaplan and Zingales’ (1997) index of financial constraints (KZ), respectively. Model 6 uses the instrumental estimation approach. Model 7, which includes the lagged risk premium (Lag(rAVG)) as an explanatory variable, is estimated using the system GMM technique after Blundell and Bond (1998). Appendix C outlines definitions and data sources for the regression variables. Unreported industry controls are based on the Fama and French (1997) industry classification. Robust t-statistics adjusted for clustering by firm are reported inside the parentheses and ***, **, and * denote statistical significance at the 1%, 5%, 10% levels, respectively.
44