Embed Size (px)
Citation preview
Documents de Travail du Centre d’Economie de la Sorbonne
The Gender Inequalities Index (GII) as a New Way to
Measure Gender Inequalities in Developing Countries
Gaëlle FERRANT
2010.17
Maison des Sciences Économiques, 106-112 boulevard de L'Hôpital, 75647 Paris Cedex 13 http://ces.univ-paris1.fr/cesdp/CES-docs.htm
ISSN : 1955-611X
The Gender Inequalities Index (GII) as a New Way
to Measure Gender Inequalities in Developing
Countries ∗
Gaelle FERRANT†
February, 2010
∗I am grateful to all members of the Microeconomics research group for their useful discussions. Ithank the participants at the gender seminar, at the development seminar, at the macro workshop,as well as the participants at the doctoral meeting of development economics in CES for theircomments, especially Florent Bresson and Martine Audibert.†Centre d’Economie de la Sorbonne-Universite Paris I Pantheon Sorbonne, 106-112 Bd de
l’Hopital, 75647 Paris Cedex 13, France, (Email: [email protected])
1
Documents de Travail du Centre d'Economie de la Sorbonne - 2010.17
Abstract
The measurement of gender inequalities has become an important topicin the academic literature. First, appropriate indicators are needed to com-pare the relative situation of women in developing countries. Second, there isrenewed attention given to the relationship between gender inequality and eco-nomic growth. Measuring gender inequalities contributes to knowing whethergreater inequality promotes or hampers growth. This paper aims to develop anew methodology in order to build an aggregate index of gender inequalitiesin developing countries: the Gender Inequalities Index (GII). Using Multi-ple Correspondence Analysis (MCA), the GII aggregates different dimensionsof gender inequalities in order to determine endogenously the weight of eachvariable.
JEL classification: J16, O11, O57, C43
Keywords : Composite index, gender inequality, development economics.
Resume
La mesure des inegalites de genre est devenue un theme important de lalitterature academique. Et ce pour deux raison : tout d’abord, des indica-teurs sexospecifiques appropries sont necessaires pour comparer la situationrelative des femmes dans les pays en developpement (PED). En outre, dufait du regain d’attention concernant la relation entre inegalites de genre etperformances economiques, une telle mesure permet d’analyser l’impact desinegalites de genre sur la croissance. En effet, mesurer les inegalites entre lessexes contribue a savoir si plus d’egalites favorise ou entrave la croissance. Cetarticle vise a developper une nouvelle methodologie en vue de construire unindicateur composite pondere des inegalites de genre dans les PED : l’Indica-teur des Inegalites de Genre (IIG). L’analyse des correspondances multiples(ACM) est une methode qui permet de construire un indicateur compositepondere endogene, englobant les differentes manifestations des inegalites degenre dans les PED. Grace a la neutralite de l’ACM, IIG est construit sansmodele inferentiel en reduisant les biais statistiques lies a la multicolineariteet aux erreurs de mesure.
Mots cles : Indicateur composite, inegalite de genre, economie du developpement
2
Documents de Travail du Centre d'Economie de la Sorbonne - 2010.17
1 Introduction
“One is not born, but becomes a woman. No biological, psychological, or eco-
nomic fate determines the figure that the human female presents in society: it is
civilization as a whole that produces this creature, intermediate between, male and
eunuch, which is described as feminine. Only the mediation of someone else can
establish an individual as an other” De Beauvoir (1949).1
The Gender Inequalities Index (GII) is a new alternative to measure gender in-
equalities in developing countries. It is a new way of addressing the shortcomings
of gender-specific measures through a new aggregate strategy using Multiple Corre-
spondence Analysis (MCA). This composite index aims to measure all dimensions
of gender inequalities, avoiding the pitfalls of aggregation. Following Sen (1999),
who shows the active and central role of women in development, several attempts
to quantify gender inequality have been made. However, poor definition and con-
struction lead to misinterpretations and misuses of indicators (Schuler (2006)). Yet,
development economists need a good proxy for gender inequalities to compare the
relative situation of women in developing countries and to study whether more gen-
der inequalities promote or hamper growth.
At the World Economic Forum in Geneva (2007), all participants recognized that
the advancement of women is an important economic, business and societal issue
with a significant impact on the growth of nations (Hausmann, Tyson, and Zahidi
(2007)). Currently, 185 countries - over 90% of the members of the United Nations
- have ratified the Convention on the Elimination of All Forms of Discrimination
against Women (CEDAW), adopted in 1979 by the UN General Assembly. The
Convention defines discrimination against women as “...any distinction, exclusion or
restriction made on the basis of sex which has the effect or purpose of impairing
or nullifying the recognition, enjoyment or exercise by women, irrespective of their
marital status, on a basis of equality of men and women, of human rights and
fundamental freedoms in the political, economic, social, cultural, civil or any other
field.”2 It may be pointed out that as Ferber and Nelson (1993) say, “gender is the
social meaning that is given to biological differences between the sexes; it refers to
1Translation from Simons (1995)2Source: UN Division for the Advancement of Women
3
Documents de Travail du Centre d'Economie de la Sorbonne - 2010.17
social constructs rather than to biological givens”.
Econometric models which analyze the relationship between one dimension of
gender inequalities and growth are plentiful. Using cross-country and panel regres-
sion, Klasen (2002) investigates how gender inequality in education affects long-term
economic growth. A large literature documents the links between gender inequal-
ity and the next generation’s well-being (Murthi, Guio, and Dreze (1995), Thomas
(1989), Thomas and Strauss (1997)). It shows that gender inequality in education
and access to resources may prevent reductions in fertility, child mortality and ex-
pansions in education of the next generation. Hill and King (1995) find a positive
and significant relationship between women’s school attainment and child mortality.
But statistics about gender inequalities are not enough to consider the relationship
with growth. If econometric regressions can explain the lack of growth by gender
inequality in education, in family law or in political representation, they cannot take
into account all the dimensions of gender discrimination (Dollar and Gatti (1999)).
In order to reach more definite conclusions on the relationship between gender in-
equalities and economic performance, a composite index is needed that combines
several dimensions of inequalities (Anand and Sen (1995), Dijkstra (2002)). A com-
posite index is used whenever a plurality of variables is needed for the evaluation of
a macroeconomic dimension (Munda and Nardo (2005a)).
The UNDP’s work has pioneered the construction of a gender inequalities index.
It has been an important step in quantifying gender inequalities, as well as in rais-
ing attention among academics concerning the issue of measuring gender inequal-
ity (Bardhan and Klasen (1999)). The 1995 UNDP Human Development Report
presents the Gender Development Index (GDI) developed by Anand and Sen (1995)
and the Gender Empowerment Measure (GEM). The GDI is expected to measure
well being, in analogy with the Human Development Index (HDI). The GEM is sup-
posed to be a measure of the relative economic and political power of women. But
a large literature (Dijkstra and Hanmer (2000), Dijkstra (2002, 2006), Bardhan and
Klasen (1999), Jutting and Morrisson (2005), Schuler (2006), etc.) criticizes UNPD
gender measures for their methodological and theoretical weaknesses. This critical
literature does not consider either the GDI or the GEM as measures of gender equal-
ity as such, because they compute some combination of absolute levels of achievement
4
Documents de Travail du Centre d'Economie de la Sorbonne - 2010.17
and a penality for inequality (see, for example, Dijkstra and Hanmer (2000), Bard-
han and Klasen (1999)). This implies that they cannot be used for assessing the
relationship between gender equality and economic performance. Other criticisms
are directed at the choice of variables and the aggregation rule. These shortcomings
open a door to building an alternative gender inequalities index. Several alterna-
tives have been constructed to address the shortcomings of UNDP gender indicators
(see for example Forsythe, Korzeniewicz, and Durrant (2000), Dijkstra and Hanmer
(2000)). But these new alternatives have led to further criticisms. That is why
Dijkstra (2002) built a new measure, the Standardized Index of Gender Equality
(SIGE). The index developed here, the GII, draws on the good aspects of the SIGE,
while at the same time attempting to avoid the methodological limitations of the
GDI, the GEM and the SIGE, in order to advance research.
The aim of this paper is to develop a new alternative way to measure gen-
der inequalities in developing countries: the Gender Inequalities Index (GII). Using
Multiple Correspondence Analysis (MCA), the GII aggregates different dimensions
of gender inequalities with endogenous weighting. This aggregation strategy using
MCA minimizes statistical biases, and is a new way to address the shortcomings of
existing relative gender measures.
The paper will proceed as follows: Section 2 briefly presents the main critiques of
gender inequalities indexes (GDI, GEM and SIGE); Section 3 presents the method-
ology; Section 4 presents the Gender Inequalities Index (GII); Section 5 justifies why
the GII is an essential tool; and finally, Section 6 concludes.
2 Incomplete Gender Inequality Indices
In 1995, at the Fourth World Conference on Women, the UNDP established two
gender sensitive measures: the Gender Development Index (GDI) and the Gender
Empowerment Measure (GEM). Widely criticized, these indicators have given rise
to many measures of gender inequality and in particular to the SIGE (Standardized
Index of Gender Equality) built by Dijkstra (2006). The SIGE attempts to address
methodological shortcomings of the UNDP’s indicators and to provide a broader
vision of the phenomenon. Nevertheless, despite the advances of the SIGE, it appears
5
Documents de Travail du Centre d'Economie de la Sorbonne - 2010.17
to have certain shortcomings.
2.1 The UNPD’s Gender sensitive indicators: construction
and shortcomings
The construction of the GDI and the GEM has helped to highlight gender in-
equalities in international policy debates. While the GDI assesses gender differences
in terms of human development, the GEM measures gender inequalities in terms of
economic and political opportunities. This sub-section reviews briefly the construc-
tion of the GDI and the GEM as a first step, before presenting their shortcomings.3.
The Gender Development Index (GDI): The GDI was developed by Anand
and Sen (1995) in analogy to the HDI (Human Development Index), taking into
account inequalities between men and women. It measures the level of human de-
velopment achieved using the same approach as the HDI. It includes the adjusted
income (earned income), an education variable (2/3 literacy and 1/3 primary, sec-
ondary, and tertiary school enrollments), and a health variable (life expectancy). It
penalizes the average obtained by the degree of inequality between men and women.
The differences between sexes are more important, the lower the GDI (i.e the close
to zero). Thus, the GDI of a country decreases when the levels of development of
women and men drop together, on the one hand, but also when the development gap
between the sexes widens, on the other hand. The greater the differences between
men and women in terms of basic capabilities, the smaller the GDI in a country is,
compared to its HDI. The GDI is thus simply the HDI weighted by gender inequal-
ities.
The GDI is built using a three-step process. First, the female and male index
for each variable is calculated by subtracting actual values from the minimum value,
and then dividing the difference by the total range of the value (Idi). Second, the
equally distributed equivalent achievement index (EDEA) is defined as:
EDEA = [(pf .Id1−εf ) + (pm.Id
1−εm )]1/1−ε
where: pm, pf are respectively male and female population shares; ε, the aversion to
inequality factor, assumed to be two by the UNDP, indicating a social preference for
3For more precision about the construction of the GDI and the GEM see UNDP (1995), Bardhanand Klasen (1999).
6
Documents de Travail du Centre d'Economie de la Sorbonne - 2010.17
equality. If ε is equal to zero, then the simple arithmetic mean of female and male
achievements is calculated.
Third, the GDI is computed as:
GDI = 13(EDEAle + EDEAed + EDEAei)
The Gender Empowerment Measure (GEM): The GEM measures gender
inequalities in relation to three components of empowerment: political participation
and decision-making (female share of parliamentary seats); economic participation
and decision-making (female share in technical and professional, and administrative
and management positions), and power over economic resources (earned income).
Gender gaps are then penalized by the same ‘aversion to inequality factor’ (ε) as used
in the GDI, implying that 50/50 shares should be the goal in all three components
(Bardhan and Klasen (1999)).
The GEM is built in two stages. First, the Equally Distributed Equivalent Per-
centage (EDEP) is defined as:
EDEP = [pf .I1−εf + pm.I
1−εm ]1/1−ε
Second, the GEM is computed as:
GEM = 13(EDEPp + EDEPe + EDEPr)
Criticisms of the UNDP gender-sensitive indexes: A first line of criticism
against the GDI and GEM concerns the choice of dimensions of gender equality.
A second problem relates to the choice of variables to measure gender inequalities.
Lastly, the construction of composite indicators is challenged.
1. Some relevant dimensions of gender inequalities are lacking. The first criti-
cism made of the UNDP gender indicators is that the GDI and GEM - limited to
economic and political dimensions - do not reflect certain sociological manifestations
of gender inequality, such as participation in community or family decisions, in phys-
ical integrity, etc. (Dijkstra and Hanmer (2000), Dijkstra (2002)). Moreover Jutting
and Morrisson (2005) denounce the omission of inequalities in social institutions,
which are crucial in developing countries. Dollar and Gatti (1999) conclude that
some countries can be relatively egalitarian in one dimension but relatively unequal
in other dimensions, which is why a broad range of indicators is needed in order
7
Documents de Travail du Centre d'Economie de la Sorbonne - 2010.17
to consider gender inequalities in all their forms. As a result, the UNDP gender
indicators are not able to assess the needs of women in developing countries and
to define priorities in the fight against gender inequalities. The dimensions omitted
are major determinants of the relative status of women and their well-being (World-
Bank (2001)). Not to take into account all aspects of gender inequalities is a limit in
itself: how it is possible to describe the relationship between gender inequalities and
development, if the indicator only considers the tip of the iceberg? Furthermore, the
consideration of some dimensions is restrictive. The GEM focuses on national polit-
ical representation and the formal economy, whereas local politics and the informal
economy are the scene of feminine activity (Bardhan and Klasen (1999)). Also, this
indicator does not take into account inequalities in access to credit, information, etc.
for the empowerment of women (Batliwala (1994), Jutting, Morrison, and Drechsler
(2006)). Moreover, the GEM includes income without any explanations. That is
why, according to Dijkstra (2006), “the GEM is an odd combination of relative fe-
male and male empowerment -but softened by taking a harmonic mean of the female
and male scores- and absolute levels of income per capita”.
2. These indicators do not measure gender inequality as such. “One of the
weaknesses of both the GDI and GEM is that they do not measure gender equality
as such, but instead some combination of absolute levels of achievement and a penalty
for inequality (see, for example, Dijkstra and Hanmer (2000), Bardhan and Klasen
(1999)). This implies that they cannot be used for assessing the relationship between
gender equality and economic performance” (Dijkstra (2002)). The main criticism
regarding the GDI and GEM is that they are not a measure of gender inequality as
such, because they include absolute levels of women’s well-being. Inequality exists
if the situation of one person can be compared to the situation of a group (Johnson
(1985)). All the critical authors (Dijkstra and Hanmer (2000), Bardhan and Klasen
(1999), Schuler (2006), etc.) view the GDI as a measure of human development
weighted inequalities. Similarly, the GEM takes into account the wage level of each
sex and not the share of each gender in the total wage (Schuler (2006)). The aim
should be to focus on whether the gap between women and men in the chosen
variables has declined, rather than whether women are ‘winning the battle of the
sexes’ (Hausmann, Tyson, and Zahidi (2007)). Therefore, it seems essential to build a
8
Documents de Travail du Centre d'Economie de la Sorbonne - 2010.17
gender inequality measure including only variables which describe the relative status
of women. Gender exists only in the comparison between men and women. Indeed,
sex usually includes three aspects: the biological sex as it is assigned at birth; the role
or sexual behavior that are supposed to correspond to it, and that the socialization
and education of differentiated individuals produce and reproduce, namely gender;
and finally sexuality (Dorlin (2008)). Then, measuring gender inequality implies
integrating only variables of comparison between men and women.
3. The income component is overweighted. The GDI and GEM are simple arith-
metic averages of their component scores. According to the UNDP, there are no
reasons to build weighted indicators (UNDP (1995)). Nevertheless, it can be argued
that unweighted composite indicators give the strongest weight to the component
with the largest variance (Munda and Nardo (2005a)). Then, if the variances of
the components differ widely, weights are needed (Tepperman, Harvey, and Blakely
(1990), Perrons (2005), Sugarman and Straus (1988)). According to Bardhan and
Klasen (1999), the unweighted GDI overvalues the weight given to the income com-
ponent: “GDI is dominated by a conceptually and empirically problematic estimate
of gender gaps in earned income, while downplaying the role of the gaps in education
and largely ignoring those in mortality, arguably the two most important problems
confronting women in many developing countries”. Also, the GDI is highly correlated
to GDP per capita. The GDI minimizes the inequalities in low-income countries and
overestimates them in countries with higher income, which disadvantages the Mid-
dle East and North Africa (MENA). High-income countries have a higher GDI than
low-income countries with the same level of gender inequalities (Dijkstra (2002)).
Gender inequality measures are designed to measure gender inequalities in individ-
ual countries rather than the levels of the available resources and opportunities in
those countries. That is why they have to be independent of the level of development
(Hausmann, Tyson, and Zahidi (2007)).
The UNDP gender indicators are a step forward in the quantification of gender
inequalities and illustrate the international debate, as well as in raising academic
attention of the issue of measuring gender inequality. However, the respective short-
comings limit their usefulness and result in very misleading international compar-
isons. Dijkstra (2006) proposes remedies for some of these shortcomings with her
9
Documents de Travail du Centre d'Economie de la Sorbonne - 2010.17
index.
2.2 The Dijkstra’s Standardized Index of Gender Equality
(SIGE)
To overcome the GDI and GEM’s shortcomings, Dijkstra (2002) built an alterna-
tive measure: the Standardized Index of Gender Equality (SIGE). This index tries
to meet three requirements: i) the index should take into account all relevant di-
mensions of gender equality; ii) it should be a relative measure; iii) it should have
appropriate weights (Dijkstra (2002)).
The Human Development Report (UNDP (1995)) provides some concrete illus-
trations of the inequality of women and men in many countries:
• the right to nationality: in much of West Asia and North Africa, women mar-
ried to foreigners cannot transfer citizenship to their husbands, though men
can;
• the right to manage property: married women are under the permanent guardian-
ship of their spouses and have no right to manage property in Botswana, Chile,
Lesotho, Namibia, and Swaziland;
• the right to income-earning opportunities: husbands can restrict their wives’
employment outside the home in Bolivia, Guatemala, and Syria;
• the right to travel: in some Arab countries, a husband’s consent is necessary
for a wife to obtain a passport, but not vice-versa. Women cannot leave the
country without their husband’s permission in Iran, etc.
All these issues require consideration. In this way, Dijkstra (2002) defines the
forms of gender inequality which should be included in gender sensitive indexes. She
uses eight dimensions identified by the Workshop in The Hague (Wieringa (1997)).
The expertise conferred to this Workshop is justified by the fact that “the explicit
aim of the Workshop was to define important aspects of gender inequality that may
hold in different cultures” (Dijkstra (2002)). To do this, researchers from many
different cultures and from different disciplines participated in the identification of
10
Documents de Travail du Centre d'Economie de la Sorbonne - 2010.17
the main dimensions of gender inequality that should be included in a new measure
and a comparison of countries.
The eight dimensions identified are as follows:
1. Gender identity, which describes gender roles defined by socialization and ed-
ucation;
2. Autonomy of the body;
3. Autonomy within the household;
4. Political power;
5. Social resources, which refer to the access to health and education;
6. Material resources, which refer to access to land, housing, and credit;
7. Employment and income;
8. Time, which includes the relative access to leisure and sleep.
To quantify all of these dimensions, the SIGE includes 5 ratios of female attain-
ment relative to males:
• Access to education (with the following weights: 2/3 for the literacy ratio and
1/3 for combined primary and secondary school enrollment);
• Access to health (life expectancy ratio);
• Labor market participation (ratio of female/male economic activity rates);
• Economic representation (female share in technical and professional, and ad-
ministrative and management positions);
• Political representation (female share in parliament).
The SIGE is a standardized and unweighted index. Standardization (subtract-
ing the mean then dividing by the standard deviation) avoids the limitations of
unintended weighting. This methodology assumes that the variables follow a nor-
mal distribution. Otherwise, the variables are normalized. However, Dijkstra (2002)
11
Documents de Travail du Centre d'Economie de la Sorbonne - 2010.17
does not provide information about the distribution or the normalization of the data
(Berenger and Verdier-Chouchane (2007)). This creates a lack of transparency and
makes the measure much more opaque (Klasen and Schuler (2009)). Furthermore,
if standardization is a response to weighting problems, it is not a methodology to
determine weights endogenously. All dimensions of gender inequalities do not dis-
criminate against women in the same way. All dimensions do not have the same
importance. According to Dijkstra (2002), the “relative access to education is per-
haps the most important and universal indicator for gender equality”. Nevertheless,
Dijkstra gives an equal weight to the five dimensions taken into account in the SIGE.
Statistical analysis is needed to identify appropriate weights endogenously. Statis-
tical information indicates which dimensions are the more constraining in gender
discrimination worldwide. Furthermore, if the objective of a composite indicator is
to describe a global trend, statistical bias and redundancy have to be corrected by
an appropriate methodology (Bazillier (2004)).
The main criticism concerns the aggregate method. The SIGE is a linear index.
Linear indicators admit total compensation among the various forms of discrimi-
nation. But, inequalities related to gender correspond to deprivation experienced
by the women affected. According to Branisa, Klasen, and Ziegler (2009), when
inequality rises deprivation expands proportionally more. Indeed, Dollar and Gatti
(1999) point out that some societies can be relatively egalitarian in one dimension
but relatively unequal in other dimensions; then women experience great depriva-
tion. That is why partial compensation - which implies that high inequality in one
dimension can only be partially offset by low inequality in another dimension - pro-
vided by a non-linear indicator is preferred. This aggregate methodology takes into
account complementarity and substitutability, so that inequalities are penalized in
every dimension (Munda and Nardo (2005b)).
The SIGE allows gender inequalities to be understood more clearly. However,
the GII (Gender Inequality Index) seeks to deal with the GDI, GEM and SIGE’s
shortcomings.
12
Documents de Travail du Centre d'Economie de la Sorbonne - 2010.17
3 A New Way to Measure Gender Inequality in
Developing Countries
“Thus, whereas a gender statistic provides factual information about the status of
women, a gender-sensitive indicator provides direct evidence of the status of women,
relative to some agreed normative standard or explicit reference group” (Johnson
(1985)).
3.1 Multiple Correspondence Analysis (MCA) to determine
weightings endogenously
Correspondence analysis is a descriptive and exploratory technique designed to
analyze multi-dimensional tables containing some measure of correspondence be-
tween the rows and columns. These methods were originally developed primarily
in France by Jean-Paul Benzecri in the early 1960s and 1970s (see Benzecri (1992),
Lebart, Morineau, and Piron (2004)). MCA may be considered to be an extension
of simple correspondence analysis to more than two variables. MCA is a correspon-
dence analysis carried out on an indicator matrix with cases as rows and categories
of variables as columns. Actually, the inner product of such a matrix, called the Burt
Table is usually analyzed: MCA is the correspondences analysis of the Burt table.
The results provide information which is similar in nature to that produced by factor
analysis techniques, and they allow the structure of categorical variables included
in the table to be explored. If Principal Component Analysis (PCA) is adapted for
quantitative and continuous variables, MCA is used to analyze qualitative, discrete
and ordinal variables. Contrary to PCA, MCA studies the set of relative frequen-
cies of each modality and not their absolute weight. The main advantage of MCA
in comparison to PCA is the non-linear analysis between variables (Bazillier and
Gouret (2004)).
MCA analyses discrete variables by projecting on different axes the common
information contained in these different variables, in order to reduce the number of
dimensions, thus minimizing the loss of information, symbolized by the total inertia,
represented by the overall dispersion of the new scatter (Greenacre (1984), Escofier
and Pages (1998)). The distances between different profiles are calculated using a
13
Documents de Travail du Centre d'Economie de la Sorbonne - 2010.17
Khi-2, in contrast to other tools of data analysis:
d2(i1, i2) =∑nj=1(fi1j
fi1− fi2j
fi2)2
After encoding continuous variables,4 MCA is applied in order to avoid the het-
erogeneity and symmetry problems likely in PCA (Bazillier and Gouret (2004)).
MCA defines endogenously the weight of each dimension in the scalar index (Benze-
cri (1992)). This scalar index is the first axis which has the highest inertia and will
define our composite index GII (Benzecri (1992), Greenacre (1984)). This method of
aggregation improves the index qualitatively, because MCA minimizes the statistical
bias or imperfection of the data. Given its statistical advantages, MCA is preferred.
From a normative point of view, the use of MCA is justified because it does
not predefine any economic model, and lets the data speak for itself. Thus, the
pre-existence of an egalitarian norm is not assumed a priori. Instead the analyti-
cal framework is developed to capture gender inequalities. This framework does not
define a single model of gender inequalities which is optimal, whatever the level of de-
velopment or the cultural and religious heritage. The method is neutral in the sense
that it requires no prior modeling of the relationship between gender inequalities
and economic growth, and does not presuppose any standard in terms of efficiency.
However, some configurations either block or foster economic convergence. Given
this indisputable advantage, MCA was adopted in this research.
3.2 Database
According to Goertz (2001), in evaluating composite indicators three concerns
dominate: external validity, reliability and ‘concept-indicator validity’. The latter
describes the link between the theoretical structure of the concept and“the structure
of its operationalization in the form of an indicator”. This requirement takes care
of the degree of theoretical coherence between the concept and how that becomes
a concrete indicator. Indeed, all dimensions have to be measured by appropriate
components. The choice of variables is crucial for the ‘concept-indicator validity’.
The quality of the database and its definition is crucial to this study: to go beyond
the shortcomings of gender specific measures, the GII has to be based on a database
4For more details see appendix B
14
Documents de Travail du Centre d'Economie de la Sorbonne - 2010.17
which describes all dimensions of gender discrimination and includes appropriate
variables.
This database introduces some dimensions omitted by well-known gender specific
measures. As Dijkstra (2002), the GII considers the eight dimensions of gender
inequalities identified by the Workshop in The Hague (Wieringa (1997)). Several
variables are used to quantify them. The more variables included in one dimension,
the more informative it is. Indeed this method minimizes errors of measurement
and quality of data. After identifying the dimensions retained and their proxy,
subindexes are constructed.5
Following Branisa, Klasen, and Ziegler (2009), subindexes are constructed to pro-
duce a summary measure for each dimension of gender inequalities. Every subindex
is a sum of n variables that are associated statistically.6 To validate this statistical
association, the same method as Branisa, Klasen, and Ziegler (2009) is used here: the
‘Kendall Tau b rank correlation’. This is a non-parametric statistic used to measure
the degree of correspondence between two variables and assessing the significance of
its correspondence. Only variables which have a significant positive value of Kendall
tau b are retained.7
The data retained are the following:
1. Gender identity describes cultural issues such as the socialization of girls and
boys, the rigidity of the sexual division of roles (Dijkstra (2002)). This di-
mension describes social behavior conveyed by society and internalized by in-
dividuals in the process of socialization. This behavior is defined by social
norms which are a vector of the gender role, by defining gender identity and
constraints. Deviation from social norms is a source of psychological and social
sanctions (Bierstedt (1963)). According to Broom and Selznick (1963), every
society has rules or norms based on cultural values specifying what appropriate
behavior is or not. They set limits within which individuals have to find ways
to achieve their objectives. In this sense they constitute an economic variable
5In this section, I describe only variables retained to construct subindexes. For more detailsabout data definition and sources see Appendix A.
6This aggregate strategy is justified by the close variance of each variable. Moreover, theendogenous weights defined by MCA are not significantly different.
7The Kendall Tau b tests the strength of association when both variables are measured at theordinal level. It makes adjustment for ties and are most suitable for Square tables (Agresti (1984)).
15
Documents de Travail du Centre d'Economie de la Sorbonne - 2010.17
because they define the role of each individual according to his/her gender and
the sexual division of labor (Elster (1989)). Social norms and gender identity
define economic and social activities of men and women (Bierstedt (1963)). In
developing countries, where community laws dominate individual laws, men
and women behave according to these constraints (Coleman (1990)). In most
of the countries, patriarchal and traditional customs are unfavorable to women
(Bierstedt (1963)).
It is very difficult to measure these dimensions, as they are qualitative concepts.
However, if we consider these social norms as social institutions, the new OECD
database can be used. Indeed, institutions are a set of formal and informal rules
established by human beings to constrain their behavior (North (1991)). Thus,
social norms define standard behavior and can be considered as institutions.
The GID database (Gender Institution Development) includes variables about
gender inequality in social institutions like family codes, physical integrity,
access to economic resources, etc. Thus, the ‘gender identity dimension’ is
measured here with four variables: the female-male ratio of early marriage,
the CIRI indicator of women’s social rights,8 gender inequality in terms of
freedom of dress and freedom of movement.9
2. Physical integrity refers to the absence of violence against women, the control
of their sexuality and access to contraception (Dijkstra 2002). This dimension
describes the autonomy of women over their bodies. It is a form of gender dis-
crimination to the extent that the biological and physical differences between
the sexes are reflected in the balance of power within social relationships. Men
8“A score of 0 indicates that there were no social rights for women in comparison to men inlaw and that systematic discrimination based on sex may have been built into law. A score of1 indicates that women had some social rights under law, but these rights were not effectivelyenforced. A score of 2 indicates that women had some social rights under law, and the governmenteffectively enforced these rights in practice while still allowing a low level of discrimination againstwomen in social matters. Finally, a score of 3 indicates that all or nearly all of women’s social rightswere guaranteed by law and the government fully and vigorously enforced these laws in practice”,taken from CIRI coding variables.
9“Freedom of movement measures the freedom of women to move outside the home. The fol-lowing elements were considered: freedom to travel; freedom to join a club or association; freedomto do the groceries (and other types of shopping) without a male guardian; freedom to see one’sfamily and friends. A score of 0 means no restrictions on women’s movement outside the home incomparison to men; 0.5 indicates that some women can leave home sometimes, but with restrictionsand 1 means that women can never leave home without restrictions” Source: Coding GID Jutting,Morrison, and Drechsler (2006)
16
Documents de Travail du Centre d'Economie de la Sorbonne - 2010.17
can affect the physical integrity of women without suffering legal penalties.
Indeed, sometimes there are no laws to protect physical integrity. This dimen-
sion is described by five variables: the prevalence and acceptance of violence
against women; the prevalence of genital mutilation; the indicator of physical
security of women; the prevalence of contraception; and adolescent fertility. In
this dimension, it is assumed that men do not have any problems concerning
their physical integrity. So, it is assumed they do not suffer from domestic vi-
olence and physical insecurity like rapt or honor killings and that men always
have choice in sexual relationships. Moreover, it is assumed that female genital
mutilation is not equivalent to the male circumcision. Unlike male circumci-
sion, which is not an attempt to inhibit the ability, desire or sexual pleasure,
one of the reasons most often put forward to justify female circumcision is the
control of sexuality (Tauzin (1988)). That is why it is assumed that genital
mutilation is not the counterpart of male circumcision and is indeed a form of
gender discrimination.
3. Autonomy within the household describes the inequalities within the house-
hold in terms of the right to divorce, inheritance rights and decision-making
(Dijkstra (2002)). The following four variables are used to measure this as-
pect of gender inequalities: the indicator of gender inequality in family law,
in parental authority, in inheritance rights and the percentage of households
headed by women.
4. Political power describes political representation and decision-making (Dijkstra
(2002)). The obvious indicator for relative female political power are used: the
female share of parliamentary seats, the proportion of women legislators, the
proportion of women holding ministerial positions and the CIRI indicator of
women’s political rights.
5. Access to education is measured as an arithmetic average of male-female ratio
in literacy rate, in net school enrollment, in primary, secondary and tertiary
education and the female share of teachers.
6. Access to health is measured by the female-male ratio of life expectancy10and
10Following Anand and Sen (1995) in the life expectancy component, it is assumed that, given
17
Documents de Travail du Centre d'Economie de la Sorbonne - 2010.17
Klasen’s missing women indicator.11
7. Economic resources include indicators of gender inequality in terms of access
to land, credit and property other than land.
8. Employment and income refers to the distribution of paid and unpaid work,
wage differentials, formal and informal labor (Dijkstra (2002)). This dimen-
sion is measured with the following variables: the CIRI indicator of women’s
economic rights, the female share in technical and professional and adminis-
trative and management positions, the male-female ratio of earned income, of
economic activity rate and the female share in the active population.
One of the requirements is that the GII (Gender Inequality Index) is a relative
measure. The GII has to measure gender inequality and does not include absolute
level of female well-being. Indeed, inequality exists if the situation of one person can
be compared to the situation of a group (Johnson (1985)). However, many variables
listed above may be the subject of criticism. Female shares and female to male ratios
do not pose any problems. For the other integer variable, it is considered the male’s
situation as the absolute reference. It is assumed that the prevalence of these types
of discrimination against men is invalid and men’s rights are applied totally. For
example, the indicator of women’s freedom of movement is coded 0 if women have no
restrictions to move outside the home; 0.5 - Some women can leave home sometimes,
but with restrictions; 1 - Women can never leave home without restrictions (i.e.
they need a male companion, etc.). This indicator describes the relative situation
of women in comparison to men, who face no movement restrictions. Similarly,
indicators of law (economic, political and social) assume men’s rights are respected;
indicators of access to economic resources assume no restrictions for men. Of course,
this is not the reality. Credit rationing is common in developing countries, but it is
assumed that it affects more women than men.
Moreover, the index rewards countries that reach the point where outcomes for
women equal those for men, but it neither rewards nor penalizes cases in which
equal treatment and an apparent biological advantage of females, women would outlive men by anaverage of five years (Waldron (1983), Johannson (1991)). If female life expectancy exceeds malelife expectancy by less or more than five years, a gender gap is held to exist.
11This indicator takes into account the two recent controversies surrounding the levels and trendsin the number of ‘missing women’ in the world. See Klasen (2008).
18
Documents de Travail du Centre d'Economie de la Sorbonne - 2010.17
women are outperforming men in particular variables (Hausmann, Tyson, and Zahidi
(2007)).
Within the sample used here 109 developing countries provide information on
all the 32 variables. The choice is guided by the availability of information so that
as many countries as possible can be ranked. As the indicators primarily measure
gender inequalities that pose problems in the developing world, the OECD countries
are excluded in the first part of the factor analysis.
4 The Gender Inequalities Index: GII
The strategy for aggregating data used here seeks to go beyond the methodolog-
ical shortcomings named above. Using Multiple Correspondence Analysis (MCA),
the Gender Inequalities Index (GII) was constructed for 109 countries, with dimen-
sion weights defined endogenously.
4.1 Four clusters of countries appear
MCA defines different axes explaining different aspects of gender inequalities.
To know how many axes to retain in order to have a good description of the whole
phenomena, the inertia of the singular values was studied. If the percentage of the
explanation of the total inertia by the first singular value has to be sufficient -more
than 50% (Escofier and Pages (1998)) - meaning that the first axis contains greatest
amount of common information, then only the first factor is retained here in the
composite index (the GII).
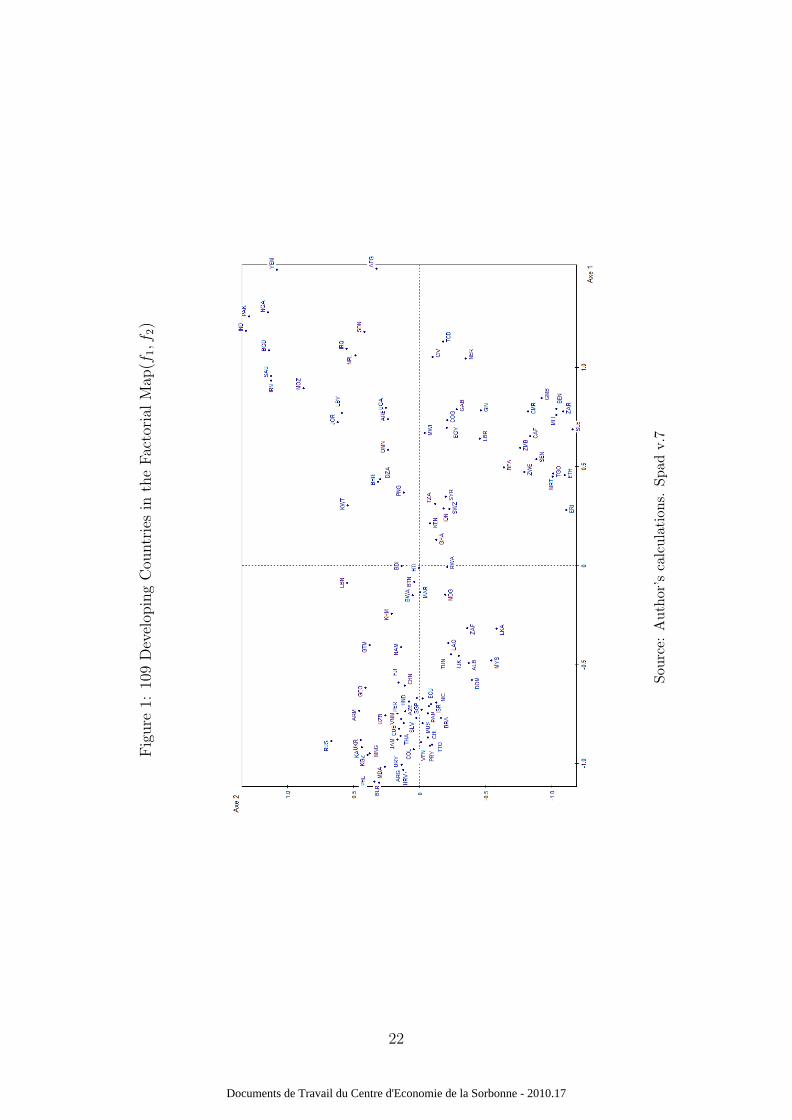
The first principal component explains 74.16% of the total inertia, which is more
than satisfactory (nearly 3/4 of the variance of initial variables). The second factor
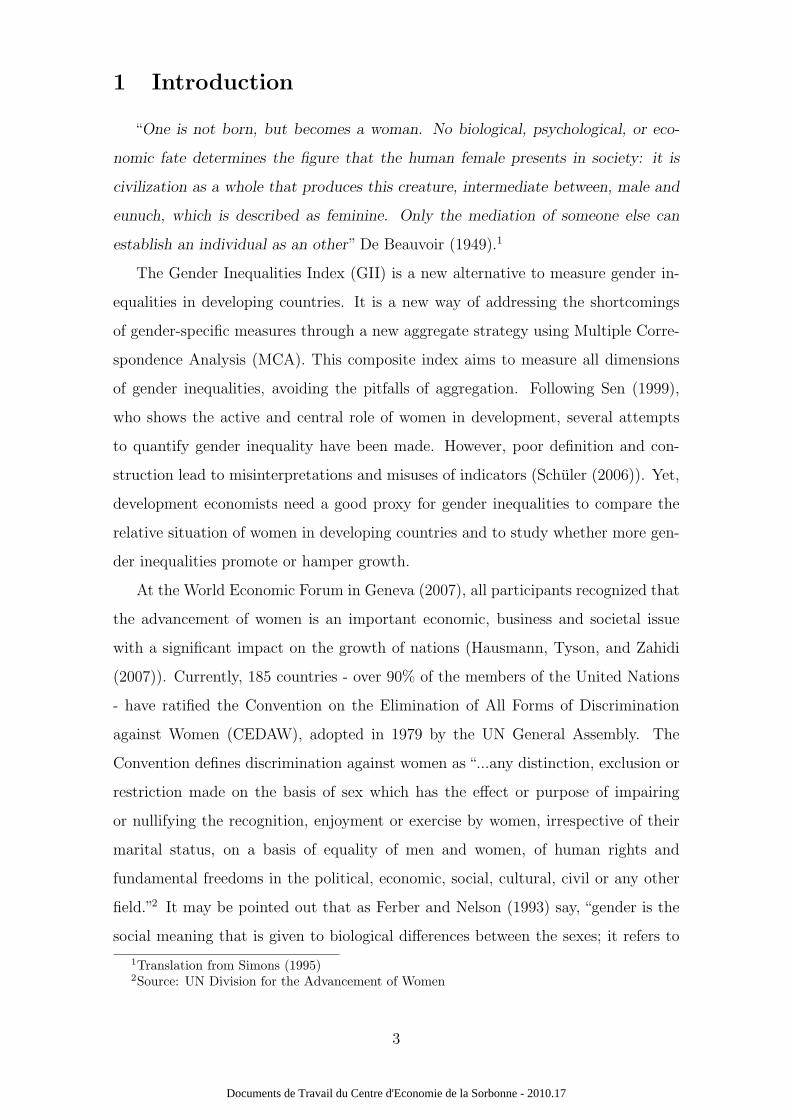
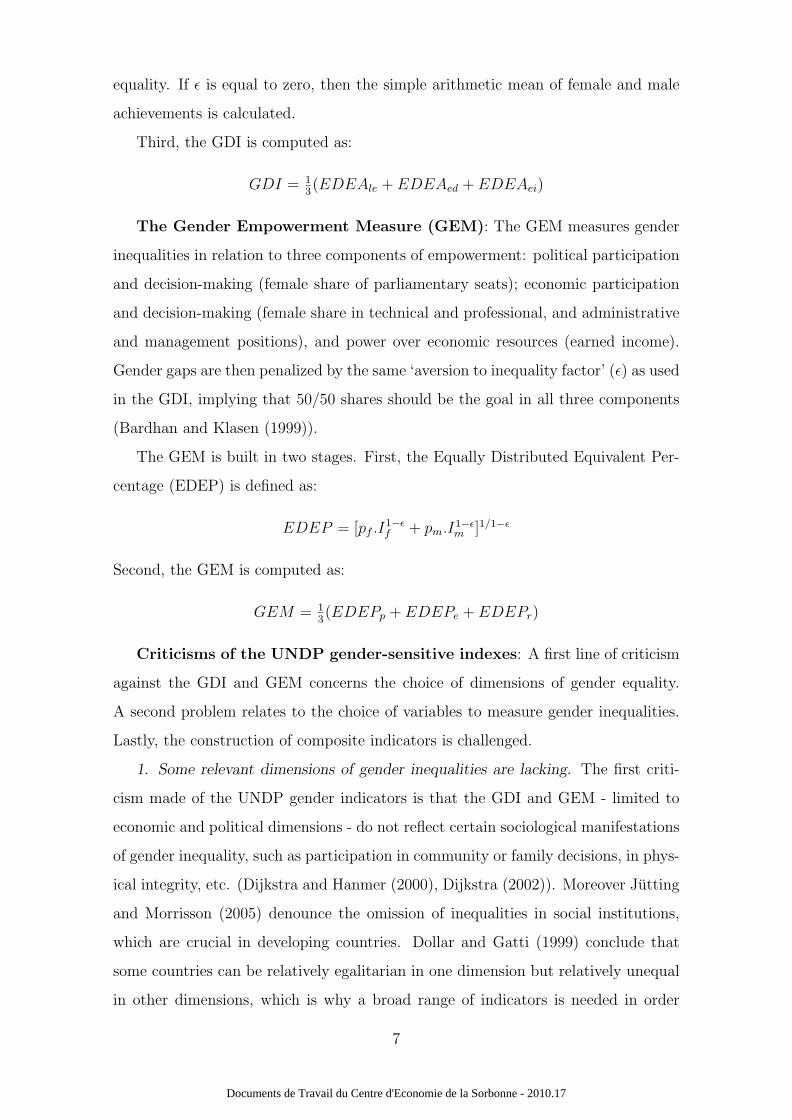
explains 9.88% of inertia. Therefore, the factorial map (f1, f2) explains 84.04% of
the dispersion of the scatter plot (Figure 1).
The first axis (horizontal) opposes countries with low gender inequalities on the
right and countries with high gender inequalities on the left. Value tests allow
the visual analysis of Figure 1 to be confirmed. High modalities of all dimensions of
gender inequalities are opposed to low modalities. This confirms that axis 1 describes
the extent of gender inequalities.
19
Documents de Travail du Centre d'Economie de la Sorbonne - 2010.17
The second axis (vertical) contrasts the strong inequalities in the dimensions of
education, physical integrity and access to economic resources on the bottom, with
strong gender inequalities in the dimensions of gender identity and politics on the
higher part of the axis. The interpretation of the second axis requires care. This
means that in the multidimensional phenomenon of gender discrimination in the
countries concerned, women suffer more in this type of inequality than in others.
This is not to say that inequalities in other dimensions do not appear or are weak,
but that they are less strong within the overall picture. So, the second axis opposes
countries where women are principally victims in the access to the determinants of
economic opportunities, to countries where women suffer mainly from discrimination
in sociopolitical representation.
Four country clusters appear in Figure 1. The top-right quadrant contains 22
developing countries where gender inequalities are high, especially for sociopolitical
representation, i.e. in gender identity (age of marriage, social rights and civil lib-
erties) and political power (political representation and political rights). In these
countries, being a women means having a restricted social role. In public, women
do not have the same rights and the same opportunities as men. Political and social
rules discriminate against women because they are set by men. These countries can
be characterized as ‘patriarchal’, since their social norms convey a customary image
of women and deny equal access to sociopolitical power. Patriarchy is the structuring
of family units based on the man, as a father figure, having primary authority over
other family members. Patriarchy also refers to a system of government by males,
and to the dominance of men in social or cultural institutions. In such countries,
men take primary responsibility over the welfare of the community as a whole. In-
deed, sociopolitical power is reserved for men. This authority often includes acting
as the dominant figures in social and political procedures, including serving as repre-
sentatives in public office. In these countries, women do not have the same rights in
terms of identity and political power. One might think that these forms of discrim-
ination are complementary, insofar as the gender identity conveyed by social norms
and internalized by individuals, constrains their role in society. These countries are
mainly localized in South Asia and in the Middle East.
In the bottom-right quadrant, there are 31 countries where gender inequalities
20
Documents de Travail du Centre d'Economie de la Sorbonne - 2010.17
are strong, principally concerning the access to determinants of economic opportuni-
ties, i.e. in access to education (primary, secondary, tertiary education, teaching and
literacy), to economic resources (access to land ownership, credit and other forms of
property), and in physical integrity (genital mutilation, adolescent fertility, access
to contraception, violence and physical security indicators). Women’s economic role
is ignored: they have unequal access to human and physical capital and then have
an unequal access to economic opportunities. These countries can be characterized
as ‘traditional’. They do not grant women any economic role. The lack of access
to education and economic resources for women constrains their economic activity
and their empowerment. In these countries, women’s activities are always depen-
dent on men, households, the extended family or the community. Furthermore, in
these countries, the violation of women’s physical integrity is frequent. This impacts
directly on their productivity and has economic consequences. But this form of dis-
crimination impacts on confidence too. Women who suffer from genital mutilation,
rape, violence or women who are aware of the threats to their physical integrity are
less confident. This can have an indirect impact on women’s economic activities and
performances. Geographically these countries are mainly located in Sub-Saharan
Africa.
21
Documents de Travail du Centre d'Economie de la Sorbonne - 2010.17
Fig
ure
1:10
9D
evel
opin
gC
ountr
ies
inth
eF
acto
rial
Map
(f1,f
2)
S our
ce:
Aut
hor’
sca
lcul
atio
ns.
Spad
v.7
22
Documents de Travail du Centre d'Economie de la Sorbonne - 2010.17
The top-left quadrant includes 33 countries characterized by low gender inequal-
ity, except in the political dimension. In these countries, women have a restricted
political role, and executive power is reserved for men.. These include, in particular,
the countries from the former Communist bloc (the Commonwealth of Indepen-
dent States CIS: Armenia, Azerbaijan, Belarus, Georgia, Kazakhstan, Kyrgyzstan,
Moldova, Turkmenistan, Tajikistan, Ukraine, and Uzbekistan). In these countries,
gender inequalities are principally found in the political dimension. While improve-
ments occurred with the collapse of the USSR, inequality in the political power
remains. Indeed, the social and educational dimensions have begun being feminized,
while the functions of government remain male preserves.
There are 23 countries in the bottom-left quadrant. These countries are mostly
located in Latin America and the Caribbean. They are characterized by low inequal-
ity except in the employment dimension. In these countries, the economic role of
women is restricted. Women are increasingly present in the production sector and
the job market in general, but professional segmentation on the basis of gender and
wage inequality persists. Unemployment among women is rising, and the situation
of women in rural areas is even more precarious. Economic power is reserved for
men and women suffer discrimination.
4.2 The endogenous determination of weights
After analyzing the graphic representation of the MCA, the latter also determines
endogenously the weight of each variable in the aggregated Gender Inequalities Index
(GII). This corresponds to its relative contribution to the variance of the aggregate
indicator and it is computed as the sum of the absolute contribution to the inertia
of the first axis for each modality (Escofier and Pages (1998)). This contribution
can be calculated as a linear combination of weights associated with the principal
components (Escofier and Pages (1998), Berr and Combarnous (2004)): the relative
contribution of a modality to the first axis is equal to the square of its coordinates
on this axis, divided by the eigenvalue of this axis. For each axis, the sum of the
relative contributions of the variables is equal to 100%.
Table 1 presents weights defined endogenously by the MCA. The results give
a higher weight to dimensions of family, identity, health and access to economic
23
Documents de Travail du Centre d'Economie de la Sorbonne - 2010.17
resources and a lower weight to gender inequalities in politics and employment. The
former contribute more than any other dimension to the discrimination of women
in developing countries. These weights describe a hierarchy between dimensions:
gender inequalities in family, identity, health and access to economic resources are
the most relevant. This is not because they are the most relevant for descriptive
statistics, nor because of their frequency, but because they put more constraints on
women: the burden of discrimination is principally due to these dimensions. Indeed,
discrimination against women in families generates discrimination in social norms
and then inequality in the role of each gender within society. Then, in developing
countries where resources are sparse, economic trade-offs promote the sex which
seems to be more important and more appropriately to have a greater role in society,
namely men.
The other dimensions are relevant to the situation of women, but are less re-
strictive. This assertion does not mean that policy for equality in education does
not matter, but that gender inequalities in the family, identity, health and economic
resources should be targeted first to promote women’s rights in developing countries.
Table 1: Weights of each Dimension in GII
Dimension Weights in GIIFamily 0.181Identity 0.156Health 0.156Economic Resources 0.146Physical Integrity 0.116Education 0.118Work 0.068Politics 0.06
Source: Author’s calculations with Spad v.7
4.3 The aggregation rule and the presentation of the GII
Although many forms of aggregation have been developed (Diewert (1976)), the
standard practice considers a composite indicator as a weighted linear function of a
set of variables (OECD (2005)). In this context, the determination of the weight of
each component of the composite indicator is crucial: the highest weight is given to
the most significant dimension (Podinovskii (1994)). Therefore, the weight of a lin-
24
Documents de Travail du Centre d'Economie de la Sorbonne - 2010.17
ear function corresponds to substitution rates between the components (Munda and
Nardo (2005b)). This logically implies total compensation between the various com-
ponents of the composite indicator. The total compensation allows any disadvantage
in one dimension to be compensated by a sufficient advantage in another dimension.
Yet, a total compensation and a linear function are not the appropriate logic for
dealing with gender inequalities (Branisa, Klasen, and Ziegler (2009)). That is why
the GII is a non-linear, weighted composite indicator. The GII thus does not allow
full compensation between dimensions, but only partial compensation. In this way,
the GII pays attention to complementarity and substitutability between dimensions
(Munda and Nardo (2005a)).
The GII is defined by the following formula:
GII = 0.181Family2+0.156Identity2+0.156Health2+0.146EconomicResources2+
0.118Education2 + 0.116PhysicalIntegrity2 + 0.068Work2 + 0.06Politic2
The quadratic form is justified by: 1) the partial compensation requirement;
2) the desire to obtain a measure that is sensitive to the distribution of values
between dimensions; and 3) marks an aversion to the particularly low values of the
indicators used in each dimension. This quadratic form is analogous to a parameter
ε which reflects the degree of aversion in terms of gender inequality (Gajdos (2001)).
Moreover, the value 2 has the advantage of easy interpretation, as it leads to the
square function.
Finally this aggregation rule satisfies the requirement of the axiomatics of in-
equalities: 1) the GII is a normalized, weighted sum of the equality shortfalls. A
value zero can be thought of as a goal and the distance from zero describes the
extent of gender inequality; 12 2) the value 2 satisfies both the transfer principle and
transfer sensitivity principle (Kolm (1976)).
4.4 Results by country, region and income group
The GII is built for 109 developing countries. In Appendix C, the results for
the GII are presented. At the top of the list, Afghanistan, Yemen, Chad, Sudan,
Pakistan, Nigeria, Bangladesh, Niger and India have the highest levels of gender
12The magnitude of deprivation is precisely the shortfall in equality.
25
Documents de Travail du Centre d'Economie de la Sorbonne - 2010.17
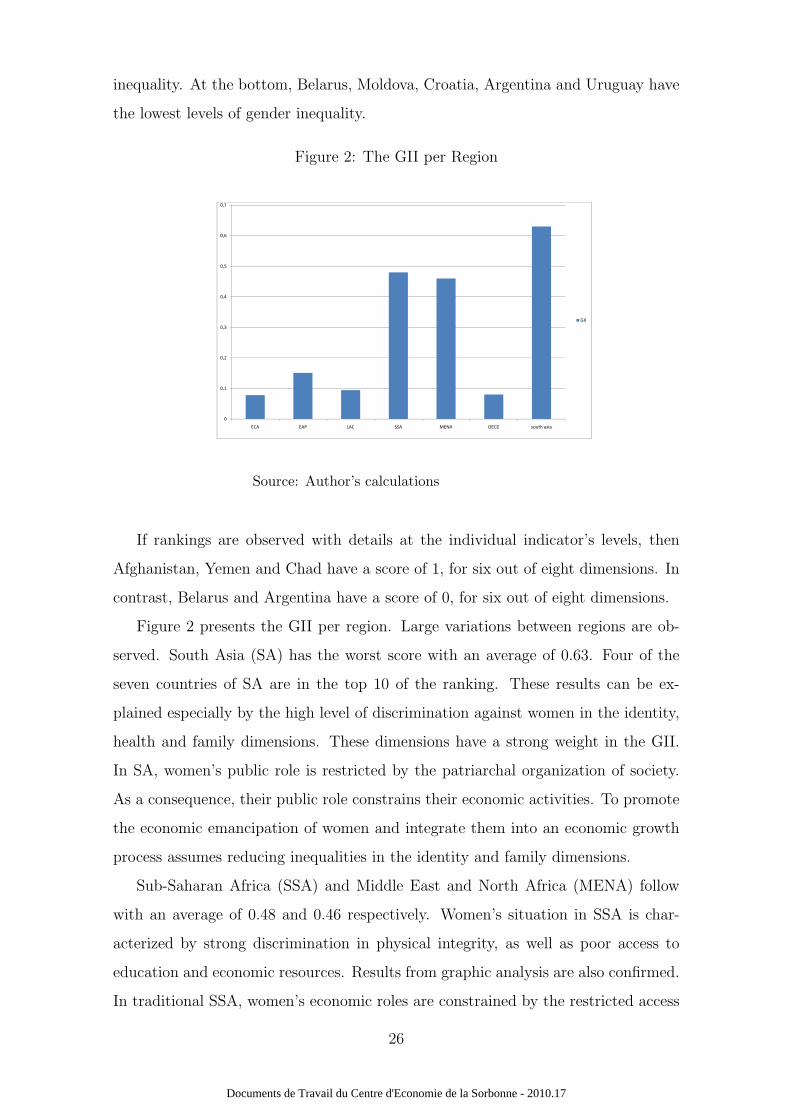
inequality. At the bottom, Belarus, Moldova, Croatia, Argentina and Uruguay have
the lowest levels of gender inequality.
Figure 2: The GII per Region
0
0,1
0,2
0,3
0,4
0,5
0,6
0,7
ECA EAP LAC SSA MENA OECD south asia
GII
Source: Author’s calculations
If rankings are observed with details at the individual indicator’s levels, then
Afghanistan, Yemen and Chad have a score of 1, for six out of eight dimensions. In
contrast, Belarus and Argentina have a score of 0, for six out of eight dimensions.
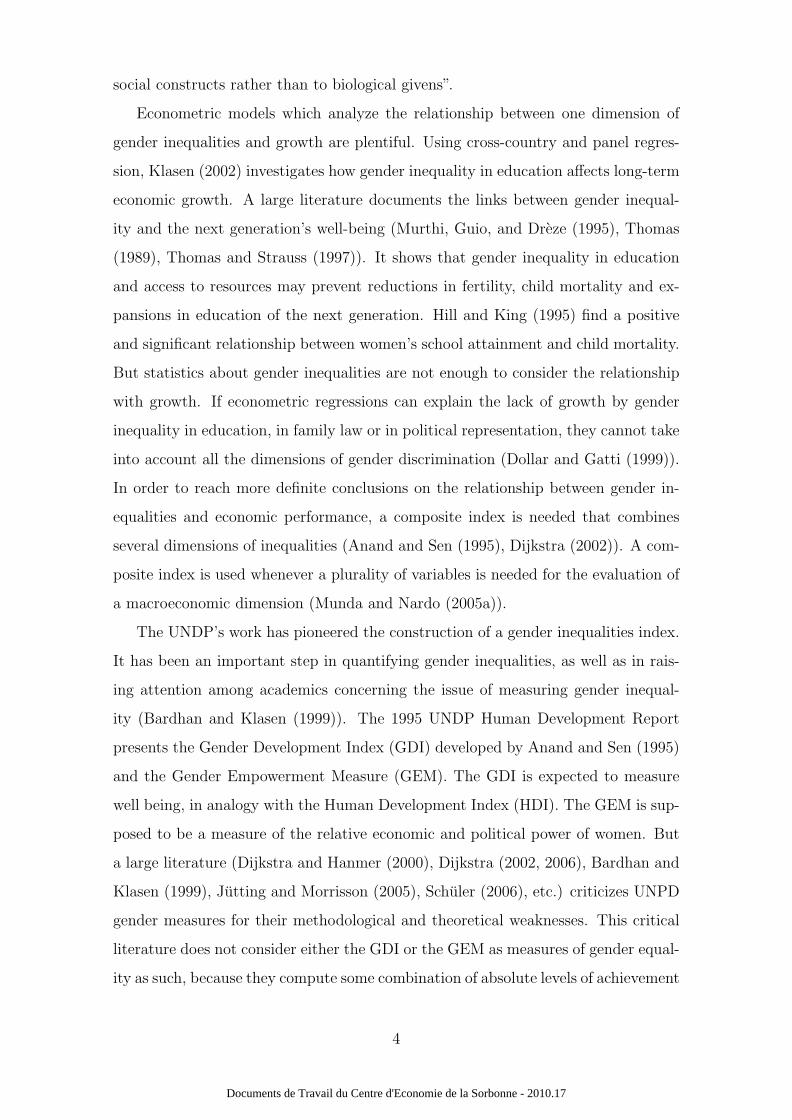
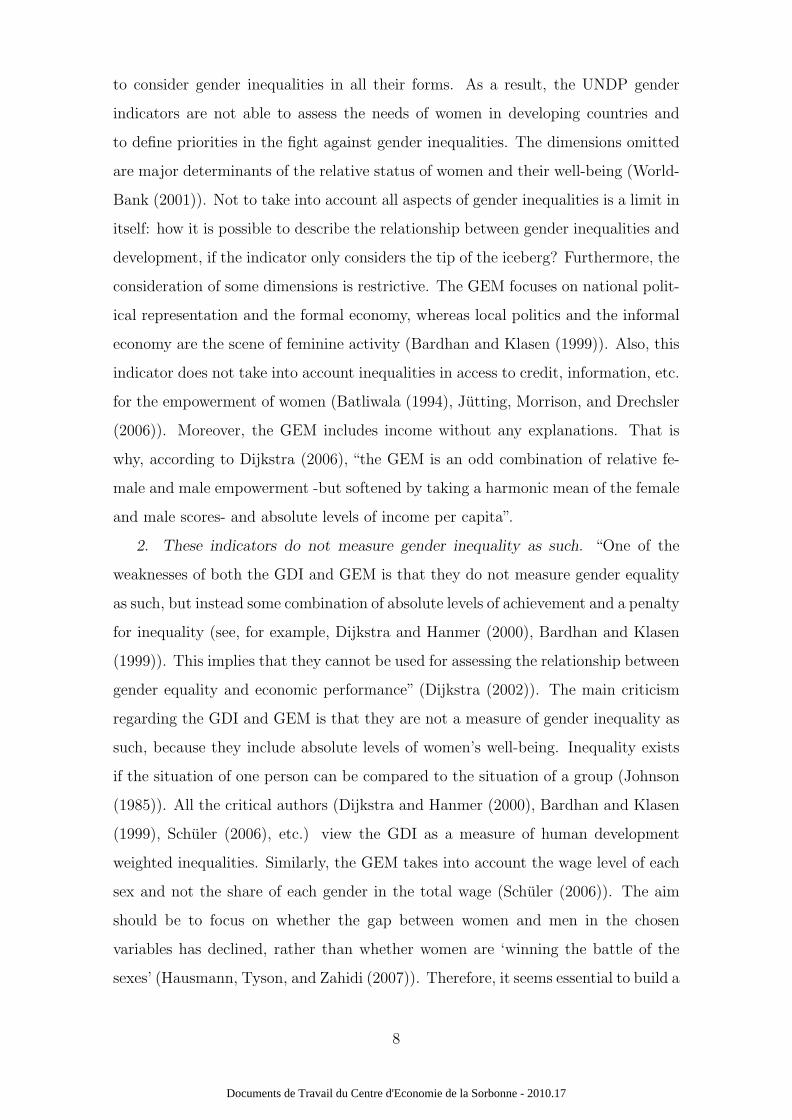
Figure 2 presents the GII per region. Large variations between regions are ob-
served. South Asia (SA) has the worst score with an average of 0.63. Four of the
seven countries of SA are in the top 10 of the ranking. These results can be ex-
plained especially by the high level of discrimination against women in the identity,
health and family dimensions. These dimensions have a strong weight in the GII.
In SA, women’s public role is restricted by the patriarchal organization of society.
As a consequence, their public role constrains their economic activities. To promote
the economic emancipation of women and integrate them into an economic growth
process assumes reducing inequalities in the identity and family dimensions.
Sub-Saharan Africa (SSA) and Middle East and North Africa (MENA) follow
with an average of 0.48 and 0.46 respectively. Women’s situation in SSA is char-
acterized by strong discrimination in physical integrity, as well as poor access to
education and economic resources. Results from graphic analysis are also confirmed.
In traditional SSA, women’s economic roles are constrained by the restricted access
26
Documents de Travail du Centre d'Economie de la Sorbonne - 2010.17
to physical and human capital. This situation can create distortions: less able men
rather than women may have access to education and economic resources. Produc-
tivity and (physical and human) capital accumulation are lower than their potential
levels. In SSA, gender inequality seems to have a relationship with low economic per-
formance, as women’s economic role is restricted to domestic and home production.
Moreover, in SSA, violation of women’s physical integrity reduces their productiv-
ity and affects the rate of fertility through genital mutilation, violence, and limited
access to contraception.
In MENA, gender inequalities are especially high in politics and employment.
Women’s representation in economic and political power is almost non-existent.
Their situation in education and access to health has been improved by growth
in these middle income countries. But strong discrimination in identity and patriar-
chal institutions limits the involvement of women in economic and political activi-
ties. Gender discrimination in economic activities can create distortions: more able
women than men are excluded from the labor market. Regarding political represen-
tation, the issue of corruption can be raised (Dollar, Fisman, and Gatti (2001)).
East Asia and the Pacific (EAP), Latin America and the Caribbean (LAC) and
Europe and Central Asia (ECA) precede OECD countries with an average of 0.15,
0.09, 0.07 and 0.008 respectively. In these regions gender inequalities are low. Nev-
ertheless, some dimensions can be improved: in EAP and ECA, gender inequality in
politics persists; in LAC, women are still discriminated against in employment and
incomes.
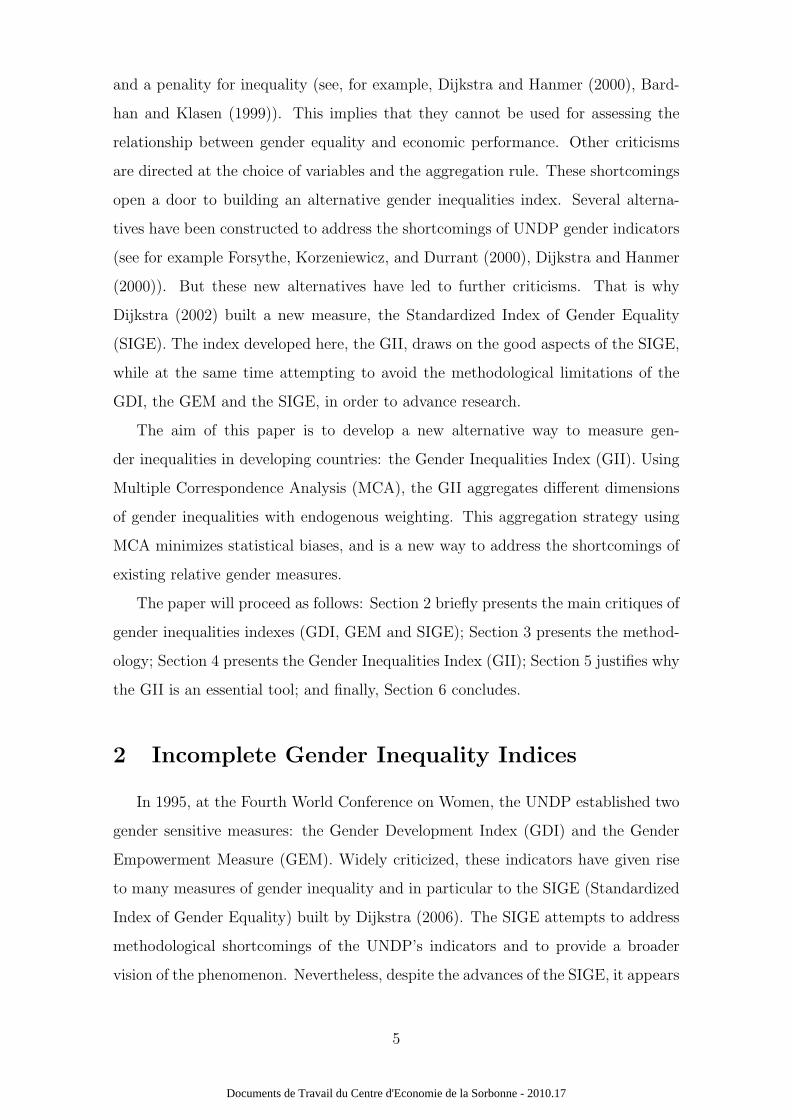
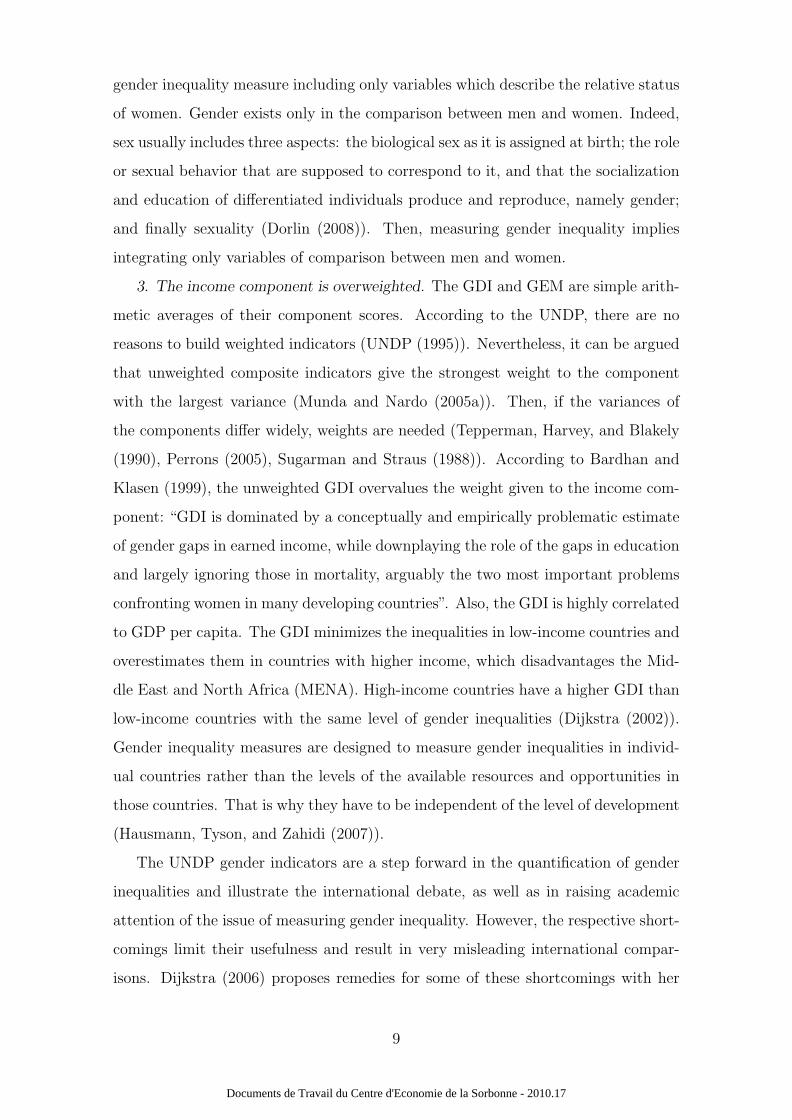
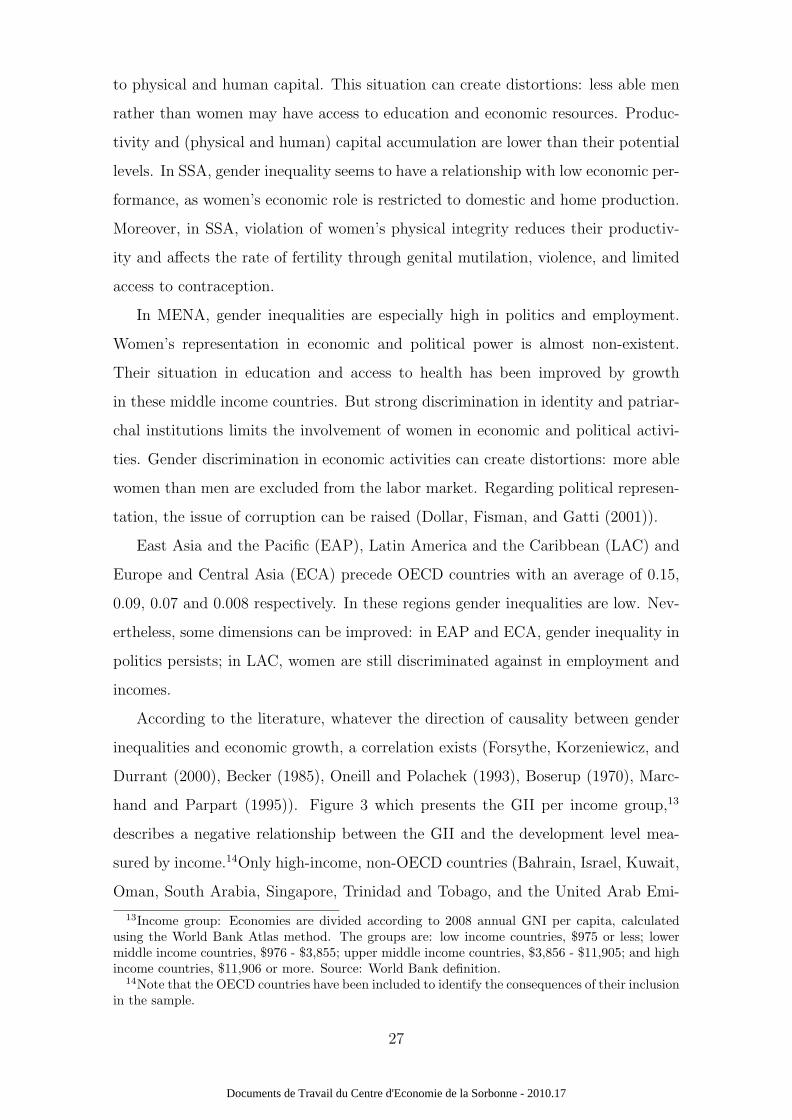
According to the literature, whatever the direction of causality between gender
inequalities and economic growth, a correlation exists (Forsythe, Korzeniewicz, and
Durrant (2000), Becker (1985), Oneill and Polachek (1993), Boserup (1970), Marc-
hand and Parpart (1995)). Figure 3 which presents the GII per income group,13
describes a negative relationship between the GII and the development level mea-
sured by income.14Only high-income, non-OECD countries (Bahrain, Israel, Kuwait,
Oman, South Arabia, Singapore, Trinidad and Tobago, and the United Arab Emi-
13Income group: Economies are divided according to 2008 annual GNI per capita, calculatedusing the World Bank Atlas method. The groups are: low income countries, $975 or less; lowermiddle income countries, $976 - $3,855; upper middle income countries, $3,856 - $11,905; and highincome countries, $11,906 or more. Source: World Bank definition.
14Note that the OECD countries have been included to identify the consequences of their inclusionin the sample.
27
Documents de Travail du Centre d'Economie de la Sorbonne - 2010.17
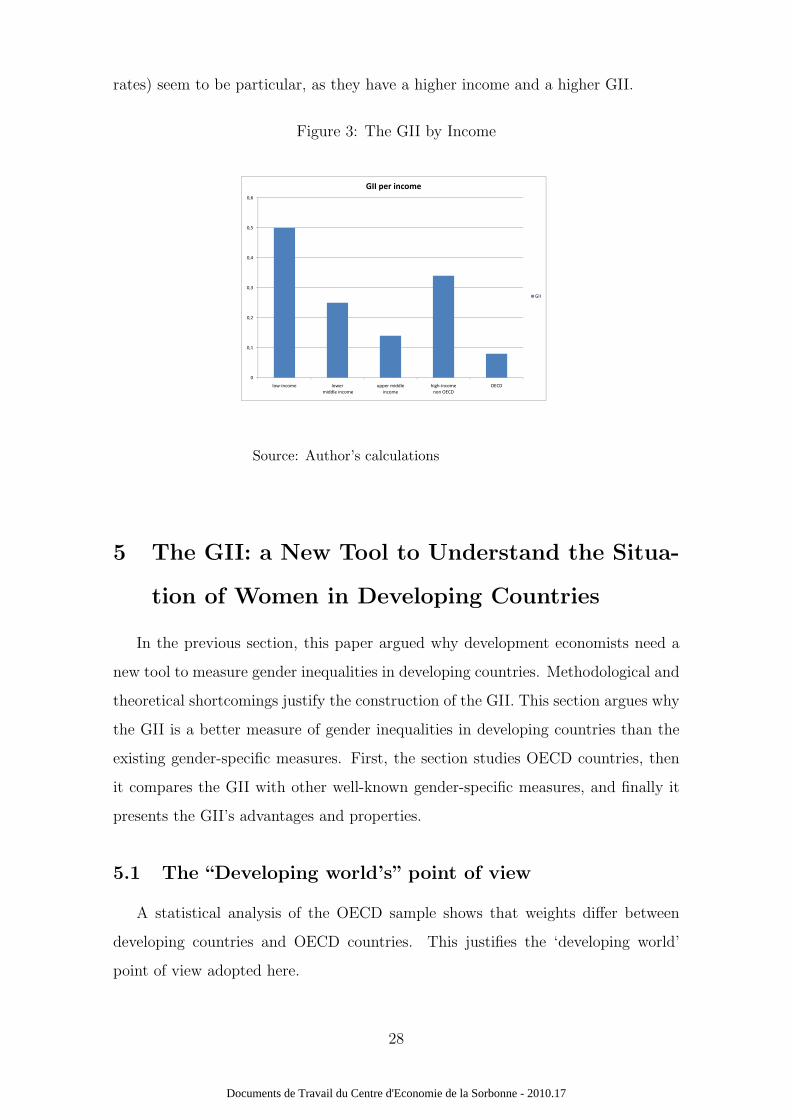
rates) seem to be particular, as they have a higher income and a higher GII.
Figure 3: The GII by Income
0
0,1
0,2
0,3
0,4
0,5
0,6
low-income lower
middle income
upper middle
income
high-income
non OECD
OECD
GII per income
GII
Source: Author’s calculations
5 The GII: a New Tool to Understand the Situa-
tion of Women in Developing Countries
In the previous section, this paper argued why development economists need a
new tool to measure gender inequalities in developing countries. Methodological and
theoretical shortcomings justify the construction of the GII. This section argues why
the GII is a better measure of gender inequalities in developing countries than the
existing gender-specific measures. First, the section studies OECD countries, then
it compares the GII with other well-known gender-specific measures, and finally it
presents the GII’s advantages and properties.
5.1 The “Developing world’s” point of view
A statistical analysis of the OECD sample shows that weights differ between
developing countries and OECD countries. This justifies the ‘developing world’
point of view adopted here.
28
Documents de Travail du Centre d'Economie de la Sorbonne - 2010.17
Discrimination against women is an important issue in developing countries and
the OECD. Nevertheless, concerns differ between the ‘developing’ and ‘developed’
world. Indeed, gender inequality appears in diverse ways. That is why, it is interest-
ing to apply MCA to the OECD sample, to know to what extent gender inequality
issues differ in importance.
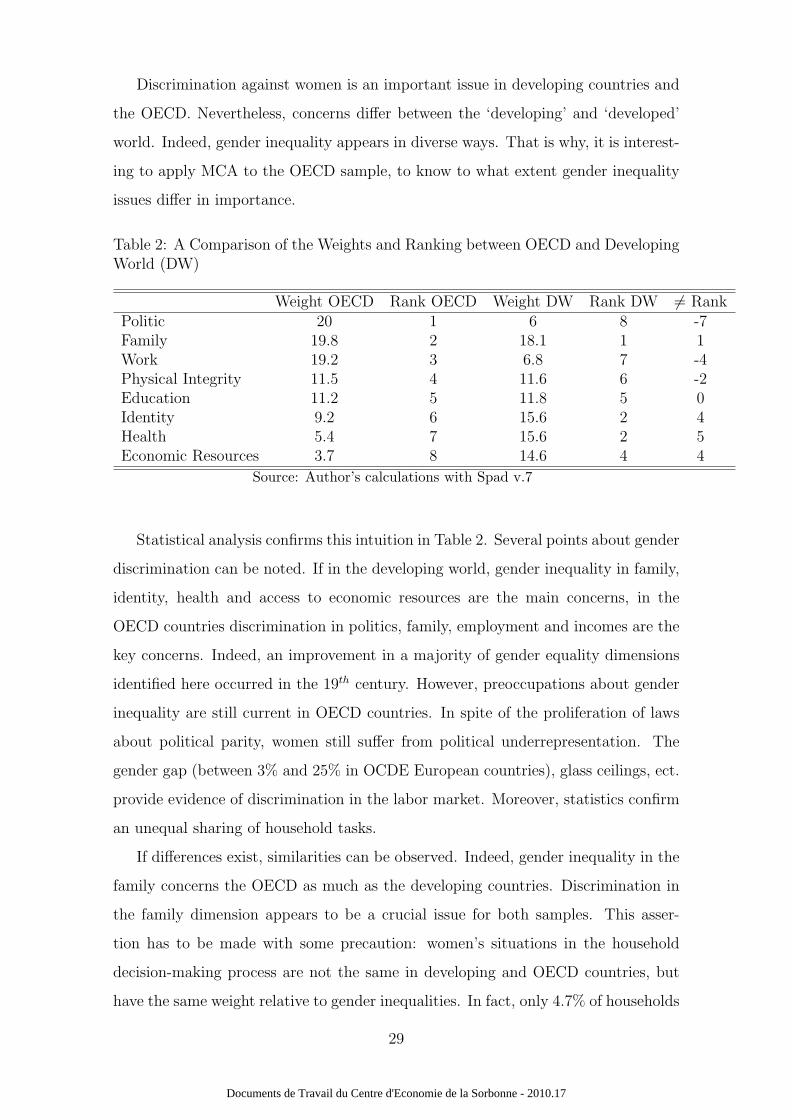
Table 2: A Comparison of the Weights and Ranking between OECD and DevelopingWorld (DW)
Weight OECD Rank OECD Weight DW Rank DW 6= RankPolitic 20 1 6 8 -7Family 19.8 2 18.1 1 1Work 19.2 3 6.8 7 -4Physical Integrity 11.5 4 11.6 6 -2Education 11.2 5 11.8 5 0Identity 9.2 6 15.6 2 4Health 5.4 7 15.6 2 5Economic Resources 3.7 8 14.6 4 4
Source: Author’s calculations with Spad v.7
Statistical analysis confirms this intuition in Table 2. Several points about gender
discrimination can be noted. If in the developing world, gender inequality in family,
identity, health and access to economic resources are the main concerns, in the
OECD countries discrimination in politics, family, employment and incomes are the
key concerns. Indeed, an improvement in a majority of gender equality dimensions
identified here occurred in the 19th century. However, preoccupations about gender
inequality are still current in OECD countries. In spite of the proliferation of laws
about political parity, women still suffer from political underrepresentation. The
gender gap (between 3% and 25% in OCDE European countries), glass ceilings, ect.
provide evidence of discrimination in the labor market. Moreover, statistics confirm
an unequal sharing of household tasks.
If differences exist, similarities can be observed. Indeed, gender inequality in the
family concerns the OECD as much as the developing countries. Discrimination in
the family dimension appears to be a crucial issue for both samples. This asser-
tion has to be made with some precaution: women’s situations in the household
decision-making process are not the same in developing and OECD countries, but
have the same weight relative to gender inequalities. In fact, only 4.7% of households
29
Documents de Travail du Centre d'Economie de la Sorbonne - 2010.17
are headed by women in Kuwait, compared to 42.4% in Finland; 90% of countries
OECD are characterized by parity in parental authority as against 32% of develop-
ing countries. Even if the extent of discrimination in the family dimension differs
substantially from OECD to developing countries, it is a crucial issue for women
all around the world. Neither development nor growth change this fact: gender
inequality in the family is a burden on women. If economic performance may have
an impact on gender inequality, discrimination in the family dimension remains a
constraint for women. Whatever the level of development, inequalities within the
household, and therefore in the private sphere, are one of the most notable mani-
festations of gender discrimination. Thus, while economic development can reduce
inequalities within the family sphere, they remain the main target in the fight against
gender discrimination (being respectively the first and second rows of the GII in the
developing and OECD samples).
The results presented in Table 2 show that worries about gender inequalities
change with the level of development. Priorities differ and recommendations too: if
gender equality in political representation seems to be crucial for OECD countries,
it is secondary for developing countries. Policy against gender discrimination has to
be suited to the level of development. Threshold effects exists in this area: equality
in politics and the issue of empowerment may be a target from a certain level of
achievement of gender equality.
Regarding these results, constructing a gender-inequalities index only for the
developing world appears to be a crucial issue.
5.2 A comparison with other gender-related measures
Correlation and non-redundancy are studied here to compare the GII with the
other well-known gender specific measures.15 Correlation and the Kendall tau b
coefficients test whether the index is empirically redundant, i.e. whether it provides
additional information as compared to other measures. Mcgillivray and White (1992)
use an empirical analysis of the statistical association between well-being measures.
They propose to separate redundancy from non-redundancy by two thresholds of 0.9
and 0.7. I pursue this approach and use the 0.70 threshold as an absolute value, as
15See appendix D
30
Documents de Travail du Centre d'Economie de la Sorbonne - 2010.17
do Branisa, Klasen, and Ziegler (2009), and conclude in favor of non-redundancy.
Moreover I check correlation between the GII, SIGE, GDI and GEM indexes. All
these are correlated negatively with the GII because the larger gender inequalities
are, the higher GII and lower the SIGE, GDI and GEM indexes. These results
suggest a correlation between GII, SIGE, GDI and GEM, so it can be concluded
that the GII measures the same phenomenon as other gender specific indexes, and
is not redundant.
5.3 The Advantages and Properties of the GII
Advantages
• The GII covers a limited number of indicators, but covers as many dimensions
of gender equality as possible through its database;
• The GII is available for 109 countries;
• The GII allows comparisons between countries, but also over time;
• The GII is a relative measure which measures gender inequalities;
• The GII includes appropriate weights determined endogenously and no unin-
tended weights.
• Its non-linear form permits only partial compensation;
• Its interpretation is easy: the higher the GII is, the stronger gender inequalities
are;
• Thanks to MCA, the GII is not built on a predefined economic model;
• Thanks to MCA, the GII minimizes statistical biases and problems related to
multicollinearity and measurement error.
Properties. The GII satisfies several axiomatic requirements of an inequality
index (Gajdos (2001), Chakravarty and Muliere (2003)).
1. Axiom of λinvariance. The GII is a relative inequality index because propor-
tional change in the male and female situations does not change inequality.
31
Documents de Travail du Centre d'Economie de la Sorbonne - 2010.17
2. Axiom of population principle. Inequality over different population sizes can
be compared (Dalton (1920)). If a population is replicated several times, the
inequality does not change.
3. Axiom of Pigou-Dalton transfer principle. A transfer of any form of discrimi-
nation from males to females should decrease inequality.
4. Axiom of transfer sensitivity. The magnitude of a decrease in inequality is
higher, the worse women’s situation is compared to men.
6 Conclusion
Over the past few decades, developing countries have made substantial progress in
educating women and improving their health outcomes. Indeed, since 1970, women’s
life expectancy has increased by 15 years on average, while gender gaps in literacy
and in primary education have decreased according to the WorldBank (2001)). Nev-
ertheless, improvements are needed: 60% of poor people are women. This situation
leads to a female poverty rate that is 1.4 times higher than the male rate. Moreover,
there are still significant gaps in the job opportunities for women and in wages paid.
If gender equality has become a crucial issue for development in the 21th century,
awareness is not sufficient. Development policy has to target the improvement of
women’s situations in the developing world, especially in the family, identity, and
health dimensions. Depending on the country or the region concerned, the fight
against all forms of gender discrimination is appropriate. However situations, and
concerns differ from region to region.
Gender issues are crucial in development economics. Measuring gender inequal-
ities is a first step to provide tools, in order to understand them and fight against
them. The GII is obviously a new tool to characterize women’s situations in com-
parison to men’s in developing countries. Far from being a normative analysis that
describes a single optimal configuration, the GII ranks countries depending on their
characteristics, in terms of gender inequalities. It provides information about dis-
crimination against women, without making value judgments.
32
Documents de Travail du Centre d'Economie de la Sorbonne - 2010.17
Bibliography
Agresti, A. (1984): Analysis of Ordinal Categorical Data. Wiley Series in Proba-
bility and Mathematical Statistics. John Wiley and Sons.
Anand, S., and A. Sen (1995): “Gender Inequality in Human Development: The-
ories and Measurement.,” Human Development Report Office Occasional Paper
No. 19, UNDP, New York.
Bardhan, K., and S. Klasen (1999): “UNDP’s Gender-Related Indices: A Crit-
ical Review,” World Development, 27(6), 985–1010.
Batliwala, S. (1994): Population Policies Reconsidered: Health, Empowerment
and Rightschap. The meaning of Women’s Empowerment: New Concepts from
Action. Harvard University Press.
Bazillier, R. (2004): “Core labour standards and economic growth,” Cahiers de
la Maison des Sciences Economiques.
Bazillier, R., and F. Gouret (2004): “composite index and principal component
analysis, Do we use the right method ?,” mimeo.
Becker, G. (1985): “Human Capital, Effort and the Sexual Division of Labour,”
Journal of Labour Economics, 3, 33–58.
Benzecri, J. (1992): Correspondence Analysis Handbook. Marcel Dekker, New-
York.
Berr, E., and F. Combarnous (2004): “L’impact du consensus de Washington
sur les pays en developpement : une evaluation empirique,” (100).
Bierstedt, R. (1963): The social order. McGraw Hill Book co.
Boserup, E. (1970): Woman’s Role in Economic Development. St Martin’s Press.
Branisa, B., S. Klasen, and M. Ziegler (2009): “The Construction of the
Social Institutions and Gender Index (SIGI),” (184).
33
Documents de Travail du Centre d'Economie de la Sorbonne - 2010.17
Berenger, V., and A. Verdier-Chouchane (2007): “Multidimensional mea-
sures of well-being: standard of living and quality of life across countries,” World
Development, 35, 1259–1276.
Broom, L., and P. Selznick (1963): Sociology. Harper and Row.
Cazes, P. (1990): “Codage d’une variable continue en vue de l’analyse des corre-
spondances,” Revue de statistique appliquee, 38, 33–51.
Chakravarty, S. R., and P. Muliere (2003): “Welfare indicators: A review and
new perspectives. 1. Measurement of inequality,” Metron - International Journal
of Statistics, 0(3), 457–497.
Coleman, J. S. (1990): Foundations of Social Theory. Harvard University Press.
Dalton, H. (1920): “The measurement of inequality of incomes,” Economic Jour-
nal, 30, 348–361.
De Beauvoir, S. (1949): Le Deuxieme Sexe. Gallimard.
Diewert, W. (1976): “Exact and superlative index numbers,” Journal of Econo-
metrics, 4, 115–145.
Dijkstra, A., G. (2002): “Revisting UNDP’s GDI and GEM: Toward an alterna-
tive,” Social Indicators Research, 57, 301–338.
(2006): “Towards a fresch start in measuring gender equality: A contribu-
tion to the debate,” journal of Human Development, 7, 275–283.
Dijkstra, A., G., and C. Hanmer, L. (2000): “Measuring socio-economic gender
equality: Toward an alternative for UNDP’s GDI,” Feminist Economist, 6, 41–75.
Dollar, D., R. Fisman, and R. Gatti (2001): “Are women really the
"fairer" sex? Corruption and women in government,” Journal of Eco-
nomic Behavior & Organization, 46(4), 423–429.
Dollar, D., and R. Gatti (1999): “Gender inequality, income and growth: Are
good times good for women?,” World Bank Policy Research Report Working Pa-
pers, 1.
34
Documents de Travail du Centre d'Economie de la Sorbonne - 2010.17
Dorlin, E. (2008): Sexe, Genre et Sexualites. Introduction a la theorie feministe.
PUF.
Elster, J. (1989): “Social Norms and Economic Theory,” Journal of Perspectives
Economics, 3.
Escofier, B., and J. Pages (1998): Analyses factorielles simples et multiples.
Objectifs methodes et interpretation. Dunod, Paris.
Ferber, M., and J. Nelson (1993): Beyond Economic Man: Feminist Theory
and Economics. Chicago University Press.
Forsythe, N., P. Korzeniewicz, R., and V. Durrant (2000): “Gender In-
equalities and Economic Growth: A Longitudinal Evaluation,” Economic Devel-
opment and Cultural Change, 48, 573–617.
Gajdos, T. (2001): “Les fondements axiomatiques de la mesure normative des
inegalites,” Cahiers de la Maison des Sciences Economiques.
Goertz, G. (2001): “Increasing concept-indicator validity: the case of democracy,”
mimeo.
Greenacre, M. (1984): Theory and Applications of Correspondence Analysis. Aca-
demic Press, London.
Hausmann, R., D. Tyson, L., and S. Zahidi (2007): The global gender gap
report. Wold Economic Forum.
Hill, M. A., and E. King (1995): “Women’s education and economic well-being,”
Feminist Economics, 1(2), 21–46.
Johannson, S. R. (1991): “Welfare, mortality, and gender,” Continuity and
Change, 2.
Johnson, D. (1985): “The development of social statistics and indicators on the
status of women,” Social Indicators Research, 16, 233–261.
Jutting, J. P., C. Morrison, and D. Drechsler (2006): “The Gender, Insti-
tutions and Development Data Base,” OECD working paper, (16).
35
Documents de Travail du Centre d'Economie de la Sorbonne - 2010.17
Jutting, J. P., and C. Morrisson (2005): “Changing Social Institutions to
Improve the Status of Women in Developing Countries,” OECD working paper,
(27).
Klasen, S. (2002): “Low Schooling for Girls, Slower Growth for All? Cross-Country
Evidence on the Effect of Gender Inequality in Education on Economic Develop-
ment,” World Bank Economic Review, 16(3), 345–373.
(2008): “Missing Women: Some Recent Controversies on Levels and Trends
in Gender Bias in Mortality,” (168).
Klasen, S., and D. Schuler (2009): “Reforming the Gender-Related Index (GDI)
and the Gender Empowerment Measure (GEM): Some Specific Proposals,” Ibero
America Institute for Econ. Research (IAI) Discussion Papers, (186).
Kolm, S. (1976): “Unequal inequalities II,” Journal of Economic Theory, 13, 82–
111.
Lebart, L., A. Morineau, and M. Piron (2004): Statistique exploratoire mul-
tidimensionnelle. Dunod.
Marchand, M., and J. Parpart (1995): Feminism, Postmodernism Develop-
ment. Routledge, London.
Mcgillivray, M., and H. White (1992): “Measuring development? : a statistical
critique of the UNDP human development index,” (135).
Munda, G., and M. Nardo (2005a): “Constructing consistent composite indica-
tors: the issue of weights,” Technical Report EUR, 21834.
(2005b): “Non-compensatory composite indicators for ranking countries:
A defensible setting,” Technical Report EUR, 21833.
Murthi, M., C. Guio, A., and J. Dreze (1995): “Mortality, Fertility and
Gender-Bias in India,” Population and Development Review, 21.
North, D. C. (1991): “Institutions,” Journal of Economic Perspectives, 5(1), 97–
112.
36
Documents de Travail du Centre d'Economie de la Sorbonne - 2010.17
OECD (2005): “Handbook on constructing composite indicators: methodology and
user guide,” OECD statistics working paper.
Oneill, J., and S. Polachek (1993): “Why the Gender Gap in Wages Narrowed
in the 1980s,” Journal of Labour Economics, 11, 205–228.
Perrons, D. (2005): “Gender Inequalities in Regional Development,” Regional
Studies, 29(5), 465–476.
Podinovskii, V. V. (1994): “Criteria importance theory,” Mathematical Social
Sciences, 27(3), 237–252.
Schuler, D. (2006): “The uses and Misuses of the Gender-related Development
Index and the Gender empowerment Measure: A review of literature,” Journal of
Human Development, 7, 161–181.
Sen, A. (1999): Development as Freedom. Oxford University Press.
Simons, M. (1995): Feminist Interpretations of Simone de Beauvoir. Pennsylvania
State University Press.
Sugarman, D., and M. Straus (1988): “Indicators of gender equality for Amer-
ican states and regions,” Social Indicators Research, 20, 229–270.
Tauzin, A. (1988): “Excision et identite feminine. L’exemple mauritanien,” Anthro-
pologie et Societes, 12, 29–37.
Tepperman, L., B. Harvey, E., and H. Blakely, J. (1990): “Toward an index
of gender equality,” Social Indicators Research, 22.
Thomas, D. (1989): “Intra-Household Resource Allocation: An Inferential Ap-
proach,” (586).
Thomas, D., and J. Strauss (1997): “Health and Wages: Evidence on Men and
Women in Urban Brazil,” (97-05).
UNDP (1995): Human Development Report. Oxford University Press.
37
Documents de Travail du Centre d'Economie de la Sorbonne - 2010.17
Waldron, I. (1983): Sex Differentials in Mortalitychap. The role of genetic and
biological factors in sex differences in mortality, pp. 141–164. Australian National
University Press, Canberra.
Wieringa (1997): “Report of the Workshop on GDI/GEM Indicators, The Hague,”
Institute of Social Studies.
WorldBank (2001): Engendering Development through gender inequality in rights,
Resources and Voice. World Bank.
38
Documents de Travail du Centre d'Economie de la Sorbonne - 2010.17
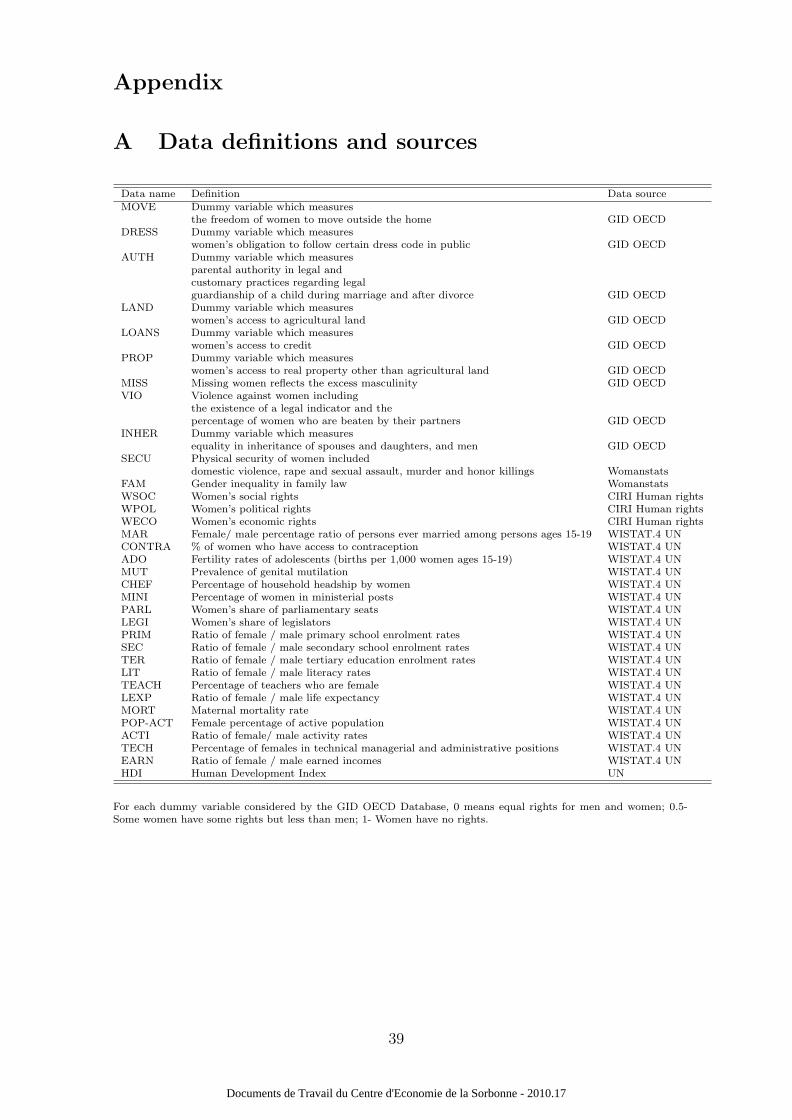
Appendix
A Data definitions and sources
Data name Definition Data sourceMOVE Dummy variable which measures
the freedom of women to move outside the home GID OECDDRESS Dummy variable which measures
women’s obligation to follow certain dress code in public GID OECDAUTH Dummy variable which measures
parental authority in legal andcustomary practices regarding legalguardianship of a child during marriage and after divorce GID OECD
LAND Dummy variable which measureswomen’s access to agricultural land GID OECD
LOANS Dummy variable which measureswomen’s access to credit GID OECD
PROP Dummy variable which measureswomen’s access to real property other than agricultural land GID OECD
MISS Missing women reflects the excess masculinity GID OECDVIO Violence against women including
the existence of a legal indicator and thepercentage of women who are beaten by their partners GID OECD
INHER Dummy variable which measuresequality in inheritance of spouses and daughters, and men GID OECD
SECU Physical security of women includeddomestic violence, rape and sexual assault, murder and honor killings Womanstats
FAM Gender inequality in family law WomanstatsWSOC Women’s social rights CIRI Human rightsWPOL Women’s political rights CIRI Human rightsWECO Women’s economic rights CIRI Human rightsMAR Female/ male percentage ratio of persons ever married among persons ages 15-19 WISTAT.4 UNCONTRA % of women who have access to contraception WISTAT.4 UNADO Fertility rates of adolescents (births per 1,000 women ages 15-19) WISTAT.4 UNMUT Prevalence of genital mutilation WISTAT.4 UNCHEF Percentage of household headship by women WISTAT.4 UNMINI Percentage of women in ministerial posts WISTAT.4 UNPARL Women’s share of parliamentary seats WISTAT.4 UNLEGI Women’s share of legislators WISTAT.4 UNPRIM Ratio of female / male primary school enrolment rates WISTAT.4 UNSEC Ratio of female / male secondary school enrolment rates WISTAT.4 UNTER Ratio of female / male tertiary education enrolment rates WISTAT.4 UNLIT Ratio of female / male literacy rates WISTAT.4 UNTEACH Percentage of teachers who are female WISTAT.4 UNLEXP Ratio of female / male life expectancy WISTAT.4 UNMORT Maternal mortality rate WISTAT.4 UNPOP-ACT Female percentage of active population WISTAT.4 UNACTI Ratio of female/ male activity rates WISTAT.4 UNTECH Percentage of females in technical managerial and administrative positions WISTAT.4 UNEARN Ratio of female / male earned incomes WISTAT.4 UNHDI Human Development Index UN
For each dummy variable considered by the GID OECD Database, 0 means equal rights for men and women; 0.5-Some women have some rights but less than men; 1- Women have no rights.
39
Documents de Travail du Centre d'Economie de la Sorbonne - 2010.17
B Discretization of continuous variables and cre-
ation of the gender inequality dimensions
Discretization of continuous variables: This article constructs a new database
which includes 32 variables and covers continuous and discrete variables. Neverthe-
less, to use MCA, these 32 variables have to be discrete. The first step thus was to
make the continuous variables discrete.16. There are two common ways to discretize
continuous variables: (i) creating classes of the same size, (ii) creating classes of
equal amplitude. This paper uses the latter, because it allows discrimination be-
tween countries to be preserved and thus avoids grouping together countries with
different characteristics. For example, regarding the ‘marriage’ variable, the first
method which proceeded to create classes of the same size, gathered together Mada-
gascar and the Democratic Republic of Congo, which have respectively a ratio of
0.34 and 0.74. In contrast, the second method -creating classes of same amplitude-
does not create artificial distance between two countries.
Then to compare the 32 variables together and standardize each measure, they
are all coded in a scale from 0 to 1. A score of 0 means equality, a score of 1 total
inequality.17
The classes are then constructed using a constant step e: 18
e = (maxxi −minxi)/K
Building the eight dimensions of gender inequalities: Once the data is
discretized, the research presented here built eight dimensions of gender inequalities.
Each dimension is an unweighted sum of the sub-variables.19
16It should be noted that it is easier to convert continuous variables into discrete variables thanthe contrary (Escofier and Pages (1998)). Even if the discretization of continuous variables iswidely criticized, because it generates a loss of information, it is the best option in this case (Cazes(1990))
17Note that truncating the data at the equality benchmarks for each variable means assigningthe same score to a country that has reached parity between women and men, and one in whichwomen have surpassed men.
18Where min xi is the minimum and max xi the maximum of the variables xi; K is the numberof classes desired, namely five.
19It should be noted that the dimensions are constructed as the unweighted sum of variables andnot as their average. Indeed, the average of discrete variables has no meaning: a score of two isnot the double of one.
40
Documents de Travail du Centre d'Economie de la Sorbonne - 2010.17
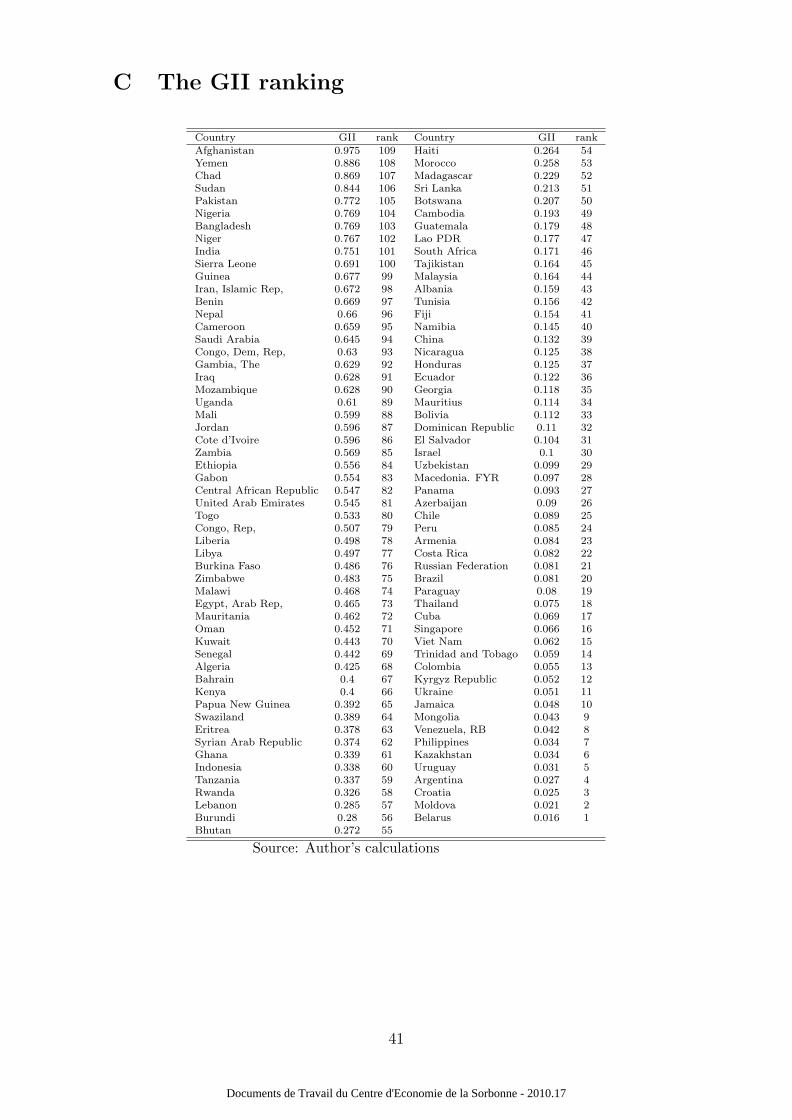
C The GII ranking
Country GII rank Country GII rankAfghanistan 0.975 109 Haiti 0.264 54Yemen 0.886 108 Morocco 0.258 53Chad 0.869 107 Madagascar 0.229 52Sudan 0.844 106 Sri Lanka 0.213 51Pakistan 0.772 105 Botswana 0.207 50Nigeria 0.769 104 Cambodia 0.193 49Bangladesh 0.769 103 Guatemala 0.179 48Niger 0.767 102 Lao PDR 0.177 47India 0.751 101 South Africa 0.171 46Sierra Leone 0.691 100 Tajikistan 0.164 45Guinea 0.677 99 Malaysia 0.164 44Iran, Islamic Rep, 0.672 98 Albania 0.159 43Benin 0.669 97 Tunisia 0.156 42Nepal 0.66 96 Fiji 0.154 41Cameroon 0.659 95 Namibia 0.145 40Saudi Arabia 0.645 94 China 0.132 39Congo, Dem, Rep, 0.63 93 Nicaragua 0.125 38Gambia, The 0.629 92 Honduras 0.125 37Iraq 0.628 91 Ecuador 0.122 36Mozambique 0.628 90 Georgia 0.118 35Uganda 0.61 89 Mauritius 0.114 34Mali 0.599 88 Bolivia 0.112 33Jordan 0.596 87 Dominican Republic 0.11 32Cote d’Ivoire 0.596 86 El Salvador 0.104 31Zambia 0.569 85 Israel 0.1 30Ethiopia 0.556 84 Uzbekistan 0.099 29Gabon 0.554 83 Macedonia. FYR 0.097 28Central African Republic 0.547 82 Panama 0.093 27United Arab Emirates 0.545 81 Azerbaijan 0.09 26Togo 0.533 80 Chile 0.089 25Congo, Rep, 0.507 79 Peru 0.085 24Liberia 0.498 78 Armenia 0.084 23Libya 0.497 77 Costa Rica 0.082 22Burkina Faso 0.486 76 Russian Federation 0.081 21Zimbabwe 0.483 75 Brazil 0.081 20Malawi 0.468 74 Paraguay 0.08 19Egypt, Arab Rep, 0.465 73 Thailand 0.075 18Mauritania 0.462 72 Cuba 0.069 17Oman 0.452 71 Singapore 0.066 16Kuwait 0.443 70 Viet Nam 0.062 15Senegal 0.442 69 Trinidad and Tobago 0.059 14Algeria 0.425 68 Colombia 0.055 13Bahrain 0.4 67 Kyrgyz Republic 0.052 12Kenya 0.4 66 Ukraine 0.051 11Papua New Guinea 0.392 65 Jamaica 0.048 10Swaziland 0.389 64 Mongolia 0.043 9Eritrea 0.378 63 Venezuela, RB 0.042 8Syrian Arab Republic 0.374 62 Philippines 0.034 7Ghana 0.339 61 Kazakhstan 0.034 6Indonesia 0.338 60 Uruguay 0.031 5Tanzania 0.337 59 Argentina 0.027 4Rwanda 0.326 58 Croatia 0.025 3Lebanon 0.285 57 Moldova 0.021 2Burundi 0.28 56 Belarus 0.016 1Bhutan 0.272 55
Source: Author’s calculations
41
Documents de Travail du Centre d'Economie de la Sorbonne - 2010.17
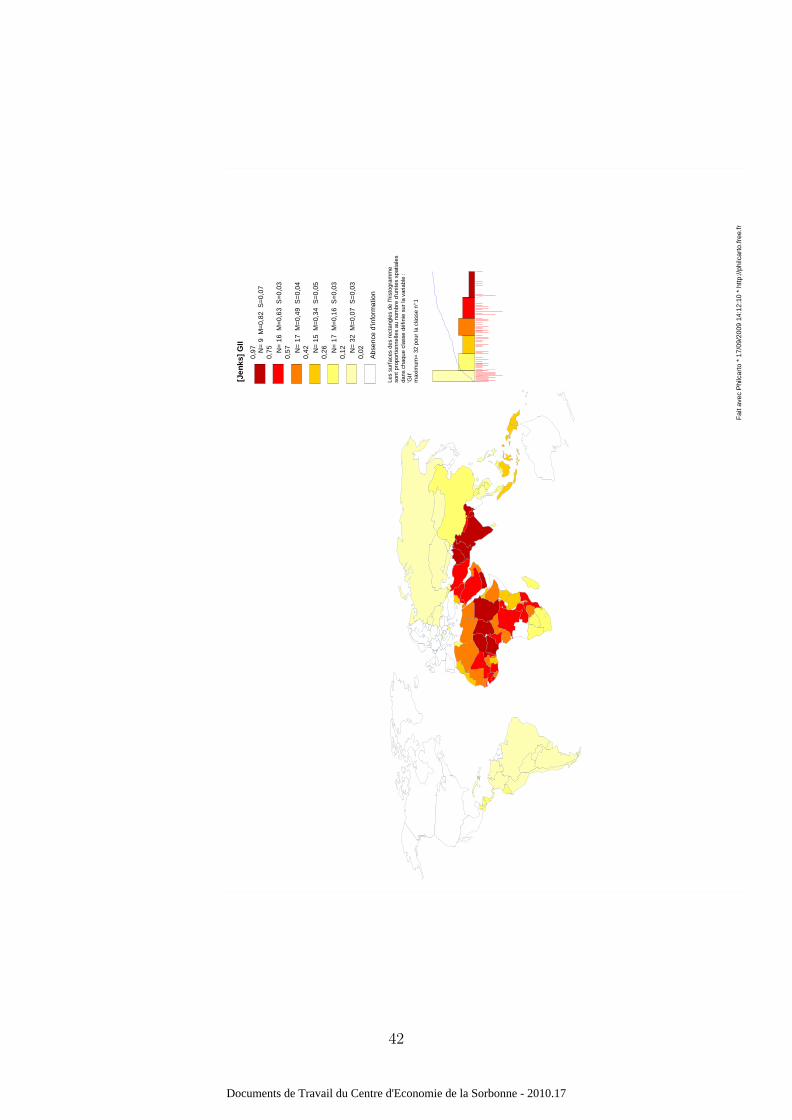
Fai
t ave
c P
hilc
arto
* 1
7/09
/200
9 14
:12:
10 *
http
://ph
ilcar
to.fr
ee.fr
[Jen
ks]
GII
0,97 N
= 9
M=
0,82
S=
0,07
0,75 N
= 1
6 M
=0,
63 S
=0,
03
0,57 N
= 1
7 M
=0,
49 S
=0,
04
0,42 N
= 1
5 M
=0,
34 S
=0,
05
0,26 N
= 1
7 M
=0,
16 S
=0,
03
0,12 N
= 3
2 M
=0,
07 S
=0,
03
0,02
Abs
ence
d'in
form
atio
n
Les
surf
aces
des
rec
tang
les
de l'
hist
ogra
mm
e so
nt p
ropo
rtio
nnel
les
au n
ombr
e d'
unite
s sp
atia
les
dans
cha
que
clas
se d
éfin
ie s
ur la
var
iabl
e :
'GII'
max
imum
= 32
pou
r la
cla
sse
n° 1
42
Documents de Travail du Centre d'Economie de la Sorbonne - 2010.17
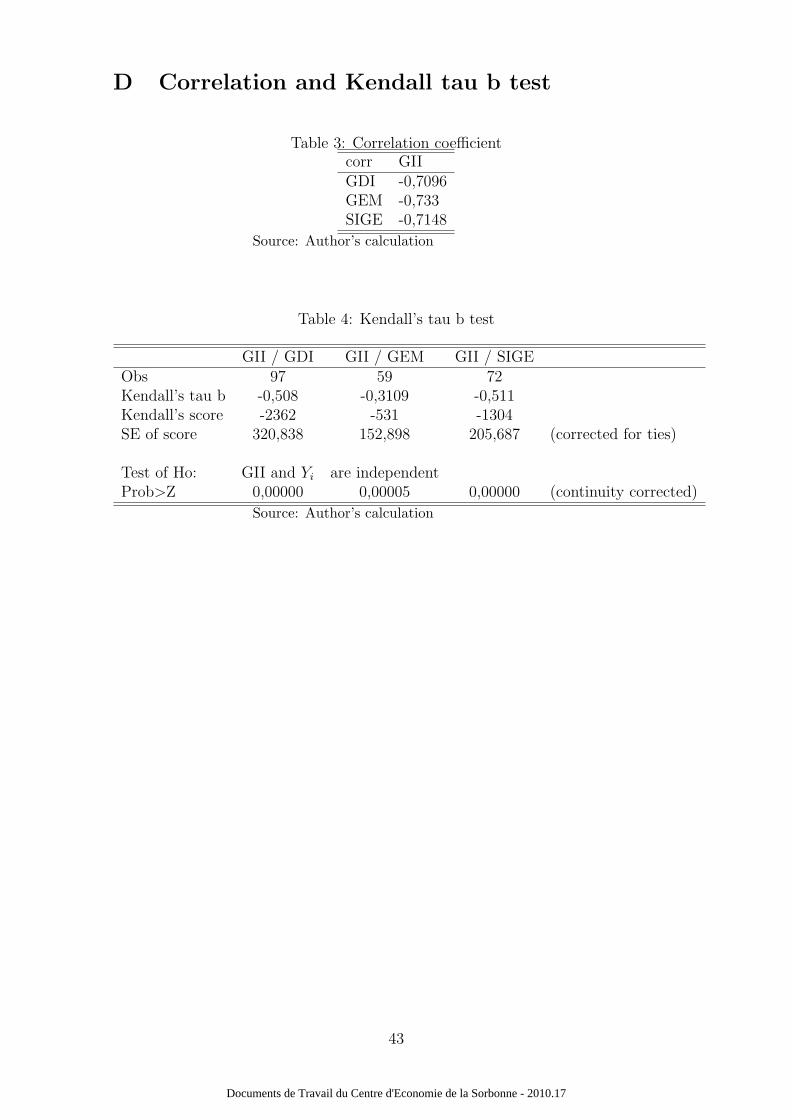
D Correlation and Kendall tau b test
Table 3: Correlation coefficientcorr GIIGDI -0,7096GEM -0,733SIGE -0,7148
Source: Author’s calculation
Table 4: Kendall’s tau b test
GII / GDI GII / GEM GII / SIGEObs 97 59 72Kendall’s tau b -0,508 -0,3109 -0,511Kendall’s score -2362 -531 -1304SE of score 320,838 152,898 205,687 (corrected for ties)
Test of Ho: GII and Yi are independentProb>Z 0,00000 0,00005 0,00000 (continuity corrected)
Source: Author’s calculation
43
Documents de Travail du Centre d'Economie de la Sorbonne - 2010.17