Embed Size (px)
Citation preview
DOCUMENTOS DE TRABAJO
Fiscal Policy, Sectoral Allocation, and the Skill Premium: Explaining the Decline in Latin America’s Income Inequality
Juan Guerra-Salas
N.º 779 Febrero 2016BANCO CENTRAL DE CHILE

BANCO CENTRAL DE CHILE
CENTRAL BANK OF CHILE
La serie Documentos de Trabajo es una publicación del Banco Central de Chile que divulga los trabajos de investigación económica realizados por profesionales de esta institución o encargados por ella a terceros. El objetivo de la serie es aportar al debate temas relevantes y presentar nuevos enfoques en el análisis de los mismos. La difusión de los Documentos de Trabajo sólo intenta facilitar el intercambio de ideas y dar a conocer investigaciones, con carácter preliminar, para su discusión y comentarios.
La publicación de los Documentos de Trabajo no está sujeta a la aprobación previa de los miembros del Consejo del Banco Central de Chile. Tanto el contenido de los Documentos de Trabajo como también los análisis y conclusiones que de ellos se deriven, son de exclusiva responsabilidad de su o sus autores y no reflejan necesariamente la opinión del Banco Central de Chile o de sus Consejeros.
The Working Papers series of the Central Bank of Chile disseminates economic research conducted by Central Bank staff or third parties under the sponsorship of the Bank. The purpose of the series is to contribute to the discussion of relevant issues and develop new analytical or empirical approaches in their analyses. The only aim of the Working Papers is to disseminate preliminary research for its discussion and comments.
Publication of Working Papers is not subject to previous approval by the members of the Board of the Central Bank. The views and conclusions presented in the papers are exclusively those of the author(s) and do not necessarily reflect the position of the Central Bank of Chile or of the Board members.
Documentos de Trabajo del Banco Central de ChileWorking Papers of the Central Bank of Chile
Agustinas 1180, Santiago, ChileTeléfono: (56-2) 3882475; Fax: (56-2) 3882231
Documento de Trabajo
N° 779
Working Paper
N° 779
FISCAL POLICY, SECTORAL ALLOCATION, AND THE
SKILL PREMIUM: EXPLAINING THE DECLINE IN LATIN
AMERICA’S INCOME INEQUALITY
Juan Guerra-Salas
Banco Central de Chile
Abstract
This paper offers an explanation for the substantial decline in income inequality in Latin America
during the 2000s, which is known to have been mainly driven by a decline in the skill premium. The
2000s were characterized by an economic expansion concentrated on low-skill-intensive service
sectors. The expansion induced an increase in the demand for low-skilled labor relative to high-
skilled labor, which compressed the skill premium. Procyclical fiscal policy exacerbated the
distributional effects of the boom by contributing to the growth of the service sector. I first document
the expansion was concentrated on services while manufacturing lagged behind, and show declining
inequality is associated with procyclical fiscal policy. I then rationalize the evidence using a small
open economy DSGE model that features a low-skill-intensive nontradable sector relative to the
tradable sector, and procyclical government purchases. This framework implies that at least part of
the decline in inequality is transitory, a prediction supported by recent data.
Resumen
Este artículo ofrece una explicación para la sustancial reducción de la desigualdad del ingreso en
América Latina durante los años 2000, la cual se sabe asociada a una reducción de la brecha salarial
entre trabajadores calificados y poco calificados. Los años 2000 se caracterizaron por una expansión
económica concentrada en sectores de servicios intensivos en trabajo poco calificado. Esta expansión
generó un aumento en la demanda por trabajo poco calificado respecto al trabajo calificado, lo que
comprimió la brecha salarial entre los dos tipos de trabajadores. Una política fiscal procíclica
exacerbó los efectos distributivos del auge al contribuir al crecimiento del sector servicios. En primer
lugar muestro que la expansión latinoamericana se concentró en servicios, mientras el sector
manufacturero se mantuvo rezagado, y que la caída en la desigualdad está asociada a una política
fiscal procíclica. En segundo lugar utilizo un modelo dinámico estocástico de equilibrio general
(DSGE por sus siglas en inglés) de una economía pequeña y abierta para racionalizar la evidencia
empírica. El modelo contempla un sector no transable intensivo en trabajo poco calificado respecto
al sector transable, y compras públicas procíclicas. Este marco analítico implica que al menos parte
de la caída de la desigualdad es transitoria. Datos recientes soportan esta predicción.
I thank Bart Moore and Johanna Francis for detailed suggestions, and Emiliano Luttini and participants at Sociedad de
Economía de Chile for comments. The views in this document are those of the author and do not represent official positions
of the Central Bank of Chile or its Board members. Email: [email protected].
1 Introduction
At least since the �rst half of the 20th century, Latin America has been the most unequal
region in the world (Williamson (2009)). It is well known, however, that income inequality
declined substantially during the 2000s, and that it was mainly driven by a decline in the
skill premium.1 Figure 1 shows the average annual percent change in the Gini coe�cient for
16 Latin American and Caribbean countries between 2000 and 2010. All countries, except
Costa Rica, experienced a sustained decline in income inequality during this period. A
simple average across countries suggests inequality fell at a rate of 0.9 percent per year in
the region.2 This was not the case before the 2000s. Gasparini and Lustig (2011) document
rising inequality during the 1980s and 1990s, and a reversal during the 2000s. Figure 2 shows
the evolution of Gini coe�cient estimates of pre-tax, pre-transfer income in six countries
between 1990 and 2012. Inequality declined signi�cantly throughout the 2000s in most of
them, while it remained stable or increased throughout the 1990s.
This paper o�ers the following explanation for Latin America's declining income inequal-
ity during the 2000s. This period was characterized by an economic expansion concentrated
on low-skill-intensive service sectors. The expansion induced an increase in the demand for
low-skilled labor relative to high-skilled labor, which compressed the skill premium. Pro-
cyclical �scal policy exacerbated the distributional e�ects of the expansion by contributing
to the growth of the service sector.
I document three features of the Latin American economy during the 2000s. First,
it experienced an economic expansion concentrated on low-skill-intensive services, whereas
sectors such as manufacturing lagged behind. Second, the real exchange rate appreciated.
And third, there is an inverse relation between income inequality and �scal procyclicality
1A large microeconometric literature �nds that a decline in the skill premium is the most important driverof the decline in income inequality in the 2000s. See, for example, Lustig, L�opez-Calva, and Ortiz-Ju�arez(2013), and the essays collected in the volume edited by L�opez-Calva and Lustig (2010).
2The decline in income inequality in the 2000s is robust to other measures. Cord et al. (2014) document adecline in income inequality using growth incidence curves, income concentration indicators, the Theil indexof inequality, the mean log deviation, the ratio between the 90th and the 10th percentile, and the Atkinsonindex.
1
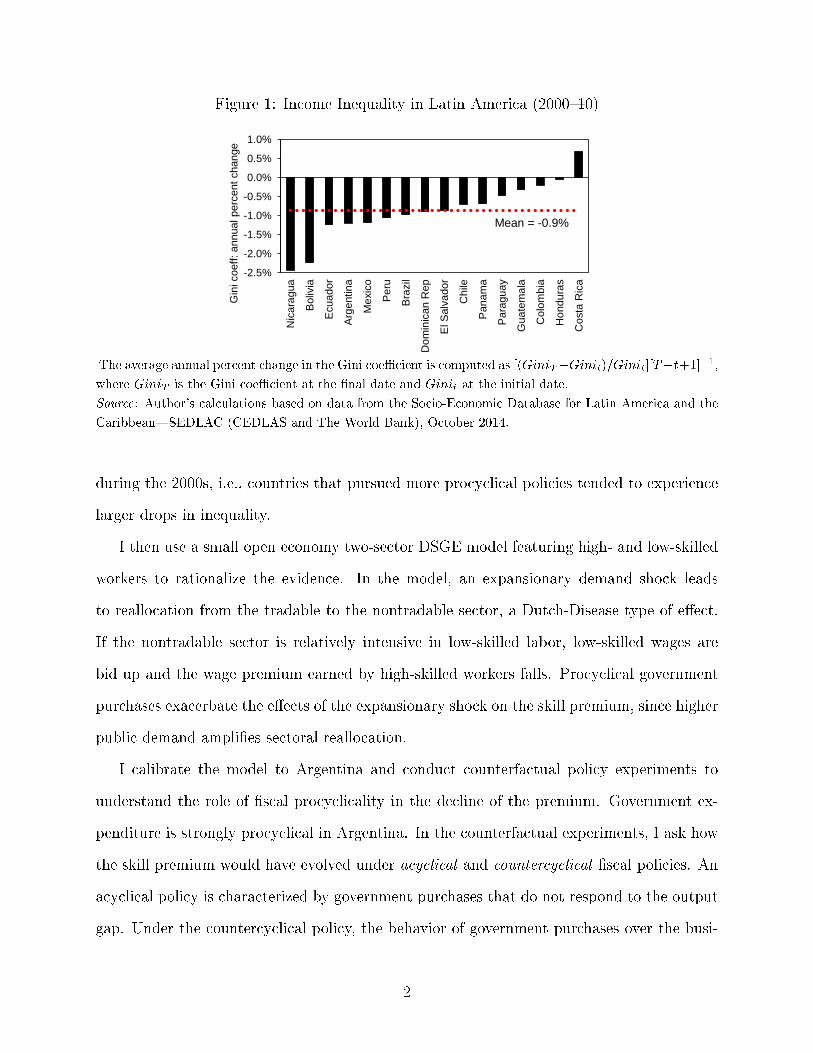
Figure 1: Income Inequality in Latin America (2000{10)
-2.5%
-2.0%
-1.5%
-1.0%
-0.5%
0.0%
0.5%
1.0%
Nic
ara
gua
Boliv
ia
Ecu
ado
r
Arg
entina
Me
xic
o
Peru
Bra
zil
Do
min
ican
Rep
El S
alv
ador
Ch
ile
Pana
ma
Para
gu
ay
Gua
tem
ala
Co
lom
bia
Ho
ndu
ras
Co
sta
Ric
a
Gin
i coeff
: annual perc
ent
change
Mean = -0.9%
The average annual percent change in the Gini coe�cient is computed as [(GiniT�Ginit)=Ginit][T�t+1]�1,
where GiniT is the Gini coe�cient at the �nal date and Ginit at the initial date.
Source: Author's calculations based on data from the Socio-Economic Database for Latin America and the
Caribbean|SEDLAC (CEDLAS and The World Bank), October 2014.
during the 2000s, i.e., countries that pursued more procyclical policies tended to experience
larger drops in inequality.
I then use a small open economy two-sector DSGE model featuring high- and low-skilled
workers to rationalize the evidence. In the model, an expansionary demand shock leads
to reallocation from the tradable to the nontradable sector, a Dutch-Disease type of e�ect.
If the nontradable sector is relatively intensive in low-skilled labor, low-skilled wages are
bid up and the wage premium earned by high-skilled workers falls. Procyclical government
purchases exacerbate the e�ects of the expansionary shock on the skill premium, since higher
public demand ampli�es sectoral reallocation.
I calibrate the model to Argentina and conduct counterfactual policy experiments to
understand the role of �scal procyclicality in the decline of the premium. Government ex-
penditure is strongly procyclical in Argentina. In the counterfactual experiments, I ask how
the skill premium would have evolved under acyclical and countercyclical �scal policies. An
acyclical policy is characterized by government purchases that do not respond to the output
gap. Under the countercyclical policy, the behavior of government purchases over the busi-
2
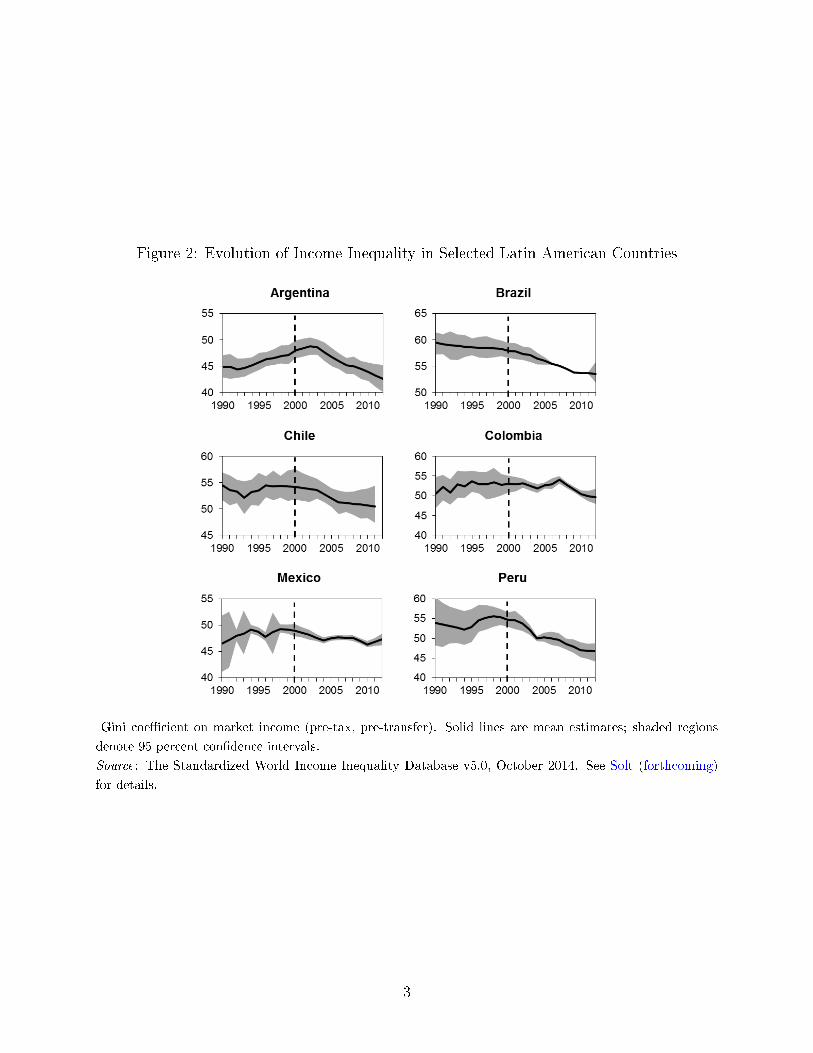
Figure 2: Evolution of Income Inequality in Selected Latin American Countries
Gini coe�cient on market income (pre-tax, pre-transfer). Solid lines are mean estimates; shaded regions
denote 95 percent con�dence intervals.
Source: The Standardized World Income Inequality Database v5.0, October 2014. See Solt (forthcoming)
for details.
3
ness cycle mimics that in Chile, a Latin American country that follows a structural balance
�scal rule that leads to countercyclical policy.3 I �nd that the skill premium would have
declined substantially less under an acyclical policy, and even less under the countercyclical
policy. The cumulative response of the premium to an expansionary shock, 10 quarters after
it hits the economy, is 40 percent smaller under the countercyclical policy than under the
procyclical policy in the baseline calibration.
This paper appeals to cyclical forces to explain Latin America's declining inequality.
Therefore, it implies that inequality should increase, or at least decline at a slower rate,
during an economic downturn. Recent data support this prediction. Since about 2012,
inequality has stagnated in Latin America at the same time that growth in the region has
slowed. This phenomenon has been thoroughly documented by Cord et al. (2014) and World
Bank (2014).
The rest of the paper is organized as follows. The next section reviews the related
literature. Section 3 documents three features of the Latin American economy during the
2000s. Section 4 spells out a small open economy DSGE model that can rationalize the
evidence. I discuss the calibration of the model in section 5, and put the model to work in
section 6, in which I study the role of sectoral allocation and alternative �scal policy rules
on the evolution of the skill premium. Section 7 concludes.
2 Related Literature
This paper is related to four strands of the economic literature. The �rst is the literature on
the e�ects of allocation among the tradable and nontradable sectors. Reallocation among
the two sectors is central to the explanation macroeconomic phenomena such as the so-called
Dutch disease (Corden and Neary (1982), Corden (1984)), the role of terms-of-trade shocks
as drivers of business cycles (Mendoza (1995)), and the macroeconomic e�ects of capital
3For analyses of the Chilean �scal rule, see Medina and Soto (2007), Frankel (2013), and Kumhof andLaxton (2009).
4
in ows (Benigno, Converse, and Fornaro (2015)). Little is known, however, about its role in
explaining distributional issues. In the DSGE model developed in this paper, a shock that
induces reallocation among the two sectors has an important e�ect on the skill premium, and
by extension, on income inequality. Di�erent skill intensities in the tradable and nontradable
sectors lie at the heart of this e�ect. Other papers in which sectoral reallocation a�ects
income distribution include Galiani, Heymann, and Magud (2010), and Coble and Magud
(2010).
The second strand of the literature related to this paper studies the cyclical e�ects of
�scal policy. It has established, for example, that policy is mostly procyclical in developing
countries, Latin American in particular, whereas it is acyclical or countercyclical in devel-
oped countries (Gavin and Perotti (1997), Frankel, V�egh, and Vuletin (2013), Ilzetzki and
V�egh (2008)). It also features ample research on the ability of countercyclical �scal policy
to mitigate cycles (Hall (2009), Leeper, Walker, and Yang (2010), Medina and Soto (2007)),
including under liquidity-trap conditions (Christiano, Eichenbaum, and Rebelo (2011), Eg-
gertsson (2010)). But the role of the cyclical stance of �scal policy on the evolution of
income inequality at business cycle frequencies has been scarcely explored; Lim and McNelis
(2013) is an exception. In this paper, procyclical �scal policy ampli�es the e�ect of aggregate
demand shocks on the skill premium, and thus, on income inequality.
The paper is also related to a literature on the business cycle and income inequality
focused on the United States.4 It establishes that inequality data display uctuations at
business cycle frequencies and develops models to �t the data (Casta~neda, D��az-Gim�enez, and
R��os-Rull (1998), Maliar, Maliar, and Mora (2005), Barlevy and Tsiddon (2006)). Lindquist
(2004) studies the evolution of the skill premium over the U.S. business cycle using a DSGE
model that features capital-skill complementarity. I study the evolution of the skill premium
in Latin America during the booming 2000s using a two-sector DSGE model.
A recent literature, primarily microeconometric, analyzes the drivers behind the decline
4Garc��a and P�erez-N�u~nez (2015) o�er an empirical analysis of income inequality over the business cyclefor the case of Chile.
5
in income inequality in Latin America during the 2000s. A common �nding is that labor
income, as opposed to other sources such as government transfers, remittances, and pensions,
drives the decline in inequality. More speci�cally, this literature �nds that the skill premium
is the key driver. Azevedo, Inchauste, and Sanfelice (2013b) estimate that labor income
accounts for 54 percent of the fall in income inequality, whereas transfers explain 21 percent.
Azevedo et al. (2013a), Gasparini et al. (2011), Tsounta and Osueke (2014), and many other
authors then argue that the falling skill premium is the cause of the equalizing e�ect of
labor income, as opposed, for example, to a more equal distribution of skills. I contribute
to this literature with a macroeconomic general equilibrium perspective that sheds light on
the underlying sources of the decline in the skill premium.
The declining skill premium plays a paramount role in Latin America's declining inequal-
ity. In this paper, it is mainly driven by an increase in the relative demand for low-skilled
workers. There is no consensus, however, on the forces behind the decline in the premium.5
Gasparini et al. (2011) apply the seminal microeconometric framework due to Katz and Mur-
phy (1992) to Latin America and �nd that demand factors explain most of the decline in
the skill premium in the 2000s, as opposed to supply factors such as educational upgrading.
There is a limited discussion on the e�ect of the business cycle on the shifts in labor demand.
Gasparini et al. (2011) �nd a negative relation between the terms of trade and the skill pre-
mium, which is consistent with a boom fueled by favorable commodity prices during which
income inequality declines. Galiani, Heymann, and Magud (2010) and Coble and Magud
(2010) consider the role of di�erent skill intensities across sectors as a channel through which
changes in the terms of trade a�ect the skill premium. Consistently with my framework,
their analysis implies that positive terms-of-trade shocks that favor the nontradable sector
at the expense of the tradable sector (a Dutch disease-type e�ect) would lead to a decline
in the skill premium if the nontradable sector is relatively more intensive in low-skilled la-
bor. Distinguishing features of my framework are that I study a dynamic model, and that
5See Lustig, L�opez-Calva, and Ortiz-Ju�arez (2013) for a discussion of this lack of consensus.
6
I consider the role of �scal policy as a mechanism that propagates the distributional e�ects
of macroeconomic shocks.
This paper focuses on the role of varying skill intensities across tradable and nontradable
sectors, but there are other factors that could a�ect the demand for labor of di�erent skill
levels. One such factor is technological change associated with trade liberalizations. It is
possible, for instance, that the wave of trade liberalization that swept Latin America in the
1990s induced skill-biased technical change by facilitating access to capital goods, inducing
an increase in the skill premium, and that the demand for high-skilled workers receded in
the 2000s as the gains from liberalization were realized. Papers that study the e�ect of trade
policy on the skill premium include Galiani and Porto (2010), Acosta and Gasparini (2007),
and Galiani and Sanguinetti (2003), among others.
A group of papers argues that the fall in Latin America's skill premium is mainly driven by
an increase in the supply of high-skilled labor due to the expansion of educational enrollment
and attainment, perhaps as a result of higher public investment in education (Azevedo et al.
(2013a), Tsounta and Osueke (2014), Cruces, Garc��a Domenech, and Gasparini (2011)). It
is likely, of course, that supply-side factors play a role in the declining premium, but it is
di�cult to explain the recent reversal towards higher inequality without appealing to demand
factors.
3 Evidence
This section documents three key features of the Latin American economy consistent with
the hypothesis that sectoral allocation and procyclical �scal policy contributed to the decline
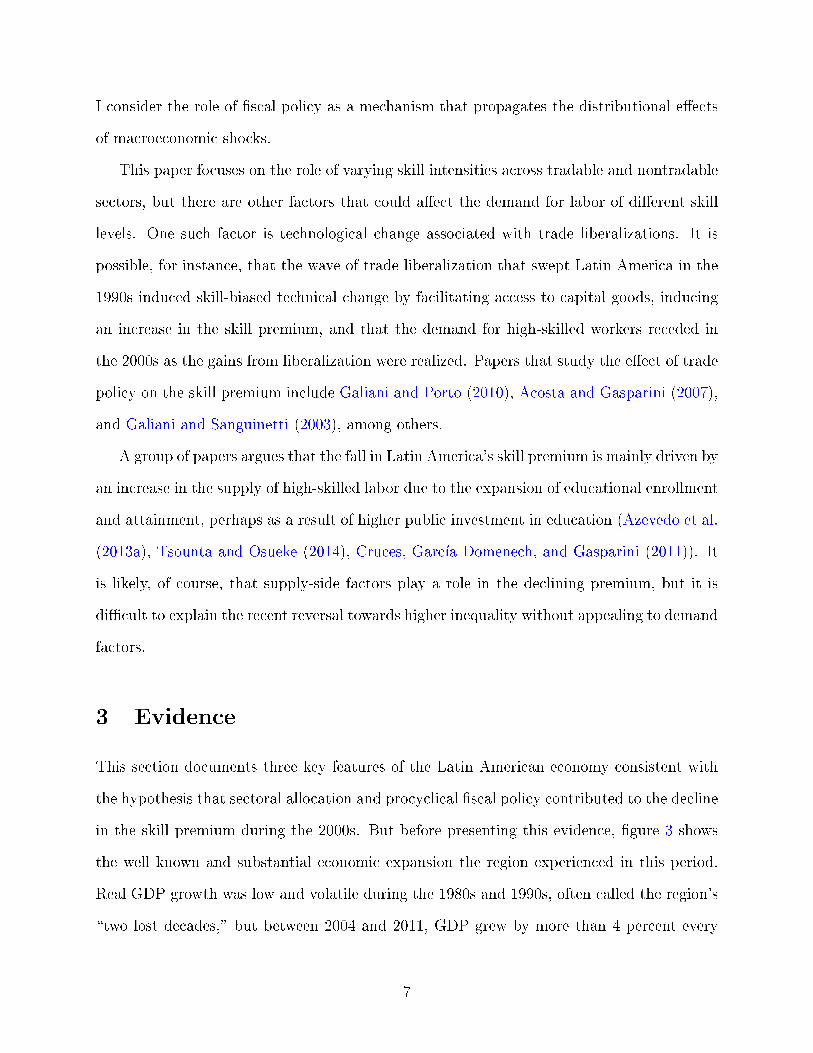
in the skill premium during the 2000s. But before presenting this evidence, �gure 3 shows
the well known and substantial economic expansion the region experienced in this period.
Real GDP growth was low and volatile during the 1980s and 1990s, often called the region's
\two lost decades," but between 2004 and 2011, GDP grew by more than 4 percent every
7
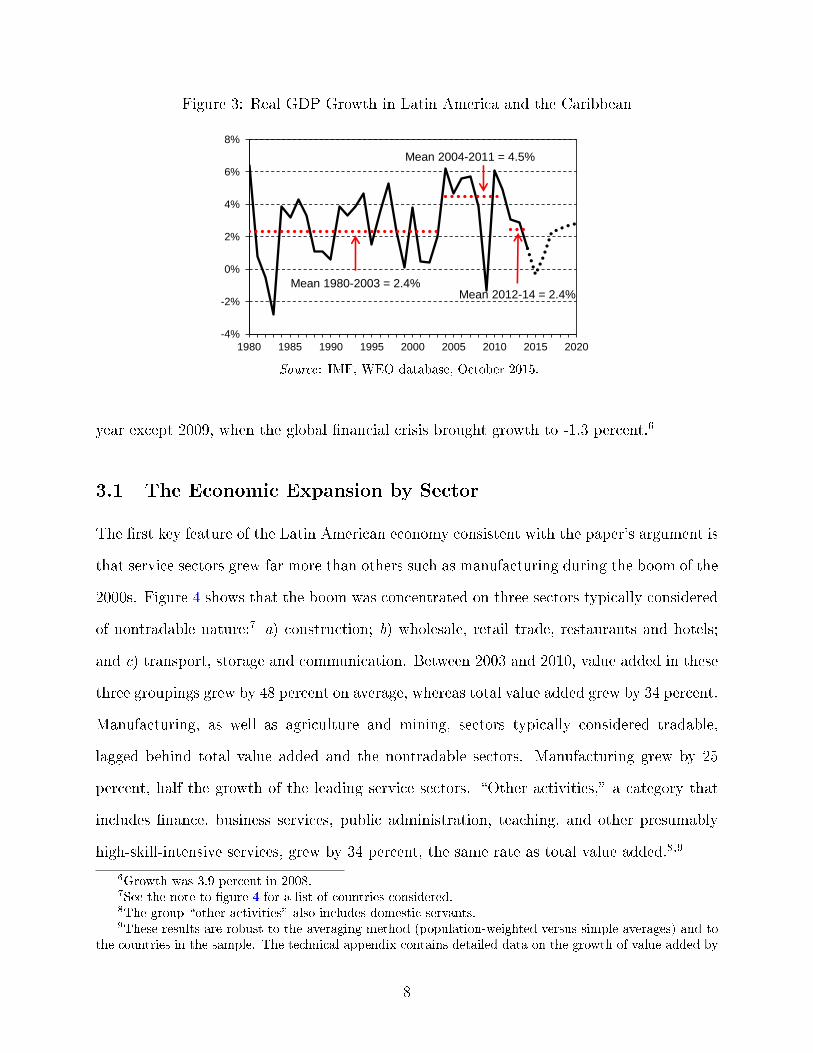
Figure 3: Real GDP Growth in Latin America and the Caribbean
-4%
-2%
0%
2%
4%
6%
8%
1980 1985 1990 1995 2000 2005 2010 2015 2020
Mean 1980-2003 = 2.4%
Mean 2004-2011 = 4.5%
Mean 2012-14 = 2.4%
Source: IMF, WEO database, October 2015.
year except 2009, when the global �nancial crisis brought growth to -1.3 percent.6
3.1 The Economic Expansion by Sector
The �rst key feature of the Latin American economy consistent with the paper's argument is
that service sectors grew far more than others such as manufacturing during the boom of the
2000s. Figure 4 shows that the boom was concentrated on three sectors typically considered
of nontradable nature:7 a) construction; b) wholesale, retail trade, restaurants and hotels;
and c) transport, storage and communication. Between 2003 and 2010, value added in these
three groupings grew by 48 percent on average, whereas total value added grew by 34 percent.
Manufacturing, as well as agriculture and mining, sectors typically considered tradable,
lagged behind total value added and the nontradable sectors. Manufacturing grew by 25
percent, half the growth of the leading service sectors. \Other activities," a category that
includes �nance, business services, public administration, teaching, and other presumably
high-skill-intensive services, grew by 34 percent, the same rate as total value added.8,9
6Growth was 3.9 percent in 2008.7See the note to �gure 4 for a list of countries considered.8The group \other activities" also includes domestic servants.9These results are robust to the averaging method (population-weighted versus simple averages) and to
the countries in the sample. The technical appendix contains detailed data on the growth of value added by
8
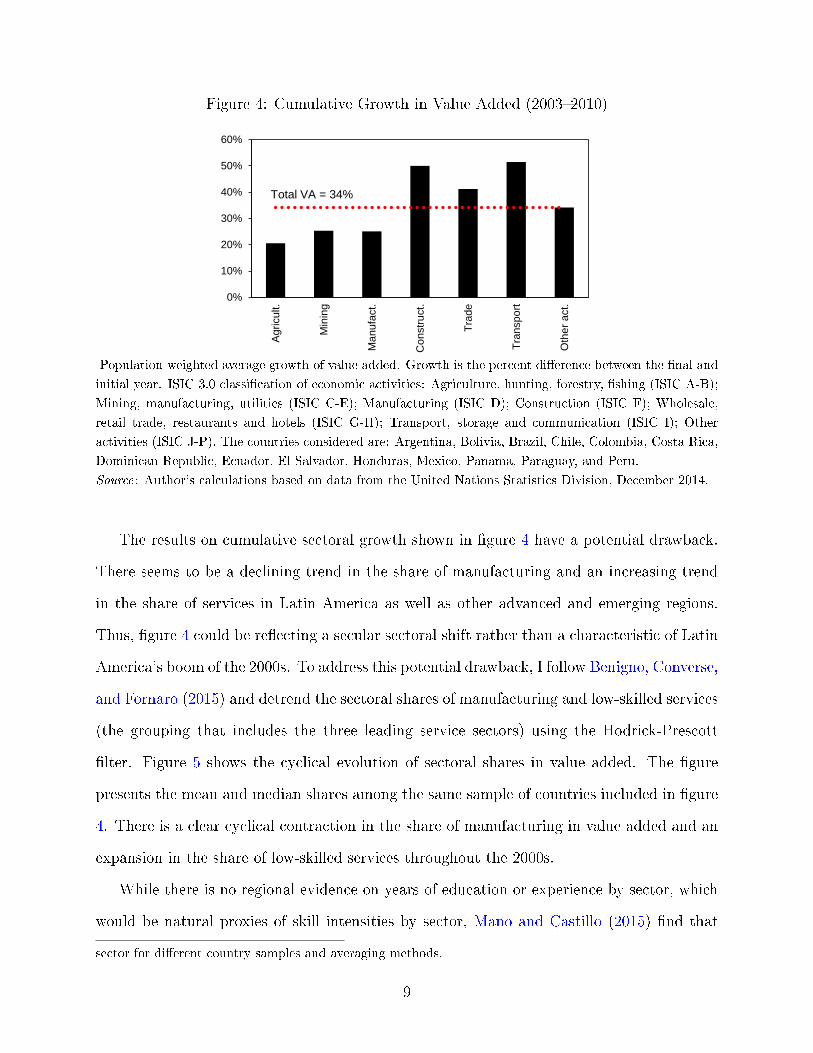
Figure 4: Cumulative Growth in Value Added (2003{2010)
0%
10%
20%
30%
40%
50%
60%
Agricult.
Min
ing
Ma
nufa
ct.
Co
nstr
uct.
Tra
de
Tra
nspo
rt
Oth
er
act.
Total VA = 34%
Population-weighted average growth of value added. Growth is the percent di�erence between the �nal and
initial year. ISIC 3.0 classi�cation of economic activities: Agriculture, hunting, forestry, �shing (ISIC A-B);
Mining, manufacturing, utilities (ISIC C-E); Manufacturing (ISIC D); Construction (ISIC F); Wholesale,
retail trade, restaurants and hotels (ISIC G-H); Transport, storage and communication (ISIC I); Other
activities (ISIC J-P). The countries considered are: Argentina, Bolivia, Brazil, Chile, Colombia, Costa Rica,
Dominican Republic, Ecuador, El Salvador, Honduras, Mexico, Panama, Paraguay, and Peru.
Source: Author's calculations based on data from the United Nations Statistics Division, December 2014.
The results on cumulative sectoral growth shown in �gure 4 have a potential drawback.
There seems to be a declining trend in the share of manufacturing and an increasing trend
in the share of services in Latin America as well as other advanced and emerging regions.
Thus, �gure 4 could be re ecting a secular sectoral shift rather than a characteristic of Latin
America's boom of the 2000s. To address this potential drawback, I follow Benigno, Converse,
and Fornaro (2015) and detrend the sectoral shares of manufacturing and low-skilled services
(the grouping that includes the three leading service sectors) using the Hodrick-Prescott
�lter. Figure 5 shows the cyclical evolution of sectoral shares in value added. The �gure
presents the mean and median shares among the same sample of countries included in �gure
4. There is a clear cyclical contraction in the share of manufacturing in value added and an
expansion in the share of low-skilled services throughout the 2000s.
While there is no regional evidence on years of education or experience by sector, which
would be natural proxies of skill intensities by sector, Mano and Castillo (2015) �nd that
sector for di�erent country samples and averaging methods.
9
Figure 5: Cyclical Evolution of Sectoral Shares in Value Added
-1.5%
0.0%
1.5%
3.0%
2000 2002 2004 2006 2008 2010 2012
Manufacturing
Mean
Median
-3.0%
-1.5%
0.0%
1.5%
3.0%
2000 2002 2004 2006 2008 2010 2012
Low-Skilled Services
Mean
Median
Mean and median evolution of sectoral shares in value added in 14 countries (see note to �gure 4 for the
list of countries). Log deviations from HP trend (� = 100). Low-skilled services include (ISIC 3.0 codes in
parenthesis): Construction (F); wholesale, retail trade, restaurants and hotels (G-H); transport, storage and
communication (I).
Source: Author's calculations based on data from the United Nations Statistics Division, December 2014.
10
labor productivity, de�ned as real value added per worker, is substantially higher in the
tradable sector than in the nontradable sector, in Latin America and other regions. More
productive workers are likely to be more skilled, so it is reasonable to believe that the
nontradable sector is relatively more intensive in low-skilled labor.10,11
3.2 The Real Exchange Rate
Growth concentration in the nontradable service sector is a Dutch-Disease type of phe-
nomenon that would presumably be associated to a real exchange rate appreciation. Figure
6 shows this was indeed the case in Latin America during the 2000s. It shows average real
exchange rates (simple and population-weighted averages) for a group of Latin American
countries in solid lines, and red trend lines for the period 2003:M1{2010:M12. The left
column of the �gure shows real exchange indices with respect to the US, whereas the right
column shows multilateral indices. All four panels suggest the real exchange rate appreciated
during the 2000s, with stronger appreciations in bilateral terms against the US.
3.3 The Relation Between Fiscal Procyclicality and Inequality
A third key feature of Latin America's economy is that there is an inverse relation between
�scal procyclicality and income inequality among countries in the region. Countries that
pursued a more procyclical �scal policy tended to experience a sharper decline in income
inequality. Figure 7 plots the average annual percent change in the Gini coe�cient against
the correlation coe�cient between the cyclical components of government expenditure and
10Mano and Castillo (2015) �nd productivity in the tradable sector is about 35{50 percent higher than inthe nontradable sector in Latin America, depending on the classi�cation of industries as traded/nontraded.These results consider data for Argentina, Brazil, Chile, and Mexico.
11It is possible, of course, that workers in the tradable sector are more productive because they haveaccess to more and/or better capital while being less skilled than their counterparts in the nontradablesector. This is unlikely, however, in light of the evidence on \capital-skill complementarity," the idea thatmore advanced equipment is relatively more complementary to high-skilled than low-skilled workers. SeeKrusell et al. (2000) for an important application to the U.S. and Du�y, Papageorgiou, and Perez-Sebastian(2004) for evidence on a panel of developed and developing countries.
11
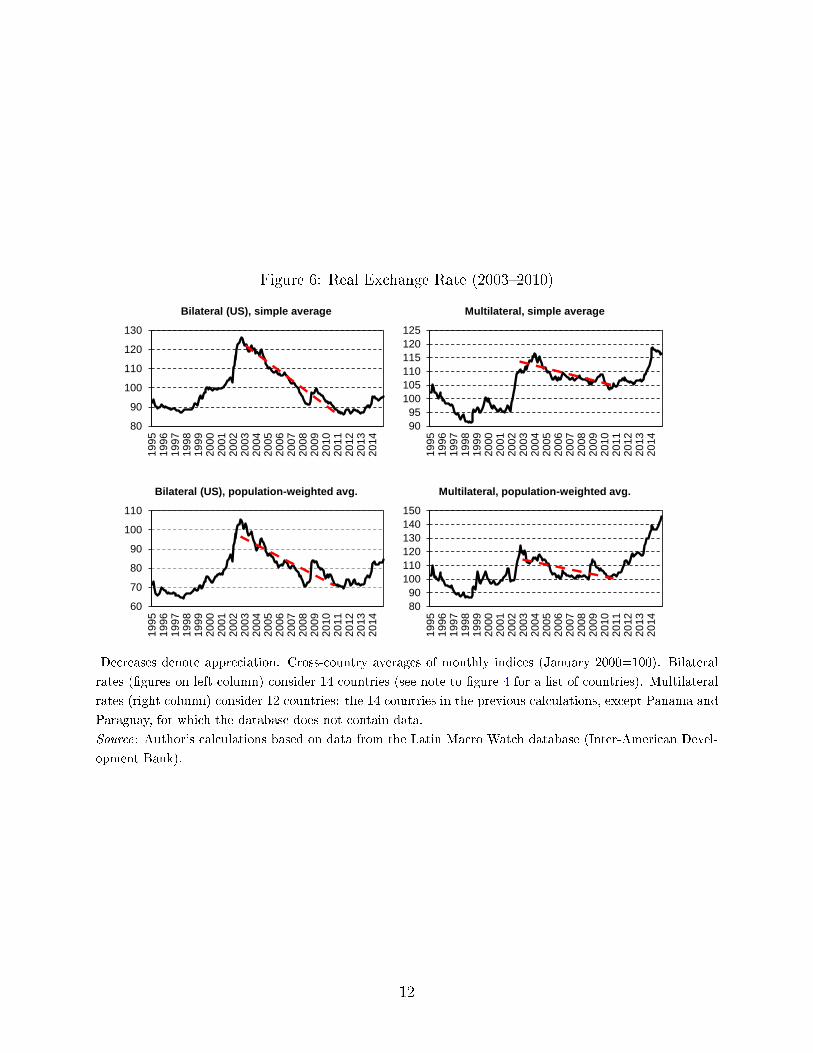
Figure 6: Real Exchange Rate (2003{2010)
80
90
100
110
120
130
19
95
19
96
19
97
19
98
19
99
20
00
20
01
20
02
20
03
20
04
20
05
20
06
20
07
20
08
20
09
20
10
20
11
20
12
20
13
20
14
Bilateral (US), simple average
90
95
100
105
110
115
120
125
19
95
19
96
19
97
19
98
19
99
20
00
20
01
20
02
20
03
20
04
20
05
20
06
20
07
20
08
20
09
20
10
20
11
20
12
20
13
20
14
Multilateral, simple average
60
70
80
90
100
110
19
95
19
96
19
97
19
98
19
99
20
00
20
01
20
02
20
03
20
04
20
05
20
06
20
07
20
08
20
09
20
10
20
11
20
12
20
13
20
14
Bilateral (US), population-weighted avg.
80
90
100
110
120
130
140
150
19
95
19
96
19
97
19
98
19
99
20
00
20
01
20
02
20
03
20
04
20
05
20
06
20
07
20
08
20
09
20
10
20
11
20
12
20
13
20
14
Multilateral, population-weighted avg.
Decreases denote appreciation. Cross-country averages of monthly indices (January 2000=100). Bilateral
rates (�gures on left column) consider 14 countries (see note to �gure 4 for a list of countries). Multilateral
rates (right column) consider 12 countries: the 14 countries in the previous calculations, except Panama and
Paraguay, for which the database does not contain data.
Source: Author's calculations based on data from the Latin Macro Watch database (Inter-American Devel-
opment Bank).
12
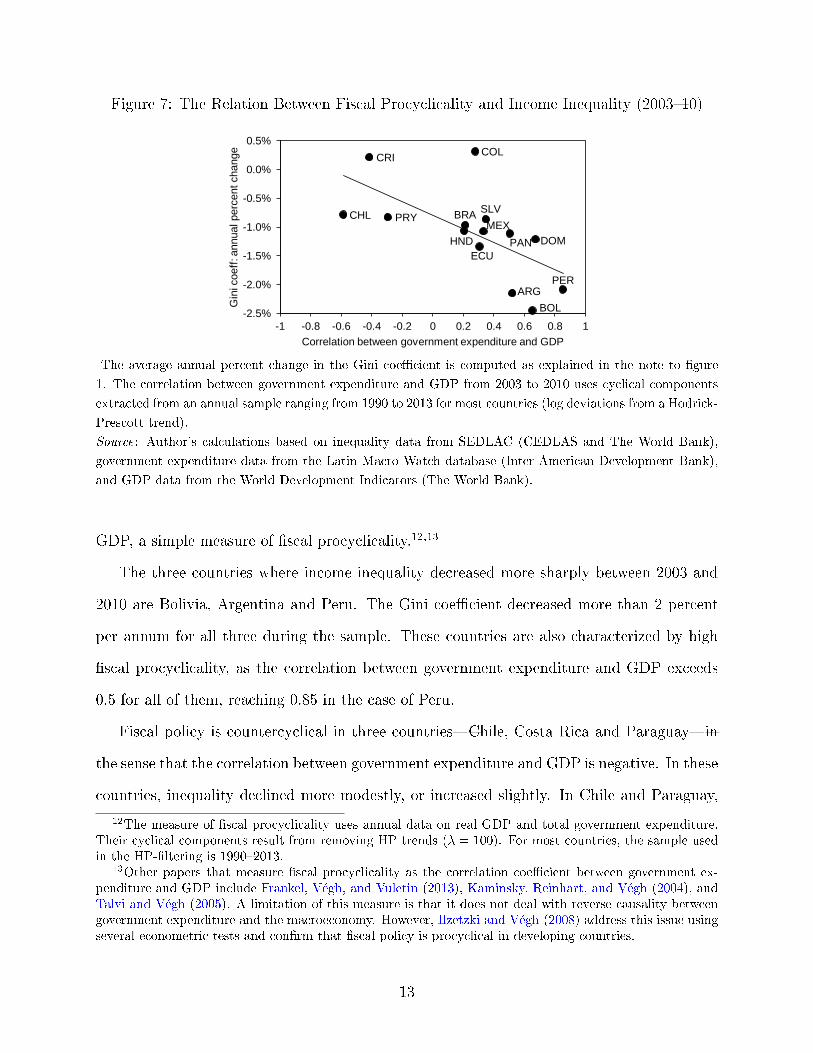
Figure 7: The Relation Between Fiscal Procyclicality and Income Inequality (2003{10)
ARG
BOL
BRA CHL
COL CRI
DOM
ECU
SLV
HND
MEX
PAN
PRY
PER
-2.5%
-2.0%
-1.5%
-1.0%
-0.5%
0.0%
0.5%
-1 -0.8 -0.6 -0.4 -0.2 0 0.2 0.4 0.6 0.8 1
Gin
i coeff
: annual perc
ent change
Correlation between government expenditure and GDP
The average annual percent change in the Gini coe�cient is computed as explained in the note to �gure
1. The correlation between government expenditure and GDP from 2003 to 2010 uses cyclical components
extracted from an annual sample ranging from 1990 to 2013 for most countries (log deviations from a Hodrick-
Prescott trend).
Source: Author's calculations based on inequality data from SEDLAC (CEDLAS and The World Bank),
government expenditure data from the Latin Macro Watch database (Inter-American Development Bank),
and GDP data from the World Development Indicators (The World Bank).
GDP, a simple measure of �scal procyclicality.12,13
The three countries where income inequality decreased more sharply between 2003 and
2010 are Bolivia, Argentina and Peru. The Gini coe�cient decreased more than 2 percent
per annum for all three during the sample. These countries are also characterized by high
�scal procyclicality, as the correlation between government expenditure and GDP exceeds
0.5 for all of them, reaching 0.85 in the case of Peru.
Fiscal policy is countercyclical in three countries|Chile, Costa Rica and Paraguay|in
the sense that the correlation between government expenditure and GDP is negative. In these
countries, inequality declined more modestly, or increased slightly. In Chile and Paraguay,
12The measure of �scal procyclicality uses annual data on real GDP and total government expenditure.Their cyclical components result from removing HP trends (� = 100). For most countries, the sample usedin the HP-�ltering is 1990{2013.
13Other papers that measure �scal procyclicality as the correlation coe�cient between government ex-penditure and GDP include Frankel, V�egh, and Vuletin (2013), Kaminsky, Reinhart, and V�egh (2004), andTalvi and V�egh (2005). A limitation of this measure is that it does not deal with reverse causality betweengovernment expenditure and the macroeconomy. However, Ilzetzki and V�egh (2008) address this issue usingseveral econometric tests and con�rm that �scal policy is procyclical in developing countries.
13
inequality decreased at around 0.8 percent per annum, while it seems to have increased
slightly in Costa Rica.
Most of the countries in the sample feature a moderately procyclical �scal policy, with
a correlation between expenditure and GDP between 0.2 and 0.5, and an average decline of
inequality of 1{1.5 percent per year. Brazil, Ecuador, El Salvador, Mexico, Honduras, and
Panama are in this group. Colombia is an outlier; inequality increased slightly while the
government implemented a moderately procyclical �scal policy.
The inverse relation between �scal procyclicality and income inequality is robust to the
sample period and the sample of countries. The technical appendix documents this relation
holds for 2000{2010 and 2003{2008. It also shows it is robust to a smaller group of countries
that includes the arguably bigger economies of Argentina, Brazil, Chile, Colombia, Mexico,
and Peru.
4 The DSGE Model
This section describes a model consistent with the evidence in the previous section that sheds
light on the role of �scal policy and sectoral allocation on the evolution of the skill premium
over the business cycle. The model is a perfectly competitive small open economy populated
by high-skilled and low-skilled households who supply the labor input used by representative
�rms that produce a tradable and a nontradable good. The nontradable sector is relatively
more intensive in low-skilled labor. The government taxes output at a constant rate and
purchases goods according to a policy rule that can be pro or countercyclical.
4.1 Households
There are high-skilled and low-skilled representative households. Both types of households
have access to the international �nancial market, where they can buy and sell one-period
risk-free foreign bonds. In what follows, individual variables are in lower case; aggregate
14
variables in upper case.
Households choose consumption and labor e�ort to maximize the expected present-
discounted value of lifetime utility:
Maxci;t;ni;t
Et
1Xj=0
�jubt+jv(ci;t+j;ni;t+j), (1)
for i = fH;Lg, where H refers to high-skilled households and L to low-skilled households.
ci;t is a consumption bundle of tradable and nontradable goods, and ni;t is the number of
hours worked by household i. � is the discount factor, and ubt is a preference shifter that is
common across households and evolves according to an exogenous stochastic process:
ln(ubt) = �bln(ubt�1) + �bt , (2)
where �b 2 (�1; 1), and �bt � i:i:d:(0; �2b ) is a preference shock. A positive shock to �bt
induces households to be temporarily more impatient, which creates an incentive to increase
consumption and reduce savings (or accumulate debt). I use this preference shock to drive
an economic expansion in the model. This simple way of generating a positive demand
disturbance can be interpreted as a reduced-form counterpart to a benign shock to the
country interest rate premium, which has been found to be an important driver of business
cycles in emerging countries, and Latin American ones in particular.14
I assume preferences are of the GHH form:15
v(ci;t;ni;t) =
�ci;t �
1!(ni;t)
!�1��
1� �,
where � > 0 is the coe�cient of relative risk aversion, and ! > 1 governs the wage elasticity
of labor supply, given by (1=!�1). The consumption aggregator ci;t is a constant elasticity of
substitution (CES) function that includes tradable and nontradable goods, denoted cxi;t and
14See, for example, Neumeyer and Perri (2005), Uribe and Yue (2006), and Fern�andez, Gonz�alez, andRodr��guez (2015).
15This preference speci�cation is due to Greenwood, Hercowitz, and Hu�man (1988).
15
czi;t, respectively:
ci;t =h'
1
�
�czi;t���1
� + (1� ')1
�
�cxi;t���1
�
i �
��1
. (3)
The parameter ' 2 (0; 1) governs the share of nontradables in the consumption basket
(it is typically called a measure of \home bias"), and � > 0 is the constant elasticity of
substitution between tradables and nontradables. The price of this basket is given by:
pi;t =�' (pz;t)
1�� + (1� ')� 1
1�� , (4)
where pz;t is the relative price of the nontradable good. The tradable good is the numeraire,
so its price is assumed to be equal to one and to obey the law of one price. The price index
pi;t, as well as the following demand schedules for tradable and nontradable goods, can be
obtained by solving the problem of consumption maximization subject to a given level of
expenditures:
czi;t = '
�pz;tpi;t
���
ci;t, (5)
cxi;t = (1� ')
�1
pi;t
���
ci;t. (6)
In addition to purchasing tradable and nontradable goods, households receive a wage in
exchange for labor services, are able to issue foreign one-period debt denominated in units
of the tradable good, and pay lump-sum taxes. Therefore, the period-by-period budget
constraint is given by:
pi;tci;t + (1 + ri;t)di;t = wi;tni;t + di;t+1 � Tt, (7)
where di;t is the stock of foreign debt held by household i at the beginning of period t, which
carries an interest rate ri;t, wi;t is the real wage, and Tt denotes a lump-sum tax payment,
16
which is constant across households.
To close the open economy, I assume the foreign interest rate is debt elastic:
ri;t = r + � (e~di;t�di � 1), (8)
where r is the world interest rate, > 0 governs the intensity of the interest rate premium,
~di;t is the cross-sectional average of debt among households of type i, which each household
takes as exogenous, and di is its steady state level.16
Utility maximization results in standard optimality conditions:
(ni;t)!�1 =
wi;t
pi;t, (9)
�ci;t �
1
!(ni;t)
!
���
= �Et
(ubt+1
ubt
�ci;t+1 �
1
!(ni;t+1)
!
���
pi;tpi;t+1
(1 + ri;t+1)
). (10)
Equation (9) is a labor supply schedule. Importantly, GHH preferences imply that labor
supply is solely a function of the real wage, and in particular, there are no wealth e�ects on
labor supply. Equation (10) is the household's intertemporal optimality condition.
4.2 Aggregation
Consumption aggregates and total private foreign debt are given by the following expressions:
Ct = cH;t + cL;t, (11)
Czt = czH;t + czL;t, (12)
16A debt-elastic interest rate premium is one of several methods that ensure foreign debt is stationary.See Schmitt-Groh�e and Uribe (2003).
17
Cxt = cxH;t + cxL;t, (13)
Dt = dH;t + dL;t. (14)
4.3 Firms
Competitive representative �rms in each sector choose high-skilled and low-skilled labor
to maximize pro�ts. Both �rms produce output according to a constant returns to scale
Cobb-Douglas technology. The government taxes income received by �rms at a rate � > 0.
Therefore, the tradable �rm faces the following problem:
MaxNxH;t
;NxL;t
�xt = (1� �)Y x
t � wH;tNxH;t � wL;tN
xL;t, (15)
Y xt = Ax
�NxH;t
��x �NxL;t
�1��x, (16)
where Y xt is tradable output, Ax is a time-invariant total factor productivity index, Nx
H;t is
the quantity of high-skilled hours employed in the tradable sector, NxL;t is the quantity of
low-skilled hours, and �x is the output elasticity of high-skilled labor in the tradable sector.17
Similarly, the �rm that produces the nontradable good faces the following problem:
MaxNzH;t
;NzL;t
�zt = (1� �)pz;tY
zt � wH;tN
zH;t � wL;tN
zL;t, (17)
Y zt = Az
�N zH;t
��z �N zL;t
�1��z. (18)
17The Cobb-Douglas production function (16) implies that the elasticity of substitution between high-and low-skilled labor is equal to one. Du�y, Papageorgiou, and Perez-Sebastian (2004) o�er estimates thatrange from 1.3 to 10 as a by-product of their empirical analysis of capital-skill complementarity in a panelof developed and developing countries.
18
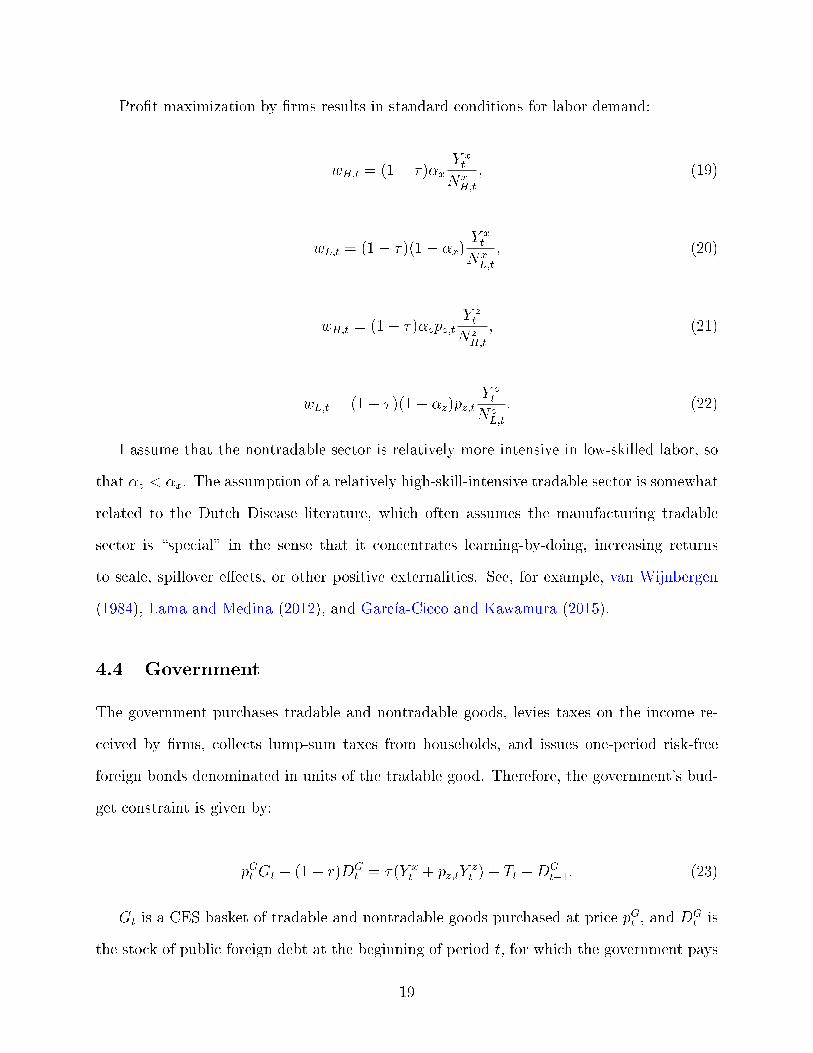
Pro�t maximization by �rms results in standard conditions for labor demand:
wH;t = (1� �)�xY xt
NxH;t
, (19)
wL;t = (1� �)(1� �x)Y xt
NxL;t
, (20)
wH;t = (1� �)�zpz;tY zt
N zH;t
, (21)
wL;t = (1� �)(1� �z)pz;tY zt
N zL;t
. (22)
I assume that the nontradable sector is relatively more intensive in low-skilled labor, so
that �z < �x. The assumption of a relatively high-skill-intensive tradable sector is somewhat
related to the Dutch Disease literature, which often assumes the manufacturing tradable
sector is \special" in the sense that it concentrates learning-by-doing, increasing returns
to scale, spillover e�ects, or other positive externalities. See, for example, van Wijnbergen
(1984), Lama and Medina (2012), and Garc��a-Cicco and Kawamura (2015).
4.4 Government
The government purchases tradable and nontradable goods, levies taxes on the income re-
ceived by �rms, collects lump-sum taxes from households, and issues one-period risk-free
foreign bonds denominated in units of the tradable good. Therefore, the government's bud-
get constraint is given by:
pGt Gt + (1 + r)DGt = �(Y x
t + pz;tYzt ) + Tt +DG
t+1. (23)
Gt is a CES basket of tradable and nontradable goods purchased at price pGt , and DGt is
the stock of public foreign debt at the beginning of period t, for which the government pays
19
the world interest rate r.
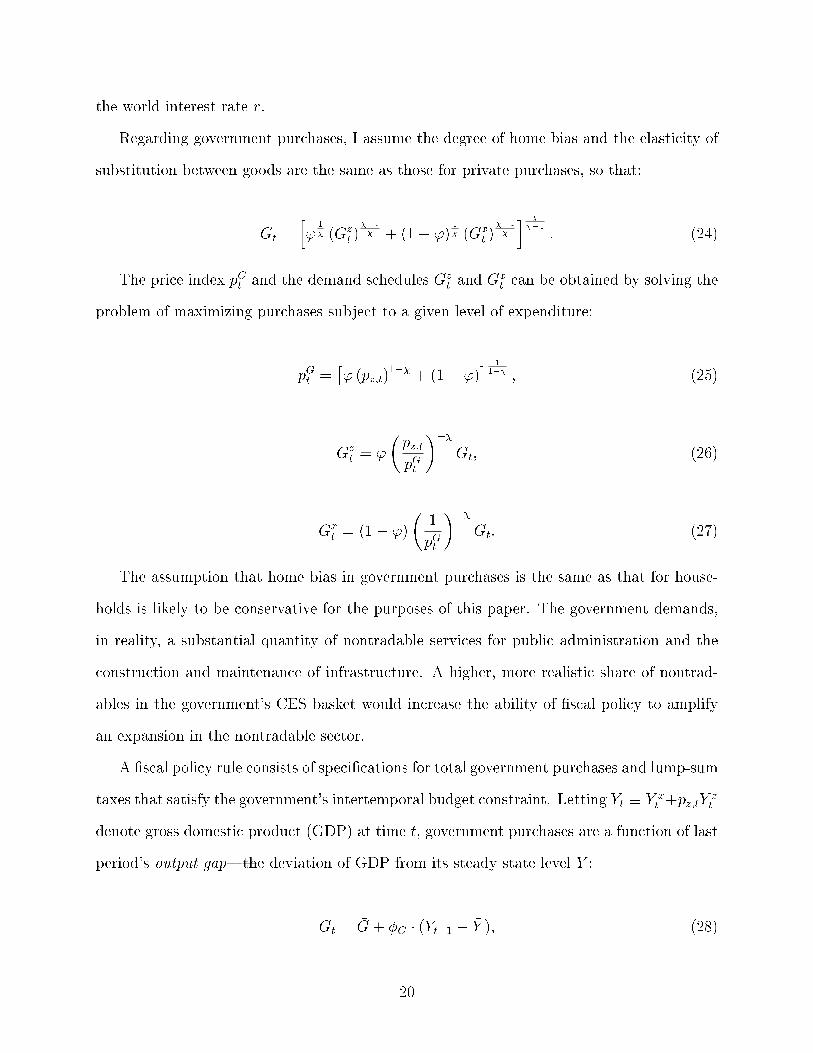
Regarding government purchases, I assume the degree of home bias and the elasticity of
substitution between goods are the same as those for private purchases, so that:
Gt =h'
1
� (Gzt )
��1
� + (1� ')1
� (Gxt )
��1
�
i �
��1
. (24)
The price index pGt and the demand schedules Gzt and G
xt can be obtained by solving the
problem of maximizing purchases subject to a given level of expenditure:
pGt =�' (pz;t)
1�� + (1� ')� 1
1�� , (25)
Gzt = '
�pz;tpGt
���
Gt, (26)
Gxt = (1� ')
�1
pGt
���
Gt. (27)
The assumption that home bias in government purchases is the same as that for house-
holds is likely to be conservative for the purposes of this paper. The government demands,
in reality, a substantial quantity of nontradable services for public administration and the
construction and maintenance of infrastructure. A higher, more realistic share of nontrad-
ables in the government's CES basket would increase the ability of �scal policy to amplify
an expansion in the nontradable sector.
A �scal policy rule consists of speci�cations for total government purchases and lump-sum
taxes that satisfy the government's intertemporal budget constraint. Letting Yt � Y xt +pz;tY
zt
denote gross domestic product (GDP) at time t, government purchases are a function of last
period's output gap|the deviation of GDP from its steady state level �Y :
Gt = �G+ �G � (Yt�1 � �Y ), (28)
20
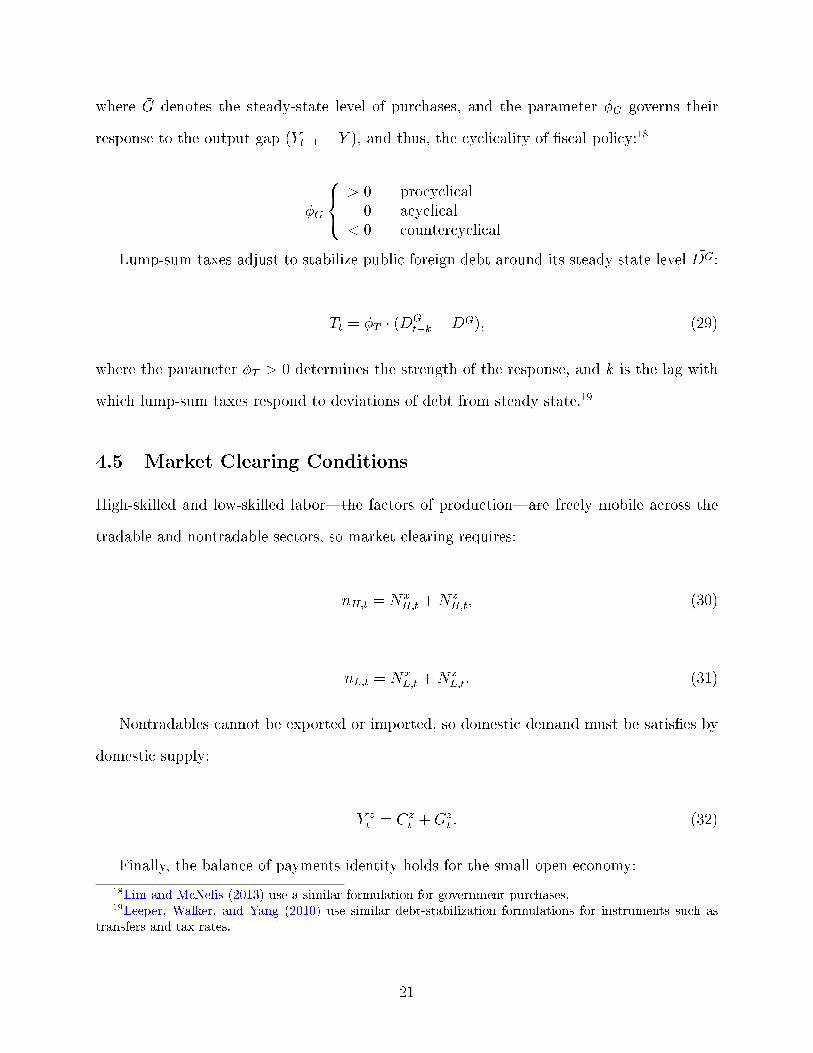
where �G denotes the steady-state level of purchases, and the parameter �G governs their
response to the output gap (Yt�1 � �Y ), and thus, the cyclicality of �scal policy:18
�G
8<:
> 0 procyclical= 0 acyclical< 0 countercyclical
Lump-sum taxes adjust to stabilize public foreign debt around its steady state level �DG:
Tt = �T � (DGt�k �
�DG), (29)
where the parameter �T > 0 determines the strength of the response, and k is the lag with
which lump-sum taxes respond to deviations of debt from steady state.19
4.5 Market Clearing Conditions
High-skilled and low-skilled labor|the factors of production|are freely mobile across the
tradable and nontradable sectors, so market clearing requires:
nH;t = NxH;t +N z
H;t, (30)
nL;t = NxL;t +N z
L;t. (31)
Nontradables cannot be exported or imported, so domestic demand must be satis�es by
domestic supply:
Y zt = Cz
t +Gzt . (32)
Finally, the balance-of-payments identity holds for the small open economy:
18Lim and McNelis (2013) use a similar formulation for government purchases.19Leeper, Walker, and Yang (2010) use similar debt-stabilization formulations for instruments such as
transfers and tax rates.
21

���DG
t+1 �DGt
�+ (Dt+1 �Dt)
�| {z }capital account
= [Y xt � (Cx
t +Gxt )]| {z }
trade balance
��rH;tdH;t + rL;tdL;t + rDG
t
�| {z }net interest income| {z }
current account
, (33)
4.6 Equilibrium
The competitive rational expectations equilibrium of the model is a set of sequences
fY zt ;Y
xt ;Ct;C
zt ;C
xt ; cH;t; cL;t; c
zH;t; c
xH;t; c
zL;t; c
xL;t;N
zH;t;N
xH;t;N
zL;t;N
xL;t;
nH;t;nL;t;Gt;Gzt ;G
xt ;Tt;D
Gt ; dH;t; dL;t; rH;t; rL;t; pz;t; pH;t; pL;t; p
Gt g1
t=0,
such that the households' and �rms' optimization problems are solved, and the markets for
goods and factors of production clear, given the initial values DG0 ; dH;0; dL;0, and the exoge-
nous sequence fubtg1
t=0. The technical appendix lists the system of expectational di�erence
equations that describe the competitive equilibrium.
I solve the model by linear approximation, and speci�cally, by taking a �rst-order Taylor
series expansion around the model's deterministic steady state.
5 Calibration
The model is calibrated to Argentina. A subset of parameters take values commonly found
in the small open economy DSGE literature. I calibrate others so that the steady state of
the model reproduces several features of Argentina's economy. The technical appendix o�ers
details on the derivation of the steady state.
Table 1 summarizes the calibration. The unit of time is a quarter, so the world interest
rate r is set to 1 percent and the discount factor � = 0:99. The coe�cient of relative risk
aversion � = 2, as is common in the literature. Following Schmitt-Groh�e and Uribe (2003),
22
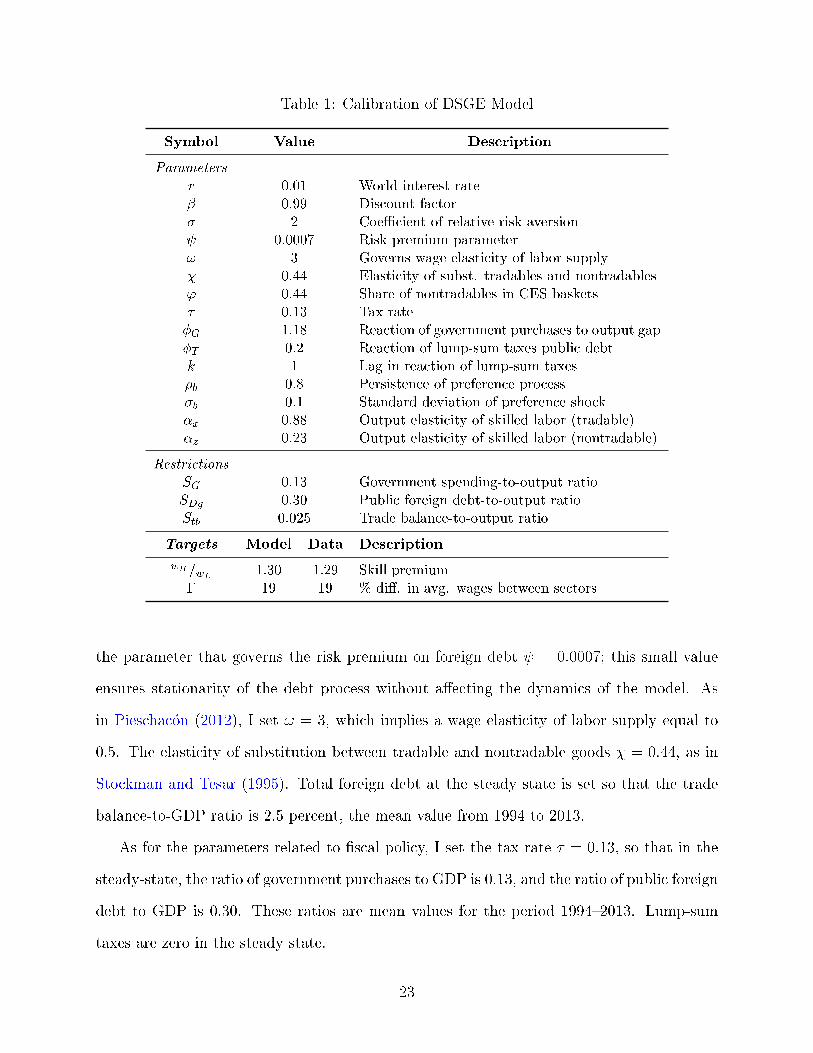
Table 1: Calibration of DSGE Model
Symbol Value Description
Parameters
r 0.01 World interest rate
� 0.99 Discount factor
� 2 Coe�cient of relative risk aversion
0.0007 Risk premium parameter
! 3 Governs wage elasticity of labor supply
� 0.44 Elasticity of subst. tradables and nontradables
' 0.44 Share of nontradables in CES baskets
� 0.13 Tax rate
�G 1.18 Reaction of government purchases to output gap
�T 0.2 Reaction of lump-sum taxes public debt
k 1 Lag in reaction of lump-sum taxes
�b 0.8 Persistence of preference process
�b 0.1 Standard deviation of preference shock
�x 0.88 Output elasticity of skilled labor (tradable)
�z 0.23 Output elasticity of skilled labor (nontradable)
Restrictions
SG 0.13 Government spending-to-output ratio
SDg 0.30 Public foreign debt-to-output ratio
Stb 0.025 Trade balance-to-output ratio
Targets Model Data Description
wH=wL1.30 1.29 Skill premium
� 19 19 % di�. in avg. wages between sectors
the parameter that governs the risk premium on foreign debt = 0:0007; this small value
ensures stationarity of the debt process without a�ecting the dynamics of the model. As
in Pieschac�on (2012), I set ! = 3, which implies a wage elasticity of labor supply equal to
0.5. The elasticity of substitution between tradable and nontradable goods � = 0:44, as in
Stockman and Tesar (1995). Total foreign debt at the steady state is set so that the trade
balance-to-GDP ratio is 2.5 percent, the mean value from 1994 to 2013.
As for the parameters related to �scal policy, I set the tax rate � = 0:13, so that in the
steady-state, the ratio of government purchases to GDP is 0.13, and the ratio of public foreign
debt to GDP is 0.30. These ratios are mean values for the period 1994{2013. Lump-sum
taxes are zero in the steady state.
23
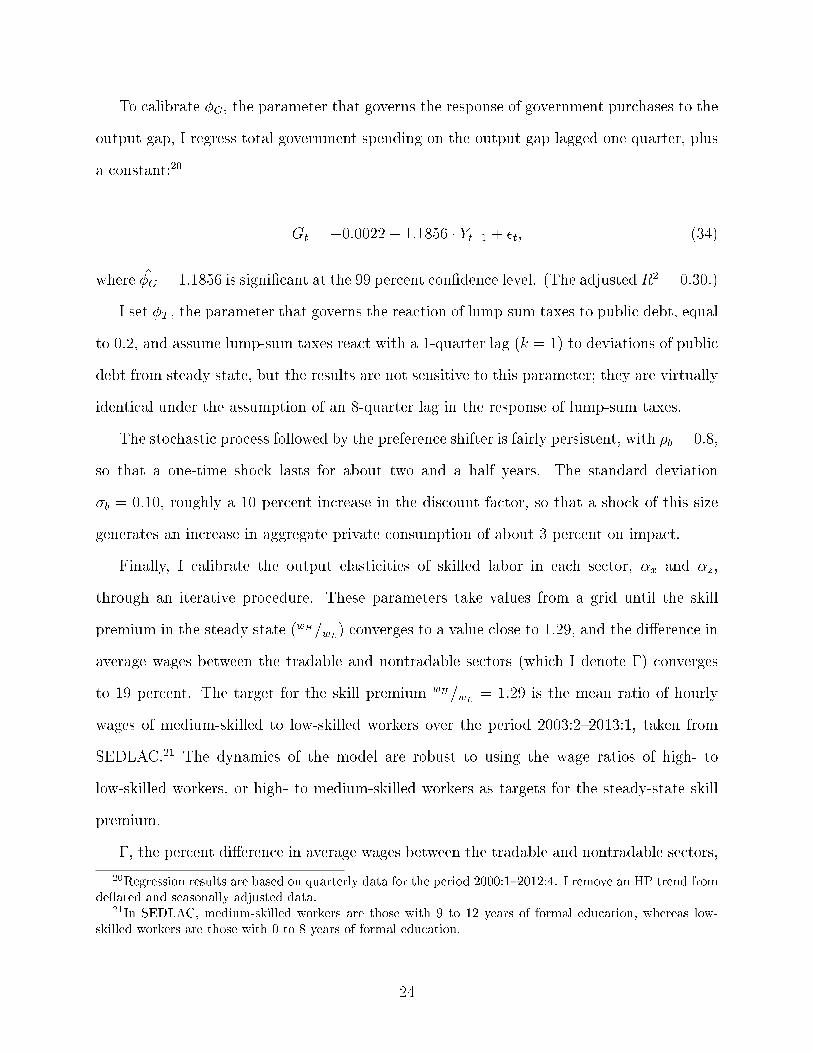
To calibrate �G, the parameter that governs the response of government purchases to the
output gap, I regress total government spending on the output gap lagged one quarter, plus
a constant:20
Gt = �0:0022 + 1:1856 � Yt�1 + �t, (34)
where �̂G = 1:1856 is signi�cant at the 99 percent con�dence level. (The adjusted R2 = 0:30.)
I set �T , the parameter that governs the reaction of lump-sum taxes to public debt, equal
to 0.2, and assume lump-sum taxes react with a 1-quarter lag (k = 1) to deviations of public
debt from steady state, but the results are not sensitive to this parameter; they are virtually
identical under the assumption of an 8-quarter lag in the response of lump-sum taxes.
The stochastic process followed by the preference shifter is fairly persistent, with �b = 0:8,
so that a one-time shock lasts for about two and a half years. The standard deviation
�b = 0:10, roughly a 10 percent increase in the discount factor, so that a shock of this size
generates an increase in aggregate private consumption of about 3 percent on impact.
Finally, I calibrate the output elasticities of skilled labor in each sector, �x and �z,
through an iterative procedure. These parameters take values from a grid until the skill
premium in the steady state (wH=wL) converges to a value close to 1.29, and the di�erence in
average wages between the tradable and nontradable sectors (which I denote �) converges
to 19 percent. The target for the skill premium wH=wL= 1:29 is the mean ratio of hourly
wages of medium-skilled to low-skilled workers over the period 2003:2{2013:1, taken from
SEDLAC.21 The dynamics of the model are robust to using the wage ratios of high- to
low-skilled workers, or high- to medium-skilled workers as targets for the steady-state skill
premium.
�, the percent di�erence in average wages between the tradable and nontradable sectors,
20Regression results are based on quarterly data for the period 2000:1{2012:4. I remove an HP trend fromde ated and seasonally adjusted data.
21In SEDLAC, medium-skilled workers are those with 9 to 12 years of formal education, whereas low-skilled workers are those with 0 to 8 years of formal education.
24
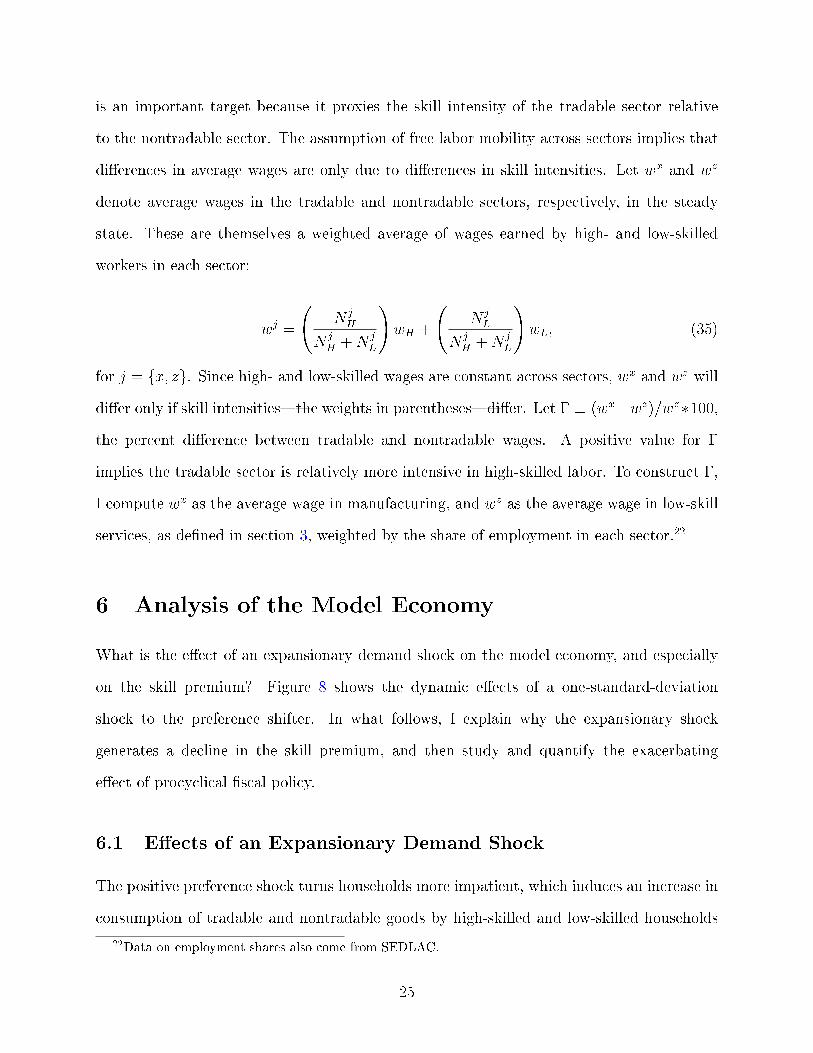
is an important target because it proxies the skill intensity of the tradable sector relative
to the nontradable sector. The assumption of free labor mobility across sectors implies that
di�erences in average wages are only due to di�erences in skill intensities. Let wx and wz
denote average wages in the tradable and nontradable sectors, respectively, in the steady
state. These are themselves a weighted average of wages earned by high- and low-skilled
workers in each sector:
wj =
N jH
N jH +N j
L
!wH +
N jL
N jH +N j
L
!wL, (35)
for j = fx; zg. Since high- and low-skilled wages are constant across sectors, wx and wz will
di�er only if skill intensities|the weights in parentheses|di�er. Let � � (wx�wz)=wz�100,
the percent di�erence between tradable and nontradable wages. A positive value for �
implies the tradable sector is relatively more intensive in high-skilled labor. To construct �,
I compute wx as the average wage in manufacturing, and wz as the average wage in low-skill
services, as de�ned in section 3, weighted by the share of employment in each sector.22
6 Analysis of the Model Economy
What is the e�ect of an expansionary demand shock on the model economy, and especially
on the skill premium? Figure 8 shows the dynamic e�ects of a one-standard-deviation
shock to the preference shifter. In what follows, I explain why the expansionary shock
generates a decline in the skill premium, and then study and quantify the exacerbating
e�ect of procyclical �scal policy.
6.1 E�ects of an Expansionary Demand Shock
The positive preference shock turns households more impatient, which induces an increase in
consumption of tradable and nontradable goods by high-skilled and low-skilled households
22Data on employment shares also come from SEDLAC.
25
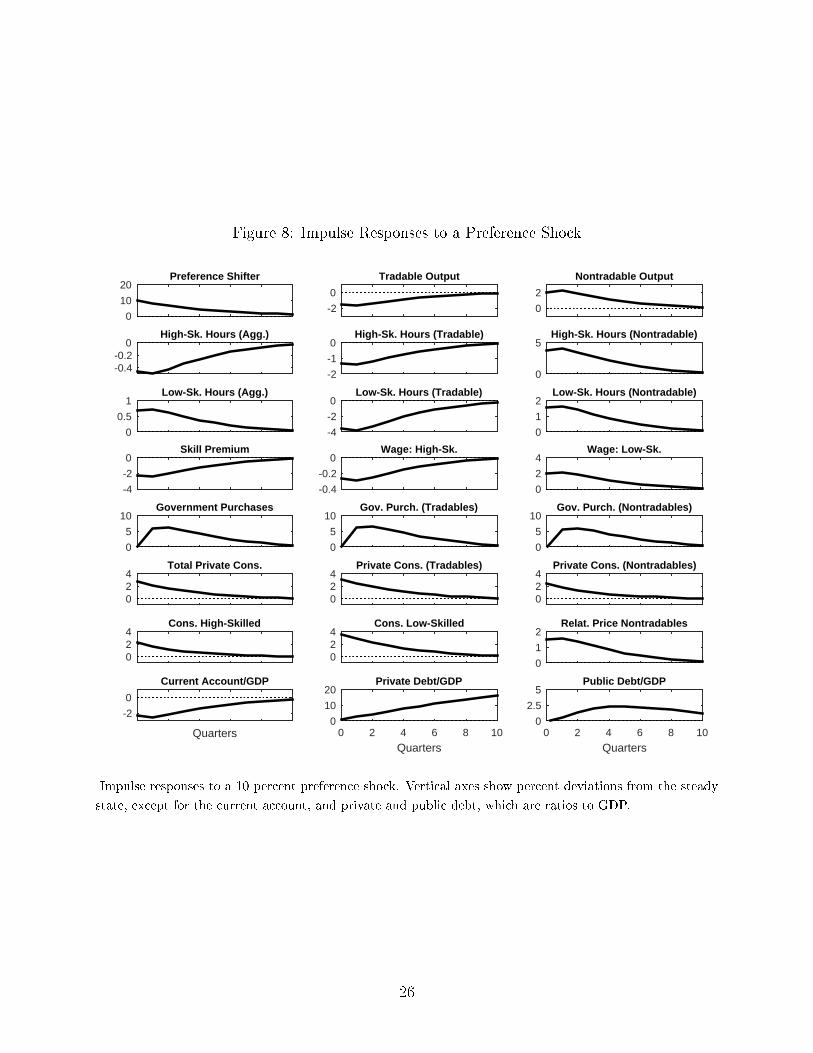
Figure 8: Impulse Responses to a Preference Shock
0
10
20Preference Shifter
-2
0
Tradable Output
0
2
Nontradable Output
-0.4-0.2
0High-Sk. Hours (Agg.)
-2
-1
0High-Sk. Hours (Tradable)
0
5High-Sk. Hours (Nontradable)
0
0.5
1Low-Sk. Hours (Agg.)
-4
-2
0Low-Sk. Hours (Tradable)
0
1
2Low-Sk. Hours (Nontradable)
-4
-2
0Skill Premium
-0.4
-0.2
0Wage: High-Sk.
0
2
4Wage: Low-Sk.
0
5
10Government Purchases
0
5
10Gov. Purch. (Tradables)
0
5
10Gov. Purch. (Nontradables)
024
Total Private Cons.
024
Private Cons. (Tradables)
024
Private Cons. (Nontradables)
024
Cons. High-Skilled
024
Cons. Low-Skilled
0
1
2Relat. Price Nontradables
Quarters
-2
0
Current Account/GDP
Quarters0 2 4 6 8 10
0
10
20Private Debt/GDP
Quarters0 2 4 6 8 10
0
2.5
5Public Debt/GDP
Impulse responses to a 10 percent preference shock. Vertical axes show percent deviations from the steady
state, except for the current account, and private and public debt, which are ratios to GDP.
26
(sixth and seventh rows of �gure 8). Nontradable goods must be produced domestically,
whereas tradables can be imported, so the increase in demand leads to an increase in the
relative price of nontradables (a real exchange rate appreciation) and a drastic reallocation
of high-skilled and low-skilled labor from the tradable to the nontradable sector (second and
third rows). This reallocation results in an expansion of nontradable output, a contraction of
tradable output (�rst row), and a deterioration of the current account-to-GDP ratio, which
is �nanced by an increase in foreign debt (last row). Government purchases are procyclical
in Argentina, so the expansionary shock leads to expansionary �scal policy (�fth row).
The reallocation induces a decline in the skill premium, since the wage earned by high-
skilled workers decreases while the wage earned by low-skilled workers increases (fourth row).
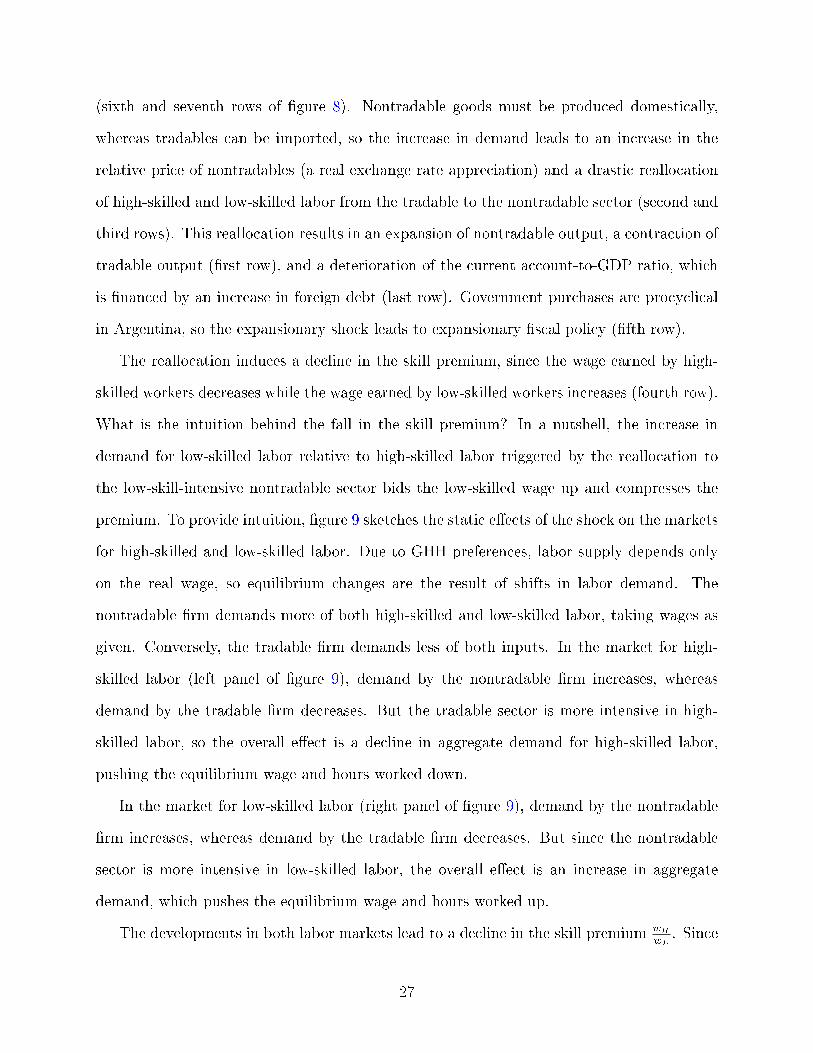
What is the intuition behind the fall in the skill premium? In a nutshell, the increase in
demand for low-skilled labor relative to high-skilled labor triggered by the reallocation to
the low-skill-intensive nontradable sector bids the low-skilled wage up and compresses the
premium. To provide intuition, �gure 9 sketches the static e�ects of the shock on the markets
for high-skilled and low-skilled labor. Due to GHH preferences, labor supply depends only
on the real wage, so equilibrium changes are the result of shifts in labor demand. The
nontradable �rm demands more of both high-skilled and low-skilled labor, taking wages as
given. Conversely, the tradable �rm demands less of both inputs. In the market for high-
skilled labor (left panel of �gure 9), demand by the nontradable �rm increases, whereas
demand by the tradable �rm decreases. But the tradable sector is more intensive in high-
skilled labor, so the overall e�ect is a decline in aggregate demand for high-skilled labor,
pushing the equilibrium wage and hours worked down.
In the market for low-skilled labor (right panel of �gure 9), demand by the nontradable
�rm increases, whereas demand by the tradable �rm decreases. But since the nontradable
sector is more intensive in low-skilled labor, the overall e�ect is an increase in aggregate
demand, which pushes the equilibrium wage and hours worked up.
The developments in both labor markets lead to a decline in the skill premium wH
wL. Since
27
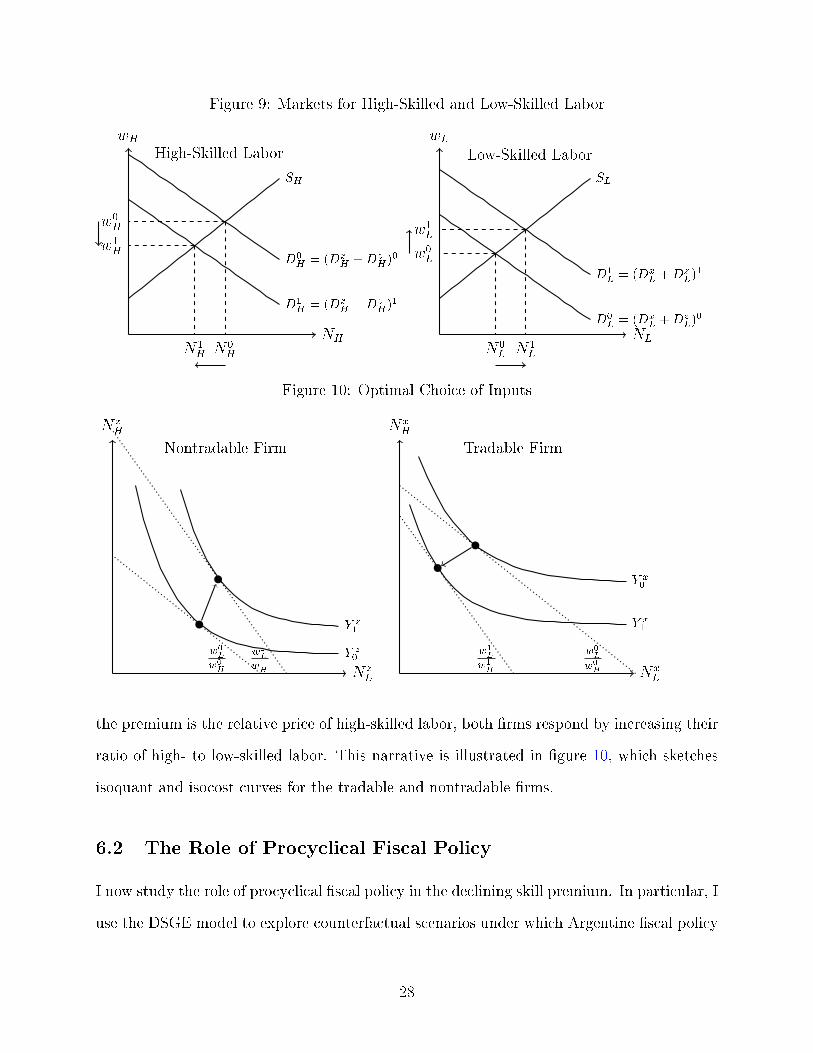
Figure 9: Markets for High-Skilled and Low-Skilled Labor
High-Skilled Labor
D0
H= (Dx
H+Dz
H)0
D1
H= (Dx
H+Dz
H)1
SH
NH
wH
N0H
w0H
N1H
w1H
Low-Skilled Labor
D0
L= (Dx
L+Dz
L)0
D1
L= (Dx
L+Dz
L)1
SL
NL
wL
N0L
w0L
N1L
w1L
Figure 10: Optimal Choice of Inputs
Nontradable Firm
N zL
N zH
w0
L
w0
H
w1
L
w1
H
Y z0
Y z1
Tradable Firm
NxL
NxH
w0
L
w0
H
w1
L
w1
H
Y x0
Y x1
the premium is the relative price of high-skilled labor, both �rms respond by increasing their
ratio of high- to low-skilled labor. This narrative is illustrated in �gure 10, which sketches
isoquant and isocost curves for the tradable and nontradable �rms.
6.2 The Role of Procyclical Fiscal Policy
I now study the role of procyclical �scal policy in the declining skill premium. In particular, I
use the DSGE model to explore counterfactual scenarios under which Argentine �scal policy
28
is acyclical and countercyclical. Under an acyclical policy, government purchases do not
respond to the output gap, so for this scenario the reaction coe�cient �G in equation (28)
takes a value of 0. As for the scenario of a countercyclical policy, I assign �G a value that
corresponds to the reaction of Chilean government purchases to the output gap. Chile's
�scal framework, centered on a structural budget balance rule that allows it to avoid �scal
procyclicality, is widely considered a feature of sound macroeconomic policy.23 A regression of
government spending on GDP, analogous to the one described by equation (34) for Argentina,
results in the following �scal policy reaction function estimate for Chile:
Gt = �0:0006� 1:0447 � Yt�1 + �t,
where �̂G = �1:0447 is signi�cant at the 99 percent con�dence level. (The adjusted R2 =
0:26.)
Figure 11 shows the dynamic e�ects of a one-standard-deviation preference shock under
alternative cyclical stances of �scal policy. Solid black lines reproduce the baseline case of
a procyclical policy, dashed red lines denote responses under an acyclical policy, and dash-
and-dotted blue lines correspond to a countercyclical �scal policy. As the fourth row shows,
changes in the skill premium are inversely related to the cyclical response of �scal policy: the
premium declines less than in the baseline case when policy is acyclical, and even less when
policy is countercyclical as in Chile. Why does procyclical �scal policy exacerbate the e�ect
of the shock on the skill premium, whereas countercyclical policy dampens it? The answer
is simple. The government receives more tax revenue as a result of the economic expansion.
Under a procyclical rule, it responds by demanding more tradable and nontradable goods,
which exacerbates the reallocation from the tradable to the nontradable sector, i.e., the
increase in demand for low-skilled labor accompanied by a decrease in demand for high-
skilled labor. The result is a larger drop in the skill premium. A countercyclical policy, on
the other hand, dampens the economic expansion, since the government reduces its purchases
23See, for example, Medina and Soto (2007), Frankel (2011), and Kumhof and Laxton (2009).
29
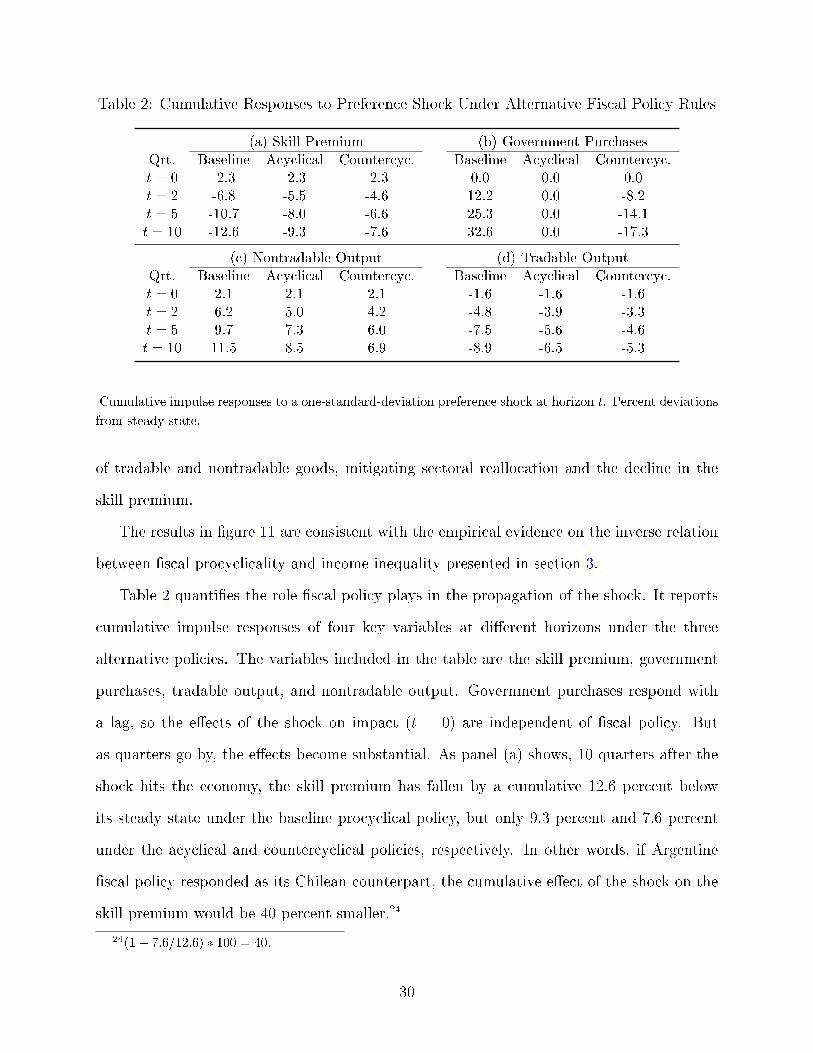
Table 2: Cumulative Responses to Preference Shock Under Alternative Fiscal Policy Rules
(a) Skill Premium (b) Government Purchases
Qrt. Baseline Acyclical Countercyc. Baseline Acyclical Countercyc.
t = 0 -2.3 -2.3 -2.3 0.0 0.0 0.0
t = 2 -6.8 -5.5 -4.6 12.2 0.0 -8.2
t = 5 -10.7 -8.0 -6.6 25.3 0.0 -14.1
t = 10 -12.6 -9.3 -7.6 32.6 0.0 -17.3
(c) Nontradable Output (d) Tradable Output
Qrt. Baseline Acyclical Countercyc. Baseline Acyclical Countercyc.
t = 0 2.1 2.1 2.1 -1.6 -1.6 -1.6
t = 2 6.2 5.0 4.2 -4.8 -3.9 -3.3
t = 5 9.7 7.3 6.0 -7.5 -5.6 -4.6
t = 10 11.5 8.5 6.9 -8.9 -6.5 -5.3
Cumulative impulse responses to a one-standard-deviation preference shock at horizon t. Percent deviations
from steady state.
of tradable and nontradable goods, mitigating sectoral reallocation and the decline in the
skill premium.
The results in �gure 11 are consistent with the empirical evidence on the inverse relation
between �scal procyclicality and income inequality presented in section 3.
Table 2 quanti�es the role �scal policy plays in the propagation of the shock. It reports
cumulative impulse responses of four key variables at di�erent horizons under the three
alternative policies. The variables included in the table are the skill premium, government
purchases, tradable output, and nontradable output. Government purchases respond with
a lag, so the e�ects of the shock on impact (t = 0) are independent of �scal policy. But
as quarters go by, the e�ects become substantial. As panel (a) shows, 10 quarters after the
shock hits the economy, the skill premium has fallen by a cumulative 12.6 percent below
its steady state under the baseline procyclical policy, but only 9.3 percent and 7.6 percent
under the acyclical and countercyclical policies, respectively. In other words, if Argentine
�scal policy responded as its Chilean counterpart, the cumulative e�ect of the shock on the
skill premium would be 40 percent smaller.24
24(1� 7:6=12:6) � 100 = 40.
30
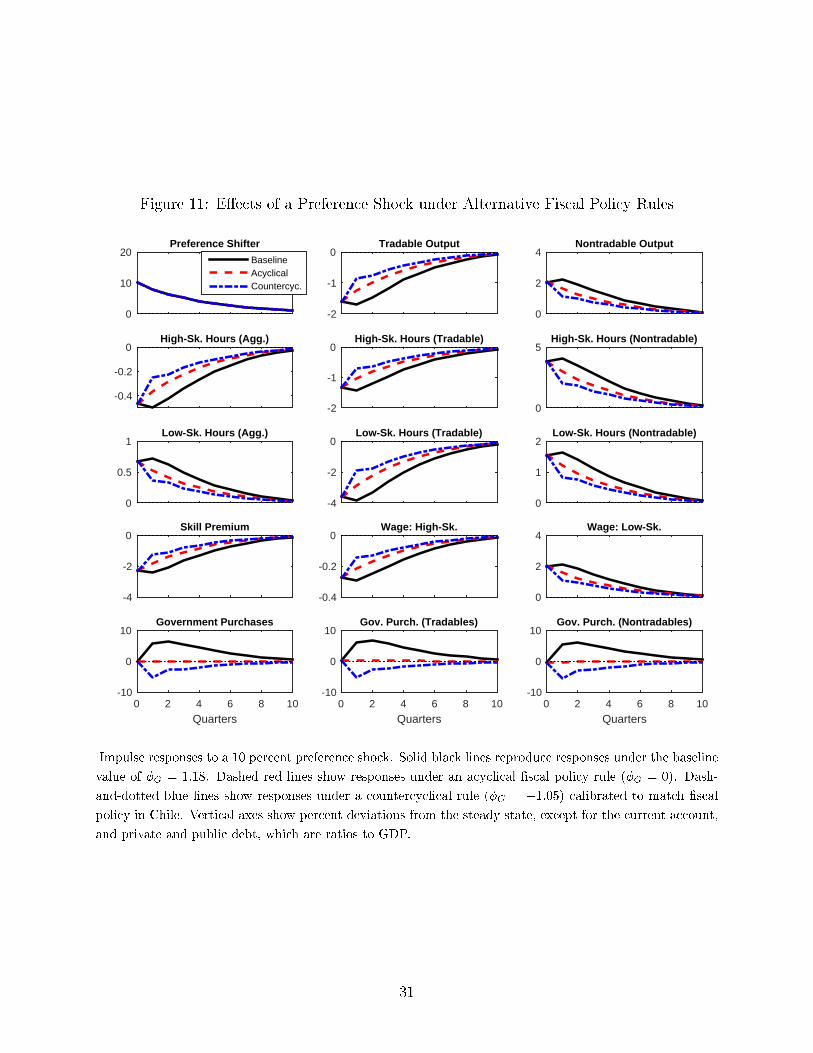
Figure 11: E�ects of a Preference Shock under Alternative Fiscal Policy Rules
0
10
20Preference Shifter
BaselineAcyclicalCountercyc.
-2
-1
0Tradable Output
0
2
4Nontradable Output
-0.4
-0.2
0High-Sk. Hours (Agg.)
-2
-1
0High-Sk. Hours (Tradable)
0
5High-Sk. Hours (Nontradable)
0
0.5
1Low-Sk. Hours (Agg.)
-4
-2
0Low-Sk. Hours (Tradable)
0
1
2Low-Sk. Hours (Nontradable)
-4
-2
0Skill Premium
-0.4
-0.2
0Wage: High-Sk.
0
2
4Wage: Low-Sk.
Quarters0 2 4 6 8 10
-10
0
10Government Purchases
Quarters0 2 4 6 8 10
-10
0
10Gov. Purch. (Tradables)
Quarters0 2 4 6 8 10
-10
0
10Gov. Purch. (Nontradables)
Impulse responses to a 10 percent preference shock. Solid black lines reproduce responses under the baseline
value of �G = 1:18. Dashed red lines show responses under an acyclical �scal policy rule (�G = 0). Dash-
and-dotted blue lines show responses under a countercyclical rule (�G = �1:05) calibrated to match �scal
policy in Chile. Vertical axes show percent deviations from the steady state, except for the current account,
and private and public debt, which are ratios to GDP.
31
Panels (c) and (d) of table 2 show the substantial amplifying e�ect of �scal policy on
sectoral allocation. Under the baseline procyclical policy, nontradable output expands 11.5
percent over a 10-quarter horizon, but only 6.9 percent under a �scal response in the style
of Chile's. Tradable output contracts 8.9 percent under Argentina's procyclical response,
but only 5.3 percent under the countercyclical �scal rule. In sum, the countercyclical policy
dampens the e�ect of the shock on sectoral allocation by 40 percent relative to the procyclical
policy.
7 Conclusion
Income inequality declined substantially within most Latin American countries during the
2000s. This paper argues that at least part of this decline is a cyclical phenomenon: the 2000s
were characterized by an economic expansion during which most countries implemented a
procyclical �scal policy. A small open economy dynamic stochastic general equilibrium
(DSGE) model shows that a procyclical policy contributes to a decline in the skill pre-
mium|the key driver of the decline in Latin American inequality|by exacerbating a boom
concentrated on nontradable sectors that are intensive in low-skilled labor.
I document that, consistently with this framework, Latin America's boom was concen-
trated on nontradable sectors such as construction, wholesale and retail trade, restaurants,
and transport, while manufacturing trailed behind. I also show the region experienced a real
exchange rate appreciation during the 2000s. Furthermore, I document an inverse relation
between �scal procyclicality and income inequality among countries in the region.
The DSGE model used to rationalize this evidence is admittedly simple. High-skilled and
low-skilled labor are freely mobile across the tradable and nontradable sectors. It would be
useful to study a more realistic model in which high-skilled labor receives a wage premium
but is less mobile than low-skilled labor. It would also be useful to model a more realistic
economic expansion, appealing to shocks to commodity prices, interest rates, export demand,
32
or the terms of trade, rather than preference shocks.25 Finally, a framework able to relate
the e�ects of cyclical phenomena and the stance of �scal policy to the accumulation of skills,
which is absent in this paper, could discriminate between demand and supply forces behind
the cyclical variation in the skill premium.
25There are several papers on the drivers of business cycles in emerging economies that could informthe choice of shocks. See, for example, Fern�andez, Gonz�alez, and Rodr��guez (2015), Mendoza (1995), Kose(2002), Neumeyer and Perri (2005), Osterholm and Zettelmeyer (2008), and Izquierdo, Romero, and Talvi(2008).
33
References
Acosta, Pablo and Leonardo Gasparini (2007), \Capital Accumulation, Trade Liberalization,and Rising Wage Inequality: The Case of Argentina." Economic Development and CulturalChange, 55, 793{812.
Azevedo, Jo~ao Pedro, Mar��a Eugenia D�avalos, Carolina Diaz-Bonilla, Bernardo Atuesta, andRa�ul Andr�es Casta~neda (2013a), \Fifteen Years of Inequality in Latin America: How HaveLabor Markets Helped?" World Bank Policy Research Working Paper 6384.
Azevedo, Jo~ao Pedro, Gabriela Inchauste, and Viviane Sanfelice (2013b), \Decomposing theRecent Inequality Decline in Latin America." World Bank Policy Research Working Paper6715.
Barlevy, Gadi and Daniel Tsiddon (2006), \Earnings Inequality and the Business Cycle."European Economic Review, 50, 55{89.
Benigno, Gianluca, Nathan Converse, and Luca Fornaro (2015), \Large Capital In ows,Sectoral Allocation, and Economic Performance." Journal of International Money and
Finance, 55, 60{87.
Casta~neda, Ana, Javier D��az-Gim�enez, and Jos�e-Victor R��os-Rull (1998), \Exploring theIncome Distribution Business Cycle Dynamics." Journal of Monetary Economics, 42, 93{130.
Christiano, Lawrence, Martin Eichenbaum, and Sergio Rebelo (2011), \When Is the Gov-ernment Spending Multiplier Large?" Journal of Political Economy, 119, 78{121.
Coble, David and Nicolas Magud (2010), \A Note on Terms of Trade Shocks and the WageGap." IMF Working Paper WP/10/279.
Cord, Louise, Oscar Barriga Cabanillas, Leonardo Lucchetti, Carlos Rodr��guez-Castel�an,Liliana D. Sousa, and Daniel Valderrama (2014), \Inequality Stagnation in Latin Americain the Aftermath of the Global Financial Crisis." World Bank Policy Research WorkingPaper 7146.
Corden, W. M. (1984), \Booming Sector and Dutch Disease Economics: Survey and Con-solidation." Oxford Economic Papers, 36, 359{380.
Corden, W. Max and J. Peter Neary (1982), \Booming Sector and De-Industrialisation in aSmall Open Economy." The Economic Journal, 92, 825{848.
Cruces, Guillermo, Carolina Garc��a Domenech, and Leonardo Gasparini (2011), \Inequalityin Education: Evidence for Latin America." UNU-WIDER Working Paper 2001/93.
Du�y, John, Chris Papageorgiou, and Fidel Perez-Sebastian (2004), \Capital-Skill Comple-mentarity? Evidence from a Panel of Countries." The Review of Economics and Statistics,86, 327{344.
34
Eggertsson, Gauti B. (2010), \What Fiscal Policy is E�ective at Zero Interest Rates?" InNBER Macroeconomics Annual 2010 (Daron Acemoglu and Michael Woodford, eds.),volume 25, 59{112.
Fern�andez, Andr�es, Andr�es Gonz�alez, and Diego Rodr��guez (2015), \Sharing a Ride onthe Commodities Roller Coaster: Common Factors in Business Cycles of EmergingEconomies." Working paper.
Frankel, Je�rey (2011), \A Solution to Fiscal Procyclicality: the Structural Budget Institu-tions Pioneered by Chile." Central Bank of Chile Working Paper 604.
Frankel, Je�rey (2013), \A Solution to Fiscal Procyclicality: the Structural Budget Institu-tions Pioneered by Chile." In Fiscal Policy and Macroeconomic Performance (Luis FelipeC�espedes and Jordi Gal��, eds.), 323{391, Central Bank of Chile, Santiago, Chile.
Frankel, Je�rey A., Carlos A. V�egh, and Guillermo Vuletin (2013), \On Graduation fromFiscal Procyclicality." Journal of Development Economics, 100, 32{47.
Galiani, Sebastian, Daniel Heymann, and Nicolas Magud (2010), \On the Distributive Ef-fects of Terms of Trade Shocks: The Role of Non-tradable Goods." IMF Working PaperWP/10/241.
Galiani, Sebastian and Guido G. Porto (2010), \Trends in Tari� Reforms and in the Structureof Wages." The Review of Economics and Statistics, 92, 482{494.
Galiani, Sebastian and Pablo Sanguinetti (2003), \The Impact of Trade Liberalization onWage Inequality: Evidence from Argentina." Journal of Development Economics, 72, 497{513.
Garc��a, Pablo and Camilo P�erez-N�u~nez (2015), \Desigualdad, Crisis y Fluctuaciones Macroe-con�omicas: Chile 1960{2014." Working paper.
Garc��a-Cicco, Javier and Enrique Kawamura (2015), \Dealing with the Dutch Disease: FiscalRules and Macro-Prudential Policies." Journal of International Money and Finance, 55,205{239.
Gasparini, Leonardo, Sebasti�an Galiani, Guillermo Cruces, and Pablo Acosta (2011), \Ed-ucational Upgrading and Returns to Skills in Latin America: Evidence from a Supply-Demand Framework, 1990{2010." World Bank Policy Research Working Paper 5921.
Gasparini, Leonardo and Nora Lustig (2011), \The Rise and Fall of Income Inequality inLatin America." In The Oxford Handbook of Latin American Economics (Jos�e AntonioOcampo and Jaime Ros, eds.).
Gavin, Michael and Roberto Perotti (1997), \Fiscal Policy in Latin America." In NBER
Macroeconomics Annual 1997 (Ben S. Bernanke and Julio Rotemberg, eds.), volume 12,11{72.
35
Greenwood, Jeremy, Zvi Hercowitz, and Gregory W. Hu�man (1988), \Investment, CapacityUtilization, and the Real Business Cycle." American Economic Review, 78, 402{17.
Hall, Robert E. (2009), \By How Much Does GDP Rise If the Government Buys MoreOutput?" Brookings Papers on Economic Activity, 40, 183{249.
Ilzetzki, Ethan and Carlos V�egh (2008), \Procyclical Fiscal Policy in Developing Countries:Truth or Fiction?" NBER Working Paper 14191.
Izquierdo, Alejandro, Randall Romero, and Ernesto Talvi (2008), \Booms and Busts in LatinAmerica: The Role of External Factors." Inter-American Development Bank ResearchDepartment Working Paper 631.
Kaminsky, Graciela L., Carmen M. Reinhart, and Carlos A. V�egh (2004), \When It Rains, ItPours: Procyclical Capital Flows and Macroeconomic Policies." In NBER Macroeconomics
Annual 2004 (Mark Gertler and Kenneth Rogo�, eds.), volume 19, 11{82.
Katz, Lawrence and Kevin M. Murphy (1992), \Changes in Relative Wages, 1963{1987:Supply and Demand Factors." The Quarterly Journal of Economics, 107, 35{78.
Kose, M. Ayhan (2002), \Explaining Business Cycles in Small Open Economies: How MuchDo World Prices Matter?" Journal of International Economics, 56, 299{327.
Krusell, Per, Lee E. Ohanian, Jos�e-V��ctor R��os-Rull, and Giovanni L. Violante (2000),\Capital-Skill Complementarity and Inequality: A Macroeconomic Analysis." Economet-
rica, 68, 1029{1053.
Kumhof, Michael and Douglas Laxton (2009), \Chiles Structural Fiscal Surplus Rule: AModel-Based Evaluation." IMF Working Paper WP/09/88.
Lama, Ruy and Juan Pablo Medina (2012), \Is Exchange Rate Stabilization an AppropriateCure for the Dutch Disease?" International Journal of Central Banking, 8, 5{46.
Leeper, Eric M., Todd B. Walker, and Shu-Chun S. Yang (2010), \Government Investmentand Fiscal Stimulus." Journal of Monetary Economics, 57, 1000{1012.
Lim, G.C. and Paul D. McNelis (2013), \Alternative Government Spending Rules: E�ectson Income Inequality and Welfare." Macroeconomic Dynamics, 17, 1496{1518.
Lindquist, Matthew J. (2004), \Capital-Skill Complementarity and Inequality Over the Busi-ness Cycle." Review of Economic Dynamics, 7, 519{540.
L�opez-Calva, Luis F. and Nora Lustig, eds. (2010), Declining Inequality in Latin America:
A Decade of Progress?, Brookings Institution Press.
Lustig, Nora, Luis F. L�opez-Calva, and Eduardo Ortiz-Ju�arez (2013), \Deconstructing theDecline in Inequality in Latin America." Tulane Economics Working Paper 1314.
36
Maliar, Lilia, Serguei Maliar, and Juan Mora (2005), \Income and Wealth DistributionsAlong the Business Cycle: Implications from the Neoclassical Growth Model." The B.E.
Journal of Macroeconomics, 5, 1{28.
Mano, Rui C. and Marola Castillo (2015), \The Level of Productivity in Traded and Non-Traded Sectors for a Large Panel of Countries." IMF Working Paper WP/15/48.
Medina, Juan Pablo and Claudio Soto (2007), \Copper Price, Fiscal Policy and BusinessCycle in Chile." Central Bank of Chile Working Paper 458.
Mendoza, Enrique (1995), \The Terms of Trade, the Real Exchange Rate, and EconomicFluctuations." International Economic Review, 36, 101{137.
Neumeyer, Pablo A. and Fabrizio Perri (2005), \Business Cycles in Emerging Economies:The Role of Interest Rates." Journal of Monetary Economics, 52, 345{380.
Osterholm, Par and Jeromin Zettelmeyer (2008), \The E�ect of External Conditions onGrowth in Latin America." IMF Sta� Papers, 55, 595{623.
Pieschac�on, Anamar��a (2012), \The Value of Fiscal Discipline for Oil-Exporting Countries."Journal of Monetary Economics, 59, 250{268.
Schmitt-Groh�e, Stephanie and Mart��n Uribe (2003), \Closing Small Open Economy Models."Journal of International Economics, 61, 163{185.
Solt, Frederick (forthcoming), \The StandardizedWorld Income Inequality Database." SocialScience Quarterly.
Stockman, Alan C. and Linda L. Tesar (1995), \Tastes and Technology in a Two-CountryModel of the Business Cycle: Explaining International Comovements." The American
Economic Review, 85, 168{185.
Talvi, Ernesto and Carlos A. V�egh (2005), \Tax Base Variability and Procyclical FiscalPolicy in Developing Countries." Journal of Development Economics, 78, 156{190.
Tsounta, Evridiki and Anayochukwu I. Osueke (2014), \What is Behind Latin America'sDeclining Income Inequality?" IMF Working Paper WP/14/124.
Uribe, Mart��n and Vivian Z. Yue (2006), \Country Spreads and Emerging Countries: WhoDrives Whom?" Journal of International Economics, 69, 6{36.
van Wijnbergen, Sweder (1984), \The `Dutch Disease': A Disease After All?" The Economic
Journal, 94, 41{55.
Williamson, Je�rey G. (2009), \Five Centuries of Latin American Inequality." NBER Work-ing Paper 15305.
World Bank (2014), Social Gains in the Balance - A Fiscal Policy Challenge for Latin Amer-
ica and the Caribbean. World Bank, Washington, DC.
37

Documentos de Trabajo
Banco Central de Chile
NÚMEROS ANTERIORES
La serie de Documentos de Trabajo en versión PDF
puede obtenerse gratis en la dirección electrónica:
www.bcentral.cl/esp/estpub/estudios/dtbc.
Existe la posibilidad de solicitar una copia impresa
con un costo de Ch$500 si es dentro de Chile y
US$12 si es fuera de Chile. Las solicitudes se pueden
hacer por fax: +56 2 26702231 o a través del correo
electrónico: [email protected].
Working Papers
Central Bank of Chile
PAST ISSUES
Working Papers in PDF format can be
downloaded free of charge from:
www.bcentral.cl/eng/stdpub/studies/workingpaper.
Printed versions can be ordered individually for
US$12 per copy (for order inside Chile the charge
is Ch$500.) Orders can be placed by fax: +56 2
26702231 or by email: [email protected].
DTBC – 778
Calvo Wages vs. Search Frictions: A Horse Race in a DSGE Model of a Small Open
Economy
Markus Kirchner y Rodrigo Tranamil
DTBC – 777
Commodity Prices, Growth and Productivity: A Sectoral View
Claudia De la Huerta y Javier García-Cicco
DTBC – 776
Use of Medical Services in Chile: How Sensitive are The Results to Different
Econometric Specifications?
Alejandra Chovar, Felipe Vásquez y Guillermo Paraje
DTBC – 775
Traspaso de Tipo de Cambio a Precios en Chile: El Rol de los Insumos Importados y
del Margen de Distribución
Andrés Sansone
DTBC – 774
Calibrating the Dynamic Nelson-Siegel Model: A Practitioner Approach
Francisco Ibáñez
DTBC – 773
Terms of Trade Shocks and Investment in Commodity-Exporting Economies
Jorge Fornero, Markus Kirchner y Andrés Yany
DTBC – 772
Explaining the Cyclical Volatility of Consumer Debt Risk
Carlos Madeira
DTBC – 771
Channels of US Monetary Policy Spillovers into International Bond Markets
Elías Albagli, Luis Ceballos, Sebastián Claro y Damián Romero
DTBC – 770
Fuelling Future Prices: Oil Price and Global Inflation
Carlos Medel
DTBC – 769
Inflation Dynamics and the Hybrid Neo Keynesian Phillips Curve: The Case of Chile
Carlos Medel
DTBC – 768
The Out-of-sample Performance of an Exact Median-unbiased Estimator for the
Near-unity AR(1) Model
Carlos Medel y Pablo Pincheira
DTBC – 767
Decomposing Long-term Interest Rates: An International Comparison
Luis Ceballos y Damián Romero
DTBC – 766
Análisis de Riesgo de los Deudores Hipotecarios en Chile
Andrés Alegría y Jorge Bravo
DTBC – 765
Economic Performance, Wealth Distribution and Credit Restrictions Under Variable
Investment: The Open Economy
Ronald Fischer y Diego Huerta
DTBC – 764
Country Shocks, Monetary Policy Expectations and ECB Decisions. A Dynamic Non-
Linear Approach
Máximo Camacho, Danilo Leiva-León y Gabriel Péres-Quiros

DOCUMENTOS DE TRABAJO • Febrero 2016