Embed Size (px)
Citation preview

ED 361 351
AUTHORTITLE
INSTITUTION
REPORT NOPUB DATENOTE
AVAILABLE FROM
PUB TYPE
EDRS PRICEDESCRIPTORS
DOCUMENT RESUME
TM 020 405
Johnson, Frank H.
Public Elementary and Secondary State Aggregate Data,by State for School Years 1991-92 and 1990-91. E.D.TABS.
National Center for Education Statistics (ED),Washington, DC.
ISBN-0-16-041876-3; NCES-93-327Jul 93
74p.; For the previous report in this series, see ED347 203.
U.S. Government Printing Office, Superintendent ofDocuments, Mail Stop: SSOP, Washington, DC20402-9328.Statistical Data (110) Reports Descriptive (141)
Tests/Evaluation Instruments (160)
MF01/PC03 Plus Postage.Comparative Analysis; *Educational Finance;Elementary Secondary Education; Enrollment;Expenditure per Student; High School Graduates;Income; *National Surveys; *Public Schools; *SchoolStatistics; Tables (Data); Teacher Student Ratio
IDENTIFIERS *Aggregation (Data); *Common Core of Data Program;National Center for Education Statistics;,NationalPublic Education Financial Survey; State NonfiscalSurvey of Public Elem Sec Educ
ABSTRACT
This report presen's non-fiscal information on publicelementary and secondary schools for the 1991-92 school year andfinance data for the 1990-91 school year (fiscal year 1991).Statistics are based on data from two of the four surveys of theCommon Core of Data program of the National Center for EducationStatistics. In comparing findings of the State Nonfiscal Survey ofPublic Elementary and Secondary Education and the National PublicEducation Financial Survey with those of previous years, severalfindings stand out. There were 42.0 million students in publicschools in 1991-92, an increase of 1.9 percent over the previousyear's total. The 2.2 million high school graduates for 1990-91represent a decrease from 1989-90, although the ratio of graduates to12th-grade enrollment increased slightly. Of the 4.5 million schoolstaff reported for 1991-92, 53.5 percent were teachers and 410,000were teacher aides. The national ratio of total students to totalteachers in 1991-92 was 17.3 students per teacher, a slight increaseover the previous year. Total reported revenues for public elementaryand secondary education were 222.8 billion dollars for 1990-91,compared with 207.7 billion dollars for 1989-90. Expendituresaveraged 4,890 dollars per pupil in membership. Data are presented in14 tables, with 14 tables of state aggregate data, revised finaltabulations, in Appendix A and the survey forms in Appendix B.(SLD)

NATIONAL CENTER FOR EDUCATION STATISTICS
ED. TABS July 1993
Public Elementaryand SecondaryState Aggregate Data, by Statefor School Years 1991-92and 1990-91
U.S. DEPARTMENT OF EDUCATIONOnce of Educatronw Research and Improvement
iATIONAL RESOURCES INFORMATIONCENTER IERICI
7 ms 0oCument nas peen reproduced asreCenfecl from the person or orgarnzat.onong.nating .t
7 Mmor changes 'lane been made to .mpronefeproaucbon duality
PointS of fnew Or Oronloos stated.n thr00Co.mem do not oeCesSarity represent ott.c.a.OERI POS110n Or pOI,CY
U.S. Depari.nent of EducationOffice of Enucational 93-327
Porn

NATIONAL CENTER FOR EDUCATION STATISTICS
E.D. TABS July 1993
Public Elementaryand SecondaryState Aggregate Data, by Statefor School Years 1991-92and 1990-91
Frank H. JohnsonElementary and Secondary Education Statistics Division
U.S. Department of EducationOffice of Educational Research and Improvement NCES 93-327

U.S. Department of EducationRichard W. RileySecretary
Office of Educational Research and ImprovementSharon P. RobinsonAssistant Secretary
National Center for Education StatisticsEmerson J. ElliottCommissioner
National Center for Education Statistics
"The purpose of the Center shall be to collect, analyze, anddisseminate statistics and other data related to educationin the United States and in other nations."Section 406(b)of the General Education Provisions Act, as amended (20U.S.C. 1221e-1).
July 1993
Contact:Frank H. Johnson(202) 219-1968
Fot sale b) the U.S. Government Printing Office
Superintendent of Documents. Mad Stop: SSOP. Washington. DC 20402-9328
ISBN 0-16-041876-3
4

Highlights
The State Nonfiscal Survey of Public Elementary and Secondary Education providesinformation about public elementary and secondary education for the 1991-92 school year.The National Public Education Financial Survey provides finance data concerning publicelementary and secondary education for the 1990-91 school year. In examining these data,and comparing them with data from the previous years, several findings stand out.
Student informationThere were 42.0 million students enrolled in public school grades pre-kindergartentnrough 12 in school year 1991-92, an increase of 1.9 percent over the previousyear's total (table 1).
The lumber of regular high school graduates for 1990-91 was 2.2 million, adecrease from the 2.3 million reported for 1989-90. The ratio of graduates to 12thgrade enrollment increased slightly froM 93.8 percent in 1990 to 94.0 percent in1991. Between the two years, there was a proportionally greater decline in 12th-grade students than in graduates. The proportion of 12th-graders who graduatedincreased by 0.2 percznt (compute6 from tables 5 and A5).
School settingOf the 4.5 million elementary and secondary school staff reported for 1991-92, 2.4million (53.5 percent) were teachers and 410 thousand were teacher aides. Inaddition, 204 thousand staff (4.5 percent) were administrators, and 1.5 million (33.0percent) provided student support through guidance, library, or other services(table 3).
The national ratio of total students to total teachers wq:- 17.3 students per teacher in1991-92. This represents a slight increase of 0.1 over last year's ratio. This rangedfrom a high of 24.9 (Utah) to a low of 13.2 (District of Columbia) (table 2).
ResourcesTotal reported revenues for public elementary and secondary education were $222.8billion for school year 1990-91, compared to $207.7 billion for school year 1989-90.In school year 1990-91, 47.3 percent of these revenues were from state governmentsources, 46.1 percent from local sources, 6.2 percent from the federal government,and 0.5 percent from intermediate sources (tables 6, 7, A6, and A7).
Current expenditures for public elementary and secondary education in school year1990-91 came to $201.5 billion. This averaged $4,890 per pupil in membership. Ofthis amount, an average of $2,965 was for instructional expenditures, $1,709 was forsupport services, and $216 for noninstructional expenditures such as administration(tables 8 and 11).
iii 5

Contents
Page
Highlights iii
Introduction 1
Methodology 1
Definitions 9
Acknowledgments 14
Tables 15
1. Public school membership, by grade and state: Fall 1991 16
2. Public school student-teacher ratio, student membership,and teachers, by grade level and state: Fall 1991 18
3. Number of staff employed by public school systemsand percentage of total staff, by category andstate: Fall 1991 19
4. Number of public school graduates, 12th-gradestudent membership, and 9th-grade student membership3 years earlier, by state: School year 1990-91 21
5. Change in number of public school graduates and12th-grade student membership from 1990 to 1991,by state 22
6. Revenues for public elementary and secondary schools,by source and state: School year 1990-91 23
7. Percentage distribution of total revenues for publicelementary and secondary schools, by source andstate: School year 1990-91 24
8. Current expenditures for public elementary andsecondary schools, by function and state:School year 1990-91 25
v6

9. Percentage distribution of current expenditures forpublic elementary and secondary schools, by functionand state: School year 1990-91 26
10. Average daily attendance and current expenditures perpupil in attendance for public elementary and secondaryschools, by function and state: School year 1990-91 27
11. Student membership and current expenditures per pupilin membership for public elementary and secondaryschools, by function and state: School year 1990-91 28
12. Employee expenditures, including salaries and employeebenefits for instruction and support servicesfor public elementary and secondaryschools, by state: School year 1990-91 29
13. Facilities acquisition and debt service expendituresfor public elementary and secondary schools,by state: School year 1990-91 30
14. Total education, current, facilities acquisition,community services, direct cost and propertyexpenditures, by state: School year 1990-91 31
Appendix A: Public Elementary and Secondary State Aggregate Data,for School Years 1990-91 and 1989-90, Revised FinalTabulations 33
Al. Public school membership, by grade and state: Fall 1990 35
A2. Public school student-teacher ratio, student membership,and teachers, by grade level and state: Fall 1990 37
A3. Number of staff employed by public school systems andpercentage of total staff, by category and state:Fall 1990 38
A4. Number of public school graduates, 12th-grade studentmembership, and 9th-grade student membership 3 years earlier,by state: School year 1989-90 40
A5. Change in number of public school graduates and 12th-gradestudent membership from 1989 to 1990, by state 41
vi
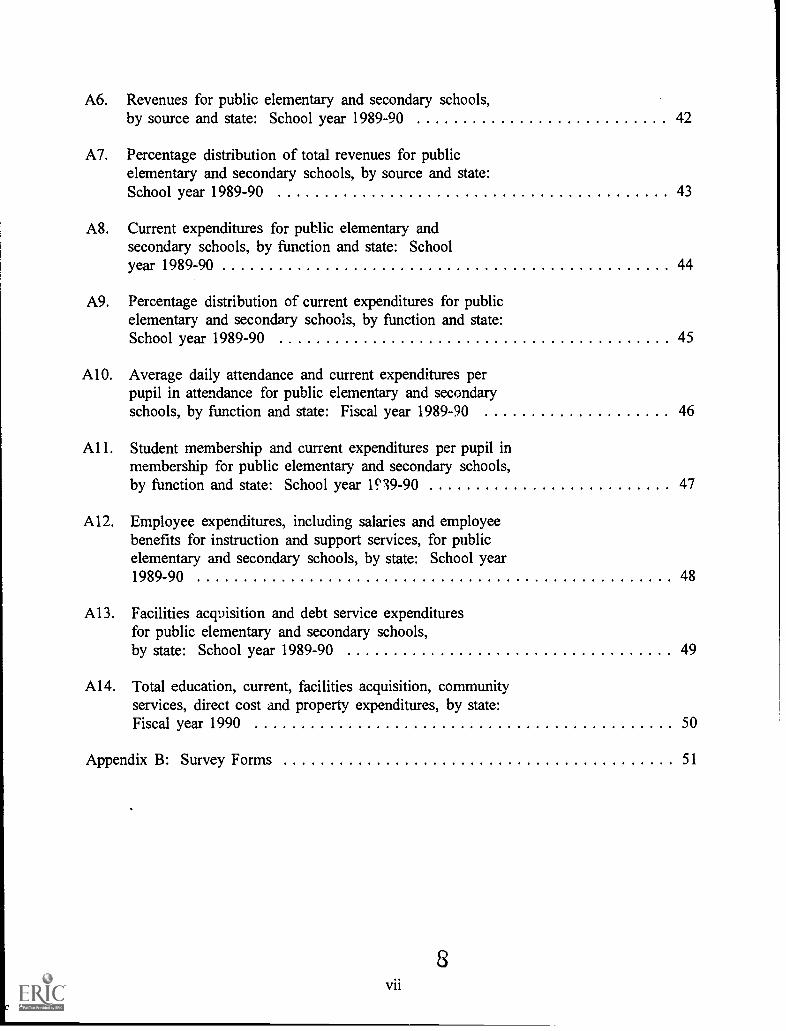
A6. Revenues for public elementary and secondary schools,by source and state: School year 1989-90 42
A7. Percentage distribution of total revenues for publicelementary and secondary schools, by source and state:School year 1989-90 43
A8. Current expenditures for public elementary andsecondary schools, by function and state: Schoolyear 1989-90 44
A9. Percentage distribution of current expenditures for publicelementary and secondary schools, by function and state:School year 1989-90 45
A10. Average daily attendance and current expenditures perpupil in attendance for public elementary and secondaryschools, by function and state: Fiscal year 1989-90 46
Al 1. Student membership and current expenditures per pupil inmembership for public elementary and secondary schools,by function and state: School year 1c19-90 47
Al2. Employee expenditures, including salaries and employeebenefits for instruction and support services, for publicelementary and secondary schools, by state: School year1989-90 48
A13. Facilities acquisition and debt service expendituresfor public elementary and secondary schools,by state: School year 1989-90 49
A14. Total education, current, facilities acquisition, communityservices, direct cost and property expenditures, by state:Fiscal year 1990 50
Appendix B: Survey Forms 51
vii

Introduction
This report presents nonfiscal information on public elementary and secondaryschools for the 1991-92 school year and finance data for the 1990-91 school year (fiscal
year 1991). It also includes an appendix containing final revised nonfiscal data for the1990-91 school year and revised finance data for the 1989-90 school year (fiscal year1990). The statistics are based on data collected through two of the four surveys of theCommon Core of Data (CCD) conducted annually by the U.S. Department of Education'sNational Center for Education Statistics (NCES).
This report differs from previous editions in three ways: 1) NCES has adjusted asubstantial amount of the reported finance data; 2) adjusted and imputed data are shown atthe state level; and 3) finance data are now labeled according to school year instead offiscal year. Adjustments are defined in this publication as cases in which a state-reportedvalue is distributed to fill in one or more items reported as missing. The term "imputation"is reserved for instances in which a value is generated to fill in a missing item, and noother values are reduced in the process. These changes were made in the hope of providingmore comparable data and to alleviate the confusion over school years and fiscal years. Alladjustmmts and imputations are described below. School year 1989-90 equates with fiscal
year 1990, and school year 1990-91 equates with fiscal year 1991.
Methodology
Data for this report were provided by state education agencies (SEAs) from theiradministrative records. NCES and the SEAs work cooperatively to ensure comparabilitybetween data elements requested and reported. Each state's CCD Coordinator was sent acopy of the previous year's nonfiscal data for his or her state with the request to update thedata with currently available information and return it to NCES. A report containing alldata provided for school years 1989-90 and 1990-91 was generated by NCES after receiptof each state's fiscal data, and sent to the state for verification or correction.
The sources of data for this report are the State Nonfiscal Survey of PublicElementary and Secondary Education, and The National Public Education Financial Surveyof the CCD series. A copy of each is included in appendix B. Responses to these surveyswere due from SEAs in the 50 states, the District of Columbia, and the five outlying areasunder U.S. jurisdiction to NCES on March 15, 1991. Data collection ceased on September8, 1992, while editing and imputation continued into March 1993. NCES edits statesubmissions, returning for confirmation or correction any items that appear to be out ofrange in light of previous reports. Other adjustments and imputations are discussed in thefollowing imputation sections. During this collection process states are encouraged to makecorrections and revisions to previous year's data. These data are reported in appendix A.
91

In compiling these data from administrative record systems, each SEA obtains datafrom the local education agencies (LEAs) that operate public schools. Each SEA may editor examine the individual LEA reports before computing state totals. While SEAs arerequested to provide counts as of the school day closest to October 1, the "as of' dates formembership counts may vary slightly from state to state.
Nonfiscal imputations. Virginia did not report any non-fiscal data for the 1991-92 schoolyear. As a result, all Virginia data and national totals are imputed in tables 1 through 5.These data were imputed by dividing current-year totals for reporting states byprevious-year totals for the same states to yield change ratios. Change ratios were thenmultiplied by corresponding data reported by Virginia for school year 1990-91. Nationaltotals include these imputed numbers. In some cases in tables 2, A2, 3 and A3 a statereported an amount for a tot:1 (example, total teachers) for which some component wasreported as missing data (example, kindergarten teachers). In these instances, the state-reported total was accepted without any attempt to impute the missing number. Unlessotherwise indicated on a table, all totzis are based on the numbers shown. Adjustments tofiscal values were based on current-year values alone. Details are given in the section onfiscal imputations.
Nonfiscal edits to missing data. NCES has made the following edit changes to nonfiscaldata. When known, we have listed specific state reporting practices concerning missingdata. All nonfiscal edits and reporting practices listed below apply to both school year1991-92 and 1990-91.
Pre-kindergarten (PK) student membership. Six states and the Virgin Islandsreported PK membership as zero or nonapplicable. NCES changed these entries to missing,because federal law requires instruction for PK students with disabilities.
Ungraded student membership. Eleven states reported zero or non-applicable forungraded student membership. In most of these states all students are assigned grades, andtherefore in those states, this category does not exist.
Pre-kindergarten CPK) teachers. Eleven states and the Virgin Islands do not reportPK teachers. Maine, Montana, and Washington include PK teachers in their teachers ofgrades 1 to 12 counts. Massachusetts includes PK teachers with kindergarten teachercounts.
Kindergarten teachers. Six states did not report kindergarten teachers. Maine,Montana, and Washington include these teachers with teachers of grades 1 to 12 counts.
Ungraded teachers. Nineteen states and the Commonwealth of Northern Marianasdid not report ungraded teachers. Maine and Montana include these teachers with theirteachers of grades 1 to 12.
210

Graduation indices. There are three indices for each state in table 5. The ratio of thenumber of regular high school graduates in 1990-91 to the number in 1989-90 is multipliedby 100 and is the first index shown. This index represents the increase (values greater than100) or the decrease (values less than 100) in numbers of regular high school graduatesfrom 1989-90 to 1990-91. This indicator of increase or decrease may be misleading byitself, since states' membership bases vary from year to year, thus changing the pool ofpotential graduates. There are several ways to adjust the uncorrected ratios to compensatefor this. The approach taken here is based on 12th-grade membership in the two schoolyears. The ratio, multiplied by 100, of the 1990-91 membership in grade 12 to the grade12 membership in 1989-90 is given. As with graduates, an increase is indicated by valuesgreater than 100 and a decrease is indicated by values less than 100. The membership ratiois then used as a correction factor to yield the adjusted ratio of graduates. This value,shown as the "graduate change index," is multiplied by 100 for ease of interpretation.Values greater than 100 indicate that the number of graduates is increasing faster than the12th-grade membership. For example, table 5 shows that the number of graduatesdecreased for the total United States in 1991 but that there was also a smaller pool oftwelfth graders.
SEA finance reports. The finance data for school years 1989-90 and 1990-91 werecollected through The National Public Education Financial Survey. NCES provided"crosswalk" software to assist states in their reporting and improve data comparabilitybetween states. This software converts a state's existing accounting reports to the federalstandard, as indicated in Financial Accounting for Local and State School Systems, 1990.
Thirty states used this software. In addition, 15 other states had their protocol forconverting data from their state accounts to the federal standard reviewed and validated.The state accounting systems in 6 states were so different from the federal standard that no"crosswalk" software or protocol validation could be accomplished.
States using "crosswalk" software:Arkansas, Colorado, Georgia, Idaho, Illinois, Kentucky, Maine, Maryland,Massachusetts, Michigan, Mississippi, Missouri, Montana, Nebraska, NewHampshire, New York, North Carolina, North Dakota, Oklahoma, Oregon,Pennsylvania, South Carolina, South Dakota, Tennessee, Utah, Washington, WestVirginia, Wisconsin, and Wyoming and the District of Columbia.
States whose protocol was reviewed and validated:Alabama, California, Florida, Hawaii, Indiana, Iowa, Kansas, Louisiana, Minnesota,Nevada, Ohio, Rhode Island, Texas, Vermont, and Virginia.
States without "crosswalk" software and whose protocol could not be validated:Alaska, Arizona, Connecticut, Delaware, New Jersey, and New Mexico.
Data from all states were edited by NCES. State specific edit reports requestingclarification and detail on missing and out of range responses were sent along with a report

of current and prior year's data and a percent change between the two years.
Imputations and adjustments on finance data for school year 1990-91. After theSeptember 8, 1992, closeout date and after all edits had been made final, NCES adjustedthe data to fi" in nearly all items reported to be missing by the states or believed missingby NCES. Facilities acquisition expenditures were imputed for the District of Columbia,and debt service expenditures were imputed for the District of Columbia and NoilhCarolina. These imputations were based on current year data. Data adjustments andimputations were performed on data for the 50 states and the District of Columbia only.Direct support in Guam was distributed across functions in current expenditures. This wasthe only direct support amount reported for any of the outlying areas.
Adjustments to items included under current expenditures took place in 22 states andin the District of Columbia. These adjustments involved distributing portions of reportedamounts into items that were reported as missing, or believed to be missing by NCES. Inmost cases guidance was sought from the states in determining which items should bedistributed, and to where they should be distributed. For example, Arizona was unable toseparate purchased services expenditures for instruction from purchased servicesexpenditures for student support. The entire amount was reported under purchased servicesfor student support. NCES distributed this amount between purchased services in the twofunctions. This resulted in an increase in the instruction expenditure reported in thispublication, and a decrease in the support services expenditures (also reported here). Theadjustments were based on the national distribution for reporting states of the relevant itemsfor the current year. They had a net effect on total current expenditures in 11 states.
The final adjustment was to distribute direct program support expenditures to theappropriate functions. These distributions occurred in 30 states and in the District ofColumbia and Guam. Direct program support expenditures are expenditures made by astate for the benefit of the LEA. Such expenditures include contributions to pension fundsand other employee benefits, student transportation or textbooks, all of which are includedin current expenditures. In the past these expenditures have been reported separately; inthis publication they are included for the first time with LEA expenditures in theappropriate function.
These adjustments had a net effect on total revenues in three states, and the effectwas less than one percent in any one state. The net effect on current expenditures occurredin 11 states, and the effect was less than 0.2 percent in any one state. More details on theseadjustments are presented below by the table number containing the data. Only thoseadjustments affecting data published in this publication are footnoted and described below.These descriptions apply to the 1990-91 fiscal data only. The methodllogy for theappendix tables containing fiscal data for school year 1989-90 are covered in a separatesection below.
12
4

The reader should refer to the database documentation for an in-depth description ofthe adjustment process. The complete database contains both the data as reported and dataas adjusted and imputed by NCES. The direct support distribution in Guam was performedfor this publication only, and is not included in the database. This publication reportsadjusted data only.
Tables 6 and 7.--Revenues. NCES distributed reported amounts within localrevenues for 1990-91 in nine states. These adjustments resulted in changes in the localrevenue subtotal in three states: Illinois, New Jersey, and South Carolina. These changesaffected total revenues in these states as well as national totals.
Tables 8, 9, 10 and 11.--Current expenditures. NCES distributed reported amountswithin current expenditures for 1990-91 in 22 states and in the District of Columbia. Theexpenditure totals for instruction and support services were affected by these adjustments inthe following seven states: Alabama, Arizona, Delaware, Kentucky, New Jersey,Washington and West Virginia. Noninstruction expenditures were affected in the following
10 states: Arizona, Colorado, Connecticut, Delaware, Maine, New Jersey, New Mexico,Oklahoma, South Carolina, and Washington.
In addition to the adjustments above, direct program support was distributed to one
or more of the expenditure categories listed above in the following 30 states: Arizona,
Arkansas, California, Connecticut, Delaware, Georgia, Idaho, Illinois, Indiana, Kansas,Kentucky, Louisiana, Maine, Maryland, Massachusetts, Michigan, Minnesota, Mississippi,Nebraska, New Jersey, New Mexico, North Carolina, Oklahoma, Pennsylvania, RhodeIsland, South Carolina, Tennessee, Texas, Vermont, and West Virginia and in the District ofColumbia and Guam.
After the above adjustments were accomplished, the net effect on currentexpenditures was observed in the following 11 states: Arizona, Colorado, Connecticut,Delaware, Maine, New Jersey, New Mexico, Oklahoma, South Carolina, Washington andWest Virginia. These changes in current expenditures occurred because of adjustments innoninstruction expenditures in all of the 11 states except West Virginia, and adjustments ininstruction expenditures in Washington and West Virginia.
Under Chapter 1 of Title I of the Elementary and Secondary Education Act of 1965,
states are to provide average daily attendance in accordance with state law; however, NCESprovides a definition for states to use in the absence of state law. Since some states usetheir own definitions and others use the NCES definition, the data on average dailyattendance are not comparable across all states.
Table 12.--Employee expenditures. NCES distributed reported amounts withincurrent expenditures for 1990-91 in 22 states and in the District of Columbia. Thesedistributions affected the amounts reported in this publication in the following functions and
states. Salaries for instruction and support services were affected by NCES adjustments in
5

Connecticut, Delaware, and New Jersey. Employee benefits for instruction and supportservices were affected by NCES adjustments in Connecticut, Delaware, Kentucky, and NewJersey.
In addition to these adjustments, some direct program support amounts weredistributed to salaries and employee benefits for both instruction and support services in thefollowing 15 states: Arizona, Arkansas, Connecticut, Delaware, Georgia, Illinois,Kentucky, Louisiana, Mississippi, Nebraska, Oklahoma, Rhode Island, South Carolina.Tennessee, and Texas. Direct support was also distributed to these items in Guam. Inaddition, the following 22 states had state employee benefits funds that were alsodistributed: Arkansas, California, Connecticut, Georgia, Idaho, Illinois, Indiana, Kansas,Kentucky, Maine, Maryland, Massachusetts, Michigan, New Jersey, New Mexico,Oklahoma, Pennsylvania, Rhode Island, Tennessee, Texas, Vermont, and West Virginia.Direct program support for employee benefits were distributed in the District of Columbiaalso.
Table 13.--Facilities acquisition and debt service expenditures. Facilities acquisitionexpenditures for 1990-91 were adjusted by NCES in the following five states: Delaware,Massachusetts, New Jersey, New Mexico, and Tennessee.
California, New Hampshire and West Virginia report interest on debt expenditureswith redemption of principal. Oklahoma reports redemption of principal with interest ondebt. NCES distributed the reported values in these four states.
The District of Columbia could not report facilities acquisition expenditures. Theseexpenditures were imputed using the national ratio of facilities acquisition to total educationexpenditures with facilities acquisition removed for the remaining 50 states. This ratio wasthen applied to the total expenditures figure reported by. the District of Columbia.
The District of Columbia and North Carolina could report neither interest on debtnor redemption of principal. NCES imputed these values by calculating the national ratiosof the remaining 49 states of interest on debt to total education expenditures andredemption of principal to total education expenditures, and then multiplying the reportedamounts for total education expenditures in these two states.
Table 14.--Total education...expenditures. The adjustments occurring in these datafor 1990-91 are described above for all categories except community services and directcost expenditures. Adjustments in community services expenditures occurred in thefollowing 13 states: Alabama, Arizona, Delaware, Florida, Kansas, Kentucky,Massachusetts, Nevada, New Jersey, Oklahoma, South Carolina, Tennessee, and Wisconsin.Adjustments in the direct cost expenditures occurred in South Carolina only. Totaleducation expenditures were affected in the following five states: Nebraska, Rhode Island,Texas, Washington, and West Virginia and in the District of Columbia.
61 4

Imputations and adjustments on finance data for school year 1989-90. After currentyear data are collected by NCES the states and territories have another calendar year tomake corrections and revisions of their data. These data replace the earlier data if anychanges have been made, and are published in this publication in appendix A. These datafor the 1989-90 school year underwent the same editing-adjustment-imputation process thatthe 1990-91 finance data went through. However, due to changes in reporting made byseveral states, there were changes in the number of states affected by these processes. Thecloseout date for the 1989-90 revisions was the same as for the 1990-91 collection,September 8, 1992.
Facilities acquisition expenditures were imputed for the District of Columbia, anddebt service expenditures were imputed for the District of Columbia and North Carolina,based on 1989-90 data and using the same procedures described above for 1990-91.Additional adjustments took place in 30 states and in the District of Columbia to fill inmissing data. Direct program support expenditures were distributed to the appropriateobjects and functions in 29 states and in the District of Columbia and Guam. All of theseadjustments used the same procedures described above for 1990-91. Data adjustments andimputations were performed on data for the 50 states and the District of Columbia only.Direct support in Guam was distributed across functions in current expenditures. This wasthe only direct support amount reported for any of the outlying areas.
These adjustments had a net effect on total revenues in three states, and the effectwas less than 3.4 percent in any one state. A net effect on current expenditures occurred in13 states, and the effect was less than 0.2 percent in any one state. More details on theseadjustments are presented below by the table number containing the data. Only thoseadjustments affecting data published in this publication are footnoted and described below.These descriptions apply to the 1989-90 fiscal data only.
Tables A6 and A7.--Revenues. NCES distributed reported amounts within localrevenues for 1989-90 in 15 states. These adjustments resulted in changes in the localrevenue subtotal in three states: Illinois, New Jersey and South Carolina. These changesaffected total revenues in these states as well as national totals.
Tables A8, A9, A 10 and Al 1 .--Current expenditures. NCES distributed reportedamounts within current expenditures for 1989-90 in 25 states. The expenditure totals forinstruction and support services were affected by these adjustments in the following sevenstates: Alabama, Arizona, Delaware, Kentucky, New Jersey, Washington and WestVirginia. Noninstruction expenditures were affected in the following 11 states: Arizona,Colorado, Connecticut, Delaware, Maine, New Jersey, New Mexico, Oklahoma, SouthCarolina, South Dakota, and Washington and in the District of Columbia.
In addiL n to the adjustments above, direct program support was distributed to oneor more of the expenditure categories listed above in the following 29 states: Arizona,Arkansas, California, Connecticut, Delaware, Georgia, Idaho, Illinois, Indiana, Kansas,
1 5
7

Kentucky, Louisiana, Maine, Maryland, Massachusetts, Michigan, Minnesota, Mississippi,Nebraska, New Jersey, North Carolina, Oklahoma, Pennsylvania, node Island, SouthCarolina, Tennessee, Texas, Vermont, and West Virginia. Direct program support in theDistrict of Columbia and Guam were also distributed.
After the above adjustments were accomplished, the net effect on currentexpenditures was observed in the following 12 states: Arizona, Colorado, Connecticut,Delaware, Maine, New Jersey, New Mexico, Oklahoma, South Carolina, South Dakota,Washington, and West Virginia and in the District of Columbia. These changes in currentexpenditures occurred because of adjustments in noninstruction expenditures in all of the 13states except West Virginia, and adjustments in instruction expenditures in Washington andWest Virginia.
Under Chapter 1 of Title I of the Elementary and Secondary Education Act of 1965,states are to provide avrage daily attendance in accordance with state law; however, NCESprovides a definition for states to use in the absence of state law. Since some states usetheir own definitions and others use the NCES definition, the data on average dailyattendance are not comparable across all states.
Table Al2.--Employee expenditures. NCES distributed reported amounts withincurrent expenditures in 30 states and in the District of Columbia. These distributionsaffected the amounts reported in this publication in the following functions and states.Salaries for instruction and support services were affected by NCES adjustments inConnecticut, Delaware, New Jersey, and New Mexico. Employee benefits for instructionand support services were affected by NCES adjustments in Connecticut, Delaware,Kentucky, New Jersey, and New Mexico.
In addition to these adjustments, some direct program support amounts weredistributed to salaries and employee benefits for both instruction and support services in thefollowing 20 states: Arizona, Arkansas, California, Connecticut, Delaware, Florida,Georgia, Illinois, Indiana, Kentucky, Louisiana, Minnesota, Mississippi, Nebraska,Oklahoma, Pennsylvania, Rhode Island, South Carolina, Tennessee, and Texas. In addition,the following 21 states had state employee benefits funds that were also distributed:Arkansas, California, Connecticut, Georgia, Idaho, Illinois, Indiana, Kansas, Kentucky,Maine, Maryland, Massachusetts, Michigan, New Jersey, Oklahoma, Pennsylvania, RhodeIsland, Tennessee, Texas, Vermont, and West Virginia. Direct program support foremployee benefits was also distributed in the District of Columbia.
Table A13.--Facilities acquisition and debt service expenditures. Facilitiesacquisition expenditures for 1989-90 were adjusted by NCES in the following five states:Delaware, Massachusetts, New Jersey, New Mexico, and Tennessee.
California, and New Hampshire report interest on debt expenditures with redemptionof principal. Oklahoma reports redemption of principal with interest on debt. NCES
168

distributed the reported values in these four states.
The District of Columbia could not report facilities acquisition expenditures. Theseexpenditures were imputed using the national ratio of facilities acquisition to total educationexpenditures with facilities acquisition removed for the remaining 50 states. This ratio wasthen applied o the total expenditures figure reported by the District of Columbia.
The District of Columbia and North Carolina could report neither interest on debtnor redemption of principal. NCES imputed these values by calculating the national ratiosof the remaining 49 states of interest on debt to total education expenditures andredemption of principal to total education expenditures, and then multiplying the reportedamounts for total education expenditures in these two states.
Table A14.--Total education...expenditures. The adjustments occurring in these datafor 1989-90 are described above for all categories except community services and directcost expenditures. Adjustments in community services expenditures occurred in thefollowing 14 states: Alabama, Arizona, Delaware, Florida, Kansas, Kentucky,Massachusetts, Nevada, New Jersey, North Carolina, North Dakota, Oklahoma, SouthCarolina and Wisconsin. Adjustments in the direct cost expenditures occurred in SouthCarolina only. Total education expenditures were affected in Washington, West Virginia,and in the District of Columbia.
Definitions
The following list defines the key terms used in this report:
Average daily attendance (ADA): The aggregate days of attendance by students ofa given school during a given reporting period divided by the number of days insession during this period; or attendance determined in accordance with state law.
Community services expenditures: Expenditures for community services tostudents, staff and community residents. Examples are community swimming pools,day care centers, or recreation or transportation programs for the elderly. Theseservices are provided by a governmental entity as a service, and are not run as. abusiness. Property expenditures (vehicles, equipment, furniture, etc.) are notincluded.
Current expenditures: Current expenditures are expenditures for the day-to-dayoperation of the school. These are expenditures for grades PK through 12, forregular elementary and secondary school programs, special education, vocationaleducation and summer school (even when students pay tuition to attend), as well asexpenditures for students and staff breakfast and lunches, cocurricular activities andathletics. This includes expenditures for the categories of ',istruction, supportservices, and noninstructional services for salaries, employee benefits, purchased
9 1 7

services, and supplies. Also included are payments by the state made for or onbehalf of school systems. This does not include expenditures for debt service andcapital outlay, and property (i.e., equipment). Direct cost (Head Start, adulteducation, community colleges, etc.) and community services expenditures are notincluded.
Direct cost expenditures: Expenditures made by LEAs for programs that are notconsidered part of public PK through 12 educational programs. Examples areexpenditures for adult education, community colleges, and nonpublic schoolprograms such as compensatory education programs for both public and privatestudents.
Employee benefits: Includes amounts paid by school districts on behalf ofemployees; these amounts are not included in gross salary, but are in addition to thatamount. Examples include group insurance, social security and retirementcontributions, and employee reimbursement for unused sick leave.
Equipment expenditures: See property expenditures.
Facilities acquisition and construction: Includes expenditures for equipment forfacilities, facilities acquisition and construction services, both property and non-property. This includes expenditures for: a) buildings built and alterationsperformed by LEA's own staff or contracted out by the LEA, b) the purchase ofland and land improvements, also assessments against LEAs for capitalimprovements, c) acquiring existing buildings, such as installment and leasepayments, and d) the initial, additional, and replacement items of equipment, such asmachinery, furniture and fixtures, and vehicles.
Fiscal year: The 12-month period beginning July 1 and ending June 30. States thatare on a different fiscal year either adjust their data submissions to correspond to theNCES definition, or report data as is and note in a cover letter that the data representtransactions occurring during a defined fiscal year. Fiscal year 1990 corresponds toschool year 1989-90, and fiscal year 1991 corresponds to school year 1990-91.
Guidance counselors/directors: Professional staff members assigned specific dutiesand school time for counseling students and parents.
High school equivalency recipients: Individuals, 19 years old or younger, whoreceived a formal document certifying that state requirements for high schoolgraduation equivalency have been met (e.g., includes General EducationalDevelopment [G.E.D.] certificate recipients).
Intermediate revenues: Revenues received from intermediate state educationagencies with independent fund-raising capability. These agencies are neither local
101 S

nor state entities. Revenues from these agencies include: unrestricted grants-in-aid,restricted grants-in-aid, revenue in lieu of taxes and revenue for or on behalf ofLEAs.
Instructional aides: Those staff members assigned to assist a teacher with routineactivities associated with teaching.
Instruction expenditures: Expenditures for activities dealing directly with theinteraction between students and teachers (salaries, including sabbatical leave,employee benefits, purchased instructional services and supplies).
Interest on debt: Debt services payments for interest on bonds and notes forobligations exceeding one year. This does not include payments on the redemptionof principal.
K: Kindergarten.
Membership: The count of students on the current roll taken on the school dayclosest to October 1 by using either 1) the sum of original entries and reentriesminus total withdrawals, or 2) the sum of the total present and the total absent.
Noninstructional expenditures: Expenditures for food service operations and otherauxiliary enterprise operations (bookstore and interscholastic athletics), excludingcommunity services (e.g., child care or swimming pool).
Officials and administrators: Chief executive officers of the education agencies,including superintendents, deputies, and assistant superintendents, and other personswith districtwide responsibilities (e.g., business managers, administrative assistants,professional instructional support staff, Chapter I coordinators, and home economicssupervisors).
Other diploma recipients: Individuals who received a diploma from programsother than the regular school program (e.g., night school graduates and state diplomarecipients).
Other high school completers: Individuals who have received a certificate ofattendance or other certificate of completion in lieu of a diploma.
Other support staff: All other staff who serve in a support capacity and afe notincluded in the categories of central office administrative support, library support, orschool administrative support (e.g., social workers, bus drivers, and health,maintenance, security, and cafeteria workers).
PK: Prekindergarten.

Prekindergarten students: Those students who are enrolled in a group or class thatis part of a public school program taught during the year or years precedingkindergarten, excluding students in Head Start programs that are not operated by thelocal education agency.
Property expenditures: Expenditures for property, machinery and equipment.These are defined as items which are not consumed or worn out through use.Examples are buildings, computers, desks, furniture, furnishings, land, tools,typewriters, and vehicles. These expenditures are not included in currentexpenditures. Property expenditures reported here include expenditures for all publiceducation functions. (Supplies such as textbooks, periodicals, teaching, medical andaudiovisual supplies, oil, gasoline, and property maintenance are NOT included asproperty expenditures, but as current expenditures.)
Regular high school graduates: Individuals who received a regular diplomarecognizing the completion of secondary school requirements during the previousschool year and subsequent summer school. Excludes high school equivalency andother diploma recipients, and other high school completers (e.g., those granted acertificate of attendance).
Revenues: Increases in the net current assets of a government fund type fromsources other than expenditure refunds and residual equity transfers. Reported asrevenues from local, intermediate, state and federal sources.
Revenues from federal sources: Direct grants-in-aid from the federal government;federal grants-in-aid through the state or an intermediate agency; and other revenuesuch as that in lieu of taxes had the tax base been subject to taxation.
Revenues from intermediate sources: Revenues from an educational governmentagency, which should have independent fund-raising capability, that is not a localeducation or state agency (e.g., New York's Board of Cooperative EducationalServices).
Revenues from local sources: Revenues from a local education agency, includinglocal property and nonproperty tax revenues; revenues from local government;tuition; transportation; revenues from food services, student activities, and textbooksales; donations; and property rentals.
Revenues from state sources: Revenues from a state government source, includingthose that can be used without restriction; those for categorical purposes; revenues inlieu of taxation.
Revenues from the state for/on behalf of school districts: Payments made by astate for the benefit of the LEA, or contributions of equipment or suppli:s. Such
12
20

revenues include the payment of a pension fund by the state on behalf of an LEAemployee for services rendered to the LEA; contributions of fixed assets (property,plant, and equipment) such as school buses and textbooks.
Salaries for instruction: Includes gross salary of regular and part-time teachers,teachers' aides, homebound teachers, hospital based teachers, substitute teachers andteachers on sabbatical leave who are on LEA payrolls. (See instructionalexpenditures.)
Salaries for support services: Includes salaries for all LEA employees providingadministrative, technical (such as guidance and health), operation, maintenance andtransportation services that facilitate and enhance instruction. (See support servicesexpenditures.)
School administrators: Staff members whose activities are concerned withdirecting and managing the operation of a particular school, including principals,assistant principals, other assistants, and those who supervise school operations,assign duties to staff members, supervise and maintain the records of the school, andcoordinate school instructional activities with those of the education agency,including department chairpersons.
State education agencies: The agency of the state charged with primaryresponsibility for coordinating and supervising public instruction including thesetting of standards for elementary and secondary instructional programs.
Student-teacher ratio: Student-teacher ratios are the ratio of total students to totalteachers. Staffing ratios vary widely depending on grade level, subject and studentability.
Support services expenditures: Expenditures for student support services(attendance, guidance, health, speech, and psyshological), staff support services(improvement of instruction, and educational media, including librarians), generaladministration (board of education and central office), school administration(principal), business (fiscal services, purchasing, warehousing, and printing),operation and maintenance of plant, student transportation services, and centralexpenditures (research, information services, and data processing).
Teachers: Those who provide instruction to prekindergarten, kindergarten, grades 1through 12, or ungraded classes. Those who teach in an environment other than aclassroom setting are also included.
Total education expenditures: Decreases in net financial resources for thepurposes of public education. These consist of current, property, and facilities
21
13

acquisition expenditures, as well as other expenditures not directly related to pre-Kthrough 12 programs such as adult education and community colleges. These "otherexpenditures" are reported as community services and direct cost expenditures.
Ungraded students: Those students assigned to classes or programs that do nothave standard grade designations.
Acknowledgments
The author would like to thank all of the people in the state education agencies whosupplied data for this publication. This publication would not have been possible withouttheir contributions. I also wish to thank the staff of Pelavin Associates Inc. for developingthe financial "crosswalk" software and 'validating state protocols, and the staff of PinkertonComputer Associates Inc. for developing the nonfiscal data collection software, andassistance with edit reports and data imputations and adjustments. I would like to thankLee Hoffman, Bill Fowler and John Sietsema of NCES for their guidance and expertise andMary Rochon for file management and support.
The author gratefully acknowledges the comments and suggestions of the reviewers:Jewell Gould of American Federation of Teachers, Tom Szuba of the Council of ChiefState Sciiool Officers, and Bob Burton, Marilyn McMillen, Kristin Keough, and Larry Ogleof NCES.
2214

23
Tables
15

Table 1.--Public school membership, by grade and state: Fall 1991
State Total
Pre-kinder-garten a/
Kinder-garten Grade 1 Grade 2 Grade 3 Grade 4 Grade 5
United States 42,000,343 3,305,619 3,754,274 3,359,193 3,333,285 3,312,443 3,268,381
Alabama 722,004 --- 54,125 58,744 57,130 60,086 58,520 59,255Alaska 118,680 1,914 10,405 11,047 10,256 9,677 9,883 9,407Arizona 656,980 2,411 54,410 59,071 55,486 55,616 54,684 52,953Arkansas 438,518 --- 33,799 35,567 33,978 34,394 34,496 34,704California 5,107,145 428,392 444,101 427,612 420,018 412,613 401,538
Colorado 593,030 5,358 47,875 50,551 49,441 49,787 49,387 47,962Connecticut 481,050 5,486 40,822 43,092 39,905 38,420 37,381 36,476Delaware 102,196 435 8,137 8,931 8,450 8,334 8,185 8,269District of Columbia 80,618 4,538 6,578 7,280 6,651 6,269 5,961 5,596Florida 1,932,131 26,784 161,688 170,096 164,759 162,741 159,330 153,373
Georgia 1,177,569 1,315 97,590 100,215 97,385 98,224 98,491 97,102Hawaii 174,747 498 14,353 14,322 14,342 14,089 13,677 13,271Idaho 225,680 1,097 15,133 17,123 17,653 18,066 18,437 18,225Illinois 1,848,166 37,039 139,544 149,246 140,697 133,154 134,185 136,007Indiana 956,994 2,437 66,881 77,519 72,718 73,678 75,214 75,009
Iowa 491,363 5,128 37,841 37,702 36,419 37,414 37,134 37,897Kansas 445,390 2,072 35,866 37,265 35,571 36,016 35,623 35,589Kentucky 646,024 11,926 46,695 50,422 48,653 49,006 49,495 50,245Louisiana 765,589 7,398 59,207 66,261 60,639 61,077 61,635 60,113Maine 216,400 1,503 18,625 18,273 17,609 17,263 16,860 16,595
Maryland 736,238 15,567 57,658 62,664 61,405 60,608 59,493 57,493Massachusetts 846,155 9,491 72,974 74,646 69,876 66,903 65,960 64,107Michigan 1,591,120 11,211 137,322 133,653 123,316 120,317 117,349 117,623Minnesota 773,571 5,549 63,500 63,958 61,871 61,875 62,111 61,520Mississippi 504,127 732 36,569 42,435 39,574 39,662 40,953 41,172
Missouri 827,404 --- 66,072 69,005 65,789 66,616 64,324 64,467Montana 155,779 437 11,995 13,199 12,548 12,428 12,533 12,572Nebraska 279,552 2,797 22,218 22,526 22,236 22,170 22,460 22,678Nevada 211,610 795 17,479 19,044 18,356 18,101 17,886 17,420New Hampshire 177,138 850 7,793 18,580 15,490 15,404 15,117 14,124
New Jersey 1,109,796 8,261 85,469 92,344 85,483 83,101 82,100 80,584New Mexico 308,667 1,231 23,276 25,868 24,546 24,482 23,829 23,481New York 2,643,993 30,025 197,128 217,128 202,847 198,973 194,841 190,126North Carolina 1,097,598 3,925 88,324 90,920 86,560 85,738 85,288 84,132North Dakota 118,376 657 9,273 9,682 9,286 9,626 9,575 9,580
Ohio 1,783,767 12,393 142,085 149,298 137,639 138,115 140,401 141,271Oklahoma 588,263 3,403 45,509 55,572 48,386 48,745 48,260 47,091Oregon 498,614 1,034 37,547 40,981 40,295 40,936 40,717 39,438Pennsylvania 1,692,797 3,108 130,364 143,470 130,300 129,814 128,87r- -126,614Rhode Island 142,144 369 :0,680 13,319 11,827 11,235 11,122 10,872
South Carolina 627,470 ..._... 43,587 55,470 50,654 50,951 52,206 52,094South Dakota 131,576 531 10,451 10,768 10,477 10,465 10,793 10,727Tennessee 833,651 --- 64,183 71,789 64,974 64,362 65,776 65,237Texas 3,464,371 102,371 258,597 303,173 282,566 279,476 278,636 276,444Utah 456,430 2,212 33,193 34,189 34,818 35,487 37,215 36,749
Vermont 97,137 1,577 8,033 8,638 8,476 8,327 7,996 7,776Virginia b/ 1,016,204 1,825 84,565 85,148 79,677 79,331 78,694 77,490Washington 869,327 3,674 68,532 73,118 71,888 72,876 72,586 70.854West Virginia 320,249 1,779 22,192 23,131 22,418 23,453 24,110 24,335Wisconsin 814,671 13,791 63,479 65,293 62,043 62,311 61,775 61,989Wyoming 102,074 1,505 7,606 8,437 8,018 8,066 8,269 8,135
Outlylng areasAmerican Samoa 13,365 1,446 1,063 1,083 1,031 961 960 866Guam 2,244 381 2,459 2,481 2,415 2,323 2,305 2,250Northern Marianas 7,096 449 548 642 584 639 587 561Puerto Rico 642,392 651 36,250 55,145 51,020 51,997 54,855 55,167Virgin Islands 22,346 -.... 1,601 1,820 1,772 1,841 1,849 1,775
See footnotes at end of table.
16

Table 1.--Public school membership, by grade and state: Fall 1991--continued
State Grade 6 Grade 7 Grade 8 Grade 9 Grade 10 Grade 11 Grade 12 Ungraded a/
United States b/ 3,238,095 3,180,120 3,019,826 3,310,290 2,913,951 2,642,554 2,390,329
Alabama 61,091 60,915 56,607 60,210 48,417 45,179 41,725
Alaska 9,213 8,892 8,430 8,449 7,670 6,816 6,621 ---
Arizona 51,882 50,528 47,200 49,038 43,323 37,828 36,122 6,428
Arkansas 34,999 35,797 34,527 33,693 31,583 29,389 27,544 4,048
California 386,807 370,964 355,168 398,734 370,635 324,395 260,693 105,475
Colorado 46,531 44,823 42,334 44,345 40,656 38,164 33,108 2,708
Connecticut 35,273 34,524 32,968 35,258 31,895 30,083 28,339 11,128
Delaware 8,136 8,175 7,503 8,085 7,365 6,238 5,953 ---
District of Columbia 5,026 5,404 4,976 4,947 5,452 4,108 3,415 4,417
Florida 148,760 144,717 135,365 152,073 135,114 117,121 100,210 _....
Georgia 97,588 92,686 87,534 100,108 77,648 68,761 62,922 ---
Ha,aii 12,822 11,808 11,270 12,550 11,260 10,395 9,290 10,800
Idaho 18,412 18,550 17,803 17,855 16,617 15,084 14,097 1,528
Illinois 139,838 135,954 127,656 139,324 127,636 115,193 104,837 87,856
Indiana 76,514 76,002 73,839 79,913 69,240 65,013 60,657 12,360
Iowa 37,818 36,755 35,449 36,745 34,019 33,332 31,648 16,062
Kansas 34,859 33,390 31,943 33,772 30,294 27,996 25,889 9,245
Kentucky 51,210 50,568 49,136 53,502 45,549 41,277 36,131 12,009
Louisiana 59,665 60,611 54,215 59,256 48,913 40,924 35,999 29,676
Maine 16,016 16,086 15,679 15,916 14,828 14,293 13,861 2,993
Maryland 56,466 54,300 50,447 55,972 46,806 42,794 40 512 14,053
Massachusetts 62,480 61,354 59,263 62,699 58,451 55,551 53,464 8,936
Michigan 117,366 116,810 111,938 122,650 105,457 98,248 90,180 67,680
Minnesota 60,329 59,216 56,806 56,892 54,571 53,208 52,165 ---
Mississippi 40,059 40,920 37,514 39,664 33,125 29,202 25,713 16,833
Missouri 65,811 65,388 62,351 67,214 58,356 54,138 49,503 8,370
Montana 12,289 11,977 11,815 11,842 11,057 10,181 9,597 1,309
Nebraska 22,271 21,394 20,617 21,310 19,540 19,229 18,106 ---
Nevada 16,665 15,974 15,205 15,412 14,311 13,070 11,283 809
New Hampshire 13,951 13,567 12,881 13,541 11,773 11,516 10,483 1,468
New JerseyNew MexicoNew YorkNorth CarolinaNorth Dakota
79,653 79,196 75,556 80,717 73,572 70,104 67,395 66,261
22,919 22,007 21,197 23,314 20,858 18,271 15,923 17,465
187,853 188,586 180,718 214,204 192,056 166,438 141,546 141,524
84,845 84,743 81,895 90,900 77,775 70,085 64,061 18,403
9,203 9,128 8,929 9,006 8,..34 8,174 7,821 ...._
Ohio 140,710 140,577 131,604 146,702 126,485 119,757 113,420 3,310
Oklahoma 46,283 44,792 43,176 44,238 40,096 35,492 35,684 1,536
Oregon 38,876 39,230 37,872 38,787 36,113 33,305 30,226 3,257
Pennsylvania 127,185 127,014 121,836 134,714 120,084 113,642 107,758 48,017
Rhode Island 10,600 10,531 10,053 10,774 9,868 8,742 8,277 3,875
South Carolina 52,301 51,424 47,352 55,650 43,947 37,196 34,638 ---
South Da%ota 10,713 10,433 9,762 9,651 9,045 8,339 7,692 1,729
Tennessee 63,714 65,961 61,623 68,300 58,652 53,117 49,011 16,952
Texas 275,909 266,704 251,107 285,063 227,350 199,643 177,332 ---
Utah 37,367 36,667 33,114 34,977 33,174 29,852 27,575 9,841
Vermont 7,537 7,313 7,029 6,568 6,032 5,715 5,529 591
Virginia lb 78,269 76,712 74,406 80,993 69,298 61,243 61,566 24,987
Washington 69,199 66,904 63,150 67,184 60,170 i...,154 53,038 ---
West Virginia 24,927 25,574 25,740 26,694 24,204 22,948 21,611 7,133
Wisconsin 61,661 60,456 57,757 63,354 57,870 56,774 53,734 12,384
Wyoming 8,224 8,119 7,511 7,531 7,307 6,837 6,425 88
Outlying areasAmerican Samoa 901 869 870 912 898 791 658 56
Guam 2,219 2,004 1,872 2,584 2,131 1,626 1,169 25
Northern Marianas 544 582 482 388 378 392 310 10
Puerto Rico 53,592 56,879 50,677 47,433 32,557 12,480
irgin Islands 1,684 1,76145,413 38,276
1,231 957 9701,672 2,078 1,335
a/ National totals are omitted for prekindergarten and ungraded students because of noncomparability ofdata across states. These counts are included in total student membership. See text for details.
b/ Virginia did not report any nonfiscal data for fall 1991. All counts for Virginia and ational totalsare imputed based on previous year's data. See text for details.Data missing or not applicable. See text for details.
SOURCE: U.S. Department of Education, National Center for Education Statistics, Common Core of Data,"State Nonfiscal Survey."
17

Table 2.--Public school student-teacher ratio, student membership, and teachers, by grade level and state: Fall 1991
Teachers
State
Student- Pre- Teachers Teachersteacher Total Total kindergarten Kindergarten of grades of ungradedratio membership teachers teachers a/ teachers a/ 1 to 12 classes a/
United States 17.3 42,000,343 2,431,622 2,155,360
Alabama 17.8 722,004 40,480 --- 3,413 37,067Alaska 16.7 118,680 7,118 35 342 6,741Arizona 19.3 656,980 33,978 94 1,367 32,517 ---Arkansas 17.0 438,518 25,785 --- 1,802 23,900 83California 22.8 5,107,145 224,000 14,600 206,200 3,200
Colorado 17.9 593,030 33,093 134 1,197 31,762 ---Connecticut 14.0 481,050 34,383 245 1,326 28,184 4,628Delaware 16.8 102,196 6,095 22 189 5,884District of Columbia 13.2 80,618 6,087 247 344 5,287 209Florida 17.6 1,932,131 109,939 742 6,306 82,004 20,887
Georgia 18.5 1,177,569 63,816 70 4,583 59,163 ---Hawaii 18.5 174,747 9,451 --- --- 8,366 1,085Idaho 19.4 225,680 11,626 63 384 11,064 115Illinois 16.8 1,848,166 110,143 890 4,052 88,162 17,039Indiana 17.5 956,994 54,546 144 1,955 50,467 1,980
Iowa 15.7 491,363 31,395 343 1,589 28,379 1,084Kansas 15.2 445,390 29,324 103 999 25,050 3,172Kentucky 17.2 646,024 37,571 370 1.441 35,760Louisiana 16.6 765,589 46,118 193 2,952 34,868 8,105Maine 14.0 216,400 15,416 --- --- 15,416
Maryland 16.9 736,238 43,616 303 1,416 41,897 ---Massachusetts 15.1 846,155 55,963 --- 1,622 46,795 7,546Michigan 19.2 1,591,120 82,967 547 3,270 69,054 10,096Minnesota 17.2 773,5,1 44,903 29 1,462 43,412 ---Mississippi 17.9 504,127 28,111 17 1,328 25,940 826
Missouri 15.8 827,404 52,306 419 2,233 49,654Montana 15.8 155,779 9,883 --- --- 9,883Nebraska 14.7 279,552 19,069 178 1,416 17,475 ---Nevada 18.6 211,810 11,409 74 467 9,590 1,278New Hampshire 15.5 177,138 11,464 68 241 11,155 ---
New Jersey 13.8 1,109,796 80,515 243 2,556 67,656 10,060New Mexico 17.6 308,667 17,498 80 757 13,720 2,941New York 15.4 2,643,993 171,914 1,777 6,862 137,766 25,509North Carolina 16.8 1,097,598 65,326 272 5,080 50,520 9,454North Dakota 15.3 118,376 7,733 72 273 7,388
Ohio 17.3 1,783,767 103,372 150 2,927 100,295 ---Oklahoma 15.6 588,263 37,650 82 1,231 32,386 3,951Oregon 18.6 498,614 26,745 52 952 24,851 890Pennsylvania 16.8 1,692,797 100,475 --- --- 89,035 11,440Rhode Island 14.6 .42,144 9,709 29 292 8,079 1,309
South Carolina 16.9 627,470 37,115 419 1,161 35,535South Dakota 14.8 131,576 8,868 14 291 7,485 1,078Tennessee 19.4 833,651 43,062 --- --- 43,062Texas 15.8 3,464,371 219,192 2,483 10,837 205,872Utah 24.9 456,430 18,305 59 691 15,359 2,196
Vermont 13.8 97,137 7,031 111 278 5,433 1,209Virginia 0/ 15.7 1,016,204 64,537 93 3,145 60,700 599Washington 20.2 869,327 42,931 --- --- 39,628 3,303West Virginia 15.3 320,249 20,997 39 829 16,647 3,482Wisconsin 15.7 814,671 52,028 256 2,057 47,180 2,535Wyoming 15.6 102,074 6,564 --- 214 5,667 683
Outlying areasAmerican Samoa 19.9 13,365 671 48 34 533 56Guam 16.6 28,244 1,699 19 125 1,547 8Northern Marianas 16.5 7,096 430 25 24 381 ---Puerto Rico 17.2 642,392 37,291 75 1,068 33,753 2,395Virgin Islands 14.1 22,346 1,581 --- 74 1,376 131
a/ National totals are omitted for prekindergarten and kindergarten teachers and teachers of ungraded classes becauseof noncomparability of data across States. See text for details.
b/ Virginia data and national totals are imputed based on previous year data. See text for details.Data missing or not applicable. See text or details.
SOURCE: U.S. Department of Education, National Center for Education Statistics, Common Core of Data, "Sta:e Nonfiscal Survey."
18 26

Table 3.--Number of staff employed by public school systems and percentacre of total staff, by category and state:
Fall 1991
Instructional staff
Administrative staff
State
Totalstaff
Teachers
Number Percent
Instructional aides
Number Percent
Officials andadministrators
Number Percent
Schooladministrators
Number Percent
United States 4,546,437 2,431,622 53.5 410,498 9.0 75,679 1.7 128,580 2.8
Alabama 81,950 40,48n 49.4 3,543 4.3 1,579 1.9 2,444 3.0
Alaska 13,992 7,118 50.9 1,626 11.6 1236 8.8 408 2.9
Arizona 65,505 33,978 51.9 5,489 8.4 990 1.5 1,445 2.2
Arkansas 51,652 25,785 49.9 4,511 8.7 582 1.1 1,961 3.8
California 429,387 224,000 52.2 55,290 12.9 5,800 1.4 12,500 2.9
Colorado 62,592 33,093 52.9 4,441 7.1 820 1.3 2,508 4.0
Connecticut 60,500 34,383 56.8 5,547 9.2 1,102 1.8 1,472 2.4
Delaware 10,987 6,095 55.5 732 6.7 143 1.3 380 3.5
District of Columbia 10,464 6,087 58.2 308 2.9 377 3.6 342 3.3
Florida 219,733 109,939 50.0 21,384 9.7 3,024 1.4 6,063 2.8
Georgia 132,921 63,816 48.0 17,534 13.2 632 0.5 4,921 3.7
Hawaii 15,697 9,451 60.2 1,049 6.7 103 0.7 441 2.8
Idaho 18,621 11,626 62.4 1,402 7.5 291 1.6 582 3.1
Illinois 196,920 110,143 55.9 15,607 7.9 1,684 0.9 4,383 2.2
Indiana 108,224 54,546 50.4 11,912 11.0 1,414 1.3 2,735 2.5
Iowa 60,413 31,395 52.0 4,536 7.5 1,198 2.0 1,728 2.9
Kansas 51,637 29,324 56.8 3,150 6.1 475 0.9 1,575 3.1
Kentucky 77,165 37,571 48.7 7,652 9.9 1,571 2.0 1,767 2.3
Louisiana 91,928 46,118 50.2 8,433 9.2 66 0.1 1,446 1.6
Maine 27,082 15,416 56.9 3,386 12.5 803 3.0 871 3.2
Maryland 79,925 43,616 54.6 6,231 7.8 332 0.4 2,441 3.1
Massachusetts 98,974 55,963 56.5 9,009 9.1 2,049 2.1 2,072 2.1
Michigan 178,111 82,967 46.6 12,969 7.3 1,395 0.8 5,051 2.8
Minnesota 75,924 44,903 59.1 7,888 10.4 1,591 2.1 1,603 2.1
Mississippi 59,200 28,111 47.5 9,788 16.5 956 1.6 1,379 2.3
Missouri 103,548 52,306 50.5 5,009 4.8 1,771 1.7 2,419 2.3
Montana 13,078 9,883 75.6 1,373 10.5 337 2.6 484 3.7
Nebraska 34,676 19,069 55.0 3,065 8.8 663 1.9 1,099 3.2
Nevada 13,145 11,409 86.8 0 0.0 270 2.1 507 3.9
New Hampshire 20,535 11,464 55.8 2,253 11.0 411 2.0 597 2.9
New Jersey 148,491 80,515 54.2 10,000 6.7 1,347 0.9 6,769 4.6
New Mexico 34,509 27,498 50.7 4,080 11.8 882 2.6 1,172 3.4
New York 338,335 171,914 50.8 24,110 7.1 3,853 1.1 6,815 2.0
North Carolina 126,332 65,326 51.7 19,407 15.4 2,039 1.6 3,775 3.0
North Dakota 14,253 7,733 54.3 1,135 8.0 341 2.4 376 2.6
Ohio 194,727 103,372 53.1 9,229 4.7 5,534 2.8 4,792 2.5
Oklahomz 69,725 37,650 54.0 5,746 8.2 635 0.9 1,908 2.7
Oregon 50,479 26,745 53.0 4,746 9.4 981 1.9 1,449 2.9
Pennsylvania 190,607 100,475 52.7 11,316 5.9 13,213 6.9 4,046 2.1
Rhode Island 15,452 9,709 62.8 1,217 7.9 275 1.8 378 2.4
South Carolina 66,597 37,115 55.7 6,597 9.9 826 1.2 2,134 3.2
South Dakota 14,753 8,868 60.1 1,205 8.2 304 2.1 511 3.5
Tennessee 84,412 43,062 51.0 7,963 9.4 801 0.9 4,168 4.9
Texas 337,473 219,192 65.0 33,976 10.1 5,436 1.6 12,089 3.6
Utah 33,290 18,305 55.0 3,812 11.5 368 1.1 837 2.5
Vermont 13,923 7,031 50.5 2,052 14.7 459 3.3 489 3.5
Virginia 5/ 130,621 64,537 49.4 10,283 7.9 1,989 1.5 3,283 2.5
hashington 78,039 42,931 55.0 6,797 8.7 1,050 1.3 2,335 3.0
West Virginia 38,550 20,997 54.5 2,748 7.1 461 1.2 1,145 3.0
Wisconsin 88,249 52,028 59.0 7,741 8.8 958 1.1 2,154 2.4
Wyoming 13,134 6,564 50.0 1,221 9.3 262 2.0 331 2.5
Outlying areasAmerican Samoa 1,277 671 52.5 12 0.9 18 1.4 54 4.2
Guam 3,157 1,699 53.8 101 3.2 7 0.2 65 2.1
Northern Marianas 906 430 47.5 106 11.7 43 4.7 37 4.1
Puerto Rico 67,948 37,291 54.9 10 0.0 1,813 2.7 1,217 1.8
Virgin Islands 3,290 1,581 48.1 330 10.0 113 3.4 81 2.5
See Footnotes at end of table.
192

Table 3.--Number of staff employed by public school systems and percentage of total staff, by categoryand state: Fall 1991--continued
Support staff
StateTotalstaff
Guidancecounselors/directors
Number Percent
Librarians
Number Percent
Other supportstaff
Number Percent
United States 4,546,437 81,774 -1.8 49,718 1.1 1,368,566 30.1
Alabama 81,950 1,530 1.9 1,206 1.5 31,168 38.0Alaska 13,992 232 1.7 156 1.1 3,216 23.0Arizona 65,505 874 1.3 671 1.0 22,058 33.7Arkansas 51,652 1,185 2.3 949 1.8 16,679 32.3California 429,387 5,800 1.4 1,200 0.3 124,797 29.1
Colorado 62,592 1,053 1.7 743 1.2 19,934 31.8Connecticut 60,500 1,594 2.6 665 1.1 15,737 26.0Delaware 10,987 179 1.6 113 1.0 3,345 30.4District of Columbia 10,464 303 2.9 187 1.8 2,860 27.3Florida 219,733 4,592 2.1 2,566 1.2 72,165 32.8
Georgia 132,921 1,723 1.3 1,935 1.5 42,360 31.9Hawaii 15,697 513 3.3 267 1.7 3,873 24.7Idaho 18,621 354 1.9 172 0.9 4,194 22.5Illinois 196,920 2,849 1.4 2,055 1.0 60,199 30.6Indiana 108,224 1,526 1.4 1,016 0.9 35,075 32.4
Iowa 60,413 1,254 2.1 670 1.1 19,632 32.5Kansas 51,637 1,226 2.4 938 1.8 14,949 29.0Kentucky 77,165 1,169 1.5 1,141 1.5 26,294 34.1Louisiana 91,928 897 1.0 1,158 1.3 33,810 36.8Maine 27,082 630 2.3 253 0.9 5,723 21.1
Maryland 79,925 1,641 2.1 1,070 1.3 24,594 30.8Massachusetts 98,974 1,838 1.9 560 0.6 27,483 27.8Michigan 178All 3,025 1.7 1,573 0.9 71,131 39.9Minnesota 75,924 902 1.2 791 1.0 18,246 24.0Mississippi 59,200 778 1.3 652 1.1 17,536 29.6
Missouri 103,548 1,941 1.9 1,252 1.2 38,850 37.5Montana 13,078 360 2.8 335 2.6 306 2.3Nebraska 34,676 644 1.9 539 1.6 9,597 27.7Nevada 13,145 395 3.0 217 1.7 347 2.6New Hampshire 20,535 554 2.7 253 1.2 5,003 24.4
New Jersey 148,491 3,001 2.0 1,700 1.1 45,159 30.4New Mexico 34,509 614 1.8 238 0.7 10,025 29.1New York 338,335 5,490 1.6 3,186 0.9 122,967 36.3North Carolina 126,332 2,493 2.0 2,134 1.7 31,158 24.7North Dakota 14,253 199 1.4 177 1.2 4,292 30.1
Ohio 194,727 3,219 1.7 1,678 0.9 66,903 34.4Oklahoma 69,725 1,203 1.7 806 1.2 21,777 31.2Oregon 50,479 1,160 2.3 746 1.5 14,652 29.0Pennsylvania 190,307 3,549 1.9 2,205 1.2 55,803 29.3Rhode Island 15,452 294 1.9 102 0.7 3,477 22.5
South Carolina 66,597 1,425 2.1 1,082 1.6 17,418 26.2South Dakota 14,753 285 1.9 191 1.3 3,389 23.0Tennessee 84,412 1,034 1.2 1,284 1.5 26,100 30.9Texas 337,473 8,648 2.6 3,584 1.2 54,148 16.0Utah 33,290 405 1.2 249 0.7 9,314 28.0
Vermont 13,923 306 2.2 192 1.4 3,394 24.4Virginia a/ 130,621 3,044 2.3 1,740 1.3 45,745 35.0Washington 78,039 1,506 1.9 1,209 1.5 22,211 28.5West Virginia 38,550 544 1.4 377 1.0 12,278 31.8Wisconsin 88,249 1,527 1.7 993 1.1 22,848 25.9Wyoming 13,134 267 2.0 142 1.1 4,347 33.1
Outlying areasAmerican SamoaGuam
1,2773,157
25
682.0
2.26
31
0.51.0
4911,186
38.437.6
Northern Marianas 906 24 2.6 10 1.1 256 28.3Puerto Rico 67,948 808 1.2 818 1.2 25,991 38.3Virgin Islands 3,290 79 2.4 40 1.2 1,066 32.4
a/ Virginia and national totals are imputed based on previuos year data. See text for details.SOURCE: U.S. Department of Education, National Center for Education Statistics, Common Core of Data,
"State Nonfiscal Survey..
20 2"7

Table 4.--Number of public school graduates, 12th-grade student membership, and 9th-grade student membership
3 years earlier, by state: School year 1990-91
State
Regularhigh schoolgraduates1990-91 a/
Otherdiploma
recipients1990-91 b/
12th-grade
membership1990-91
United States 2,237,482 2,381,083
Alabama 39,042 42,031
Alaska 5,458 6,486
Arizona 31,282 --- 34,645
Arkansas 25,668 1 27,734
California 234,164 39,226 244,142
Colorado 31,293 --- 33,582
Connecticut 27,290 54 27,859
Delaware 5,223 142 5,897
District of Columbia 3,369 --- 3,481
Florida 87,419 1,418 94,776
Georgia 60,088 --- 62,379
Hawaii 8,974 275 9,234
Idaho 11,961 73 13,095
Illinois 103,329 --- 105,541
Indiana 58,558 1,288 62,740
Iowa 28,593 175 30,928
Kansas 24,414 --- 26,089
Kentucky 35,835 328 37,577
Louisiana 33,489 --- 37,983
Maine 13,151 406 13,817
Maryland 39,014 40,529
Massachusetts 52,075 --- 53,484
Michigan 88,234 3,184 91,769
Minnesota 46,474 --- 51,324
Mississippi 23,665 156 26,411
Missouri 46,928 49,925
Montana 9,013 --- 9,609
Nebraska 16,500 71 17,680
Nevada 9,370 791 11,197
New Hampshire 10,059 --- 10,408
New Jersey 67,003 --- 67,716
New Mexico 15,157 144 15,454
New York 133,562 3,197 142,514
North Carolina 62,792 58 65,720
North Dakota 7,573 --- 7,960
Ohio 107,484 118,605
Oklahoma 33,007 35,671
Oregon 24,597 105 30,018
Pennsylvania 104,770 108,592
Rhode Island 7,744 5 8,167
South Carolina 33,063 1,027 35,393
South Dakota 7,127 7,758
Tennessee 44,847 --- 49,050
Texas 174,306 3,010 178,390
Utah 22,219 1,269 26,263
Vermont 5,212 --- 5,424
Virginia c/ 5P.:-.1 955 61,328
Washington 42,514 --- 51,856
West Virginia 21,064 22,045
Wisconsin 49,340 54,562
Wyoming 5,728 6,245
Outlying areasAmerican Samoa 597 599
Guam 1,014 --- 1,120
Northern Marianas 273 3 326
Puerto Rico 29,329 10,946 31,496
Virgin Islands 986 71 1,128
9tn- High school Othergrade equivalency high school
membership recipients completers
1987-88 1990-91 b/ 1990-91 b/
3,142,991
59,480 --- 1,539
7,549 715 5
43,183 3,165 149
33,489 2,596 2,124
345,654 3,281 90
42,018 1392,672---34,707
7,6841,480
343 63
5,665 734 49
142,768 15,277 447
93,881 ---
11,791 --- 210
15,000 157 49
133,306 --- ---
77,716 3,961 285
33,296 1,679 144
30,098 ---
51,188 ---
61,716 7,127
16,651 1,116 108
53,370 1,957 864
65,364 --- ---
126,279 4,238 350
51,900 2,708 ---
38,370 2,662 1,657
64,700 3,257
10,620 719 ---
19,123 498 55
12,112 708 42
13,206 2,276 ---
81,639 8,430 ---
21,818 1,854 76
207,361 13,717 164
91,845 4,283 1,557
8,735 256 ---
148,565 4,34743,738 6,293 ---
34,338 8,723 1,842
133,426 7,179
10,524 570 4
54,003 2,380 2,388
8,461 1,134 ---
66,160 10,763 1,348
264,32828,117 326 227
6,439 1,264 ---
79,449 3,694 540
58,149 3,388 ---
27,171 1,17259,832 3,9467,009 339
715 37 0
2,567 81
377 ---
45,838 5,148 0
1,975 20
Data missing or not applicable.a/ Regular high school graduates may include summer graduates not included in 12th grade membership.
b/ National totals are omitted for other diploma, high school equivalency recipients and other completersbecause of noncomparability of data across states. High school equivalency recipients are age 19 or youn
c/ 1990-91 data for Virginia and national totals are imputed based on previous year data.
SOURCE: U.S. Department of Education, National Center for Education Statistics, Common Core of Data,"State Nonfiscal Survey."
2129 BEST COPY vr ABLE

Table 5.--Change in number of public school graduates and 12th-grade student membership from 1990 toby State
State
Regular high schoolgraduates a/
1989-90 1990-91
Ratio of1991 to 1990graduate
12th-grade
1989-90 1990-91
Ratio of1991 to 199012th-grademembership
United States 2,320,337 2,237,482 96.4 2,473,278 2,381,093 96.3
Alabama 40,485 39,042 96.4 43,482 42,031 96.7Alaska 5,386 5,458 101.3 6,402 6,486 101.3Arizona 32,103 31,282 97.4 35,618 34,645 91.3Arkansas 26,475 25,668 97.0 28,505 27,734 97.3California 236,291 234,164 99.1 243,023 244,142 100.5
Colorado 32,967 31,293 94.9 34,799 33,582 96.5Connecticut 27,878 27,290 97.9 29,186 27,859 95.5Delaware 5,550 5,223 94.1 6,314 5,997 53.4District of ColumbiaFlorida
3,62688,934
3,36987,419
92.998.3 9::7673:
3,48194,776
92.196.1
Georgia 56,605 60,088 106.2 59,445 62,379 104.9Hawaii 10,325 8,974 86.9 9,453 9,234 97.7Idaho 11,971 11,961 99.9 13,149 13,095 99.6Illinois 108,119 103,329 95.6 110,514 105,541 95.5Indiana 60,012 58,558 97.6 65,063 62,740 96.4
Iowa 31,796 28,593 89.9 33,795 30,928 91.5Kansas 25,367 24,414 96.2 26,918 26,089 96.9Kentucky 38,005 35,835 94.3 40,186 37,577 93.5Louisiana 36,053 33,489 92.9 39,892 37,983 95.2Maine 13,839 13,151 95.0 14,552 13,817 94.9
Maryland 41,566 39,014 93.9 43,302 40,529 93.6Massachusetts 55,941 52,075 93.1 55,945 53,484 95.6Michigan 93,807 88,234 94.1 97,713 91,769 93.9Minnesota 49,087 46,474 94.7 53,724 51,324 95.5Mississippi 25,182 23,665 94.0 27,851 26,411 94.6
Missouri 48,957 46,928 95.9 52,420 49,925 95.2Montana 9,370 9,013 96.2 9,985 9,609 96.2Nebraska 17,664 16,500 93.4 19,099 17,680 92.6Nevada 9,477 9,370 98.9 11,297 11,197 99.1New Hampshire 10,766 10,059 93.4 11.131 10,408 93.5
New Jersey 69,824 67,003 96.0 70,438 67,716 96.1New Mexico 14,884 15,157 101.8 15,751 15,454 98.1New York 143,318 133,562 93.2 148,836 142,514 95.8North Carolina 64,782 62,792 96.9 68,194 65,720 96.4North Dakota 7,690 7,573 98.5 8,032 7,960 99.1
Ohio 114,513 107,484 93.9 125,507 115,605 94.5Oklahoma 35,606 33,007 92.7 37,728 35,671 94.5Oregon 25,473 24,597 96.6 30,018 30,018 100.0Pennsylvania 110,527 104,770 94.8 115,400 108,592 94.1Rhode Island 7,825 7,744 99.0 8,346 8,167 97.9
South Carolina 32,483 33,063 101.8 36,621 35,393 96.6South Dakota 7,650 7,127 93.2 8,248 7,758 94.1Tennessee 46,094 44,847 97.3 50,851 49,050 96.5Texas 172,480 174,306 101.1 192,963 178,390 92.4Utah 21,196 22,219 104.8 24,971 26,263 105.2
Vermont 6,127 5,212 85.1 5,719 5,424 94.8Virginia c/ 60,605 58,441 96.4 63,501 61,328 96.6Washington 45,941 42,514 92.5 53,840 51,856 96.3West Virginia 21,854 21,064 96.4 22,831 22,045 96.6Wisconsin 52,038 49,340 94.8 56,022 54,562 97.4Wyoming 5,823 5,728 98.4 6,281 6,245 99.4
Outlying areasAmerican Samoa 703 597 84.9 641 599 93.4Guam 1,033 1,014 98.2 1,240 1,120 90.3Northern Marianas 227 273 120.3 300 326 108.7Puerto Rico 29,049 29,329 101.0 32,700 31,496 96.3Virgin Islands 1,260 986 78.:,, 1,063 1,128 106.1
1991,
Graduatechangeindex b/
100.2
99.8100.0100.299.698.6
98.4102.6100.3100.8100.2
101.269.0
100.3100.1101.2
98.399.3100.697.6
100.1
100.397.4
100.299.199.1
100.6100.0100.999.6
99.9
99.8
103.897.3
100.699.4
99.398.096.6
100.7101.1
105.399.0100.9109.399.7
69.799.896.199.891.496.9
90.9108.7110.7104.873.7
Data missing or not applicable.a/ Regular high school graduates may include summer graduates not included in 12th grade membership.b/ Graduate change index is the ratio of 1991 graduates to 1990 graduates divided by the ratio of 1991
12th-grade membership to 1990 12th-grade membership, multiplied by 100.c/ 1990-91 graduate data for Virginia and natioral total aru imputed based on previous year data.SOURCE: U.S. Department of Education, National Center for Education Statistics, Common Core of Data,
"State Nonfiscal Survey."
22
3t)

Table 6.--Revenues for public elementary and secondary schools, by source and state: School year 1990-91
[In thousands of dollars]
State Total
Revenues, by source
Local Intermediate State Federal
United States a/ $222,822,499 $102,673,325 $1,048,576 $105,324,533 $13,776,066
Alabama 2,704,515 777,684 0 1,625,517 301,315
Alaska 1,021,392 206,162 0 699,742 115,489
Arizona 2,973,755 1,308,049 142,349 1,288,855 234,503
Arkansas 1,645,442 524.103 4,219 956,019 161,100
California 25,266,899 6,771,427 0 16,684,098 1,811,375
Colorado 2,892,809 1,623,702 1,367 1,131,029 136,713
Connecticut 3,687,572 2,058,138 0 1,520,723 108,712
Delaware 566,146 138,341 0 387,592 40,213
District of Columbia 665,624 608,452 0 0 57,172
Florida 10,416,592 4,518,304 0 5,215,514 682,774
Georgia 5,417,738 2,209,594 0 2,853,492 354,653
Hawaii 945,327 21,617 0 850,017 73,693
Idaho 795,820 242,448 0 490,907 62,464
Illinois a/ 9,269,492 5,711,910 0 2,941,988 615,593
Indiana 5,305,182 2,258,419 9,286 2,794,834 242,642
Iowa 2,211,510 1,027,875 11,348 1,059,434 112,852
Kansas 2,208,225 974,293 151,999 972,370 109,564
Kentucky 2,729,811 641,854 0 7..827,601 260,356
Louisiana 3,0"0,752 1,115,109 0 1,759,673 325,970
Maine 1,192,430 518,589 0 608,475 65,366
Maryland 4,565,842 2,647,847 0 1,705,473 212,522
Massachusetts 5,274,333 3,045,757 0 1,959,858 268,718
Michigan 9,054,147 6,098,938 8,561 2,424,039 522,610
Minnesota 4,300,519 1,620,715 121,176 2,376,069 182,558
Mississippi 1,599,374 465,165 2,081 866,680 265,448
Missouri 3,968,551 2,166,483 19,614 1,560,232 222,221
Montana 786,516 205,940 168,264 345,728 66,584
Nebraska 1,469,586 916,563 11,193 455,723 86,107
Nevada 1,006,832 551,526 0 416,217 39,089
New Hampshire 977,610 873,544 0 76,667 27,399
New Jersey a/ 9,565,571 5,566,396 0 3,614,415 384,759
New Mexico 1,321,887 199,052 0 961,213 161,621
New York 21,362,779 11,195,604 52,090 9,091,432 1,023,652
North Carolina 4,995,253 1,265,059 0 3,301,219 328,975
North Dakota 515,373 222,326 8,569 232,350 51,828
Ohio 9,116,257 4,692,796 5,789 3,906,212 511,460
Oklahoma 2,356,528 754,225 47,683 1,440,005 114,615 .
Oregon 2,687,143 1,792,229 48,290 682,382 164,242
Pennsylvania 11,063,955 5,725,078 8,162 4,755,738 574,977
Rhode Island 866,151 471,041 0 353,329 41,781
South Carolina a/ 2,856,421 1,156,397 30,113 1,427,317 242,593
South Dakota 532,388 318,465 7,004 146,649 60,270
Tennessee 3,034,270 1,365.144 0 1,372,661 296,466
Texas 15,407,772 7,478,471 143,966 6,770,503 1,014,833
Utah 1,420,359 515,622 0 810,1-". 94,563
Vermont 615,449 388,047 0 197,299 30,103
Virginia 5,462,332 3,354,318 0 1,810,903 27,111
Washington 4,698,505 1,045,570 72 3,385,318 267,575
West Virginia 1,599,534 409,788 251 1,064,629 124,866
Wisconsin 4,636,119 2,578,429 0 1,864,756 192,934
Wyoming 588,382 230,723 45,129 281,462 31,068
Ouzlying areasAmerican Samoa 30.407 81 8,694 21,631
Guam 125,496 107,266 0 18,231
Northern Marianas 34,803 22 26,111 8,669
Puerto Rico 1.266,116 782 878,903 386,430
Virgin Islands 160,899 118,284 0 42,615
a/
NOTE:SOURCE:
Local revenues for these states were adjusted by NCES, affecting total revenues and the national totalfor local revenues and total revenues. See text for details.Details may not add to total due to rounding.U.S. Department of Education, National Center for Education Statistics, Common Core of Data,
2331

Table 7.--Percentage distribution of total revenues for public elementary and secondary schools,by source and state: School year 1990-91
State
Within-state percentage distribution
Local Intermediate State Federal
United States a/ 46.1 0.5 47.3 6.2
Alabama 28.8 0.0 60.1 11.1Alaska 20.2 0.0 68.5 11.3Arizona 44.0 4.8 43.3 7.9Arkansas 31.9 0.3 58.1 9.8California 26.8 0.0 66.0 7.2
Colorado 56.1 0.0 39.1 4.7Connecticut 55.8 0.0 41.2 2.9Delaware 24.4 0.0 68.5 7.1District of Columbia 91.4 0.0 0.0 8.6Florida 43.4 0.0 50.1 6.6
Georgia 40.8 0.0 52.7 6.5Hawaii 2.3 0.0 89.9 7.8Idaho 30.5 0.0 61.7 7.6Illinois a/ 61.6 0.0 31.7 6.6Indiana 42.6 0.2 52.7 4.6
Iowa 46.5 0.5 47.9 5.1Kansas 44.1 6.9 44.0 5.0Kentucky 23.5 0.0 66.9 9.5Louisiana 34.8 0.0 55.0 10.2Maine 43.5 0.0 51.0 5.5
Maryland 58.0 0.0 37.4 4.7Massachusetts 57.7 0.0 37.2 5.1Michigan 67.4 0.1 26.8 5.8Minnesota 37.7 2.8 55.3 4.2Mississippi 29.1 0.1 54.2 16.6
Missouri 54.6 0.5 39.3 5.6Montana 26.2 21.4 44.0 8.5Nebraska 62.4 0.8 31.0 5.9Nevada 54.8 0.0 41.3 3.9New Hampshire 89.4 0.0 7.8 2.8
New Jersey a/ 58.2 0.0 37.8 4.0New Mexico 15.1 0.0 72.7 12.2New York 52.4 0.2 42.6 4.8North Carolina 27.3 0.0 66.1 6.6North Dakota 43.2 1.7 45.1 10.1
Ohio 51.5 0.1 42.8 5.6Oklahoma 32.0 2.0 61.1 4.9Oregon 66.7 1.8 25.4 6.1Pennsylvania 51.7 0.1 43.0 5.2Rhode Island 54.4 0.0 40.8 4.8
South Carolina a/ 40.5 1.1 50.0 8.5South Dakota 59.8 1.3 27.5 11.3Tennessee 45.0 0.0 45.2 9.8Texas 48.5 0.9 43.9 6.6Utah 36.3 0.0 57.0 6.7
Vermont 63.1 0.0 32.1 4.9Virginia 61.4 0.0 33.2 5.4Washington 22.3 0.0 72.1 5.7West Virginia 25.6 0.0 66.6 7.8Wisconsin 55.6 0.0 40.2 4.2Wyoming 39.2 7.7 47.8 5.3
Outlying areasAmerican Samoa 0.3 0.0 28.6 71.1Guam 85.5 0.0 0.0 14.5Northern Marianas 0.1 0.0 75.0 24.9Puerto Rico 0.1 0.0 69.4 30.5Virgin Islands 73.5 0.0 0.0 26.5
a/ Local revenues for these states are adjusted by NCES, affecting total revenues and the nationsl totalfor local revenues and total revenues.
NOTE: Details may not add to 100 percent due to rounding.SOURCE: U.S. Department of Education, National Center for Education Statistics, Common Core of Data,
"The National Public Education Financial Survey..
24 32

Table 8.--Current expenditures for public elementary and secondary schools, by function and
state: School year 1990-91
State
rIn thousands of dollars)
Current expenditures, by function
Total Instruction Support services Noninstruction
United States $201,549,624 $122,214,281 $70,419,509 $8,915,835
Alabama a/ 2,475,216 1,538,723 726,957 209,537
Alaska 854,499 426,220 401,924 26,355
Arizona b/ 2,469,415 1,464,485 879,406 125,525
Arkansas a/ 1,510,092 870,282 470,274 169,536
Ca.fornia b/ 22,748,218 13,267,159 8,559,560 921,499
Colorado b/ 2,642,839 1,612,622 937,472 92,745
Connecticut b/ 3,427,201 2,202,759 1,187,993 36,449
Delaware b/ 534,003 339,212 184,805 9,986
District of Columbia a/ 639,737 298,769 311,193 29,775
Florida 9,045,710 5,280,683 3,322,574 442,453
Georgia a/ 4,804,225 2,995,394 1,528,858 279,973
Hawaii 827,579 503,312 270,394 53,873
Idaho a/ 708,045 446,921 227,073 34,051
111.nois a/ 8,932,538 5,204,112 3,411,815 316,611
Incliana a/ 4,379,142 2,731,831 1,449,628 197,683
Iowa 2,136,561 1,281,171 763,712 91,679
Kansas a/ 1,938,012 1,144,710 702,885 90,416
Kentucky b/ 2,480,363 1,474,301 846,538 159,524
Louisiana a/ 2,987,448 1,756,185 993,737 237,526
Maine b/ 1,070,965 707,108 340,467 23,390
Maryland a/ 4,184,858 2,569,556 1,476,953 138,349
Massachusetts a/ 4,906,828 2,919,478 1,835,788 151,562
Michigan a/ 8,545,805 4,919,688 3,374,380 251,737
Minnesota a/ 3,740,820 2,389,218 1,203,615 147,987
Mississippi a/ 1,510,552 947,173 435,125 128,254
Missouri 3,487,786 2,106,277 1,229,498 152,012
Montana 719,963 435,023 254,157 30,784
Nebraska b/ 1,297,639 791,899 379,405 126,335
Nevada 864,379 512,678 324,115 27,585
New Hampshire 888,156 561,083 297,989 49,084
New Jersey b/ 8,784,969 4,970,595 3,598,990 215,383
New Mexico b/ 1,134,142 663,960 416,630 53,553
New York 19,514,583 13,055,859 5,884,940 573,784
North Carolina a/ 4,544,112 2,848,755 1,404,150 291,207
North Dakota 460,581 277,585 146,073 36,923
Ohio 8,407,428 4,817,439 3,172,105 417,884
Oklahoma b/ 2,078,673 1,304,005 652,516 122,152
Oregon 2,453,934 1,442,537 925,799 85,598
Pennsylvania a/ 10,087,322 6,415,597 3,309,448 362,277
Rhode Island a/ 823,655 536,199 264,673 22,784
South Carolina b/ 2,493,524 1,473,165 802,126 218,232
South Dakota 481,304 293,254 158,993 29,057
Tennessee a/ 2,903,209 1,788,871 928,176 186,161
Texas a/ 13,695,327 8,270,015 4,561,672 863,640
Utah 1,235,916 801,456 359,153 75,306
Vermont a/ 599,018 375,921 206,523 16,574
Virginia 4,891,212 2,952,146 1,751,932 187,135
Washington b/ 3,906,529 2,334,707 1,383,976 187,846
West Virginia b/ 1,473,744 895,048 491,964 86,732
Wisconsin 4,292,434 2,681,850 1,477,847 132,737
Wyoming 529,413 317,284 193,535 18,594
Outlying AreasAmerican Samoa 24,946 11,239 9,450 4,256
Guam a/ 122,170 59,689 53,884 8,597
Northern Marianas 32,987 24,110 6,165 2,712
Puerto Rico 1,187,261 810,124 184,663 192,474
Virgin Islands 119,950 68,125 44,594 7,230
a/ Instruction, support services and/or noninstruction expenditures were adjusted byNCES, affecting national totals for these expenditures. See text for details.
b/ Instruction, support services and/or noninstruction expenditures were adjusted byNCES, affecting current expenditures for these states and national totals. See text.
NOTE: Details may not add to total due to rounding.SOURCE: U.S. Department of Education, National Center for Education Statistics, Common Core
of Data, "The National Public Education Financial Survey."
25 33

Table 9.--Percentage distribution of current expenditures for public elementaryand secondary schools, by function and state: School year 1990-91
State
Within-state percentage distribution
Instruction Support services Noninstruction
United States
Alabama a/AlaskaArizona a/Arkansas a/
60.6
62.249.959.357.6
34.9
29.447.035.631.1
4.4
8.5
3.15.1
11.2California a/ 58.3 37.6 4.1
Colorado a/ 61.0 35.5 3.5Connecticut a/ 64.3 34.7 1.1Delaware a/ 63.5 34.6 1.9District of Columbia 46.7 48.6 4.7Florida 58.4 36.7 4.9
Georgia a/ 62.3 31.8 5.8Hawaii 60.8 32.7 6.5Idaho a/ 63.1 32.1 4.8Illinois a/ 58.3 38.2 3.5Indiana a/ 62.4 33.1 4.5
Iowa 60.0 35.1 4.3Kansas a/ 59.1 36.3 4.7Kentucky a/ 59.4 34.1 6.4Louisiana a/ 58.8 33.3 8.0Maine a/ 66.0 31.8 2.2
Maryland a/ 61.4 35.3 3.3Massachusetts a/ 59.5 37.4 3.1Michigan a/ 57.6 39.5 2.9Minnesota a/ 63.9 32.2 4.0Mississippi a/ 62.7 28.8 8.5
Missouri 60.4 35.3 4.4Montana 60.4 35.3 4.3Nebraska a/ 61.0 29.2 9.7Nevada 59.3 37.5 3.2New Hampshire 63.2 33.6 3.3
New Jersey a/ 56.6 41.0 2.5New Mexico a/ 58.5 36.7 4.7New York 66.9 30.2 2.9North Carolina a/ 62.7 30.9 6.4North Dakota 60.3 31.7 8.0
Ohio 57.3 37.7 5.0Oklahoma a/ 62.7 31.4 5.9Oregon 58.8 37.7 3.5Pennsylvania a/ 63.6 32.8 3.6Rhode Island a/ 65.1 32.1 2.8
South Carolina a/ 59.1 32.2 8.8South Dakota 60.9 33.0 6.0Tennessee a/ 61.6 32.0 6.4Texas a/ 60.4 33.3 6.3Utah 64.8 29.1 6.1
Vermont a/ 62.8 34.5 2.8Virginia 60.4 35.8 3.8Washington a/ 59.8 35.4 4.8West Virginia a/ 60.7 33.4 5.9Wisconsin 62.5 34.4 3.1Wyoming 59.9 36.6 3.5
Outlying AreasAmerican Samoa 45.1 37.9 17.1Guam a/ 48.9 44.1 7.0Northern Marianas 73.1 18.7 8.2Puerto Rico 68.2 15.6 16.2Virgin Islands 56.8 37.2 6.0
a/ Instruction, support services and/or noninstruction expenditures were adjustedby NCES, affecting distribution ratios. See text for details.
SOURCE: U.S. Dep,,rtment of Education, National Center for Education Statistics, CommonCore of Data, "The National Public Education Financial Survey."
26

Table 10.--Average daily attendance and current expenditures per pupil in attendance for public elementary
and secondary schools, by function and state: School year 1990-91
State
United States
Alabama b/AlaskaArizona b/Arkansas b/California b/
Colorado b/Connecticut b/Delaware b/District of ColumbiaFlorida
Georgia b/HawaiiIdaho b/Illinois b/Indiana b/
IowaKansas b/Kentucky b/Louisiana b/Maine b/
Maryland b/Massachusetts b/Michigan b/Minnesota b/Mississippi b/
MissouriMontanaNebraska b/NevadaNew Hampshire
New Jersey b/New Mexico b/New YorkNorth Carolina b/North Dakota
OhioOklahoma b/OregonPennsylvania b/Rhode Island b/
South Carolina b/South DakotaTennessee b/Texas b/Utah
Vermont b/VirginiaWashington b/West Virginia b/WisconsinWyoming
Outlying AreasAmerican SamoaGuam b/Northern MarianasPuerto RicoVirgin Islands
Current expenditures per pupil in attendance
Averagedaily
attendance a/ Total Instruction
Supportservices
Non-instruction
38,426,543 $5,245 $3,180 $1,833 $232
682,524 3,627 2,254 1,065 307
102,585 8,330 4,155 3,918 257
573,140 4,309 2,555 1,534 219
408,145 3,700 2,132 1,152 415
5,065,647 4,491 2,619 1,690 182
521,899 5,064 3,090 1,796 178
450,808 7,602 4,886 2,635 81
91,052 5,865 3,725 2,030 110
69,092 9,259 4,324 4,504 431
1,714,394 5,276 3,080 1,938 258
1,075,728 4,466 2,785 1,421 260
160,193 5,166 3,142 1,688 336
209,085 3,386 2,138 1,086 163
1,618,101 5,520 3,216 2,109 196
888,177 4,930 3,076 1,632 223
456,614 4,679 2,806 1,673 201
397,609 4,874 2,879 1,768 227
569,713 4,354 2,588 1,486 280
720,551 4,146 2,437 1,379 330
196,229 5,458 3,603 1,735 119
637,370 6,566 4,031 2,317 217
770,802 6,366 3,788 2,382 197
1,452,700 5,883 3,387 2,323 173
714,072 5,239 3,346 1,686 207
474,029 3,187 1,998 918 271
733,680 4,754 2,871 1,676 207
138,341 5,204 3,145 1,837 ::;23
257,587 5,038 3,074 1,473 490
185,755 4,653 2,760 1,745 149
156,579 5,672 3,583 1,903 186
1,016,159 8,645 4,892 3,542 212
291,215 3,895 2,280 1,431 184
2,278,531 8,565 5,730 2,583 252
1,012,613 4,488 2,813 1,387 288
109,691 4,199 2,531 1,332 337
1,603,025 5,245 3,005 1,979 261
548,387 3,791 2,378 1,190 22?
431,806 5,683 3,341 2,144 198
1,542,077 6,541 4,160 2,146 235
129,856 6,343 4,129 2,038 175
573,138 4,351 2,570 1,400 381
121,403 3,965 2,416 1,310 239
767,738 3,782 2,330 1,209 242
3,085,648 4,438 2,680 1,478 280
417,609 2,960 1,919 860 180
88,901 6,738 4,229 2,323 186
1,011,513 4 836 2,919 1,732 185
781,371 b,20 2,988 1,771 240
300,067 4,911 2,983 1,640 289
731,088 5,a7.1 3,668 2,021 182
92,506 5,723 3,430 2,092 201
12,272 2,033 916 770 347
25,330 4,823 2,356 2,127 339
6,062 5,442 3,977 1,017 447
597,418 1,987 1,356 309 322
19,984 6,002 3,409 2,232 362
a/ Average Daily Attendance (ADA) is not comparable among states because of various statutory
reporting procedures.b/ Instruction, support services, noninstruction and/or total current expenditures were adjusted
by NCES, affecting expenditures per pupil in attendance. See text for details.
NOTE: Details may not add to total due to rounding.SOURCE: U.S. Department of Education, National Center for Education Statistics, Common Core of Data,
"The National Public Education Financial Survey."
2735

Table 11.--Student membership and current expenditures per pupil in membership for public el,mentary andsecondary schools, by function and state: School year 1990-91
Current expenditures per pupil in membership
State
Membershipas of
fall 1990 Total InstructionSupportservices
Non-
instruction
United States 41,216,683 $4,890 $2,965 $1,709 $216
Alabama a/ 721,806 3,429 2,132 1,007 290Alaska 113,903 7,502 3,742 3,529 231Arizona a/ 639,853 3,859 2,289 1,374 196Arkansas a/ 436,286 3,461 1,995 1,078 389California a/ 4,950,474 4,595 2,680 1,729 186
Colorado a/ 574,213 4,603 2,808 1,633 162Connecticut a/ 469,123 7,306 4,695 2,532 78Delaware a/ 99,658 5,358 3,404 1,854 100District of Columbia 80,694 7,928 3,702 3,856 369Florida1 S61,592 4,859 2,837 1,785 238
Georgia a/ 1,151,687 4,171 2,601 1,327 243Hawaii 171,708 4,820 2,931 1,575 314Idaho a/ 220,840 3 206 2,024 1,028 154Illinois a/ 1,821,407 4,904 2,857 1,873 174Indiana a/ 954,525 4,588 2,862 1,519 207
Iowa 483,652 4,418 2,649 1,579 190Kansas a/ 43' ,034 4,434 2,619 1,608 207Kentucky a/ 636,401 3,897 2,317 1,330 251Louisiana a/ 784,757 3,807 2,238 1,266 303Maine a/ 215,149 4,978 3,287 1,582 109
Maryland a/ 715,176 5,852 3,593 2,065 193Massachusetts a/ 834,314 5,881 3,499 2,200 182Michigan a/ 1,584,431 5,394 3,105 2,130 159Minnesota a/ 756,374 4,946 3,159 1,591 196Mississippi a/ 502,417 3,007 1,885 866 255
Missouri 816,558 4,271 2,579 1,506 186Montana 152,974 4,706 2,844 1,661 201Nebraska a/ 274,081 4,735 2,889 1,384 461Nevada 201,316 4,294 2,547 1,610 137New Hampshire 172,785 5,140 3,247 1,725 168
New Jersey a/ 1,089,646 8,062 4,562 3,303 198New Mexico a/ 301,881 3,757 2,199 1,380 177New York 2,598,337 7,510 5,025 2,265 221North Carolina a/ 1,086,871 4,181 2,621 1,292 268North Dakota 117,825 3,909 2,356 1,240 313
Ohio 1,771,089 4,747 2,720 1,791 236Oklahoma a/ 579,087 3,590 2,252 1,127 211Oregon 472,394 5,195 3,054 1,960 181Pennsylvania a/ 1,667,834 6,048 3,847 1,984 217Rhode Island a/ 138,813 5,934 3,863 1,907 164
South Carolina a/ 622,112 4,008 2,368 1,289 351South Dakota 129,164 3,726 2,270 1,231 225Tennessee a/ 824,595 3,521 2,169 1,126 226Texas a/ 3,382,887 4,048 2,445 1,348 255Utah 446,652 2,767 1,794 804 169
Vermont a/ 95,762 6,255 3,926 2,157 173Virginia 998,601 4,898 2,956 1,754 187Washington a/ 839,709 4,652 2,780 1,648 224West Virginia a/ 322,389 4,571 2,776 1,526 269Wisconsin 797,621 5,382 3,362 1,853 166Wyoming 98,226 5,390 3,230 1,970 189
Outlying AreasAmerican Samoa 12,463 2,002 902 758 342Guam a/ 26,391 4,629 2,262 2,042 326Norttern Marianas 6,449 5,115 3,739 956 420Puerto Rico 644,734 1,841 1,257 286 299Virgin Islands 21,750 5,515 3,132 2,050 332
a/ Instruction, support services and/or noninstruction expenditures were adjustedby NCES, affecting expenditures per pupil. See text for details.NOTE: Detail m4y not add to total due to rounding.SOURCE: U.S. Depattment of Education, National Center for Education Statistics, Common
Core of Data, "The National Public Education Financial Survey."
28

Table 12.--Employee expenditures, including salaries and employee benefits for instruction and support servicesfor public elementary and secondary schools, by state: School year 1990-91
[In thousands of dollars]
Totalemployee
expendituresSalaries forinstruction
Salariesfor supportservices
Employeebenefits forinstruction.
Employeebenefits
for supportservices
United States 162,257,128 90,627,831 38,670,241 22,350,979 10,608,077
Alabama 1,961,541 1,182,802 420,627 264,252 93,860Alaska 657,763 313,184 217,753 66,611 60,216Arizona a/ 2,032,415 1,204,115 529,139 194,736 104,425Arkansas a/ 1,156,188 668,542 266,660 155,350 65,637California a/ 18,807,756 10,002,472 5,188,470 2,218,640 1,398,173
Colorado 2,166,164 1,254,170 544,333 249,389 118,271Connecticut a/ 2,889,712 1,596,080 629,692 466,962 196,979Delaware a/ 438,757 244,166 92,054 73,942 28,595District of Columbia a 519,903 239,073 193,436 43,806 43,588Florida 7,290,578 3,626,444 1,939,330 1,093,115 631,689
Georgia a/ 3,965,367 2,200,190 890,780 644,721 229,675Hawaii 639,016 372,427 142,787 89,337 34,465Idaho a/ 568,713 327,185 122,597 85,091 33,840Illinois a/ 7,097,427 4,047,128 1,881,276 735,596 433,427Indiana a/ 3,542,541 2,031,635 786,072 522,623 202,211
Iowa 1,739,960 986,128 442,181 213,950 97,701Kansas a/ 1,552,795 905,515 401,373 167,326 78,581
Kentucky a/ 2,025,837 1,212,204 466,124 211,345 136,164Louisiana a/ 2,383,434 1,301,914 537,309 366,853 177,358Maine a/ 836,753 504,252 171,183 111,526 49,792
Maryland a/ 3,510,776 1,828,391 833,790 559,662 288,933
Massachusetts a/ 3,550,788 2,193,013 817,641 275,106 265,029Michigan a/ 7,170,175 3,533,939 1,862,881 1 129,466 643,890
Minnesota 2,980,152 1,777,104 615,998 439,938 147,111
Mississippi a/ 1,195,532 758,065 254,441 137,182 45,844
Missouri 2,700,700 1,617,757 673,131 277,060 132,752Montana 528,953 306,898 117,963 73,939 30,153Nebraska a/ 988,797 594,231 212,548 133,890 48,129Nevada 726,366 386,102 187,330 101,192 51,742New Hampshire 662,941 415,430 134,681 70,551 42,279
New Jersey a/ 6,520,638 3,737,092 1,663,321 769,709 350,516New Mexico a/ 863,736 493,948 206,414 115,647 47,727New York 16,179,033 9,578,987 3,123,329 2,700,119 776,598North Carolina 3,777,255 2,193,096 867,364 516,632 200,163North Dakota 346,524 205,978 73,677 49,051 17,818
Ohio 6,736,292 3,497,204 1,714,405 979,552 545,131Oklahoma a/ 1,686,227 998,778 377,203 225,197 85,049Oregon 1,966,844 946,880 461,526 361,007 197,431Pennsylvania a/ 7,938,701 4,137,815 1,546,930 1,622,720 631,236Rhode Island a/ 678,336 386,040 146.917 105,350 40,029
South Carolina a/ 1,984,809 1,140,812 467,824 256,583 119,590South Dakota 362,228 216,123 85,356 43,064 17,685Tennessee a/ 2,279,130 1,355,457 489,564 238,449 195,660Texas a/ 10,773,914 6,635,035 2,657,290 988,909 492,680Utah 1,002,241 564,003 189,356 184,503 64,378
Vermont a/ 443,829 260,500 95,945 62,753 24,630Virginia 4,169,593 2,223,624 1,057,172 592,632 296,165Washington 3,192,794 1,676,920 799,565 487,681 228,629West Virginia a/ 1,229,354 629,362 277,943 223,393 98,656Wisconsin 3,414,353 1,893,068 687,768 596,437 237,070Wyoming 423,497 226,555 107,793 58,434 30,715
Outlying AreasAmerican Samoa 16,600 8,481 5,872 1,318 929Guam a/ 102,734 50,017 39,092 7,650 5,976Northern Marianas 22,871 15,935 2,626 3,621 690Puerto Rico 812,787 675,780 36,002 95,052 5,952Virgin Islands 97,690 55,526 26,401 10,383 5,380
a/ Salaries and/or employee benefits were adjusted by NCES, affecting total employee expenditures. Seetext for details.
NOTE: Details may not, add to total due to rounding.SOURCE. U.S. Department of Education, National Center for Education Statistics, Common Core of
Data, "The National Public Education Financial Survey."
29:3 7

Table 13.--Facilities acquisition and debt service expenditures for public elementaryand secondary schools, by state: School year 1990-91
[In thousands of dollars)
State
Facilitiesacquisitionexpenditures
Debt service expenditures
Interest Redemptionon debt of principal
United States 515,633,083 $4,314,321 $5,275,289
Alabama 164,985 37,566 41,093Alaska 38,176 61,024 85,514Arizona 433,093 134,665 162,110Arkansas 77,643 35,575 42,064California a/ 2,030,681 179,730 216,359
Colorado 276,125 101,437 58,528Connecticut 6,666 66,168 88,439Delaware a/ 21,571 4,729 11,633District of. Columbia b/ 34,940 5,231 6,981Florida 1,607,725 242,259 214,872
Georgia 444,752 75,612 47,145Hawaii 51,203 24,783 29,506Idaho 67,943 13,612 20,316Illinois 447,419 190,907 285,576Indiana 359,711 250,375 28,450
Iowa 149,493 25,080 29,753Kansas 67,419 34,701 31,824Kentucky 77,491 53,916 53,210Louisiana 127,725 92,764 101,299Maine 109,316 26,530 35,348
Maryland 303,882 38,289 52,025Massachusetts a/ 51,494 57,239 119,625Michigan 530,561 206,568 219,617Minnesota 443,831 75,884 106,600Mississippi 76,52', 22,130 37,438
Missouri 309,71 75,256 81,797Montana 47,-72 11,394 14,035Nebraska 107,208 19,950 35,577Nevada 291 226 33,687 36,883New Hampshire a/ 74,806 26,201 31,541
New Jersey a/ 116,765 76,983 108,706New Mexico a/ 127,955 16,803 32,276New York 1,648,964 275,576 375,304North Carolina h/ 521,068 249,476 332,918North Dakota 10,099 6,186 8,376
Ohio 394,543 128,154 503,490Oklahoma a/ 210,964 11,577 13,936Oregon 109,684 39,073 64,161Pennsylvania 27,721 248,789 379,958Rhode Island 3,414 15,674 10,612
South Carolina 256,144 85,812 113,248South Dakota 47,222 5,640 5,571Tennessee a/ 124,119 17,111 15,382Texas 1,535,928 530,261 551,205Utah 104,627 35,202 52,346
Vermont 29,773 6,207 11,720Virginia 497,10'. 109,203 136,557Washington 612,812 147,031 117,226West 7irginia a/ 58,478 12,834 15,465Wisconsin 333,267 54,141 86,399Wyoming 31,270 13,331 15,279
Outlying AreasAmerican Samoa 1,615 0 0Guam 0 0 0Northern Marianas 0 0 0Puerto Rico 3,488 0 0Virgin Islands 5,927 0 0
a/ Facilities acquisition and/or debt service expenditures adjusted by NCES. See text.b/ Fa.Alities acquisition and/or debt service expenditures imputed by NCES.NOTE: Details may not add to total due to rounding.SOURCE: U.S. Department of Education, National Center for Education Statistics,
Common Core of Data, "The National Public Education Financial Survey."
30 3

Table 14.--Total education, current, facilities acquisition, community services, direct cost and property
expenditures, by state: School year 1990-91
(In thousands of dollars)
State
Totaleducation
expenditures
Currentexpenditures
Facilitiesacquisitionexpenditures
Communityservices
expenditures
Property expenditures(excluding
Direct cost facilitiesexpenditures acquisition)
United States $224,525,979 $201,549,624 $15,633,083 $958,726 $2,246,716 $4,137,830
Alabama a/ 2,705,632 2,475,216 164,985 4,289 29,577 31,566
Alaska 914,291 854,499 38,176 4,606 0 17,011
Arizona a/ 3,034,499 2,469,415 433,093 9,893 1,803 120,294
Arkansas 1,642,258 1,510,092 77,643 1,944 5,221 47,356
California a/ 25,641,797 22,748,218 2,030,681 103,717 335,632 423,550
Colorado a/ 2,960,187 2,642,839 276,125 5,286 0 35,938
Connecticut a/ 3,473,936 3,427,201 6,666 0 0 40,070
Delaware a/ 580,61.6 534,003 21,571 6,303 3,946 14,793
District of Columbia b/ 692,718 639,737 34,940 0 6,105 11,936
Florida a/ 11,096,053 9,045,710 1,607,725 69,672 234,523 138,423
Georgia 5,519,589 4,804,225 444,752 89,281 48,103 133,227
Hawaii 935,679 827,579 51,203 19,879 8,297 28,721
Idaho 795,702 708,045 67,943 669 288 18,757
Illinois 9,687,873 8,932,538 447,419 55,714 17,374 234,828
Indiana 4,873,395 4,379,142 359,711 7,635 22,705 104,202
Iowa 2,339,092 2,136,561 149,493 1,519 1,254 50,263
Kansas a/ 2,080,191 1,938,012 67,419 279 2,094 72,387
Kentucky a/ 2,617,020 2,480,363 77,491 1,282 2,677 55,206
Louisiana 3,181,587 2,987,448 127,725 3,211 13,344 49,858
Maine a/ 1,213,178 1,070,965 109,316 551 11,662 20,685
Maryland 4,554,717 4,184,858 303,882 10,948 10,294 44,735
Massachusetts a/ 5,024,856 4,906,828 51,494 8,440 31,889 26,206
Michigan 9,623,829 8,545,805 530,561 89,485 242,911 215,067
Minnesota 4,405,912 3,740,820 443,831 103,109 39,200 78,952
Mississippi 1,629,736 1,510,552 76,528 4,314 2,862 35,478
Missouri 4,010,242 3,487,786 309,771 26,723 27,598 158,364
Montana . 791,474 719,963 47,772 1,177 2,914 19,648
Nebraska a/ 1,436,520 1,297,639 107,208 534 924 30,215
Nevada 1,186,581 864,379 291,226 17 4,711 26,248
New Hampshire 976,795 888,156 74,806 929 1,982 10,922
New Jersey a/ 9,097,066 8,784,969 116,765 5,371 98,374 91,587
New Mexico a/ 1,273,658 1,134,142 127,955 6,200 33 5,328
New York 21,839,075 19,514,583 1,648,964 63,634 342,6/5 269,220
North Carolina a/ 5,138,942 4,544,112 521,068 23,176 75 50,511
North Dakota 484,921 460,581 10,099 901 2,767 10,574
Ohio 9,206,039 8,407,428 394,543 24,786 116,570 262,713
Oklahoma a/ 2,306,287 2,078,673 210,964 1,753 5 14,693
Oregon 2,619,022 2,453,934 109,684 6,023 1,201 48,181
Pennsylvania 10,509,075 10,087,322 27,721 58,499 205,894 129,640
Rhode Island a/ 841,742 823,655 3,414 336 4,407 9,930
South Carolina a/ 2,848,626 2,493,524 256,144 16,972 22,724 59,262
South Dakota 551,241 481,304 47,222 335 1,086 21,293
Tennessee a/ 3,269,048 2,903,209 124,119 9,114 164,023 68,582
Texas a/ 15,617,348 13,695,327 1,535,928 36,364 5,656 344,074
utah 1,387,308 1,235,916 104,627 22,445 0 24,320
Vermont 642,830 599,018 19,773 1,251 1,827 10,960
Virginia 5,597,771 4,891,212 497,108 5,970 73,717 129,763
Washington a/ 4,738,512 3,906,529 612,812 16,711 60,856 141,603
West Virginia a/ 1,586,763 1,473,744 58,478 5,342 14,445 34,754
Wisconsin a/ 4,763,890 4,292,434 333,267 21,107 19,697 97,384
Wyoming 580,861 529,413 31,270 1,030 793 18,355
Outlying AreasAmerican Samoa 28,390 24,946 1,615 1,234 596
Guam 125,777 122,170 0 0 3,606
Northern Marianas 36,193 32,987 0 0 3,206
Puerto Rico 1,209,031 1,187,261 3,488 8,536 9,746
Virgin Islands 146,788 119,950 5,927 1,999 18,912
a/b/NOTE:SOURCE:
One or more expenditures have been adjusted by NCES. affecting national totals. See text for details.
Facilities acquisition expenditures imputed by NCES, affecting national totals. See text for details.
Details may not add to total due to rounding.U.S. Department of Education, National Center for Education Statistics, Common Core ofData, "The National Public Education Financial Survey."
31
BEST COPY AVAILABLE

Appendix A
Public Elementary and Secondary State Aggregate Data,for School Years 1990-91 and 1989-90
Revised Final Tabulations
This appendix includes revised final information from state education agencies forthe 1990-91 school year for nonfiscal data and school year 1989-90 for finance data. Thesedata were incorporated into the Common Core of Data (CCD) files as of March 22, 1993.Data for this report were provided by state education agencies (SEAs). The sources of datafor this report are the State Nonfiscal Survey of Public Elementary and SecondaryEducation, and The National Public Education Financial Survey of the CCD series.
Refer to the methodology section for a description of tl adjustments and methodsof imputation that were used in these tables.
40
33

Table Al.--Public school membership, by grade and state: Fall 1990
State Total
Pre-kinder-
garten a/Kinder-garten Grade 1 Grade 2 Grade 3 Grade 4 Grade 5
United States 41,216,683 3,306,329 3,499,434 3,327,454 3,296,720 3,248,065 3,197,343
Alabama 721,806 --- 54,067 60,230 57,414 60,713 58,666 60,227
Alaska 113,903 1,713 10,107 10,550 9,491 9,795 9,487 9,056
Arizona 639,853 1,693 53,839 58,668 55,782 55,210 53,041 51,912
Arkansas 436,286 --- 34,052 35,348 34,374 34,295 34,438 34,822
California 4,950,474 --- 423,740 432,694 419,469 409,839 399,293 384,483
Colorado 574,213 4,351 46,337 49,319 49,002 48,438 47,341 45,685
Connecticut 469,123 5,185 40,594 42,607 38,656 37,701 36,333 35,313
Delaware 99,658 344 7,980 8,938 8,421 8,212 8,236 7,892
District of Columbia 80,694 4,215 6,417 7,526 6,752 6,454 6,100 5,593
Florida 1,861,592 20,184 163,209 165,375 159,653 155,946 150,965 144,778
Georgia 1,151,687 604 97,208 99,109 96,668 97,977 96,123 95,500
Hawaii 171,708 --- 13,898 14,255 13,953 13,534 13,124 12,791
Idaho 220,840 919 15,676 17,806 17,726 18,090 17,825 18,117
Illinois 1,821,407 34,303 139,976 145,354 134,153 134,540 135,844 139,366
Indiana 954,525 967 68,024 78,849 74,411 75,033 74,634 75,171
Iowa 483,652 4,747 38,778 37,117 37,192 37,022 37,642 37,408
Kansas 437,034 1,627 36,221 36,946 35,932 35,410 35,429 34,443
Kentucky 636,401 6,310 46,972 50,976 48,865 49,131 49,832 50,669
Louisiana 784,757 7,324 65,305 66,649 61,544 61,972 61,077 60,122
Maine 215,149 1,301 19,107 18,081 17,389 16,866 16,589 15,869
Maryland 715,176 14,360 56,617 61,911 60,252 59,120 57,228 54,921
Massachusetts 834,314 7,567 73,481 73,231 67,497 66,331 64,246 62,465
Michigan 1,584,431 10,785 141,656 129,986 121,820 119,895 117,560 115,862
Minnesota 756,374 7,171 64,264 62,462 61,467 61,664 61,026 59,550
Mississippi 502,417 997 37,568 42,762 40,357 40,998 41,820 40,829
Missouri 816,558 --- 66,154 67,283 66,415 63,715 63,904 64,754
Montana 152,974 533 12,326 13,236 12,345 12,372 12,438 12,209
Nebraska 274,081 2,062 22,751 22,655 22,051 22,297 22,507 22,037
Nevada 201,316 421 16,737 18,249 17,866 17,399 16,985 16,472
New Hampshire 172,785 696 7,467 18,451 15,515 15,043 14,594 13,855
New Jersey 1,089,646 6,998 83,551 89,942 83,650 82,307 80,288 79,402
New Mexico 301,881 1,406 23,280 25,404 24,694 23,817 23,323 22,799
New York 2,598,337 29,187 193,972 213,664 201,601 195,150 190,245 185,355
North Carolina 1,086,871 3,050 88,176 88,598 85,335 85,200 83,652 83,397
North Dakota 117,825 691 9,547 9,631 9,747 9,659 9,614 9,225
Ohio 1,771,089 --- 145,294 145,857 139,197 140,432 141,402 140,892
Oklahoma 579,087 2,555 45,904 56,049 48,564 48,164 46,615 45,632
Oregon 472,394 1,254 35,715 40,492 39,201 37,717 37,106 37,581
Pennsylvania 1,667,834 2,846 127,628 139,099 129,628 127,986 125,666 123,365
Rhode Island 138,813 364 10,559 13,511 11,272 11,101 10,812 10,489
South Carolina 622,112 --- 43,087 55,440 50,924 51,622 51,339 51,210
South Dakota 129,164 547 10,681 10,731 10,420 10,700 10,707 10,692
Tennessee 824,595 --- 63,739 70,992 64,341 65,497 64,676 63,404
Texas 3,382,887 92,172 257,586 299,112 279,347 274,868 274,159 269,767
Utah 446,652 1,920 33,166 34,741 35,265 36,903 36,435 37,236
Vermont 95,762 681 8,087 9,014 8,379 7,983 7,788 7,696
Virginia 998,601 1,609 84,583 83,834 78,924 78,461 77,165 75,806
Washington 839,709 3,285 67,654 71,848 71,585 71,166 69,715 67,705
West Virginia 322,389 610 22,241 23,348 23,461 24,164 24,302 24,914
Wisconsin 797,621 13,265 63,539 63,140 61,526 60,775 60,794 60,509
Wyoming 98,226 --- 7,812 8,364 7,961 8,036 7,935 8,096
Outlying areasAmerican Samoa 12,463 1,284 963 990 942 930 850 889
Guam 26,391 375 2,268 2,414 2,191 2,227 2,187 2,050
Northern Marianas 6,449 345 406 554 569 535 534 522
Puerto Rico 644,734 701 34,596 55,609 52,520 54,004 56,099 55,713
Virgin Islands 21,750 --- 1,543 1,821 1,744 1,837 1,766 1,683
See footnotes at end of table.
354 1

Table Al.--Public school membership, by grade and state: Fall 1990--continued
state Grade 6 Grade 7 Grade 8 Grade 9
United States 3,110,172 3,066,898 2,979,123 3,168,630
Alabama 58,794 59,962 57,024 57,318Alaska 8,665 8,466 7,967 8,114Arizona 49,763 47,832 45,802 46,369Arkansas 33,913 34,729 34,384 32,696California 363,533 359,008 347,479 381,573
Colorado 43,899 42,201 41,075 42,553Connecticut 34,220 33,458 32,382 33,381Delaware 7,680 7,647 7,256 7,869District of Columbia 5,145 5,493 5,172 4,958Florida 139,866 136,337 133,621 148,396
Georgia 91,628 88,006 86,259 94,889Hawaii 12,234 11,251 11,397 12,319Idaho 17,904 17,615 17,243 16,670Illinois 134,204 129,512 128,637 132,303Indiana 73,821 74,194 73,258 76,671
Iowa 35,885 35,361 34,930 34,768Kansas 32,901 32,068 31,743 32,051Kentucky 49,694 49,803 48,141 50,958Louisiana 63,081 59,926 53,507 59,564Maine 15,946 15,809 15,154 15,726
Maryland 53,811 51,722 49,864 52,363Massachusetts 60,813 60,284 58,818 60,803Michigan 114,673 113,342 109,328 119,079Minnesota 57,052 56,483 54,417 54,058Mississippi 38,644 40,762 38,063 37,440
Missouri 64,024 63,566 61,455 63,605Montana 11,543 11,830 11,514 11,370Nebraska 20,892 20,602 20,226 20,061Nevada 15,415 14,920 14,623 14,072New Hampshire 13,299 12,974 12,610 12,680
New Jersey 78,340 76,512 74,839 77,549New Mexico 21,390 21,487 20,487 22,366New York 183,282 184,451 178,389 205,901North Carolina 83,070 83,036 82,523 87,422North Dakota 8,917 9.014 8,898 8,581
Ohio 136,945 135,348 132,213 143,585Oklahoma 44,160 43,622 42,319 41,890Oregon 36,821 36,694 35,253 36,213Pennsylvania 123,240 123,291 119,563 129,283Rhode Island 10,132 10,125 9,894 10,154
South Carolina 50,983 49,576 47,852 53,237South Dakota 10,132 9,992 9,530 9,240Tennessee 63,180 64,137 61,382 64,514Texas 261,986 255,540 246,418 273,922Utah 36,267 33,060 34,551 32,933
Vermont 7,305 7,085 6,842 6,398Virginia 75,177 73,981 73,403 77,527Washington 65,388 62,628 61,623 61,562West Virginia 24,035 26,867 26,175 25,500Wisconsin 58,543 57,860 56,244 59,058Wyoming 7,932 7,429 7,376 7,118
Outlying areasAmerican Samoa 826 853 863 874Guam 1,890 1,878 1,796 2,512Northern Marianas 45 530 468 432Puerto Rico 54,L1.8 56,639 51,702 46,721Virgin Islands 1,602 2,100 1,584 1,496
Grade 10 Grade 11 Grade 12 Ungraded a/
2,895,549 2,611,633 2,381,083
49,923 45,437 42,0317,306 6,700 6,486 ---42,359 37,043 34,645 5,89531,649 29,424 27,734 4,428361,594 315,322 244,142 108,300
39,863 36,614 33,582 3,95331,186 29,289 27,859 10,9597,424 5,862 5,897 ---5,221 4,298 3,481 3,869
134,193 114,293 94,776 ---
77,292 68,045 62,379 ---10,752 10,543 9,234 12,42315,691 14,622 13,095 1,841127,060 114,080 105,541 86,53469,676 63,254. 62,740 13,822
34,067 31,688 30,928 16,11929,629 27,258 26,089 9,28745,483 39,689 37,577 12,30149,407 42,523 37,983 34,76715,238 14,283 13,817 3,474
46,389 42,627 40,529 13,46259,154 56,639 53,484 9,501108,067 99,540 91,769 71,06954,357 51,079 51,32433,177 28,303 26,411 14,286
59,145 53,352 49,925 9,26110,627 9,930 9,609 1,09219,837 18,423 17,68013,530 12,614 11,197 81611,881 11,334 10,408 1,978
73,713 70,029 67,716 64,81020,661 17,938 15,454 17,375188,101 167,323 142,514 139,20279,885 70,712 65,720 17,0958,338 8,003 7,960 ---
129,741 121,578 118,605 ---38,273 37,855 35,671 1,81433,874 31,186 30,018 3,269120,110 113,014 108,592 54,5239,661 8,830 8,167 3,742
43,969 37,480 35,393 ---8,676 7,989 7,758 1,36959,724 53,196 49,050 16,763
224,440 195,180 178,390 ---30,365 28,697 26,263 8,850
5,968 5,612 5,424 1,50068,860 62,503 61,328 25,44058,866 54,828 51,85624,630 22,914 22,045 7,18359,394 55,963 S4,562 12,4497,123 6,689 6,245 110
833 691 599 761,861 1,553 1,120 69
390 383 326 ---44,563 38,020 31,496 12,3231,389 1,114 1,128 943
a/ National totals are omitted for prekindergarten and ungraded students because of noncomparability ofdata across states. These values are included total membership.Data missing or not applicable.
SOURCE: U.S. Department of Education, National Center for Education Statistics, Common Core of Data,"State Nonfiscal Survey."
36 4 2

Table A2.--Public school student-teacher ratio, student membership, and teachers, by grade level and state: Fall 1990
Teachers
State
Student-teacherratio
Totalmembership
Totalteachers
Pre-kindergartenteachers /a
Kindergartenteachers /a
Teachersof grades1 to 12
Teachersof ungradedclasses /a
United States 17.2 41,216,683 2,398,169 2,125,287
Alabama 19.9 721,806 36,266 --- 3,195 33,071Alaska 17.0 113,903 6,710 42 310 6,358Arizona 19.4 639,853 32,987 42 1,338 31,607 ---Arkansas 16.8 436,286 25,984 --- 1,761 24,081 142California 22.8 4,950,474 217,228 14,402 199,872 2,954
Colorado 17.8 574,213 32,342 109 1,158 31,075 ---Connecticut 13.5 469,123 34,785 269 1,327 28,561 4,628Delaware 16.7 99,658 5,961 33 203 5,725District of Columbia 13.6 80,694 5,950 207 319 5,288 136Florida 17.2 1,861,592 108,088 479 6,550 82,030 19,029
Georgia 18.3 1,151,687 63,058 32 4,483 58,543 ---Hawaii 18.9 171,708 9,083 --- --- 8,069 1,014Idaho 19.6 220,840 11,254 51 428 10,681 94
Illinois 16.7 1,821,407 108,775 793 3,982 87,061 16,939Indiana 17.4 954,525 54,806 36 1,905 48,155 4,710
Iowa 15.6 483,652 31,045 324 1,551 28,119 1,051Kansas 15.0 437,034 29,140 100 990 24,933 3,117Kentucky 17.3 636,401 36,777 290 1,237 35,250Louisiana 17.3 784,757 45,401 142 3,013 34,443 7,803Maine 13.9 215,149 15,513 --- 15,513 ---
Maryland 16.8 715,176 42,562 278 1,418 40,866 ---Massachusetts 15.4 834,314 54,003 --- 1,570 44,927 7,506Michigan 19.8 1,584,431 80,008 389 3,298 66,772 9,549Minnesota 17.4 756,374 43,574 34 1,465 42,075Mississippi 17.9 502,417 28,062 15 1,336 25,798 913
Missouri 15.6 816,558 52,359 299 2,246 49,814Montana 15.9 152,974 9,613 --- --- 9,613Nebraska 14.6 274,081 18,764 131 1,443 17,190Nevada 19.4 201,316 10,373 --- 432 8,745 1,196New Hampshire 16.2 172,785 10,637 55 230 10,352
New Jersey 13.6 1,089,646 79,886 216 2,486 67,549 9,635New Mexico 18.1 301,881 16,703 48 745 13,169 2,741New York 14.7 2,598,337 176,390 1,694 6,913 141,462 26,321North Carolina 16.9 1,086,871 64,283 210 4,376 49,896 9,801North Dakota 15.5 117,825 7,591 71 282 7,238 ---
Ohio 17.2 1,771,089 103,088 119 3,364 99,605 ---Oklahoma 15.6 579,087 37,221 67 1,217 32,108 3,829Oregon 18.0 472,394 26,174 47 919 24,308 900Pennsylvania 16.6 1,667,834 100,275 --- --- 88,962 11,313Rhode Island 14.6 138,813 9,522 63 299 7,920 1,240
South Carolina 16.8 622,112 36,963 366 1,113 35,464South Dakota 15.2 129,164 8,511 11 349 7,582 569Tennessee 19.2 824,595 43,051 --- 43,051Texas 15.4 3,382,887 219,298 2,484 10,828 205,986 ---Utah 25.0 446,652 17,884 55 683 14,908 2,238
Vermont 13.2 95,762 7,257 60 272 6,188 737Virginia 15.7 998,601 63,638 82 3,107 59,853 596Washington 20.1 839,709 41,764 --- --- 38,002 3,762West Virginia 15.0 322,389 21,476 45 801 17,085 3,545Wisconsin 16.2 797,621 49,302 312 1,910 44,690 2,390Wyoming 14.5 98,226 6,784 --- 221 5,674 889
Outlying areasAmerican Samoa 18.8 12,463 662 60 35 514 53Guam 17.1 26,391 1,543 20 113 1,388 22Northern Marianas 15.5 6,449 416 17 10 389 ---Puerto Rico 18.8 644,734 34,260 73 1,018 31,098 2,071Virgin Islands 13.8 21,750 1,575 --- 70 1,375 130
a National totals are omitted for prekindergarten and kindergarten teachers and teachers of ungraded classes becauseof noncomparability of data across States. These counts are included in total teachers. See text for details.Data missing or not available.
SOURCE: U.S. Department of Education, National Center for Education Statistics, Common Core of Data, "State Nonfiscal Survey."
3743 BEST COPY 4VAILABLE
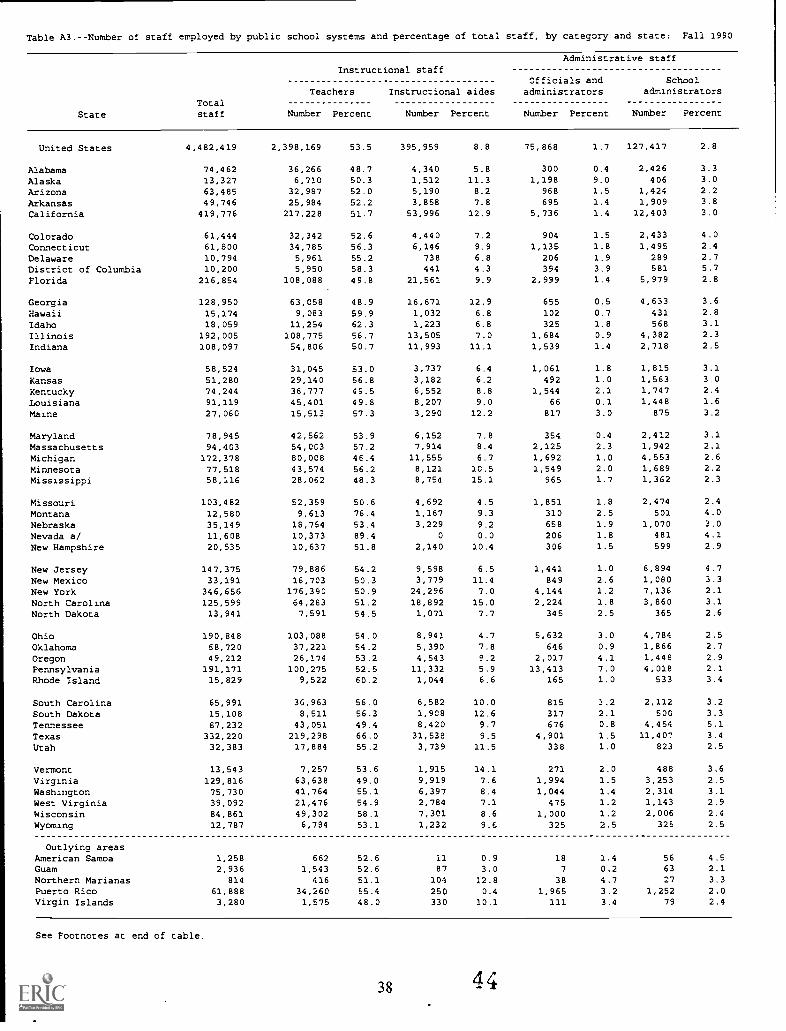
Table A3.--Number of staff employed by public school systems and percentage of total staff, by category and state: Fall 1990
Instructional staffAdministrative staff
TotalState staff
Teachers
Number Percent
Instructional aides
Number Percent
Officials andadministrators
Number Percent
Schooladministrators
Number Percent
United States 4,482,419 2,398,169 53.5 395,959 8.8 75,868 1.7 127,417 2.8
Alabama 74,462 36,266 48.7 4,340 5.8 300 0.4 2,426 3.3
Alaska 13,327 6,710 50.3 1,512 11.3 1,198 9.0 406 3.0
Arizona 63,485 32,967 52.0 5,190 8.2 968 1.5 1,424 2.2
Arkansas 49,746 25,984 52.2 3,858 7.8 695 1.4 1,909 3.8
California 419,776 217,228 51.7 53,996 12.9 5,736 1.4 12,403 3.0
Colorado 61,444 32,342 52.6 4,440 7.2 904 1.5 2,433 4.0
Connecticut 61,800 34,785 56.3 6,146 9.9 1,135 1.8 1,495 2.4
Delaware 10,794 5,961 55.2 738 6.8 206 1.9 289 2.7
District of Columbia 10,200 5,950 58.3 441 4.3 394 3.9 581 5.7
Florida 216,854 106,088 49.8 21,561 9.9 2,999 1.4 5,979 2.8
Georgia 128,950 63,058 48.9 16,671 12.9 655 0.5 4,633 3.6
Hawaii 15,174 9,083 59.9 1,032 6.8 102 0.7 431 2.8
Idaho 18,059 11,254 62.3 1,223 6.8 325 1.8 568 3.1
Illinois 192,005 108,775 56.7 13,505 7.0 1,684 0.9 4,382 2.3
Indiana 108,097 54,806 50.7 11,993 11.1 1,539 1.4 2,718 2.5
Iowa 58,524 31,045 53.0 3,737 6.4 1,061 1.8 1,815 3.1
Kansas 51,280 29,140 56.8 3,182 6.2 492 1.0 1,563 3.0
Kentucky 74,244 36,777 49.5 6,552 8.8 1,544 2.1 1,747 2.4
Louisiana 91,119 45,401 49.8 8,207 9.0 66 0.1 1,448 1.6
Maine 27,060 15,513 57.3 3,290 12.2 817 3.0 875 3.2
Maryland 78,945 42,562 53.9 6,152 7.8 354 0.4 2,412 3.1
Massachusetts 94,403 54,003 57.2 7,914 8.4 2,125 2.3 1,942 2.1
Michigan 172,378 80,008 46.4 11,555 6.7 1,692 1.0 4,553 2.6
Minnesota 77,518 43,574 56.2 8,121 10.5 1,549 2.0 1,689 2.2
Mississippi 58,116 28,062 48.3 8,754 15.1 965 1.7 1,362 2.3
Missouri 103,482 52,359 50.6 4,692 4.5 1,851 1.8 2,474 2.4
Montana 12,580 9,613 76.4 1,167 9.3 310 2.5 501 4.0
Nebraska 35,149 18,764 53.4 3,229 9.2 658 1.9 1,070 3.0
Nevada a/ 11,608 10,373 89.4 0 0.0 206 1.8 481 4.1
New Hampshire 20,535 10,637 51.8 2,140 10.4 306 1.5 599 2.9
New Jersey 147,375 79,886 54.2 9,598 6.5 1,441 1.0 6,894 4.7
New Mexico 33,191 16,703 50.3 3,779 11.4 849 2.6 1,080 3.3
New York 346,656 176,390 50.9 24,296 7.0 4,144 1.2 7,136 2.1
North Carolina 125,599 64,263 51.2 18,892 15.0 2,224 1.8 3,860 3.1
North Dakota 13,941 7,591 54.5 1,071 7.7 345 2.5 365 2.6
Ohio 190,848 103,086 54.0 8,941 4.7 5,632 3.0 4,784 2.5
Oklahoma 68,720 37,221 54.2 5,390 7.8 646 0.9 1,866 2.7
Oregon 49,212 26,174 53.2 4,543 9.2 2,017 4.1 1,446 2.9
Pennsylvania 191,171 100,275 52.5 11,332 5.9 13,413 7.0 4,018 2.1
Rhode Island 15,829 9,522 60.2 1,044 6.6 165 1.0 533 3.4
South Carolina 65,991 36,963 56.0 6,582 10.0 815 2.2 2,112 3.2
South Dakota 15,108 8,511 56.3 1,908 12.6 317 2.1 500 3.3
Tennessee 87,232 43,051 49.4 8,420 9.7 676 0.8 4,454 5.1
Texas 332,220 219,296 66.0 31,538 9.5 4,901 1.5 11,407 3.4
Utah 32,383 17,884 55.2 3,739 11.5 338 1.0 823 2.5
Vermont 13,543 7,257 53.6 1,915 14.1 271 2.0 488 3.6
Virginia 129,816 63,638 49.0 9,919 7.6 1,994 1.5 3,253 2.5
Washington 75,730 41,764 55.1 6,397 8.4 1,044 1.4 2,314 3.1
West Virginia 39,092 21,476 54.9 2,784 7.1 475 1.2 1,143 2.9
Wisconsin 84,861 49,302 58.1 7,301 8.6 1,000 1.2 2,006 2.4
Wyoming 12,787 6,784 53.1 1,232 9.6 325 2.5 325 2.5
Outlyina areasAmerican Samoa 1,258 662 52.6 11 0.9 18 1.4 56 4.5Guam 2,936 1,543 52.6 87 3.0 7 0.2 63 2.1
Northern Marianas 814 416 51.1 104 12.8 38 4.7 27 3.3
Puerto Rico 61,888 34,260 55.4 250 0.4 1,965 3.2 1 252 2.0Virgin Islands 3,280 1,575 48.0 330 10.1 111 3.4 79 2.4
See Footnotes at end of table.
38 4 4

Table A3.--Number of staff employed by public school systems and percentage of total staff, by categoryand state: Fall 1990--continued
Support staff
Guidance Other supportcounselors/directors Librarians staff
StateTotalstaff Number Percent Number Percent Number Percent
United States 4,482,419 79,950 1.8 49,909 1.1 1,355,147 30.2
Alabama 74,462 1,396 1.9 1,244 1.7 28,490 38.3Alaska 13,327 210 1.6 163 1.2 3,128 23.5Arizona 63,485 853 1.3 657 1.0 21,406 33.7Arkansas 49,746 1,168 2.3 946 1.9 15,186 30.5California 419,776 5,698 1.4 1,155 0.3 123,560 29.4
Colorado 61,444 983 1.6 740 1.2 19,602 31.9Connecticut 61,800 1,692 2.7 674 1.1 15,873 25.7Delaware 10,794 196 1.8 115 1.1 3,289 30.5District of Columbia 10,200 263 2.6 179 1.8 2,392 23.5Florida 216,854 4,609 2.1 2,521 1.2 71,097 32.8
Georgia 128,950 1,600 1.2 1,908 1.5 40,425 31.3Hawaii 15,174 503 3.3 264 1.7 3,759 24.8Idaho 18,059 330 1.8 177 1.0 4,182 23.2Illinois 192,005 2,787 1.5 2,075 1.1 58,797 30.6Indiana 108,097 1,595 1.5 1,074 1.0 34,372 31.8
Iowa 58,524 1,187 2.0 667 1.1 19,012 32.5Kansas 5:,280 1,185 2.3 946 1.8 14,772 28.8Kentucky 74,144 1,103 1.5 1,111 1.5 25,410 34.2Louisiana Q1.'19 892 1.0 1,183 1.3 33,922 37.2Maine 27,060 611 2.3 260 1.0 5,694 21.0
Maryland 78,945 1,6C4 2.0 1,070 1.4 24,791 31.4Massachusetts 94,403 1,823 1.9 656 0.7 25,940 27.5Michigan 172,378 2,923 1.7 1,578 0.9 70,069 40.6Minnesota 77,518 869 1.1 781 1.0 20,935 27.0Mississippi 58,116 766 1.3 670 1.2 17,537 30.2
Missouri 103,482 1,976 1.9 1,273 1.2 38,857 37.5Montana 12,580 345 2.7 315 2.5 329 2.6Nebraska 35,149 507 1.7 530 1.5 10,291 29.3Nevada a/ 11,608 354 3.0 194 1.7 0 0.0
New Hampshire 20,535 548 2.7 265 1.3 6,040 29.4
New Jersey 147,375 2,998 2.0 1,687 1.1 44,871 30.4
New Mexico 33,191 587 1.8 236 0.7 9,957 30.0New York 346,656 5,896 1.7 3,336 1.0 125,458 36.2North Carolina 125,599 2,403 1.9 2,178 1.7 31,759 25.3North Dakota 13,941 163 1.2 171 1.2 4,235 30.4
Ohio 190,848 3,229 1.7 1,685 0.9 63,489 33.3Oklahoma 68,720 1,130 1.6 767 1.1 21,700 31.6Oregon 49,212 1,115 2.3 731 1.5 13,184 26.8Pennsylvania 191,171 3,359 1.8 2,220 1.2 56,554 29.6Rhode Island 15,829 328 2.1 213 1.3 4,024 25.4
South Carolina 65,991 1,387 2.1 1,088 1.6 17,044 25.8South Dakota 15,108 272 1.8 179 1.2 3,421 22.6Tennessee 87,232 860 1.0 1,290 1.5 28,481 32.6Texas 332,220 8,198 2.5 3,876 1.2 53,002 16.0Utah 32,383 395 1.2 255 0.8 8,949 27.6
VermoAt 13,543 350 2.6 200 1.5 3,062 22.6Virginia 129,816 2,983 2.3 1,747 1.3 46,282 35.7Washington 75,730 1,411 1.9 1,174 1.6 21,626 28.6West Virginia 39,092 536 1.4 373 1.0 12,305 31.5Wisconsin 84,861 1,493 1.8 970 1.1 22,789 26.9Wyoming 12,787 181 1.4 142 1.1 3,798 29.7
Outlying areasAmerican Samoa 1,258 24 1.9 6 0.5 481 38.2Guam 2,936 63 2.1 31 1.1 1,142 38.9Northern Marianas 814 17 2.1 11 1.4 201 24.7Puerto Rico 61,888 797 1.3 736 1.2 22,628 36.6Virgin Islands 3,280 79 2.4 40 1.2 1,066 32.5
a/ Nevada does not report instructional aides and other support staff; these numbers are assumed to be zero.SOURCE. U.S. Department of Education, National Center for Education Statistics, Common Core of Data,
"State Nonfiscal Survey."
39

Table A4.--Number of public school graduates, 12th-grade student membership, and 9th-grade student membership3 years earlier, by state: School year 1989-90
State
Regular Other 12th- 9th- High school Otherhigh school diploma grade grade equivalency high schoolgraduates recipients membership membership recipients completers1989-90 a/ 1989-90 b/ 1989-90 1986-87 1989-90 b/ 1989-90 b/
United States 2,320,337 2,473,278 3,256,860
Alabama 40,485 43,482 62,612 3,124 1,925Alaska 5,386 6,402 7,872 636 6
Arizona 32,103 --- 35,618 44,263 8,109 ---Arkansas 26,475 4 28,505 34,501 2,444 1,839California 236,291 33,912 243,023 348,672 6,662 2,697
Colorado 32,967 34,799 44,478 2,278 206Connecticut 27,878 --- 29,186 37,191 1,624Delaware 5,550 475 6,314 8,103 826 86
District of Columbia 3,626 --- 3,778 5,884 618 88
Florida 88,934 1,856 96,639 145,470 14,911 698
Georgia 56,605 59,445 90,274Hawaii 10,325 --- 9,453 11,896 --- 184Idaho 11,971 31 13,149 15,080 149 14
Illinois 108,119 --- 110,514 141,211 --- ---Indiana 60,012 1,018 65,063 79,787 3,874 326
Iowa 31,796 242 33,795 36,316 4,324 0
Kansas 25,367 26,918 30,940 ---
Kentucky 38,005 227 40,186 55,038 --- ---
Louisiana 36,053 --- 39,892 63,616 6,615 1,454Maine 13,839 377 14,552 17,829 1,195 60
Maryland 41,566 43,302 57,118 2,001Massachusetts 55,941 --- 55,945 70,205 --- ---
Michigan 93,807 6,715 97,713 133,796 3,786 713Minnesota 49,087 53,724 54,693 3,944Mississippi 25,182 154 27,851 39,196 2,619 1,720
Missouri 48,957 52,420 67,105 3,865Montana 9,370 9,985 11,249 641Nebraska 17,664 --- 19,099 20,650 892Nevada 9,477 838 11,297 12,273 1,013 22New Hampshire 10,766 --- 11,131 14,547 2,177 ---
New Jersey 69,824 --- 70,438 87,477 8,146New Mexico 14,884 152 15,751 21,820 1,836 125New York 143,318 2,989 148,836 220,033 13,342 189North Carolina 64,782 59 68,194 95,311 3,748 1,677North Dakota 7,690 8,032 8,733 145 ---
Ohio 114,513 125,507 154,659 3,786Oklahoma 35,606 37,728 45,930 5,527 ---
Oregon 25,473 115 30,018 35,552 6,690 2,133Pennsylvania 110,527 115,400 139,761 7,246Rhode Island 7,825 4 8,346 11,238 --- 33
South CarolinaSouth DakotaTennesseeTexasUtah
32,483 681 36,621 55,488 2,160 2,6447,650 8,248 8,929 935 ---46,094 50,851 67,900 9,713 1,351172,480 192,963 269,256 --- ---21,196 1,177 24,971 26,935 464 138
Vermont 6,127 --- 5,719 6,685 1,278Virginia 60,605 919 63,501 82,294 3,827 689Washington 45,941 --- 53,840 59,514 3,260West Virginia 21,854 22,831 28,278 1,435Wisconsin 52,038 56,022 61,791 3,058Wyoming 5,823 6,281 7,411 303
Outlying areasAmerican Samoa 703 641 790 29 7
Guam 1,033 1,240 2,693 78Northern Marianas 227 --- 300 ---Puerto Rico 29,049 4,903 32,700 48,012 4,456 0
Virgin Islands 1,260 67 1,063 2,186 37
Data missing or not applicable.a/ Regular high school graduates may include summer graduates not included in 12th grade membership.b/ National totals are omitted for other diploma, high school equivalency recipients and other completers
because of noncomparability of data across states. High school equivalency recipients are age 19 or younger.SOURCE: U.S. Department of Education, National Center for Education Statistics, Common Core of Data,
"State Nonfiscal Survey."
40

Table A5.--Change in number of public school graduates and 12th-grade student membership from 1989 to 1990,by state
State
Regular high schoolgraduates a/
1988-89 1989-90
Ratio of1990 to 1989graduates
12th-grademembership
1988-89 1989-90
Ratio of1990 to 198912th-grademembership
Graduatechangeindex b/
United States 2,458,800 2,320,337 94.4 2,650,467 2,473,278 93.3 101.1
Alabama 43,437 40,485 93.2 45,571 43,482 95.4 97.7Alaska 5,631 5,386 95.6 6,851 6,402 93.4 102.4Arizona 31,919 32,103 100.6 36,962 35,618 96.4 104.4Arkansas 27,920 26,475 94.8 30,074 28,505 94.8 100.0California 244,629 236,291 96.6 257,450 243,023 94.4 102.3
Colorado 35,520 32,967 92.8 37,538 34,799 92.7 100.1Connecticut 30,862 27,878 90.3 32,927 29,186 88.6 101.9Delaware 6,104 5,550 90.9 6,807 6,314 92.8 98.0District of Columbia 3,565 3,626 101.7 4,346 3,778 86.9 117.0Florida 90,759 88,934 98.0 99,659 96,639 97.0 101.1
Georgia 61,937 56,605 91.4 65,902 59,445 90.2 101.3Hawaii 10,404 10,325 99.2 10,039 9,453 94.2 105.4Idaho 12,520 11,971 95.6 13,943 13,149 94.3 101.4Illinois 116,660 108,119 92.7 120,267 110,514 91.9 100.9Indiana 63,571 60,012 94.4 69,641 65,063 93.4 101.0
Iowa 34,294 31,796 92.7 36,157 33,795 93.5 99.2Kansas 26,848 25,367 94.5 28,783 26,918 93.5 101.0Kentucky 38,883 38,005 97.7 42,382 40,186 94.8 103.1Louisiana 37,198 36,053 96.9 41,604 39,892 95.9 101.1Maine 13,857 13,839 99.9 15,662 14,552 92.9 107.5
Maryland 45,791 41,566 90.8 47,248 43,302 91.6 99.0Massachusetts 57,328 55,941 97.6 60,588 55,945 92.3 105.7Michigan 101,784 93,807 92.2 107,398 97,713 91.0 101.3Minnesota 53,122 49,087 92.4 58,335 53,724 92.1 100.3Mississippi 24,241 25,182 103.9 29,129 27,851 95.6 108.6
Missouri 51,968 48,957 94.2 56,218 52,420 93.2 101.0Montana 10,490 9,370 89.3 10,958 9,985 91.1 98.0Nebraska 18,690 17,664 94.5 19,964 19,099 95.7 98.8Nevada 9,464 9,477 100.1 11,916 11,297 94.8 105.6New Hampshire 11,340 10,766 94.9 11,878 11,131 93.7 101.3
New Jersey 76,263 69,824 91.6 78,033 70,438 90.3 101.4New Mexico 15,481 14,884 96.1 16,915 15,751 93.1 103.2New York 154,580 143,318 92.7 161,593 148,836 92.1 100.7North Carolina 69,970 64,782 92.6 73,595 68,194 92.7 99.9North Dakota 8,077 7,690 95.2 8,433 8,032 95.2 100.0
Ohio 125,036 114,513 91.6 137,196 125,507 91.5 100.1Oklahoma 36,773 35,606 96.8 40,073 37,728 94.1 102.8Oregon 26,903 25,473 94.7 32,320 30,018 92.9 101.9Pennsylvania 118,921 110,527 92.9 124,572 115,400 92.6 100.3Rhode Island 8,554 7,825 91.5 8,954 8,346 93.2 98.1
South Carolina 37,020 32,483 87.7 39,348 36,621 93.1 94.3!:.outh Dakota 8,181 7,650 93.5 8,685 8,248 95.0 98.57.-ennessee 48,553 46,094 94.9 53,700 50,851 94.7 100.3Texas 176,951 172,480 97.5 201,762 192,963 95.6 101.9Utah 22,934 21,196 92.4 25,911 24,971 96.4 95.9
Vermont 5,963 6,127 102.9 6,229 5,719 91.8 111.9Virginia 65,004 60,605 93.2 68,064 63,501 93.3 99.9Washington 48,941 45,941 93.9 57,921 53,840 93.0 101.0West Virginia 22,886 21,854 95.5 23,488 22,831 97.2 98.2Wisconsin 54,994 52,038 94.6 60,725 56,022 92.3 102.6Wyoming 6,079 5,823 95.8 6,753 6,281 93.0 103.0
Outlying areasAmerican Samoa 569 703 123.6 654 641 98.0 126.1Guam 936 1,033 110.4 1,099 1,240 112.8 97.8Northern Marianas 200 227 113.5 281 300 106.8 106.3Puerto Rico 31,617 29,049 91.9 35,307 32,700 92.6 99.2Virgin Islands 1,025 1,260 122.9 1,200 1,063 68.6 138.8
a/ Regular high school graduates may include summer graduates not included in 12th grade membership.b/ Graduate change index is the ratio of 1990 graduates to 1989 graduates divided by the ratio of 1990
12th-grade membership to 1989 12th-grade membership, multiplied by 100.SOURCE: U.S. Department of Education, National Center for Education Statistics, Common Core of Data,
"State Nonfiscal Survey."
4 1
4 7

Table A6.--Revenues for public elementary and secondary schools, by source and state: School year 1989-90
(In thousands of dollars)
State Total
Revenues,
Local
by source
Intermediate State Federal
United States a/ $207,752,932 $95,916,077 $897,439 $98,238,633 $12,700,784
Alabama 2,557,836 737,217 0 1,534,021 286,598Alaska 960,122 209,740 0 622,798 127,584Arizona 2,742,625 1,200,486 131,299 1,194,354 216,488Arkansas 1,594,428 531,371 3,932 905,487 153,637California 24,320,281 6,454,798 0 16,260,203 1,605,281
Colorado 2,767,107 1,577,696 1,798 1,055,366 132,246
Connecticut 3,543,024 1,870,065 0 1,575,131 97,828Delaware 542,448 140,672 0 362,161 39,616District of Columbia 648,392 593,801 0 0 54,591Florida 9,589,961 4,079,776 0 4,914,474 595,711
Georgia 5,194,517 2,105,928 0 2,759,335 329,253Hawaii 810,631 19,546 0 714,986 . 76,099Idaho 710,841 226,193 0 427,757 56,891Illinois a/ 8,814,248 5,329,732 0 2,952,592 531,923Indiana 4,349,969 1,624,186 4,090 2,510,251 211,441
Iowa 2,145,710 976,662 11,648 1,056,130 105,270Kansas 2,085,315 914,177 146,673 920,867 103,598Kentucky 2,247,379 486,428 0 1,540,138 220,813Louisiana 3,058,293 1,052,531 0 1,696,645 309,117Maine 1,154,667 478,416 0 613,447 62,805
Maryland 4,267,441 2,461,507 0 1,609,649 196,285Massachusetts 5,117,504 3,112,058 0 1,765,255 240,192Michigan '8,394,959 5,656,011 5,846 2,251,071 482,031Minnesota 3,988,317 1,627,502 107,520 2,088,236 165,059
Mississippi 1,573,464 444,934 732 884,024 243,774
Missouri 3,699,939 1,996,658 17,909 1,480,193 205,179Montana 707,594 252,359 66,621 324,888 63,726Nebraska 1,359,712 955,095 10,505 314,371 79,742Nevada 860,464 497,673 0 326,773 36,018New Hampshire 900,843 .800,215 0 75,684 24,944
New Jersey a/ 8,820,238 4,997,366 0 3,486,521 336,351New Mexico 1,225,429 181,661 0 893,539 150,229New York 19,744,546 10,638,450 46,882 8,044,917 1,014,296North Carolina 4,683,693 1,255,342 0 3,127,946 300,405North Dakota 487,049 213,752 7,738 218,041 47,517
Ohio 8,709,509 4,467,797 3,363 3,774,795 463,554Oklahoma 2,172,547 764,822 48,693 1,237,503 121,530Oregon 2,539,734 1,702,040 44,473 637,971 155,250Pennsylvania 10,336,060 5,279,381 10,930 4,511,630 534,118Rhode Island 844,009 438,946 0 363,539 41,524
South Carolina a/ 2,692,826 1,110,732 16,700 1,347,999 217,395South Dakota 503,949 309,076 6,547 130,552 57,774Tennessee 2,907,714 1,290,636 24,474 1,330,928 261,676Texas 13,948,117 6,962,810 125,876 5,847,048 1,012,383Utah 1,334,715 496,690 0 751,040 86,986
Vermont 562,543 345,613 11,136 181,330 24,464Virginia 5,101,281 3,145,376 0 1,687,176 268,730Washington 4,192,291 947,925 0 3,000,965 243,402West Virginia 1,413,165 378,830 135 928,128 106,072Wisconsin 4,240,432 2,362,628 0 1,703,555 174,249Wyoming 581,050 212,768 41,917 297,225 29,140
Outlying areasAmerican Samoa 26,936 81 0 8,511 18,345Guam 113,758 95,689 0 0 18,069Northern Marianas 26,906 12 0 19,935 6,959Puerto Rico 1,159,520 887 0 620,287 338,346Virgin Islands 174,458 109,437 0 0 65,021
a/ Local revenues for these states were adjusted by NCES, affecting total revenues and the national totalfor local revenues and total revenues. See Zext for details.
NOTE: Details may not add to total du:. tn rounding.SOURCE: U.S. Department of Education, National Center for Education Statistics, Common Core of Data,
"The National Public Education Financial Survey."
42 43
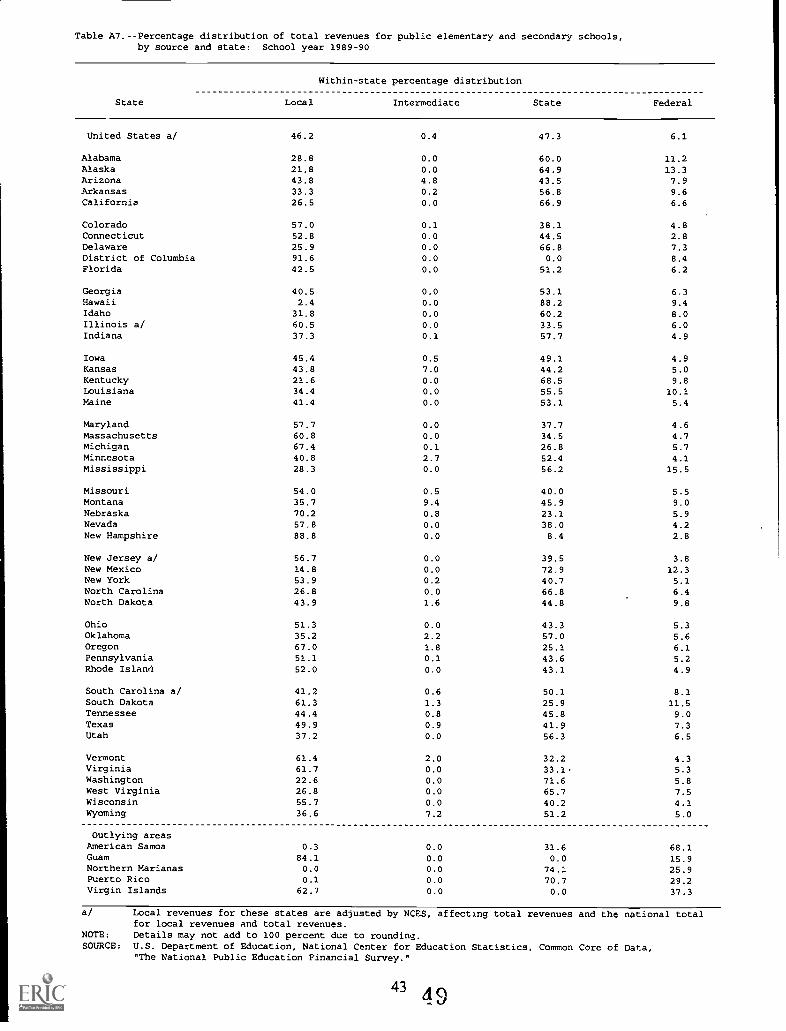
Table A7.--Percentage distribution of total revenues for public elementary and secondary schools,by source and state: School year 1989-90
State Local
Within-state percentage distribution
Intermediate State Federal
United States a/ 46.2 0.4 47.3 6.1
Alabama 28.8 0.0 60.0 11.2Alaska 21.8 0.0 64.9 13.3Arizona 43.8 4.8 43.5 7.9Arkansas 33.3 0.2 56.8 9.6California 26.5 0.0 66.9 6.6
Colorado 57.0 0.1 38.1 4.8Connecticut 52.8 0.0 44.5 2.8Delaware 25.9 0.0 66.8 7.3District of Columbia 91.6 0.0 0.0 8.4Florida 42.5 0.0 51.2 6.2
Georgia 40.5 0.0 53.1 6.3Hawaii 2.4 0.0 88.2 9.4Idaho 31.8 0.0 60.2 8.0Illinois a/ 60.5 0.0 33.5 6.0Indiana 37.3 0.1 57.7 4.9
Iowa 45.4 0.5 49.1 4.9Kansas 43.8 7.0 44.2 5.0Kentucky 21.6 0.0 68.5 9.8Louisiana 34.4 0.0 55.5 10.1Maine 41.4 0.0 53.1 5.4
Maryland 57.7 0.0 37.7 4.6Massachusetts 60.8 0.0 34.5 4.7Michigan 67.4 0.1 26.8 5.7Minnesota 40.8 2.7 52.4 4.1Mississippi 28.3 0.0 56.2 15.5
Missouri 54.0 0.5 40.0 5.5Montana 35.7 9.4 45.9 9.0Nebraska 70.2 0.8 23.1 5.9Nevada 57.8 0.0 38.0 4.2New Hampshire 88.8 0.0 8.4 2.8
New Jersey a/ 56.7 0.0 39.5 3.8New Mexico 14.8 0.0 72.9 12.3New York 53.9 0.2 40.7 5.1North Carolina 26.8 0.0 66.8 6.4North Dakota 43.9 1.6 44.8 9.8
Ohio 51.3 0.0 43.3 5.3Oklahoma 35.2 2.2 57.0 5.6Oregon 67.0 1.8 25.1 6.1Pennsylvania 51.1 0.1 43.6 5.2Rhode Island 52.0 0.0 43.1 4.9
South Carolina a/ 41.2 0.6 50.1 8.1South Dakota 61.3 1.3 25.9 11.5Tennessee 44.4 0.8 45.8 9.0Texas 49.9 0.9 41.9 7.3Utah 37.2 0.0 56.3 6.5
Vermont 61.4 2.0 32.2 4.3Virginia 61.7 0.0 33.1. 5.3Washington 22.6 0.0 71.6 5.8West Virginia 26.8 0.0 65.7 7.5Wisconsin 55.7 0.0 40.2 4.1Wyoming 36.6 7.2 51.2 5.0
Outlying areasAmerican Samoa 0.3 0.0 31.6 68.1Guam 84.1 0.0 0.0 15.9Northern Marianas 0.0 0.0 74.1 25.9Puerto Rico 0.1 0.0 70.7 29.2Virgin Islands 62.7 0.0 0.0 37.3
a/ Local revenues for these states are adjusted by NCES, affecting total revenues and the national totalfor local revenues And total revenues.
NOTE: Details may not add to 100 percent due to rounding.SOURCE: U.S. Department of Education, National Center for Education Statistics, Common Core of Data,
"The National Public Education Financial Survey."
434 9

Table A8.--Current expenditures for public elementary and secondary schools, by functionand state: School year 1989-90
(In thousands of dollars)
State Total
Current expenditures, by function
Instruction Support services Noninstruction
United States b/ $187,557,791 $113,508,548 $65,715,524 $8,333,719
Alabama a/ 2,275,233 1,415,988 661,174 198,070
Alaska 828,051 411,555 388,824 27,672
Arizona b/ 2,258,641 1,333,943 819,184 105,514
Arkansas a/ 1,404,545 833,978 452,252 118,315California b/ 21,485,782 12,466,505 8,183,826 815,451
Colorado b/ 2,451,831 1,475,510 903,315 73,005
Connecticut b/ 3,340,627 2,148,247 1,160,055 32,325Delaware b/ 511,538 325,474 176,677 9,388
District of Columbia 632,459 290,617 331,066 10,777Florida a/ 8,228,531 4,760,602 3,055,239 412,690
Georgia a/ 4,414,016 2,760,999 1,385,958 267,059Hawaii 700,012 420,364 230,364 49,285Idaho a/ 627,794 392,204 204,479 31,110Illinois a/ 8,125,493 4,832,679 2,991,690 301,124
Indiana a/ 4,024,098 2,489,175 1,343,818 191,105
Iowa 2,004,742 1,203,193 713,815 87,734
Kansas a/ 1,848,302 1,091,406 668,744 88,152Kentucky a/ 2,094,231 1,273,453 724,271 96,507Louisiana a/ 2,802,793 1,656,514 909,437 236,842
Maine b/ 1,048,195 687,622 330,963 29,609
Maryland a/ 3,845,123 2,324,421 1,387,011 133,691Massachusetts a/ 4,760,390 2,840,881 1,772,241 147,269
Michigan a/ 8,025,621 4,612,472 3,170,646 242,502
Minnesota a/ 3,474,398 2,206,638 1,123,999 143,762
Mississippi a/ 1,472,710 933,399 418,894 120,417
Missouri 3,288,738 1,989,034 1,153,019 146,684Montana 641,345 398,079 215,053 28,213Nebraska a/ 1,233,431 752,610 361,412 119,410
Nevada 712,698 431,571 256,820 24,508New Hampshire 821,671 511,957 280,676 29,037
New Jersey b/ 7,963,966 4,522,187 3,245,026 196,753New Mexico b/ 1,020,151 594,571 377,064 48,516New York 18,090,978 11,932,397 5,592,249 566,332North Carolina a/ 4,288,474 2,688,444 1,315,344 284,685North Dakota 459,391 277,047 146,259 36,084
Ohio 7,994,379 4,548,349 3,025,445 420,584Oklahoma b/ 1,905,339 1,192,694 602,525 110,119Oregon 2,297,944 1,338,458 880,717 78,768
Pennsylvania a/ 9,496,786 5,986,447 3,161,309 349,031Rhode Island a/ 786,969 520,835 251,608 14,525
South Carolina b/ 2,322,432 1,368,276 743,294 210,862South Dakota b/ 447,068 275,338 144,670 27,060Tennessee a/ 2,790,808 1,803,131 792,880 194,797Texas a/ 12,763,954 7,729,648 4,216,514 817,792Utah 1,130,135 731,602 327,692 70,841
Vermont a/ 546,901 342,051 188,798 16,053
Virginia 4,561,874 2,743,571 1,638,755 179,548Washington b/ 3,551,252 2,079,651 1,302,500 169,102West Virginia b/ 1,316,747 787,617 448,823 80,307Wisconsin 3,929,920 2,454,141 1,348,914 126,865Wyoming 509,084 301,001 190,217 17,866
Outlying AreasAmerican Samoa 21,837 9,004 8,997 3,835Guam a/ 106,033 46,407 54,689 4,936Northern Marianas 20,476 17,631 2,845Puerto Rico 1,090,383 768,791 165,602 155,990Virgin Islands 128,066 69,173 52,356 6,538
a/
b/
---
NOTE:SOURCE:
Instruction, support services and/cr noninstruction expenditures were adjusted byNCES, affecting national totals for these expenditures. See text for details.Instruction, support services and/or noninstruction expenditures were adjusced byNCES, affecting current expenditures for these states and national totals. See text.Data missing or not available.Details may not add to total due to rounding.U.S. Department of Education, National Center for Education Statistics, Common Coreof Data, "The National Public Education Financial Survey."
4450

Table A9.--Percentage distribution of current expenditures for public elementary andsecondary schools, by function and state: School year 1989-90
State Instruction
Within-state percentage distribution
Support services Noninstruction
United States a/ 60.5 35.0 4.4
Alabama a/ 62.2 29.1 8.7Alaska 49.7 47.0 3.3Arizona a/ 59.1 36.3 4.7Arkansas a/ 59.4 32.2 8.4California a/ 56.1 38.1 3.8
Colorado a/ 60.2 36.8 3.0Connecticut a/ 64.3 34.7 1.0Delaware a/ 63.6 34.5 1.8District of Columbia 46.0 52.3 1.7Florida a/ 57.9 37.1 5.0
Georgia a/ 62.6 31.4 6.1Hawaii 60.1 32.9 7.0Idaho a/ 62.5 32.6 5.0Illinois a/ 59.5 36.8 3.7Indiana a/ 61.9 33.4 4.7
Iowa 60.0 35.6 4.4Kansas a/ 59.0 36.2 4.8Kentucky a/ 60.8 34.6 4.6Louisiana a/ 59.1 32.4 8.5Maine a/ 65.6 31.6 2.8
Maryland a/ 60.5 36.1 3.5Massachusetts a/ 59.7 37.2 3.1Michigan a/ 57.5 39.5 3.0Minnesota a/ 63.5 32.4 4.1Mississippi a/ 63.4 28.4 8.2
Missouri 60.5 35.1 4.5Montana 62.1 33.5 4.4Nebraska a/ 61.0 29.3 9.7Nevada 60.5 36.0 3.4New Hampshire 62.3 34.2 3.5
New Jersey a/ 56.8 40.7 2.5New Mexico a/ 58.3 37.0 4.8New York 66.0 30.9 3.1North Carolina a/ 62.7 30.7 6.6North Dakota 60.3 31.8 7.9
Ohio 56.9 37.8 5.3Oklahoma a/ 62.6 31.6 5.8Oregon 58.2 18.3 3.4Pennsylvania a/ 63.0 33.3 3.7Rhode Island a/ 66.2 32.0 1.8
South Carolina a/ 58.9 32.0 9.1South Dakota a/ 61.6 32.4 6.1Tennessee a/ 64.6 28.4 7.0Texas a/ 60.6 33.0 6.4Utah 64.7 29.0 6.3
Vermont a/ 62.5 34.5 2.9Virginia 60.1 35.9 3.9Washington a/ 58.6 36.7 4.8West Virginia a/ 59.8 34.1 6.1Wisconsin 62.4 34.3 3.2Wyoming 59.1 37.4 3.5
Outlying AreasAmerican Samoa 41.2 41.2 17.6Guam a/ 43.8 51.6 4.7Northern Marianas 86.3 --- 13.9Puerto Rico 70.5 15.2 14.3Virgin Islands 54.0 40.9 5.1
a/ Instruc:-.ion, support services and/or noninstruction expenditures were adjustedby NCES, affecting distribution ratios. See text for details.Data missing or not available.
SOURCE: U.S. Department of Education, National Center for Education Statistics, CommonCore of Data, "The National Public Education Finacial Survey..
45 51

Table A10.--Average daily attendance and current expenditures per pupil in attendance for publicelementary and secondary schools, by functicn and state: Fiscal year 1989-90
State
United States b/
Alabama b/AlaskaArizona b/Arkansas b/California b/
Colorado b/Connecticut b/Delaware b/District of Columbia b/Florida b/
Georgia b/HawaiiIdaho b/Illinois b/Indiana b/
IowaKansas b/Kentucky b/Louisiana b/Maine b/
Maryland b/Massachusetts b/Michigan b/Minnesota b/Mississippi b/
MissouriMontanaNebraska b/NevadaNew Hampshire
New Jersey b/New Mexico b/New YorkNorth Carolina b/North Dakota
OhioOklahoma b/OregonPennsylvania b/Rhode Island b/
South Carolina b/South Dakota b/Tennessee b/Texas b/Utah
Vermont b/VirginiaWashington b/West Virginia b/WisconsinWyoming
Outlying AreasAmerican SamoaGuam b/Northern MarianasPuerto RicoVirgin Islands
Averagedaily
attendance a/
Current expenditures per pupil
SupportTotal Instruction services
in attendance
Non-instruction
37,799,296 $4,962 $3,003 $1,739 $220
683,833 3,327 2,071 967 29098,213 8,431 4,190 3,959 282
557,252 4,053 2,394 1,470 189403,025 3,485 2,069 1,122 294
4,893,341 4,391 2,552 1,672 167
519,419 4,720 2,841 1,739 141
439,524 7,601 4,888 2,639 74
89,838 5,694 3,623 1,967 104
71,468 8,850 4,066 4,632 151
1,646,583 4,997 2,891 1,856 251
1,054,097 4,187 2,619 1,315 253157,360 4,448 2,671 1,464 313203,987 3,078 1,923 1,002 153
1,587,733 5,118 3,044 1,884 190884,568 4,549 2,814 1,519 216
450,224 4.453 2,672 1,585 195
388,986 4,752 2,806 1,719 227569,795 3,675 2,235 1,271 169
727,125 3,855 2,278 1,251 326
195,089 5,373 3,525 1,696 152
620,617 6,196 3,745 2,235 215763,231 6,237 3,722 2,322 193
1,4,6,996 5,546 3,188 2,191 168
699,001 4,971 3,157 1,608 206
476,048 3,094 1,961 880 253
729,693 4,507 2,726 1,580 201
135,406 4,736 2,940 1,588 208254,754 4,842 2,954 1,419 469
173,149 4,117 2,492 1,483 142
154,915 5,304 3,305 1,812 187
997,561 7,983 4,533 3,253 197
290,245 3,515 2,049 1,299 167
2,244,110 8,062 5,317 2,492 2521,012,274 4,236 2,656 1,299 281109,659 4,189 2,526 1,334 329
1,584,735 5,045 2,670 1,909 265
543,170 3,508 2,196 1,109 203419,771 5,474 3,189 2,098 188
1,524,839 6,228 3,926 2,073 229125,934 5,249 4,136 1,998 115
569,029 4,081 2,405 1,306 371119,823 3,731 2,298 1,207 226761,766 3,664 2,367 1,041 256
3,075,333 4,150 2,513 1,371 266408,917 2,764 1,789 801 173
87,832 6,227 3,894 2,150 183
989,197 4,612 2,774 1,657 182755,141 4,703 2,754 1,725 224301,947 4,361 2,608 1,486 266711,466 5,524 3,449 1,896 178
91,277 5,577 3,298 2,084 196
11,448 1,907 787 786 33523,883 4,440 1,943 2,290 2076,809 3,007 2,589 --- 418
597,436 1,825 1,287 277 26118,924 6,767 3,655 2,767 345
a/ Average daily attendance (ADA) is not comparable among states because of various statutoryreporting procedures.
b/ Instruction, support services and/or noninstruction expenditures were adjustedby NCES, affecting distribution ratios. See text for details.Data missing or not available.
NOTE: Details may not add to total due to rounding.SOURCE: U.S. Department of Education, National Center for Education Statistics, Common Core of Data,
"The National Public Education Financial Survey."
465 2

Table All.--Student membership and current expenditures per pupil in membership for public elementaryand secondary schools, by function and state: School year 1989-90
State
Membershipas of
fall 1989
Current expenditures per pupil
SupportTotal Instruction services
in membership
Non-instruction
United States a/ 40,542,707 $4,626 $2,800 $1,621 $206
Alabama a/ 723,743 3,144 1,956 914 274Alaska 109,280 7,577 3,766 3,558 253Arizona a/ 607,62 3,717 2,195 1,348 174Arkansas a/ 434,960 3,229 1,917 1,040 272California a/ 4,771,978 4,502 2,617 1,715 171
Colorado a/ 562,755 4,357 2,622 1,605 130Connecticut a/ 461,560 7,238 4,654 2,513 70Delaw a/ 97,808 5,230 3,328 1,806 96Distr .f Columbia 81,301 7,779 3,575 4,072 133Florida d/ 1,789,925 4,597 2,660 1,707 231
Georgia a/ 1,126,535 3,918 2,451 1,230 237Hawaii 165,493 4,130 2,480 1,359 291Idaho a/ 214,932 2,921 1,825 951 145Illinois a/ 1,797,35E 4,521 2,689 1,664 168Indiana a/ 954,165 4,217 2,609 1,408 200
Iowa 478,486 4,190 2,515 1,492 183Kansas a/ 430,864 4,290 2,533 1,552 205Kentucky a/ 630,688 3,321 2,019 1,148 153Louisiana a/ 783,025 3,579 2,116 1,161 302Maine a/ 213,775 4,903 3,217 1,548 139
Maryland a/ 698,806 5,502 3,326 1,985 191Massachusetts a/ 825,588 5,766 3,441 2,147 178Michigan a/ 1,576,785 5,090 2,925 2,011 154Minnesota a/ 739,553 4,698 2,984 1,520 194Mississippi a/ 502,020 2,934 1,859 834 240
Missouri 807,934 4,071 2,462 1,427 182Montana 151,265 4,240 2,632 1,422 187Nebraska a/ 270,920 4,553 2,778 1,334 441Nevada 186,834 3,816 2,310 1,375 131New Hampshire 171,696 4,766 2,982 1,635 169
New Jersey a/ 1,076,005 7,401 4,203 3,016 183New Mexico a/ 296,057 3,446 2,008 1,274 164New York 2,565,841 7,051 4,650 2,179 221North Carolina a/ 1,080,744 3,968 2,488 1,217 263North Dakota 117,816 3,899 2,352 1,241 306
Ohio 1,764,410 4,531 2,578 1,715 238Oklahoma a/ 578,580 3,293 2,061 1,041 190Oregon 472,394 4,864 2,833 1,864 167Pennsylvania a/ 1,655,279 5,737 3,617 1,910 211Rhode Island a/ 135,729 5,798 3,837 1,854 107
South Carolina a/ 616,177 3,769 2,221 1,206 342South Dakota a/ 127,329 3,511 2,162 1,136 213Tennessee a/ 819,660 3,405 2,200 967 238Texas a/ 3,328,514 3,835 2,322 1,267 246Utah 438,554 2,577 1,668 747 162
Vermont a/ 94,779 770 3,609 1,992 169Virginia 985,346 4,630 2,784 1,663 182Washington a/ 810,232 4,383 2,567 1,608 209West Virginia a/ 327,540 4,020 2,405 1,370 245Wisconsin 782,905 5,020 3,135 1,723 162Wyoming 97,172 5,239 3,098 1,958 184
Outlying AreasAmerican Samoa 12,258 1,781 735 734 313Guam a/ 26,493 4,002 1,752 2,064 187Northern Marianas 6,101 3,356 2,890 --- 466Puerto Rico 651,225 1,674 1,181 254 240Virgin Islands 21,193 6,043 3,264 2,470 308
a/ Instruction, support services and/or noninstruction expenditures were adjustedby NCES, affecting distribution ratios. See text for details.Data misSing or not available.
NOTE: Details may not add due to roundingSOURCE: U.S. Department of Education, National Center for Education Statistics, Common
Core of Data, "The National Public Education Financial Survey."
47 53

Table Al2.--Employee expenditures, including salaries and employee benefits for instruction and supportservices, for public elementary and secondary schools, by state: School year 1989-90
[In thousands of dollars)
Totalemployee
expendituresSalaries forinstruction
Salariesfor supportservices
Employeebenefits forinstruction
Employeebenefits
for supportservices
United States a/ 150,797,718 84,416,405 35,990,067 20,649,846 9,741,400
Alabama 1,781,656 1,078,264 369,738 248,552 85,102Alaska 651,117 312,779 219,347 66,259 52,733Arizona a/ 1,862,166 1,114,737 494,935 162,324 90,170Arkansas a/ 1,094,862 634,946 255,244 143,321 61,351California a/ 17,818,114 9,294,671 4,864,522 2,233,154 1,425,767
Colorado 1,998,279 1,156,996 512,918 223,500 104,866connecticut a/ 2,835,175 1,475,832 587,879 542,777 229,688Delaware a/ 415,755 231,468 86,645 70,840 26,803District of Columbia a/ 541,141 224,466 197,855 56,133 62,687Florida a/ 6,615,376 3,304,910 1,783,691 962,828 563,947
Georgia a/ 3,639,536 2,060,076 820,445 562,987 196,028Hawaii 532,368 341,344 128,987 44,894 17,144Idaho a/ 501,739 288,812 109,580 73,895 29,452Illinois a/ 6,423,284 3,727,371 1,562,380 732,534 400,999Indiana a/ 3,298,763 1,908,097 739,284 469,483 181,899
Iowa 1,632,755 931,493 416,316 195,420 89,525Kansas a/ 1,468,893 871,587 372,928 146,351 78,028Kentucky a/ 1,747,137 1,053,240 403,849 180,120 109,929Louisiana a/ 2,212,476 1,208,467 484,598 367,119 152,292Maine a/ 816,555 462,471 156,636 139,057 58,391
Maryland a/ 3,212,793 1,672,709 782,121 493,225 264,738Massachusetts a/ 3,440,520 2,136,969 809,555 254,709 239,286Michigan a/ 6,719,168 3,306,165 1,736,136 '.,065,363 611,504Minnesota a/ 2,774,558 1,655,296 575,283 408,930 135,049Mississippi a/ 1,169,342 749,983 245,181 131,170 43,008
Missouri 2,533,454 1,536,088 626,359 253,464 117,543Montana 490,787 288,172 104,565 71,698 26,353Nebraska a/ 937,982 573,704 203,017 117,985 43,275Nevada 607,507 329,763 158,172 78,630 40,941New Hampshire 605,246 379,475 125,078 62,686 38,008
New Jersey a/ 5,965,286 3,440,669 1,536,940 678,439 309,238New Mexico a/ 781,167 448,390 184,674 103,655 44,448New York 14,875,938 8,868,470 2,965,868 2,346,155 695,444North Carolina 3,552,637 2,058,645 814,793 491,669 187,530North Dakota 345,055 205,934 74,245 47,880 16,995
Ohio 6,365,243 3,323,985 1,656,333 885,707 499,219Oklahoma a/ 1,545,689 961,115 360,779 162,715 61,079Oregon 1,827,911 880,555 433,252 331,251 182,853Pennsylvania a/ 7,459,366 3,896,793 1,471,432 1,501,817 589,323Rhode Island a/ 646,976 361,824 131,129 110,844 43,178
South Carolina a/ 1,848,478 1,076,179 446,722 219,627 105,949South Dakota 331,290 199,540 77,093 39,079 15,579Tennessee a/ 2,158,608 1,296,814 427,705 325,477 108,612Texas a/ 10,039,961 6,248,727 2,496,088 868,063 427,083Utah 907,651 514,279 174,942 162,166 56,264
Vermont a/ 402,923 235,581 85,044 59,637 22,661Virginia 3,874,070 2,061,476 988,879 554,333 269,382Washington 2,865,405 1,496,970 737,723 426,470 204,242West Virginia a/ 1,083,024 559,852 253,076 186,011 84,085Wisconsin 3,137,010 1,753,640 637,020 534,988 211,362Wyoming 404,527 216,617 103,086 54,456 30,368
Outlying AreasAmerican Samoa 14,858 7,081 5,984 973 820Guam a/ 85,853 31,780 38,842 7,745 7,486Northern Marianas 14,398 12,019 --- 2,379 ---Puerto Rico 781,465 648,750 35,316 92,347 5,052Virgin Islands 102,099 56,549 29,565 10,499 5,487
a/ Salaries and/or employee benefits were adjusted by NCES, affecting total employee expenditures.See text for details.Data missing or not available.
NOTE: Details may not add to total due to rounding.SOURCE: U.S. Department of Education, National Center for Education Statistics, Common Core of
Data, "The National Public Education Financial Survey."
48 54

Table A13.--Facilities acquisition and debt service expenditures for public dementaryand secondary schools, by state: School year 1989-90
[In thousands of dollars)
State
Facilitiesacquisitionexpenditures
Debt service expenditures
Interest Redemptionon debt of principal
United States $13,899,316 $3,769,762 $4,845,784
Alabama 189,290 32,376 26,587Alaska 34,118 52,461 72,406Arizona 377,227 132,027 149,477Arkansas 76,462 33,255 40,547California a/ 1,656,062 148,176 189,547
Colorado 213,738 89,322 48,685Connecticut 14,473 48,772 68,277Delaware a/ 21,218 3,271 10,766District of Columbia b/ 40,625 2,727 3,783Florida 1,420,703 163,782 144,714
Georgia 505,048 68,622 39,711Hawaii 51,209 25,247 29,733Idaho 35,321 13,187 16,161Illinois 669,607 175,422 259,394Indiana 330,544 230,043 36,638
Iowa 99,500 19,120 27,463Kansas 140,592 34,224 30,283Kentucky 51,772 44,298 48,018Louisiana 146,998 109,580 83,818Maine 95,776 22,806 30,379
Maryland 327,089 35,068 50,074Massachusetts a/ 49,395 66,497 139,492Michigan 428,870 169,332 207,374Minnesota 408,577 67,459 85,695Mississippi 67,124 26,291 37,987
Missouri 257,741 69,647 73,136Montana 4.,456 11,516 13,293Nebraska 84,970 17,096 31,718Nevada 170,045 29,186 37,321New Hampshire a/ 97,462 21,187 27,103
New Jersey a/ 111,798 77,709 107,190New Mexico a/ 126,444 16,181New York 1,179,783 228,294 386,065North Carolina b/ 429,581 192,293 266,770North Dakota 19,962 6,344 8,442
Ohio 308,497 101,262 575,603Oklahoma a/ 200,096 10,423 13,333Oregon 97,993 34,642 35,394Pennsylvania 40,703 223,235 295,105Rhode Island 2,434 7,630 12,642
South Carolina 229,676 85,099 103,325South Dakota 26,208 4,883 5,018Tennessee a/ 158,840 8,958 21,720Texas 1,548,880 495,875 490,898Utah 85,598 34,675 47,044
Vermont 25,956 5,949 8,433Virginia 424,445 93,322 159,854Washington 525,167 125,852 101,778West Virginia 30,170 3,220 22,932Wisconsin 199,461 40,136 76,707Wyoming 19,612 11,781 18,393
Outlying AreasAmerican Samoa 265 0 0
Guam 0 0 0
Northern Marianas 0 0 0
Puerto Rico 2,409 0 0
Virgin Islands 3,998 0 0
a/ Facilities acquisition and/or debt service expenditures adjusted by NCES. See text.b/ Facilities acquisition and/or debt service expenditures imputed by NCES. See text.NOTE: Details may not add to total due to rounding.SOURCE: U.S. Department of Education, Nacional Center for Education Statistics,
Common Core of Data, "The National Public Education Financial Survey."
49 55

Table A14.--Total education, current, facilities acquisition, community services, direct cost and propertyexpendi..-..ures, by state: Fiscal year 1990
[In thousands of dollars)
State
Totaleducation
expendituresCurrent
expenditures
Facilitiesacquisitionexpenditures
Communityservices
expendituresDirect costexpenditures
Propertyexpenditures(excludingfacilities
acquisition)
United States $208,244,133 $187,557,791 $13,899,316 $875,163 $2,023,479 $3,888,384
Alabama a/ 2,537,422 2,275,233 189,290 1,841 25,283 45,775
Alaska 879,792 828,051 34,118 3,024 0 14,599
Arizona a/ 2,756,350 2,258,641 377,227 7,635 1,611 111,236
Arkansas 1,526,136 1,404,545 76,462 1,146 5,044 38,939
California a/ 24,005,132 21,485,782 1,656,062 90,138 304,620 468,530
Colorado a/ 2,731,202 2,451,831 213,738 3,733 0 61,900
Connecticut a/ 3,393,455 3,340,627 14,473 0 0 38,354
Delaware a/ 556,328 511,538 21,218 6,107 3,276 14,189
District of Columbia 686,279 632,459 40,625 0 5,876 7,319
Florida a/ 10,035,404 8,228,531 1,420,703 52,723 203,885 129,561
Georgia 5,186,312 4,414,016 505,048 94,894 44,447 127,906
Hawaii 803,522 700,012 51,209 21,158 4,974 26,169
Idaho 681,399 627,794 35,321 543 380 17,360
Illinois 9,056,679 8,125,493 669,607 45,708 18,854 197,018
Indiana 4,464,296 4,024,098 330,544 4,926 20,588 84,139
Iowa 2,156,160 2,004,742 99,500 1,313 2,491 48,114
Kansas a/ 2,060,063 1,848,302 140,592 149 1,816 69,203
Kentucky a/ 2,188,405 2,094,231 51,772 976 2,051 39,376
Louisiana 3,020,372 2,802,793 146,998 11,797 11,982 46,801
Maine a/ 1,176,411 1,048,195 95,776 592 10,114 21,734
Maryland 4,237,026 3,845,123 327,089 12,566 10,640 41,609
Massachusetts a/ 4,878,573 4,760,390 49,395 8,485 34,386 25,916
Michigan 8,923,750 8,025,521 428,870 80,813 217,479 170,968
Minnesota 4,089,091 3,474,398 408,577 94,916 37,668 73,532
Mississippi 1,582,737 1,472,710 67,124 1,617 2,716 38,571
Missouri 3,741,415 3,288,738 257,741 21,803 25,401 147,733
Montana 706,721 641,345 46,456 12 2,725 16,183
Nebraska a/ 1,349,490 1,233,431 84,970 814 823 29,452
Nevada 910,544 712,898 170,045 27 3,569 24,004
New Hampshire 933,983 821,671 97,462 695 1,850 12,306
New Jersey a/ 8,254,916 7,963,966 111,798 4,954 87,867 86,333
New Mexico a/ 1,155,618 1,020,151 126,444 3,172 0 5,851
New York 19,935,122 18,090,978 1,179,783 64,722 325,606 274,034
North Carolina a/ 4,811,773 4,288,474 429,501 19,694 80 73,945
North Dakota a/ 495,053 459,391 19,962 471 2,783 12,446
Ohio 8,683,573 7,994,379 308,497 26,465 92,021 262,211
Oklahoma a/ 2,120,721 1,905,339 200,096 1,632 51 13,604
Oregon 2,449,864 2,297,944 97,993 5,971 1,103 46,853Pennsylvania 9,912,123 9,496,788 40,703 57,769 181,350 135,513
Rhode Island a/ 809,238 786,969 2,434 340 4,502 14,993
South Carolina a/ 2,649,098 2,322,432 229,676 12,526 19,622 64,843
South Dakota 491,906 447,068 26,208 180 1,309 17,140
Tennessee a/ 3,154,474 2,790,808 158,840 8,935 145,328 50,562
Texas a/ 14,634,299 12,763,954 1,548,880 27,656 5,111 288,698
Utah 1,254,898 1,130,135 85,598 22,536 0 16,628
Vermont 585,341 546,901 25,956 696 1,054 10,733
Virginia 5,176,260 4,561,874 424,445 5,259 65,748 118,934
Washington a/ 4,223,117 3,551,252 525,167 13,138 53,408 80,151West Virginia a/ 1,394,328 1,316,747 30,170 5,094 12,267 30,050
Wisconsin a/ 4,251,234 3,929,920 199,461 23,044 18,775 80,035Wyoming 546,729 509,084 19,612 760 943 16,330
Outlying AreasAmerican Samoa 23,966 21,837 265 0 1,189 675
Guam 107,267 106,033 0 0 0 1,235Northern Marianas 20,927 20,476 0 0 0 451
Puerto Rico 1,105,647 1,090,383 2,409 0 7,502 5,353Virgin Islands 157,591 128,066 3,998 0 1,751 23,775
a/b/NOTE:SOURCE:
One or more expenditures have been adjusted by NCES, affecting national totals. See text for details.Facilities acquisition expenditures imputed by NCES, affecting national totals. See text for details.Details may not add to total due to rounding.U.S. Department of Education, National Center for Education Statistics, Common Core ofData, "The National Public Education Financial Survey."
5056

Appendix B
Survey Forms
51 57

U.S. DEPARTMENT OF EDUCATIONOYFICE OF THE ASSISTANT SECRETARY
FOR EDUCATIONAL RESEARCH AND IMPROVEMENTNATIONAL CENTER FOR EDUCATION STATISTICS
WASHINGTON, D.C. 20208-5651
COMMON CORE OF DATA
STATE NONFISCAL SURVEY OF PUBLICELEMENTARY AND SECONDARY EDUCATION
SCHOOL YEAR 1991-92
FORM APPROVEDO.M.B. No. 1850-0067EXP. DATE: 12/31/92
DUE DATE: MARCH 15, 1992
This report is authorized by law (20 U.S.C. 1221e-1). While you are notrequired to respond, your cooperation is needed to make the results ofthis survey comprehensive, accurate, and timely.
PLEASE complete each cell with a number, 0, N, or M
A01 NAME OF STATE EDUCATION AGENCY
A02 MAILING ADDRESS
A03 CITY
A04 STATE
A05 ZIP CODE
A06 TELEPHONE NUMBER
B: INSTRUCTIONAL STAFF 1991-92 FTE1990-91 FTE
301 PREKINDERGARTEN TEACHERS
302 KINDERGARTEN TEACHERS
B03 ELEMENTARY TEACHERS
B04 SECONDARY TEACHERS
BO5 TEACHERS OF UNGRADED CLASSES
306 TOTAL FTE TEACHERS
307 INSTRUCTIONAL AIDES
308 INSTRUCTIONAL COORDINATORSSUPERVISORS
C: SUPPORT SERVICES STAFF 1990-91 FTE 1991-92 FTE
CO1 ELEMENTARY GUIDANCE COUNSELORS
CO2 SECONDARY GUIDANCE COUNSELORS
CO3 TOTAL GUIDANCE
C04 LIBRARIANS/MEDIA SPECIALISTS
C05 LIBRARY/MEDIA SUPPORT STAFF
C06 LEA ADMINISTRATORS
C07 LEA ADMIN. SUPPORT STAFF
C08 SCHOOL ADMINISTRATORS
C09. SCHOOL ADMIN. SUPPORT STAFF
C10 STUDENT SUPPORT SERV. STAFF
Cll ALL OTHER SUPPORT SERV. STAFF
ED (NCES) FORM 2446 Previous editions of this form are obsolete
53
58

D: STUDENTS BY GRADE LEVEL1990-91
MEMBERSHIP1991-92
MEMBERSHIP
DO1 PREKINDERGARTEN
DO2 KINDERGARTEN
D03 GRADE 1
D04 GRADE 2
D05 GRADE 3
DO6 GRADE 4
DO7 GRADE 5
D08 GRADE 6
D09 GRADE 7
D10 GRADE 8
Dll GRADE 9
D12 GRADE 10
D13 GRADE 11
D14 GRADE 12
D15 UNGRADED
D16 TOTAL (Sum of lines D1-D15)
1989-90UNDIELICATED
COUNT
,
E: HIGH SCHOOL COMPLETERS1990-91
UNDUPLICATEDCOUNT
E01 REGULAR DIPLOMA
E02 OTHER DIPLOMA
E03 HIGH SCHOOL EwUIV. RECIPIENTS
E04 OTHER HIGH SCHOOL COMPLETERS
NOTE: Please review this survey form and be sure that each item is complete.
Person completing survey form
CCD Coordinator
Date
Telephone Number
Return Completed Form to:
U.S. Department of EducationNational Center for Education Statistics555 New Jersey Avenue, N.W.Washington, D.C. 20208-5651
If you have questions about this questionnaire,contact NCES staff at (202) 219-1618. Refer toCommon Core of Data, State Nonfiscal Survey.
ED (NCES) FORM 2446 Previous Editions of this form are obsolete
54 50
OMB Number 1850-0067Approval expires
December 31, 1992
U.S. DEPARTMENT OF EDUCATION
NATIONAL CENTER FOR EDUCATION STATISTICS
The National PublicEducation Financial Survey
Fiscal year 1991
NAME OF STATE NAME OF PERSON PREPARING THIS REPORT TELEPHONE NUMBER(Include area code, extension)
RETURN COMPLETED FORM TO:
U.S. Department of EducationNational Center for Education Statistics
555 New Jersey Avenue, N.W.Washington, D.C. 20208-5651
Attention: GSAB Fiscal Survey
CERTIFICATION: I hereby certify that to the best of my knowledge and belief, the data reported in sections I - XV below constitute a trueand full report of revenues, expenditures and student attendance during the regular school year and for summer school for the publicelementary and secondary schools under this jurisdiction for purposes of public law 97-35, as revised by P.L. 100-297.
TYPE OR PRINT NAME OF AUTHORIZED OFFICIAL I SIGNATURE OF AUTHORIZED OFFICIAL
TITLE.
55 60
L

PUBLIC ELEMENTARY AND SECONDARYEDUCATION REVENUES FROM ALL SOURCES
I. REVENUE FROM LOCAL SOURCES AMOUNT(omit cents)
a. Property Tax (1110)[Include only Ad Valorem taxes. Do not include penalties andinterest or dependent district's property taxes here.] $
b. Non-property Tax (1120-1190)[Include Sales and use taxes, income taxes, penalties andinterP:7t on taxes, and other taxes. Do not include dependentdistrict's non-property taxes here.] $
c. Other Local Government Units-Property Tax(1210 )[Include only Ad Valorem taxes for dependent district'sproperty taxes. Do not include penalties and interest here.] $
d. Other Local Government Units-Non-property Tax(1220-1290)[Include Sales and use taxes, income taxes, penalties andinterest on taxes, and other taxes. Include dependent district'snon-property taxes here.] $
e. Tuition From Individuals (1310)[Include tuition from individuals only.]
$
f. Tuition From Other LEA's Within The State (1320)[Include tuition from other LEA's within the State only.]
$
g. Transportation Fees From Individuals (1410)[Include transportation fees from individuals only.]
$
h. Transportation fees from other LEA's Within theState (1420)[Include transportation fees from other LEA's within the Stateonly.] $
i. Earnings on Investments (1500 - 1540)[Include interest on investments, dividends on investments,gains or losses on sale of investments, earnings on investmentin real property.]
$
]. Food Service (excluding federal reimbursements)(1600 - 1630)[Include daily sales for reimbursable programs, school lunchprograms, school breakfast programs, special milk programs,and non-reimbursable programs. Also include specialfunctions. Federal reimburcements should appear under 4500.] $
56 Ci

I. REVENUE FROM LOCAL SOURCESAMOUNT
omit cents
k. Student Activities (1700 - 1790)[Include admissions, bookstore sales, student organizationmembership dues & fees, student fees, and other studentactivity income.]
$
I. Other Revenue from Local Sources(1330-1340, 1430-1440, 1800, 1900 - 1990; not
1940)[Include tuition from other LEA's outside the State, and tuitionfrom other sources.Include transportation fees from other LEA's outside the State,and transportation fees from other sources.Include revenues from community service activities operatedby an LEA.Include revenue from the rental of real or personal propertyowned by the school, contributions and donations from privatesources, gains or losses on sale of fixed assets of proprietaryfunds, services provided other LEA's, other local governmentalunits, other funds, and miscellaneous.]
$
m. Textbook Revenues (1940)[Include textbook sales and rentals.] $
n. Summer School Revenue[Include tuition from students, other LEA's, fees and charges.] $
Local Sources of Revenue Subtotal (1000)[EXCLUDE tuition from other LEA's within the State (1320) andtransportation fees from other LEA's within the State (1420).Sum a-e, g, i-n.]
$
II. REVENUE FROM INTERMEDIATESOURCES (2000)[Include all revenues that can be used for any legal purposedesired by an ISA without restriction.Include revenues that must be used for a categorical orrestricted purpose.Include revenues to an ISA in lieu of taxes it would have had topay had its property or other tax base been subject to taxation.Include payments to pension fund by other governmentaljurisdiction for the benefit of the ISA, contributions ofequipment and supplies, and contributions to fixed assets.]
III. REVENUE FROM STATE SOURCES (3000)[Include all revenues that can be used for any legal purposedesired by an LEA without restriction.Include revenues that must be used for a categorical orspecific purpose.Include revenues to an LE4 in lieu of taxes it would have had topay had its property or other tax base been subject to taxation.Include payments to pension fund by other governmentaljurisdiction for the benefit of the LEA, contributions ofequipment and supplies, and contributions to fixed assets.]

IV. REVENUE FROM FEDERAL SOURCESAMOUNT
(omit cents)
a. Grants-in-Aid Direct from the FederalGovernment (4100, 4300)[Include all revenues that can be used for any legal purposedesired by an LEA without restriction.Include all direct revenue grants to the LEA which must beused for a categorical or specific purpose.] $
b. Grants-in-Aid from the Federal GovernmentThrough the State (4200, 4500)[Include all revenues that can be used for any legal purposedesired by an LEA without restriction.Include all revenues through the State as grants to the LEAwhich must be used for a categorical or specific purpose.Federal reimbursements for food service should appear here.] $
c. Grants-in-Aid from the Federal GovernmentThrough Other Intermediate Agencies (4700)[Include all revenue grants through an intermediate agency tothe LEA.] $
d. Other Revenue from Federal Sources (4800,4900)[Include revenues to an LEA in lieu of taxes it would have hadto pay had its property or other tax base been subject totaxation.Include payments made by the Federal Government for thebenefit of the LEA, contributions of equipment and supplies,and contributions to fixed assets, and foods donated by theFederal Government to the LEA.]
$
Federal Sources of Revenue Subtotal (4000)$
V. OTHER SOURCES OF REVENUE (5000)[Include bond principal and premiums. Accrued interestrealized from the sale of bonds should be included whenpermitted by State law.Include amounts available from the sale of school property orcompensation for the loss of fixed assets. Do not includeproprietary funds gain on sale of fixed assets here, but in 1900.]
Total Revenue from All Sources[Should agree with sum of subtotals 1,11,111, and W. DO NOTinclude other sources of revenue (5000)]
58
63

PUBLIC ELEMENTARY AND SECONDARYEDUCATION EXPENDITURES
I. INSTRUCTION (1000)1AMOUNT
(omit cents)
1. Salaries (100)[Include gross salary of those involved in instruction (seefootnote) while on the payroll of the LEA.]
$
2. Employee benefits (200)[Include amounts paid by the LEA in behalf of employees.Examples are group insurance, social security contributions,retirement contributions, tuition reimbursement,unem[ ioyment compensation, workmen's compensation, andsuch other employee benefits as unused sick leave.] .
$
3. Purchased i:9rvices (300-500; exclude 560)[Include the services of teachers or others who provideinstruction to students. Include computer-assistedinstructional (CAI) expenditures, travel for instructional staffand per diem expenses. Exclude tuition (560).]
$
4. Tuition (562, 563, 569)[Include tuition to other LEA's outside the State, tuition toprivate schools, and other tuition. Exclude (561).]
$
5. Tuition to Other LEA's Within the State (561)$
6. Supplies (600)[Include items that are consumed, worn out or deterioratedthrough use. Examples include classroom teaching supplies,audiovisual supplies, books and periodicals. Do not includeenergy expenditures.]
$
7. Property (700)[Include tangible property of a more or less permanent nature,other than land or buildings or improvements thereon.Examples are machinery, tools, trucks, cars, furniture andfurnishings.]
_
$
8. Other (800)[Include dues and fees paid by LEA's on behalf of instructionalstaff for membership in professional or other organizations.]
$
Instruction Expenditures Subtotal (1000)[DO NOT include tuition to other LEA's within the State (561) orProperty (700) in this subtotal.]
$
1 Include only regular and part-time teachers, teachers aides, homebound teachers, hospital-based teachers, substituteteachers and teachers on sabbatical leave. tf prorated amount and FTE are not available, also include teaching schoolnurses, teaching librarians, and teaching departmental chairpersons.
5964

II. SUPPORT SERVICES (2000)[See Instructions for a more detailed listingunder each Support Services function andobject.]
Students2
AMOUNT(omit cents)
InstructionalStaff3
GeneralAdministration4
1. Salaries (100)[Include gross salary while on the payroll ofthe LEA.]
Note: include salaries onlyfor staff in footnote 2
$
Note: include salaries onlyfor staff in footnote 3
$
Note: include salaries onlyfor staff in footnote 4
$
2. Employee benefits (200)[Include amounts paid by the LEA on behalfof employees. Examples are group in-surance, social security contributions,retirement contributions, tuition reimburse-ment, unemployment compensation,workmen's compensation, and such otheremployee benefits as unused sick leave.)
Note: include employeebenefits only for staff infootnote 2
$
Note: include employeebenefits only for staff infootnote 3
$
Note: include employeebenefits only for staff infootnote 4
$
3. Purchased services (300-500)[a. Include the services of medical doctors,social workers, psychologists.psychiatrists, audiologists and other con-sultants providing for student needs.b. Include expenditures for instuctionalstaff (see footnote below).c. Include the services of legal firms, elec-tion services and staff relations andnegotiations services.Travel for these staff is also included in a, bor c as appropriate.]
Note: only include 3a here
$
Note: only include 3b here Note: only include 3c here
4. Supplies (600)[Include amounts paid for items that areconsumed, worn out, or deterioratedthrough use. Examples are attendancesupplies, medical supplies, films, tapes,paper supplies, books and periodicals.]
5. Property (700)[Include expenditures for furniture and fix-tures, as well as desks, file cabinets,typewriters, duplicating machines, com-puters, audiovisual equipment and thelike.]
$
$ $ $
6. Other (800)[Include miscellaneous expenditures forgoods and services not mentioned above,such as staff membership fees.]
$ $ $
Support Servicessubtotal 2100
Expenditures Subtotal (2100-2300)[DO NOT include Property (700) in this sub-total. Sum 100-600, 800 for each column.] $
subtotal 2200
$
subtotal 2300
2 Include only staff in attendance and social work services, guidance, health, psychology, speech pathology and audiology.3 Incluoe only supervisors of instruction (not department chairmen), curriculum coordinators and inservice training staff, school
library staff, audiovisual staff, educational television staff and staff engaged in the development of computer-assistedinstruction.
4 Include only board of education stafi, board secretary/clerk staff, staff relations and negotiations staff, the superintendent's staff,and the superintendent.
6065

II. SUPPORT SERVICES (2000)[See Instructions for a more detailed listingunder each Support Services function andobject.]
SchoolAdministration5
(2400)
AMOUNT(omit cents)
Operations andMaintenance6
(2600)
StudentTransportation'
(2700)
1. Salaries (100)[include gross salary while on the payroll ofthe LEA.]
Note: include salaries onlyfor staff in footnote 5
$
Note: include salaries onlyfor staff in footnote 6
$
Note: include salaries onlyfor staff in footnote 7
$
2. Employee benefits (200)[Include amounts paid by the LEAon behalfof employees. Examples are group in-surance, social security contributions,retirement contributions, tuition reimburse-ment, unemployment compensation,workmen's compensation, and such otheremployee benefits as unused sick leave.)
Note: include employeebenefits only for staff infootnote 5
$
Note: include employeebenefits only for staff infootnote 6
$
Note: include employeebenefits only for staff infootnote 7
$
3. Purchased services (300-500)[a.) Include the services of consultants,school scheduling firms, and administra-tive staff inservice training.b.) Include the services of maintenancecompanies, security services, equipmentrepair companies and grounds upkeepconcerns.c.) Include the services of student busingcompanies and handicapped transporta-tion services.]
Note: only include 3a here
$
Note: only include 3b here Note: only include 3c here
$
4. Supplies (600)[Include amounts paid for items that areconsumed, worn out, or deterioratedthrough use. Examples are books and pe-riodicals, energy expenditures, servicesreceived from utility companies, food ex-penditures from school food serviceprograms, and routine auto and bus main-tenance.]
$
5. Property (700)[Include expenditures for furniture and fix-tves, as well as desks, file cabinets,computers, vehicles and machinery.]
6. Other (800)[Include miscellaneous expenditures forgoods and services not mentioned above,such as staff membership fees.) $ $ $
Support ServicesExpenditures Subtotal (2400-2700)[DO NOT include Property (700) in this sub-total. Sum 100-600, 800 for each column.)
subtotal 2400
$
subtotal 2600 subtotal 2700
5 Include only the staff of the office of the principal (including vice principals and other assistants), departmentchairpersons andthe principal.
6 Include only operations and maintenance supervisor, operation staff (heating, lighting, ventilation, repairing and replacingfacilities and equipment), care and upkeep of grounds and equipment staff, vehicle operations and maintenance staff (notstudent transportation staff) and security services staff.
7 Include only student transportation supervision staff, and staff for vehicle operation, monitoring of students, and vehiclemaintenance.
6166

II. SUPPORT SERVICES (2000)[See Instructions for a more detailed listingunder each Support Services function andobject.]
Other Supp2rtServices°
2500 2800 2900
AMOUNT(omit cents)
Totalby ob ect 100, 200 etc.
1. Salaries (100)[Include gross salary while on the payroll ofthe LEA.]
Note: include salaries only fcr staff infootnote 8
$ $
2. Employee benefits (200)[Include amounts paid by the LEA on behalfof employees. Examples are group in-surance, social security contributions,retirement contributions, tuition reimburse-ment, unemployment compensation,workmen's compensation, and such otheremployee benefits as unused sick leave.]
Note: include employee benefits onlyfor staff in footnote 8
$
_
$
3. Purchased services (300-500)[Include purchased business support ser-vices such as budgeting, payroll, financialaccounting, internal auditing, purchasing,warehousing, printing and duplicating; pur-chased central support services such asplanning, research, development, evalua-tion and data processing services. Traveltor these staff is also included here.]
_
$ $
4. Supplies (600)[Include amounts paid for items that areconsumed, worn out, or deterioratedthrough use. Examples are paper supplies,books and periodicals.] $ $
5. Property (700)[Include expenditures for furniture and fix-tures, as well as desks, file cabinets, andcomputers and other equipment.] $ $
6. Other (800; exclude 830)[Include miscellaneous expenditures forgoods and services not mentioned above,such as staff membership fees.]
$ $
Support ServicesExpenditures Subtotal[DO NOT include Property (700) in this sub-total. Sum 100-600, sop for each column.]
subtotal 2500, 2800, 2900
$
subtotal all support services (2100-2900)
$
8 Business support staff (2500) includes the chief business officer, the staff for supervisor of fiscal services, budgeting, payroll,financial accounting, internal auditing, purchasing, warehousing, printing and duplicating staff. Central support staff (2800)includes planning, research, development, evaluation staff, as well as data processing staff. Other support services (2900) isdesignated for any support staff not included in the "Other Support" category.
6762

Ill. Operation of Non-Instructional Services (3000)[Include food services operations and enterprise operations(LEA bookstore)] AMOUNT
(omit cents)
a. Food Services Operations (3100)
1. Include objects 100, 200, 300-500, 600 and 800. DO NOTinclude Property (700).
2. Property (700) [furniture, fixtures, equipment]
$
$
b. Enterprise Operations (3200)
1. Include objects 100, 200, 303-500, 600 and 800. DO NOTinclude Property (700).
2. Property (700) [furniture, fixtures, equipment]
$
$
Operation of Non-Instructional Subtotal (3000)[DO NOT include Community Services (3300) or any Property(700) in this subtotal. Sum a.1. and b.1.]
_
$
IV. Direct Program Support[lncti.ide expenditures by SEA or State made on behalf of LEAnot classified elsewhere.]
AMOUNT(omit cents)
a. Textbooks for Public School Children
1. Include objects 100, 200, 300-500, 600 and 800. DO NOTinclude Property (700).
2. Property (700) [furniture, fixtures, equipment]
$
$
b. Transportation for Public School Children
1. Include objects 100, 200, 300-500. 600 and 800. DO NOTinclude Property (700).
2. Property (700) [furniture, fixtures, equipment]
$
$
c. Employee Benefits for Public School Employees
1 Include objects 100, 200, 300-500, 600 and 800. DO NOTinclude Property (700).
2. Property (700) [furniture, fixtures, equipment]
$
$
63 ' LI

IV. Direct Program Support AMOUNT(omit cents)
d. Direct Program Support for Private SchoolStudents[Include expenditures by SEA or State made for/on behalf ofprivate school students.] $
e. Other Direct Program Support for PublicSchool Students (specify program name on dotted line)
$1. Include objects 100, 200, 300-500, 600 and 800. DO NOTinclude Property (700).
2. Property (700) [furniture, fixtures, equipment] $
Direct Support Subtotal[DO NOT include Direct Program Support for Private SchoolStudents (d) or any Property (700) in this subtotal. Sum a.1.,b.1., c.1. and e.1.] $
V. Current Expendit,.-es[Sum subtotals for I. Instruction (1000), II. Support Services(2000), Ill. Non-instruction (3000) (but agt Community Services)and IV. Direct Program Support (but 021 Private School StudentAid). DO NOT induce any Property (700) in this total.]
VI. Facilities Acquisition and Construction Services(4000) AMOUNT
(omit cents)
1. Non-Property Expenditures(For buildings built and alterations performed bythe LEA's own statf.)[Include salaries (100), employee benefits (200), purchasedprofessional and technical services (300), purchased propertyservices (400), other purchased services (500), supplies (600)and other (800) for buildings built and alterations performed bythe LEA's own staff.]
$
2. Property Expenditures[Include Land and Improvements (710), expenditures for thepurchase of land and the improvements thereon, andBuildings (720), expenditures for acquiring existing buildings.] $
6460

VI. Facilities Acquisition and Construction Services(4000) AMOUNT
(omit cents)
3. Equipment[Include expenditures for the initial and additional purchase ofequipment, and replacement items of equipment (730).]
VII. Other Uses (5000)[Include debt service payments (principal and interest).]
a. Debt Service (5100) [Include only long-term debtservice (obligations exceeding one year)].
1. Interest (830) [Include only long-term. Interest on currentloans (repayable within one year of receiving the obligation) ischarged to 2513].
2. Redemption of Principal (910)
$
$
Other Uses Subtotal $
VIII. Community Services (3300)[Include expenditures for child care and community swimmingpool.]
1. Include objects 100, 200, 300-500, 600 and 800. DO NOTinclude Property (700).
2. Property (700) [furniture, fixtures, equipment]
IX. Direct Cost Programs[Include here educational expenditures for other than publicpre-K through 12 programs not shown above.] AMOUNT
(omit cents)
a. Non Public School Programs (program #500)[Do not include property (object 700)]. $
b. Adult Education (program #600)[Do not include property (object 700)]. $
c. Community College (program #700)[Do not include property (object 700)).
$
d. Other (specify program name on dotted line)
$
6570

IX. Direct Cost Programs
AMOUNT
1. Property (700)[Include property from Non-Public School Programs (#500),Adult Education (#603), Community College (#700) andOther.]
$
Direct Cost Programs Subtotal[DO NOT include Property (700) in this subtotal.] $
X. Property (700)[Total from Property in Instruction (I), Support Services (II),Operation of Non-Instructional Services (III), Direct ProgramSupport (IV), Property Expenditures and Equipment (VI),Community Services (VIII) and Direct Cost Programs (IX).]
Xl. Total Expenditures for Education[Sum Current Expenditures (V), Non-Property Expenditures(VI), Community Services (VIII), Direct Cost Programs (IX) andProperty (X). DO NOT include Other Uses (OI).]
Xli. Exclusions from Current Expenditures forpurposes of P.L. 100-297
AMOUNT(omit cents)
(shaded areas need not be completed)
a. Tuition paid by individuals (1310)
obtained from p. 1 (1310)
b. Transportation fees paid by individuals (1410)
obtained from p. 1 (1410)
c. Chapter 1 (ESEA) expenditures[Note: DO NOT simply restate revenues received. This item tocontain expenditures.] $
d. Chapter 1 ESEA carryover expenditures $
e. Chapter 2 (ECIA) expenditures[Note: DO NOT simply restate revenues received. This item tocontain expenditures.] $
f. Chapter 2 ECIA carryover expenditures $
6671

AMOUNT(omit cents)
(shaded areas need not be completed)XII. Exclusions from Current Expenditures forpurposes of P.L 100-297
g. Food service revenues (1630)
h. Student activities revenues (1790)
i. Textbook revenues (1940)
j. Summer School Revenues. : .
'obtained tromp
Total Exclusions (sum a..j)(NCES will compute this)
XIII. Net current expenditure as defined byHawkins-Stafford Education Amendments of 1988(P.L. 100-297).[Subtract Total Exclusions (XII) from Current Expenditures (V)](NCES will compute this)
XIV. Average Daily Attendance (ADA)
1
Use either method A or B
A. ADA as defined by State Law[Append definition. statutory citation, length of school year andlength of school day]
B. ADA as defined by NCES[The aggregate days of attendance of a given school during agiven reporting period divided by the number of days insession during this period.]
XV. State Per Pupil Expenditure to be used, in part,in the calculation of Federal Entitlements forChapter 1 (ECIA), Impact Aid, Indian Education andother Federal programs.[Divide XIII by XIV.]
(NCES will compute this)
AMOUNT(omit cents)
67 72 BEST COPY AVPE: 1.2

9
ISBN 0-16-041876-3
8 1 61
0000
1 I I

United StatesDepartment of Education
Washington, D.C. 20208-5651
Official BusinessPenalty for Private Use, $300
maOF tP-4,P7171°' A
- $09/
Ntik".4
NCES 93-327
74
Postage and Fees PaidU.S. Department of Education
Permit 140. G-17
FOURTH CLASS BOOK RATE
61Liei uat si 1ii itibr