Embed Size (px)
Citation preview

DOCUMENT RESUME
ED 044 528 08 VT 012 073
AUTHOR Lecht, Leonard A.; And OthersTITLE Relating Manpower and Demographic Information to
Planning Vocational-Technical Education. FinalReport.
INSTITUTION National Planning Association, Washington, D.C.Center for Priority Analysis.
SPONS AGENCY Office of Education (DREW), Washington, D.C. Bureauof 'Research.
BUREAU NO BR-9-0487PUB DATE Sep 70GRANT OEG-0-180487-4496-085NOTE 97p.
EDRS PRICE EDRS Price ME-$0.50 HC-$4.95DESCRIPTORS Educational Objectives, *Educational Programs,
Employment Opportunities, Employment Projections,*Guidelines, Labor Market, Manpower Needs,Population Growth, Population Trends, *ProgramPlanning, School Demography, Student Needs,*Vocational Education
ABSTRACTThis plan, which uses current and projected manpower
and demographic information to define vocational education programs,objectives, and priorities, is designed to help the program plannercollect and combine information about his studentsr programs, and thelabor market. Planning steps are: (1) identify population served, (2)
relate current enrollment to population, (3) set enrollmentobjectives, (4) identify occupational patterns and derive jobopenings, (5) relate program completion to job openings, (6) setcompletion objectives, (7) translate completions to enrollments, (8)
match enrollment objectives by type of program and occupational area,and (9) estimate resources required for achieving each programobjective. Guidelines are provided for establishing an informationbase in terms of demographic projections (Steps 1-3), for developinglabor market information in order to estimate completion objectives(Steps 4-7) , ail4 for adjusting the two sets of objectives so thatprojected occupational, special education, and cooperative programsare approximately matched to the needs of the anticipated studentpopulation (Steps 8 and 9). Additional guidelines for coordinatingstate and local vocational education plans are appended. (SB)

00
FINAL REPCIETProject No. 94487
.4' Grant No . OEG -0-9-180'107- 4496 (085)
C)OU./
RELATING AUPOWER MID DEI:6GRAPHICINFORMATION TO PIAIMING VOCATIONAL-Ti.;CHIIICAL EUJCATION
Leonard A. Vs.chtJohn B. teeepl.e.Maria-Aurora n-sreees
. .
Center for Priority AnalysisNational Planning Association1250 Connecticut Avenue, Room 333
Washington, D.C. 20036
Sep'. caber, 1970
DIN,AMP.I.iT OFHEALTHIEIXICATION, MID VTELFARE
Office of Educationrxrcau of Research
C") V $ 04 PAIltt fIV111 Of Off/alf.110Vt11110.1I orto kat
Off Kt Of IWO. h011,4 00(1)Vt111 011$.1 Oft% 1liffOOLICE0tichUft1 at Oftert0 'VOW OP. 1111$04 010114$441T/0.1 04K *t MPG (11 1001111 OfV1 01 l'AVICAVI Vt$'10 00 1101 Vita
11 Hittirt Ott otitit OFT CI Oi f0O$61101110SiTIO4 0111000

I;
PIM REPORTProject No. 9-0487
Grant No. 0EG-0-9-1804874*S (085)
RELATIrG EMPOWER AND DEMOGRAPHICINFORMATION TO PUiNIING VOCATIONAL-TECHNICAL EDUCATION
Leonard A. LechtJohn B. TvepleMaria-Wove Paredes.
Center for Priority AnalysisNational Planning Association
Washington, D.C.
September, 1970
The report reported herein as performed pursuant to a grant with theOffice of Education, U.S. DepartLlent of Health, Education, and Welfare.Contractors undertaking such projects under Government sponsorship Lreeneourtged to express freely their professional judgment in the conductof the project. roints cf view or opinions stated do rot, there're,necessarily represent official Office of Education position or policy.
U.S DEPARTMT OFHEALTH, EDUCATION, AND WELFARE
Office c' EducationBureau of Research

BACKGROLKii) 1NFOIIIIATIO1
This publication in tha result of a continuing research /sregrauby t7le Center 2 Priority Analysis in the national Planning Associatioli.It results fro e3 previous work which releted National Coals and theircoats to manpmer and voceticnal educotion priorities in the 1970's.
These guidelines have been prepared to assist local vocationeleducation planners in utilizing nanpower and dcaographic infoneetion insetting enrollment objectives for their local pregrws. The guidepresents a tool to help the local adalnistrator anticipate future needsand ansign priorities to specific prograus in order to effectivelyallocate resources. A local plan in a result of these decisions, andthis guide should not be interpreted as a substitute foricat for a completedlocal plan. Rather it suggests how information describing present andanticipated future labor market and population trends can be related toeducational variables so that decisions about programs can be quantitativelyexpressed in terns of need.
There are nany variables in planning educational progrars besidmthose treated in this guide such as sex differences, dropout and studentperroroance leveler , They Mill also affect the types of decisions madeconcerning progreei priorities. Concentration in this domment on gen-eral manpower and derlographic measures reflects the concerns of theAmen dents of 10t: in relating pre/gran to job opportunity and to students.Once these basic types of inforelation have been structured. and related toedleational enrollnents and °eictions, the effect of these other varia-bles can be assessed. This guide therefore provides the basic fnarLeworkfor vocational education planning, a framework which will allow theadxJinistrator to assess the inplication of his program decisions, to seekalternative prograni nixes to achieve his objectives and to evaluate theeffects of chenges in resources on his output -- providing students withnarketable skills.
Since the developnent of a final planning guide will recluire feed-back from those responsible for vocational education planning, theOffice of Education and the authors would appreciate receiving theiremments.
The authors wish to thank their fellow-workers, Nancy Ilonrot andSheila O'Donnell who contribute valuable editorial and typing assistancein the preparation of this report.
RATIO1AL PIAM111:0 ASSOOYATIONS W.:ember , 1970

Chapter
1
2
TABLE OF CONTENTS
PART I
Page
Planning in Vocational 'Education 1
Steps in Using Demographic Information 6
to Development Enrollment Objectives
3 Using Manpower Information to Develop 17
Enrollment Objectives
4 Preparing a Long Range Plan 3U
PART II
5 Sources of Data for Planning 38
6 Methodology 54
APPENDICES
I Coordinating State and Locra Vocational 65
Education Plan
II Annotated Bibliography 91

PART
Chapter 1
PLAUNINC IN VOCATIONAL EDUCATION
The Vocational Education Amendments of 1968 require the educatorto develop, and update annually, a plan for a five-year period settingout his objectives in measurable terms and determining the resourcesneeded to achieve these objectives. The educator may set an objectiveof providing vocational skills to a larger number of students, or oftraining for different oecupations'or he may wish to serve more dis-advantaged and handicapped students than in the past. It is no easytask to achieve such objectives with a restricted budget a dynamicsociety in which a rapidly changing technology is shifting job oppor-tunities and a highly mobile population is constantly changing numbersand characteristics of students. The purpose of this handbook is toshow how manpower and demographic data can help the vocational educatorin this task.
Manpower data that show growing and diminishing occupationalcategories and demographic projections that show shirts in studentpopulations are critical to realistic planning. So are many otherfactors such as the teachers) facilities, and expected budgets. Whilethe focus of the handbook is on techniques for using manpower anddemographic data, it is first necessary to see how this informationrelates to the overall planning process.
The Uses and Lini.ts of Planning
Over the last few years planning has been oversold and made overlycomplicated. Many scholarly °apex's were written on strategic planningversus tactical planning versuslong-range planning--on PPPS--andon computer simulations. now ch)rta and cost-benefit formulas began tobe viewed as ends in themselves. What got lost in all of this wr.s thebasic notion that planning is a straightforward concept having verysimilar elements end implications whether used by en individual or alarge organization. People and institutions plan in order to helpthem decide how best to use limited resources in achieving their object-ives. ihtt plunning never substitutes for good judgement.
We shall develop these points in more detail as they are basic to
1

the approach used in this handbook. They involve a number of considerations)such as:
1. Planning is a straightforward concept.
2. Planning stresses the development of realistic) quantifiedobjectives; however, planning does not determine objectives,people do.
3. Planning is not a substitute foi good judgement.
4. information is a key element in planning.
5. Planning is useful to the educator insofar as it helps hiMdetermine how to use resources to exhieve more of hisobjectives.
The plan becomes a major asset mhen it helps the vocational educatorto lay out future steps (e.g.) courses to cut beck or add, teachertalents needed)) and to keep his priorities clear.
Demgi.:51phic and Manpower Aspects of Vocational Education Plannin4
The remainder of this handbook will discuss in detail how manpowerand demographic data can be used to establish realistic objectives. Oneof the major purposes of this document is to show the planner how tocollect and combine diverse information about his students) his programsand the labor market so he can plan future programs which better meetthe occupstional and educational needs of his students. These kinds ofinformation mill allow him to set realistic program objectives for futureyears.
Developing a longrange voeational education program sensitive tolabor market needs is, of necessity) a step-by-step process. However)just as in taking a trip, it's good to know where you ere Going beforeyou start. Prior to defining these planning steps, therefore) we suggestthat the vocational planner review the planning approach presented inFigure 1 on the following page. This figure illustrates one approach tocombining socio-cconomie) educational) And labor market data in developinga plan. Mile this approach is not indispensible) it illustrates therelation between different types of information normally requested in aplanning document.
2
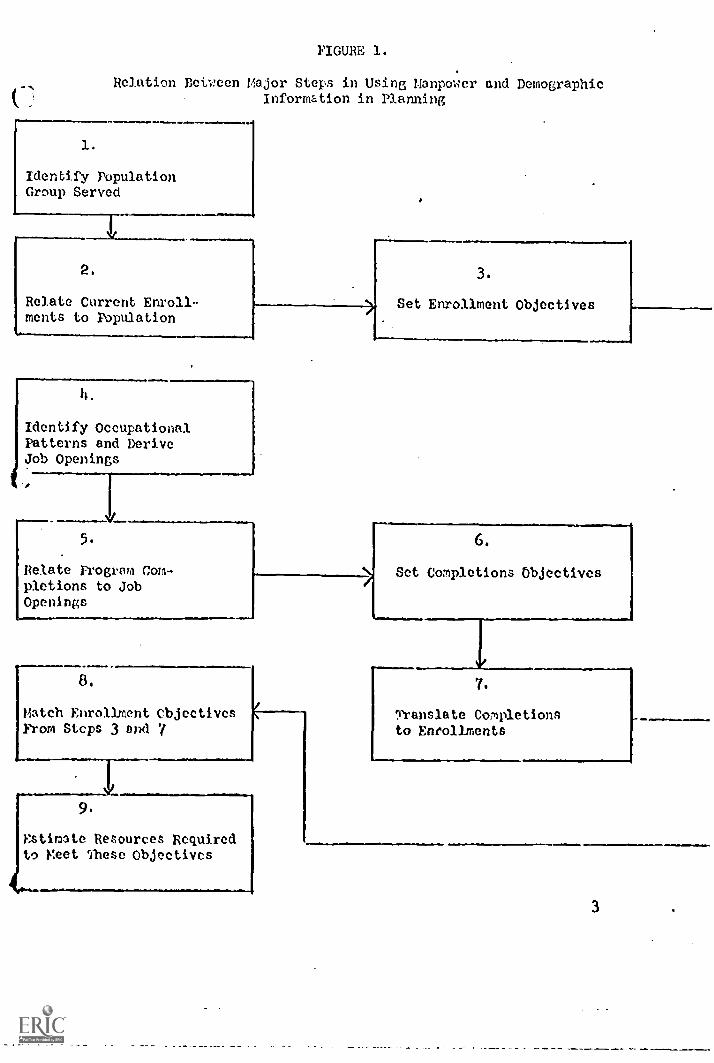
FIGURE 1.
Relation Between Major Steps in Using Manpower and DemographicInformation in Planning
1.
Identify PopulationGroup Served
2.
Relate Current Enroll-ments to Population
)t.
Identify OccupationalPatterns and DeriveJob Openings
5.
Relate Program Com-pletions to JobOpenings
8.
Match Enrollment ObjectivesFrom Steps 3 and 7
9.
Estimate Resources Requiredto Meet These Objectives
3.
Set Enrollment Objectives
6.
Set Completions Objectives
7.
Pranslate Completionsto Enrollments
3

The steps involved in using current and projected manpower and demo-
graphic information to define educational programs and priorities for the
future are listed below. The first three steps describe the use of demo-
graphic information in setting objectives in terms of enrollments by target
population and type of program.
Comparing socio-economic or demographic information vith.educationalenrollments will allow the administrator to set objectives definingthe number of different types of students he intends to serve in thefuture and the types of programs requirea. The planning steps are:
1. Identify population groups served by the educational system;
2. Relate current public vocational-technical program enrollmentsto school age population in terms of these socio-economicindicators;
3. Establish measurable objectives specifying the types ofvocational education programs (i.e., regular, co-op, workstudy, remedial, etc.) needed to accomodate specific numbersof students from various target populations.
Thl next four planning steps compare manpower information witheducational program completions and will allow the administrator to setobjectives in terms of the number he wishes to train for each occupation.
4. Identify occupations for which you now train and other occupa-tions for which you would like to train, and translate em-ployment data to annuol job openings for each of theseoccupations;
5. Compare the program completions from publ?e and private vocationaleducation with job openings;
6. Establish measurable objectives relating vocational educationcompletions to chenges in job openings over a five year period;
7. Translate completions objectives to the number of enrollmentsrequired to achieve sk desired number of completions.
Once steps one through seven are completed, the administrator candevelop enrollment projections which relate both type of program andoccupational arca. The total vocational education projections willidentify specific program requirements and should be employed to developforecasts of teachers, equipmentoind facilities required to support theeducational objectives. These summary projections constitute the body ofa long-range voCational education plan. Two major analytical stepsare required:
8. Hatch enrollment objectives by type of program and occupationalarca.
9. Estimate resources required for achieving each program objective.

Establishing an information base in terns of demographic projectionsis the first task in planning occupational education programs (Steps 1-3).The following chapter illustrates how to Organize this information to makeit a frpmevork fox planning, Chapter 3 deals specifically with thedevelopment of labor market information in order to estimate completionobjecJ6ivc (Steps h-7). Chapter 4 describes the process of adjustingthese tvo acts of objectives so that projected occupational, specialeducation ana cooperative programs are appropriately matched to the needsof the anticipated student population (Steps 8 and 9).
5

Chapter 2
STEPS IN USING DEi',10GRAPHIC INFORMATIONTO DEVELOP ENROLLMENT OBJECTIVES
One of the primary purposes of vocational education is to servenon-college-bound students needing occupational skills. The plannerwill therefore first want to obtain a thorough description of thepopulation by race, socio-economic characteristics, or physicalhandicap. Moreover, he must have some feel for the shifting focusof various subpopulations as this will affect the schools in hisdistrict.
Before describing the step-by-step analytic process for treat-ing demographic and educational Caa in developing enrollment objectives,it is worthwhile to review the kinds of information which will beemployed. (Chapter 5 discusses some of the common sources of thisinformation.)
Two major purposes for collecting information on students bytarget population is that different kinds Of student's need differenttypes of education programs and different kinds of teachers. Whilethere are many ways in which a population can be subdivided, data isnot always available. The educator should at least seek out dataon the white, non-white, disadvantaged and handicapped sectors ofthe school district's population and estimates of changes in the size ofthese sectors over the next five years. These breakdo'vms should beobtained for enrollments and for school-age population.
6

rm:ollments. The net enrollment in vocational education programs definesthe number of different students currently being served by vocationaleducation.
The educational administrator, however, will have to define whatconstitutes a vocational education enrollee. Certainly all students inoccupational programs in-post secondary and specialized secondary voca-tional schools will be included. However, in comprehensive high schoolsa student may take vocational courses in one grade and switch to a generalcourse the next or take a course without intending to be a regular voca-tional education student. A judgement is required which predicts howmany 9th through 11th grade students taking coursework in an occupationalarea with instructional program code are terminal occupational edu-
cation students.
When calculating vocational education enrollments the educator shouldobtain a breakdown by instructional program and target population. Withsuch information he will be able to relate enrollment information to thesize of the school age target populations in his community. (See Chapter 5).
Most of the raw data on enrollments is already available withinthe education agency. In cases where it is not, it can be collected onan annual or semi-annual basis without too much difficulty.
School Age Population. To assess the degree to which the vocational
school programs are serving the educational needs of the community, it
is necessary to determine the size of the school age population in the
area served by the local education agency and the characteristics of
this population in terms of racial groups, socio-economic characteristics,
and physical handicaps. Socio-economic data describing the current and
anticipated size of various target populations may-be difficult to obtain
in some cases.
Generally, information is available in the census for both metro-
politan areas and states. Usually a population breakdown for families
with annual incomes under $3,000 will be available. Information on
characteristics in the census, however, may refer to total population
ali' agh age-breakdowns are available in some cases.
In addition to benchmark data the educator needs to know the
current and projected population of the 15-19 year and 20 -211 year age groups
(standard census population categories). Chapter 5 discusses sources of
such data. While anticipated changes in the size of the school age
population of the city are the best yardstick for projecting future
school enrollments, it is possible to make a preliminary estimate of
enrollments from educAtional data alone. In cities with little in or no

out migration an estimate of the net potential total enrollment ingrades 8-12 -five years from now is the current total enrollment ingrades 3-7, disregarding dropouts or transfers to or from non-publicschools. The percentage of dropouts and net transfers out of secondaryschools should then be calculated and subtracted from the initialestimated projection.
Other DemograPhic Variables. There are several national trends inpopulation change which must be considered by the educator ininterpreting local population statistics and projections and estimating
their effect on future program enrollments. These include trends in
nonwhite population and employment, the effect of population migration,
the decentralization of cities and the role of increasing educational
attainment of labor force participants.
Nonwhite Population and Employment. While some interpret federal laws asforbidding the collection of social statistics on the basis of race, itis nonetheless known that population growth among nonwhites has beenrapid in the school age groups near to entering the labor force. VINm1960 to 1966, the nonwhite population under 14 grew by 16 pereent.VqIn the next twenty years, it is estimated that the growth rate in theschool age population among nonwhites will continue to be high, nearlydouble the comparable rate for whites.
Information on age and employment status by race is also available.Data show, for example, that in 1967 one out of every four nonwhite teen-agers was unemployed. The slum unemployment rate was even higher. Ifthe number of unemployed nonwhite teenagers persists at current levelsor increases in the next decade, further pressures will develop forspecial vocational training efforts to meet their needs.
Migration. Vocational education enrollment changes due to migrationmust be considered in planning in addition to those due to currentlocal population needs. Population growth based on the in-migration offamilies has different effects on education than population changesresulting from elementary and junior high school students reaching highschool age. A time lag in the demand for housing, education, andservices occurs in connection with population increase due to thebirth of children and aging of the population. In contrast, the migrationof entire families imposes immediate demands on the new communityfor work, education, housing and services. In the decade ahead, educa-tional systems of some cities, particularly in the southwest, will bechallenged by substantial increases in the need for their servicesresulting from migration. In these areas, the size of the future schoolage population and the special needs of these students mill be lesspredictable than in the pa.A. The administrator should discover if thepopulation projections he is employing are based solely on birthrates ortake into account. the estimated influence and effects of migration.
(1 ) Lecht, Leonard A., Manpower Needs for rational Goals in the 1970's,Frederick Praeger, Inc., New York, 1969, p. 43.
8

Educational Attainment.. As the supply of better-educated persons increases,their availability affects entrance requirements for jobs. The collegedegree has already replaced the high school diploma as an entry levelrequirement for many white collar occupations. Graduation from high school16 now a prerequisite for most jobs dealing with the public and is fre-quently required for apprenticeship in skilled trades. As educationalattainment rises generally, post-secondary occupational training willincreasingly become a minimum requirement for jobs requiring formalskill preparation. Rising educational attainment and increased emphasison educational credentials for a growing number of employment opportunitiessuggests increased emphasis on post-secondary occupational education.
Once the pleiner has selected sources of demographic informationand educational data, he is ready to begin the analysis which willprovide the administrator with information required to set enrollmentobjectives. Figure 2surnmarizes and relates the three planning stepsand associated analytical tasks.
FIGURE 2
STEPS RELATING DEMOGRAPHIC INFORMATION TO ENROLLMENT OBJECTIVE'3
PLANNING STEPS
1. Identify
PopulationGroups
2. Relate toCurrent En-rollments
3. Set Objectivesby PopulationGroup and TypeProgram
ANALYSIS TASK
Determine current andprojected changes in thesize of the school agedpopulation and various'sub-populations
Calculate Percent ofAge Group Served forEach Subpopulation
Project Number ofEnrollees bySubpopulation
Project camber of
Enrollees'by Typeof Program
TEXT TABLE
Table 1
Table 2
Table 3
Table 3A

1. Id:Ttifv ronulation Grouns to be Seved by Vocational Education
The first step is to find and record the estimated chances in total
city school age population end its pertinent subgroups. TW.s and sub-
sequent steps will be illustrated in working tables using actual data
from a U. S. city with a totalpopuletion of 1 million. Table 1
presents a comparison of this school age population with the total
population over a five-year period and indicates that while a majority
of the city's 1970 population Is white, nearly sixty percent or 46,o00
school aced youths arc nonwhite. Moreover, sixteen thousand youths come
from poor families. The challenge to the city's, vocational education
program arising from the need to serve the disadvantaged is obvious.
TABLE 1
CURRENT AfiD PROJECED SCHOOL AGED POPULATION Ill AN URBAN AREA(in 000's)
Current Population1970
ProjectedPopulations
1 75
Percentchange
1970-1975ow.*
TOTAL 929 928 -1
Age 20-24, white,nonwhite
7)4 76 +3
Secondary School AgeTotal ( 15-19 ) 81 83 + 2
White 35 30 -14
Nonwhite h6 53 +15
Disadvantaged 16 11 -12
Handicapped 6 7 417
The sire of the population age group 3.5-19 indicates the potential"market" or need for secondary education, partly vocational. Anincreased number of 15 to 19 year ctld by 1975 suggests a need for ex-panding secondary and post-secondary programs. A fifteen percent increasein the number of non-whites in the high school age population presentsvocational educators with special prdolems. In the first place, non-white students may have occupational aspirations not well related tocurrent program offerings or to the realities of the labor market. Theymay in some instances learn more quickly with non-white teachers, orapproach occupational education in a manner different from that ofwhites. Their higher average dropout and youth unemployment ratessuggest that vocai;;.onal education has room to improve as well as expandeducational services for this group. Similarly, projections of thenumbers oC handicapped persons and low-income families with dependentchildren may suggest a need for more tailoring of vocational programs tothe learning needs of these particular groups.
10

2. Relate Current Public Educatianal_Program Enronts tonhc(.dITe TopuTatias 737 These Tk761-6:Ir.o;lomic
Characteristics'
Once the administrator has described the current and projectedschool-age population to be served, he must develop relationshipsbetween this population and current educational enrollments. Theserelationships will show the proportion of the school age populationnow enrolled and indicate how this varies for various target groups.Such an analysis may indicate where improvements in the delivery ofeducational services can be made.
It is common to find that there are no current data available onnon-whites, the disadvantaged or the handicapped vocational enrollments.In this case, the planner must estimate this figure based on whateverinformation is available including his knowledge of the local schoolsystem. In our example, for instance, the planner has assumed thatnonwhites arc represented in vocational programs in the same proportionas in total secondary enrollments. He can therefore estimate thatthere were about 36,000 nonwhites enrolled in 1970 in secondaryeducation programs (see Table 2).
A comparison of enrollments in tile sample school system with thepopulation being served is presented in Table 2. Overall, aboutthree out of four secondary school-age chi].dron are enrolled in "iublic highschools. Of the total white school age population, only two out of three areenrolled in public schools -- a lower proportion than for nonwhites.The lower percentage reported for whites is probably due to the numbersof white children enrolled in parochial and other private schools.
However, while nearly three out of four high school age children areserved by current public educational programs, about 40% of the disabledwith limited activity are served and only one in four of the disadvantagedgroup, defined by economic level of family, are enrolled. The lowpercentage of these populations in school is probably due to higher drop-out rates for lower income students. In recognition of the fact thatthese groups are most in need of vocational skills, all students fromthese populations have been enrolled in vocational education programs.
In the current city example, dropout and follow-up data by targetpopulation was not available. This data should be collected. Measuresof vocational program effectiveness would then include not only percent

population by age group enrolled, but the percent of the enrolleescompleting training and the porcent entering the field for wilich trained.Even with the limited data reported, it is possible to suggest someobjectives in terms of vocational education enrollments.
Table 2
Target Population and SecondaryEnrollments .in en Urban Area in 1970
(numbers in thouSands)
Number Percent ofEnrolled in Population Percent of Popula-
Population Number in Public Secon- Component in tion in GainfulComponent City in dary Schools Public Secondary VocationalAged 15-12_ 1970 in 1970 Schools in 1970 Education
Total 81 58 72% 18%
White 35 22 63 17
Nonwhite 46 36 78 20
Disadvantaged(family incomeunder 0,000) 16
Handicapped(limitedactivity) 6 2.5
25 25
42 42
3. Set Enrollment Objectives by Population Group and Type of Program
To detail target enrollment projections, the administrator must firstestimate what proportion of total public seconaary enrollments will be invocational education. Enrollment projections for the five grades 8-12have been used as a base.
A two percent increase in the population aged 15-19 has been projectedfor the city from 1970 to 1975. If enrollments in public secondaryschools are the same percent of the total in this age group in 1975 asthey were in 1970, the city's secondary schools will be enrolling about60 thousand students in 1975.
12

Total secondary enrollment in public schools in 1970 was 58 thousand,and 15 thousand or 26% of these were in gainful occupational education
programs (21 thousard additional were in Consumer and Homemaking Education).
The high youth unemployment rate in this city suggests that a greaterproportion of the youth should learn marketable skills before leavingschool. If our objectives were to increase gainful occupational programenrollments from 26 to 30% of total secondary enrollment, enrollmentsin these programs would in2rease from 15,000 to 18,000, a 20% increasefrom 1970 to 1975. Consumer and homemaking education enrollments are pro-jected to increase only at the rate of overall secondary enrollments.Sec Table 3.
The proper way to set objectives is by establishing target enrollmentsfor cach type of program required to service the needs of student populaUons. Such objectives may be expressed either as a percent of totalvocational education enrollments in 1975 or as a percentage enrollmentincrease over the five-year period. Projected enrollments by selectedtype of program and student population characteristics are illustratedfor the sample city in Table 3A.
Some of these students will be full tine, others part time ( incooperaive, work study, or evening programs.) To make educationalprograms relevant to changes in the job market as well as target popula-tion needs, the planner may relate the part-time enrollments to theneeds of disadvantaged youth. For economic reasons alone these studentswould profit from, and probably need, work after age 16. An objectjveby 1975, therefore, is to have half of the disadvantaged youth in thecity enrolled in part-time vocational programs which allow them to beemployed. Total enrollments are therefore projected to include spacesfor 3,500 part-time students and the balance, between 14 and 15 thousand,for full-time students.
Projections of enrollments by target population (regardless of typeof program) should be related to changes in the target populations as aproportion of the total population. Enrollments for some groups mayincrease faster than others in the five year period if they are under-represented in current enrollments. The goal should be to give alltypes of students an egual opportunity to enroll and benefit fromappropriate vocational training. Nonwhites in the school aged populationwill grow at a somewhat faster rate than the 14% increase projected forthe total nonwhite population from 1970 to 1975. It is anticipated,with these objectives, that about two-thirds of public secondary schoolenrollmems will be non-white within five years. If nonwhites arerepresented in vocational education in the s. .e proportion as in totalsecondary enrollments, there will be about 12 thousand nonwhites enrolledin gainful secondary vocational technical education prograu3by 1975.
13

Table 3
Objectives for Vocational Education
Enrollments in an Urban area 1970-1975
(Numbers in Thousands)-
Total Secondary
Total Voc Ed Secondary
Actual Population 15-19
and Voc Ed Enrollment Figures
For 1970
Population
Enrollment
Projected Population
15-19 and Voc Ed
Enrollments for 1975
Population Enrollment
Rationale for Enrollment
Projection
for 1970-1975
81
81
58
36
83
83
60
37
Gainful Voc Ed
81
15
83
18
Thirty percent of secondary
enrollment in Voc. 3d.
Nhite
35
630
6Declining population but increasing
7.1roporton_in Voc. Ed.
Nonwhite
46
953
12
Au increase. from 62 to 675
enrollments in five years
Disadvantaged
16
414
7Increase frm 25 to 505 of
teenaP,e population in Voc Ed.
Handicapped
62.5
73.5
Increase from 42 to 505 of
population in Toe. E.

Target
Populations
Table 3 A
Enrollment Objectives by Type
of Program in an Urban Area, 1970-1975
Actual 1970
Projected 1975
Reg.
Co-op
Work
Spec. (4Tota1
Studv
Ed.
Reg.
Co-op
Work Spec. (-)Tot,'
Study Ed.
Total
13,400
1100
500
(3500)
15,000
14,500
2,500
1,000(7)000)
ld,000
White
5,500
500
---
( 500)
6,000
5,500
500
---- ( 500)
6,000
Nonwhite
7,900
600
500
(3000)
9,000
9,000
2,000
1,000 (6500)
12,000
Disadvantaged
3,000
500
500
(1000)
4,000
3,500
2,500
1,000 (3500)
7,000
handicapped
2,500
---
---
(2500)
2,500
3,500
----
---- (3500)
3,500
(1)
Students in Special Education programs are included in appropriate Regular, Co-op, or
Work Study enrollments.

This will amount to 23% of the nonwhite J.5 -19 year olds compared with 20% (of the white 15-19 year olds. As an alternative, we could have setenrollments at the same proportion of city school age population for bothwhites ard nonwhites.
Only an estimated 25% of disadvantaged youth J.5 -19 in 1970 were enroll-ed in secondary .'cation prograns compared with the enrollment of 72% ofthe total population in this age group. Given a high priority forserving disadvantaged youth, it is reasonable to project increasingenrollments of the disadvantaged secondary school age youth in vocationaleducation from 25% or 4,000 in 1970 to at least 50% or 7,000 of the estimat-ed 14 thousands of these disadvantaged youth by 1975. This representsa 75% increase in enrollments of disadvantaged youth over five years.
The neeMo serve the handicapped is also a priority in the 1968Amendments-)Only about 40% of the school age handicapped were re-portcd enrolled in vocational technical education programs in 1970.Since training facilities for the handicapped are often more expensivethan those for the disadvantaged, an objective might be to increase thisto 50% by 1975.
These first three steps summarize the gathering and treatMent ofdemographic information on the local level, in order to define specificvocational education objectives in terns of enrollments. To preparea five-year plan and from this to specify the following year's programrequires also that objectives in terms of program completions byoccupational area be projected to 1975 based on an analysis of labormarket information.
(2) The Vocational Education Amendments of 1968777t. 90-576)
16
Chapter 3
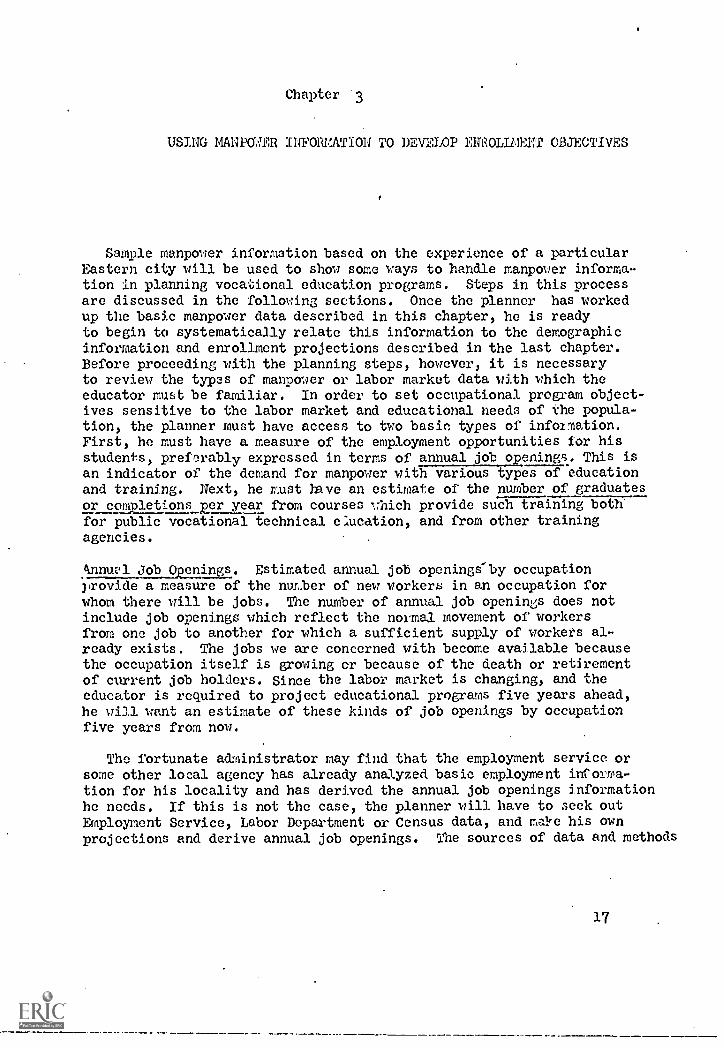
USING MANPOWER INFORMATION TO DEVELOP ENROLMENT OBJECTIVES
Sample manpower information based on the experience of a particularEastern city will be used to show some ways to handle manpower informa-tion in planning vocational education programs. Steps in this processare discussed in the following sections. Once the planner has workedup the basic manpower data described in this chapter, he is readyto begin to systematically relate this information to the demographicinformation and enrollment projections described in the last chapter.Before proceeding with the planning steps, however, it is necessaryto review the types of manpower or labor market data with which theeducator must be familiar. In order to set occupational program object-ives sensitive to the labor market and educational needs of the popula-tion, the planner must have access to two basic types of information.First, he must have a measure of the employment opportunities for hisstudents, preferably expressed in terms of annual job openings. This isan indicator of the demand for manpower with various types of educationand training. Next, he Lust have an estimate of the number of graduatesor completions per year from courses which provide such training both'for public vocational technical education, and from other trainingagencies.
tajnual221..02anings. Estimated annual job openings by occupationprovide a measure of the nuriaer of new workers in an occupation forwhom there till be jobs. The number of annual job openings does notinclude job openings which reflect the normal movement of workersfrom one job to another for which a sufficient supply of workers al-ready exists. The jobs we are concerned with become available becausethe occupation itself is growing or because of the death or retirementof current job holders. Since the labor market is changing, and theeducator is required to project educational programs five years ahead,he will want an estimate of these kinds of job openings by occupationfive years from now.
The fortunate administrator may find that the employment service orsome other local agency has already analyzed basic employment infoama-tion for his locality and has derived the annual job openings informationhe needs. If this is not the case, the planner will have to seek outEmployment Service, Labor Department or Census data, and malre his onprojections and derive annual job openings. The sources of data and methods
17

for making such projections are described in Chapters 5 and 6,
The local State Employment Service (SES) of. 'ice is the usual sourceof erployment information. Whi).e the U. S. Labor Department hasrequested these offices to provide vocational, education administratorswith the type of job openings information which they require, in manycases funds requied to develop this information on the :local level arenot available. In these cases, the local or state enp:loyment service1.tv only be able to provide intonation on unfilled enployment servicejob openings in the lochliiy by OE coded Instructional Program. Thiswill usually include an enumeration of:
1. Annual average number of E.S. job openings unfilled 30 daysor more by occupation;
2. The anticipated national employment growth in percent overthe next five years by occupation.
For vocational, education planning, the annual average number of E.S.job openings unfilled 30 days or more in an occupation may be used asan estimate of the annual job openings in that occupation.
An estimate of annual job openings in an occupation five years hencecan be made by multiplying current annual job openings in the occupationby the estimated national five-year rate of growth in employe.ent inthe occupation. if the rate of growth is 2O over the next five yearsand current annual job openings amounted to 203 the;'e vould be anestiinated 240 openings in 197. This method for estimating annual jobopenings will be relatively accurate only if:
-job openings are changing proportionally to employment; end
-the local employment picturenational trends.
If either of these two assumptionsadopt the following procedure:
is not significantly different from
is not appropriate, the planner should
If the plarner can obtain state projections of demand by occupation,he can estimate the future eemand for the occupation in his locality byapplying the percent of stete employment in the occupation in his arcafrul U. S. decennial Census figrc. For example, if Censy; data rhothat 15,, of total aLate cmplorcent for carpenters occurs in his locality,he can tsstue that 1%; of the State's projected annual job openings forcarpenters will occur in hir area. When recent census data are notavailable, he should ePlculate the proportion of the total state labor,narhet vhich is represented by his locality. This cPn be estimated as
18

the proportion of working age populction (usually 18 to 6)4) in thestate residing in the local area. For exmple, if his school
sy.ten is located in a metropolitan area which contains 25c4 of thestate's labor force aged 18-64, he can assume that, on the average,25'4 or statewide employment occurs in his area. One-quarter of thestate's annual job openings for each occupation would therefore representon estimate of the job openings against which completions from his vocat-ional education programs should be compared. The planner must adjust thesefigures for the local job market based on known differences between thestate and local urban employment. For example, the urban area willcontain fewer than 254 of the openings in agricultural occupations andwill probably have more than one quarter of office occupations employ-ment. Even if the statewide figures are not reduced, this techniquewill fairly define the statewide employment opportunities for com-pletions from the school system, and thus allows for student mobility.
To identify job and career opportunities for the residents of anarea, the educational planner must consider what "market" he is trainingfor. Does he want to focus his programs on local demand, state demand,ol national manpower needs? And what is local? To answer this questionhe should know where, typically his graduatin,; students pursue and findemployment. A good beginning will be to use the manpower projection ofthe entire metropolitan area. There are a number of reasons forusing manpower data from the metropolitan area rather than the city, town,or suburb itself. Relating training needs to job opportunities logicallybegins where the majority of the job opportunities are going to befor the people of the community, and metropolitan area datamay inlicate areas of expand ng job opportunity not reflected in thelocal labor market. So mobile is our society today,however, that projectedmanpower requirements of the state and nation nay also be used as a largercontext for vocational program decisions, but the opportunities theysuggest for many will be more remote psychologically as well as geo-graphically. The primary emphasis in the city plan, by and large, mustremain the employment demand which is reasonably close to hone, althoughthe decision will depend on local circumstances. In the case of
suburban school district, Standard Eetropolitan Statistical Areaemployment figures moy represent a relevant employment market forstudents - even if part of the metropolitan area is in another state.For example, a vocaVonal school in Teaneck, New Jersey, may findprojections for the Kew York standard metropolitan area more relevantfor planning than data for the state of Vow Jersey. A city in centralNew Jersey, hovever, may assume that a majority of its graduates findemployment opportunity either locally or randomly throughout the state.If no local projections are available, statewide employment data maybe rost appropriate to use. A rapidly growing city in the Southwest mayplace a higher priority on local projection than national figures,while a city in a state like West Virginia,wMch is losing populationbecause of a lack of employment opportunities, may prefer to use national
19
employment pojectionl or thone of a neighboring state.
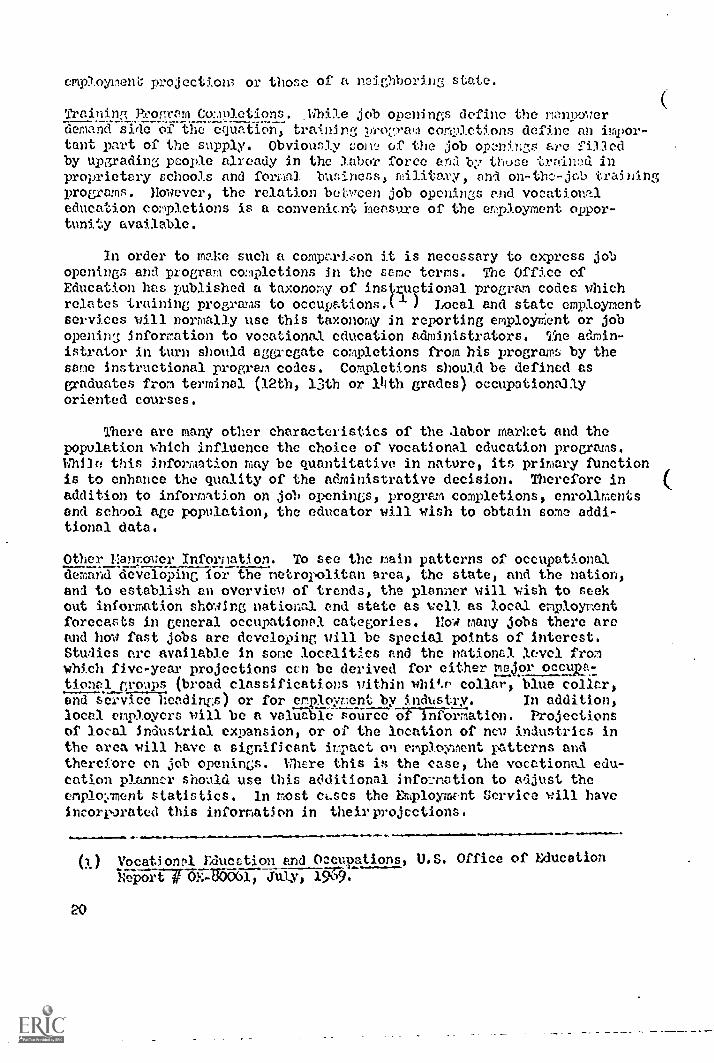
Training Pronrem Comnletions. While job openings define the menpowerdemand side of the equation, training nronram connletions define an impor-tant part of the supply. Obviously come of the job openings are filledby upgrading people already in the labor force end by thuse rnined inproprietary schools and fortia3 buninens, rpilitary, and on-the-job trainingprograms. However, the relation between job openings and vocationaleducation completions is a convenic.nt iaeesure of the employment oppor-tunity available.
In order to make such a comparison it is necessary to express jobopenings and program completions in the serve terms. The Office ofEducation has published a taxonomy of insinuctional program codes vhichrelates training programs to occupations. ( ) Local and state employmentservices will normally use this taxonomy in reporting employMent or jobopening information to vocational education administrators. The admin-istrator in turn should aggregate completions from his programs by thesane instructional program codes. Completions should be defined asgraduates from terminal (12th, 13th or linth grades) occupationallyoriented courses.
There are many other characteristics of the dabor market and thepopulation which influence the choice of vocational education programs.While this information may be quantitative in nature, its primary functionis to enhance the quality of the administrative decision. Therefore inaddition to information on job openings, program completions, enrollmentsand school age population, the educator will wish to obtain some addi-tional data.
Other Hanrovey Information. To see the rain patterns of occupationaldemand developing for the metropolitan area, the state, and the nation,and to establish an overview of trends, the planner will wish to seekout information showing national and state as veil as local employnentforecasts in general occupational categories. How many jobs there areand hov fast jobs arc developing rill be special points of interest.Studies arc available in some locelit!es and the national level fromwhich five-year projections ctn be derived for either major occun:tionel groups (broad classifications within whi4.e collar, blue collar,end service headings) or for employment by industry. In addition,local employers will be a valiale source of information. Projectionsof local industrial expansion, or of the location of ncv industries inthe area will have a significant impact on employment patterns andtherefore on job openings. Where this is the case, the vocational edu-cation planner should use this additional infoenntion to adjust theemployment statistics. In most cases the Employmtnt Service will haveincorporated this information in theirprojections.
111........
(1) vocational Education and Occupations, U.S. Office of Education
Ire-port # 0E-BW61, July, l9o9.
20

rot all jobs &re equal candidates for formal training so there areseveral characteristics of the jobs themselves which the educationalplanner must investigate. These include quantitative assessments ofwage rates, seasonality, and pro-lotion possibilities as well as a quali-tative evaluation of the status of the job in the community, the jobsatisfaction of the employees, and the students' perception of thedesirability of employment in the occupation. Other things being equal,the job which carries a higher entering wage, better opportunities forpromotion and seems highly desirable to students deserves priority. Ina local area this may not be the occupation showing the largest numberof job openings, but fast growing occupations with less overall employmentmay be good candidates for training. rev occupations developing out ofexpanding technology often offer considerable career opportunities evenwhen the current employment market is small.
Finally, the educator must consider other routes to job entrybesides formal secondary or post - 'secondary vocational training. Forsome jobs, regardless of the growth and magnitude of job openings, theavailability of on-the-job training, or the lack of a requirement forpre-occupational training may argue against extensive vocational instruc-tional programs. In other cases, the basic skill requirement for jobentry nay be easily obtained by all students in the general educationprogram. In still other occupations, job training may be provided byspecial federel programs such as MDTA or the Job Corps, union apprentice-ship or proprietary schools. In these cases, the educational plannermust determine whether the demand for workers is significantly greaterthan the supply from these other training programs and vhether theseprograms are projected to expend.
Four steps are involved in interpreting and translating manpowerinformation into objectives in terms of enrollments by instructionalprogram. Figure 3 summarizes these steps and indicates the analytictasks involved and the table where resuJ.ts are recorded. Thesteps to be taken in using manpower or labor market information
are discursed below.
FiGure 3. STF,r3 Il USIPG ENIPCONR INFORMATIONTO DEVELOP ENROLLMENT OBJECTIVES
Planning Steps Analysis Task
4. Identify Occupational Estimate Job Openings forPatterns Occupations Relevant to
Vocational Education
Text Table
Ir
5. Relate Program Co plc- Derive Completions es a 5
tions to Job Openings Percent of Openings
21

Planninr7 Steps
. 6. Set Completions Objec-tives by InstructionalYrogram
7. Translate Completionsto Enrollments
Analysis Task Text Table
Project Completions by 6Instructional P.rogranTaking Account of LaborMarket Changes
Estimate Enrollment in1974-1975 Needed to Achievethe Desired Level of Com-pletions
7
4. Identik_Occuoational Patterns and Define EnIploymant reeds in Termsof Annual. Job OLeninrrs.
To relate labor rLarket changes to vocational-technical education,it is necessary to express employment demand in specific job categorieswhich can be related to instructional programs. Such information willdefine for the planner the size of the labor market in occupations wherevocational-technical education programs are appropriate sources ofpreparation.
In Table 4 job openings for 1970 and 1975 have been listed forrepresentative occupations in our sample netropolitan area. The percen-tage change over the 1970-1975 period is also given. The occupationslisted include five white collar, five blue collar, end one serviceoccupation. They illustrate a variety of occupations in the city forwhich vocational training is often conducted in public schools, sometimesit the secondary and occasionally at the post-secondary level.
The selected occupations listed as examples in Table 4 illustratethe variety of developTents in job openings which must be evaluatedin planning for future occupational progroms. Salesmen and secretaries,stcllornphersland typists, are rolatively high volume jobs in theexample for the 1970-1975 period, but only the latter category is groWingin opportunity. Growth jobs in the technical and service categoriesfor the some period include nedical and dental technicians, draftsmen,rotor vehicle mechanics and practical rurses. With the exception ofmotor vehicle mechanics, the craftsmen and operatives occupationsshow h projected decline in annual job openings during this period.The planner will probably not wish to expand enrollments in occupationaltraining programs in the face of such declining job markets. Andcomrersely, expanding job opportunities for medical and dentaltechnicians tend rotor vehicle mechanics suggest that instructional prog-ms vight be expanded in these fields. Selecting specific instructional
programs to exjancl requires a comparison of public vocational program
22

OE ProgramCode
Table 4
Samp3e Average Annual. Job Openings
in MAropolitan. Area
Occupation
Current Job Projected Job Percent
Openings Openings Change
1970 1975 1970-1975
PROFESSIONAL TECIiiIICAL, &KINDRED07.0103 Technicians, Medical & Dental 266 429 61%17.1303 Draftsmen 66 93 41
CLERICAL & KINDRED14.0700 Sccretnrles, Stenographers, Typists 3629 4,242 1714.0399 Office Machine Operators 570 603 6
SALES VORKFRS6.0117 Salesmen 2992 3,216 7
CRAFTS/Mt FORE AND KINDRED17.1001 Carpenters 208 204 - 2
17.2302 Machinists 83 67 - 19
17.0302 Motor Vehicle Mechanics 217 325 50
OWRLTIVES & MIMED17.2306 ----Wideis & Flamecutters 163 143 - 917.3399 Ctewers & Stitcher& 204 114 - 44
SERVICE WO3KERS17.0205 Nurse, Practical 309 367 19
23

completions with this job opening information ant other sources oftrained workers.
5. Relate Program Co: nletions from Public Vocational and Non-ntblicEducation Progra,,ts with Present Job Openings.
Decisions to change vocational program priorities depend not only onwhat is happening in the job market, but what portion of the trainedlabor supply is being provided by vocational-technical education.
Before decisions can be made concerning enrollment objectives inpublic vocational-technical programs, it is necessary to compare theannual nurher of new workers needed with the number of such workerssupplied frot all sources. An expanding job market for Practical latses,for example, may not be a suitable program for public secondary educationif local hospitals are planning to greatly expand their 1,111 trainingprograms. Similarly, occupational opportunities for carpenters whichmay expand in the area due to anticipated federal funding for suchpurposes as Kodel Cities pay cause a rapid increase in the size ofapprenticeship programs, thus increasing the need for vocationaleducation programs as a source of preapprenticeship preparation.
While public vocational program completions can be estimated frorascheol records, there is no single source of information on non-publicvocational or occupational training programs. Information on currentand future completions from private trade schools, speci,21 federalprograms and other sources can often be obtained throug;i direct contactwith private and business schools, unions, trade associations, or theChmber of Commerce.
A worksheet sumarizing chengcs in job openings, and relatingthese to current public and private vocational education completions isshown in Table 5. The planner will probably not use such a table inhis forl.isl plan, but the information it contains is essential forarriving at decisions concerning measurable objectives for occupationaleducation programs.
In our example the fastest growing job opportunities are in thefields with the least tr_nount of fcrmal training being provided. Com-pletions aro less then 5O of job openings for all occupations showinga positive growth in job oranings. In contrast, the two occupationswhere job opportunity is anticipated to decline ineolve public and privatetraining programs now producing 80:, or vore of the skilled personnelrequired tinnually. This vide variation between potential changes injob openings and availability of formal preparation for these jobssuggests new priorities are required in vocational education prOz,r0=to increase outputs from proigras in growth octupations, and to
211

OEProgram
Code
07.0303
14.0700
14.0)17
17.1001
'.0302
17.3399
17.0205
Table 5
Comparison of Annual JobOpenings with Coerces of Training in Metropolitan
Area in 1970,
Ocalpation
Technicians, Medical andDental
Secretaries, Stenographersand Typists
Sales Workers
Carpenters
Motor Vehicle Mechanics
Sewers and Stitchers
Purses, Practical
1970Annual Job
Openina_
.266
3,629
2,992
208
217
204
309
1970 Completionsfrom Vocational
Education,Public Other(a)
25 16
800 249
220
54 170
90
113 50
92 89
Estimated PercentAll Completions
of 1970 JobOpenings
15%
29
108
41
80
58
(a) Estimated fro7.1 sampling of training in the mctropnlitan area.

decrease training in shill areas where job opportunities are declining.This leads to the next step in the planning; process, setting educationalobjectives.
6. SeUpecific Vocational-technical Education CovletionObjectives
The above steps have laid out the basic manpower and vocationaleducational conpletion information the planner must develop for hislong-range educational plan. niS next task is to relate informationconcerning the present directions of the labor market and vocationaleducation in order to develop specific educational objectives in termsof co.apletions for vocational education programs in 1975. vle shall
first discuss these items of information and then describe how theyare used in developing objectives. Labor market projections and educa-tional completions from the public and private sector (illustratedin the preious two tables) give us the basic data required to establishoutput projections for vocational-technical programs.
In order to allocate resources, objectives must be stated asmeasurable targets to be achieved at a given future date. Five yearsis the target planning period under the Vocational Education Amendmentsof 1968, and therefore is the target date used in our examples. The
terns used to define objectives should be quantitative educationindicators such as number of completions by instructional program.
Educational completion objectives are illustrated in Table 6. Formedical and dental technicians, ye have projected increased vocationalcompletions from 9% of annual job openings in 1970 to about 20::, ofopenings in 1975. This is because the annaal openings for these jobsarc predicted to increase by over 60:, during this prio:1, yet verylittle training is available indicating that this eccupation willprovide growing employment opportunities for vocational s tudents.
)or secretaries, stenographers, sand typists and for sales workers,no change in vocational education completions are projected. Thereason for not expending mks worker instructional proertms is thefeet that training is not as essential for employment ts it is inother occupations. And though secretarial job openings will increaseby 17:,, it is felt this increase will be taken up by the projectedexpansion of private school enrollments in such programs. Also, aseducational requirements increase, an expanding number of junior andfour year college libral eras graivates with typing and stenographicskills are expni.:-d to be employed in these vositic,ns.
In two of our sample occupations, one (rotor vehicle mec) anics) expanding
tnd no (carpenters) experiencing no change, the Atnned proportion ofcompletions to job or:mines will stay the tame. This reens that withemploymen!, expanding formotor vehicle neck nits, completicns are projected to
increese fron 90 to about 135. ro change in completions is projected
26

OE
Pro
gram
Ca.
le
07.0
103
14.0700
14.0117
17.1001
17.3399
^.ab
lea0
81N
e.
Zetablishtng Objectives for Ptblic Vc
:ional Education Program. CaTpletionz
Act
=2-
Job Openings
Projected. job 0'ocnings and
and Completions for 1970
Cempletions for 1975
Jobf,
Projected
Job
Target
Openiur:c-'
Commletiens`''
2222im!L
Complctionz
25
429
80
0ecumation
Technicians, Medical
266
and Demtal
Secretaries,
Stene7rashers
and Typist=
3,62
980
0
Sales Worker:
2,99
222
0
Motor Vehicle Mechanic:.
217
0 90
Carpenters
208
54
Sewers and Ctitehers,
lemmufacturing
204
1 1
3
17.0
205
21=
e, P
ract
ical
4,242
3,216
325
800
Rationale for
Target Projection
Increase percent ccm-
pletiorm frcra 9% to
205 of job openint7n7
(very little private
training)
Maintain cane level of
completions (other
training)
220
Maintain sa.me level of
completions (train i :,7,
not essential for job)
135
Maintain ceme Propor-
tion of ce=pletions to
job opcningc.
204
54
Maintain came propor-
tion of ccrmletions to
job opening.;
214
50Reduce cc,1ctionc
proportional to rcduc-
tion in job omportuni-
ic.;
309
92
367
1R0
mz
(1)
From
Table
4.(2
)Fr
Tab
le 5
.
Increase Proportion of
ceppletions to job
openings frca 30% to
505 (training essential
for ammloyment)

for carpenters. In the case of sewers anal stitchers, a notable reductionin job openings will be reflected in a 50:, reduction in completions from le
public Weational-eaucation progrems. Finally, the decreasing availabilityof LPN training in area hospitals suggests that the Vocational. Educationsysi;:m increase 1,1311 trainin3 at a rate faster than that of annual jobopenings. Thus, while annual openings will increase by 20'i, to about370 by 1975, completions from the public schools are targeted to doublein the same period and will reach 50::, of the annual job openings by
1975.
7. Translate Completions to Enrollments
In order to arrive at a final, set of objectives it will be necessaryto adjust completions objectives to the realities of studeni; character-istics. If ve translate completions objectives into enrollments byinstructional, program required to produce those completions, me cancompare these directly to the enrollment objectives derived from demo-graphic data. Table 7 presents enrollments required for the completionsobjectives previously derived.
For some programs listed in Table 7, total enrollments exceedcompletions by a factor of four or five because of the anticipateddrop-out rate and because the program is spread over two or threeyears and completions in any one year will amount to only one halfor one third or enrollments. In others, such as practical nurses theprogram is made up of one course and most or all of the enrolleescomplete the program in a your and only the dropout rate need beCOlf3idered.
28

Table 7
EnrollrAents Required to Meet Cc Ipletions Objectives for 1975
OBPro3ral.Coic
07.0103
14.0700
14.0117
17.0302
17.1001
17.3399
Occupation
Technicians,Medical andDental
Secretaries,Stenographersand Typists
Sales Vorkers
Motor Vehicle Mechanics
Carpenters
Severs andStitchers,Manufacturing
CeATletionObjective
1975
80
Boo
220
135
50
EnrollmentReqvired
1915
150
1+, 5o0
880
735
140
160
17.0205 Nurses; Practical 180 200
29

Chapter 4
PREPARMG A IONO HAUGE PIAU
The treatment of manpower end sccio-economie data in order to deriveeducational objectives has been presented in a series of working tableswhich the planner may use as a working format. Reporting this informa-tion in a formal document or plan requires the compilation of summarytables of objectives, enrollments, completions and resources. Whilestate planning guidelines are undergoing change, and state requirementsfor local vocational education plans vary, at least three kinds ofsumaries will usually be requested for presenting the results of theplanning process.
First, the plan will include a statement of the local educationagefley's goals and objectives. The derivation of this information wasillustrated and discussed in Steps 3 and 7, and shown in Tables 3A and 7.Second, there should be a sumnary of projected enrollments by OE instruc-tional program to meet the objectives; this is discussed in Step 8, andthird, the plan will normally include projected changes in teachers,faciliieZcs and equivrient to support the objectives, which is discussedin Step 9.
8. Match Projected Enrollment Objectives Derived from Manpower
and Demo ranhic Data.
We have illustrated in previous steps how specific educationalobjectives can be derived. These objectives may be sumnarized for com-pletions and enrollments as follows:
In order to make the city's secondary vocational education programsrelevant to the educational needs of taN:get populations, the followingobjectives were defined (see Tab3e 3A):
a. A 20% increase in enrollments is projected for all secondaryvocational education.
b. Enrollments of students in part-time secondary programs willbe increased by 120%.
c. Enrollments of. students from disadvantaged families (ineomesunder $3,000) will be increased by 75%.
d. Enrollments of nonwhites,is projected to increase by 1/3,/2
and of handicawed by 110r;J.

Objectives in terms of completions, based on labor market changes,ehould be sw=arixed in an early part of the plan. In order to vake thecity's vocational education programs more responsive to the local labormarket in this example, the following canpletion objectives were defined(see Table 7):
G. Completions in programs in the health occupations will beexpanded over the next five years as follows:
Instructional Program
Medical and Dental Technicians
Nurses, Practical
Projected Change inCompletions, 1970-1975
(in _percent)
220%
96%
b. Completions in technical and industrial occupations will bechanged to meet anticipated changes in the labor market.
Carpenters
Motor Vehicle Mechanics
Sewers and Stitchers, Manufacturing
No change
50%
- 53%
c. For distributive occupations and office occupations, no Changein annual collipletions are projected for 1975.
Total projected enrollments by instructional program and by type ofproven must be related in the final vocational education plan. Enroll-ment projections by general program type have already been projected inTable 3A. The projections of completions by instructional program codehave been translated into enrollments in Table 7. Once instructionalprogram information has been translated into enrollments, these shouldbe distributed among program types. In the example in Table 8, wesuggest segmenting programs in terms of Full Time, Cooperative, Work-Study and Special Education. Other school systems may wish to add anexemplary program category, and/or break down full-time enrollments intothose in vocational-technical high schools and those in the comprehen-sive high schools. We have omitted such a breakdown here in the inter-est of simplicity.
The demographic projections described earlier in this reportsuggest that a major expansion of cooperative and work-study programswill be required to serve the needs of students who must work foreconomic reasons.
31

In our exenplc, secondary vocational education enrollments areprojected to increase fro 36 to 37 thousand f.rc:n 1970 to 1975. Gainfuloccupational preparation enrolivents will increase froa 15 to 18 thous-and. Distributicn of enrollments by in:Arvetional prcuam results in3,500 of the cnroalees being able to work a9 well as study. All of theoccupational prejyaration progasms given as illustrations except Indica'and dental technicians are available to part-time as well to to full-time students. It in rusuned the medical end dental technician trainingon the secondary level is preparatory to a post-secondary program and istherefore most appropriately scheduled for full-tine students. It isalso anticipated that servicing the needs of the disadvantaged shouldinclude the rapid expansion of cooperative and work-study programs infields that premise readier employment upon graduation. We thereforeproject a majority of motor vehicle mechanics enrollments in work-study programs,
expansion of distributive education in cooperative programs and atripling of cooperative or workstudy enrollments for secretaries,stenographers and typists.
Special education program enrollments of seven thousand in 1975 allowfor remedial education, counseling and JO coaching cavonents for halfof the 7,000 disadvantaged students ana all of the 3,500 handicappedstudents projected to be simultaneously enrolled in regular instructionalprograms.
The total enrollment figures for 1970 and 1975 entered in Table 8were derived frol enrollments objectives. The distribution of enroll-ments for each instructional program into regular, cooperative and work-study programs is based on the administrators' best feel for the type ofstudent to be attracted by each program, the number of employers he canmake workstudy arrangenents with, and his estimates of student prefer-ences. Since many of these factors can change markedly over a five-yearperiod, annual updating of this plan is essential. ,
The "other occupations" category in this table is large onlybecause we have chosen to illustrate these planning steps with sevenselected occupations. All vocational instructional prograns offered inthe school system in 1970 should be included in actual planning tables.liew instructional programs planned after 1970 but before 1975 shouldalso be included. In many cities there is a growing use of teacher andsocial welfare aides, and increasing emphasis on the nation's transpor-tation system will open up many jobs for heavy equipment operators,truck drivers and deliverymen. Secondary vocational edu9Oion may be alogical spot for new forl'al training efforts like these. J)
This table presents a srrtrary of the plan, the total projected.enrollments by occupational area end type of instruction required tofulfill the objectives of the plan. Vbile these are projections and notm(1) llational Goals and Vocational Education Priorities in the 1970's,
Hatioual Planning Association, Center for Priority Analysis, 1910.
32
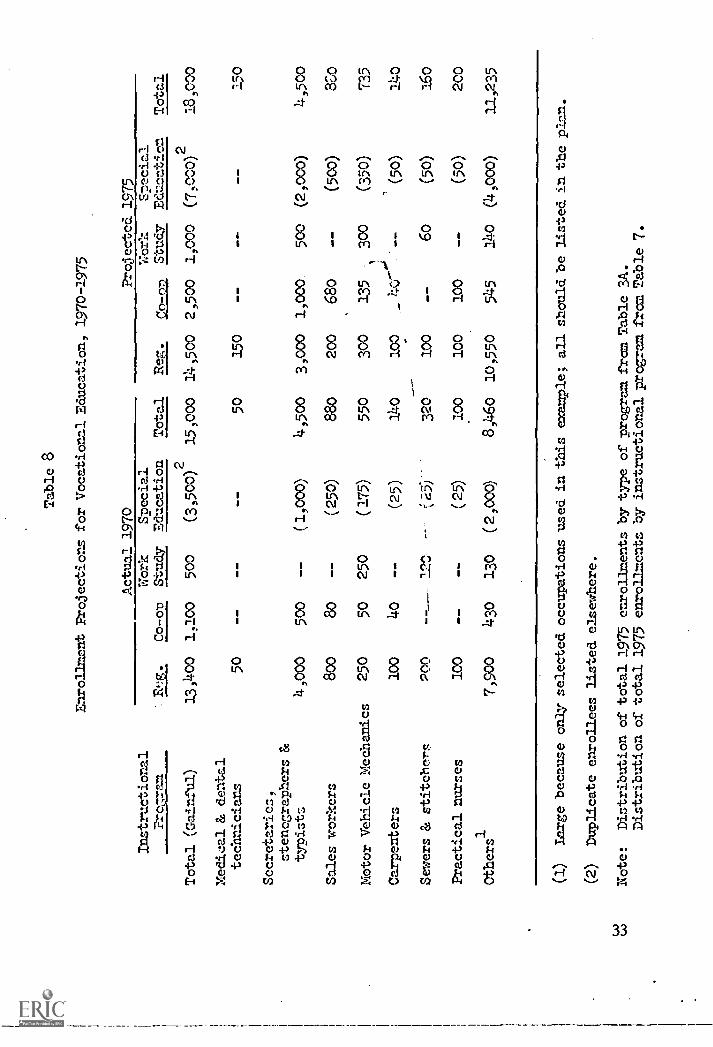
Table 8
Enrollment Projections for Vocational Education, 1970-1975
Instructional
Pream
Actual 1970
Projected 1975
Reg.
Co-op
Work
Study
Special
Education
Total
Reg.
Co- ,-)D
fork
Study
Smecial
Educatien
Total
Total (Gainful)
Medical & dental
technicians
Secretaries,
stenc3raphers &
typists
Sales workers
Motor Vehicle Mechanics
Carpenters
Sewers & stitehers_
Practical nurses
Others1
13,400
50
4,000
800
250
100
200
100
7,900
1,100
500
80
50
4o
--
430
500
--
250
--
12C,
_ -
130
(3,500)2
(1,000)
(250)
(175)
(25)
----
,-25)--
(25)
(2,000)
15,000 50
4,500
880
550
140
320
100
8,46o
14,500
150
3,000
200
300
100
100
100
10,550
2,500 1,000
--
1,000.-
500
680
--
135
-1
300
_.
1**--"Pj_
--
--
60
100
--
545
140
(7,000)2
(2,000)
(50o)
(350)
,
(50)
(5o)
(50)
(4,000)
18,000
150
4,500
Ko
735
140
160
200
11,235
(1)
Large because only selected occupations used in this example; all should be listed in the plan.
(2)
Duplicate enrollees listed elset,ihere.
coco
Note:
Distribution of total 1975 enrollments by type of program from Table 3A.
Distribution of total 1975 enrollments by instructional program from Table 7.

predictions, they arc target values the adeinistrator hopes to achievewithin the next five years. His following year's effort, in this examplethe ennual plen for 1971, should reflect mile progress toward eehievingeach of the objectives, and shifts in enrolhlents should occur in thedirections indicated by the five-year plun.
9. Estimated Resources Reetired td Achieve Stated Objectives.
To support changes in progrell objectives,the administrator mustforecast changes in facilities (or at least facility utilization),teachers, and equipment to service the changing pattern of enroliDlents.The particular ccobination of the resources to apply to each programdepends not only on projected enrollments but also on program design.On the one hand a given school may be operating traditional lecture-workshop classes with full-time teachers, or may use part-tine teachersfrom business and industry. On the other hand instructional technologymay accelerate changes in the ratio of teachers to pupils and the useof speeial teaching equipment. A change in types of programs offered Laychange resource requirements. However, whatever the instructionalmethods employed, the projected reauirenents for teachers, equipmentand facilities and their associated costs must finally be related tothe estimated nu fiber of students enrolled in each instructional program.Similarly, the gp in counsel ors and other special support personnelmust be related to the educational objectives in long-range plans:
Table 9 presents an example to illustrate the task of relatingthe various types of information discussed in this report. The plannerenters in coluan 4 the current nvinber of teachers for each instructionalprogram. This projected teacher requirements for 1975 (coluein 5) mustthen be related to the changes in enrollments (column 3 minus column 2)and the distribution of these enrollments as shown for this example inTable 8.
For example, for autonotive mechanics. programs, an enrollment increasefrom 550 to 735 is expected, or an increase of more than 30 percent. An
increasing number of these will be in part-time programs so it isreasonable to project a smaller percentage increase in teechers thanin enrollments. Therefore, we have illustrated a 20 percent increasein teachers. Similarly, a doubling of enrollments in practical nurseprograms (last row in Table 8) is matched by a projected doubling ofthe number of teachers for these programs in Table 9.
31+
Tab
le
Exe
mpl
ary
Com
plet
ed F
orm
at f
or V
= a
tiona
l Edu
catio
n M
fmni
ng
(1)
OE
Pro
gram
Cod
e
(2)
(3)
Vocational En-
rollments
A1970
1975
(4)
(5)
Teacher Require-
ments
AP
1970
1975
(6)
(7)
(8)
(9)
(10)
(1)
(12)
(13)
Facility Requests
Facet
1070-1975
1970-1975
AP
AP
$Sq
.Ft.
$T
otal
/Puo
ilT
otal
/Pup
il
Tot
al (
gain
-fu
l)15
,000
18,0
00
Med
ical
and
Den
tal
Tec
hnic
ians
5015
02
3(1)
NO
CH
AN
GE
(2)
Secr
etar
ies,
Sten
ogra
pher
san
d T
mis
ts41500
4,500
38:3
400(3)
(2)
Sale
s W
orke
rs880
880
N. v.
Mec
hani
cs55
073
555
65In
crea
se in
spa
ce
Carpenters
140
140
Sew
ers
and
Stitc
hers
320
160
2518
Dec
reas
e ir
t spa
ce
Nur
ses,
Pra
ctic
al 1
0020
05
10Increase in equitment
provided by cooperating
hospital
Oth
ers
8,46
011
,235
NO
TE
S:D
ata
for
culr
mn.
, (1)
,(2
), a
nd (
3) a
re f
rom
Tab
le 8
.(1)
Increased teachers' loads are shifts from mart-time to full-time teachers.
(2)
Spac
e av
aila
ble
in
curr
ent f
acili
ties.
(3)
Dec
reas
e in
teac
her:
stud
ent r
atio
.

Similarly, facility and budget projections must be related to theseobjectives. A iVt'ilvIth al data entries throngh colvm 13 will suggestthe kinds of facility end but changes which nay be required to meetthese objectives.
It must be understood that eharges'in resonrces need not be directlyproportional to anticipAted enrollment changes. For °maple, the rapidexpansion of enrolleonts in medical technician COUVAC-3 night be acconplishedby andarg special partstin:e teachers, by keeping teachers at their currentlevel and adding teacher aides, or by maintaining the current teachingstaff and introducing co puler assisted instruction in mathematics andbiological science skills. Similarly, doubling of enrollments in practicalnurse programs might be aceanplished by expanding night courses or nightbe conaicted on a part -tine basis through cooperation with a hospital ona re5.0)nracrkt basic, rather than by doubling the teaching staff. Eachof these alternatives has different iisplications for teachers, equipment,and facatties, but come mix of resources must show a change responsiveto projected enslIsents by program.
When planned conroe reductions in enrollments are' anticipated, asis the case with sewers and stitchcrs in our example, there need be noautomatic proportional reduction of teacher's. Teachers are assusied tohave tenure arta tri1J continue o :1 the staff mnleas they retire or transferout of the systesi. If the reduction in enrollments is slow, there raybe no problem. Dolvial attrition may be operative, or alternative dutiesnay be found for the curplas teachers. If teachers must be transferred,available teacher skills rimy be taken advantage of in other coursesrequiring related skills -- sewing in home econonies courses, for example.
In all cases, the final enrollment objectives selected will dependnot only on the availability of teachers, equipment, and facilities, buton an tenticipated school budget. If the budget is growing too slowlyover R five-year period, ti hile either expanqed enrollments or more costlyprograms appear neceasary in the light of educational objectives, innovativelow-cost program alternatives may be required. This may involve betterscheduling of facility usage, nose cooperative efforts with local employers,or the use of supplemental teacher aides. If none of these alternativescan be arranged, enrollnent objectives will have to be modified. If schoolbudgets can be anticipated to increase while enrollments remain relativelyconstant, on the other hand, the anministrator has an opportunity toit teschcr-stndent ratios, to purchase more modern equeqxnent, expandthe guidance progreves)or improve facilities. In each case, however, theislorovenent or expansion intended should support an enrollment objectiveand not be carried out for its am sake. The expenditure of both currentand increased budgets should always be related in the planner's mind andin the planning docnuent to the echievenent of specified vocational edu-cation objectives set in Table 9.
36

A eonparisen of current alld projected enrollments froll columns2 and 3 of Table 9 will tell the planner how far he hr to go toachieve his 1975 objectives end he should set his 1971 objectivesto reflect sor,e progress in this direction. After costing out the1971 program, he nay be forced to reduce his 1971 objectives in lightof the naximm resources he ahticipates. These levels, however,will probably be in excess of the actual resources which will be provided,and the 1971 objectives will again have to be reduced. The higherfigures should be used in the plan since the 1971 plan will be usedto justify the level of support requested and to argue for more funds.The five-year enrollrlent objectives should similarly reflect desiredlevels of perfoaArance rather than reasonable expectations of availableresources. The analysis of resources required for these objectivesmy reveal areas where special efforts are required (such as inservice training of re.nedial education teachers, or construction ofnew facilities) which will need substantial lead-time. These objectivesmy have to be deferred to a later date if resources are not provided butthey set the frame of reference for all vocational education planningby telling the planner, in quantifiable terms, where he wishes to go.
The steps outlined in this section will help the vocational educationadpinistrator organize his future prograws around a set of objectives.The plan which he prepares based on such a systematic development processcan be cployed in conunicating these objectives end requirements tolocal and state Advisory Councils and to the State Department of Education.They will also improve the porfornance of the local vocational programsin meting stated goals and will serve as a sound foundation for arguingfor the additional funds needed to meet these goals.
37

PART II
Chapter 5
SOURCES OF DATA FOR PLAN1aNG
1. Labor Market Data
Manpower Data. Data on labor force by age and sex for states and local_ .areas may be available from studies conducted by state planning departmentsutilizing Bureau of Labor Statistics techniques for developing projectionsusing national employment trends. Studies may also have been done in thisarea by private research organizations such as the labor force projectionsstudy by the Battelle Memorial Institute for the State of Michigan. klUniversity research center studies are another possible sourcc. Nationaldata are available from the Manpower Report of the President, 2) whichassesses major changes in the labor force for the entire United States.
Tables illustrating the type of statistical data which can be developedare presented on the next tro pages. Table 1 shows a distribution ofthe labor force by age group for the sample susA, the rest of the stateand the United States. To better demonstrate relationshps, the samedata is expressed in percentages in Table 2. The tables do not showmale and female data but these can be expressed by the same age intervalsas in the totals. (3)
The same format may be followed for presenting the nonwhite laborforce and the labor force participation rates data. For estimatingnonwhite labor force participation rates by age groups in our stateand city example, adjusted U.S. labor force participation rates (4)
were derived for Baltimore and Maryland. Adjustments were based onprojected participation rates obtain.ed ftoM the National PlanningAssociation projections study. (5)
Similarly, educational attainment data indicating the amount ofschooling achieved by individuals within the labor force may be presentedand also expressed in percent. (See Table 3.) National data for this
particular variable for 1960 were obtained from the U.S. Census and for
(1) See the Michigan Manpower Study: An Analysis of the Characteristicsof Michigan's Labor Force in the Next 15 Years, Battelle MemorialInstitute, November, 196.
(2) Manpower Report of the President, published annually, U.S.. Departmentof Labor, through the Government Printing Office, Washington, D.C.
(3) Ibid.
(Jr) Ibid.
(5) Economic and Demographic Projections for States and MetropolitanAreas, National PlanniLc Association, Report No. 68-R-1, January,
p. s-237.
36
Illustrative Table 1
Labor Force by Age and Sex for 1960, 1970, and 1975 for the Baltimore
SMSA, The Rest of the State of Maryland and the United States
(in 000)
Category
Baltimore SMSA
Rest of the State
United States
1960
1970
19 75
1960
1970
1975
1960
1970
1975
Total
15-19 years
40.0
56.6
56.5
31.4
49.5
54.,!!
6,200
8,5'r
9.328
20-24 years
67.3
120.3
137.0
47.6
93.2
106.5
7,497
11,733
13,196
25-64 years
567.6
631.4
69i..8
390.3
529.9
600.5
56,005
62,497
67,80
65 years old
and over
27.6
33.4
32.7
18.1
22.5
27.1
3,379
3,199
3,292
Total, 15 years
old and over
703.0
341.7
921.0
437.14
695.1
788.5
73,031
35,999
93,616
Male (Same age intervals)
Female
(Same age in;:ervals)
Sources:
The Labor Force of Maryland:
Projections of Socioeconomic Characteristics to 1980,
The Maryland State Planning Department, 1969;
Manpower Report to the President, U.S. Department of
Labor, 1967, T& le -2, D. 268.

Illustrative Table 2
Labor Force by Age and Sex for 1950, 1970 and 1975 for the Baltimore
SMSA, The Rest of the State of Maryland and the UnIted States
(percent ditribution)
Baltimore SMSA
Rest of the State
Unitec: States
Category
1960
1970
19'75
1960
1070
1375
1900
19'70,
75
Total
15-19 years
5.75",
6.71,
6.1'1,
6.45
7.15
6.9;
8.5-1,
10.15
10.05
20-24 years
9.6
14.3
14.9
9.3
13.4
13.5
10.3
73.6
14.1
25-64 years
30.0
75.0
75.14
80.1
76.3
76.2
76.6
72.7
72.4
6:3 years old and
over
3.9
4.0
3.5
3.7
3.2
.3.4
4.6
3.7
3-5
Total, 15 years
old and over
100.0
100.0
100.0
100.0
100.0
100.0
100.0
100.0
100.0
Male (Same age intervals)
Female
(Same age intervals)
Sources:
The Labor Force of Maryland:
Projections of Soc:.oeconomic Characteristics to :;_73o,
The Maryland State-Plannfng Department, 1969;
Manpower Report to the President, U.S. Department of
Labor, 1967, Table E-2,
263.

Illustrative Table 3
Educational Attainment of Labor Force by Sex, 1960, 1970 and 1975
for the Baltimore SMSA, the Rest of the State of Maryland and the United States
(in 000)
Cater:cry
Baltimo::e
SYSA
nest of the State
United States
1960
160.0
86.2
152.6
169.4
62.8
72.2
703.2
1970
121.2
81.3
135.9
249.3
96.9
107.2
3141.3
1975
108.8
76.5
199.6
295.8
114.3
126.1
921.1
1960
109.4
59.4
107.3
117.8
43-7
50.0
487.6
1970
99.5
67.2
154.3
205.1
79.5
38.9
696.0
1975
93.4
66.1
172.6
251.5
96.6
107.1
737.2
1960
f 117'644
13,711
17,272
6,636
6,255
61,458
1970x
.W1. 5
(.
,
,
114 524
4.
13,047
31,353
11,876
11,85'2.
87,654
Total
Less than 3 years
3 years
1-3 years hizh school
4years h7 -h school
1-3 years college
4 years or more college
Total
Male (Same educational
levels)
Female
(Same educational
levels)
* Not available
Sources:
The Labor Force of Maryland:
Projections of Socioeconomic Characteristics to 1980,
Maryland State Planning Department;
Occupational Characteristics, U.S. Census of Population, 1960,
PC(2)-7A, Pp. 116-129.

1975 fro t National. Planning Association projections of educational attain-ment to 1975. (6) 1970 U.S. Census data will soon be available for up-dating these estimates.
Table 125 in Detailed Characteristics, U.S. Census of Populationentitled "Imiustry Croup of the Er:piOyed, by Occupation and Sex, for theState or Standard Metropolitan Statistical Area of 250,000 or More: 1960,"shows employment by industry data in the various occupations (professionalto service workers) for 43 industrial categories. (7) Equivalent datafor 1970 will soon.be available in the 1970 Census. This data is generallycomparable to the Standard Industrial Classification Code (S1C), withcertain qualifications such as the difference in the classification ofgoverment workers in the SIC and the Census. (All goverment workersin the SIC arc classified into one major grouping while the Census, onthe other hand, classifies government workers in service agencies intothe appropriate industrial category i.e., government medical workersin the medical services.)
The above data were used by the National Planning Association as abase for developing employment projections to 1975 and 1980 by '7dustryfor the nation and for state areas. (8) This study shows emplo,..mt byindustry for 1966, 1968,'and projected 1975 and 1980 in 33 differentindustrUtl categories. Twenty-one manufacturing industries are includedand a breakout of commodity and non-commodity producing industries isprovided.
State planning departments, labor departments and private researchorgAnizations may also have developed employment by industry projections.For our sample area, industry employment projections were developed bythe Maryland State Planning Department in its study, The Labor Force ofMtrylcnd, Projections of Socio-Mconomic Characteristics to 198671Elsstudy contains projections for the major occupational groups in 31 in-duscry sectors for six sub-regions and for the whole state.
Planners who wish to develop their own industry projections can doso by using the simple ratio uethod. If data for the particular industryare available for at least two-year points, preferably five years apart, atime trend can be established to project these data to 1975. See Chapter6, pages 57 and 59 for sample calculations of this projection technique.The resultant ratio con then be applied to the 1970 national employmentprojection to allow an estivate of employment in the industry for thestate or local area. 1975 national employment by industry projectionshave been developed by the Bureau of Labor Statistics and are presentedin Appendix Rs Volume IV, Tomorrow's MnRorer Needs.
This ratio method, however, applies well to industries that cater toA national market, yielding better results than when applied to thoseresponsive to local trends or economic conditions. For the latter in-dustries, states developing their cem projections can rely upon re6ressiontechniques to measure influences of local factors upon the e'Aploymtnt of
AAA.. 041 ateN/W/Naira.-
(6) Chong K. Park) "Economic Changes) Manpower Requirements and TheirImplications for Educational Policy in the Next Two Decades," unpublisheANational Planning Association Study) April 1968, Appendix Table 8.
(7) "Detailed Characteristics," Characteristics of fhe_fprlation, 1262A1Eus2111Tulntion, Series PO (1T-1 D to 53 D, Chapter D, Table 1P5.
(8) Econmic and DInogralphic Projections to 1975 and kpo, "Area EmploymentFrofirc71Taionai Planning Association, Regional Economic Projection
42 Sera es, Report 1 :o. 70-R-1, Table 2.02, Vashington, D.C., April, 1970.

their industries. Experiences of states developing their own industryprojections utili.zing these techniques are described extensively inTomorrow's Manpower reeds. (9)
Employment by major occupational group by sex and race and employ-ment by detailed occupation by sex and r:',ce arc available for each statefrom the 1960 Census(10) which show. the devAilcd. occul'atlon of the employed,
by sex, for the entire state, (including reparate urban and rural totals)and for standard metropblitan areas of 10:;,000 or more. The Censusdefines as empleycd, all persons, 14 years old and above "at work" orwith jobs but not working" due to illness or reasons. TheCensus provides data on the =fiber employed by occupational group (forexample, clerical and kindred workers), occupational category within thegroup (for example, secretaries, stenographers and typists) and occupationgroup and category by industry (for example, secretaries, stenographersand typists in the construction industry.) Should more detail on. thesecategories be desired, the Classified Index of Occupations and Industries,U. S. Bureau of the Census, shows what minor occupations are included ineach of the categories. Additional statistical detail however, must berequested in writing from the Office of the Chief, Population Division,U. S. Bureau of the Census. The planner also is reminded that the 1970Census will soon be available for comprehensive employment data.
gore recent data than 1960 may be obtained from the research andanalysis divisions of the State Employment Security e.encies. Thvugh itis possible that the available data are not based on actual count buton estimates developed from industrial-occupational matrices, they shouldstill prove useful as a guide if historical information in not available.State planning departments are also another important source of historical
as well as projected employment data.
Other sources of data on selected occupations mere statewide and SESAsurveys conducted by local chambers of commerce, the Federal Reserve Banks,research divisions of piofessional organizations, trade unions, oamd lieensure
agencies. State and local data may also be available on employment inteachin3, health and other occupations from Federal agencies responsiblefor programs in these special areas.
(9) See the rew York State experience, "New York State Departent ofLabor's Earipover Projections for the State and Its Areas, a Pre-liminary Report on Eethoi", Volume I, Somorrow's_Kaazacryeed,U. S. Department of Labor, Bureau of Labor Statistics, Bulletin?o. 1606, Washington, D.C., 1969, pp. 18-146. See also the Stateof Denver experience, in Pethodoloa_for Frokteetion of OccupationalMeamlalm_the Denjes_atandt-rd1:atrotAitan Statistical Area, preparedfor the Office of ranpower Policy, Evaluations an4 Research, U.S.Department of Labor, by the Bureau of Economic Research, Universityof Colorado, Boulder, Colorado, parch 1966.
(10°Mailed Characteristics' Characteristics of the Population,1960, 02.. cit., Table 121.
43

Projections of national data are available from the study, Man-power Reaniremnts foi National Objectives in the 1970's which estimatesemployment levels ne:essary for the pursuit of given economic and socialgoals (11) end rrom. the Bureau of Labor Statistics report bulletins,Occupational Em»loyment Iktterns for 1950 end 1975, and Tomorrow's Man-power Needs, T(2 Vhich project national employment by occupation tndindustry .6-1975.
Table 4 shows employment by major occupational group for a samplecity and state and the United States. This dee could be similarly ex-pressed in the sare format for male, female) and in percent. (Employ-ment data for farm occupations was distributed among the other categoriesand vas not reported separately.) Employment by detailed occupation isshown in Table 5. It provides sample detailed occupational categoriesfrom each main occupational group, selected from the 30 largest occu-pations in the 1960 Census for the Baltimore SMSA and the state ofMaryland.
In selecting the above occupational categories, the largest occu-pations in the 1960 Census for the SMSA end state were identified andranked according to size. Out of the 30 or so largest occupations, thoseof particular interest to vocational education (on the basis of highemployment growth, existing vocational programs or training potential)were selected from each main occupational group. Since the EUreau ofEmployment Security did not provide employment projections for all theoccupations in Table 5, estimates based on the 1960-1975 occupationalmatrices in Tomorrow's Merpower Needs were used in deriving averageannual job openings presenter iii Chapter III, Fart One.
Employment and Earnings. These data vhich show the relationshiptaween evoloyment and income are available from the Employment and Earningsseries and the Area Wage Srveys published by the Bureau of Labor Statistics.The latter provides statistics on the labor force, employment) man-hours)earnings and rates of labor turnover for large cities and their adjacentsuburban counties. Hourly earnings for "Production 'corkers on manufacturingpayrolls" for the SMSA in our example were derived from this source.(See Table 6.) Earnings for the Selected occupations were estimatedPmi data on average weekly hours and earning* by occupation and industryin the Area Wage Survey. (For each selected occupation, the averageweekly earnings in each industry were divided by average weekly hours ineach industry giving the rverage hourly earnings of each selected occu-pation by industry. Average hourly earnings for each selected occupationby industry were then weighted by the number of workers in the occupationin coch industry providing average hourly earnings in the area for eachselected occupation.) Lca Wage Surveys provide pertinent weekly salaryend earnings data for each netropolitan area based on annual occupationalsurveys. A list of available surveys can be obtained from the U.S.Durcau of Labor Statistics.
001110600.6
(11) Leonard A. Lecht, rtmpowerpesulnents for National Objectives in the!1270's, report to the Manpower AoAlnistration, U.S. Department of Labor, It
(12) Sec Appendix E, Volume IV, Tovorrouis Ennpower Needs, op. cit.
h4
171,,strat4ve table 4
annleyment by Ma:lor Cccupationel Group, 1960, 1970 and 1975, fo-
Daltimore =.1.A, the ; eJ. of the State of Maryland an:a the United Statec
(in 000)
Cater-ory
1Reet of the Stotc
1960
1970
19/5
1960
1970
1975
1960
nitc collar
336-6
103.L.
Profeecional a technical 00.2
Manc.:,:efial
66.6
67.6
Clerical
131.0
1;7.0
50:0
66.7
Blue collar
202.1
Craft%,..n
10b.:7
Operatives
129.7
Laborere
47.9
Scrvicee
Private houechold
.Other cervicee
Faro
Total
"P JJ.0
95.3
1,7nite
Ctates
435.0
207.6
209.4
341.3
29,093
39,123
43,361
119.3
6.,.6
34.2
100.9
7,232
10,721
12,413
69.0
',4-.7
63.0
9.
,9-1-6-
1).,.5
-.,L-
.n ,
.r62.2
3
174)
c; )
.
,-
l7
-1
71.0
29.1
;6.9
54.6
4,639
4,910
:f=c-,-
-,....,
.:
303-6
139.6
172.4
194.1
25,193
.
29,90q
31,432
119.3
43.3
64.1
75.7
3,71..2
1- --:,-
.....,,,..,0
10,722
144.7
49.7
62.9
71.3
11,393
13,343
11.,:60
39.6
!.5.6
1,3.;
47.1
1:,553
6,013
6,200
104.0
29.3
:.6.0
55.8
7,172
11,271
12,311
702-5
732.6
843.4
376.5
507.3
591.7
61,453
e0,303
37,65l.
Soul.ct:":
The Labor Force of :.!aryland:
Projection^ of SocioeconemIc Characteristic" to 190;
"Detailed Charaeterie tice," Charactcri7t1
of the 7onulation, U.S. Censun of Ponulation for 1960, PC (1) -
1 D, 2. 523;
Leonard A. Lecht, ManpoYer Eec:airemente for I':'ational Obf,ectiven in thc 137C'e, Report to the
Manpower Adminietration, 1960, pp. 294-296.
Illustrative Table 5EN.olowent by Detailed Occupaticn, 1930, 1970 and
1910 for
Occupational category
the Da ltLkore
Balti,Iore
19o0S :SA
;ncl the State of 1:aryland
' State of Maryland1970 19:75 1970 1960
Professional & technicalMedical and dental
technicians 1,535 3,000 4,598 2,727 5,082 7,884
ClericalStenographers &
typists 25,1409 37,915 56,303 51,458 67,747 95,690
CraftsmenCexpenters 7,419 7,797 8,022 15,182 16,707 19,561Motor vehicle mech-
anics 5,793 8,100 9,700 11,479 (a) (a)Welders t flmccutters 4,263 5,477 6,257 5,483 7,195 8,841Vachinists 5,433 5,P3 5,013 8,313 8,136 7,671
OperativesDrivers, bus & true!; 14,585 17,897 31,569 26,187 31,569 38,093Sewers & stichqsamanufacimring b 5,789 6,177 4,923 9,963 8,836 8,940
ServiceAttendants, hospital
& other institutions 4,930 7,897 12,351 7,198 11,719 18,735
Policemcnt and otherlaw enforceent 4,640 5,989 7,4'13 12,563 10,713 14,840
Practical nurses 116,)2 2,776 4,424 2,847 5,052 8,226
Kot availableb) Projected to decline on the basis of occupational group emplvnent trends
in th Varyltnd 1,Nbor Force Study.S/urePs: "Detailed Characteristics," Characteristics of the Population,
U.S. Census of Population, 19S3, a: (1) 22 D, rorylend, Table 121, pp. 'MU7-292;The Labor Force of 1:aryll.ni: 1-r,ljectiont of Swloeconomic Characteristics to 10:.0,
garylanl State Planning D%parl.mcnt, 309; Data on e,Qloynent in the BaltiAlrezetiwolitan area related to vocatonal education released by the garrlaud Derartment.of X.:_ployAcnt Security, Re&ctr.:h at4 Analysis Divisi:11, Cline 1969.
...........a.

Per capita personal income data for states end areas are availablefrom the National Planning Association study, Economic and DemographicProjections for States end Metropolitan Areas. Me dataTrn terwa ofW6-dollars) are provided for each state, for metropolitan areas, andfor the United States, and are projected to 1985. 1970 data were notdeveloped in this study so the 1970 figures were estimated throughextrapolation. ()<or this procedure) see Chapter 6, page 57.) Some
projections have also been made by the Office of Business Economics,U.S. Department of Commerce.
Similar data may be available from studies supported or initiatedby the bureaus of economic research or industrial research departments ofuniversities. 0-3) However) these are usually limited to a particular
state or area.
Tables showing sample data on these variables follow.
....././.10,....(13) See) for example) "Provisioral Population and Labor Force Projections
for South Carolina Counties, 1975 - 2000," a research project by
an O. Park supported by the Faculty Basic Research Committee endthe Department of Industr!al Management, Clemson University, SouthCarolina) and featured in the Clemson University Review of IndustrialManagement and. Textile Science) pp. 38-:t67

XllustraUve Table 6Avorac,e Hourly EarninL,:: for SelectedRelatives to Production Workers in
Hourly,
Occupt.ticn earnl.nr!,s
OceupatIl.ons a:1d Their
Baltimore Sfl3A, 1968
Earnings
Relative
Production workers onnanufacturing payroll:. $ 3.22 100.0
Selected occupations (allindustries)
Secretaries 2.91 90.3Stenographers 2.5) 78.0Typists 2.21 68.6Draftsmen 3.80 118.0Corpentert (r12.3.tr;enanc,e 3.51 109.0McchiniLts (maintenance 4.01 )211.5
Guards an watOmn 2.16 67.1Truckdrivers 3.18 98.8
..-.0-..
Sources: Eploymentand larninL;s, larch, 1969, Table C-10,p. 104;Area Vage Su-rve:,.: The Bcltimore, 1'nry3and tetropolitan Area, SeptemberI9a;; Table A-3, p. 15, Bureau of Labor Statistics.
Hotel 'Ate "En-nin;.;s Relative" coltz.In cho..%3 the he arly cnrnin3s for
each selected cecnpation taken as a percent of the average total hourlyearnings of pro4vctioa workers on mnuftcturing yayrolls in the saupleSMSA.
48
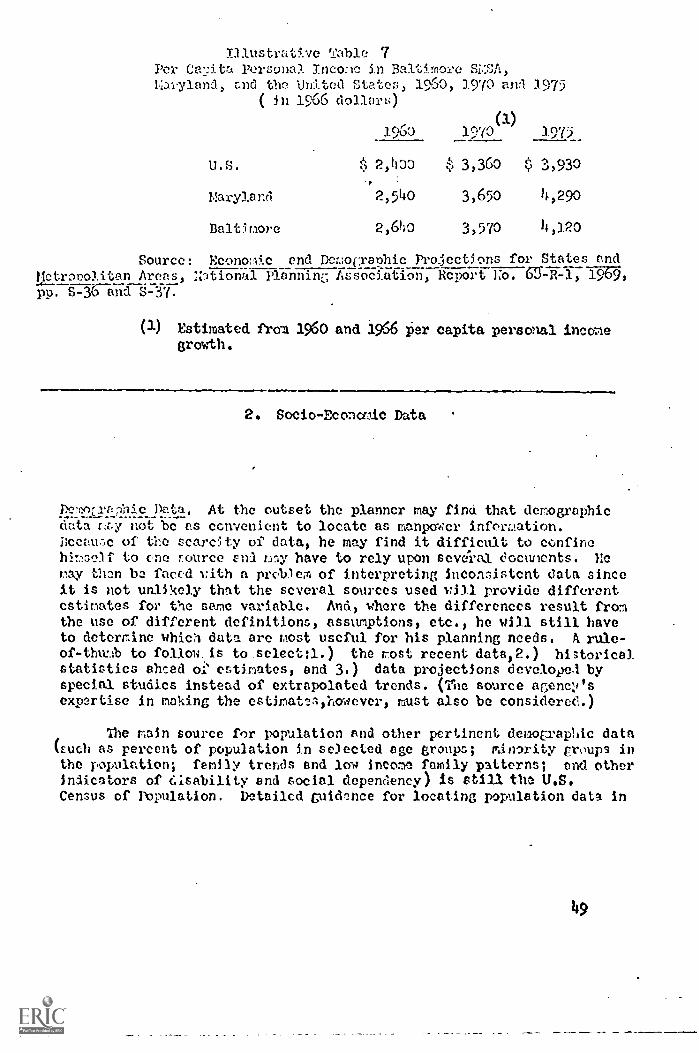
Illustrative Table 7Per CalAta Personal Inco:le in Baltimore SI:SA,Earyland, and the WO.ted States, 1960, 1970 an:I 1975
( in 1966 dollar:;)
(1)1960 197) 1975
U.S. tti 2,00 3,360 .$ 3,930
Maryland 2,540 3,650 4,290
Baltimore 2,640 3,570 4,320
Source: Beoncelic end Dmocraphie Projeetlons for States endMetrnoolitan Areas, Nitional Planninc, Lssociation, Report ho. 65-R-11 1969,pp. 5-36 end 5-37.
(1) Estimated from 1960 and 1966 Per capita personal incomegrowth.
2. Socio-Econcvic Data
p_e:11(K.r.--.1ie_il.ata. At the outset the planner may find that demographicdeta Ley not be as convenient to locate as manpower information.Deeetu,e of the scare ty of data, he may find it difficult to confinehinsOf to ore rource racy have to rely upon several comments. Yeray than be faced with a prebleA of interpreting inconsistent data sinceit is not unlikely that the several sources used will provide differentestimates for the same variable. And, where the differences result fronthe use of different definitions) assumptions) etc.) he will still haveto determine which data are rost useful for his planning needs. A rule-of-thxr.lb to follolOs to select:1.) the rost recent data)2.) historicalstatistics ahead or estimates, and 3.) data projections developed byspecial studies instead of extrapolated trends. (The source agenev'sexpertise in making the estimatvishowever, must also be considered.)
The main source for population and other pertinent demographic data(such as percent of population in selected age groups; minority croups inthe population; fenny trends and low income family patterns; and otherindicators of disability and social dependency) is stilt the U.S.Census of Population. Detailed guldrmee for locating population data in
49
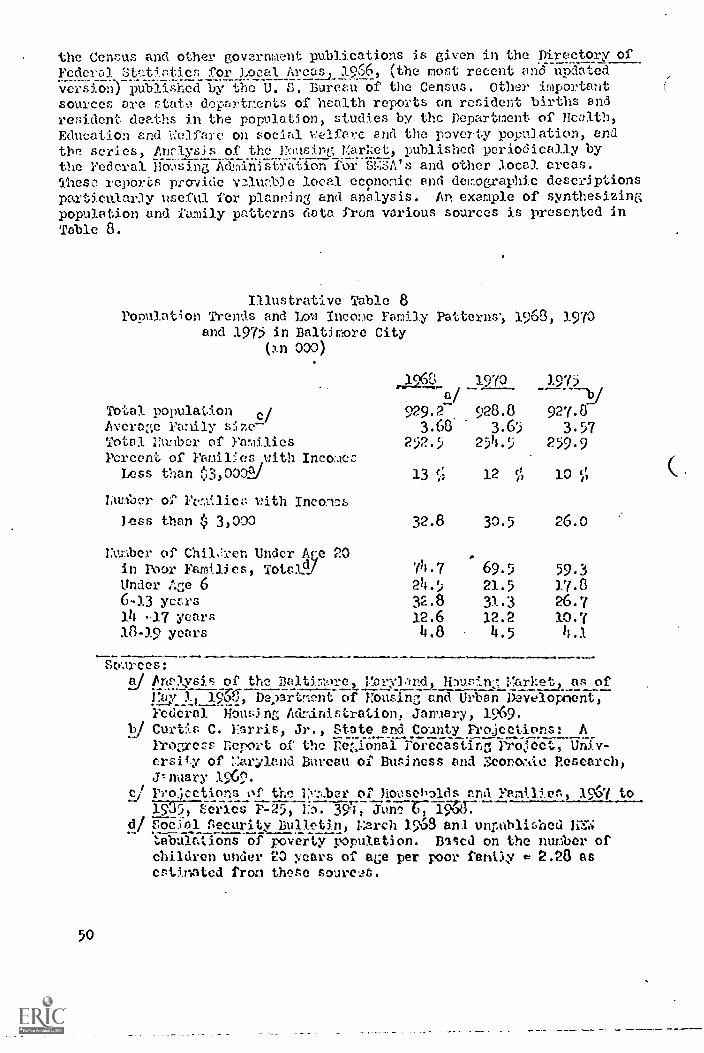
the Census and other government publications is given in the Directory ofFederal Statistics for Local Areas l9r)6 (the most recent and updated
version publIshed by the U. S. Bureau of the Census, Other importantsources are stat,:l departments of health reports on resident births andresident deaths in the population, studies by the Department of Health,Education and 1:elfac on social velfere and the poverty population, endthe series, Anclysis of the }:;raisin t: V.arket, published periodically bythe Federal Howsing Administration for SNSA's and other local areas.These reports provide v:Ilmb)e local economic and demographic descriptionsparticularly useful for planning and analysis. An example of synthesizingpopulation and family patterns data from various sources is presented inTable 8.
Illustrative Table 8Population Trends and Low Income Family Patterns',
and 1975 in Baltimore City(yn 000)
,19Q,a/
To;.,o1 population c/ 929.27
1963, 3.970
1970 1975
928.8 927.8-Average Family size- 3.68 3.65 3.57Total Humber of Families 252.5 254.5 259.9Percent of Famil!es,with Incomcc
Less than 0,00011./ 13 t.; 12 10
Lumber of Fvmilicl: 1?ith Incomes
Tess than (i 3,000 32.8 30.5 26.0
Lumber of Chilren Under Are 20in Poor Families, Totc:0./ 711.7 69.5 59.3Under Age 6 24.5 21.5 37.86-13 yccrs 32.8 31.3 26.7114 -17 years 12.6 12.2 10.718 -3.9 years 4.8 14.5
....01Sources:J An?lysis of the Baltimore, Varynd, HIus:tv Varket, as of
Hay l 16X De)ge"r-rlt of Housing and Urban Developnent,.- -
Federal Housing Administration, January, 1969.hi Curtis C. Esrris, Jr., State end County Projections: A
Progress Leport of the Te,ionalForecasting Project, Univ-ersity of ::ariland Bureau of Butinesn and Scono;.$1e Research,Jtnuary 1969.
e/ Procetions of the HY:,ber of housebolds tnd 1967 to1.07;; tcries P-250 ro. 397, June t7 15168-:
d/ SoCrial Security Bulletin, Harch 1963 and uniwailir,hed'tabulations of poverty population. Based on the nunber orchildren under 20 pears of ace per poor fenUy ft 2.28 asestinatcd fro; these soure.lo.
50

3. Educational Data
Enroll'ents. These data should include total public school enrollnent,public secondary enrollment, and pablie senior high enrollment by age,sex, and race. Data for the state and SIM rare available fret antualreports of state board, of education showinz public achool enrollmmt bygrade and local uait. Lepelta released by the local ed,aeation agencyresearch and dcvelolment units may provide enroll!,:ent forecaats or trendprojections, data ol paatl deacaregation, number of pupils and claases,or annual reports of net roll by gradea and programs.
Data should include voeational education enrollments: 1) by typeof group served (secondary, post-secondary, adult, cooperative, handi-capped, disadvantaged) ; 2) by curriculum ( vocational- technical, generalvocational, special curriculum, consumer -hone econonics); and 3) byspecific training program a (carpentry, electronics, etc.). Statedepartments of education nay indicate in their state plans for voca-tional education the mraber of vocational enrollaents by type of groupserved, by curriculum or by federally-funded training programs for thestate end for the SgSA's, or ray present these data as estimated percen-tages of secondary high school enrollments or given group populations,i.e., adult, handicapped or disadvantaged, Annual reports of the stateboards of education and the research studies done by the research bureausof the local education agencies are also prtmary sources of the abovedata. Furthermore, enrollment data by specific training program may beobtained from reports on enrollments by level of reimbursable and reim-bursed programs which are submitted by the state departments of educationas part of their annual budget requests to the U.S. Office of Education.
The planner is also reminded of the need to obtain actual counts orestimates of nonwhite enrollments by these categorica.
Vocational Education Compktions. Those data ray be available in stateand local education plans for vocational education showing conpletionsin OE coded federally-funded instructional programs (secondary, post-secondary, etc.). They nay be included in analyses of manpower needsand employment opportunities in the state or local area prepared bystate educa'aional planning units or the research bureau of local edu-cation agencies.
51

Withdawals and Fol]ow-Un (Secondary Level)
Data on vithdrawals, possibly including all types of student transfers(out of county, private school, out of state) and follow -up on secondary
school graduates m,y be available from guidance and counselingunits or fro:1 the 3 research bureaus of the state and local edueavion systems.Additional pertimAlt data could al:o be obtained fro annual reports of thestate boards of education showing reasons for withdraual (transfer,disability, etc.) and type of current activities pursued by the publicschool graduate, uhether these be emplo:went, unemployment, further studyor marriage.
Planners should also attempt to gather drop-out and follow-up databy tar(;et population (disadvantaged, handicapped, etc.) from the abovesources or arrange to have the data made available if this informationis not currently provided.
Training Output Information From the Private Sector
The educational planner nay find that information on enrollmentsand completions comparable to the data from the public schools are notreadily available fron the private sector (proprietary schools, hospitals)institutions, union apprenticeship and other types of licensed trainingagencies.) A short phone survey of these other sources of training in thelocal area Nay prove fruitful as a stop-gap measure until more formaldata-gathering arrangements can be nJde. In our example, a stdey by thelocal cha:1)er of commerce listed the various schools that offer vocationaleducation courses in the SY.SA. Using this list as a Guide, inquirieswere vide by Lail and telephone which yielded the necessary information.Lists of schools offering vocational training for specific occupations inst*tes and local areas nay also be requested fro./ the national organizationssho-.:n in the summary of s,trces belo and additional sources of Informationare identified in the Occunationnl Outl00% Landb00%.
Occupation
Practical nurses;attendants, hospital;nurses, associatederee
eaeal & dentaltechnicians
Possible source of information
Private h341itels With special training
progrtms; Professional orcanizations -Pational Association for Practical UurseEducation Services, Inc., Lew York, tel.212-868-0220; American tarscs Association,NOW York, tel. 212-JU2-7230; nationalLeague for nursing, hew York, tel. 212-582 -1022
Board of Schools of ELdical Tachnoloa,Anercian Society of Clinical Pathologists,Chicego, tel. 321-738-1336; Arscricen Assoc-
iation of Dental Schools, Chicago, tel. 312-
V/1h-5878

Occupati on
Eanngers; salesvorxers
Secretaries, steno-graphers, typist
Possible Source of Inforation
Large cw!penics 'with forxal training programs;Universities-colleges or schools of businessadministration
Business and proprietary schools; localsecretarial associations
Carpenters Local unions with apprenticeship progrcras
53

Chapter 6
METHODOLOGY
1., Makin e: Proleetions
Developing initial oecl(pational vp)12etions for 6 state or local areautinfr, the Bureau of Labor statistics national irdnlIg-oecualtIclaalmtricen. There are two methods of projecting manpower requirements byOKiroation for states and local are using National industry-occupa-tional matrices recently developed by the Bureau of Labor Statistics (I).These methods assume a similarity of local area and National social andeel:y.1°11e trends based on the fact that 1) area industry employmentchanges are reflected in National industry employment levels and 2) homo-geneity of demand for both products and services from one area to thenext (e.g., food, telephone service) and auto repairs) creates similarstructures of local area industries all over the nation. A briefdescription of the first procedure, Method A, follows in IllustrativeTable 9. This method may be repeated for as many occupations as needed,provided 1) projections by industries data is available, 2) these occu-pations are included in the National matrices and 3) basic employmentdata is available in the 1960 Census.
Method B, as presented in Illustrative Table 10, is more complexthan Method A since it requires a bpse matrix for 1950 (see step 4) aswell as the development of individual matrices for each industry. Thechoice of method on the basis of expedience, data and resource avail-ability, however, is left to the planner.
Projections by extx Deriving trend projections in relativelysimple tuvi requires actual data for two year points in time (preferablyfive years apart) for the calculation. This ,s done through 1) extrapo-lation by simple proportion and 2) extrapolatLon using growth rates orfactors (2). The results of these two methods are close and either maybe used to obtain the needed estiirates.
( 1) See Tomorrow's Menpower Needs, Vol. I, a. nit., p. 10-17.
( 2) These are available in Growth Factors, Compound Interest Tables,Stanford Research Institute, Research Information Center,Ca)ifornia, which provides average rates of growth, both positiveand negative, over time from 1 to 50 years.
54

Illustrative Table 9
Method A.
Projecting Employment by Occupation for a Local Area Using National anti State Industry Trends
For Occu-pation N:
Industry (each
industry employ-
ing workers in
occupation N)
(1)
(2)
(3)
(4)
State 1960 em-
For each industry:
Column 1 x Col-
1975 projected
ployment for
percent of total
mrin 2 (summation
industry employ-
each industry
1940 National em-
of col= 3 =
:)ment in State
(data for area
ployment in occu-
1960 total State
(projected by
available from
pation N (percents
employment for
either time
the Census*)
available from
Appendix G, Volame
occupation N)
trend or regres-
sion technives.
IV, Tomorrow's
See Part II, p.
Manpower Needs)
38
for possible
sources)
Total 2x 1960 occupation N = 1975 projected.
Total 1
employment in
employment for
local area
occupation N in .
local arem
(5)
For each in-
dustry:
per-
cent of total
1975 Nat;
employment in
occapativeN
(percents
available from
Appendix G,
Volume IV, To-
morrow's Mtn-
poer Needs)
(6)
Cols mn 4 x Col-
= 5 (summntieu
of column = 1975
total State em-
ployment for
ocounation,
called Totta 2)
* "Detailed Characteristics,' Characteristics of the Population,. 1960 Census of Ponulation, U.S. Bureau of the Census,
Series PC 1 (1) Volt
11 D to 53 D Chapter D, Table 125.
These are individual reports, one for each of the 50 States
and U.S. territories.
For more detail on this source, see the descrimtion of employment by detailed occupation by
sex, page 43!

Illustrative Table 10
Method. B.
Projecting Employment by Industry for a Local Area Using National and State Industry Trends
For 3L3ustry N:
Occupation
(Distribution
of occunations
fran urofes-
sional to ser-
vice workers)
(1)
1960 National
ratios of each
ocetriation in
industry N (per-
cents available
from Appendix G,
Vol me IV, To-
morrow's Manpower
Eeeds)
(2)
1975 National
ratios of each
occupation in
industry N
(available from
same sotree as
1960 ratios)
(3)
National eborge
factors or
column 2
column 1
(available frem
Appendix I, Vol-
tme IV, Tomorrow's
Manpower Needs)
(4)
1960 local in-
dustry pattern
(local employ-
ment in each
occupation
taken as per-
cent of total
local industry
N employment*)
(5)
Derived 1975
local industry
patter= (col-
umn 3 x column
4 = 1975 local
occupational
ratios for in-
dustry N)
(6)
Projected 1975
local employment
in
indu
stry
Nfor each occupa-
tion (1975 local
occupational
ratios for in-
dustry N from
col.= 5 x 1975
loca
l pro
ject
ed=7:1cymentiet. for
industry N)
The sum total of all 1975 local estimates for each occupation from
coliz
m 6
in each of the industry matrices is the nrojectcd local =Ploy-
ment requirement for the occupation in 1975.
* Ibid.
Table 121, "Detailed occupation of the employed."
**Projected by either time trend or regression techniques and may be available from state rlanning department studies.
See Part II, m. A-8 for mozsible sources.

Method (1) derives trends by applying the change between the two givenhistorical data proportionately over time to the year projected.The following example demonArates how this method was used. in pro-jecting the educational indicators in our sample city. Slmilar projections
for employment by industry and occupation may also be derived in thismanner, provided historical data for, two given years is available.
Educational indicatorNural:.er enrolled
053 051T 1970 1975
Tit) tb-r- TeT
Secondary public schoolenrollments 312,042 361,309
wherec and d = projections for 1970 and. 1975
a and b = actual data for two given years
y year
andc = b-a N
bVb-Ya Ye Yb
thusc = (361,309 - 312,04) (1970 - 1968) + 361,309
19n-1933
19,706 + 361,309
= 381,016
Method (2) derives trend projections by applying the rate of changebetween two giver}} data points to the base year data by using the GrowthFactors Table. (3) Using the data in the previous example, we divided the
1968 enrollment into the 1963 enrollment:
2610091
a ( rate of change in indicator over the five year312,C4 ,157`' period, 1963 - 1968)
The nearest approximate to the derived rate of change of 1.1578 shouldbe located in the five-year row of the Growth Factors Table, the timelapse in the considered interval being five years. This number or 1.1593is under the 3.0 column on page eight of the Table. Proceeding downthe sane column to the "seven-year" row since seven years is the timelapse between 1963 end 1970, will indicate a ratio of 1.2299. This
ratio when applied to the 1963 enrollment ( the base year) will give the
11111...,(3) Growth Factors, op. cit.
57

1970 trend projection:
c = 1.2299 x 312,042 = 383,780
The some methods (1) and (2) may be used to derive d, the 1975
projection. It is also suggested that these methods may be used toestimate the indicator for ynrs within the considered time interval,
1965 enrollment for example, where no actual data is available.
2,, Deriying Average Annual. Job Openings
The number of job openings or entry opportunities for a given
occupation within a time period is calculated as a sum of (1) employ-
ment growth or change in employment in the occupatJ on within the
conAdered time interval and (2) attrition or replacement demand
arising from death and. retirement within the occupation. A sample
calculation for carpenters is presented:
Number employed in SMSA,
Occupation 1970
Carpenters 7,797 8,022
(1) Employment growth . 8,022-- 7797 . 225
Average employment growth = Employment growth, ; number ofyears within the time period
= 225. 22.5
(2) Replacement demand = average employment x annual attrition rate
e 8,022 7,797 or 7,909 (2.3) = 1822
(3) Averogc ammal job openinge, 1975 == Employnent growt% 4, replace-
ment demand = 22 182 = 20q
* Annual death and retirement rates for all major occupationnl aoups
and categories ale available in Appendix A, Volume I, Tomorrow's
Manpower Needs, pp. 64-67.
58

In BOMU occupations, attrition rates ore provided separately formales and females. Replacement demand should therefore be calculatedas a sum of both male and female attrition. The following calculationis an example:
Nuinber employed_in_242A,CoccupatJon 1970
Attendants, hospital and otherinstitutions 7)897
(1) Employment growth = 12,351 - 7,897 . 4,454Average employment growth = [ 454 = 445
10
12,351
(2) Replacement demand = - average employment x attrition rate
Note: The average employment should be disaggregated by thepercentap of male and female employment in the occupationin 1970.0) If either group is less than 10%, only therate of the larger group will be used to calculate replace-ment demand.
Thus,
Average employment x percent of males in occupation =
10, 124 x 24.6 - 2,490
Average employment x percent of females in occupation =
10,124 x 75.4 = 7,633
The disaggrezated average employment is now respectively multipliedby the male and female attrition rates:
2,490 x 1.7 ( male attrition rate ) = 42
7,633 x 4.7 ( female attrition rate ) = 359
Total replacement demand = 42 + 359 . 401
(3) Average annual.,job openings, 1975 . employment growth +total replacement demand = 445 + 401 = 846
.14.1..0.11V...111111
(4 ) Employment by specific occupation by sex will be available in the 1970
Census. In this example, the percentages of male and female employ-ment for the occupation were derived from the ratio of male-female em-ploYment for the occupation in the 1960 Census and updated by male-femaleemployment ratios for the SYSA in 1970 from the State Departmentplanning study.
59

3. Relatina Average Annual Job Openinga to Enrol3Tants and Completions Data
Tabulating enrollments and completions data by OE Instructional ProgramCode. All vocational instructional progrom.offerinas in public schools arenow clasaified by subject matter and asstened nuabarkal codes up to sixdigits for standard identification and classification purposes. (5)
The seven main subject patter areas with their corresponding identificationcodca and simple inatructional progrcals are as follova:
Instructional program Assigned OE pyagram code
AgricultureAnimal science
01.0001.0101
Distributive education o4. co
Industrial marketing 01F.12
Health occupations education 07.00Nursing assistance (aide) 07.0303
Home economics 09.00Consumer education 09.0101.
Office occupations 11..00
Stenographic, secretarial andrelated occupaticns 14.07
Technical education 16.0oElectronic technology 16.0108
Trade and industrial occupations 17.00Carpentry 17.1001
Thus, each instructional program carries the first tvo digits of itsmajor subject matter area plus four subsequent digits designating itas either a principal segment of training in this area or a divisionclassified under the principal segment. The instructional program"Nursing assistance (aide)" for example, carries as its first two digits"07." the health occupations education code, plus "0303" signifyingthis program as the third division classified under "Hurs'ng", the thirdprincipal segment of the health instructional area. In audition, eachinstructional program is briefly described according to curricular content.The "nursing assistance (aide)" program is defined as a "combination of sub-ject matter and experiences designed to prepare a person to perform simpletasks involved in the personal core of individuals receiving nursingservices. These tasks are performed under the supervision of a nurse."
Using the handbook, vocational education program offerings in aneducational system can be similarly classified and their enrollments andcompletions tabulated by this classific ation.
(5 )
Go
See the handbook, Vocational Education and Occupations,. prepared jointlyby the Division of Vocational and Technical Education, Bureau of AdultVocational, and Library Programs, U.S. Office of Education and the Drat .1
of Occupational Analysis, U.S. Training and. Employment :service, Man-power Administration, U.S. Department of Labor, 1969.

Matching instructional programs to related occupations. Inorder to help facilitate the matching of ins\zuetional programsto occupations, the handbook also indicates opposite each instructionalprogram the occupations directly related to it. These occupationsare defined, classified, and numerically coded by the D.O.T. system.k6 /
In cases where an instructionyl program is matched to a specificoccupational title as in "07.0101 Dental assisting" matches' to "Dentalassistant (medical service)," relating instructional programs tooccupations iv simple.
BLS Occupational Category
Dental assistants
Federally-funded Instruction Program
OE code Title
07.0101 Dental assisting
Hovever, in some cases, more than one occupational title isrelated to an instructional program. The instructional program "Nurs-ing assistance (aids)" for instance is related to three D.O.T. occu-pational titles and "17.1001 carpentry" is related to 29 occupationaltitles. Since the purpose here is to identify the occupational categoryor group for which data are available and relate it to the instructionalprogram, it will be necessary to convert the DOT titles to the sameclassification as the data source. Where BLS data are used, the firstdigits of the related D.O.T. titles should pl'ovide the clue to theirBLS occupational group and classification. For this purpose, theBLS Conversion Table should prove very useful in identifying theoccupational group or category. t 7
First, the handbook shows that the numbers "355" is common toall D.O.T. titles related to the "07.0303 Nursing assistance (aide)"program and "8607 is common to all D.O.T. titles related to the "17.1001Carpentry" program. Consulting the Conversion,Table, one would findthat the "355." D.O.T. title group, Attendants, hospitals, morgues andrelated services is equivalent to the BLS Occupational Category of"Attendants, hospitals and other institutions." In turn, the D.O.T.title group "860. Carpenters and related occupations" is equivalentto the BLS Occupational Category of "carpenters."
BLS Occupational Category Federally-funded Instruction Program
OE code Title
Attendants, hospitals and.other institutions
Carpenters
07.0303
17.1001
Nursing assistance (aide)
Carpentry
(6) See p. xi of the handbook, Vocational. Education and Occupations for a
brief explanation of this classification or consult the Dictionary ofOccupational Titles, Third Edition, Vol. 1.
(7) See the Table Conversion from BLS Occupation Group and MajorOccu2ations to D.O.T. Equivalents, Bureau of Labor Statistics, U.S.Dcpartment of Labor (unpublished).
61

rili(f case entailing the most difficulty in matching instructional
programs and occupations w)uld be where instructional programs arc cobroad that they train or relate to several instructional categories. Anexample would be in the program "04.19 Transportation,"where a wide variety of D.O.T. titles equivalent to several occupationalgroups and categories, i.e. managers, salesorkers, clerks, and stew-ardessess is related to this program. The difficulty lies in relating theseoccupations to one instructional program particularly if enrollmentsand completion data are reported for the whole program and not by groups,that is, how many nrolled or completed training as managers, sales workers1etc.
If more detailed. statistics cannot be obtained, qualitative Judge-ment should be exercised. in choosing the occupational group the instructionalproi;ram is mainly training for. If for instance only a negligible numberof managers and clerks are being trained. in thie program, it could thenbe related in terms of enrollments and completions to sales workers, n.e.c.or stewardesses as the case may be.
Federally-funded InstructionalProaran
BLS Occupational Category OE Code Title
Sales workers, n.e.c. (8) 04.19 Transportationor
1Stewardesses
Relatini3 average annpaljeb openings to completions in instructional
E:522.1,P. After classifying program offerings by OE cede classificationand relating them to occupational categories, data on average annualjob openings for each occupation as well as data on enrollments andcompletions may be filled in so that ratios of completions to jobopenings could be obtained.
Table 11 summarizes this procedure for one occupation, carpenter.The steps are as follows:
1.) Enter the occupational title;
2.) Record annual job openings for 1970 and 1975 and percentchange (for duration see pp. 58-59);
(8)
62
3.) Enter the appropriate instructional program code and title;
4.) Record enrollments and completions from this program forcurrent_yei
The BLS Convemion Table equates the D.O.T. title group, "280.Salesman..." in the OE Transportation instructional program tothe occupational category, "Sales workers, n.e.c. (not elsewhere
classified)".

5.) State completions in 1970 as a percent of average annualjob openings for 1970;
6.) Identify source(s) of formal occupational preparation otherthan vocational education;
7.) Record total enrollments and completions from these source(s)for current year;
8.) State "other source" completions as percent of openings;
9.) Calculate total completions as a percent of openings.
Illustrative Table 11
Average Annual Job Openings Related to TrainingCompletions from the Public and Private Sector
for the Baltimore SMSA, 1970 and 1975
(1) (2) (3)Average annual Federally-fundedjob openings, instructional grogram
Occupational category 1970 1975 % of change OE Code Title
Carpenters 208 204 -2% 17.1001 Carpentry
(4a) (4b )(5)
Completions as a per-Number of cent of average annual
Enrollments Completions job o enings, 1970Col IT7eol 2)
(6)
Type and source of training,private sector
100 54 26% Apprenticeship program
(7a) (7b) (8) (9) .
Completions from other Total completions (public.undsources as a percent of private) as a percent of
Enrollments Cosa letions annual job 00.1..pings, 1970 annual job epenings.,_1970,Rol 7b :. Col 2y ---061 lib + col 7b .., r.,..01 27--
,
180 170 834 108%
63

AITNIDICES
64

APP2ND1X I
COORDINATIEG STATS AND LOCALVOCATIONAL EDUCATION PLUS
by
Paul Larkin
65
r

BACq1ROUAD
This paper is intended to assist, state planners in relating localplans to the state vocational education pion. It presents some simplemethods for apprairing the reasonableness of 1°061 vocational educationdecisions in light of local menpmer end demographic projections.Implications ore drawn for procedures needed to lacilitate the flow ofplanning information from the state and local to the national level.
This report it on outgrowth of a continuing effort of the NationalKenning Association to identify national goals) estimate their dollarcosts) end indicate the menp..ler needed to achieve objectives. One pasteffort explored the impliections of netional goals for planning prioritiesin vocational education. The present paper is part of a more recentstudy) under a Grant from the Bureau of Research of the U. S. Office ofEducation, devoted to the developnent of a planning guide for vocationaleducation at the local level end is also bcsed in part on observationsand experience associated with earlier efforts.
Documents revieged in preparing this pap?r include planning documentsof more than three-fifths of the states, many local plans and theirnumerous supporting documents) ene, scholarly analytical studies concernedwith vocational prozera planning. Informntion also WAS obtained frominformation users and developers in research coordinating units) citysyste:As) end comaunity college offices of institutional research andstate level people responsible for vocational education planning.
66

A. OVER MW
The Vocational Education Amendments of 1968 provide for a kind ofplenning that nks statistical information concerning students withprojected job opportunities in the five-year future. Questions ariseconcerning the compatibility of data e,erived from a variety of souces,the various ways that data con be 1:1w:coned and analyzes: for planningpurposes, and the wealth of ways that percentages and ratios can be usedto express planning relationships all of which contribute to the problemsof coordinating local information at the state level.
The problems of coordinating local planning information will notbe the same for all typos of data. In the discussion which follows,occupational outlook information will be seen to involve centralizedsources of projections, with communication problems between the makersof projections on the one hand and the users of projections on the otherposing some of the key difficulties of coordination. Manpower supplyinformation, however, will be seen to suffer from a dearth of systematicobservations rAde at the local level. Demographic and socio-economicstatistics will be seen to involve a jungle of different sources, oftenresulting in a hodgepodge of disparate information to be reconciled formailing and morth.
From this picture we have drawn conclusions and recommendationseonterning further federal and state Luidelines necessary for the coor-dination of local planning infornatiol. Frocedures 'should be providedfor routine annual business meetings between local planners of vocationalprogrems and employment security officers who are the source of locallyrelevant manpower projections. Kenpower supply estimates should begathered annually on a local basis. And finally, coordination of tartetinformation must be accomplished if state plans are to be fulfilled inthe aggregate at the local level, the practical level of programimplementation.
67

n. savitplum OF TH2 DATA COORDINATION PRO=
As a result of the program pIenntng requirement of the VocationalEducation Amendvents of 19G0, all state vocational education agencicamust now coordinate end analyze new kinds of quant;tative informationinCLuding data outside the moil domain of education. Beginning in fiscalyear 1971 federal regulations will require that each state plan includean application form to be used by local education agencies requestingfederal funds. These loeal awlications must:
1. Describe the programs end activities for which federal fundsare requested;
2. Give eviclence thai; sxisting manpower supply resources ere beingconsiderce;
3. Show how the vocational programs proposed will prepare individ-duals for careers;
I. Present a five-year plan, compatible with the two-year projectionsof U4P8*, reflectins the vocational needs of local students,and;
5. Relate prograq information to the locia objectiws identified.
Incorporating local. Information into the state plan is now, therefore,a more complex task than ever.
This paper describes the problems the stAte agencies face if they aregoing to integrate quantified local planning inforott;on ulth the stateplop for vocational education. Techniques are discussad for eppraisirgthe reLsoMOleness of manpower and dexographie projections in the localplans, end f(4. translating these projections in the local plans into
indicators for educational planning. We shall also consider state andlocal target-setting, the pressures for more inforAtion and not informationand new information within the state's %veational education system, andthe woblems involved in coordinating intra -state target objectives forspecial categories of students such as the disadvantaged.
Severa rounds of planning experience to date indicate considerablevariety in local plea submissions, within the limits of federal regulations.
.1.1111%.......010 11 11111.
* Cooperative Arca 141lip4Ver Planning Systfll,

one state, for example, has a coAprthensive system for determiningoccupati.mel supply and demand for each locality relYeving the localeducation agencies of this responsibility. Both employers and non-public sources of training arc surveyed annuelly, insuring accurate andup-to-date information. An iretediatoly tdjoining state, however, onlymakes the estimate of local occupational opportunity. Each locality isrequired to submit the basic manpower supply information needed for thestate plan. In many states, howevel', even general estimates of manpowersupply are omiUed by the local agencies and in most states little orno information, is reported on manpower supply from the proprietaryschools.
Variations in local objectives, assumptions, definitions, sourcesof information used, and values assigned to the EGMO projecticms bydifferent sources are some of the problems which may affect statecoordination of local information. The sections which follow will discusssuch problems in detail.
A review of local application forms contained in state plans revealsprogram planning information that can be classified into three majorcategories: occupational demand and manpower Supply, deo6raphic andsocio-economic data, and instructional program data. It will be convenientto discuss the coordinating of state and local planning information in termsof these major information categories.
69

C. COORDIVATIN STATI; A1.0 MCAJ, PLA1011110 111FOMATIO11
Dcand Inforwation. A state's occupational outlook information is usuallycenUaNy coorWacd, most often by the ttate department of employmentsecurity. Special, studies Ly public ogencies, outaide consultants, orlocal banks or Chambers of Commerce have also been occasional Sources ofdata on future oc,:upational demand. The federally supported employmentservice frequently makes annual projections of occupationtq demands. TheVocational Education tmendments of n68 envisioned an expanded role forthe state and local employment services in identifying occupational out-look. An increasingly strong national federation of state informationsystems it forseceblo in the decade o2 the seventies.
To be useful for vocational education planning, however, projectedjob oprortunities data must be specific enough to malt translation intothe United States Office of Education standard instructional program code.*In many states this is n; difficult. Certain localities, for exemple,continue to report job opportunities in the old general catecories, suchas "Trades and Industrial" or "Distributive Occupations." In our largerpopulation centers, however, job opportunities are now Ming projected insufficient occupational detail to permit analysis in terms of i»structionalprogress,. In the first round of Ienning under the '68 Amendments, there (r
vas little uniformity in reporting local job opportunities. Confusionamong the indicators used creeted problems of data coordination. Becauseof crowing state end local cooperation, however, this luck of uniformityis declining. Site 1968, the Labor Department's Manpower Administrationhas continued to refine procedures for annual reporting of state end10cA1 tAXTOWer projections.
Men occupational opportunities Are sufficiently detailed to specifyinstructional programs, data can be translated into information forcoordinated vocational program planning. Lists can be drawn up, forexample, showing which occupations show increasing, constant, or decreasingjob opportunities in A state; end in each of its school district treas.Job categories ttn also be listed shorging critical shortages of trainedworkers.
If a state end any of its subdivisions have relied upon differentsources in projectng job opportunities by occupation, a check is nseetseryto tscertain the conpatibility of the sources, since assumptions andtechniws nAy very. For example, those respottible for drawing up thevocational education Pltn at the state level nay have relied upon state
Alls...16.4111...1111...11a11.41.111011111.116.
* See Vocetionel Education and Occupations, OE-04061, u.s. CoveriintPrinting Office, Washington, D.C., 1%9
73

planning department forecasts drawn up in the mid-1960's, Vaien dependedupon earlier de4a. Projections for one of the state's metropolitanLimas, however, nay have been made more recently, using new techniquesof the Burneu of Lebo: Statistics end involving slightly 4ifferentassumptions. The information in the state report, emphasizing employmentby industry, therefore, nay not be directly comy2areble with the occupationaloutlook reported for a specific metropolitan area. Clearly a more unified,procedure for coordination is needed. State employment service projectionscovering the entire state not just the metropolitan time alone would bea solution.
If state and decal sources of manpower projections differ, tomesimple techniques nay help state people to assess the reasonableness oftha local forecasts. Table 1, adapted from an actual report of a stateemployment service, illustrates the use of the city-to-state ratio tocoordinate state and local occupational outlook in health occupations forthe five -year future. In this example, local projections of occupationalopportunity are compared with the state estimates for the same future yearas a check for compatibility. Projections are listed for eight healthoccupations in a moderately large state and one of its cities. The cityhas a population of about half a million, a little nore than 10 percent ofthe state population. In the projections given in Table 1, however, some-thing closer to 20 percent of the total state eploynent opportunities inthree occupations listed axe rssigned to this one city: dental assistants,nedicel techniciens, and licensed practical nurses. Voreover, whilepsychiatric aides figure as the second highest category for job opportunitiesin the state, ro opportunities in this category are reported for thecity. Translating city projections into percentages of the state totalcan facilitate the identification of such relationsAipa, and suspiciousitems con be checked for reasonableness.
Where state and local data relatiorships seem unusual or out of theordinary, it is proper to ask why. There nay be swe common explanationof discrepancies or anomalies, or each may have its own unique explanation.raciest inquiry will usually reveal goat euswers. In the case of the healthoccupations shown in Table 1, there ray be A concentration or dental asassistants and taedical technicians in the city because of the densityof service facilities there, end the high deband for licensed practicalnurses nay °cent because of a high density of urban nursing hones. Thefailure to list opportunities for psychiatric aides, however, is probablya reporting problem. Data ray never have been collected for thisoccupation on the basis of simple inertia, or because it had never yetbeen identified separately by the enploptent service and reported as enoccupational opportunity to vocational educators.
71

TAM:, -
tbe city to state ratio of job opportunities to assess the reasonableness of local
five-year ,r%reetions (Teed:: for health services prcr7ortionatc to the population is taker
to be c. critarion. ho city holds about one-tenth the pos.ulation of the state.)
Five-year
Five-year
OCCUPATION
State Projection
City 7rojeca.pn
assistant
:4edical
exsistant
edical technician
rurses' aide
narse, licensed practice.
:arse, practical
Orderly
Ratio of
City Projection
to State Projection
Convent
125
25
.20
Zxceerls erpectee
vclue. S!:toult-: bc
100
IS
.15
enc.eked.
90
15
neck for
easonableness.
475
35
.07
565
110
r"eck
rcas2nablewass.
350
30
.09
310
20
.06
:,ycchiatrie aide
465
.00
Omittel.i. (no projection given)
SOURCE:
Annua1 report of the :tate employment service.
VD

Suuply Information. Intimately connected with occupational demand projec-tions is the forecasting of changes in the new supply of skilled manpowerat the state and local levels. In most states the supply of skilled man-power trained in proprietary schools) business and industry) or otherprivate sources is not being systematically monitored, However, statelicensing of proprietary tchools nay offer an opportunity to obtainsuch data in the future. Mile periodic surveys arc generally conductedamong employers, often on a yearly basis, to determine industry's needsfor manpower in places of ony considerable popalation density, no counter-part effort in usually made on the supply side. Lack of observations orestimates locally results in a lock of factually based estimates at thestate level.
Currently) dependable estimates of future manpower supply tend tobe limited to public local, state or federal sourcea of job preparation.In most instances, however, the reporting of historical data from eventhe public sector cannot be called adequate. Manpower supply in thereforea critical area of information need in the vocational program planningsystem.
Relationships between projected occupalAonal demand and state andlocal manpower supply are brought out by the illustrative data on Table 2.It is Assumed that information from public sources is the only inforrAtionnavailably. Ratios of state supply and city supply to projected demandarc used to bring out planning information relationships. The state andcity are the same ones used in Table 1. in the exanple, a problemarises In the case of thn practical nurse category. Here the statesupply 3,s listed at over 100 percent of denand, and the city supply isover n0 percent of demand. It nay be, hd:ever, thr% the practical nursecategory is being used as t catch-all for classifying mny orsonsexpected to beccie nurse's aides or assittants, licensed .precticel nurses,pysehtatrie aides, end workers in other occupations related to health
discipliner. Defore any decision is rAde, therefore, it would benecessary to determine the exect occupations included in this category.
Five-year projections of mnpower supply by occupational categorynay be classified as target projections, and will be discussed under thisheading in t later section. At this point, however, it it important tocgAnsi2e that planning coordination nust be establisMi on a firm basis,throji up-to-date knowledge of manpower supply for a given occupation.hvcn if costs, priorities, or other considerat3ons proMbit :immediatedevelopment of a full- fledged system for anticipating occupational supply,
cenerel estitzatto (110014 be obtained when the local plen is preistcd.planning technician in the state capAal will not be able to tontectoil the roJrces of renIver supply in the state, but the local
73

Using ratios
demand 1:n
available.
,^COUTA.1707
Dental asst.
Medical lab asst.
Medical tech.
IlUrse' aide
"arse, lic. prat..
NUrse, practical
Orderly
Psychiatric aide
7.41.7.7,7 2
of current public vocational training supply to projected oc=ational
7f:calth ee=uratiens establish th^ r.:-.a::enablcness of m7npo'her su7=ly inforration
Pro:ectood
Current supply
aatio of state
Pro,jected
.w.^:..-...d 4"
in the state
pUblic sully
demand in
ter.
State
from pUblic sources
to projected de-pnds
the city
Cur--ent forecast
of sup?.'- in the
city 'row sublic
sources
un:e_%.- to
demand
projected
125
100
4s
25
.38
.25
2512 3
.8 .20
90
.01
15
475,
8o.17
35
565
30.05
110
350
487
.1.39
30-2
13.
2.65
310
135
.44
20'_
7.8
5
MO
O.00
11.70TZ:
Adapted :ran a recent annual report of a state c=1,-ployment service.
Demand is based here on the EMployment Service unfilled openings appro
includes secondary, post-secondary, and adult programs in the regul
together with the results of other sources
training such as MD TA
available concerning results of private sources of training such as
acn, and manpower supply
Al= vocational education system,
prcgrams.
Data were
proprietary senools.
not

planner rhould find it possIble to contact the major sources in his eunlocal area.
Figure:1 derived from general estimates, however, should not betreated the same as actual count figures. Estimates will help establishreasonablcness of local targets with reference to the total supplysituation but they cannot be unthinkingly aggregated as a reliableversion of the state picture.
Democaphk: Information. Information concerning future students and theircomunitiea Fa-ps determine the type and scope of alternative programofferings for the five-year future. Secondary enrollees of five yearsfrom now have already been in school for some time, and we can describetheir numbers, ethnic and geographic origin, levels of family income anddegree of handicap if any. %e can also Generalize about communitiesthrough the 1130 of indicators such es juvenile delinquency rates andhigh school dropout rates. In addition to basic information concerningpopa)ation ego, sex, and ethnic group, a number of other indicatorsere used in local plans to specify terget groups. Some examples ofindicators used are number of low inco:ie families (or children of lowincome Pamilies), number of handicapped, dropout rates, unWoymentrttes end juvenile delinquency rates. !my one of these indicators mayentail information problems.
Census counts are a major source of demographic information forvocational progrem planning purposes. In addition to information on schoolenrollments and years of school completed) census reports provideinformation on a number of other variables: birth. Id death rates)migration patterns, measures of family stability, employment status)nativity and parentage, occupational distributions,%ncome, populationchanges, urban-rural differences, age and sex differences) distributionof population subgroups, and long-term historical trends,.
With the passage of time following the decennial Census, it becomesincreasingly necessary to use a number of other more recent sources ofdata describing the population. The reliability of information aboutstate and local residents can vary considerably) depending upon differencesin source, purpose, recency and data base. Table 3 Larstrates fourestimates of the 1975 population of a sctple city made in the late 1960's.Al?. accepted the date of the 1960 Census as a starting point. A stateplanning eepartment, relying upon projected natural popalation .increaseand net migration) forecast a city population of over 94E,000 in 1975.The most recent aiailable avidence used in this study was from the mid-1960's) and the objective as to forecast economy end labor force as abasis for state policy decisions. Three later studies relied on
75
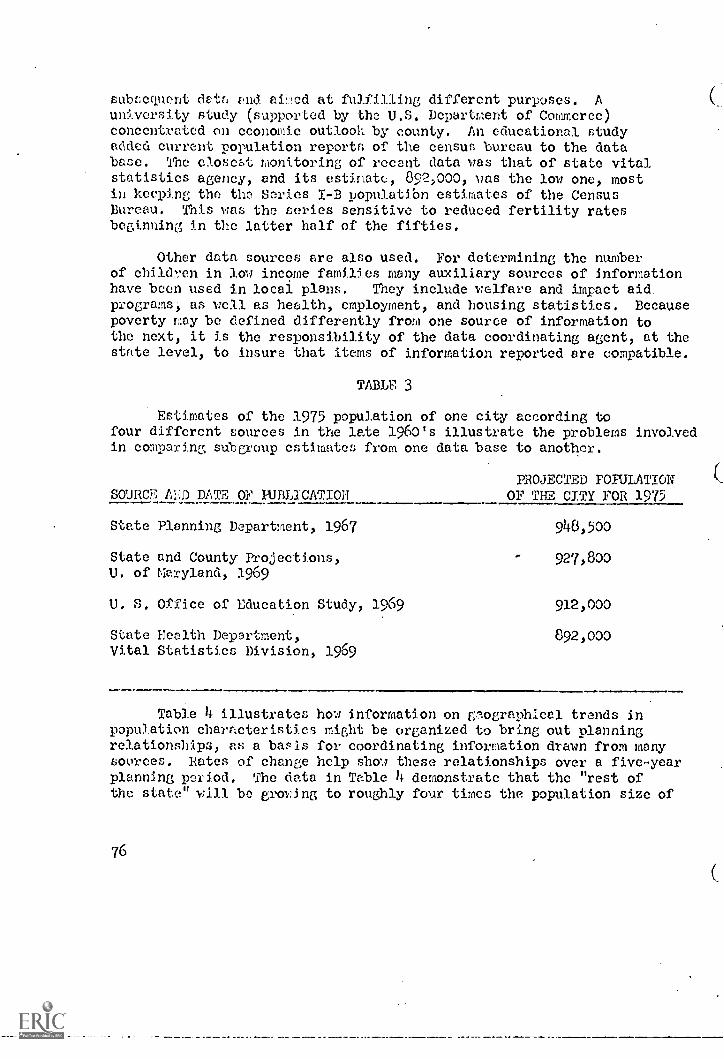
subsequent data and aimed at fulfilling different purposes. Auniversity study (supported by the U.S. Department of Commerce)concentrated on economic outloolL by county. An educational studyadded current population reports of the census bureau to the database. The closest monitoring of recent data was that of state vitalstatistics agency, and its estimate, 892,000, vas the low one, mostin keeping the the Series I-B populatibn estl,nates of the CensusBureau. This was the series sensitive to reduced fertility ratesbeginning in the latter half of the fifties.
Other data sources are also used. For determining the numberof children in low income families many auxiliary sources of informationhave been used in local plans. They include welfare and impact aidprograms, as well as health, employment, and housing statistics. Becausepoverty nay be defined differently from one source of information tothe next, it is the responsibility of the data coordinating agent, at thesuite level, to insure that items of information reported are compatible.
TABLE 3
Estimates of the 1975 population of one city according tofour different sources in the late 1960's illustrate the problems involvedin comparing subgroup estimates from one data base to another.
PROJECTED POPULATIONSOURCE AID DATE OF PUBLICATION OF THE CITY FOR 1975
State Planning Department, 1967 948,500
State and County Projections, 927,800U. of Maryland, 1969
U. S. OP ice of Education Study, 1969 912,000
State Health Department, 892,000Vital Statistics Division, 1969
Table 4 illustrates how information on gnographical trends inpopulation characteristics might be organized to bring out planningrelationships, as a basis for coordinating information drawn from manysources. Rates of change help show these relationships over a five-yearplanning period. The data in Table 4 demonstrate that the "rest ofthe state" will be grming to roughly four times the population size of
76

'the semple city in a five-year interval. The city population is seen tobe relatively static. While the total state shows notable gains inselected population age groups of special interest for vocational plenning,the city tends to show stability or decline. This implies that the "restof the state" may have more flexibility in planning and in developing newresponses to expanding demand for occupational education. Program changesin the city will tend to reflect replacement of old programs, or areordering of program priorities within a relatively constant total. Thesome pie in the city must he cat different ways, while the expandingpie in the rest of the state permits more chances to start new thingsafresh.
TABLE 4
POPULATION CHARACTERISTICSPercentage Change,
1960 1970 1:975 1970-1975
General. PopulationState Total 3,100,689 3,969,200 4,528,000 14.0;City 939,024 928,800 927,800 -0.1
Source:
Percent of Populationin Selected Age Groups
C. Harris,University
1960
Jr., State and County PI' ojeetions,
of Maryland, 196TPercentage Change,
1970 1975 1970-1975 .11....
State:
15-19 279,000 361,000 412,00.0 14.0%20-44 1,070,000 1,310,000 1,585,000 20.9
City:
15-19 65,000 81,000 83,000 2.2
20-44 309,000 276,000 283,000 2.5
Source: State Plenning Department, The Population ofthe State, 1967 and C. Harris, Jr., State andCounty i rojections, University of Maryland, 1969.
77
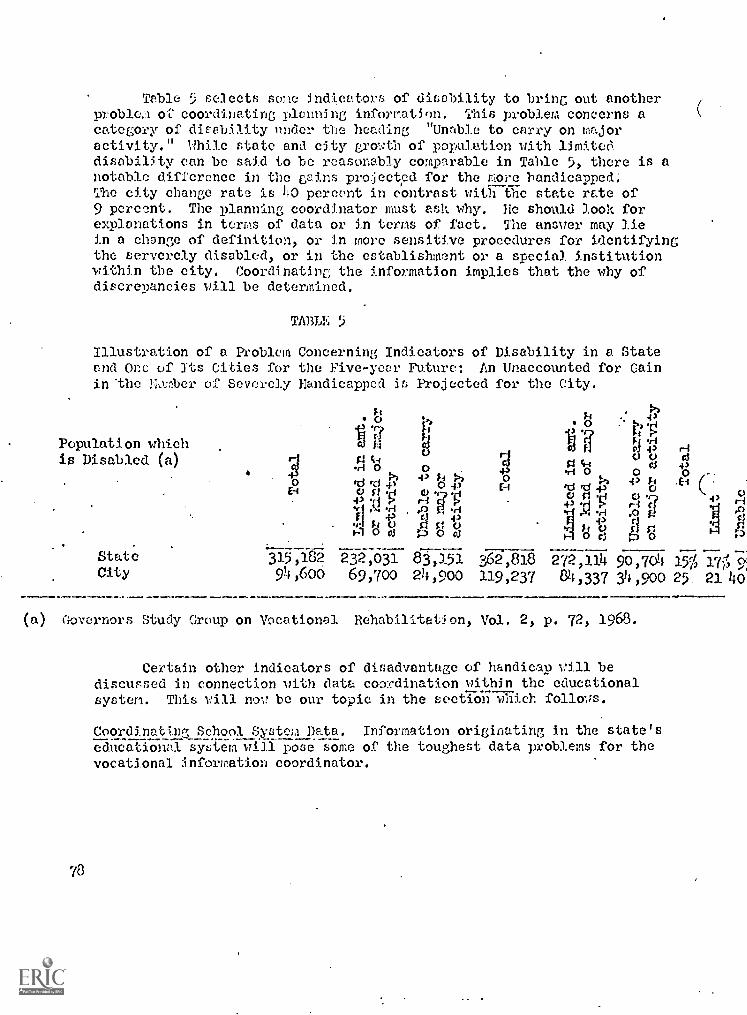
Table 5 selects some indicators of disability to bring out anotherproblem coordinating planning information. This problem concerns acategory of disability nnder the heading "Unable to carry on majoractivity." While state anti city growth of population with limited,disability can be said to be reasonably comparable in Table 5, there is anotable difference in the gains projected for the more handicapped.The city change rate is 110 percent in contrast with the state rate of9 percent. The planning coordinator must ask why. He should look forexplanations in terms of data or in terms of fact. The answer may liein a change of definition, or in more sensitive procedures for identifyingthe serverely disabled, or in the establishment or a special institutionwithin the city. Coordinating the information implies that the why ofdiscrepancies will be determined.
TABLE 1.)
Illustration of a Problem Concerning Indicators of Disability in a Stateand Onc of Its Cities for the Five-year Future: An Unaccounted for Cainin the floA)er of Severely Handicapped if, Projected for the City.
Population whichis Disabled (a)
t C. F/01 T1
civ d
,A o 043 0 ri 0 d 430
0 rd id +5 0 43 EA rd 43 1.4 (0
11 14 0 0., 0. .64 HA V .2 I 4.S1
/ 4 I-1 slNq-ko 00V 4) 0
OdcS
odState 315,182 232,031 8K151 362,818 272,114 90,7 15% 17% 9;City 94,600 69,700 24,900 119,237 84,337 34,900 25 21 4o
(a) Governors Study Group on Vocational. Rehabilitation, Vol. 2, p. 72, 1968.
Certain other indicators of disadvantage of handicap will bediscussed in connection with data cooy:dination within the educationalsystem. This will now be our topic in the section which follows.
Coordinating School System Data. Information originating in the state'seducational system will pose some of the toughest data problems for thevocational information coordinator.
78

For the sake of emphasizing these outstanding problem areas) we willstructure our present discussion around data on poor and handicappedstudents, and selected program completions data designed to supporttarget projections. Target projections themselves will be discussed later.It is recognized that many other variables could have been introduced toillustrate data coordination needed within the school system, beyond thoseselected in this presentation. The principles of evaluation are similar,however, to those we apply here.
A kind of observation frequently heard from vocational educators isthat "we have been serving the disadvantaged student for years, but wehave never had to identify them. I probably have fifty disadvantagedstudents in my classes right now. But I can't tell you which studentsthey are." This raises the question of indicators) or how you designspecial programs for students you can't identify.
When leadership to provide for human needs emanates from the federaland the state level to the local level where programs are implemented, thebias is strong to identify student needs within statistical categories ofdisadvantage. Infinitely tore promising, however, is that approachwhereby local agents understand that they have a mandate, and feel freeto begin with the numbers and types of individual students who are "notsucceeding" in regular programs. The school dropout, the unemployedyouth, and the juvenile delinquent and the low achiever are examples ofthose not succeeding. These descriptors can become indicators, togetherwith items in the student's school record which predict school withdrawal,unemployment, and juvenile delinquency. Such indicators should be pulledtogether in planning local programs for the disadvantaged, not excludingan important type of predictor often neglected in recent years: thepaper and pencil test of aptitude and achievement.
Table 6 illustrates the use of ratios for the assessment of stateand local relationships concerning the enrollment of disadvantaged studentsin vocational programs. When the data of a major city are related to thestate data for a current year, the city effort can be seen as a proportionof the state effort within instructional programs. Special efforts for thedisadvantaged are expressed as a function of instructional programs.Severel specific occupations are presented for illustration in Table 6.The table shows that cooperative end work-study programs are beingutiiived to train the city's disadvantaged students. Within the occupationsselected as examples, the disadvantaged are being prepared as auto mechanicsbut not as medical and dente). technicians. The city claims about a thirdof the state's total enrollment in cooperative programs; and about two-thirds of its enrollment, in work-study programs. Relationships like this
79
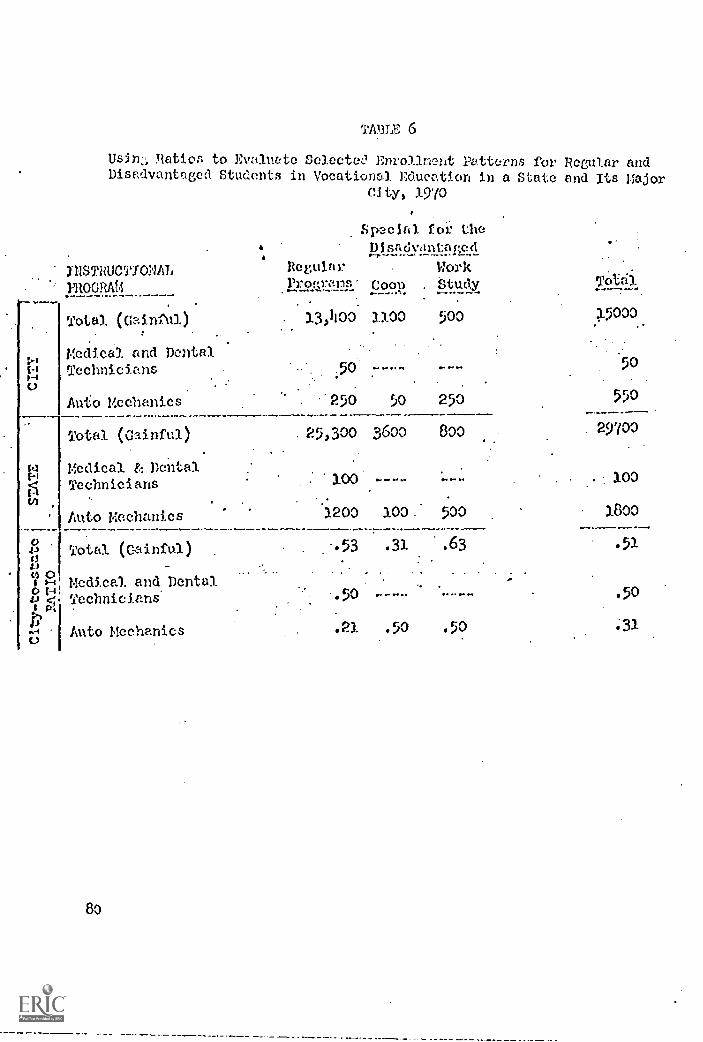
TABLE 6
Usin;, Ration to Evaluate Seleetez? Enrollnant Patterns for Recular andDisadvantaged. Students in Vocational. Education in a State and Its Vajor
City, 1970
YNSTRUCTfONAL
Total (Gainful).
Medical and Dental.
Technicians
Auto Mechanics
Total (Gainful)
F Medical & DentalI'l6 Techniciansm.
Auto Mechanics
J1 Total (Gainful)o0J-,(GO
Ft ,0...
I '-',
,
Medical and Dental.
J-1i Technicians1
Auto Mechanics
80
Special for the
Disadvantaped
Regular WorkPro;;Yan. Coop . Study.
13,00 1.100 500
50 "--- --"
YPtrA.
?5000.
50
'250 50 250 550
. 25,300 3600 800 29700
1001 ....." """.
100
1200 100 : 500 1800
-.53 .31 -.63 .51
.
'.50 -_"" ....."" .50
.21 .50 .50.31

'permit the intonation coo-xdinator to assess the meaning of the data heis receiving from the city for policy implications within the totalstate program.
Percentages ray also be used to contrast the city and state patternsof enrollment of the disadvantaged as a, percent of the whole (regular anddisadvantaged combined.) This can be done for the total vocationaleducation effort and for each occupational category. The entries inTable 6 do not appear to demonstrate inconsistency or incompatibility,ea about the mac percentase of special effort for the disadvantaged isseen in the city and the state as a whole.
Typically, the information-gathering resources available to vocationaleducators are tot yet up to the challenge of proCucing uniformly acceptabledata for identifying disadvantaged vocational students. One approachobtains program enrollment information from all students, beginning atthe junior high school level, thus providing the necessary data forplanning. Another solution relies upon advertising and the sign-up process,so that only students menifesting a need are reedited. If such solutionsare attempted, for program planning and budgeting purposes descriptorslike "poverty" should be more and more specifically defined from the nationalthrough the state to the local level. I!oreover, requests for informationfrom the local planning agent should be accompanied by advice, standardizeddefinitions of terms and resources enabling him to gather the informationhe must report.
The strategic position of state departments of vocational educationmakes them responsible for coordinating information on state and localinstructional programs. It is up to them to provide the technical assistancenecessary for effective program planning on a stateVide basis. This impliesappropriate record-keeping procedures, reporting forms, and timetables fordata collecton, as well as the guidance and training of lOcal schoolpersonnel through conferences, written guidelines, and direct assistanceas needed.
It would be foolish to draw up a comprehensive list of items ofinformation that would apply in the same way to vocational programplanning in every state.
However, enrollments and completione data by occupational programare at the heart of program planning for vocational education. Logically,reports of training completions by occupational category are the minimminformation elements necessary for effective communication and programmanagement. It is more common, however, for enrollments to be reportedrather than completions vhen only one of these two reporting categories
81

'is used. If there can be established a clear relationship betweenenrollments end completions estilAates of current occupational supplyfrom public vote-Lionel education con be made. nut this is a stop-gap measure. Where completions ere not now being reported by occupationalcategory, their reporting should be initiated promptly, and a beginningshould be made in collecting placement,and follow-up information.
Information on enrollments end c-mpletions gill generally showsome degree internal consistency within a given school system, ifstandards and practices are uniform from one school to the next. Thisis not necessarily the case, however, as we move from secondary to post-secondary levels of education. Community colleges, with strong programsof occupational education developing independently of vocationaleducation at the secondary level, represent a segment of state and localvocational training which in most instances has not evolved into an inte-grated element of the state's total vocational education effort, or beenincorporated in their reporting procedures.
This concludes the section on coordinating school system informationfor vocational education planning at the state and local level. We willnow turn our attention to the way information is used to establish priorityalternatives, and ultimately program priori:ties, within the state.
82

D. COORDINATIM TMETS
Coordinating state and local targets is an aspect of p3anning thatcan easily be overlooked. The assumption may be made that local agenciesplan independently, but a state appeel,for practical nurses, for example,could bring a local response that oversupplies the need and does a dis-service to the students. Because of the importance of coordinatingtarget information so that state plans will be practical as yell asrational, special attention must be paid to the cumulation of local plansinto the state plan.
The information analyst at the state level can be aided by the useof ratios to coordinate targets of a major locality and the remainder ofthe state. This type of information relationship is illustrated for oneoccupation, medical and dental technicians, in Table 7, In this example,the city to state ratio of opportunities and training completions is seento be held constant for target projections in the five year future. The
city thus maintains its effort in relationship to state totals. In 1975,this city's public vocational education program will continue to graduatethree medical or dental technicians of every ten in the state, as in 1970,as the "demand" also remains relatively constant. Where a city has con-centrations of a certain industry, steel or electronics, for example, thereasonableness of certain ratio entries will be apparent.
The utility of the ratio method is in its ability to reveal majorpatterns of change in activities concerned with occupational programs.Major changes can be evaluated for their reasonableness and theircompatibility with what is happening elsewhere in the state. If, forexample, the city effort in Table 7 had shifted froth threetenths ofthe state target completions for medical and dental technicians, thequestion of decentralization of effort could be raised to help establishalternative targets.
yuch information crucial for effective planning is in the form ofnumerical data, but projecting realistic future possibilities alsodemands considerable critical judgement. Targets can be reasonablyexpected to demonstrate sound logic, and it should be possible toexplain why some particular number or percentage was chosen as a targetrather then any other. But extreme precision is not to be expected,because projections are estimates.
In practice, the planner can be reasonably asked why he projects atarget change in enrollments of the handicapped from 5 percent to 10 percentin some program, rather than to 20 percent, but not why he doesn't make
83

USING RATIOS
T.A7.23
7
'M COORDINATE CITY.= STATE TARGET PROJECTIONS FOR
PUBLIC VOCATIONAL EDUCATION' PROGRAM COMPLETIONS
OE Program'
Actual Job Openings
Projected Job Opening and
Code
Occupation
and Completions for 1970
Completions for 1975
.
07.01°3
TechnicianS
:Job
!Estimated Job
Target ..
.Comment on
Medical, and Openings
Commletionz
!Openings
Completions
Target Projection
Dental
CITY:
25
280
70
Increase percent od.'
200
completions from 12.5%
to 25% of job openings
.
STATE:
in response ..o opport,..rai
670
83
940
.
233
xisintains current eity,t
state ratio of occupac...ic:
RATIO:
Proeam-ccmpletions.
City to
State:.
.30
.
.30
.30
.30

it 11 percent or 9 percent. Perhaps the best reasons for target-settingwill result from discussions with the people rho will have to operatethe program. Their estimates can be taken to be good indicators of thatis fea6ible, and good management practice will not exclude them fromtarget setting.
Occupationally-related courses of instruction meeting student needsthrough appropriate programs are at the heart of the Vocational EducationAmendments of 1963. Table 8 shows how information on target populationssuch as the disadvantaged can be laid out to permit coordination of co-relative target programs, This procedure can help rationalize thepattern of program development intended for a state and one of its citiesin the five-year future. Although this form of laying out information isuseful for other purposes as well, we rill focus on what it brings outconcerning enrollments of the disadvantaged as a percent;:ge of the totalcity and state effort by occupational. category, The listing of enrollmentsof disadvantaged as a percent of the city and the state program byoccupation, health techWeians and auto mechanics are useful examples,shows that the state and local target enrollments are not unreasonableor incompatible with each other, Modest increases of the disadvantagedcan be seen proportionately in the total program and in the auto mechanicsprogram. Notice that the five-year targets do not provide for medicaland dental technician training for the disadvantaged. Discussion of thispossibility as an option may result from such an observation.
Target coordination between the state plan and the aggregate oflocal plans'must also be considered. IV the efforts described in thestate target projections are not implemented in the aggregate of localefforts, they will not be implemented at all. The meal efforts neednot all be a reflection of the projected state efforts in a uniformmanner. That would be most unusual, and most artificial, But the localefforts must be such that on the average, or more specifically in theaggregate, they must approximate the state plan provisions in such awe.y as to validate the information reforted on targets in the state plan.
In many states, targets reported to the state agency by the localplanning agency are now coordinated for neither instructional programsnor special subgroups of the population. This implies a fiduciaryapproach on the part of the state agent to local plan submissions. In
other states, however, selected targets are checked in the annual plan.Vocational services projected for low-income family students provide anexample of an item which might be singled out for review. A plannerinterviewed in one state in connection with this report stated that therural poor in his state needed so much by way of vocational education
85
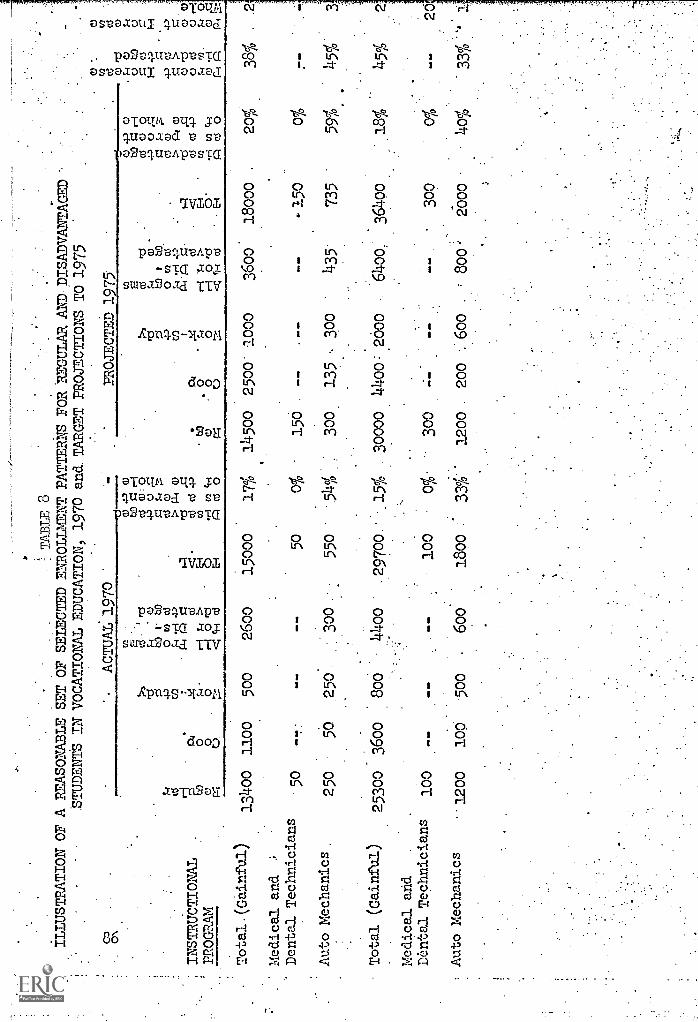
TABLE 8
ILLUSTRATION OF A REASONABLE SET OF SELECTED ENROLLMENT PATTERNS FOR *REGULAR AID
DISADVANTAGED
.STUDENTS IN VOCATIONAL
ED
UC
AT
ION
, 197
0 an
d. T
AR
GE
T P
RO
JEC
TIO
NS
TO
1975
INST
RU
CT
ION
AL
'PR
OG
RA
M
Tot
al.(
Gai
nful
)
Med
ical
and
Den
tal T
echn
icia
ns
Aut
o M
echa
nics
AC
TU
AL1970
O
V
..ag
'R
:iF-
t0
Zbi
11'
40
M(.
1 er
l P 0
PO
oP .
o.
.--1
o r
d.o
.,-ci
--. 0
PRO
JEC
TE
D1975.
6.
rao'
wo
40w
at.
Ari o,d
a
3.31
100
5o
25o
50
250
300
1100
500
2600
Total (Gainful)
25300
3600
Coo
Med
ical
and
Den
tal T
echn
icia
ns
Aut
o M
echa
nics
100
15000
17%
5o
0%
-
55o
.540/0
1010
0. 2
9700
.15
%
100
0%.
1200
100
500
600
1800:
33%
14500
15o
300
30000
300
1200
2500' 000
.w. 135 , 300
/4.400:.2000
MO
S.
.200
600
.
3600
435
6400:
Coo
18000
.
150
735
36400
309
2000
20%
o%
59%
18% 0%
40%
38%
45%.
14-5%
33%
.
20

services that no coordination of planning information was needed. Justthe services in whatever abundance vas available. This position representsa "greatest need" approach, but does not answer the question, how muchis being clone? Another state has a program planning division thatsystematically rationalizes local target-setting.
The results of these efforts must be scrutinized annually. Programplanning is intended to be a cycle, and not a onc,1 and for all event.This means that feedback mechanisms must operate, if decision makers areto be alert to the communication resources available in PPD. Informativefeedback should characterize vocational education at every state ofmanagement as the year progresses, both in the annual evaluation ofplans and performance as they develop and in the broader evaluation ofthe longer-term effort over a period such as five or ten years.
87

E. ca;oimx.c3 /U1) Rrcu,!:4-1.TDATICTS
The cucceenful fvnctioring of the pregrva planning and budgetingapproe.ch required by the 1.956 Ar;:endeents depends vpon the infomationnoving fray local data sources to the state capital, and to Vashingtonand back again. The syetem mast be ceel*tent. Much of the skepticismor reluetF:nce to rely vpon p,annng inforoation fro: the disorderatteched to a mountain of niscellaneoue bits and pieces of uncriticallyused data. The systea rw :t be useful, end increasingly specific as thegeographic area referred to is h:ore tightly defined. Flexibility mustbe built in, co that informtion vey flee, in the seva volume, tom andconfiguraien appe.opriete to save, different types of user, frog theprogram administrutor to the vocational counselor.
The state inforeeatIon coordinator 'lust understand that one of thechief Ivobleris of inforretion gathering for the local planner ie theidentificatiol or students not succeeding in regular progreus. Statisticaldescriptions of people in a locality are sufficient to identify wite-spread vocational education needs, or special problems in cities anddepressed rural areas.
The follatirj remeelendations are svggeoted by the vaterial inthis chapter, Lna be. ve;efol for officials considering the furtherdevelopment of federal and state guidelines for planning:
1. State level coordihators of inforration should evaluate local targetprojections to deteIvine their eolyatibility with the state plan,and should see if the aggregete infortion of local planning targetsreported for the state will be tutstantially equivalent to local aimsin the eggregate. State coordinetors should be able to use oinplemethods, such na ratios end eggretAte differences, to evaluate thereastnableness of local target infonration.
2. Guidelines on the uce of oetupational,outloOk inforbation withinthe state sheuld fcature cooperation with the state departbent oferployment security because of that agency's inforieation resources,as well as the Cooperative ...ma VenpoPAer Plannihg System (CAM). Such
cooperative efforts should also include the state education department'reecuree for tLe ditseiination of vocational guidan,.:e andcoumeling inforaation.

3. ost stater, need a thoroughgoing system for projecting manpover supplyby occupation in the five-year future. As matte:s now stand, evengeneral estimates are regularly lecking as to the .supply of trainedmanpower that can be anticipated from non-public sources of trainingwithin rost of the fifty states.
4. Local planners need more knowledge and training in the use of demographicinformation for long-range vocational education planning. Ilot only shouldlocal planners have some general sense of the assumptions, methodology,recency, end valve of these projections. They should also be ableto use percentage distributions and percentage chenge comparisons aspart of their routine reporting that translates data into usefulplanning information.
5. School system information is the area of guidelines for coordinatingvocational education planning in most urgent need of attention byfederal and state administrators. Files describing student characteristicsrelevant to programs need to be most specific at the school and districtlevel, with decreasing specificity at the state and federal level. It
should be abuniently clear locally which disadvantaged and handicappedstudents are riot succeeding in regular programs, end how they areidentified. State departments of vocational education should alsobe receiving from local agencies a clear communication of full-timeequivalent instructional courses by occupational category, end thecurrent year's enrollment and completions data indicating the numberof regular and special-category students enrolled or graduating.
6. Comaunity colleges and post-secondary technical'institutes should besingled out for development of more effective reporting of infor.nationessential for coordinated planning and evaulatie_ln. Job and careeroriented completions should be reported unambiguously.
7. Target-setting should focus on students, end relate individual studentneeds and capacities to occupations and careers through the medium ofprograms. The student identified as being a^rdemicelLy disadventaged, forexample, can be given the opportunity and supportive services to becomean auto mechanic through the L:ediun of a work-study program, if thatoutcome suits his individual abilitf.es end interests. For informationpurposes in the planning process, target enrollments and completionsshould be listed as explicit nu-abers, distinguishing instructionalprograms and relating them to participating students by target type.
89

8. Reporting forms themselves.can 113hC it impossible for informationcoordinators at the state level to relate local data on one variableto another variable. Designers of forms for local Beta submissionsshould be careful to require the kind of information they need forstate-level program management, such as the identification by typeof students not succeeding in regular programs, and information onhow they are assigned by instructional code categories to specialprograms such as work-study progreqs. Designers of forms shouldavoid the kind of column and row headings that split studentinformation and progrcn information, permitting you to tellseporctely the nu: ber of local disadvantaged by typo and the numberof enrollees in instructional program, but not the count of thedisadvantaged within 3nstructionsl programs.
90

APPEUDIX IX
AiirOTAT2D }3I111,)0G1tANY
An Act to .Amend the Voeetonel Education Act of 1963L and for Othco}irgoees., Co/IL:rens, SeneCes, 90175 Vc;ncii.17; 2dITasion, 192.
As a ma4or legislative milestone in vocational education, thisAct necks the improvenent end strengthening of vocational educationprograms at all levels. The ocationel education planner is thusshewn through a series of new requirements and procedures, how totailor his training progrems more closely to needs of distinct groupsin the population i.e. disadvantaged, handicapped end how to utilizemanpower and demographic infornIalen in planning more flexible programsfor state end local areas. In &citation, provisions arc made forprofessional grooth and development of teaching and administrativepersonnel and the encouragement of exploratory programs and nowteaching r:othois.
Kotz, Arnold, ca., Occupational Education: Plan ing and Programeigl,Stanford Renearch Institute, California, September 1967. Volumes I-IV.
Provides significant insights into planning and programming invocational education by bringing the reader up to date on conceptsand techniques followed by vocational education planners instateand local areas throughout the country. Papers on specific aspectsof planning and decision-making presented by economists and edmin-istratore during a national conference on planning are also included,together with recoratendations on which procedures within theseaspects are particularly feasible for federal, state or local levels.
Lecht, Leonard A., renpover reeds for retienal Coals in the 1973's, FrederickA. Prneger, Inc., rev York, 19.9.
Offers the concept of national goals analysis as a framework in whichto relate the nation's resources to its aspirations. Proceedingupon the assumption that the United States will continue to pursue itscurrent activities in sixteen definable goal areas, it demonstrateshow the pursuit of these activities will correspondingly affectmanpo-eer requirements and employment opportunities in the 1970's. It
shows the contained probable doller costs and human resources require-ments for each particular goal, indicating that not all goals ray beinplemented at the sena tine and that planning on the basis of setpriorities is vital. Its importance to the ple.nner therefeeelies in the guidelines it provides for setting nationol prioritiesin program planning, showing what coals when pursued are highemploy.lent grmth areas.
Kethods end Stretegies for State Men Developeent in Accordance with the Provisionsof Vocational Edveation Ametnente a W. A aemary taper PresentedIrthe rational alini.enee on State Plana Sponsored by the U.S. Officeof Education, Covington, Kentucky, Earth t4-27,
This report summarizes the proceedings of a national conference held
91

on the developlent of state plans, It analyzes the implicationsof the X963 Vocational Education Act Amendmerts for cducetionel plan-ning with appropriate cox:lents given on state plen guides and planningprocedures folloecd by vericls states. Short discussions of delegates'reactions to the fve working papers dealing with all aspects of programplanning and evalmtion are also included.
Occunetional Outlook Yandok, 1963-1969, U.S. Department of Labor, Bureau ofLaloorITAKTra, Washington, D.C. 1968.
Describes all types of occupations'in the United States accordingto their education, health or skill requirements, duties and respon-sibilities and current employment trends. This information is gceredto the use of individuals interested in the relationship between labormarket trend"; and training opportunities, i.e. guidance counselors andeducational planne-2s. Estimates of projected job openings are generallyprovided for the 1970's.
A coxpanion periodical, the Occupational Outlook Quarterly, updatescareer inforeation presented in the biennial Hnneibook, ena offers awealth of articles on current developments end changes effectingoccupations. A second related publication, ';1-le Occupational OutlookReport Series MACS available Handbook infornation on specific careerfields in brief reprints.
Priorities in Vocational-Technical Education end rational Goat in the 1970's,Vetional Plenning Association, Washington, D.C., 1970, Volute I andII(Reports I-VI).
This report is one of continuing research efforts in the study ofnational goals end the ronpover requirements needed to achieve themin the 1970's. Implications for vocational education have been drawnfrom a close assessment of how the vleorous pursuit or specific goalsnay affect nanpower requirenents in related occupations and the typeof training needed to prepare individuals for these occupations. Sixadditional reports, tvaileble separately, attenpt to measire in greaterdetail the impact of assigning a high priority to specific goals,forexample, health, education and social welfare, upon related occupationaleaployileg. Consequently priorities for plenning and programing invocational-technical education have been set within these coal Si eas.These reports are: (1) Career Openings in health Occupations; (2) Vol
professional Occupations in Education, (3) Career OpeningA in SocialYenkre; (4) CarLer OpportaUties in the Construction Crafts; (5) Jot
Opportunities in Transportation; (6) Education for Technician Careers.
"Social and l',:npv.7er Environmmts of Vocational Education," General tepe11 ofof the Advitory Council on Vocational. Educationx. 1958, bferce or EctIC-ation, U.S. ibapartnent of health, Education and Welfare, Ch. ll, pp. 163 -1f32.
Identifies current toeio-eeonosic issues and forces of chanGe withinthe labor force as they relate to vocation education end presents newdinesions for wrapover training in the light of their implications.It CmphCSJa.CS the need for a more systeratic eaproach that:would coor-
92

dinnte vocational educotion proi,,rams in 01 levels of trainlvs suchDS general education, vocational education, mvpover development,adult education, and on-thl-job training, where vlentional educationincreasingly ossurns a major rale in skill development. A specialsection is devoted to an ancaysis of federal manpower policies andprogt'u in the 190's and develops a design vhich incorparates civonalternative approaches to the problem of coordinuting federal, stateand local effort in manpower training.
Venn, Grant, "the Vocational Education Amendments of 1963," Arf:ericon
Education, Doccer 1963-January 199.
Briefly and concisely delineates the importance of the 1963 Voc-ational Anendments and explains its nev directions as an aid toplanning strenger, tore flexible voce Lionel education pogxems,si;rese.ng that these proves are now designed for individualsand groups instead of occupational groupings. A summary of the
hialichts or the Act, Title I ova II, including salient provisionsand requirements of each section, follows the analysis.
93