Embed Size (px)
Citation preview

ED 037 491
AUTHORTITLF
INSTITUTIONPUB DATENOTE
EDRS PRICEDESCRIPTORS
IDENTIFIERS
DOCUMENT RESUME
OD 009 556
Cox, Arlie E.; And OthersTitle I in Ohio: Third Annual Evaluation of Title I(ESEA) , Fiscal Year 1968Ohio State Dept. of Education, Columbus.Apr 6Q58p.
EDRS Price MF-$0.50 HC-$3.00Communication Skills, *Compensatory Education,*Disadvantaged Youth, Elementary School Students,*Federal Programs, Health Education, HealthServices, Job Skills, Participant Characteristics,Preschool Education, *Program Effectiveness, ProgramEvaluation, Program Improvement, Pupil PersonnelServices, Secondary School Students, SpecialEducation, Teacher Education*Elementary Secondary Education Act Title I Program,ESEA Title I Programs, Ohio
ABSTRACTThis report evaluates the participation of nearly
all public school districts in Ohio in ESEA Title I programs. Theevaluation aims to provide a basis for determining whether programsare to be modified, intensified or shifted in terms of objectives andactivities. The report focuses on: the size, scope and effectivenessof all Title I programs; data and observations on eight primaryinstructional service areas, or program categories; communicationsskills, the area involving the most students and the most money;mathematics/science area; and, data on preschool education, pupilpersonnel services, health education/services, arts and humanities,vocational skills, and special education. The major findings arethat: many participants are improving their academic abilities; theattitude and motivation of many participants for doing school-typeactivities have reportedly improved; programs concentrated in theelementary grades (particularly grades 1-3) are more often successfulthan those spread from K-12; and, that when teachers and teacheraides are provided in-depth inservice training, a program is likelyto have a positive impact. Recommendations based on these findingsare also included. For Title I evaluation in Ohio during fiscal year1968, see ED 016 705. (RJ)

Third Annual Evaluation of Title I
(Elementary and Secondary Education Act)
Fiscal Year 1968
U.S. DEPARTMENT OF HEALTH. EDUCATION t WELFARE
OFFICE OF EDUCATION
THIS DOCUMENT HAS SEEN REPRODUCED EXACTLY AS RECEIVED FROM THE
PERSON OR ORGANIZATION ORIGINATING 11. POINTS OF VIEW OR OPINIONS
STATED DO NOT NECESSARILY OMSK" OFFICIAL OFFICE OF EDUCATION
POSITION OR POLICY.
0 9 5 5 6E.-
TITLE I IN OHIO
ARLIE E. COX, Section Chief, Basic Programs
LOUIS C. VILD, Educational Consultant
EILEEN YOUNG, Educational Consultant
MARTIN W. ESSEXSuperintendent of Public Instruction
HAROLD J. BOWERSDeputy Superintendent of Public Instruction
R. A. HORN, DirectorDivision of Federal Assistance
State of OhioDepartment of Education
3201 Alberta Streetqcs Columbus, Ohio 43204
April, 1969

4.PREFACE
/41CD Federal guidelines for Title I of the Elementary and Secondary
Education Act of 1965 require that programs be evaluated annually--
UJ at local, state, and federal levels. In compliance with guidelines,the Basic Programs Section of the Division of Federal Assistanceprepared evaluation instruments, had them completed by local evalu-ators, and composited the data so that a state-level evaluationreport could be made available to the U.S. Office of Education, localadministrators, and other persons interested in Title I in Ohio.
Purpose of Title I Evaluation
The purpose of Title I evaluation is to provide a sound basisfor determining whether programs are to be modified, intensified, orshifted in terms of objectives and activities. Evaluation is essen-tial to secure quantitative and qualitative evidence to ascertainthe impact of Title I on disadvantaged youth. Broad, general concerns,such as these, must be broken into specific questions for which man-ageable evaluation units can be framed. Examples of basic units are:"Have participants improved significantly in their reading ability?"or "Have participants' attitudes toward education improved?" Thesequestions must be answered for each local situation to which they areapplicable. Answers can then be composited into manageable state-leveldata. Specific questions, however, such as cause-and-effect relation-ships or the effect of the presence or absence of particular variables,cannot, as yet, be answered statewide.
Data Collection
The state evaluation instrument was sent to each school districtthat operated a Title I program during fiscal year 1968--i.e., duringthe 1967-68 school year or the summer that followed. At the time thisreport was compiled, 97% ofall evaluation instruments had been returnedand were sufficiently complete to be used in compiling data.
Whenever possible, the source of financial information was fromestimated expenditure reports, which were 100% complete and which areamong the official financial records of the districts and of the state.
Application forms were used to project the report information ontotal numbers of participants from 97% to 100%. In all other instances,the 97% was considered sufficiently complete for reporting purposes.
Report Organization
Chapter I relates to the overall aspects of Title I programmingin Ohio during fiscal year 1968.
Chapters II through IV present data and observations on eight primaryinstructional and service areas, or program categories. Chapter II dealswith communication skills, the area involving the most students and themost money. Chapter III treats the mathematics/science area. Chapter IVpresents data on the six remaining areas, all of which were limited inthe number of students served and the amount of funds expended.
Chapter V is a concise listing of conclusions and recommendations.

CONTENTS
Chapter Page
I. TITLE I IN OHIO--FISCAL YEAR 1968 1
Basic Data. Participants--Their Educational Needs.Participants--Social Pattern and Physical HandicapHindrances. Participants--Grade Range Patterns.Participants--Non-Public Involvement. Participants- -Non- Public Students' Activities. Primary Instructionaland Service Areas--Definition. Primary Instructional andService Areas--District Implementation Patterns. PrimaryInstructional and Service Areas--Participation Patterns.Expenditure Patterns. Staffing Patterns. InserviceTraining. Parent Involvement. Title I Effectiveness- -Overview. Title I Effectiveness--Generalized Successes.Title I Effectiveness--Reported Hindrances. Title IEffectiveness--Elements of Successful Programs. Title IEffectiveness--Objective and Subjective Evaluation.Title I Effectiveness -- Dropout Prevention. Title IEffectiveness--Continuing Education.
II. COMMUNICATION SKILLSBasic Data. Participants. Core and Supportive ActivitiesTechniques, Procedures, and Resources. ExpenditurePatterns. Staffing Patterns. Effectiveness of Communi-cation Skills Areas. Year-to-Year Involvement.
III. MATHEMATICS AND/OR SCIENCE SKILLSBasic Data. Participants. Core and Supportive ActivitiesTechniques, Procedures, and Resources. ExpenditurePatterns. Staffing Patterns. Effectiveness of Mathe-matics/Science Areas. Year-to-Year Involvement.
IV. OTHER PRIMARY INSTRUCTIONAL AND SERVICE AREASBasic Data. Participants. Core and Supportive ActivitiesExpenditure Patterns. Preschool Education. Basic Data.Observations and Other Data. Pupil Personnel Services.Basic Data. Observations and Other Data. Health Education/Services. Basic Data. Observations and Other Data. Artsand Humanities. Basic Data. Observations and Other Data.Vocational Skills. Basic Data. Observations and OtherData. Special Education. Basic Data. Observations andOther Data. Staffing Patterns.
21
33
45
V. CONCLUSIONS AND RECOMMENDATIONS 57
Conclusions. Recommendations.

CHAPTER I
TITLE I IN OHIO--FISCAL YEAR 1968
Through provisions of the Elementary and Secondary Education Actof 1965, federal grants are available for educational programs foreducationally disadvantaged students who live in areas of high concen-trations of children from low-income families. By nature of the fundingformula, nearly all public school districts in Ohio qualify for funds.
Districts wishing to implement projects must--in accordance withexisting federal and state guidelines--identify attendance areas to beserved, determine the educational needs of children living in these areas,plan instructional and service activities to meet these needs, make appli-cation to the state for project approval and funding, implement projects,maintain fiscal records, and evaluate results of what happened to theselected children.
This chapter focuses on the size, scope, and effectiveness of allTitle I programming that occurred in Ohio during fiscal year 1968.
Basic Data
Ohio school district participation
Districts having Title I projects 629Percent of Ohio districts having projects . 92%Funded projects in fiscal year 1968 668
Scheduling patterns by number of districts
Regular term scheduling only 220Summer term scheduling only 188Both regular and summer term scheduling . . 221
Primary Instructional and/or Service Areas
Implemented during the regular term 618Implemented during the summer term 588Total primary areas 1,206
Student participation
Public school participants 198,908Non-public school participants 11,248Total participants 210,156
Estimated expenditures for Title I programming
Regular term expenditures $22,317,618Summer term expenditures $ 9,833,393Total fiscal year 1968 expenditures $32,17)1,011
1

Participants--Their Educational Needs
As a part of developing a Title I program, each school districtis required to analyze the educational needs of all school-age young-sters residing in its target area. After the most pressing educa-tional needs are identified, the district is tollesign a Title Iprogram with these needs in mind and select participants most needfulof the instruction and services to be provided.
After program activities have been completed, evaluators are askedto list the most pressing educational needs of the children actuallyparticipating in each primary area. Based on a compositing of fiscalyear 1968 data, the most pressing educational needs of project parti-cipants, by grade range, are presented in the table below.
TABLE 1. MOST PRESSING EDUCATIONAL NEEDS OF TITLE I PARTICIPANTS,BY GRADE RANGE
RankOrderof Need
Grades1-3
Grades4-6
Grades7-9
1
Increase ability tounderstand oral orwritten language(input)
Improve work-studyskills
Increase feeling ofsuccess in theschool setting
2
Increase feeling ofsuccess in theschool setting
Increase ability tounderstand oral orwritten language(input)
Improve work-studyskills
3
Increase ability tocommunicate by meansof oral or writtenlanguage (output)
Increase ability toIncrease feeling of understand oral orsuccess in the written languageschool setting (input)
4 Lengthen attentionspan
Increase ability to Increase ability tocommunicate by means communicate by meansof oral or written of oral or writtenlanguage (output) language (output)
5 Improve work-studyskills
Improve self image Improve self image
2

Participants--Social Pattern and Physical Handicap Hindrances
Students involved in Title I project activities frequently exhibit
social patterns or have physical handicaps that may have contributed to
their educationally disadvantagement,
Social pattern hindrances were reported nearly twice as frequentlyas physical handicaps. Based on a count, duplicated by the numbers oftimes a particular child was involved in more than one primary instruc-
tional or service area, the three most frequently reported social pattern
hindrances were, in rank order:
(1) Cultural values that interfere with school progre3s
(2) Discipline problems(3) Poor attendance, truancy, unexcused absences
Based on the type of count described above, the four physical handi-
cap hindrances reported most frequently were, in rank order:
(1) Speech difficulties(2) Slow-l.arners (50-80 I.Q.)(3) Visual problems(4) Auditory problems
Participants--Grade Range Patterns
The table below shows the percentages of children from different
grade ranges participating in Title I during fiscal years 1966, 1967,
and 1968. Patterns that seem to be emerging include:
The number of children being served each year is decreasing (due in
large part to decreased funding and to an emphasis upon greater
concentration of services).
Two out of three participants during fiscal year 1968 were from
grades 1-6.
The percentage of students from grades 1-3 over the past three
fiscal years has increased from 27% to 32%.
TABLE 2. PERCENTAGES OF TITLE I PARTICIPANTS BY GRADE RANGE FOR
FISCAL YEARS 1966, 1967, AND 1968
Percentages by Grade Range
FiscalYear Participants PreK-K 1-3 4-6 7-9 10-12
1966 223,354 7% 27% 41% 18% 6%
1967 214,825 7 29 42 17 5
1968 210,156 7 32 37 18 6
3

Participants--Non-Public Involvement
As stated previously, districts are required to analyze the edu-cational needs of all school-age youngsters residing in their targetareas and to offer Title I services to the selected youngsters havingthe greatest need for the instruction and services being offered.Whether a particular youngster is enrolled in public or non-publicschool makes no difference, so long as he resides in the target areaand his priority of educational need qualifies him for program parti-cipation. The basis for this type of non-public participation is the"child-benefit" part of the authorizing legislation.
Ohio districts are required to make a sincere effort to involveeligible non-public studens. In fiscal year 1968, over 250 of the629 participating districts enrolled 11,248 non-public students ineither regular or summer term Title I activity areas. The relativelylow number of districts enrolling non-public students should be putin perspective with the following in mind:
Many districts are in small communities or sparsely populatedareas where students cannot conveniently attend non-public schools.
Many non-public students living in large and me:Wm-size citiesdo not reside in target areas, and, therefore, do not qualify forprogram participation.
Procedures used in fiscal year 1968 by public school administra-tors to stimulate working relationships with non-public school offi-cials and to involve eligible students in project activities were, inrank order according to times reported:
(1) Telephone contacts(2) Personal contacts(3) Close cooperation exists;
no need to stimulate involvement(4) Written contacts
In a question related to resources (not necessarily ones pro-vided through Title I) shared by public schools with non-publicschools, the three ranked most important were:
(1) Non-public pupils enrolled in classestaught by public-school teachers inpublic buildings
(2) Educational specialists sent tonon-public schools to work withchildren
(3) Arrangements in connection withconferences, libraries; testing,counseling, health services, etc.
4

Even though, in most cases, both public and non-public officialswere interested in involving qualified students, certain types of
problems caused difficulties. The four ranked most troublesome were:
(1) Scheduling(2) Transportation(3) Communication(4) Attendance area
differences
As can be seen in the table below, the proportions of public andnon-public students participating in Title I have decreased by about 2%
in three years of program operation. Reasons for the decrease include:
Smaller target areas and fewer qualified buildings--affectingboth public and non-public participation.
Greater concentrations of instruction and services on studentswith higher priorities of need.
A trend toward more regular term scheduling, which sometimesincreases the problems of scheduling eligible non-public students.
TABLE 3. NUMBERS AND PERCENTAGES Or: PUBLIC AND NON-PUBLIC PARTICI-PANTS FOR FISCAL YEARS 1966, 1967, AND 1968
Title I Participants
Public Non-Public
TotalParticipants
FiscalYear
Number Percent Number Percent
1966
1967
1968
207,606
200,965
198,908
93%
94
95
15,748
13,860
11,248
7%
6
5
223,354
214,825
210,156

Participants--Non-Public Students' Activities
The 11,248 non-public participants in Title I programs duringfiscal year 1968 most frequently participated in four of the eightprimary instructional or service areas. Reported numbers of non-public participants by grade range for these areas are included inthe table below. Even on a duplicated basis, a total of less than700 non-public students were involved in all four remaining primaryareas--preschool education, arts and humanities, vocational skills,and special education.
TABLE 4. NON-PUBLIC PARTICIPANTS BY PRIMARY INSTRUCTIONAL ORSERVICE AREAS OF MOST FREQUENT INVOLVEMENT AND BYGRADE RANGE
GradeCommunication
SkillsMathematics/
Science
PupilPersonnelServices
HealthEducation/Services
RangeRegularTerm
SummerTerm
RegularTerm
SummerTerm
RegularTerm
Summer
Term
Regular
Term
Summer
Term
1-3 1,932 1,656 12 674 236 52 178 60
4-6 2,655 2,091 92 710 307 81 108 70
7-9 772 494 85 163 140 50 251 60
10-12 176 15 3 9 30 1 48
Total 5,535 4,256 189 1,550 692 213 538 238
Dupli-catedTotal
9,791 1,739 905 776
6

Primary Instructional and Service Areas--Definition
Inherent to the Ohio evaluation plan was the classification oflocally planned program activities into units called "Primary Instruc-tional and/or Service Areas."
By definition, a primary area is "an essentially separate segmentof educational programming which operates independently of other instruc-tional or service segments within a project."
Each primary segment of Title I programming had to be classifiedunder one of the following primary,areas:
Communication Skills
Mathematics and/or Science
Preschool Education
Pupil Personnel Services
Health Education/Services
Arts and Humanities
Vocational Skills
Special Education
Each primary area could have multiple core activities, which incombination, comprise general objectives of the area. Core activitypossibilities were outlined in the data collection instrument instruc-tions and are included here on page 8.
Supportive activities were considered activities or services con-ducted for the purpose of contributing to the effectiveness of each core
activity, which in turn, contributed to the effectiveness of the primary
area. Core activities for one area could be associated with other areas
as supportive activities. For example, in a communication skills area,"remedial/correctional reading" was classified as a core activity, but,
in a vocational skills area, "remedial/correctional reading" was a sup-
portive activity.
All core and supportive activities were to relate to the primary
instructional or service area, and, furthermore, were expected directly
or indirectly to add to its effectiveness. Each child participated in
core or supportive activities, as required by his particular needs.However, by the above definition of primary area, each child in sup-
portive activities had to be a participant within the primary area.
Structural interrelationships within a typical Title I program are
illustrated in Figure 1. The circle represents the program--the totalTitle I activities conducted by the district during any one fiscal year.
The semicircles denote primary areas, each with separate general objec-
tives and core activities. Supportive activities can contribute to the
effectiveness of one or all primary areas.
7

CORE AND SUPPORTIVE ACTIVITIES
Communication SkillsLanguage arts (basic communication skills,
grammar, writing, spelling)Developmental reading (general)Remedial/correctional readingReading readinessEnglish as a second languageSpeech (non-therapeutic speech
improvement or development)Library useStudy skillsOther communication activities
Mathematics/ScienceMathematics/science (general)MathematicsPhysical sciencesSocial sciencesEconomicsOther mathematics/science activities
Preschool EducationPre-kindergartenSummer kindergartenRegular kindergartenHeadstart follow-up
Pupil Personnel ServicesPsychological servicesPsychiatric servicesSchool social work (including
home-school visiting)Attendance serviceIndividual counseling by counselor
or psychologistGroup counseling by counselor or psychologistGuidance services (general) by counselorGuidance related services by teacherElementary guidanceEfforts to reduce dropoutsEfforts to improve attitude/motivationEfforts to improve emotional/social healthEfforts to improve self conceptExtracurricular and socially oriented school
activitiesPupil-personnel related services for parents
Health Education/ServicesPhysical development (motor coordination)Physical recreation activitiesHealth educationVisual health servicesDental health servicesMedical health servicesSchool nurse programOther health education/service activities
Arts and HumanitiesArts and humanities (general)Fine art (general)Arts craftsMusic, appreciationMusic, instrumentalMusic, vocalDramaLiteratur eOther art / humanities activities
Vocational SkillsBusiness educationIndustrial artsVocational awareness/orientationWork studyHome economicsChild care/developmentOther vocational activities
Special educationSlow learners (50-80 IQ)Speech and hearing therapyEmotionally disturbedNeurologically impairedDeaf--hard of hearingOther special education activities
Additional Supportive ActivitiesStaff visitations to other schoolsConferences/workshops for project staffProject provides for staff to attend university classesUniversity staff used as consultants for staff
developmentLocal administrators conduct project staff developmentIncrease of professional library for project staffProvision of food, fees, and clothing (general)Food services (breakfast, lunch, other)Community education/public relationsOther supportive service activities (general)

PROGRAM
and/orS
wiNIP
Supportive
Activit ies I
SupportiveActivities
CORE
ACTIVITIES
Supportive
Activities
Supportive
Activities
CORE
ACTIVITIES
ructional and/0
4;.Supportive
Activities
Supportive
Activities
FIGURE 1. STRUCTURAL INTERRELATIONSHIPS WITHIN A TYPICAL TITLE I PROGRAM
Primar Instructional and Service Areas--District Im lementation Patterns
Of the 629 participating Ohio districts, 441 had regular term program-ming and 409 had summer term programming. During one or both of theseterms the average district implemented a total of two primary areas. As
can be seen in the table on the following page, most districts havingprogramming in the respective terms had a communication skills primary area.During the regular term, the second most prevalent primary area was "healtheducation/services." In the summer term, "mathematics/science" rankedsecond.
9

TABLE 5. APPROXIMATE PERCENTAGES OF DISTRICTS IMPLEMENTING THE VARIOUSPRIMARY INSTRUCTIONAL AND SERVICE AREAS
Primary AreaRegular Term: Percent Summer Term: Percent
of 441 Districts of 409 Districts
Communication skills 950 90%
Mathematics/science 6 22
Preschool education 2 4
Pupil personnel services 9 5
Health education/services 11 9
Arts and humanities 4 6
Vocational skills 6 6
Special education 4 1
Primary Instructional and Service Areas -- Participation Patterns
Numbers of youngsters participating in each primary instructional or
service areas are reported in the table below. Observations include:
. 47% of all Title I participants in Ohio during fiscal year 1968 wereinvolved in regular term communication skills areas; 37% were in
summer term communication skills areas.
On an average, one of every two Title I participants was involved in
two primary areas.
TABLE 6. REPORTED REGULAR AND SUMMER TERM PARTICIPANTS IN EACH OF THE
PRIMARY INSTRUCTIONAL AND SERVICE AREAS
Primary AreaRegular TermParticipants
Communication skills
Mathematics/science
Preschool education
Pupil personnel services
Health education/services
Arts and humanities
Vocational skills
Special education
Duplicated Total
97,818
11,821
7,227
18,359
27,972
23,499
3,216
1,958
191,870
10
Summer TermParticipants
77,743
40,405
1,821
5,552
7,098
4,280
1,189
1,481
139,569

Imuli.ture Patterns
Based on estimated expenditure reports submitted after fiscalyear 1968 projects were completed, a total of $32,151,011 was expen-ded or encumbered by Ohio school districts for the 668 projects.
Expenditure patterns by primary instructional and service areasare illustrated in the following figure. Table 7 compares expendi-tures for fiscal years 1967 and 1968.
Special education 2%
Vocational education 20/0 Communication skills 65%Arts and humanities 2%
Health education services 4%
Pupil personnel services 6%
Preschool education 8%
Mathematics science 11%
FIGURE 2. REPORTED EXPENDITURE PATTERNS BY PRIMARY INSTRUCTIONAL ANDSERVICE AREAS
TABLE 7. COMPARISON OF APPROXIMATE EXPENDITURES BY PRIMARY INSTRUC-TIONAL AND SERVICE AREAS FOR FISCAL YEARS 1967 AND 1968
FiscalYear
Millions of Dollars Expended,
c.-1 oC) r4
4.)
0 mo um
f"4 = $.4 13 0 RI =0 0 0 in 0 In V r4 = 0.c + U .0 till!) RIC -4ffi r40 '410 r4 04 0)(,) ci3 4 .r4 4.) r4 C 4J MIn 0 "r4 > r". > in RI RI 0o = 0.$4 m$4 4ag u=$1 :3 Z C) ..1.2 i:I) $4 = 0 TS0. 0 C. in git .0 > 0
TotalCo
r".03 *4-1
r4 M0 0ozP. VV) 0
$4C)a:4.)0
1967 19.3 3.1 2.1 0.6 1.1 1.1 0.7 0.5 3.9 32.4
1968 20.9 3.4 1.4 1.8 1.4 0.7 0.7 0.6 MIR MIR 32.2
11

In the table below, expenditures are broken into three very generalcategories--staff development, which included salaries, employee benefits,and inservice training; equipment and supplies; and, all other costs.
TABLE 8. APPROXIMATE EXPENDITURE PATTERNS WITHIN THE VARIOUS PRIMARYINSTRUCTIONAL AND SERVICE AREAS
Expenditures byMillions of
Dollars
ExpenditureCategory
Staff development
Equipment and supplies 1.9 .3 .1
Other
Total
Primary Instru
- =0 00-C MM UW14'0
W
16.6 2.7 2.4
2.4 .4 .2
20.9 3.4 2.7
ctional and Service Areas
1.5
.1
.2
1.8
1.1
.1
.2
1.4
.6
.1
--
0.7
.4
.1
.2
0.7
.5
deb OM
.1
0.6
25.8
2.7
3.7
32.2
Title I activities may be conducted during the regular term, duringthe summer term, or both the regular and summer terms. The opinion ofthe Ohio Department of Education Title I staff is that regular term pro-grams are more beneficial to the educationally disadvantaged than short
summer term programs. As can be noted in the table below, the percentagesof funds expended for Title I programming reflects continuing emphasisby both state and local administrators upon more comprehensive effortsduring the regular term.
TABLE 9. REPORTED TITLE I EXPENDITURES DURING THE REGULAR TERM ANDSUMMER TERM FOR FISCAL YEARS 1966, 1967, AND 1963
Regular Term Summer TermFiscal Estimated
Year Amount Percent Amount Percent
1966 $12,955,933 38 $21,138,628 62 $34,094,561
1967 19,518,315 60 12,845,536 40 32,363,851
1968 22,317,618 69 9,833,393 31 32,151,011
12

Staffing Patterns
The number of teachers employed to instruct Title I participants
during the regular term, the summer term, or both, was 6,417. As can
be seen in the table below, 75% of the teachers were considered full-
time employees.
TABLE 10. TITLE I TEACHERS, CLASSIFIED BY FULL-TIME AND PART-TIME
EMPLOYMENT
Category Number Percent
Full-time
Part-time
Total
4,843
1,574
6,417
75%
25
100
Background on the teaching experiences and training of Title I
teachers indicate that nearly all the teachers had previous class-
room experience. Many of them also had experience teaching the
disadvantaged or had special skills training.
TABLE 11. TITLE I TEACHERS ACCORDING TO TEACHING EXPERIENCE AND
SPECIAL TRAINING
BackgroundDescriptors
Percent of Title ITeachers HavingThis Background
Number of Teachers
General TeachingExperience
92.10 5,908
Experience inTeaching theDisadvantaged
30.1 1,932
Special Skills orTraining, as inRemedial Reading
. -
26.6 1,710
Special Trainingto Teach theDisadvantaged
9.0 579
13

Information on overall staffing patterns was collected separatelyfor regular and summer term employment. Numbers arc, however, dupli-cated to an undetermined extent. For example, in the table below, theduplicated number of teachers is 10,642 contrasted with the 6,417 un-duplicated number of -..eachers reported in a previous table.
TABLE 12. DUPLICATED NUMBERS OF PROFESSIONAL AND NON-PROFESSIONALPERSONS EMPLOYED UNDER TITLE I TO CONDUCT PRIMARY AREAACTIVITIES
Job Classification(s
Regular TermEmployees
Summer TermEmployees
Employees inFiscal Year 1968
Full-
timePart-time
Full-time
Part-time
Full-
timePart-time
Total
Teachers 1,353 1,401 4,682 3,206 6,035 4,607 10,642
Teacher aides . . . 910 481 2,036 635 2,946 1,116 4,062
Administrators,principals . . . 95 347 463 404 558 751 1,309
Counselors 83 127 148 195 231 322 553
Psychologists . . 11 64 38 40 49 104 153
Nurses, physicians,dentists 76 171 59 137 135 308 443
Librarians 12 39 113 189 125 228 353
Librarian aides . . 72 41 134 129 206 170 376
Social workers, homevisitors, atten-dance workers . . 82 43 49 30 131 73 204
Speech therapists. 6 28 47 46 53 74 127
Clerks, secretaries,cooks, bus drivers,others 223 397 660 2,254 883 2,651 3,534
TOTAL 2,923 3,139 8,429 7,265 11,352 10,404 21,756
In addition to persons paid with Title I funds, an undeterminednumber of persons were paid with local funds and approximately 3,500volunteers--about 1,000 being parents of project participants--helpedconduct program activities.
14

1,1
Inservice Training
The two tables below provide information about amounts and types
of inservice training provided to Title I staff members. Note in the
first table that, on an average, regular term staff members received
over twice as much inservice training as summer term members.
TABLE 13. PROFESSIONAL AND NON-PROFESSIONAL TITLE I STAFF MEMBERS
RECEIVING TRAINING DURING THE REGULAR AND SUMMER TERMS
Staff ClassificationRe ular Term Summer Term
Persons Average Hours Persons Average Hours
Professional 4,452 27.6 6,259 11.2
Non-professional 2,079 17.3 3,160 7.0
TABLE 14. REPORTED HOURS SPENT BY PROFESSIONAL AND NON-PROFESSIONAL
TITLE I STAFF MEMBERS IN VARIOUS TYPES OF INSERVICE
TRAINING ACTIVITIES
Type of InserviceTraining
Professionals Non-Professionals
Total Hours:Regular and
Summer Terms
AverageHours PerPerson
Total Hours;Regular and
Summer Terms
AverageHours PerPerson
Local administrationprovided inservicetraining
,-
93,849 10.9 28,944 7.8
Conferences/workshopsprovided for projectstaff
54,580 8.3 15,749
.
5.7
Visitation to otherschools by membersof Title I staff
14,823
.
6.9 1,666 2.5
Staff members providedcollege or universitycourses on campus
6,305 41.9 5,396 14.9
College or universityprofessor(s) pro-vided courses inlocal schools
9,878 23.4 915 5.4
Other 13,927 9.0 4,386 4.8

Parent Involvement
Estimated numbers of participants' parents involved in various
types of Title I activities--other than volunteer work, which was
reported previously--are reported in the table below.
TABLE 15. INVOLVEMENT OF PARTICIPANTS' PARENTS IN TITLE I ACTIVITIES
DURING THE REGULAR AND SUMMER TERMS
Type of ParentInvolvement
Regular Term Summer Term
EstimatedNumbers ofPerson*__
Averagehours
EstimatedNumbers ofPersons
Averagehours
Group meetings toexplain how parentscan help meet student
needs
22,1972 7.8 10,416 1.0
Parental visits toTitle I classrooms
17,753 1.5 20,307 1.2
Group meetings toexplain how Title Ischool activitiesmeet student needs
17,669 1.8 13,449 1.1
Individual conferenceswith project staffpersonnel
33,456 1.0 18,382 0.7
Home visits by socialworkers or homevisitors
24,285 1.5 9,997 0.7
Involvement in Title Iplanning
3,142 3.3 1,547 1.0
.
Estimated unduplicatedcount of parentsinvolved
40,487 40,732
Estimated average hours
per parent7.8 1.7
16

Y
Title I Effectiveness--Overview
To discuss the educational achievements of youngsters enrolledin Title I programs as if Title I operated in a vacuum would bemeaningless. About thirty-five or forty federally funded programsaffect economically deprived children, many of whom are the educa-tionally disadvantaged served by Title I. Untold numbers of stateand local agencies are using varied approaches in attempts to posi-tively influence these same youngsters. As a result of the complexityof forces, cause-and-effect relationships between Title I effortsalone and educational achievement cannot be determined. What can beevaluated, however, is how well Title I participants achieved beyondarbitrary, reasonable expectations. Types of changes, and in somecases measured amounts of change, can be reported. Causes of change,
however, cannot be identified.
Title I Effectiveness--Generalized Successes
When the opinions of local evaluators--stated in narrative form- -were analyzed, the five most frequently mentioned successes connectedwith Title I were, in rank order:
(1) Improved ochievement of participants(2) Improved attitude of participants(3) Improved school-community relationships(4) Improved motivation of participants(5) Increased individual attention provided to participants
Title I Effectiveness--Reported Hindrances
Evaluators were also asked to report major problem areas. The
five mentioned most frequently were, in rank order:
(1) Irregular attendance by participants(2) Scheduling(3) Insufficient funds(4) Lack of school/parent cooperation(5) Shortages of teachers
Title I Effectiveness--Elements of Successful Programs
In an effort to determine what made some Title I programs moresuccessful than others, specific information was collected fromcommunication skills areas reports. Indications are that the moresuccessful communication skills areas had the following characteristics:
Participants in the grade 1 through 6 ranges
Pupil-teacher ratios of less than 10 to 1
Teacher aides, who were provided with in-depth inservice training
Involvement of counselors, psychologists, and other supportivepersonnel
17
Po

Title I Effectiveness--Objective and Subjective Evaluation
Using information from locally completed evaluation data col-
lection instruments, the state-level Title I staff gethered infor-
mation relative to the degree of change that students exhibited in
three primary instructional areas--communication skills, mathematics/
science, and arts and humanities as measured by standardized tests
and subjective evaluative techniques. For reporting purposes, speci-
fic criteria were established so that each child's measured efforts
could be classified in one of three categories--"marked improvement,"
"improvement," or "no significant change." Table 16 has criteria
information and reported percentages of participants in each classi-
fication. More specific information for the respective primary areas
is included in chapters two, three, and four.
TABLE 16. EFFECTIVENESS OF THREE PRIMARY AREAS, AS INDICATED BYDEGREES OF CHANGE MEASURED BY EVALUATIVE TECHNIQUES
PrimaryArea
EvaluativeTechnique
4-4
o
et L
t: g0 4CI C..)
Grade Range
1-3 4-6 7-9 10-12
Communicationskills
Objective(Standard-ized tests)
M*I
N
33%
34
33
34%3234
38%
2834
38%36
26
SubjectiveMI
N
23
5027
3344
23
28
52
20
2843
29
Mathematics/science
Objective(Standard-ized tests)
MI
N
34
27
39
31
32
37
25
17
58
29
32
39
SubjectiveM
N
23
5720
21
56
23
11
73
16
6
88
6
Arts andhumanities
,
Objective(Standard-ized tests)
MI
N
268
66
20
6218
SubjectiveMI
N
4
25
71
7
29
64
12
39
49
25
5817
.
*M-Marked improvement (1.5 or more months gain per month of instruction)
I-Improvement (1.1 to 1.4 months gain per month of instruction)
N-No significant change (1.0 or less month gain per month of instruction)
18

Title I Effectiveness--Dropout Prevention
A dropout is defined as "a studma who leaves a school, for anyreason except death, before graduation or completion of a program ofstudies and without transferring to another school district." Dropoutinformation may eventually provide indications of Title I effectiveness,although cause-effect relationships will always be difficult--if not
impossible--to establish.
In fiscal year 1968, for the first time, dropout information wascollected on a grade-by-grade basis. Reported rates are shown below.
Percent
8-
7
6-
5-
4-
3-
2-
1-
Dropout rates--Title I schoolswith 1/3 or more of their enroll- /ment participating in Title Iactivities
A//
88 III II MO 111 111.
oo.
O/*/ 1 /./ .1
I ..
/..
I Dropout rates- -Title I schools. with less than 1/3 of their enroll-/ ."
. /ment participating in Title I,/ / activities/ ." // e/.. Dropout rates--All non-Title I schools/ ./ °
op..,0:.:.Grade 7 8 9 10 11 12
FIGURE 3. DROPOUT RATES FOR SEVENTH- THROUGH TWELFTH-GRADERS INTITLE I AND NON-TITLE I SCHOOLS
Longitudinal information on dropout rates, without reference tograde level, is presented in the following table. With no speculation
as to reasons, the information does suggest that--using fiscal year 1966
as a baseline--the dropout rate in Title I schools is dropping more con-sistently than the dropout rate in non-Title I schools and that thisrate is the same as the rate for all Ohio secondary schools.
19

TABLE 17. REPORTED DROPOUT RATES IN OHIO SCHOOLS DURING FISCAL YEARS1966, 1967, AND 1968
Fiscal Year Title I Non-Title I All Ohio,Secondary Schools Secondary Schools Secondary Schools
1966 3.4% 2.9% 3.3%
1967 3.2 3.1 3.1
1968 2.9 2.6 2.8
Title I Effectiveness -- Continuing Education
How many high school graduates have been encouraged to continuetheir education as a result of Title I activities? The complexity ofcause-effect relationships negates a "Yes" or "No" answer to thisquestion. What may be indicated is that, during the past three years,some forces--Title I possibly among them--have directly or indirectlyencouraged increasing percentages of graduates in Title I schools topursue some schooling, either technical or academic. In the figurebelow, note the apparent narrowing of the gap between non-Title Igraduates and graduates from Title I schools with one-third or moreof their enrollment participating in Title I.
Percent ofGraduates
50-
45-
40-
35-
Graduates of Non-Title I schools ..0 sr% (1.,,1.10400 ....
011. 411110
0. 11111.1
Graduates of Title I schools withless than 1/3 of their enrollmentparticipating in Title I activities
00Graduates of Title I schools with
.0°. 1/3 or more of their enrollmentparticipating in Title I activities
0S°0
Fiscal year 66 67 68
FIGURE 4. CONTINUING EDUCATION PATTERNS FOR TITLE I AND NON-TITLE I
SCHOOLS
20

CHAPTER II
COMMUNICATION SKILLS
The Primary Instructional and/or Service Area implemented most
frequently was entitled "Communication Skills." By evaluation-
instrument definition, core activities within communication skills
areas were designed to improve the facility of educationally disad-
vantaged youngsters in one or more of the following areas:
Basic communication skills, grammar, writing, and spelling
Developmental, remedial, or correctional reading
Reading readiness
Non-therapeutic speech improvement or speech development
Library use
Study skills
hnglish as a second language
Basic Data
Communication skills areas implemented in
Ohio during fiscal year 1968
Regular term 431
Summer term 373
Approximate percent of Ohio districtsimplementing communication skills areas
Districts with regular termscheduling 95%
Districts with summer termscheduling 90%
Reported participants in communication
skills areas
Regular term participants 97,818
Summer term participants 77,743
Total, including duplication 175,561
Reported expenditures for communication
skills areas
Regular term expenditures $14,073,320
Summer term expenditures $ 5,746,957
Total expenditures $19,820,277
21

Participants
The numbers of participants in regular and summer term Title I
communication skills areas in Ohio during fiscal years 1967 and 1968
are listed in the table below. Observe that in 1968 approximately
25 thousand more students participated in communication skills areas.
By contrast, the total number of students involved in Title I activ-
ities was reduced in 1968 by approximately 5 thousand.
TABLE 18. NUMBER AND GRADE RANGE OF PARTICIPANTS IN REGULAR AND
SUMMER TERM COMMUNICATION SKILLS AREAS DURING FISCAL
YEARS 1967 AND 1968
GradeRange
Regular Term Summer Term
FiscalYear1967
FiscalYear1968
FiscalYear1967
FiscalYear1968
PreK-K 1,134 4,701 1,679 1,737
1-3 27,134 33,383 29,027 28,618
4-6 25,789 35,433 31,407 33,986
7-9 17,524 20,013 10,813 10,533
10-12 4,943 4,288 1,347 2,869
TOTAL 76,524 97,818 74,273 77,743
22

Distribution of project participants within the communication
skills area by grade range and sex is shown in the table below.
Observations about the data include:
The percentage of boys during the regular term clusters around
60% for all grade ranges except pre-kindergarten/kindergarten,
where the percentage was about 50%. This difference illuminates
the need for special emphasis on preventive communication skills
activities for pre-kindergarten and kindergarten boys.
Except for the pre-kindergarten/kindergarten level, the percent-
age of boys participating during the regular term was consistently
higher than the percentage for the summer term. Assuming that
educational needs and bases for participant selection were gen-
erally equivalent during the two terms, boys were apparently less
willing to participate during the summer term. This difference
strengthens the arguments for comprehensive regular term Title I
programming.
TABLE 19. NUMBER AND GRADE RANGE OF PUBLIC SCHOOL PARTICIPANTSBY SEX AND PERCENT OF BOYS IN REGULAR AND SUMMER TERM
COMMUNICATION SKILLS AREAS
GradeRange
Regular Term Summer Term
NumberofBoys
Numberof
Girls
PercentofBoys
NumberofBoys
Numberof
Girls
PercentofBoys
PreK-K 2,354 2,347 50.1 903 834 52.0
1-3 18,622 12,829 59.2 15,322 11,640 56.8
4-6 19,992 12,786 61.0 18,319 13,576 57.4
7-9 11,334 7,907 58.9 5,663 4,376 56.4
10-12 2,494 1,618 60.7 1,494 1,360 52.3
TOTAL 54,796 37,437 59.3 41,701 31,786 56.7
23

Core and Supportive Activities
For evaluation purposes, a communication skills area is an essen-
tially separate segment of educational programming that operates inde-
pendently of other instructional or service segments within a project.
However, multiple core and supportive instructional or service activi-
ties are conducted to contribute to the effectiveness of a primary
area. Title I evaluators could list information for up to seven core
or supportive activities conducted as a part of their regular or summer
term communication skills areas. The following table reports partici-
pants for all core activities and for supportive activities involving
more than 5,000 participants. Observations based on this table include:
Each regular term participant in a communication skills
area was involved in an average of 2.9 core or supportive
activities. This average is the same as in fiscal year 1967.
Each summer term participant was involved in an average
of 4.0 core or supportive activities compared with an
average of 3.4 activities in fiscal year 1967.
Each average participant was involved in more core or
supportive activities during the summer because different
scheduling and staffing factors influenced regular and
summer term operation of primary areas.
The seven core and supportive activities that involved
the most participants during the regular term, listed
in rank order, were:
(1) Remedial/correctional reading
(2) Language arts (communication skills,
grammar, writing, spelling)
(3) Developmental reading(4) Study skills(5) Efforts to improve attitude/motivation
(6) Efforts to improve self concept
(7) Library use
The seven core and supportive activities that involved
the most participants during the summer term, listee
in rank order, were:
(1) Remedial/correctional reading
(2) Language arts (communication skills,
grammar, writing, spelling)
(3) Study skills(4) Efforts to improve attitude/motivation
(5) Library use(6) Physical recreation activities
(7) Developmental reading
24

TABLE 20. PARTICIPANTS RECEIVING CORE AND SUPPORTIVE SERVICES WITHIN
COMMUNICATION SKILLS AREAS
Core or Supportive Activity Regular Summer DuplicatedTerm Term Total
CORE ACTIVITY
Remedial/correctional reading 48,233 55,026 103,259
Language arts (communication skills,grammar, writing, spelling) 44,794 45,838 90,632
Study skills 24,494 32,844 57,338
Developmental reading 28,367 17,488 45,855
Library use 10,116 29,654 39,770
Reading readiness 7,405 3,887 11,292
Speech (non-therapeutic speechimprovement or development) 4,418 3,813 8,231
English as a second language 2,143 515 2,658
Other communication skills 5,749 2,516 8,265
SUPPORTIVE ACTIVITY*
Efforts 1:o improve attitude/motivation 16,062 31,423 47,485
Physical recreation activities . . . . 2,940 19,520 22,460
Efforts to improve self concept . . . 13,080 99,091 22,171
Mathematics/science 3,572 77,647 11,219
Physical development (motorcoordination) 6,579 4,050 10,629
Visual health services 5,171 1,194 6,365
School social work (including home-school visiting) 4,857 1,016 5,873
School nurse program 3,369 2,249 5,618
Guidance services by counselor . . . . 1,534 3,842 5,376
*5,000 or more participants
25
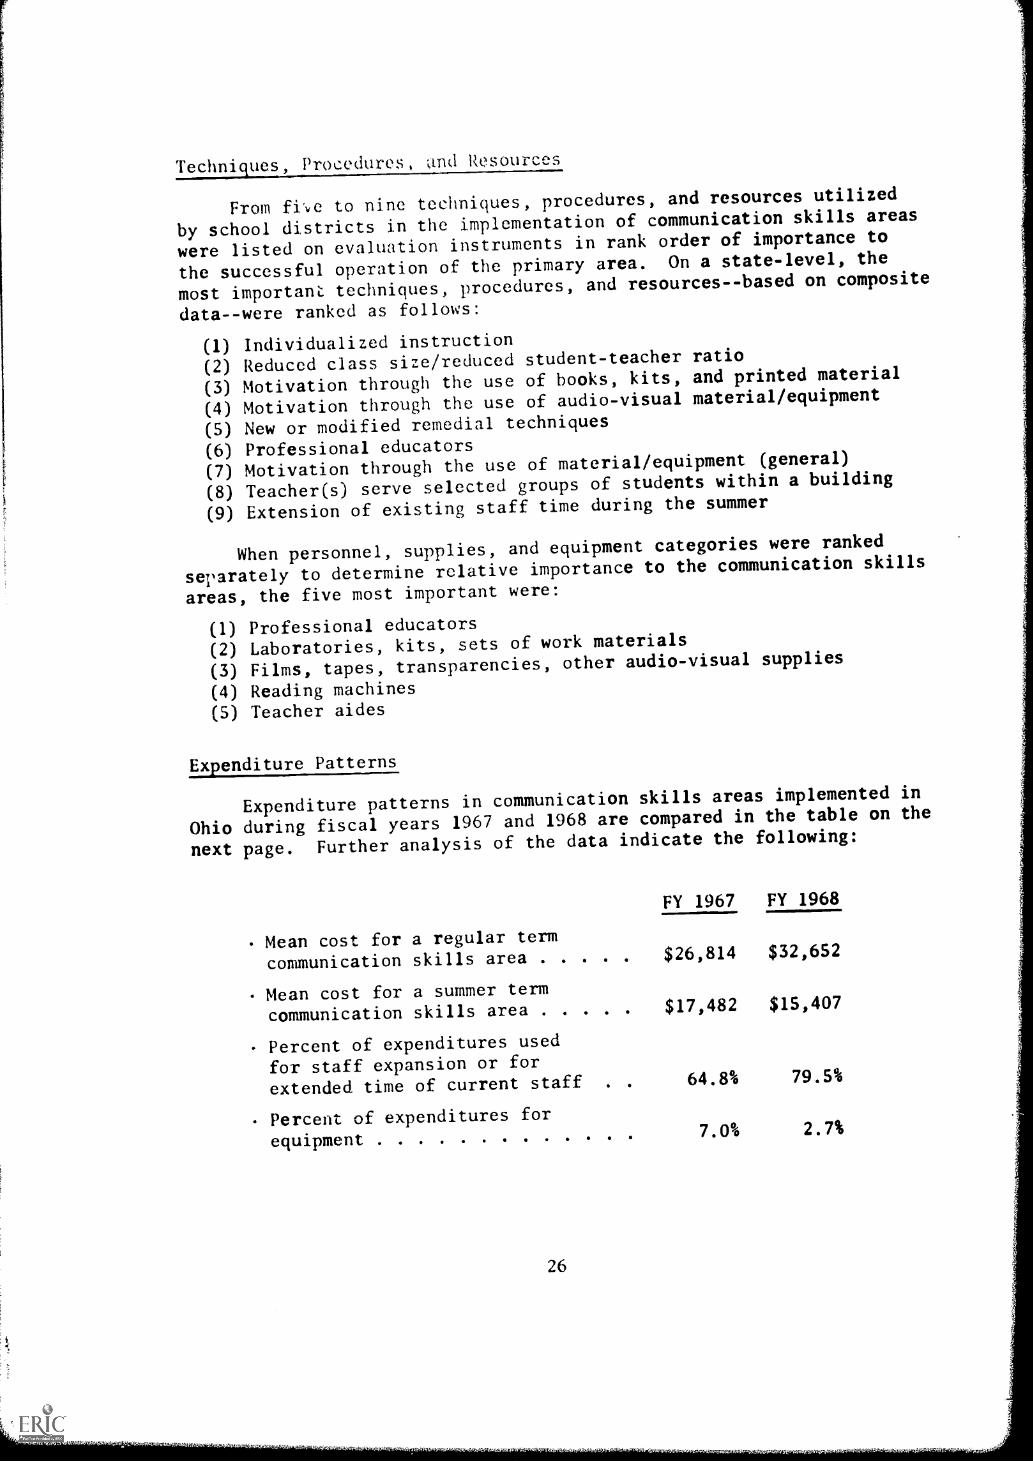
Techniques, Procedures, -Ind Resources
From fie to nine techniques, procedures, and resources utilized
by school districts in the implementation of communication skills areas
were listed on evaluation instruments in rank order of importance to
the successful operation of the primary area. On a state-level, the
most importani: techniques, procedures, and resources--based on composite
data--were ranked as follows:
(1) Individualized instruction
(2) Reduced class size/reduced student-teacher ratio
(3) Motivation through the use of books, kits, and printed material
(4) Motivation through the use of audio-visual material/equipment
(5) New or modified remedial techniques
(6) Professional educators
(7) Motivation through the use of material/equipment (general)
(8) Teacher(s) serve selected groups of students within a building
(9) Extension of existing staff time during the summer
When personnel, supplies, and equipment categories were ranked
separately to determine relative importance to the communication skills
areas, the five most important were:
(1) Professional educators
(2) Laboratories, kits, sets of work materials
(3) Films, tapes, transparencies, other audio-visual supplies
(4) Reading machines(5) Teacher aides
Expenditure Patterns
Expenditure patterns in communication skills areas implemented in
Ohio during fiscal years 1967 and 1968 are compared in the table on the
next page. Further analysis of the data indicate the following:
FY 1967 FY 1968
Mean cost for a regular term
communication skills area $26,814 $32,652
Mean cost for a summer term
communication skills area $17,482 $15,407
Percent of expenditures used
for staff expansion or for
extended time of current staff , 64.8% 79.5%
Percent of expenditures for
equipment7.0% 2.7%
26
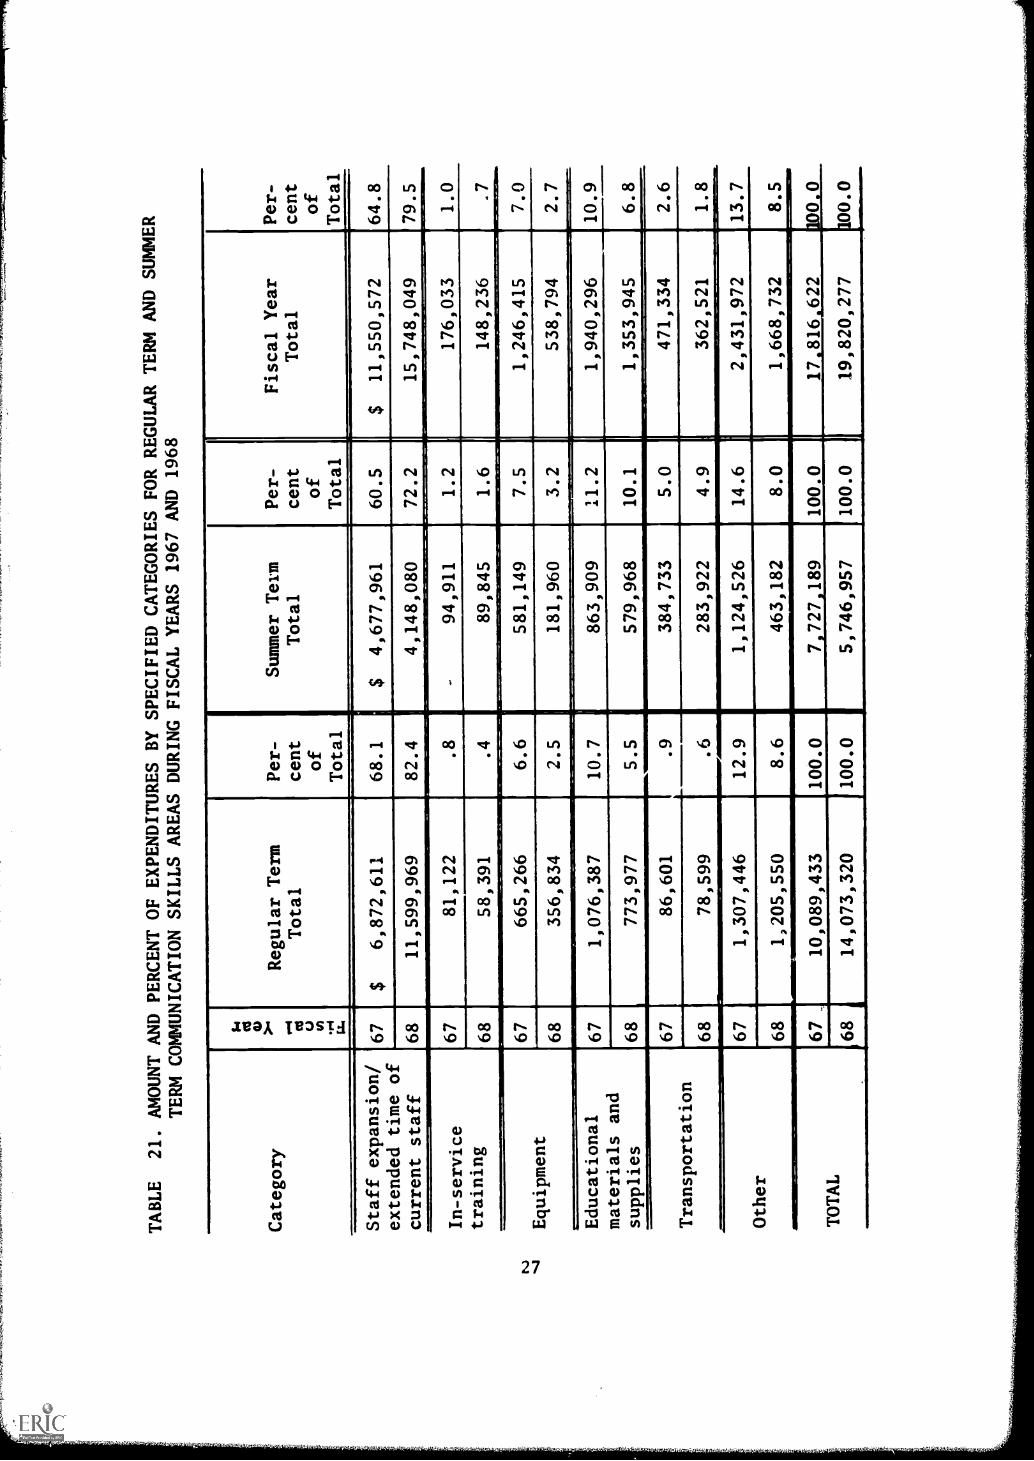
TABLE
21. AMOUNT AND PERCENT OF EXPENDITURES BY SPECIFIED CATEGORIESFOR REGULAR TERM AND SUMMER
TERM COMMUNICATION SKILLS AREAS DURING FISCAL YEARS 1967 AND
1968
Category
N M o >4 ,' m o m .r.4
it
Regular Term
Total
Per-
cent
of
Total
Summer Tem
Total
Per-
cent
of
Total
-I.
Fiscal Year
Total
Per-
cent
of
Total
Staff expansion/
extended time of
current staff
67
$6,872,611
68.1
$4,677,961
60.5
$11,550,572
.
64.8
68
11,599,969
82.4
4,148,080
72.2
15,748,049
79.5
In-service
training
67
81,122
.8
-94,911
1.2
176,033
1.0
68
58,391
.4
89,845
1.6
148,236
.7
Equipment
67
665,266
6.6
581,149
7.5
1,246,415
7.0
68
356,834
.
2.5
.
181,960
_
3.2
538,794
2.7
Educational
materials and
supplies
67
1,076,387
10.7
863,909
11.2
1,940,296
10.9
68
773,977
5.5
579,968
10.1
1,353,945
6.8
Transportation
67
86,601
.9
384,733
5.0
471,334
2.6
68
78,599
.6
283,922
4.9
362,521
1.8
Other
67
1,307,446
.
12.9
1,124,526
14.6
2,431,972
13.7
68
1,205,550
8.6
463,182
8.0
1,668,732
8.5
TOTAL
67
_10,089,433
y
100.0
7,727,189
100.0
17.816.622
100.0
68
14,073,320
100.0
5,746,957
100.0
419,820,277
100.0

Staffing Patterns
Approximately 58% of the staffing positions filled to implement
Title I communication skills areas were in the teacher category.
Another 22% were in the teacher aide category. Numbers of persons
employed in these and other capacities are included in the table below.
TABLE 22. PROFESSIONAL AND NON-PROFESSIONAL PERSONS PAID WITH TITLE I
FUNDS FOR REGULAR AND SUMMER TERM COMMUNICATION SKILLS AREAS
Job Classification(s)
Regular TermEmployees
Summer TermEmployees
Employees inFiscal Year 1968*
Full-
time
Part
time
Full-time
Part-time
Full-time
PartI time
Total
Teachers 963 834 3,198 1,943 4,161 2,777 6,938
Teacher aides . 666 292 1,260 416 1,926 708 2,634
Administrators,principals . . . 61 263 295 232 356 495 851
Counselors 36 63 66 105 102 168 270
Psychologists . . 7 38 19 27 26 65 91
Nurses, physicians,dentists 23 61 35 63 58 124 182
Librarians 9 26 78 103 87 129 216
Librarian aides . . 56 33 89 71 145 104 249
Social workers, homevisitors, atten-dance workers . . 29 27 25 10 54 37 91
Speech therapists. 3 11 30 23 33 34 67
Clerks, ,secretaries,cooks, bus drivers,others 137 256 339 1,212 536 1,468 2,004
TOTAL 1,990 1,904 5,494 4,205 7,484 6,109 13,593
*Duplicated totals
The next table reports information about teachers employed within
communication skills areas categorized by academic degree, overall teach-
ing experience, and Title I teaching experience. Noteworthy observations
about teachers in communication skills areas include:
12.6% had masters degrees.
80.6% had three years or more teaching experience.
26.4% had over two years Title I teaching experience.
Only 6.5% were first-year teachers.
28
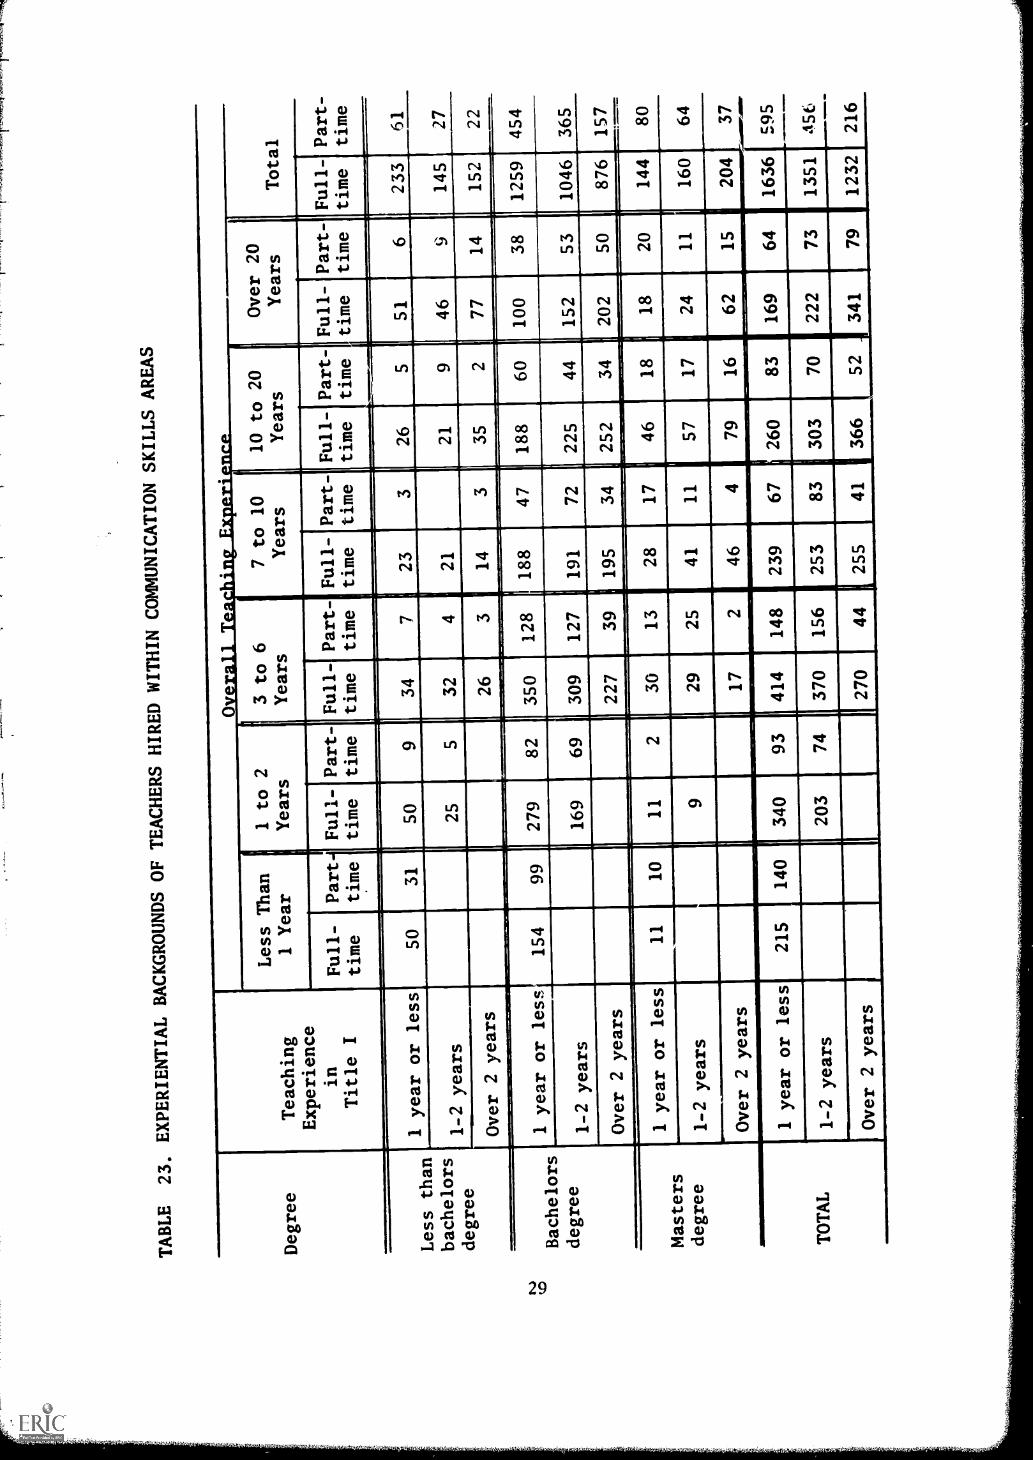
TABLE
23. EXPERIENTIAL
BACKGROUNDS OF TEACHERS
HIRED WITHIN COMMUNICATION
SKILLS AREAS
Degree
Teaching
Experience
in
Title I
Less Than
1 Year
1 to 2
Years
3 to 6
Years
7 to 10
Years
10 to 20
Years
Over 20
Years
Total
Full-
Part Full- Part-
time
time
time
time
Full- Part-
time
time
Full- Part- Full- Part-
Full-
time
time
time
time
time
Part- Full-
time
time
Part-
time
Less than
bachelors
degree
NJ
Bachelors
degree
1 year or less
1-2 years
Over 2 years
1 year or less
154
1-2 years
Over 2 years
61 27 22
454
157
Masters
degree
TOTAL
1 year or less
1-2 years
Over 2 years
1 year or less
1-2 years
Over 2 years
80
370
156
37
595
A56

Effectiveness of. Communication Skills Areas
The figures on this page and the following page illustrate the
levels of effectiveness reported for students participating in com-
munication skills areas during the regular term and summer term,
respectively. Collected data were categorized on the basis of stan-
dardized test results and on change criteria as indicated. Obser-
vations following the figure showing summer term data.
Percent ofParticipants
SO-
45-
40-
3S-
30:
2S-
20-
15-
10-
5-
M-Marked improvement (1.5 or more monthsgain per month of instruction)
I-Improvement (1.1 to 1.4 months gainper month of instruction)
N-No significant change (1.0 or lessmonth gain per month of instruction)
Grades
M I N
1-3
M I N
4-6
M I N
7-9
M I N
10-12
FIGURE 5, PERCENT OF PARTICIPANTS IN REGULAR TERM COMMUNICATION SKILLS
AREAS BY GRADE RANGE, WHERE DEGREES OF CHANGE WERE REPORTED
AS MEASURED BY STANDARDIZED TESTS
30

Percent ofParticipants
40-
35-
30-
25-
20-
15-
10-
5-
M-Marked improvement (1.5 or more months
gain per month of instruction)I-Improvement (1.1 to 1.4 months gain
per month of instruction)
N-No significant change (1.0 or less
month gain per month of instruction)
Grades
M I N M I N M I N M I N
1-3 4-6 7-9 10-12
FIGURE 6. PERCENT OF PARTICIPANTS IN SUMMER TERM TITLE I COMMUNI-
CATION SKILLS AREAS BY GRADE RANGE, WHERE DEGREES OF
CHANGE WERE REPORTED AS MEASURED BY STANDARDIZED TESTS
Analysis of the data used to compile figures 5 and 6 indicates:
Statewide, approximately 66% of about 98,000 students involved in
communication skills areas during the regular term exhibited 1.1
months or more gain for every month enrolled in Title I activities.
Of these same students, 34% exhibited 1.5 or more months gain for
every month enrolled.
Approximately 65% of about 78,000 summer term participants, (many of
whom were also among the participants mentioned above) exhibited
1.1 months or more gain for every month enrolled in Title I acti-
vities. Of this same group, 33% exhibited 1.5 or more months gain
for every month enrolled.
31

Year-to-Year Involvement
Because problems in the communication skills area are usually deep-
rooted and often interrelated with other Title I activities, involvement
of a particular child for one or two terms during one year is often not
enough for him to catch up with his more advantaged classmates. The
graphs below are based on information collected to learn the extend to
which Title I services are being provided on a longitudional basis. Two
limiting factors to keep in mind are (1) changes brought about by pro-
motion of students to grade levels not served by a communication skills
area and (2) population mobility. Further analysis of data indicates
that over 30,000 youngsters who participated in regular term communi-
cation skills areas had been in Title I activities during each of three
years. By contrast, approximately 15,000 of the summer term partici-
pants were involved in each of the years.
REGULAR TERM97,818 participants
Involvement during fiscalyears 1966, 1967, and 1968
Involvement during fiscalyear 1968 and fiscal year1966 or 1967
Involvement during 1968 only
SUMMER TERM77,743 participants
FIGURE 7. PERCENTAGES OF REGULAR AND SUMMER TERM PARTICIPANTS INCOMMUNICATION SKILLS AREAS DURING FISCAL YEAR 1968 WHOWERE ALSO INVOLVED IN TITLE I DURING FISCAL YEAR 1966AND/OR 1967
32

CHAPTER I I I
MATHEMATICS AND/OR SCIENCE SKILLS
After communication skills, the second most frequently imple-
mented Primary Instructional and/or Service Area was entitled
"Mathematics and/or Science." By evaluation-instrument definition,
core activities within mathematics/science areas were designed to
improve the facility of educationally disadvantaged youngsters in
one or more of the following areas:
Mathematics/science (general)
Mathematics
Physical sciences
Social sciences
Economics
Other mathematics/science activities
Basic Data
Mathematics/science areas implemented in
Ohio during fiscal year 1968
Regular term 28
Summer term 88
Approximate percent of Ohio districts
implementing mathematics/science areas
Districts with regular termscheduling
Districts with summer term
scheduling
6%
22%
Reported participants in mathematics/
science areas
Regular term participants 11,821
Summer term participants 40,405
Total, including duplication . . 52,226
Reported expenditures for mathematics/
science areas
Regular term expenditures $1,456,687
Summer term expenditures $1,771,170
Total expenditures $3,227,857
33

Participants
The numbers of participants in regular and summer term Title I
Liathematics/science areas in Ohio during fiscal years 1967 and 1968
are listed in the table below. Observe that in 1968 over 8 thousand
more students participated in mathematics/science areas. By contrast,
the total number of students involved in Title I activities was reduced
in 1968 by approximately 5 thousand.
TABLE 24. NUMBER AND GRADE RANGE OF PARTICIPANTS IN REGULAR AND
SUMMER TERM TITLE I MATHEMATICS/SCIENCE AREAS DURING
FISCAL YEARS 1967 AND 1968
GradeRange
Regular TermSummer Term
FiscalYear1967
FiscalYear1968
FiscalYear1967
FiscalYear1968
PreK-K 6 81 216 1,084
1-3 936 3,514 10,391 14,209
4-6 9,590 3,834 14,246 15,156
7-9 2,042 3,602 4,901 6,883
10-12 746 790 293 3,073
TOTAL 13,320 11,821 30,047 40,405
34

Distribution of project participants within the mathematics/
science areas by grade range and sex is shown in the table below.
The percentage of boys during the regular and summer terms generally
ranged between 51 and 52 percent, which is about the percentage of
school-age boys throughout the country. A possible explanation is
that needs in the area of mathematics and science, unlike needs in
the communication skills area, are independent of sex differences.
A larger sampling and longitudinal study are needed, however, to
test this observation.
TABLE 25. NUMBER AND GRADE RANGE OF PUBLIC SCHOOL PARTICIPANTS BY
SEX AND THE PERCENT OF BOYS IN REGULAR AND SUMMER TERMS
MATHEMATICS/SCIENCE AREAS
GradeRange
Regular Term
Numberof
Girls
PercentofBoys
-
NumberofBoys
.
Summer Term
Numberof
Girls
PercentofBoys
NumberofBoys
PreK-K 42 39
-
51.94
564 520 52.0
1-3
,
1,788 1,714 51.1 7,021 6,514 51.9
4-6 1,894 1,848 50.6 7,500 6,946 51.9
7-9 1,929 1,588 54.8 3,437 3,283 51.1
10-12 417 374 52.7 1,581 1,489 51.5
TOTAL 6,070 5,563 52.2 20,103 18,752 51.7
35

Core and Supportive Activities
For evaluation purposes, a mathematics/science area is an essen-
tially separate segment of educational programming that operates inde-
pendently of other instructional or service segments within a project.
However, multiple core and su-portive instructional or service activi-
ties are conducted to contribute to the effectiveness of a primary
area. Title I evaluators could list information for up to seven core
or supportive activities conducted as a part of their regular or summer
term mathematics/science areas. The following table reports partici-
pants for all core activities and for supportive activities involving
more than 1,000 participants. Observations based on this table
include:
Each regular term participant in a mathematics/science
area was involved in an average of 2.1 core or supportive
activities compared with an average of 1.7 activities in
fiscal year 1967.
Each summer term participant was involved in an average
of 3.0 core or supportive activities compared with an
average of 2.7 activities in fiscal year 1967.
Each average participant was involved in more core or
supportive activities during the summer because different
scheduling and staffing factors influenced regular-and
summer term operation of primary areas.
The seven core and supportive activities that involved
the most participants during the regular term, listed
in rank order, were:
(1) Physical sciences(2) Mathematics(3) Efforts to improve attitude/motivation
(4) Study skills(5) School social work (including home-school
visiting)(6) Mathematics/science (general)(7) Group counseling by counselor or psychologist
The seven core and supportive activities that involved
the most participants during the summer term, listed
in rank order, were:
(1) Efforts to improve attitude/motivation
(2) Mathematics/science (general)
(3) Social sciences(4) Mathematics(5) Physical recreation activities
(6) Study skills(7) Vocational awareness/orientation
36

TABLE 26. NUMBER OF PARTICIPANTS RECEIVING CORE AND SUPPORTIVE
SERVICES IN MATHEMATICS/SCIENCE AREAS
Core or Supportive ActivityRegularTerm
SummerTerm
Duplicated
Total
CORE ACTIVITY
Mathematics/science (general)
Social sciences
Mathematics
Physical sciences
Economics
1,507
772
3,115
7,073
7
21,293
21,003
14,558
1,653
224
22,800
21,775
17,673
8,726
231
Other mathematics/science activities. 51 1,075 1,126
SUPPORTIVE ACTIVITY*
Efforts to improve attitude/motivation 2,425 26,728 29,153
Physical recreation activities . . . 13,944 13,944
Study skills 1,578 3,841 5,419
Vocational awareness/orientation . . . 497 3,349 3,846
Efforts to improve self concept . . . . 463 1,254 1,717
School social work (including home-
school visiting) 1,567 101 1,668
Medical health services 1,425 184 1,609
Guidance services by counselor . 1,122 426 1,548
Group counseling by counselor
or psychologist 1,515 1,515
Food services (breakfast, lunch,
other 42 1,466 1,508
Pupil-personnel related services
for parents 1,200 1,200
*1,000 or more participants
37
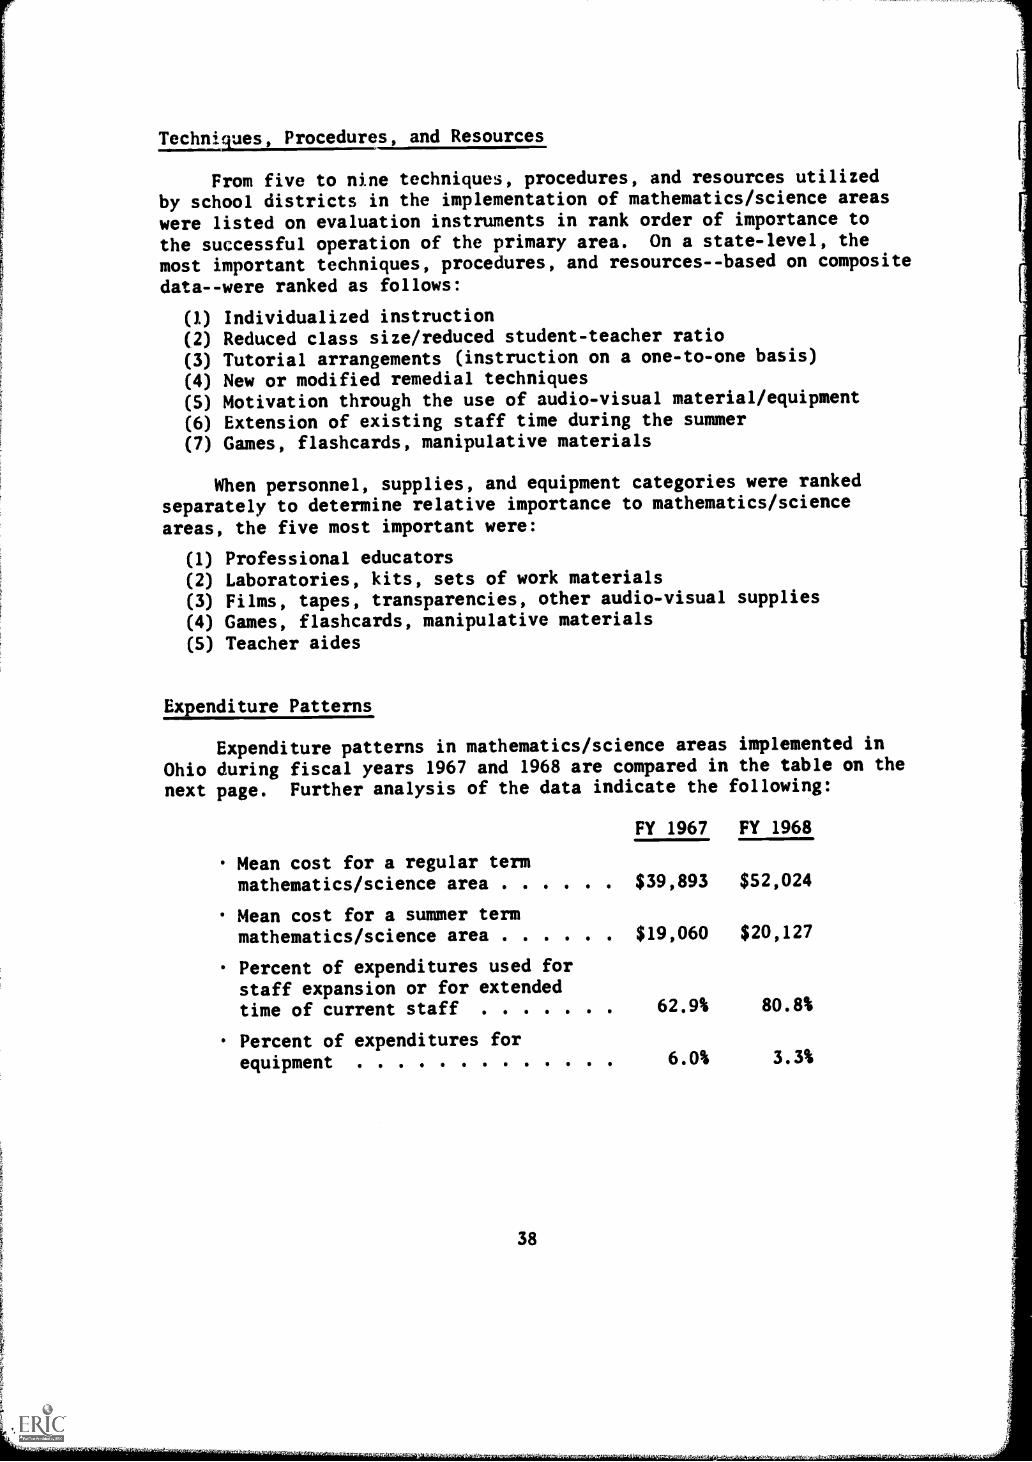
Techniques, Procedures, and Resources
From five to nine techniques, procedures, and resources utilized
by school districts in the implementation of mathematics/science areas
were listed on evaluation instruments in rank order of importance to
the successful operation of the primary area. On a state-level, the
most important techniques, procedures, and resources--based on composite
data--were ranked as follows:
(1) Individualized instruction(2) Reduced class size/reduced student-teacher ratio
(3) Tutorial arrangements (instruction on a one-to-one basis)
(4) New or modified remedial techniques(5) Motivation through the use of audio-visual material/equipment(6) Extension of existing staff time during the summer(7) Games, flashcards, manipulative materials
When personnel, supplies, and equipment categories were ranked
separately to determine relative importance to mathematics/science
areas, the five most important were:
(1) Professional educators(2) Laboratories, kits, sets of work materials(3) Films, tapes, transparencies, other audio-visual supplies
(4) Games, flashcards, manipulative materials(5) Teacher aides
Expenditure Patterns
Expenditure patterns in mathematics/scienceOhio during fiscal years 1967 and 1968 are comparednext page. Further analysis of the data indicate
Mean cost for a regular term
areas implemented inin the table on the
the following:
FY 1967 FY 1968
mathematics/science area $39,893 $52,024
Mean cost for a summer termmathematics/science area $19,060 $20,127
Percent of expenditures used forstaff expansion or for extendedtime of current staff 62.9% 80.8%
Percent of expenditures forequipment 6.0% 3.3%
38
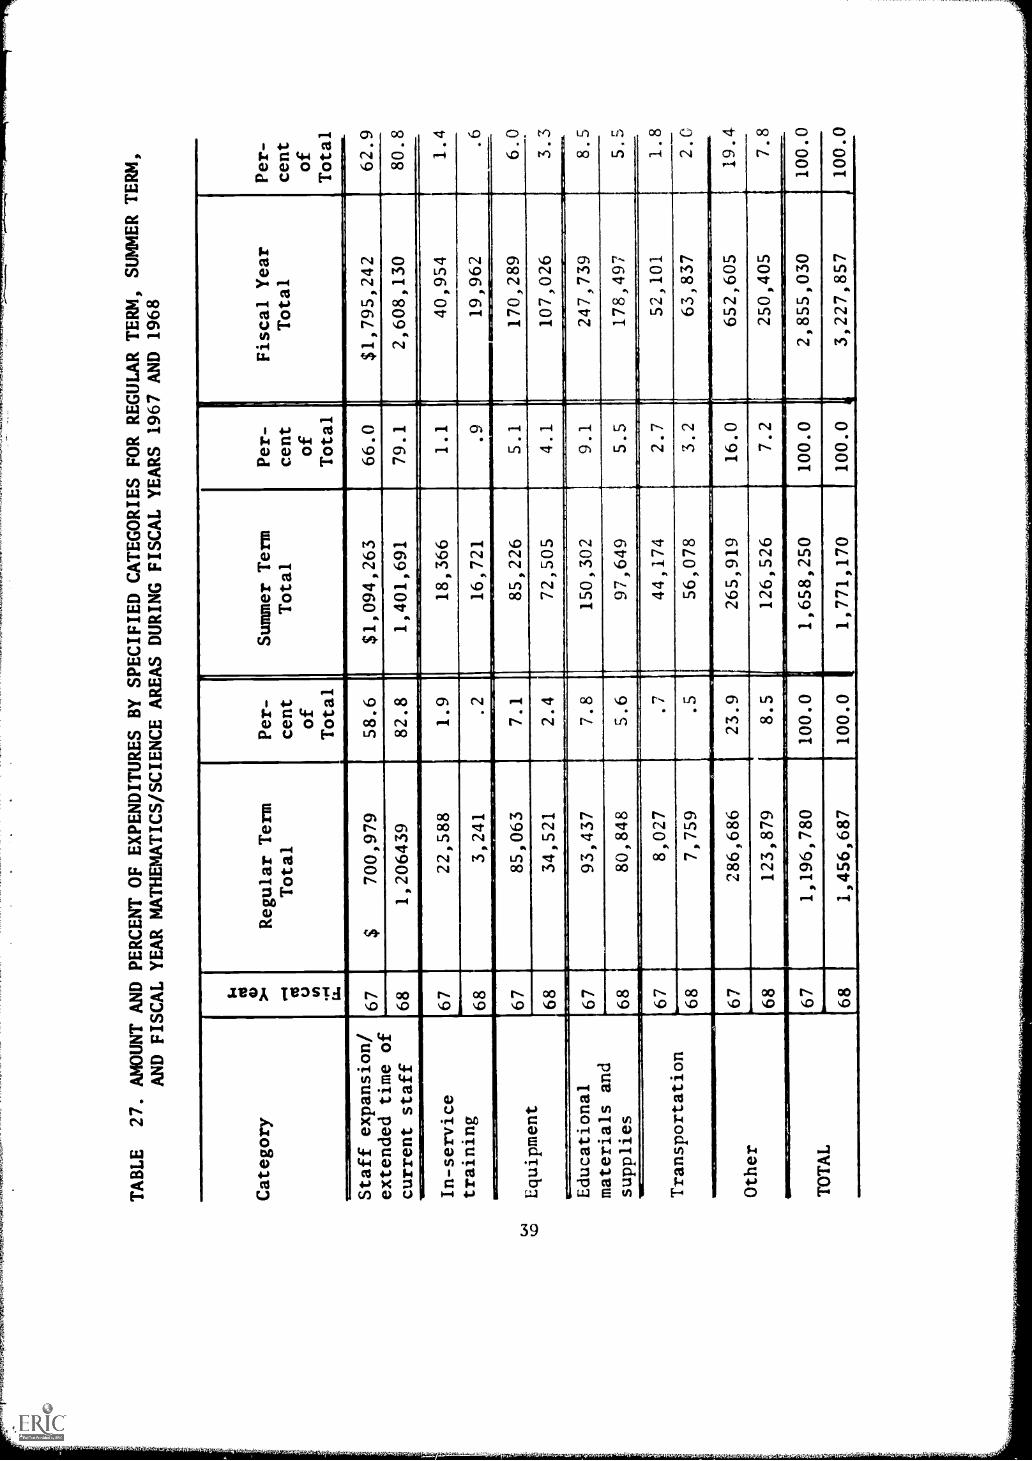
TABLE
27. AMOUNT AND PERCENT OF EXPENDITURES BY SPECIFIED CATEGORIES FOR REGULAR TERM,
SUMMER TERM,
AND FISCAL YEAR MATHEMATICS/SCIENCE AREAS DURING FISCAL YEARS 1967 AND
1968
Category
N >-.
.4 u H r4 11..
Regular Term
Total
Per-
cent
of
Total
Summer Term
Total
.
Per-
cent
of
Total
Fiscal Year
Total
Per-
cent
of
Total
Staff expansion/
extended time of
current staff
67
$700,979
58.6
$1,094,263
66.0
$1,795,242
62.5
68
1,206439
82.8
1,401,691
79.1
2,608,130
80.E
In-service
training
67
22,588
1.9
18,366
1.1
40,954
1.4
68
3,241
.2
16,721
.9
19,962
.(
Equipment
p...... .,
67
85,063
7.1
85,226
.... ..6
5.1
170,289
6.0
68
34,521
2.4
72,505
4.1
107,026
3.2
Educational
materials and
supplies
67
93,437
7.8
150,302
9.1
247,739
8.5
68
80,848
5.6
97,649
5.5
178,497
5.E
Transportation
67
8,027
.7
44,174
2.7
52,101
1.E
68
7,759
.5
.-
56,078
3.2
63,837
2.0
Other
67
.
286,686
23.9
265,919
16.0
652,605
19.4
68
123,879
8.5
126,526
7.2
250,405
7.E
TOTAL
67
1,196,780
100.0
1,658,250
100.0
2,855,030
100.0
68
1,456,687
100.0
1,771,170
100.0
3,227,857
100.0

Staffing Patterns
Approximately 48% of the staffing positions filled to implement
Title I mathematics/science areas were in the teacher category.
Numbers of persons employed in other capacities are included in the
table below.
TABLE 28,PROFESSIONAL AND NON-PROFESSIONAL PERSONS PAID WITH TITLE I
FUNDS FOR REGULAR AND SUMMER TERM MATHEMATICS/SCIENCE AREAS
Job Classification(s)
Regular TermEmployees
Summer TermEmplo ees
Employees inFiscal Year 1968*
Full-time
Part-time
Full-time
Part-time
Full-I
timePart-
timeTotal
Teachers 60 175 774 1,160 834 1,335 2,169
Teacher aides . 31 63 437 147 468 210 678
Administrators,principals . . . 5 24 78 129 83 153 236
Counselors 3 27 13 81 16 108 124
Psychologists . . 2 7 8 7 10 17
Nurses, physicians,dentists . . . 1 3 2 20 3 23 26
Librarians 2 3 25 82 27 85 112
Librarian aides . . 11 2 32 58 43 60 103
Social workers, homevisitors, atten-dance workers . . 2 2 9 6 11 8 19
Speech therapists. 1 1 15 2 15 17
Clerks, secretaries,cooks, bus drivers,others 4 3 113 946 117 949 1,066
TOTAL 120 304 1,491 2,652 1,611 2,956 4,567
*Duplicated totals
The next table reports information about teachers employed within
mathematics/science areas categorized by academic degree, overall teach-
ing experience, and Title I teaching experience. Noteworthy observations
about teachers in mathematics/science areas include:
16.1% had masters degrees.
74.8% had three years or more teaching experience.
18.7% had over two years Title I teaching experience.
Only 6.0% were first-year teachers.
40

TABLE 29.
EXPERIENTIAL BACKGROUNDSOF TEACHERS HIRED
WITHIN MATHEMATICS/SCIENCE
AREAS
Degree
Teaching
Experience
in
Title I
Overall Teachin:
Experience
Less Than
1 Year
1 to 2
Years
3 to 6
Years
7 to 10
Years
10 to 20
Years
Over 20
Years
Total
Full-
time
Part-
time
Full-
time
Part-
time
Full-
time
Part-
time
Full-
time
Part-
time
Full-
time
Part-
time
Full-
time
Part
time
Full -Part-
time
time
Less than
bachelors
degree
1 year or less
52
11
5S
14
71
14
246
11
1-2 years
22
78
62
83
r31
7
Over 2 years
11
113
116
1
Bachelors
degree
1 year or less
20
33
92
26
85
22
39
12
37
14
17
2290
109
1-2 years
34
27
49
28
33
933
11
26
3174
83
Over 2 years
42
233
935
129
4139
16
Masters
degree
1 year or less
15
53
19
69
414
33
251
23
1-2 years
41
11
10
13
7I
12
45
245
24
Over 2 years
32
611
11
131
TOTAL
1 year or less
26
40
108
34
109
29
52
16
58
18
34
6387
143
1-2 years
40
30
67
38
54
16
51
17
39
13
250
114
Over 2 years
46
440
947
153
6186
20

Effectiveness of Mathematics/Science Areas
The figure below illustrates the levels of effectiveness reported
for students participating in mathematics/science areas during either
the regular term and/or the summer term. Collected data were cate-
gorized on the basis of standardized test results and on change criteria
as indicated. Analysis of the data indicates:
About 3 out of 10 participants involved in mathematics/
science areas exhibited marked improvement.
About 5 out of 10 participants involved in mathematics/
science areas exhibited improvement or marked improvement.
Percentage ofParticipants
55-
50-
45-
40-
35-
30-
25-
20-
15-
10-
5-
M-Marked improvement (1.5 or more
months gain per month of instruc-
tion)Improvement (1.1 to 1.4 months
gain per month of instruction)
N-No significant change (1.0 or less
month gain per month of instruc-
tion)
II1
M I N
Grades 1-3
M I N
4-6
M I N
7-9
M I N
10-12
FIGURE 8. PERCENT OF PARTICIPANTS IN MATHEMATICS/SCIENCE AREAS BY
GRADE RANGE, WHERE DEGREES OF CHANGE WERE REPORTED AS
MEASURED BY STANDARDIZED TESTS
42

Year-to-Year Involvement
Problems in the mathematics/science area, just as those in the
communication skills area, are frequently deep-rooted and often
interrelated with other Title I activities. Involvement of a par-
ticular child for one or two terms during one year is often not
enough for him to catch up with his more advantaged classmate. The
graphs below are based on information collected to learn the extent
to .4lich Title I services are being provided, on a longitudional basis.
Two limiting factors to keep in mind are (1) changes brought about by
promotion of students to grade levels not served by a mathematics/
science area and (2) population mobility. Further analysis of data
indicates that over 5,000 youngsters who participated in regular term
mathematics/science areas had been in Title I activities during each
of three years. By contrast, approximately 10,000 of the summer term
participants were involved in each of the years.
REGULAR TERM11,821 Participants
Involvement during fiscalyears 1966, 1967, and 1968
Involvement during fiscalyear 1968 and fiscal year1966 or 1967
Involvement during 1968 only
FIGURE 9.
SUMMER TERM40,405 Participants
PERCENTAGES OF REGULAR AND SUMMER TERM PARTICIPANTS IN
MATHEMATICS/SCIENCE AREAS DURING FISCAL YEAR 1968 WHO
WERE ALSO INVOLVED IN TITLE DURING FISCAL YEAR 1966
AND/OR 1967
43

CHAPTER IV
OTHER PRIMARY INSTRUCTIONAL. AND SERVICE AREAS
Six of the eight Primary Instructional and/or Service Areas- -the exceptions being the communication skills and the mathematics/science areas discussed in chapters two and three--were limited insize and scope. The six areas, ranked by reported expenditures, were:
(1) Preschool Education
(2) Pupil Personnel Services
(3) Health Education/Services
(4) Arts and Humanities
(5) Vocational Skills
(6) Special Education
In view of the limited numbers of participants and the compara-tively low expenditures of funds in each of these areas, this chapterpresents data and observations about all six areas. Chapter organi-zation is essentially the same as that used in the two precedingchapters, with modifications as deemed advisable. Exceptions include:
Individual techniques, procedures, and resources were used with sofew participants and were so varied that - -even on a statewide basis- -
data provided no comparisons that were considered meaningful.
Effectiveness of individual areas, as measured by evaluativeprocedures, were so limited in nature that separate treatmentof data was considered meaningless.
Year-to-year involvement was dropped for lack of meaningful data.
Basic Data
Basic data for the six areas, along with observations and otherdata, have been placed on separate sheets, beginning on the next page.
Participants
The numbers of regular and summer term participants are reportedin Table 30 on page 52. Observe that in every area, except specialeducation, numbers of participants were much higher during the regular
term.
Core and Supportive Activities
The table on page 53 lists by primary area the core and supportive
activities that involved, in the opinion of the writers of this publi-cation, significant numbers of participants. Activities are listedin rank order, according to the reported numbers of participants.
lIpenditure Patterns
Expenditu41 patterns are compared in the table on page 54.
45

PRESCHOOL EDUCATION
Basic Data
Preschool education areas implemented inOhio during fiscal year 1968
Regular term 9
Summer term 17
Approximate percent of Ohio districtsimplementing preschool education areas
Districts with regular termscheduling 2%
Districts with summer termscheduling 4%
Reported participants in preschooleducation areas
Regular term participants 7,227
Summer term participants 1,821
Total, including duplication 9,048
Reported expenditures for preschooleducation areas
Regular term expenditures $2,154,874
Summer term expenditures $ 365,270
Total expenditures $2,520,144
Observations and Other Data
The third highest expenditure of Title I funds was for preschool edu-cation areas, exceeded only by expenditures for the communicationskills and mathematics/science areas.
89% of the reported expenditures for preschool education areas duringfiscal year 1968 was used for salaries and employee benefits.
Reported expenditures for preschool education areas during fiscalyear 1968 exceeded similiar expenditures in fiscal year 1967 by over$500,000.
Reported numbers of participants in preschool education areas infiscal year 1967 were 5,590 for the regular term and 3,169 for thesummer term. When these data are contrasted with data above, a shiftto regular ter programming is evident.
46
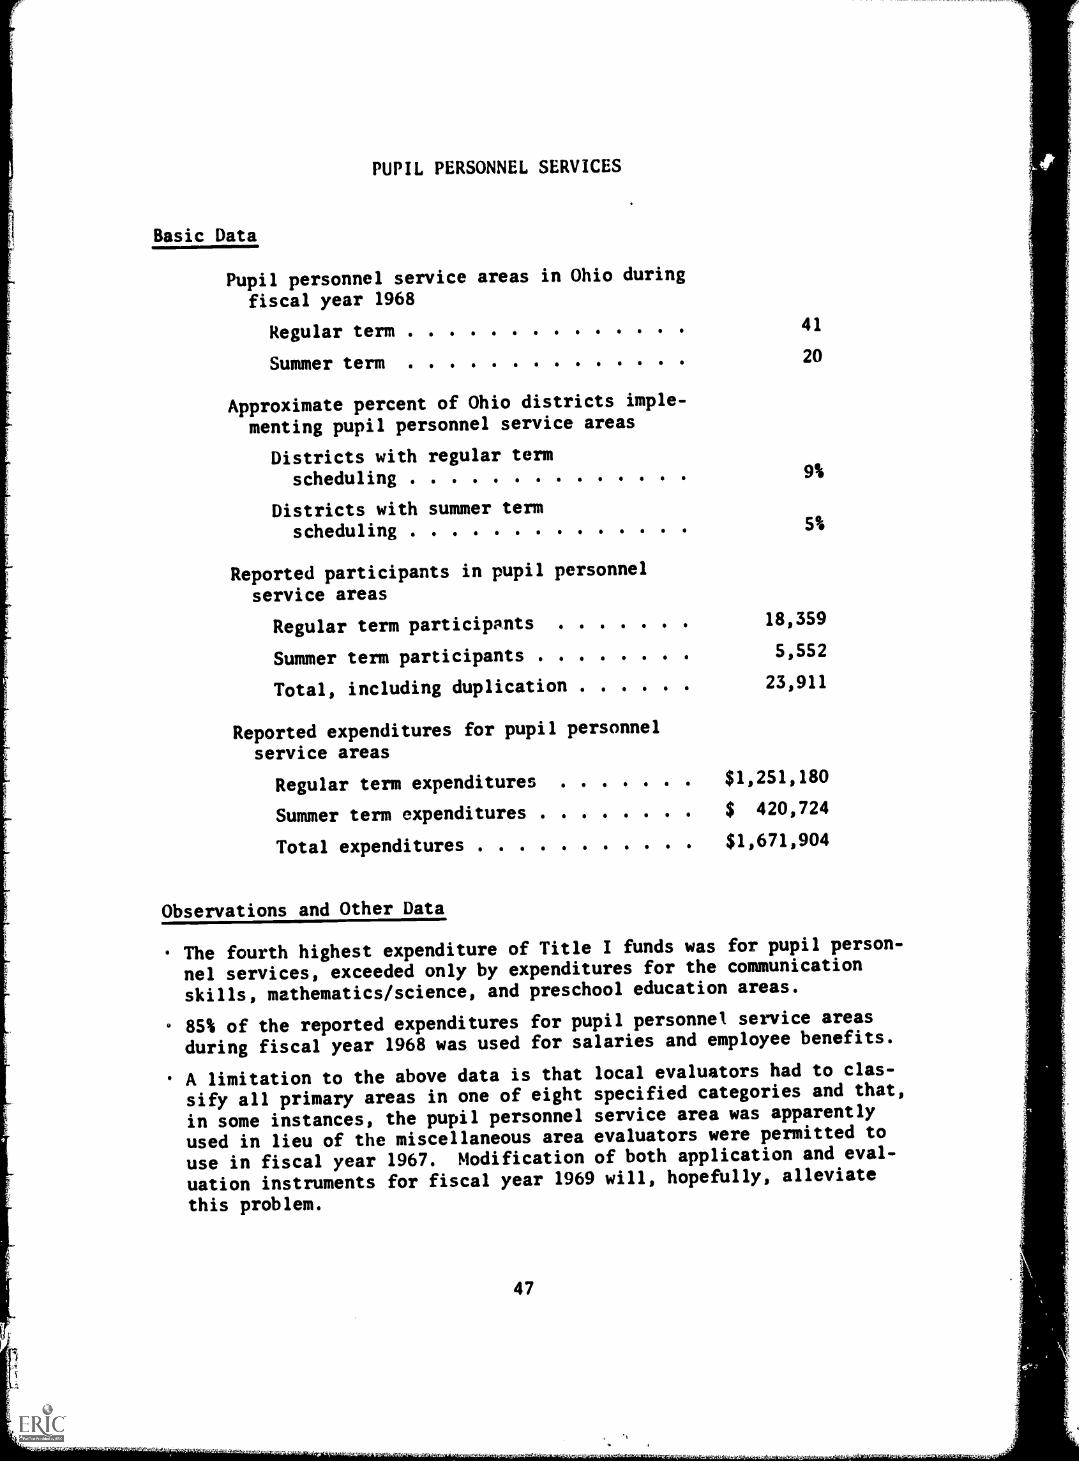
PUPIL PERSONNEL SERVICES
Basic Data
Pupil personnel service areas in Ohio during
fiscal year 1968
Regular term
Summer term
Approximate percent of Ohio districts imple-
menting pupil personnel service areas
Districts with regular term
scheduling
Districts with summer term
scheduling
41
20
9%
5%
Reported participants in pupil personnel
service areas
Regular term participants 18,359
Summer term participants .... 5,552
Total, including duplication 23,911
Reported expenditures for pupil personnel
service areas
Regular term expenditures $1,251,180
Summer term expenditures $ 420,724
Total expenditures $1,671,904
Observations and Other Data
The fourth highest expenditure of Title I funds was for pupil person-
nel services, exceeded only by expenditures for the communication
skills, mathematics/science, and preschool education areas.
85% of the reported expenditures for pupil personnel service areas
during fiscal year 1968 was used for salaries and employee benefits.
A limitation to the above data is that local evaluators had to clas-
sify all primary areas in one of eight specified categories and that,
in some instances, the pupil personnel service area was apparently
used in lieu of the miscellaneous area evaluators were permitted to
use in fiscal year 1967. Modification of both application and eval-
uation instruments for fiscal year 1969 will, hopefully, alleviate
this problem.
47

HEALTH EDUCATION/SERVICES
Basic Data
Health education/service areas implemented
in Ohio during fiscal year 1968
Regular term 48
Summer term 35
Approximate percent of Ohio districts imple.
menting health education/service areas
Districts with regular termscheduling
Districts with summer termscheduling
11%
9%
Reported participants in health education/
service areas
Regular term participants 27,972
Summer term participants 7,098
Total, including duplication 35,070
Reported expenditures for health education/
service areas
Regular term expenditures $ 923,589
Summer term expenditures $ 358,914
Total expenditures $1,282,503
Observations and Other Data
76% of the reported expenditures for health education/service areas
during fiscal year 1968 was used for salaries and employee benefits.
3% of the reported expenditures during fiscal year 1968 was used forequipment compared with 10% during fiscal year 1967.
Of the six primary areas dealt with in this chapter, the healtheducation/service area involved the highest numbers of participantsin the regular and summer terms, respectively.
48

ARTS AND HUMANITIES
Basic Data
Arts and humanities areas implemented inOhio during fiscal year 1968
Regular term 19
Summer term 23
Approximate percent of Ohio districts imple-menting arts and humanities areas
Districts with regular termscheduling 4%
Districts with summer termscheduling 6%
Reported participants in arts and human-
ities areas
Regular term participants 23,499
Summer term participants 4,280
Total, including duplication 27,779
Reported expenditures for arts and human-ities areas
Regular term expenditures $369,446
Summer term expenditures $348,367
Total expenditures $717,813
Observations and Other Data
77% of the reported expenditures for arts and humanities areas duringfiscal year 1968 was used for salaries and employee benefits.
1.6% of the reported expenditures during fiscal year 1968 was usedfor equipment compared with 9.4% during fiscal year 1967.
Of the six primary areas dealt with in this chapter, the arts andhumanities area involved the second highest numbers of participantsin the regular and summer terms respectively. Only the health educa-
tion/service area had more participants.
Reported numbers of participants in arts and humanities areas infiscal year 1967 were 17,669 for the regular term and 7,895 for thesummer term. When these data are contrasted with data above, a shiftto regular-term programming is evident.
49
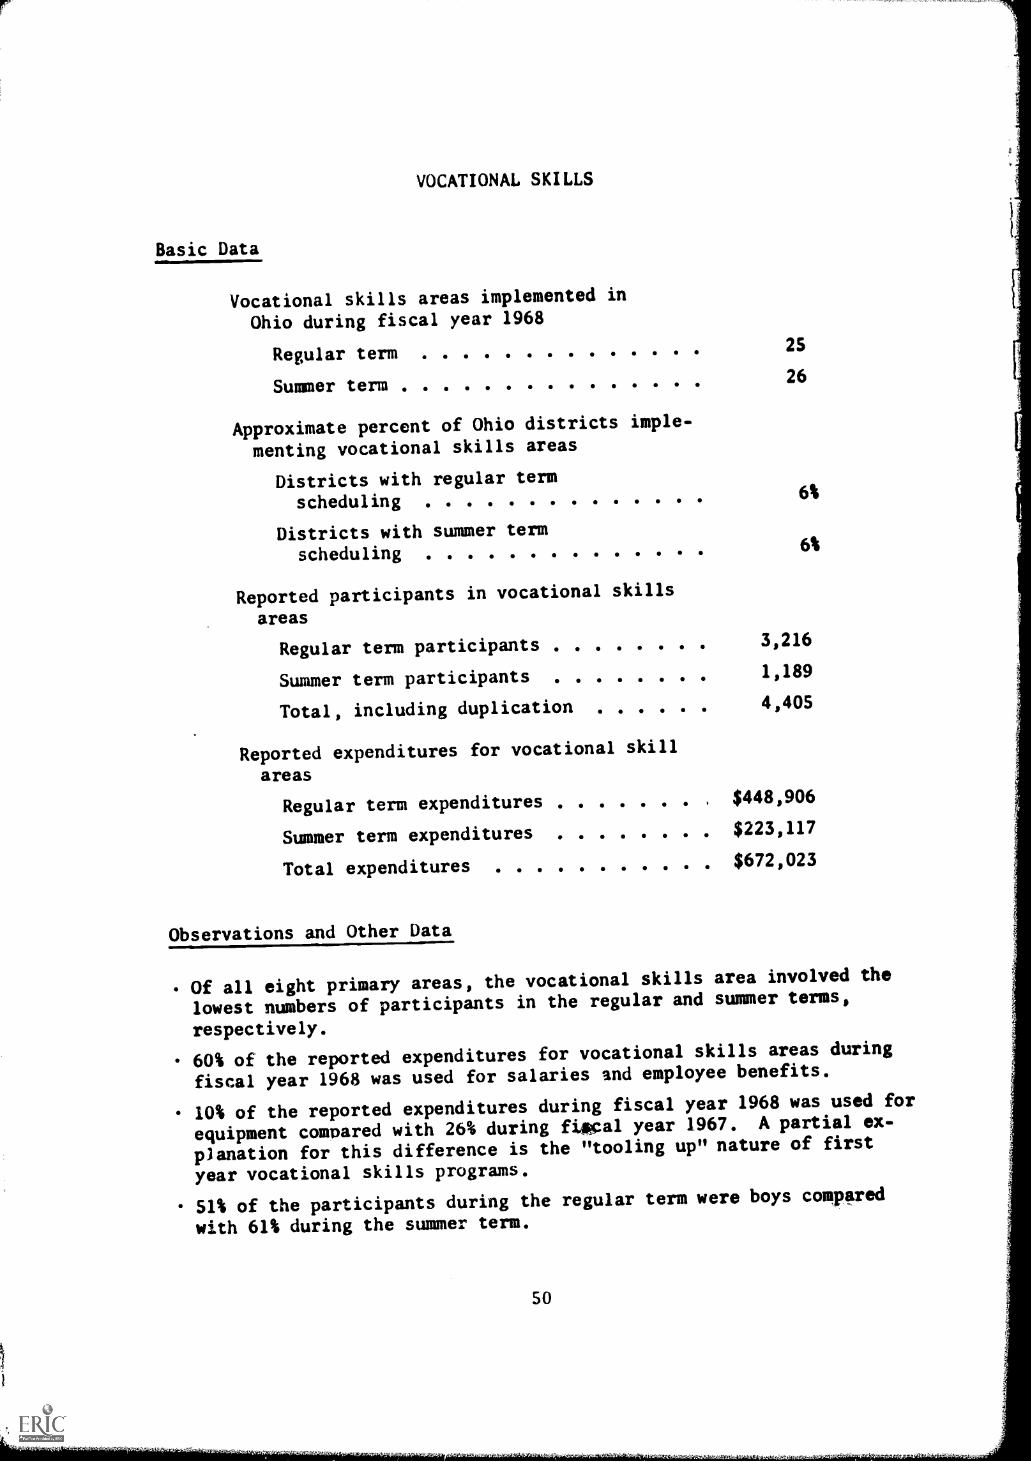
VOCATIONAL SKILLS
Basic Data
Vocational skills areas implemented in
Ohio during fiscal year 1968
Regular term2S
Summer term26
Approximate percent of Ohio districts imple-
menting vocational skills areas
Districts with regular term
scheduling
Districts with summer term
scheduling
6%
6%
Reported participants in vocational skills
areas
Regular term participants 3,216
Summer term participants 1,189
Total, including duplication 4,405
Reported expenditures for vocational skill
areas
Regular term expenditures $448,906
Summer term expenditures $223,117
Total expenditures $672,023
Observations and Other Data
Of all eight primary areas, the vocational skills area involved the
lowest numbers of participants in the regular and summer terms,
respectively.
60% of the reported expenditures for vocational skills areas during
fiscal year 1968 was used for salaries and employee benefits.
10% of the reported expenditures during fiscal year 1968 was used for
equipment compared with 26% during fi&cal year 1967. A partial ex-
planation for this difference is the "tooling up" nature of first
year vocational skills programs.
51% of the participants during the regular term were boys compared
with 61% during the summer term.
SO
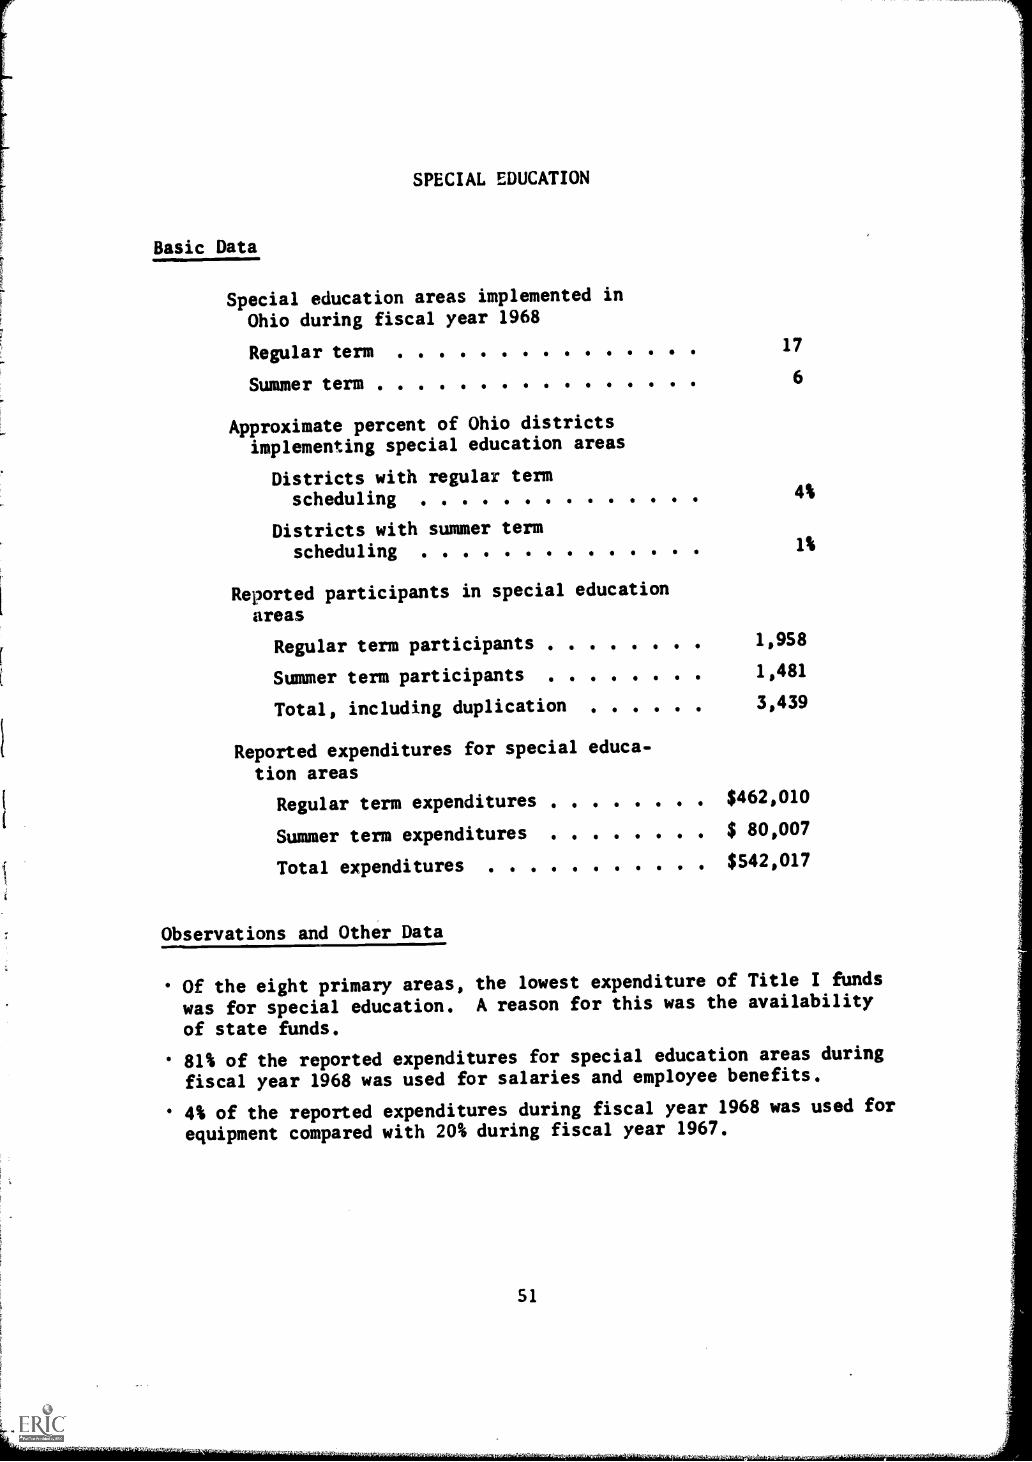
SPECIAL EDUCATION
Basic Data
Special education areas implemented in
Ohio during fiscal year 1968
Regular term 17
Summer term 6
Approximate percent of Ohio districtsimplementing special education areas
Districts with regular termscheduling
Districts with summer termscheduling
4%
1%
Reported participants in special education
areas
Regular term participants 1,958
Summer term participants 1,481
Total, including duplication 3,439
Reported expenditures for special educa-
tion areas
Regular term expenditures $462,010
Summer term expenditures $ 80,007
Total expenditures $542,017
Observations and Other Data
Of the eight primary areas, the lowest expenditure of Title I funds
was for special education. A reason for this was the availability
of state funds.
81% of the reported expenditures for special education areas during
fiscal year 1968 was used for salaries and employee benefits.
4% of the reported expenditures during fiscal year 1968 was used for
equipment compared with 20% during fiscal year 1967.
51

TABLE
30. NUMBER AND GRADE RANGE OF PARTICIPANTS IN SIX
PRIMARY INSTRUCTIONAL AND SERVICE AREAS
Grade
Range
rrimar
instructional ana Service Areas
Preschool
Education
Pupil
Personnel
Services
Health
Education/
Services
Arts and
Humanities
Vocational
Skills
Special
Education
Regular
Term
Summer
Term
Regular
Term
Summer
Term
Regular
Term
Summer
Term
Regular
Term
Summer
Term
Regular
Term
Summer
Term
Regular
Term
Summer
Term
PreK-K
7,227
1821
991
38
1,828
so
38
83
61
1-3
3,713
913
9,779
2,290
8,635
1228
447
532
4-6
5,936
1,695
10,008
3273
9,656
1823
951
1,038
606
7-9
5,751
1,592
4,880
1,050
1,965
950
558
417
281
142
10-12
1,8
1,314
1,477
386
241
241
2,649
721
109
40
TOTAL
7,227
1,821
18,359
5,552
27,972
7,098
23,499
4,280
3,216
1,189
1,958
1,481

TABLE 31. CORE AND SUPPORTIVE ACTIVITIES OF SIGNIFICANCE WITHIN SIX
PRIMARY INSTRUCTIONAL AND SERVICE AREAS
PrimaryArea
Core Activitiesof Significance
Supportive Activitiesof Significance
Preschooleducation
1. Pre-kindergartenactivities
2. Regular kinder-garten activities
1. School social work (includinghome-school visiting)
2. Physical development (motorcoordination)
3. Efforts to improve self concer4. Dental health services
Pupilpersonnelservices
1. Extracurricular andsocially orientedschool activities
2. Efforts to improveattitude/motivation
3. Elementary guidance
1. Speech and hearing therapy2. Language arts (communication
skills, grammar, writing,spelling)
3. Arts and humanities (general)
Healtheducationservices
1. Dental health services2. Health education3. Medical health services4. Physical development
(motor coordination)
1. Efforts to improve self concep'2. Efforts to improve emotional/
social health
Arts andhumanities
1. Fine arts (general)2. Music appreciation3. Arts and humanities
(general)
1. Efforts to improve attitude/motivation
Vocationalskills
1. Vocational awareness/orientation
2. Work study
1. Guidance services (general)by counselor
2. Individual counseling bycounselor or psychologist
3. Efforts to improve attitude/motivation
4. Language arts (communicationskills, grammar, writing,spelling)
Specialeducation
Activities for theemotionally distilrbed
2. General specialeducation activities
1. Arts and crafts2. Physical development3. Food services4. Language arts (communication
skills, grammar, writing,spelling)
53

TABLE
32, EXPENDITURES
BY SPECIFIED CATEGORIES FOR SIX PRIMARY INSTRUCTIONAL AND SERVICE AREAS
Expenditures
Category
Primary Instructional and Service Areas
Preschool
Education
Pupil
Personnel
Services
Health
Education/
Services
Arts and
Humanities
Vocational
Skills
Special
Education
Staff expansion/
extended time of
current staff
$2,214,038
$1,413,252
$975,667
$551,662
$405,137
$436,327
In-service
training
15,868
46,861
10,470
8,329
1,137
3,228
.
Equipment
18,466
43,626
4
44,133
11,434
.
68,145
.
21,676
Educational
materials and
supplies
68,128
66,524
71,959
68,041
49,488
28,986
Transportation
28,934
11,404
18,898
29,802
10,561
17,597
Other
174,710
90,237
161,376
48,545
137,555
34,203
TOTAL
$2,520,144
1
$1,671,904
$1,282,503
$717,813
$672,023
$542,017
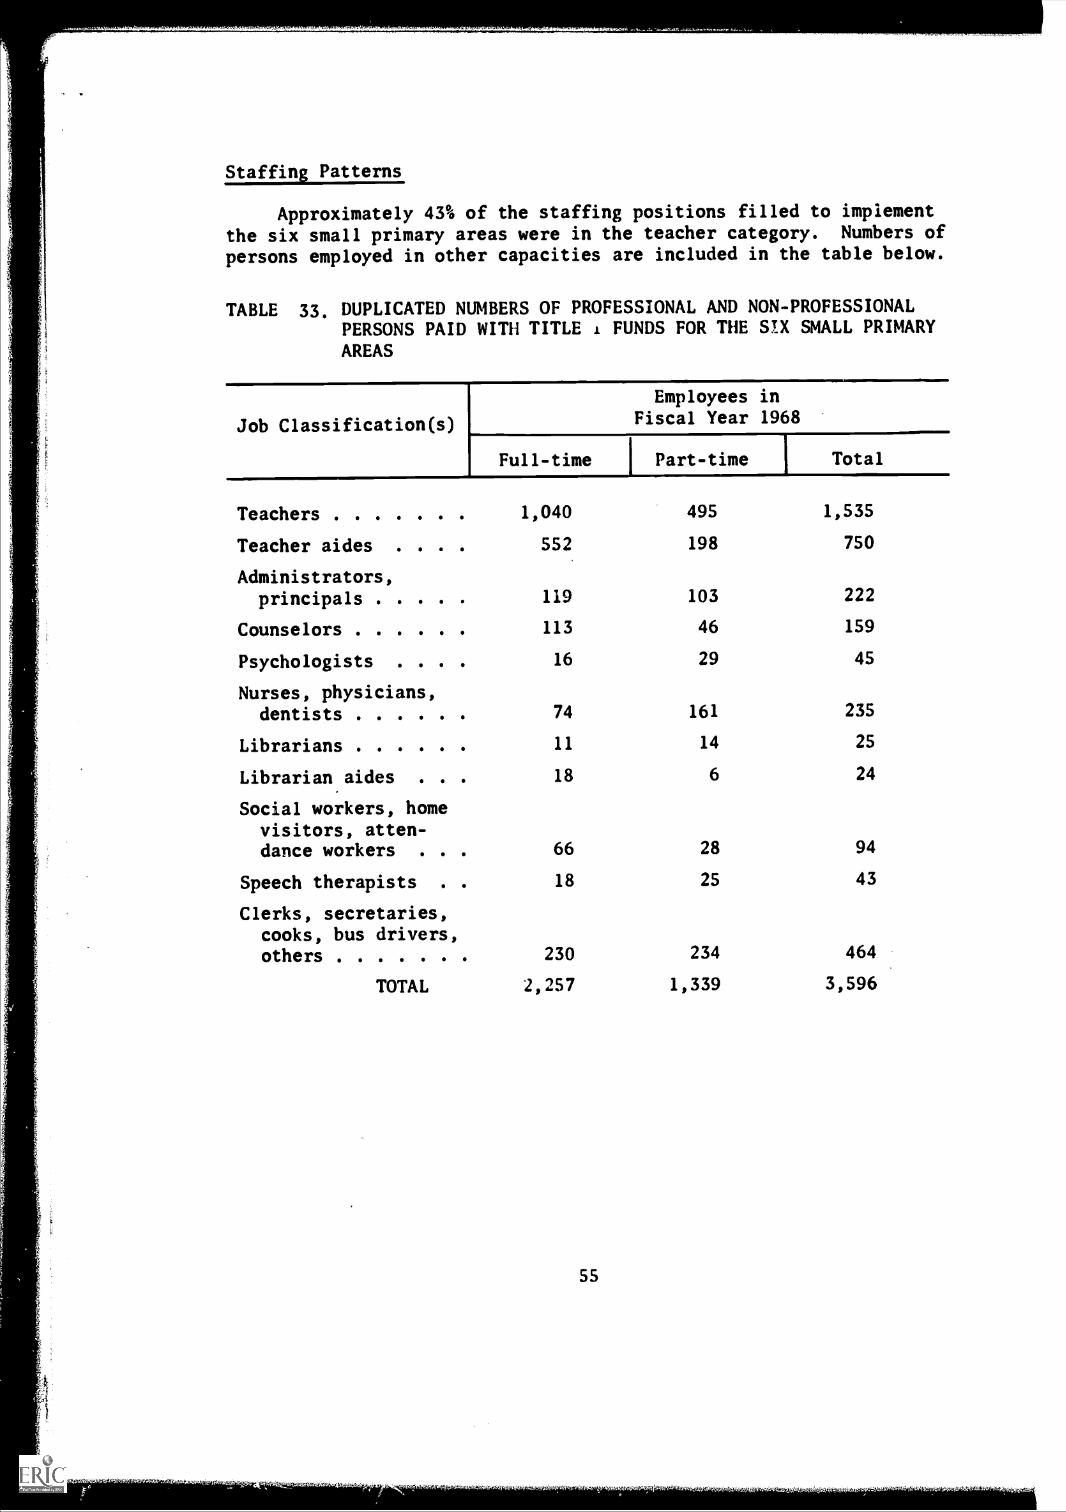
Staffing Patterns
Approximately 43% of the staffing positions filled to implementthe six small primary areas were in the teacher category. Numbers of
persons employed in other capacities are included in the table below.
TABLE 33. DUPLICATED NUMBERS OF PROFESSIONAL AND NON-PROFESSIONALPERSONS PAID WITH TITLE i FUNDS FOR THE SIX SMALL PRIMARY
AREAS
Job Classification(s)
Employees inFiscal Year 1968
Full-time 1_ Part-time I Total
Teachers 1,040 495 1,535
Teacher aides 552 198 750
Administrators,principals . . 119 103 222
Counselors 113 46 159
Psychologists . 16 29 45
Nurses, physicians,dentists 74 161 235
Librarians 11 14 25
Librarian aides . . 18 6 24
Social workers, homevisitors, atten-dance workers 66 28 94
Speech therapists . 18 25 43
Clerks, secretaries,cooks, bus drivers,others 230 234 464
TOTAL 2,257 1,339 3,596
55

CHAPTER V
CONCLUSIONS AND RECOMMENDATIONS
Based on the information presented in this report, on discussionsby state officials with many educators, and on observations made bystate officials during on-site visits of programs, the following con-clusions and recommendations are offered:
Conclusions
The number of students that can be effectively served by any onedistrict depends on needs of children and on allocated funds.
Many Ohio Title I participants are improving their academic abilities,particularly in the communication skills and mathematics/science areas.
The attitude and motivation of many participants for doing school-typeactivities have reportedly improved.
Programs concentrated in the elementary grades, particularly grades 1-3,are more often successful than those spread from K-12.
When teachers and teacher aides are provided in-depth inservice training,a program is more likely to have a positive impact.
Specific questions concerning effectiveness of a local program, or ofa program component, must be answered at the local level.
Each district should--in addition to compiling data needed on the statelevel--systematically assess criteria for selecting participants andapproaches used in program implementation.
Recommendations
To effect positive change, Title I efforts should be concentrated on afew students rather than thinly spread to many students.
Program emphasis should be placed on readiness or preventive measuresthat should alleviate--over a period of years--the need for concen-tration on remedial and corrective measures.
New approaches should be tried, if they appear to offer maximum servicesand activities within reasonable cost limits.
Based on pertinent needs of project participants, services of necessarycounselors, psychologists, and other professionals should be provided.
In-depth inservice training should be provided to teacher aides.
Use of Title I funds during the summer term should, in most cases, belimited to regular term participants who need follow-up activities.
Local evaluative data should be studied carefully; then, program empha-sis and intensity shifted, as deemed advisable.
Title I should be interrelated with regular school programming.
Other sources of money that could be used to supplement or expand localTitle I programming should be investigated.
S7