Embed Size (px)
Citation preview
1
Do School Lunch Menus Influence National School Lunch Program Participation?
Janet G. Peckham Graduate Student, Clemson University
[email protected] (Corresponding author)
Jaclyn D. Kropp Assistant Professor, University of Florida
Thomas A. Mroz
Professor, Clemson University [email protected]
Vivian Haley-Zitlin
Associate Professor, Clemson University [email protected]
Ellen M. Granberg Associate Professor, Clemson University
Nikki Hawthorne Director of Food & Nutrition Services,
Anderson 5 School District [email protected]
Selected Paper prepared for presentation at the Agricultural & Applied Economics
Association’s 2013 AAEA & CAES Joint Annual Meeting Washington, DC, August 4-6, 2013.
Abstract: The National School Lunch Program (NSLP) is one of the largest nutrition assistance programs in the United States, providing free and reduced-price lunches for income-eligible students as well as minimally subsidizing paid lunches for students that do not qualify to receive free or reduce-price lunches. Although the levels of nutrient deficiencies vary slightly across studies, the majority of the research concedes that NSLP participants consume more fats and sodium than non-participants, which may lead to higher rates of overweight and obesity. Furthermore, differences across income in dietary intake among NSLP participants may be an underlying cause of the previous mixed results. In this study, we investigate the relationship between income-eligibility status (Free, Reduced, or Paid) and entrée selection. Using a unique dataset tracking daily entrée choices and their nutritional value among elementary students at a suburban school district, this paper provides a novel approach to understanding the healthfulness of the NSLP. We find that while controlling for age, gender, and race, students that purchase free lunch choose entrees with less sodium than students purchasing either reduced-price or paid lunches. Relative to students purchasing free-lunches, students purchasing paid lunches also choose entrees with more protein and fat and entrees with fewer carbohydrates. JEL: D12, I18, I38 Q18 Keywords: National School Lunch Program, Obesity, Point of Sale Data
Copyright 2012 by Peckham, Kropp, Mroz, Haley-Zitlin, Granberg, & Hawthorne. All rights reserved. Readers may make verbatim copies of this document for non-commercial purposes by any means, provided that this copyright notice appears on all such copies.
2
Introduction
The National School Lunch Program (NSLP) is one of the largest nutrition assistance
programs in the United States, providing free and reduced-price lunches for income-
eligible students as well as minimally subsidizing paid lunches for students that do not
qualify to receive free or reduce-price lunches. In 2011, over five billion lunches were
served to an average of 31.7 million students per day (U.S. Department of Agriculture
2012). When the program was introduced in 1946, the ‘Type A’ qualifying lunch offered
was designed to provide one-third to one-half of the daily food requirements of a ten- to
twelve-year-old child (Ralston et al. 2008). As nutritional knowledge progressed over
time, the Type A lunch was updated to reflect these advancements. New guidelines
effective beginning in the 2012/13 school year align the required food components of a
Type A lunch provided by the NSLP with the 2005 Dietary Guidelines for Americans as
required by the Richard B. Russell National School Lunch Act (U.S. Department of
Agriculture 2012). Specifically, the new guidelines increase the availability of healthful
foods (fruits, vegetables, and whole grains), while reducing the levels of sodium and
saturated fats and controlling calorie levels of the offered items. Although schools that
offer the National School Lunch Program (NSLP) must adhere to the United States
Department of Agriculture’s guidelines regarding menu offerings, individual schools
have the ability to select the components offered on any particular day and generally offer
several entrée options. The offerings at a given school on a particular day generally differ
in the nutritional content and healthfulness.
In this study, we investigate the relationship between income-eligibility status
(Free, Reduced, or Paid) and entrée selection. As previously indicated, some NSLP
3
participants are eligible to receive free lunches, other pay a reduced-cost, and some pay
the full-price. Specifically, students from households with household incomes of 130
percent of the poverty line or less are eligible to receive free lunches, while students from
households with household incomes between 130 percent and 185 percent of the poverty
line are eligible to receive reduced-price lunches; roughly 69 percent of all lunches
served are free or reduced-price lunches (Food and Nutrition Service 2013). Students
from households with household incomes exceeding 185 percent of the poverty line are
income-ineligible to receive free or reduced-price lunches, but may purchase “full-price”
lunches.1 Thus the nutritional standards of the NSLP may impact children of various
socio-demographic backgrounds.
Previous research investigating the healthfulness of the NSLP is mixed. Recent
studies have found positive correlation between participation in the NSLP and child
weight (Millimet, Tchernis, & Husain 2010; Schanzenbach 2009) and energy
consumption (Campbell et al. 2011). However, Campbell et al. (2011) also find that
dietary quality between participants and non-participants is the same over the course of a
day, suggesting participants consuming more calories at lunch may eat fewer calories at
breakfast and dinner. Gleason and Suitor (2003) estimate that at lunch, NSLP
participants on average consumed ninety-five percent more sodium than recommended
while non-participants consumed eighty-eight percent more sodium than recommended.
The authors also find that relative to non–participants (students presumably bringing
lunch from home), NSLP participants consume more dietary fat as a percentage of
calories. A recent study by Hanson and Olson (2013) compares the dietary intake of low-
1 In 2012, the poverty line for a family of four was $23,050 (U.S. Department of Agriculture 2012). 2 If parents have a change in income at anytime during the school year, they can apply for a change in
4
income NSLP participants and high-income NSLP participants. The authors find that
while all participants consumed more saturated fats and sodium than non-participants,
high-income participants had lower saturated fat intake than low-income NSLP
participants.
Although the levels of nutrient deficiencies vary slightly across studies, the
majority of the research concedes that NSLP participants consume more fats and sodium
than non-participants, which may lead to higher rates of overweight and obesity. This is
particularly concerning since low-income minorities are both at greater risk for obesity
and more likely to participate in the NSLP, creating the potential for positive selection
bias (Ogden & Carroll 2010). Furthermore, differences across income in dietary intake
among NSLP participants may be an underlying cause of the previous mixed results.
Using a unique dataset tracking daily entrée choices among elementary students at a
suburban school district, this paper provides a novel approach to understanding the
healthfulness of the NSLP.
Data
Data were collected from the Anderson 5 School District in South Carolina, a suburban
district with approximately 12,500 students in pre-kindergarten to twelfth grade.
Student-level daily point of sale (POS) data were obtained from the Food and Nutrition
Services department cafeteria transactions logs for the period Jan 7, 2013 to April 30,
2013. The data were collected after implementation of new nutritional guidelines. In the
cafeteria, students complete transactions by entering their unique personal identification
number (PIN). The PIN is linked to account information regarding lunch price status and
5
available funds; parents or students may add money to accounts at any time of the year.
We utilized the PIN to track student-level purchases over the study period.
For students purchasing a NSLP qualifying lunch, the cashier enters “Entrée 1”,
“Entrée 2”, or “Vegetarian Entrée” and the student’s account is debited the appropriate
amount given the student’s income-eligibility status (Free, Reduced, or Paid)2. The
entrée numbers coincide with the order in which the entrées are listed on the monthly
menus. The three daily entrees come with a choice of sides; this information is not
entered into the POS database. Students may also have the opportunity to purchase a la
carte foods, such as dessert, milk, or chips. These purchases are also recorded. However,
the POS data on these purchases is not as clearly defined: the cashier may ring up a
cookie as “Dessert” or use another button with an equivalent price. Furthermore, the
manner in which these transactions are recorded is not yet standardized at the district-
level. In Anderson 5 elementary schools, a la carte transactions account for less than 0.5
percent of total transactions. Given the available data, this paper focuses only on entrée
purchases.
POS data were collected for each school day between January and April 2013 at
the district’s eleven elementary schools. We limit the sample to elementary schools
because they offer fewer a la carte options (food choices that are available for purchase
outside of a qualifying NSLP lunch) than middle or high schools and a larger percent of
K-5 students typically participate in the NSLP than middle or high school students (Fox
& Condon 2012). The district also provided all enrolled students’ race, gender, and grade
2 If parents have a change in income at anytime during the school year, they can apply for a change in eligibility. This occurred for 174 students between January and April. In these cases, the lowest income level is used. For example, if a student’s status changes from “paid” to “reduced,” the student is considered reduced-price lunch status for the entire school year.
6
level information. Thus, the dataset includes the race, gender, and grade level of all
students (including those students that do not have POS data because they have not
purchased a NSLP lunch or a la carte item) and POS and income eligibility status data on
students that have purchased a NSLP lunch at least once. If a student is recorded as
attending school on a day he does not purchase a lunch, we assume the child has brought
a lunch from home.
Each school district participating in the National School Lunch Program creates a
lunch menu following the guidelines for a reimbursable lunch set by the USDA. As of
July 2012, the federal guidelines for kindergarten through fifth grade require participating
schools to offer at least one option for each of the five meal components each day. The
five meal components that must be offered daily are: 1) meat or meat alternative, 2) bread
or grain, 3) fruit, 4) vegetable, and 5) milk (U.S. Department of Agriculture 2012). Total
calories per lunch must fall between 550 and 650kcal, and, beginning in the school year
2014/15, total sodium can be no greater than 640mg per lunch. Districts were given more
time to meet the new sodium guidelines because it will be challenging for many as the
existing vendors and suppliers may need to modify their products to meet these standards.
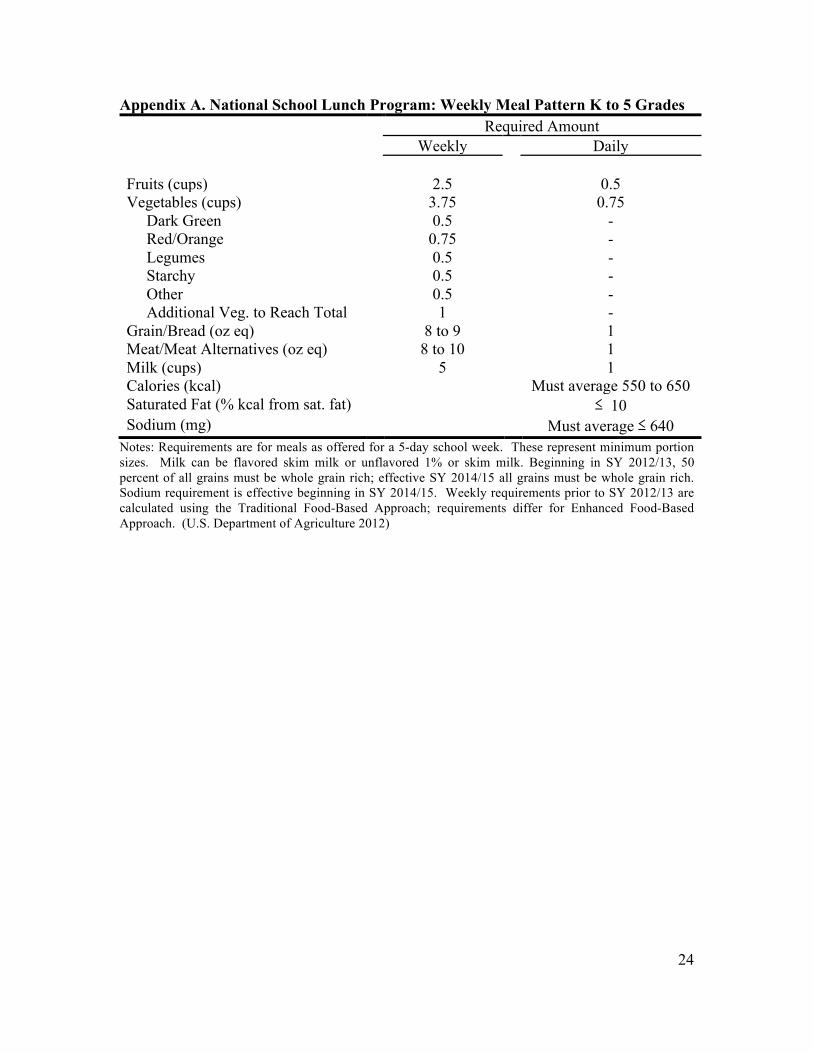
For a summary of the federal guidelines, see Appendix A. Additionally, South Carolina
requires that each school offer at least two different entrees and vegetables and
recommends each school offers two or more fruits (Center for Disease Control and
Prevention 2007).
Anderson 5 Food and Nutrition Service creates monthly school lunch menus that
meet or exceed the guidelines for a reimbursable lunch. Students and parents can access
school lunch menus on-line and menus are also sent home with each student on a
7
monthly basis. Thus caregivers and students are aware of what is being served for lunch
in the school cafeteria and can use this information when deciding to buy a school lunch
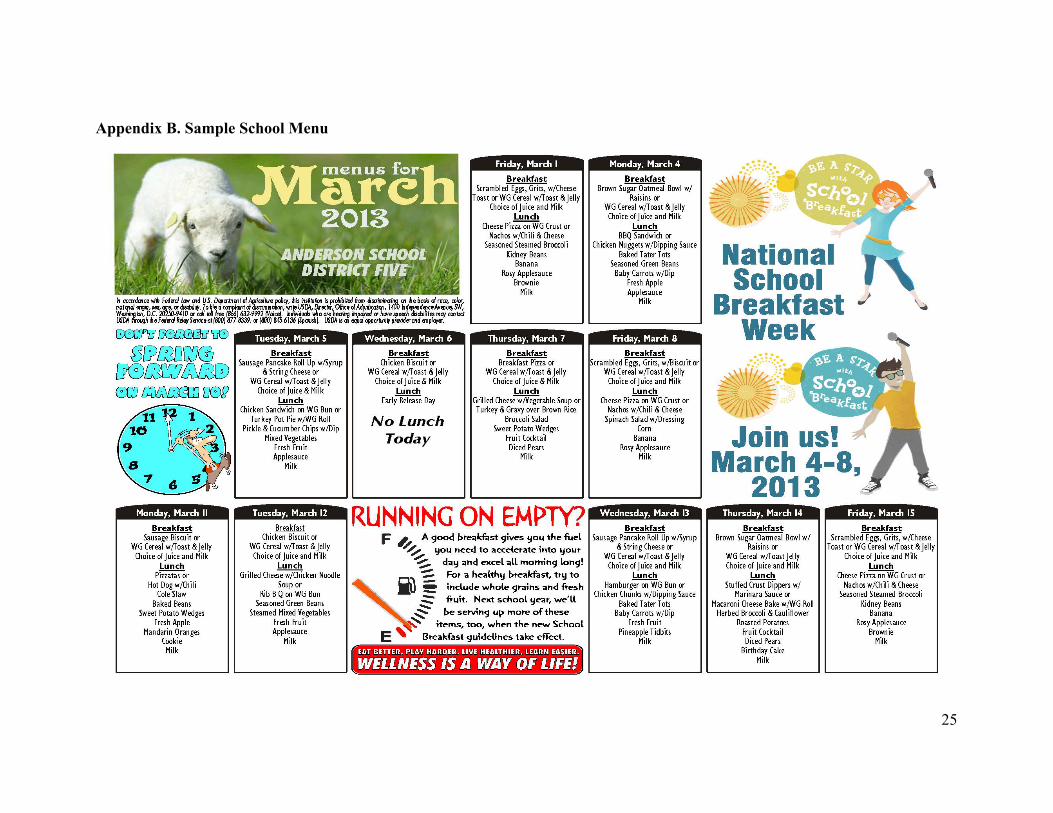
or bring one from home. On a typical day, a student has three entrée choices, two fruit
options, two vegetable options, and milk options to choose from (see Appendix B for an
example of a monthly menu). In order to be considered a qualifying lunch (in which the
school is reimbursed by the government), a student must select a minimum of three items,
one of which must be a fruit or vegetable.
In the Anderson 5 School District, menu offerings are set at the district-level.
During the period of investigation, there were 37 different entrée options offered in
rotation. Most entrees provide the meat/meat alternative as well as a bread or grain
(starch). Five entrees do not include a starch. Nutrition information for each of the
entrées served (provided by the school district nutrition services director) includes total
calories (kCal), fat (grams), sodium (milligrams), protein (grams), and carbohydrates
(grams) per entrée. In some cases, the district uses more than one vendor for the same
entrée option and it is therefore difficult to determine the nutritional information of a
specific food item served on a particular day at a particular elementary school from the
nutritional information provided by the district. For food items supplied by multiple
vendors, we calculated the median nutritional values of each food item and used that to
estimate the calories and nutrients in the entrees offered. Once a month, a “Manager’s
Choice” entrée is served. On these days, the cafeteria managers of each elementary
school select the menu and therefore the offerings vary across elementary schools. These
days are discarded because nutrition content information could not be calculated for this
option without access to each cafeteria’s daily production records.
8
Methods
Our analysis begins with ordinary least squares regression (OLS) of each macronutrient
and the available student demographics. This simple model will help determine whether
grade level, gender, school location or race impacts the nutritional value of the chosen
entrée. Let Yi be the total nutrient value in the ith entrée purchased
(1) Yi =! i + "xi# + Schoo "li$ + % i
The model will be estimated once for each nutrient in the dataset: Calories, Fat, Sodium,
Protein, and Carbohydrates. The vector !xi includes the grade-level (kindergarten to fifth),
gender (male and female), income-eligibility (free, reduced, and paid status) and race
(white, black, Hispanic, and other) of the student purchasing the ith entrée. Let grade-
level act as a proxy for age and income-status as a proxy for family income. Lastly, a
vector of dummy variables, Schoo !li , indicating which elementary school the ith entrée is
purchased is included. The model includes categorical variables Race, Status, Gender,
School, and Grade. There are eleven elementary schools in Anderson 5; we maintain
confidentiality by labeling each school 1 through 11.
Results
Descriptive Statistics
Forty-seven percent of district students are enrolled in one of eleven elementary schools.
The spring 2013 semester began on January 7 and POS data were collected through April
30. In the 66 school days represented in the dataset, 5,592 students purchased 279,698
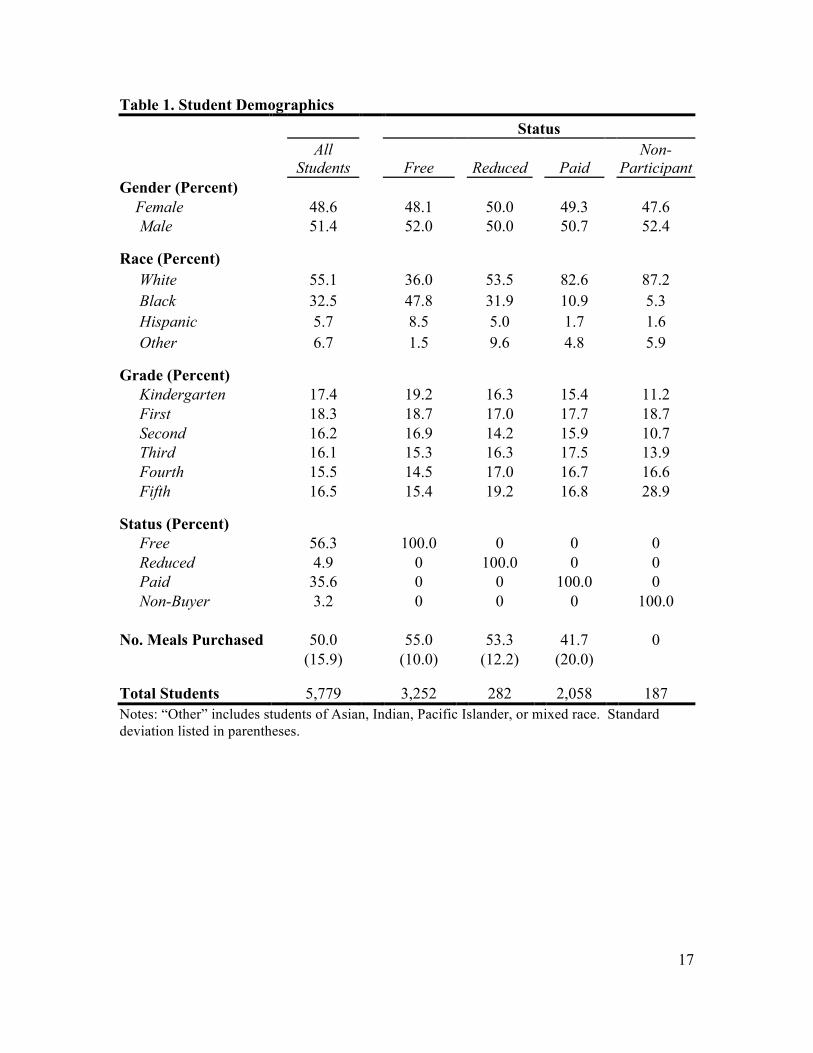
school lunches. An additional 187 elementary students never purchased lunch. Table 1
provides summary statistics for the key demographics. Students are evenly distributed
across kindergarten through fifth grades. The majority of elementary aged students are
9
white, 33 percent are black, and 6 percent are Hispanic. Fifty-six percent of students
receive lunch for free and 36 percent of students pay full price for school lunch. Only 3
percent of elementary school students did not receive a NSLP lunch at least once during
the sample period. These students will be referred to as “Non-Participants” and should
not be confused with students receiving a free NSLP lunch.
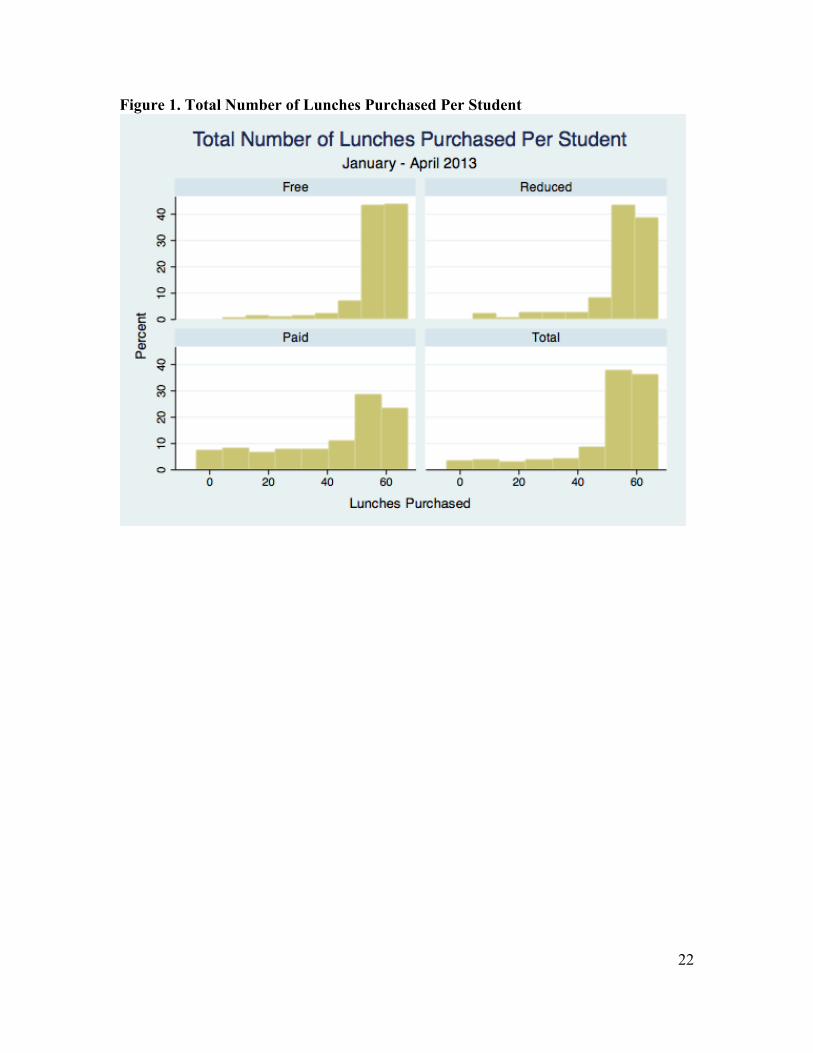
On average, a participating student purchased 50 school lunches in the 66 day
sample period. Histograms in figure 1 show that the distribution of lunches purchased
differs depending on lunch-price status, with the average free-lunch student purchasing
13 more lunches (about 1 more per week) than the paid-lunch students. The five most
purchased entrees are the “Vegetarian Tray” (12.5 percent of sales), “Chicken Sandwich
on Whole Grain Bun” (10.6 percent) “Chicken Nuggets with Dipping Sauce” (9.0
percent) “Cheese Pizza on a Whole Grain Crust” (7.4 percent), and “Hamburger on
Whole Grain Bun” (6.6 percent). However, these entrées are also offered more often
than others, i.e. the “Vegetarian Tray” consists of a yogurt, cheese, and crackers and is
available every day. Given the number of days it is offered, the daily vegetarian option is
actually one of the least popular entrees, averaging 528 transactions per day.
Using the average number of purchases per day for the days that the item was
offered, the most popular entrée is “Chicken Nuggets with Dipping Sauce” (3,144 entrees
purchased per day offered). Moreover, if all breaded bite-size chicken-style entrée
transactions are combined (including chicken nuggets, chicken chunks, and popcorn
chicken; served with or without a whole grain roll), bite-size chicken is served 13 days
(19 percent of days sampled) with an average of 4,178 purchases per day. A nationally
representative 2004-2005 study assessing school nutrition found 17 percent of daily
10
menus offered some type of breaded/fried chicken product, so Anderson 5 may offer this
type of entrée slightly more than other school districts (Gordon et al. 2007). Similarly, if
all pizza-style entrée transactions are combined (including cheese pizza, pepperoni pizza,
pizzatas, and stuffed crust dippers3), pizza-style entrees are served more than 30 percent
of all days sampled, but only an average of 2,375 entrees are purchased per day offered.
The least popular entrees, measured by both percent of total sales and purchases per day
offered are “Enchilada Pie with Whole Grain Roll” (0.12 percent of sales, 169 entrees
purchased per day offered) and “Fish Nuggets with Dipping Sauce” (0.24 percent, 338
entrees per day).
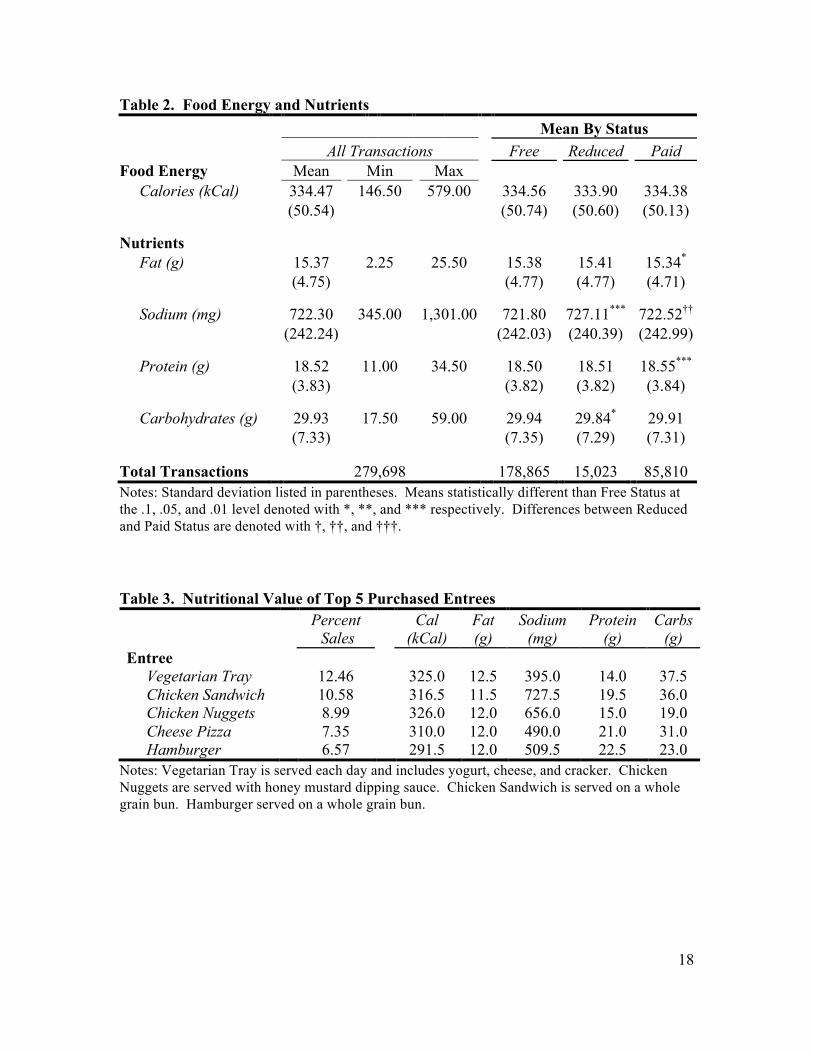
Table 3 provides the nutritional values for the five most purchased entrees and
Appendix B contains nutritional values and popularity ranking for all entrée options
offered during the sample period. On average, an entrée contains 340 calories, 15g fat,
783mg sodium, 32g protein, and 19g carbohydrates. There are no federal mandates
regarding the nutrition of an NSLP entrée, so without the nutritional information of the
other food components offered, we are unable to determine whether or not the average
lunch meets guidelines. However, the guidelines do require that a NSLP lunch provide
between 550 and 650 calories (averaged over the week), leaving little wiggle room for
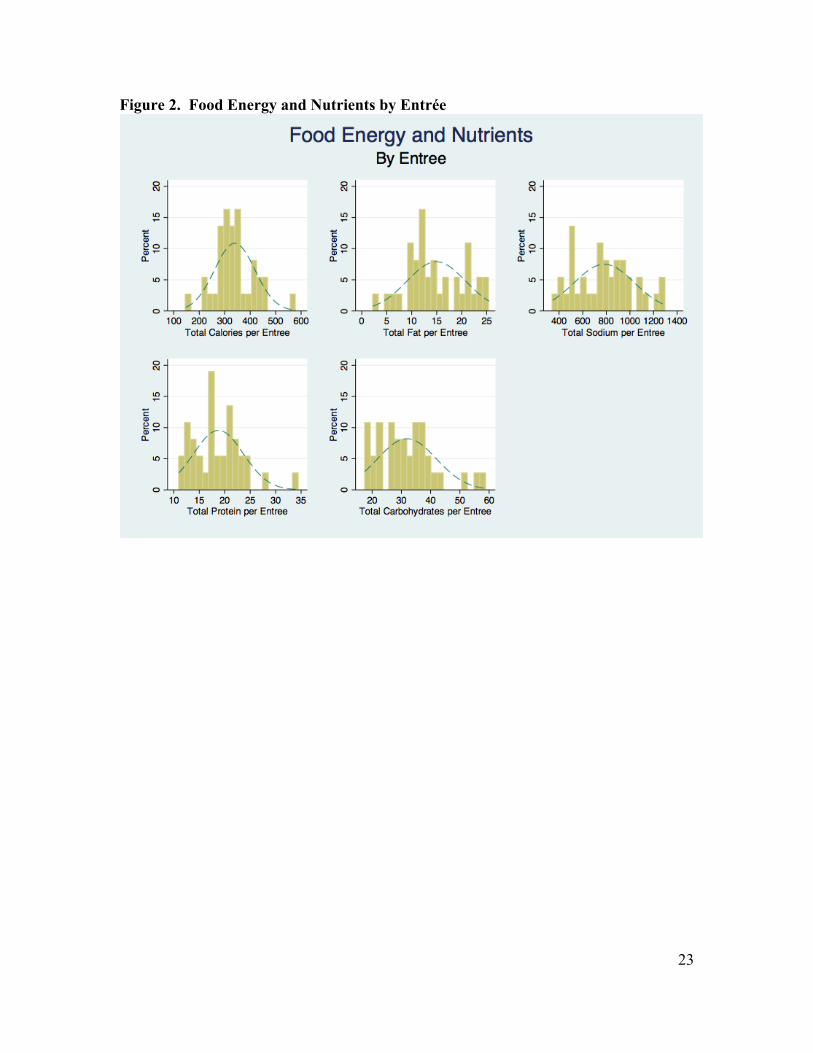
very energy dense entrees. Figure 2 illustrates the distribution of the total nutrients per
entrée. More than half of the 37 entrees have between 233 and 320kcal. The entrée
highest in calories is “Chicken Alfredo with a Whole Grain Bun” (579 calories) and was
only served once in our sample period. The entrée lowest in calories is “Deli Sliced
Turkey on a Whole Grain Bun” (146.5 calories) and was only served twice. “Deli Sliced 3 Stuffed crust dippers are mozzarella cheese wrapped in pizza crust (Rich’s Food Service 2011a) and served with marinara sauce. Pizzatas are mozzarella cheese, pepperoni, and marinara sauce wrapped in pizza crust (Rich’s Food Service 2011b).
11
Turkey on a Whole Grain Bun” is also the entrée lowest in fat (2.2 grams). The “Rib-B-
Q on a Whole Grain Bun” has the highest amount of fat (25.5 grams). Average total
sodium is greater than the 640mg cap effective 2014/15, and more than half the entrees
have sodium levels greater than 640mg. Total sodium ranges from 345mg in “Italian
Spaghetti” to 1,301mg in “Grilled Cheese with Chicken Noodle Soup.”
According to the 2004-2005 School Nutrition Dietary Assessment (SNDA-III),
entrees can contribute as much as 61 percent of the total protein in an NSLP elementary
school lunch (Gordon et al. 2007).4 “Grilled Cheese” offers the least protein and
“Chicken Alfredo with a Whole Grain Bun” offers the most protein. In this case, the
entrée with the most protein is also the entrée with the highest calories. When
transactions are separated by lunch-price status, the average nutritional values remain
similar. However, there are a few statistically significant but numerically small
differences. For example, paid-status lunches have 0.04 fewer grams of fat than free-
status lunches on average (see Table 2).
Regression Results
It is important to remember that the data provide information on the entrée choice a
student makes and the corresponding nutritional values. Recall that the dependent
variables, Yi, do not measure the nutrients consumed, only the nutrients purchased. For
example, a positive coefficient on Gender would suggest that boys are systematically
choosing entrees that are more energy dense (when Yi = Calories) than girls. We would
not know if boys are simultaneously choosing side items with fewer calories, or if girls
are choosing more energy dense entrees and do not eat it all.
4 SNDA-III categorizes food groups differently than this paper. Our “Entrée” includes the following SNDA-III major food groups: combination entrees, meat/meat Alternatives, and bread/grains.
12
Calories
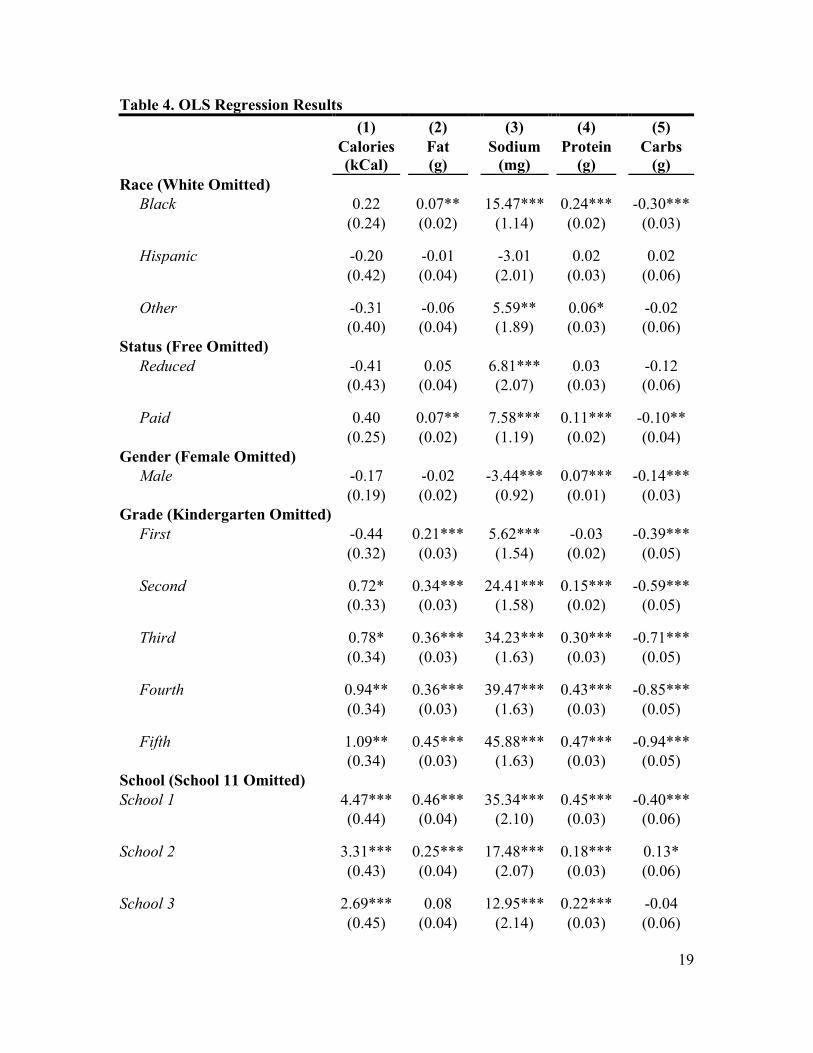
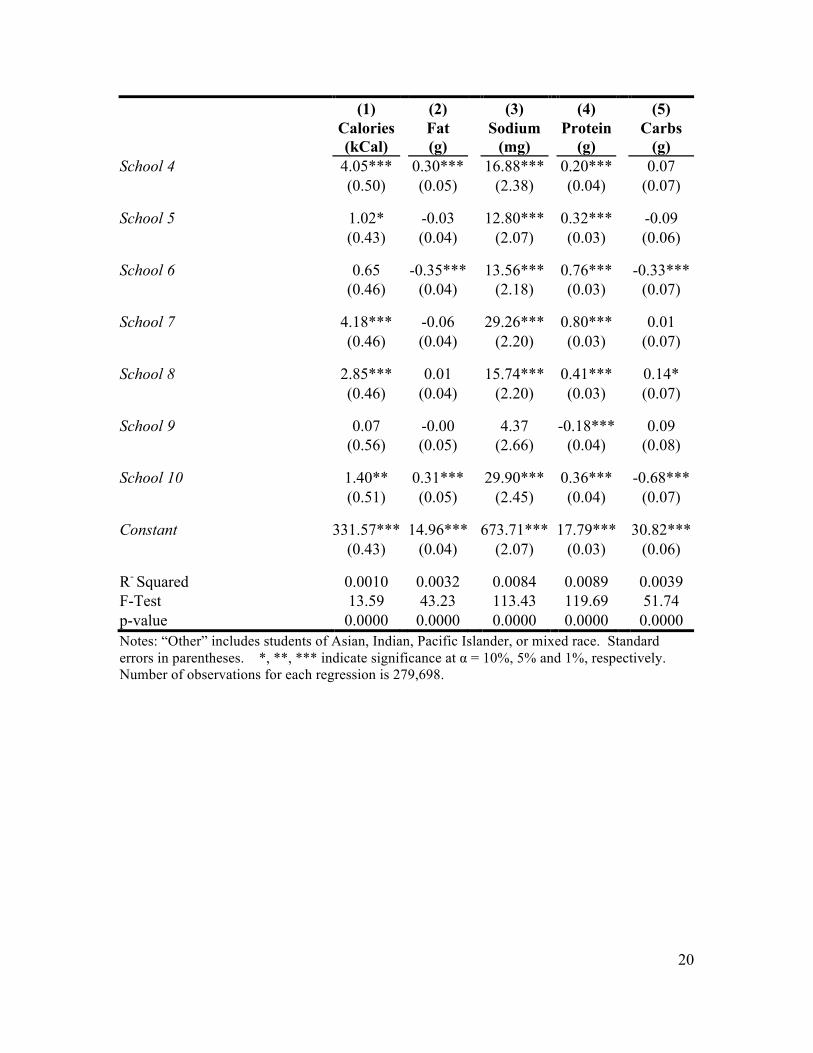
Race, Status, and Gender are not statistically significant (Table 4). Grade, our proxy for
age, is significant. Relative to kindergartners, students in second to fifth grade choose
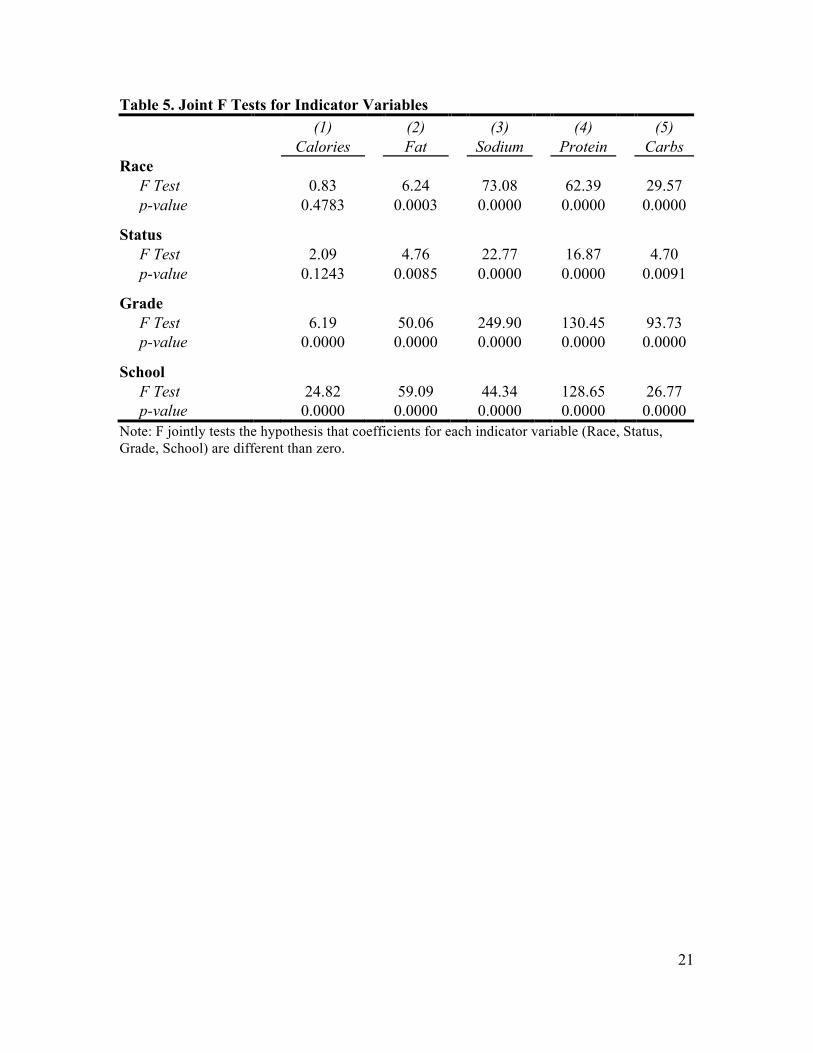
entrees with more calories. Joint F-tests for Status and Race fail to reject the null
hypothesis: neither income-eligibility status nor race influence the caloric content of a
student’s choice of entrée (Table 5).
Fat
The results for estimates pertaining to Fat are similar to the results pertaining to Calories.
Black students purchase entrees with more fat than white students, but the resulting
difference is negligible. The hypothesis that there is no significant difference across all
Race groups is rejected in favor of the alternative; similar results are found with Grade.
Like the Calories model, the R2 is very small: less than one-hundredth of a percent of
variation in Fat can be explained by the explanatory variables. The coefficient for
income-ineligible students (Paid Status) is significant and positive, suggesting that
students purchasing a paid-lunch choose entrees with more fat than students purchasing
free lunch. The joint F tests conclude that all four groups of explanatory variables
contribute to the total fat grams a student is served.
Sodium
Compared to white students, black, Asian, Indian, Pacific Islander, or mixed race
(“Other”) students all choose higher sodium entrees than white students. Students
receiving free lunch (Free Status) choose entrees with less salt than students receiving
reduced-price or full-price lunches. The coefficient on Gender was also statistically
significant: male students chose lower sodium entrees than female students.
13
As in the model where Fat is the dependent variable, as students get older, they
choose entrees with greater amounts of sodium. First graders choose entrees with 5.6mg
more than kindergartners while fifth graders choose entrees with 45.9mg more sodium.
The joint F tests conclude that all four groups of explanatory variables contribute to the
total sodium a student is served.
Protein
When controlling for income, gender, age, and race, black students choose entrees with
0.24 more grams of protein than white students (the amount of protein in 3 baby carrots
(U.S. Department of Agriculture 2011)). The coefficients for Other Race and Gender are
also statistically significant, but very small in magnitude (0.06 and 0.07g, respectively).
Income-ineligible students choose entrees with 0.11g more protein than income-eligible
students purchasing a free lunch. Similarly to the model for sodium, older students
choose entrees with statistically larger amounts of protein.
Carbohydrates
In the final nutrient analysis, the joint F-tests suggest that Race, Status, Gender, Grade,
and school contribute to the total carbohydrates a student is served. The coefficient for
Black (compared to White) is negative and statistically significant but small in magnitude.
The same is true for the coefficient for Paid Status (vs. Free lunch students) students.
We also find male students choose entrees with 0.14 fewer carbohydrates than female
students. Additionally, younger students prefer entrees with more carbohydrates than
older students.
14
Conclusion
In this study, we investigate the relationship between income-eligibility status (Free,
Reduced, or Paid) and entrée selection. Using a unique dataset tracking daily entrée
choices and their nutritional value among elementary students at a suburban school
district, this paper provides a novel approach to understanding the healthfulness of the
NSLP. Without controlling for age, gender, or race, there is no difference in the caloric
content of entrees selected by students purchasing free, reduced-price, or paid lunches.
Conversely, students purchasing paid-lunches choose entrees with less fat and sodium
than students purchasing free lunches. When controlling for age, gender, and race,
students that purchase free lunch choose entrees with less sodium than students
purchasing either reduced-price or paid lunches. Relative to students purchasing free-
lunches, students purchasing paid lunches also choose entrees with more protein and fat
and entrees with fewer carbohydrates.
There was no statistically significant effect of status on total calories. Due to the
new guidelines requiring each qualifying lunch to have an average of 550 to 650 calories,
there was a narrow distribution of calories among the 37 entrees offered at Anderson 5
elementary schools. The new guidelines also require sodium levels to be less than 650mg
per meal, but this will not be effective until the 2014/15 school year. Future research
may compare the distribution of sodium among entrees before and after the guideline
come into effect.
15
References
AdvancePierre Foods. 2013. Smokie grill pork rib pattie with honey bbq sauce. Other Fully Cooked Unbreaded Products. Accessed 28 May 2013. http://www.advancepierre.com/products/3717_Smokie-Grill-Pork-Rib-Pattie-with-Honey-BBQ-Sauce.aspx
Campbell, B.L., Nayga Jr., R.M., Park, J.L., Silva, A., 2011. Does the National School Lunch Program improve children’s dietary outcomes? American Journal of Agricultural Economics 93 (4), 1099-1130.
Centers for Disease Control and Prevention. 2007. State-Level School Health Policies and Practices: A State-by-State Summary from the School Health Policies and Programs Study 2006. Atlanta: U.S. Department of Health and Human Services.
Food and Nutrition Service. 2013. National School Lunch Program: participation and lunches served. United States Department of Agriculture, May 10, 2013. http://www.fns.usda.gov/pd/slsummar.htm
Fox, M.K., Condon, E. 2012. School Nutrition Dietary Assessment Study-IV: Summary of Findings. Food and Nutrition Service, U.S. Department of Agriculture.
Gleason, P., Suitor, C., 2003. Eating at school: how the National School Lunch Program affects children’s diets. American Journal of Agricultural Economics 85(4), 1047–1061.
Gordon, A., Crepinsek, M.K., Nogales, R., Condon, E. 2007. School Nutrition Dietary Assessment Study-III, Vol I: School Foodservice, School Food Environment, and Meals Offered and Served. U.S. Department of Agriculture, Food and Nutrition Service.
Gundersen, C., Kreider, B., Pepper, J., 2012. The impact of the National School Lunch Program on child health: a nonparametric bounds analysis. Journal of Econometrics 166 (1), 79-91.
Hanson, K.L., Olson, C.M. 2013. School meals participation and weekday dietary quality were associated after controlling for weekend eating among U.S. school children aged 6 to 17 years. Journal of Nutrition 143 (5), 714-721.
Millimet, D.L., Tchernis, R., Husain, M., 2010. School nutrition programs and the incidence of childhood obesity. Journal of Human Resources 45 (3), 640–654.
Ogden, C., Carroll, M., 2010. Prevalence of obesity among children and adolescents: United States, trends 1963–1965 through 2007–2008. Center for Disease Control.
Ralston, K., Newman, C., Clauson, A., Guthrie, J., Buzby, J., 2008. The National School Lunch Program: background, trends, and issues. ERR-61, U.S. Department of Agriculture, Economic Research Service.
Rich’s Food Service. 2011a. Stuffed crust pizza dipper product information. AM/PM Snacks. Accessed 28 May 2013. http://richsfoodservice.com/products/ampm-snacks/appetizers/handheld-snacks-and-meals/stuffed-crust-pizza-dippers/65268
Rich’s Food Service. 2011b. Pepperoni pizzatas product information. AM/PM Snacks. Accessed 28 May 2013. http://richsfoodservice.com/products/ampm-snacks/appetizers/handheld-snacks-and-meals/pepperoni-pizzatas/65282
Schanzenbach, D., 2009. Does the federal school lunch program contribute to childhood obesity? Journal of Human Resources 44 (3), 684–709.
16
U.S. Department of Agriculture. 2011. USDA National Nutrient Database for Standard Reference [Online Database]. Available from Nutrient Data Lab website: http://ndb.nal.usda.gov/
U.S. Department of Agriculture. 2012. Federal Register 77 (57). March 23, 2012.
17
Table 1. Student Demographics Status
All
Students xx Free xx Reduced
xx Paid
xx
Non- Participant
Gender (Percent) Female 48.6 48.1 50.0 49.3 47.6 Male 51.4 52.0 50.0 50.7 52.4
Race (Percent) White 55.1
36.0
53.5
82.6
87.2
Black 32.5
47.8
31.9
10.9
5.3 Hispanic 5.7
8.5
5.0
1.7
1.6
Other 6.7
1.5
9.6
4.8
5.9
Grade (Percent) Kindergarten 17.4 19.2 16.3 15.4 11.2 First 18.3 18.7 17.0 17.7 18.7 Second 16.2 16.9 14.2 15.9 10.7 Third 16.1 15.3 16.3 17.5 13.9 Fourth 15.5 14.5 17.0 16.7 16.6 Fifth 16.5 15.4 19.2 16.8 28.9
Status (Percent) Free 56.3 100.0 0 0 0 Reduced 4.9 0 100.0 0 0 Paid 35.6 0 0 100.0 0 Non-Buyer 3.2 0 0 0 100.0 No. Meals Purchased 50.0 55.0 53.3 41.7 0 (15.9) (10.0) (12.2) (20.0)
Total Students 5,779 3,252 282 2,058 187 Notes: “Other” includes students of Asian, Indian, Pacific Islander, or mixed race. Standard deviation listed in parentheses.
18
Table 2. Food Energy and Nutrients Mean By Status x All Transactions x Free x Reduced x Paid Food Energy Mean Min Max Calories (kCal) 334.47 146.50 579.00 334.56 333.90 334.38 (50.54) (50.74) (50.60) (50.13)
Nutrients
Fat (g) 15.37 2.25 25.50 15.38 15.41 15.34* (4.75) (4.77) (4.77) (4.71)
Sodium (mg) 722.30 345.00 1,301.00 721.80 727.11*** 722.52†† (242.24) (242.03) (240.39) (242.99)
Protein (g) 18.52 11.00 34.50 18.50 18.51 18.55*** (3.83) (3.82) (3.82) (3.84)
Carbohydrates (g) 29.93 17.50 59.00 29.94 29.84* 29.91 (7.33) (7.35) (7.29) (7.31)
Total Transactions 279,698 178,865 15,023 85,810 Notes: Standard deviation listed in parentheses. Means statistically different than Free Status at the .1, .05, and .01 level denoted with *, **, and *** respectively. Differences between Reduced and Paid Status are denoted with †, ††, and †††. Table 3. Nutritional Value of Top 5 Purchased Entrees
Percent
Sales Cal
(kCal) Fat (g)
Sodium (mg)
Protein (g)
Carbs (g)
Entree Vegetarian Tray 12.46 325.0 12.5 395.0 14.0 37.5 Chicken Sandwich 10.58 316.5 11.5 727.5 19.5 36.0 Chicken Nuggets 8.99 326.0 12.0 656.0 15.0 19.0 Cheese Pizza 7.35 310.0 12.0 490.0 21.0 31.0 Hamburger 6.57 291.5 12.0 509.5 22.5 23.0
Notes: Vegetarian Tray is served each day and includes yogurt, cheese, and cracker. Chicken Nuggets are served with honey mustard dipping sauce. Chicken Sandwich is served on a whole grain bun. Hamburger served on a whole grain bun.
19
Table 4. OLS Regression Results
(1) (2) (3) (4) (5)
Calories (kCal)
x Fat (g)
x Sodium (mg)
x Protein (g)
x Carbs (g)
Race (White Omitted) Black 0.22 0.07** 15.47*** 0.24*** -0.30***
(0.24) (0.02) (1.14) (0.02) (0.03)
Hispanic -0.20 -0.01 -3.01 0.02 0.02
(0.42) (0.04) (2.01) (0.03) (0.06)
Other -0.31 -0.06 5.59** 0.06* -0.02
(0.40) (0.04) (1.89) (0.03) (0.06)
Status (Free Omitted) Reduced -0.41 0.05 6.81*** 0.03 -0.12
(0.43) (0.04) (2.07) (0.03) (0.06)
Paid 0.40 0.07** 7.58*** 0.11*** -0.10**
(0.25) (0.02) (1.19) (0.02) (0.04)
Gender (Female Omitted) Male -0.17 -0.02 -3.44*** 0.07*** -0.14***
(0.19) (0.02) (0.92) (0.01) (0.03)
Grade (Kindergarten Omitted) First -0.44 0.21*** 5.62*** -0.03 -0.39***
(0.32) (0.03) (1.54) (0.02) (0.05)
Second 0.72* 0.34*** 24.41*** 0.15*** -0.59***
(0.33) (0.03) (1.58) (0.02) (0.05)
Third 0.78* 0.36*** 34.23*** 0.30*** -0.71***
(0.34) (0.03) (1.63) (0.03) (0.05)
Fourth 0.94** 0.36*** 39.47*** 0.43*** -0.85***
(0.34) (0.03) (1.63) (0.03) (0.05)
Fifth 1.09** 0.45*** 45.88*** 0.47*** -0.94***
(0.34) (0.03) (1.63) (0.03) (0.05)
School (School 11 Omitted) School 1 4.47*** 0.46*** 35.34*** 0.45*** -0.40***
(0.44) (0.04) (2.10) (0.03) (0.06)
School 2 3.31*** 0.25*** 17.48*** 0.18*** 0.13*
(0.43) (0.04) (2.07) (0.03) (0.06)
School 3 2.69*** 0.08 12.95*** 0.22*** -0.04
(0.45) (0.04) (2.14) (0.03) (0.06)
20
(1) (2) (3) (4) (5)
Calories (kCal)
x Fat (g)
x Sodium (mg)
x Protein (g)
x Carbs (g)
School 4 4.05*** 0.30*** 16.88*** 0.20*** 0.07
(0.50) (0.05) (2.38) (0.04) (0.07)
School 5 1.02* -0.03 12.80*** 0.32*** -0.09
(0.43) (0.04) (2.07) (0.03) (0.06)
School 6 0.65 -0.35*** 13.56*** 0.76*** -0.33***
(0.46) (0.04) (2.18) (0.03) (0.07)
School 7 4.18*** -0.06 29.26*** 0.80*** 0.01
(0.46) (0.04) (2.20) (0.03) (0.07)
School 8 2.85*** 0.01 15.74*** 0.41*** 0.14*
(0.46) (0.04) (2.20) (0.03) (0.07)
School 9 0.07 -0.00 4.37 -0.18*** 0.09
(0.56) (0.05) (2.66) (0.04) (0.08)
School 10 1.40** 0.31*** 29.90*** 0.36*** -0.68***
(0.51) (0.05) (2.45) (0.04) (0.07)
Constant 331.57*** 14.96*** 673.71*** 17.79*** 30.82***
(0.43) (0.04) (2.07) (0.03) (0.06)
R- Squared 0.0010 0.0032 0.0084 0.0089 0.0039 F-Test 13.59 43.23 113.43 119.69 51.74 p-value 0.0000 0.0000 0.0000 0.0000 0.0000 Notes: “Other” includes students of Asian, Indian, Pacific Islander, or mixed race. Standard errors in parentheses. *, **, *** indicate significance at α = 10%, 5% and 1%, respectively. Number of observations for each regression is 279,698.
21
Table 5. Joint F Tests for Indicator Variables
(1)
(2)
(3)
(4)
(5)
x Calories x Fat x Sodium x Protein x Carbs
Race F Test
0.83
6.24
73.08
62.39
29.57 p-value
0.4783
0.0003
0.0000
0.0000
0.0000
Status F Test
2.09
4.76
22.77
16.87
4.70 p-value
0.1243
0.0085
0.0000
0.0000
0.0091
Grade F Test
6.19
50.06
249.90
130.45
93.73 p-value
0.0000
0.0000
0.0000
0.0000
0.0000
School F Test
24.82
59.09
44.34
128.65
26.77 p-value
0.0000
0.0000
0.0000
0.0000
0.0000
Note: F jointly tests the hypothesis that coefficients for each indicator variable (Race, Status, Grade, School) are different than zero.
22
Figure 1. Total Number of Lunches Purchased Per Student
23
Figure 2. Food Energy and Nutrients by Entrée
24
Appendix A. National School Lunch Program: Weekly Meal Pattern K to 5 Grades Required Amount Weekly Daily Fruits (cups) 2.5 0.5 Vegetables (cups) 3.75 0.75 Dark Green 0.5 - Red/Orange 0.75 - Legumes 0.5 - Starchy 0.5 - Other 0.5 - Additional Veg. to Reach Total 1 - Grain/Bread (oz eq) 8 to 9 1 Meat/Meat Alternatives (oz eq) 8 to 10 1 Milk (cups) 5 1 Calories (kcal) Must average 550 to 650 Saturated Fat (% kcal from sat. fat) ≤ 10 Sodium (mg) Must average ≤ 640
Notes: Requirements are for meals as offered for a 5-day school week. These represent minimum portion sizes. Milk can be flavored skim milk or unflavored 1% or skim milk. Beginning in SY 2012/13, 50 percent of all grains must be whole grain rich; effective SY 2014/15 all grains must be whole grain rich. Sodium requirement is effective beginning in SY 2014/15. Weekly requirements prior to SY 2012/13 are calculated using the Traditional Food-Based Approach; requirements differ for Enhanced Food-Based Approach. (U.S. Department of Agriculture 2012)
25
Appendix B. Sample School Menu
26
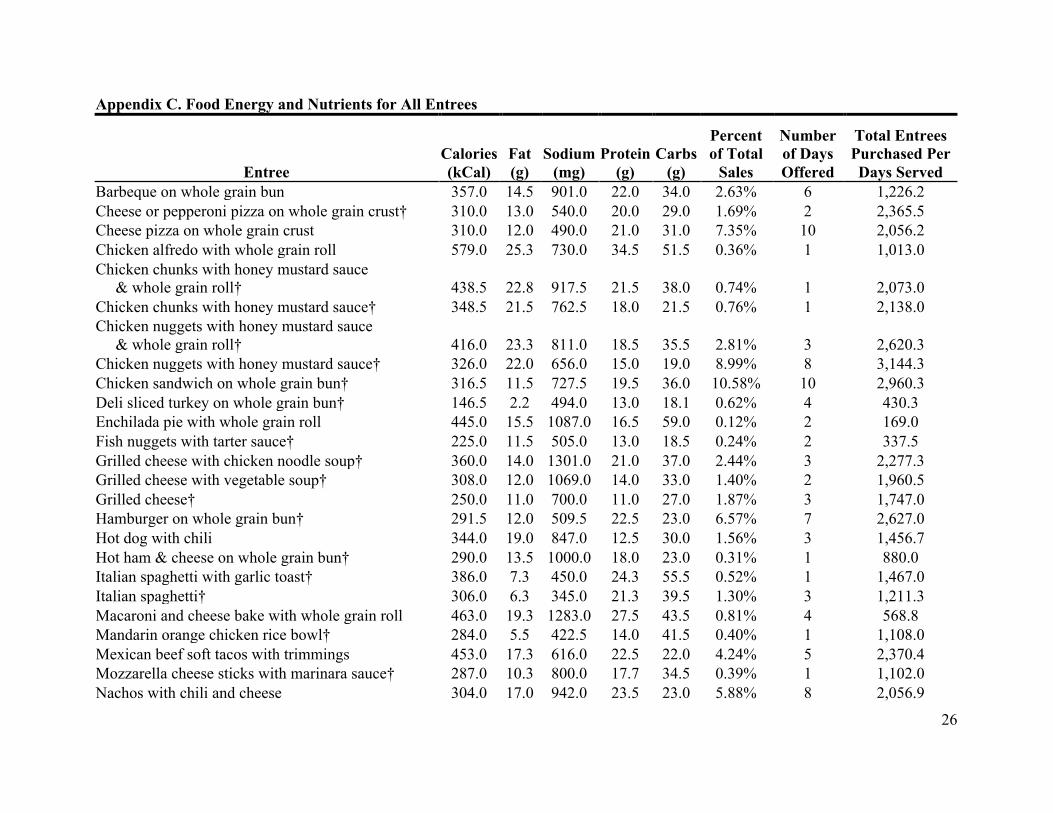
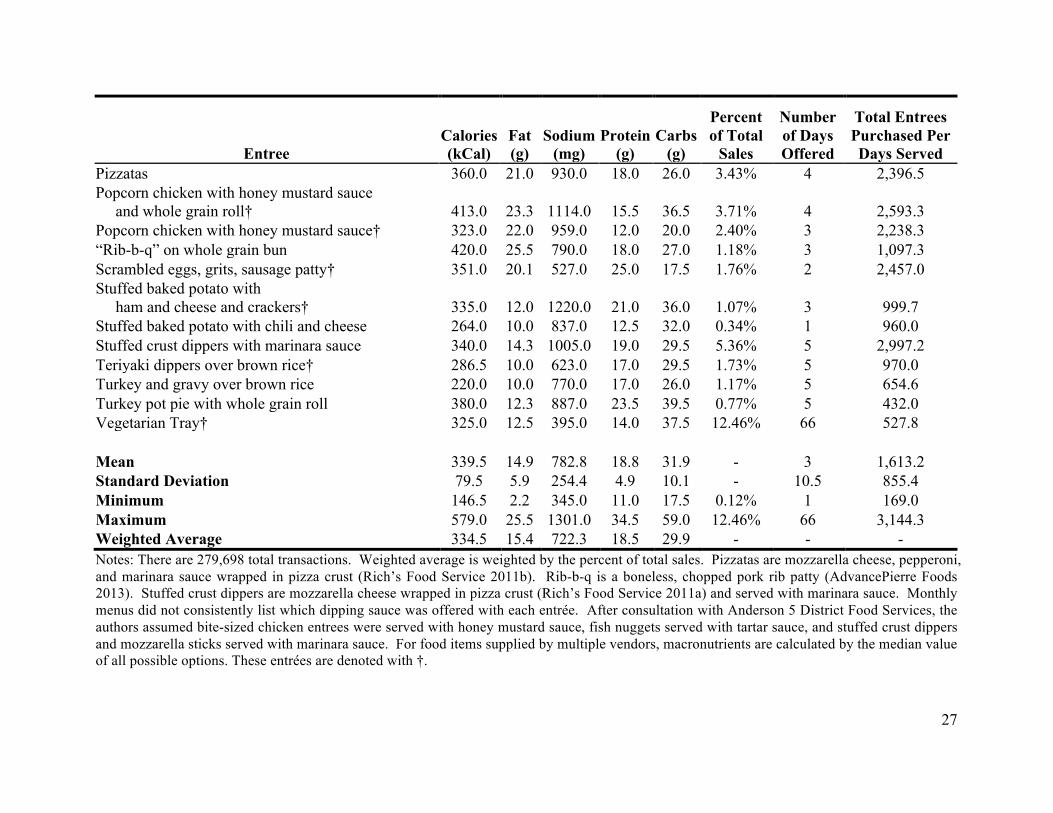
Appendix C. Food Energy and Nutrients for All Entrees
Entree Calories (kCal)
Fat (g)
Sodium (mg)
Protein (g)
Carbs (g)
Percent of Total
Sales
Number of Days Offered
Total Entrees Purchased Per Days Served
Barbeque on whole grain bun 357.0 14.5 901.0 22.0 34.0 2.63% 6 1,226.2 Cheese or pepperoni pizza on whole grain crust† 310.0 13.0 540.0 20.0 29.0 1.69% 2 2,365.5 Cheese pizza on whole grain crust 310.0 12.0 490.0 21.0 31.0 7.35% 10 2,056.2 Chicken alfredo with whole grain roll 579.0 25.3 730.0 34.5 51.5 0.36% 1 1,013.0 Chicken chunks with honey mustard sauce & whole grain roll† 438.5 22.8 917.5 21.5 38.0 0.74% 1 2,073.0 Chicken chunks with honey mustard sauce† 348.5 21.5 762.5 18.0 21.5 0.76% 1 2,138.0 Chicken nuggets with honey mustard sauce & whole grain roll† 416.0 23.3 811.0 18.5 35.5 2.81% 3 2,620.3 Chicken nuggets with honey mustard sauce† 326.0 22.0 656.0 15.0 19.0 8.99% 8 3,144.3 Chicken sandwich on whole grain bun† 316.5 11.5 727.5 19.5 36.0 10.58% 10 2,960.3 Deli sliced turkey on whole grain bun† 146.5 2.2 494.0 13.0 18.1 0.62% 4 430.3 Enchilada pie with whole grain roll 445.0 15.5 1087.0 16.5 59.0 0.12% 2 169.0 Fish nuggets with tarter sauce† 225.0 11.5 505.0 13.0 18.5 0.24% 2 337.5 Grilled cheese with chicken noodle soup† 360.0 14.0 1301.0 21.0 37.0 2.44% 3 2,277.3 Grilled cheese with vegetable soup† 308.0 12.0 1069.0 14.0 33.0 1.40% 2 1,960.5 Grilled cheese† 250.0 11.0 700.0 11.0 27.0 1.87% 3 1,747.0 Hamburger on whole grain bun† 291.5 12.0 509.5 22.5 23.0 6.57% 7 2,627.0 Hot dog with chili 344.0 19.0 847.0 12.5 30.0 1.56% 3 1,456.7 Hot ham & cheese on whole grain bun† 290.0 13.5 1000.0 18.0 23.0 0.31% 1 880.0 Italian spaghetti with garlic toast† 386.0 7.3 450.0 24.3 55.5 0.52% 1 1,467.0 Italian spaghetti† 306.0 6.3 345.0 21.3 39.5 1.30% 3 1,211.3 Macaroni and cheese bake with whole grain roll 463.0 19.3 1283.0 27.5 43.5 0.81% 4 568.8 Mandarin orange chicken rice bowl† 284.0 5.5 422.5 14.0 41.5 0.40% 1 1,108.0 Mexican beef soft tacos with trimmings 453.0 17.3 616.0 22.5 22.0 4.24% 5 2,370.4 Mozzarella cheese sticks with marinara sauce† 287.0 10.3 800.0 17.7 34.5 0.39% 1 1,102.0 Nachos with chili and cheese 304.0 17.0 942.0 23.5 23.0 5.88% 8 2,056.9
27
Entree Calories (kCal)
Fat (g)
Sodium (mg)
Protein (g)
Carbs (g)
Percent of Total
Sales
Number of Days Offered
Total Entrees Purchased Per Days Served
Pizzatas 360.0 21.0 930.0 18.0 26.0 3.43% 4 2,396.5 Popcorn chicken with honey mustard sauce and whole grain roll† 413.0 23.3 1114.0 15.5 36.5 3.71% 4 2,593.3 Popcorn chicken with honey mustard sauce† 323.0 22.0 959.0 12.0 20.0 2.40% 3 2,238.3 “Rib-b-q” on whole grain bun 420.0 25.5 790.0 18.0 27.0 1.18% 3 1,097.3 Scrambled eggs, grits, sausage patty† 351.0 20.1 527.0 25.0 17.5 1.76% 2 2,457.0 Stuffed baked potato with ham and cheese and crackers† 335.0 12.0 1220.0 21.0 36.0 1.07% 3 999.7 Stuffed baked potato with chili and cheese 264.0 10.0 837.0 12.5 32.0 0.34% 1 960.0 Stuffed crust dippers with marinara sauce 340.0 14.3 1005.0 19.0 29.5 5.36% 5 2,997.2 Teriyaki dippers over brown rice† 286.5 10.0 623.0 17.0 29.5 1.73% 5 970.0 Turkey and gravy over brown rice 220.0 10.0 770.0 17.0 26.0 1.17% 5 654.6 Turkey pot pie with whole grain roll 380.0 12.3 887.0 23.5 39.5 0.77% 5 432.0 Vegetarian Tray† 325.0 12.5 395.0 14.0 37.5 12.46% 66 527.8
Mean 339.5 14.9 782.8 18.8 31.9 - 3 1,613.2 Standard Deviation 79.5 5.9 254.4 4.9 10.1 - 10.5 855.4 Minimum 146.5 2.2 345.0 11.0 17.5 0.12% 1 169.0 Maximum 579.0 25.5 1301.0 34.5 59.0 12.46% 66 3,144.3 Weighted Average 334.5 15.4 722.3 18.5 29.9 - - - Notes: There are 279,698 total transactions. Weighted average is weighted by the percent of total sales. Pizzatas are mozzarella cheese, pepperoni, and marinara sauce wrapped in pizza crust (Rich’s Food Service 2011b). Rib-b-q is a boneless, chopped pork rib patty (AdvancePierre Foods 2013). Stuffed crust dippers are mozzarella cheese wrapped in pizza crust (Rich’s Food Service 2011a) and served with marinara sauce. Monthly menus did not consistently list which dipping sauce was offered with each entrée. After consultation with Anderson 5 District Food Services, the authors assumed bite-sized chicken entrees were served with honey mustard sauce, fish nuggets served with tartar sauce, and stuffed crust dippers and mozzarella sticks served with marinara sauce. For food items supplied by multiple vendors, macronutrients are calculated by the median value of all possible options. These entrées are denoted with †.