Embed Size (px)
Citation preview
Do fluid inclusions preserve d18O values of hydrothermal fluids in
epithermal systems over geological time? Evidence from paleo- and
modern geothermal systems, Milos island, Aegean Sea
J. Nadena,b,*, S.P. Kiliasa, M.J. Lengc, I. Cheliotisd, T.J. Shepherdb
aSection of Economic Geology and Geochemistry, Department of Geology, National and Kapodistrian University of Athens,
Panepistimioupolis, Ano Ilisia, 157 84 Athens, GreecebBritish Geological Survey, Keyworth, Notts NG12 5GG, UK
cNERC Isotope Geosciences Laboratory, British Geological Survey, Keyworth, Notts NG12 5GG, UKd Institute for Geology and Mineral Exploration, 70 Messoghion St., 115 27 Athens, Greece
Received 19 December 2001; accepted 27 September 2002
Abstract
Stable isotope compositions of quartz (d18Oquartz) and fluid inclusion waters (d18OFI and dDFI) were analysed from Profitis
Ilias, a low-sulphidation epithermal gold mineralisation deposit on Milos island, Greece, to establish if d18OFI preserve a record
of paleogeothermal processes. Previous studies show that mineralisation at Profitis Ilias resulted from extreme boiling and
vaporisation with a zone located at approximately 430 m above sea level (asl) representing the transition between liquid- and
vapor-dominated systems [Miner. Depos. 36 (2001) 32]. The deposit is also closely associated with an active geothermal
system, whose waters have a well-characterised stable isotope geochemistry [Pflumio, C., Boulegue, J., Liakopoulos, A.,
Briqueu, L., 1991. Source, Transport and Deposition of Metals. Balkema, Rotterdam]. The samples were collected over an
elevation interval of 440 m (210–650 m asl) to give information on the liquid and vapor dominated sections of the
paleosystem.
The data show systematic variations with sample elevation. Samples from the highest elevations (ca. 650 m asl) have the
lightest d18OFI (� 7.3x) and dDFI (� 68.0x) whilst the deepest (ca. 210 m asl) are isotopically heavier (d18OFI, � 0.3x;
dDFI, � 19.0x). Relative changes in d18OFI closely parallel those in dDFI. d18Oquartz shows an opposite trend, from the
lightest values ( + 13.9x) at the lowest elevations to the heaviest ( + 15.1x) at the highest elevations. d18OFI shows
correlations with other parameters. For example, variable fluid inclusion homogenisation temperatures in the vapor-dominated
part of the system correlate with a rapid shift in dDFI (� 33.3xto � 50.5x) and d18OFI (� 4.1xto � 6.2x). Gold
contents also increase in the same zone (up to 50 ppm Au). Comparable correlations in d18Oquartz or d18Ocalculated (estimated
geothermal fluid from fluid inclusion homogenisation data) are absent. d18Ocalculated are always 5–10xheavier than d18OFI.
Comparison with the present day geothermal field shows that dDFI and d18OFI are similar. Isotope data for the modern system
and fluid inclusion waters fall on linear trends subparalleling the meteoric water line and project towards seawater values.
Numerical modelling favours kinetically controlled fractionation to explain differences in d18Ocalculated and d18Ofluid rather than
diffusive posttrapping reequilibration. The evidence suggests that in low-temperature epithermal systems, d18OFI may represent
0009-2541/02/$ - see front matter D 2002 NERC. Published by Elsevier Science B.V. All rights reserved.
doi:10.1016/S0009-2541(02)00289-9
* Corresponding author. British Geological Survey, Keyworth, Notts NG12 5GG, UK. Tel.: +44-115-936-3280; fax: +44-115-936-3200.
E-mail address: [email protected] (J. Naden).
www.elsevier.com/locate/chemgeo
Chemical Geology 197 (2003) 143–159
a better record of fluid process and the isotopic composition of the paleogeothermal fluid than temperature-corrected quartz
data.
D 2002 NERC. Published by Elsevier Science B.V. All rights reserved.
Keywords: Fluid inclusions; Oxygen and hydrogen isotopes; Active Aegean arc; Epithermal mineralisation
1. Introduction
Stable isotope analyses (dD and d18O) of inclusionfluids and minerals provide valuable insights into
fluid sources, hydrothermal processes and fluid–rock
interaction in a wide range of geological environments
(e.g. O’Reilly et al., 1997; Wilkinson et al., 1995).
One of the main methodologies for determining D/H
and 18O/16O focuses on measuring dD on extracted
inclusion fluids and calculating d18O of the fluid by
analysing the host quartz. Recently, procedures that
analyse both dD and d18O on inclusion fluids have
been developed for quartz and carbonates (Kishima
and Sakai, 1980; Kazahaya and Matsuo, 1984; Ohba
and Matsuo, 1988; Lecuyer and O’Neil, 1994). How-
ever, in quartz, scientific opinions as to which
approach is the most appropriate are divided (Vityk
et al., 1993; Ohba et al., 1995). The indirect approach
is not ideal as it relies on accurate determination of
quartz precipitation temperatures, usually ascertained
through fluid inclusion microthermometry. Also, there
is evidence for isotopic disequilibrium between quartz
and the fluid phase at low temperatures ( < 250 jC)(Zhang et al., 1989; Matsuhisa et al., 1978). Direct
measurements also have problems since isotopic
reequilibration can occur after trapping and during
cooling of the host mineral (Rye and O’Neil, 1968;
Ohba et al., 1995).
In this study, we present directly and indirectly
measured dD and d18O data for adularia–sericite
epithermal-Au mineralisation at Profitis Ilias on Milos
island (Aegean sea); a deposit closely linked to a
modern geothermal reservoir, and whose geology,
mineralogy and fluid inclusions, are well character-
ised (Kilias et al., 2001). In addition, the modern
system is well documented mineralogically, geo-
chemically and isotopically (Liakopoulos, 1987; Lia-
kopoulos et al., 1991; Pflumio et al., 1991; Christanis
and St. Seymour, 1995), and provides an excellent
analogue for the epithermal Au mineralisation.
2. Geological setting and background information
2.1. The geology of Milos island
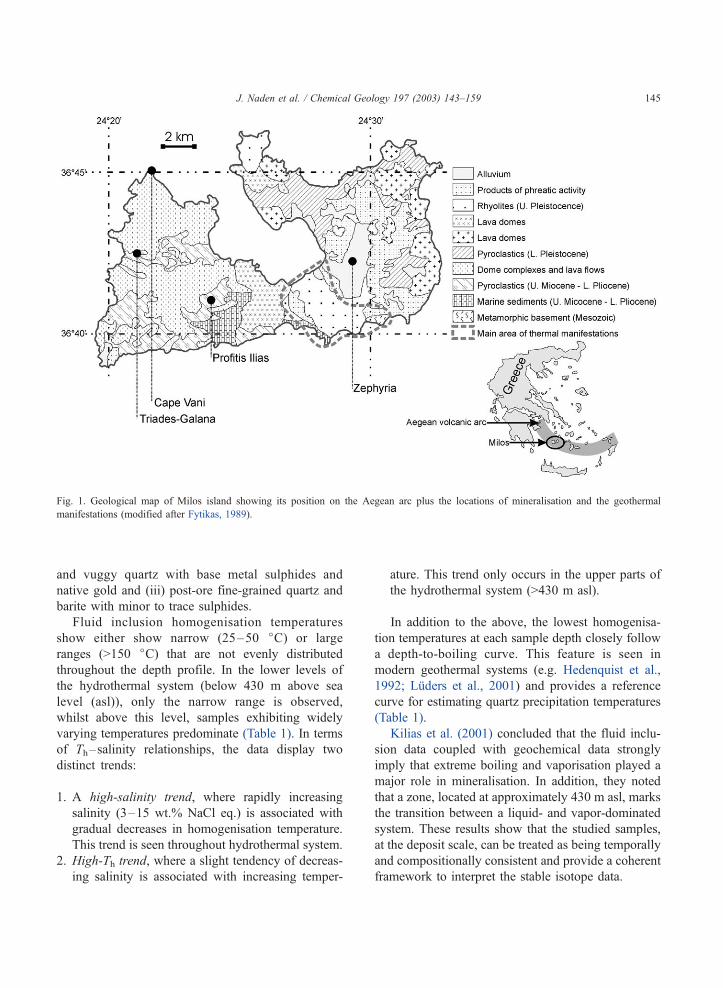
Milos is located on the active Aegean volcanic arc
(Fig. 1). Volcanism on Milos is Pliocene to Pleisto-
cene in age and calc-alkaline in nature, and resulted
from the northeastward subduction of the Mediterra-
nean seafloor (part of the African plate) below the
Aegean microplate (Papazachos and Kiratzi, 1996 and
references therein). The geology, geochronology, geo-
thermal activity and structure of the island are
described in detail by Fytikas (1989 and references
therein), Briqueu et al. (1986), Liakopoulos et al.
(1991) and Tsokas (1996), and its main geological
features are shown in Fig. 1. Though the last recorded
volcanism ceased 100,000 years ago, Milos is cur-
rently an active geothermal field. Present-day activity
is concentrated in the central and eastern portions of
the island and is expressed by fumaroles, hot springs,
hot ground and submarine gas escapes (Fig. 1).
2.2. Epithermal gold mineralisation at Profitis Ilias
The geology, mineralogy and fluid inclusions of
Profitis Ilias have been described in detail by Kilias et
al. (2001), and only the salient features are reiterated
here.
The mineralisation is classified as a low-sulphida-
tion epithermal gold deposit and the host rocks consist
of strongly sericitised rhyolitic lapilli-tuffs and ignim-
brites. The mineralisation, comprising native gold,
minor sphalerite, galena, chalcopyrite and pyrite, is
developed in a series of interconnected N–S to NE–
SW trending vein structure that occupy a fault net-
work. Vein widths are up to 3 m across and extend to
depths of at least 300 m below the present-day sur-
face. Three broad paragenetic stages to the minerali-
sation are recognised: (i) barren pre-ore comprising
microcrystalline quartz and pyrite; (ii) fine-grained
J. Naden et al. / Chemical Geology 197 (2003) 143–159144
and vuggy quartz with base metal sulphides and
native gold and (iii) post-ore fine-grained quartz and
barite with minor to trace sulphides.
Fluid inclusion homogenisation temperatures
show either show narrow (25–50 jC) or large
ranges (>150 jC) that are not evenly distributed
throughout the depth profile. In the lower levels of
the hydrothermal system (below 430 m above sea
level (asl)), only the narrow range is observed,
whilst above this level, samples exhibiting widely
varying temperatures predominate (Table 1). In terms
of Th–salinity relationships, the data display two
distinct trends:
1. A high-salinity trend, where rapidly increasing
salinity (3–15 wt.% NaCl eq.) is associated with
gradual decreases in homogenisation temperature.
This trend is seen throughout hydrothermal system.
2. High-Th trend, where a slight tendency of decreas-
ing salinity is associated with increasing temper-
ature. This trend only occurs in the upper parts of
the hydrothermal system (>430 m asl).
In addition to the above, the lowest homogenisa-
tion temperatures at each sample depth closely follow
a depth-to-boiling curve. This feature is seen in
modern geothermal systems (e.g. Hedenquist et al.,
1992; Luders et al., 2001) and provides a reference
curve for estimating quartz precipitation temperatures
(Table 1).
Kilias et al. (2001) concluded that the fluid inclu-
sion data coupled with geochemical data strongly
imply that extreme boiling and vaporisation played a
major role in mineralisation. In addition, they noted
that a zone, located at approximately 430 m asl, marks
the transition between a liquid- and vapor-dominated
system. These results show that the studied samples,
at the deposit scale, can be treated as being temporally
and compositionally consistent and provide a coherent
framework to interpret the stable isotope data.
Fig. 1. Geological map of Milos island showing its position on the Aegean arc plus the locations of mineralisation and the geothermal
manifestations (modified after Fytikas, 1989).
J. Naden et al. / Chemical Geology 197 (2003) 143–159 145
2.3. The modern geothermal system: chemical and
isotopic characteristics
In the active geothermal system, the reservoir
liquid before phase separation is moderately saline
(f 9 wt.% dissolved salts), and after phase separa-
tion, the condensed vapor has a salinity of 0.12 wt.%
NaCl. Geochemically, the residual liquid phase is
dominated by sodium chloride (up to 14.3 wt.% NaCl)
with significant potassium (1.1 wt.%) and calcium
(0.5 wt.%). In addition, magnesium (1.36� 10� 4 mol
l� 1) and sulphate (1.04� 10� 5 mol l� 1) are strongly
depleted compared to seawater. During its ascent to
the surface, the hydrothermal fluid separates into
liquid and vapor phases (Liakopoulos, 1987; Liako-
poulos et al., 1991). In terms of stable (d18O, dD)isotope systematics, the deep reservoir comprises a
fluid that resulted from a Rayleigh-type distillation of
seawater accompanied by partial reequilibration with
volcanic rocks as the seawater percolated down
through the system (Pflumio et al., 1991).
3. Materials and methods
3.1. Sample selection and preparation
Sample selection for isotopic analysis was based
on fluid inclusion microthermometry and elevation
data. The criteria were that quartz samples contained
only a single-inclusion type with an inclusion pop-
ulation dominated by primary/pseudosecondary inclu-
sions and that they covered most of the vertical range
of the deposit. In total, 11 quartz samples were
selected for analysis (Table 1). Approximately 10 g
of quartz from each sample were crushed and sieved
to � 1000 + 500 Am. The quartz concentrates were
then washed in hot (ca. 90 jC) 6 M HCl several times
with a final rinse in hot (ca. 90 jC) Milli Q water to
remove ‘‘soluble’’ impurities adhering to the surface
of the quartz grains (e.g. iron oxides). This was
followed by ultrasonic cleaning in cold Milli Q water
for 5 min to remove ‘‘insoluble’’ surface impurities
(e.g. clay minerals). Any contaminants left were then
removed by careful handpicking under a binocular
microscope to give a pure quartz concentrate weigh-
ing between 0.5 and 1.0 g. Immediately, prior to
analysis, the sample was briefly ultrasonically cleaned
in dichloromethane to remove any remaining organic
material.
3.2. d18O and dD from fluid inclusions
d18O and dD in fluid inclusions were determined
using a modified methodology based on Kishima and
Sakai (1980), Kazahaya and Matsuo (1984) and
Lecuyer and O’Neil (1994). Between 0.5 and 1 g of
handpicked quartz grains were degassed at f 20 jCovernight under vacuum. Samples were then decrepi-
tated at 600 jC for 30 min and the fluid inclusion
water collected cryogenically. This water was then
transferred to a microequilibration quartz tube sealed
Table 1
Sample information and stable isotope results
Sample
no.
Elevation
(m asl)
Sample
weight (g)
FI water
weight (mg)
d18Oquartz
(x)
d18OFI
(x)
dDFI
(x)
Salinity
(wt.% NaCl eq.)
Th range
(jC)Boiling
curve T (jC)
G2185 657 1.4 0.5 15.4 � 4.5 � 28.7 6.1–6.8 150–160 89
G1746 621 0.5 2.5 15.5 � 7.8 � 51.0 5.0–5.5 213–243 149
G1810 613 0.5 0.3 15.1 � 7.3 � 47.8 4.5–4.5 161–284 156
G2374 551 1.5 1.2 14.2 � 7.8 � 68.0 3.4–5.6 190–234 188
G2245 499 0.5 3.7 14.6 � 6.9 � 41.5 3.3–4.9 205–215 204
G2255 457 0.5 1.6 13.9 � 6.1 � 39.8 3.1–4.7 190–219 213
G2424 421 0.7 1.2 14.2 � 6.2 � 50.5 0.0–7.5 233–253 220
G2267 405 1.4 3.7 14.3 � 4.1 � 33.3 6.5–7.8 223–249 223
G2268 403 1.2 2.5 13.7 � 4.5 � 34.9 4.4–9.2 208–231 223
G2283 365 1.2 0.3 13.4 � 3.7 � 23.8 3.1–6.2 219–251 230
PD9380 210 0.5 1.2 14.5 � 0.3 � 19.0 5.6–5.6 237–280 250
Also shown are summary microthermometric data and boiling curve temperatures for each sample elevation (from Kilias et al., 2001).
J. Naden et al. / Chemical Geology 197 (2003) 143–159146
at one end, to which 2 cm3 of a standard CO2 gas was
added, and the tube completely sealed. The tube was
then weighed, and the H2O and standard CO2 gases
were left to exchange oxygen isotopes at 25 jC for 7
days. After equilibration, H2O and CO2 were sepa-
rated cryogenically. The water was converted to
hydrogen by reduction over hot zinc and ratios were
measured on a SIRA 10 mass spectrometer. CO2 was
collected and ratios were determined on an Optima
mass spectrometer along with a sample of the stand-
ard gas used for the equilibration. The d18O values of
the water samples were calculated using the mass
balance equation of Kishima and Sakai (1980) and the
CO2–H2O fractionation factor at 25 jC was deter-
mined using O’Neil et al. (1975). The d18O value of
standard CO2 used for equilibration was 31.85x(SMOW), a value close to that expected for the
CO2 after equilibration. Since the oxygen isotope
ratio of the CO2 only changes slightly during the
equilibration, the precision was not compromised.
The weight of fluid inclusion water released from
the quartz was calculated from the weights of the
collection tubes before and after the H2O–CO2 col-
lection. The water content of each sample was vari-
able, but in most cases, 0.5–1 g of quartz yielded
between 0.5 and 4 Al of water (Table 1). At each stage
in the extraction procedure, the line pressure was
monitored to check for residual gas. Precisions
obtained for the laboratory-standard water, extracted
and measured at the same time, were 0.1xfor d18Oand 3xfor dD (2r) for samples containing between
1 and 2 Al of water. The data are presented as per mil
(x) deviations from VSMOW.
3.3. d18O from quartz
Silicate ratios were obtained from the quartz after
fluid inclusion extraction using the procedure outlined
by Clayton and Mayeda (1963). Oxygen yields were
monitored and considered acceptable within the range
99–103% of the theoretical yield. Isotope ratios were
measured on a CJS Sciences mass spectrometer
(phoenix 390, rebuilt VG MM903). d18O values were
normalised through laboratory standards and NBS28,
and corrected according to Craig (1957) and Deines
(1970). The data are presented as per mil (x)
deviations from VSMOW. Overall, analytical repro-
ducibility was of the order of F 0.10x(2r).
4. Stable isotope results
4.1. Oxygen data
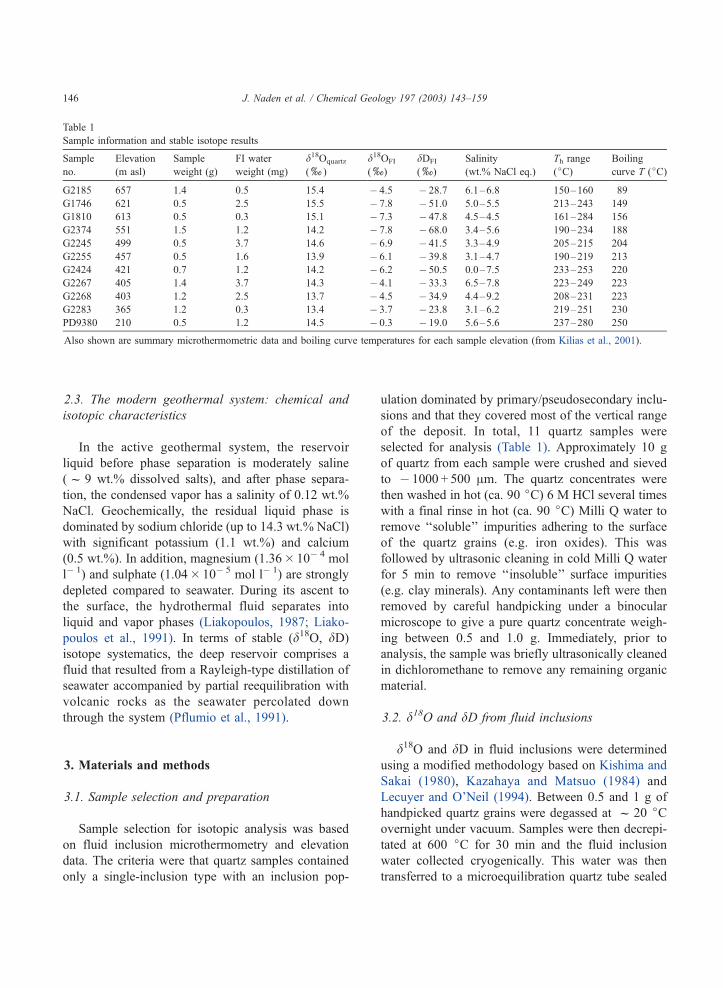
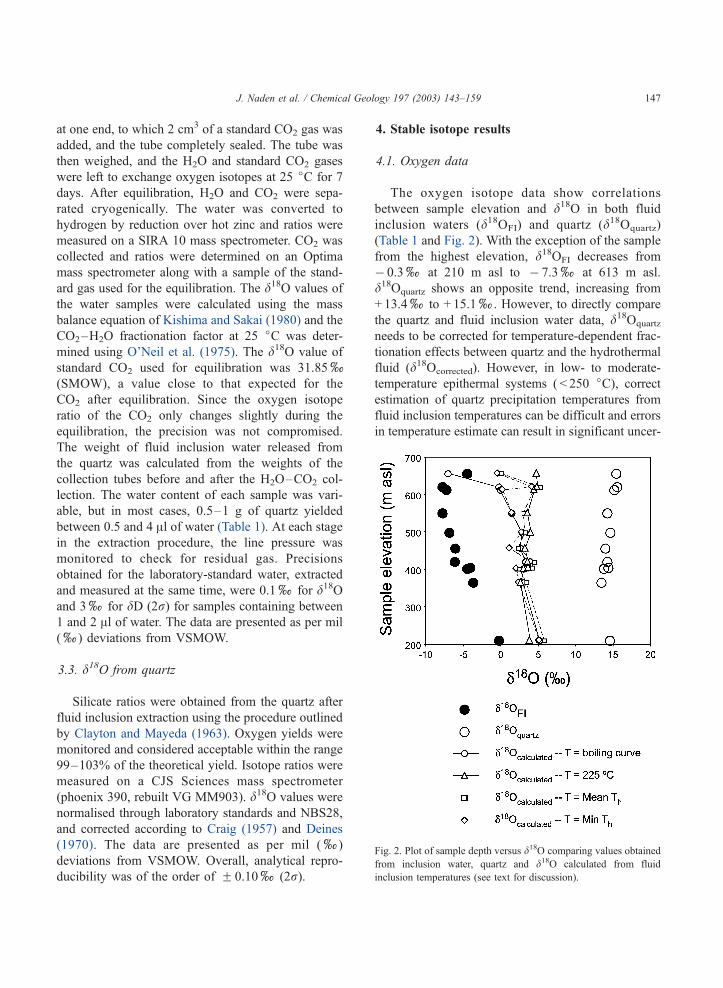
The oxygen isotope data show correlations
between sample elevation and d18O in both fluid
inclusion waters (d18OFI) and quartz (d18Oquartz)
(Table 1 and Fig. 2). With the exception of the sample
from the highest elevation, d18OFI decreases from
� 0.3xat 210 m asl to � 7.3xat 613 m asl.
d18Oquartz shows an opposite trend, increasing from
+ 13.4xto + 15.1x. However, to directly compare
the quartz and fluid inclusion water data, d18Oquartz
needs to be corrected for temperature-dependent frac-
tionation effects between quartz and the hydrothermal
fluid (d18Ocorrected). However, in low- to moderate-
temperature epithermal systems ( < 250 jC), correctestimation of quartz precipitation temperatures from
fluid inclusion temperatures can be difficult and errors
in temperature estimate can result in significant uncer-
Fig. 2. Plot of sample depth versus d18O comparing values obtained
from inclusion water, quartz and d18O calculated from fluid
inclusion temperatures (see text for discussion).
J. Naden et al. / Chemical Geology 197 (2003) 143–159 147
tainties in isotopic compositions. At 200 jC, an
uncertainty of F 20 jC for example in the fluid
inclusion homogenisation temperature corresponds
to a 2.5xuncertainty in d18Ofluid. Furthermore, at
Profitis Ilias, where there is a temperature difference
of approximately 100 jC between the lowest and
highest elevations, uncertainties of this magnitude are
greater than the total range in the measured quartz
oxygen isotopic composition (1.2x). Several
choices of temperature estimate are available to us.
First, there is a single value, e.g. 225 jC, that
corresponds to estimated boiling temperatures, but
there is a clear variation in temperature over the
investigated elevation interval (see Table 1). Second,
average sample homogenisation temperatures (Table
2) could also be appropriate. However, in this case,
there is good evidence for heterogeneous trapping
(Kilias et al., 2001), which will make this choice an
overestimation. Third, the minimum homogenisation
temperature of each sample (Table 1), which repre-
sents fluid inclusions that have trapped the least
vapor, is also a valid estimate (see Pichavant et al.,
1982; Ramboz et al., 1982; Bodnar et al., 1985 for
discussions that relate homogenisation temperatures,
boiling and heterogeneous trapping). Last, we have
depth-to-boiling relationships to estimate fluid tem-
peratures (Table 1).
Fig. 2 compares d18Ocorrected, d18OFI and d18Oquartz
with sample elevation using the above methods for
estimating temperature. First, it is clear that trends in
the data are systematically related to sample eleva-
tion. Second, there is a difference of about + 8xto
+ 12xbetween d18OFI and d18Ocorrected. Closer
examination of the corrected data raises a number
of further points:
1. Use of a single temperature value preserves the
d18O–depth trend seen in the quartz data, which is
still in the opposite sense to the inclusion water
data.
2. Employing mean homogenisation temperature
results in significant scatter, and makes it difficult
to differentiate any data trends.
3. Minimum homogenisation temperature again re-
sults in scatter, but trends in the data are now
discernible and the d18O–depth trend is in a similar
sense to that of the inclusion water.
4. Applying temperature estimates calculated from
the boiling curve, with the exception of the sample
from the highest elevation, results in a trend with
little scatter that closely parallels the inclusion
water.
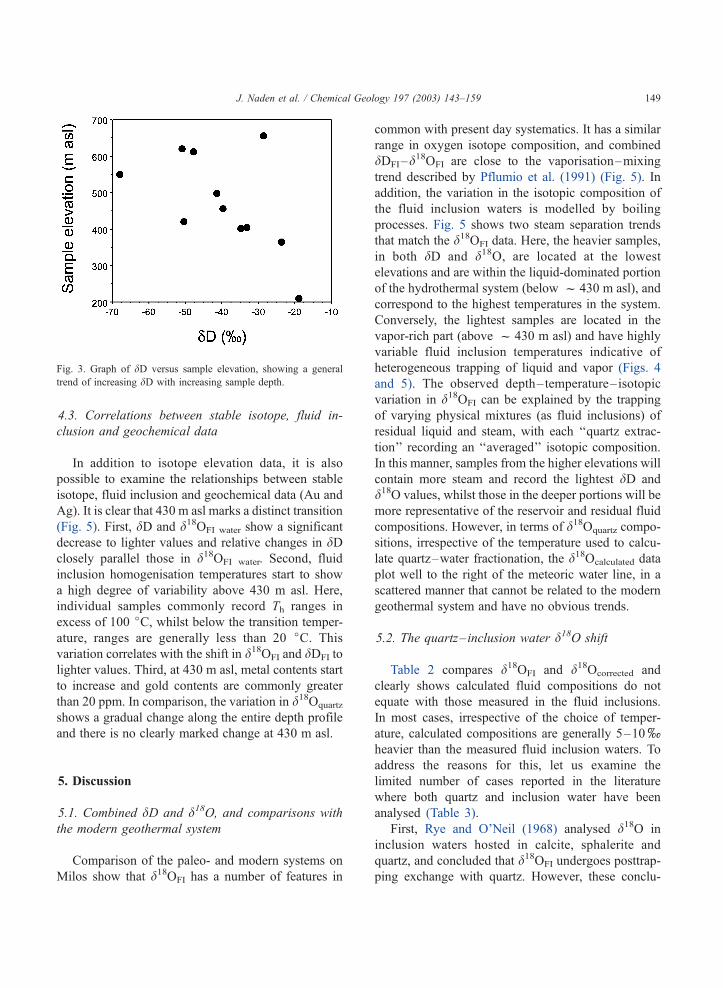
4.2. Hydrogen data
dD of inclusion waters (dDFI) varies between
� 68.0xand � 19.0x. dDFI shows a reasonable
correlation with sample elevation (Fig. 3), with eight
of the eleven samples analysed falling on a linear trend
varying from the light values (� 47.8x) at high
elevations (613 m asl) to heavier values (� 19x) at
lower altitudes (210 m asl).
Table 2
Comparison of fluid inclusion water d18O with calculated fluid compositions for Profitis Ilias
Sample
no.
Elevation
(m asl)
d18OFI
(x)
d18Oquartz
(x)
d18Ocalculated (x)
(T= boiling curve)
d18Ocalculated (x)
(T= 225 jC)d18Ocalculated (x)
(T=mean Th)
Boiling
curve T (jC)Mean
Th (jC)
G2185 657 � 4.5 15.4 � 7.1 4.8 0.0 89 155
G1746 621 � 7.8 15.5 � 0.3 4.9 5.2 149 230
G1810 613 � 7.3 15.1 � 0.1 4.5 4.4 156 223
G2374 551 � 7.8 14.2 1.4 3.6 3.0 188 214
G2245 499 � 6.9 14.6 2.8 4.0 3.2 204 211
G2255 457 � 6.1 13.9 2.6 3.3 2.3 213 207
G2424 421 � 6.2 14.2 3.3 3.6 4.4 220 241
G2267 405 � 4.1 14.3 3.6 3.7 4.2 223 234
G2268 403 � 4.5 13.7 3.0 3.1 2.5 223 215
G2283 365 � 3.7 13.4 3.0 2.7 3.4 230 238
PD9380 210 � 0.3 14.5 5.1 3.9 5.8 250 264
Calculated fluids use Zhang et al. (1989).
J. Naden et al. / Chemical Geology 197 (2003) 143–159148
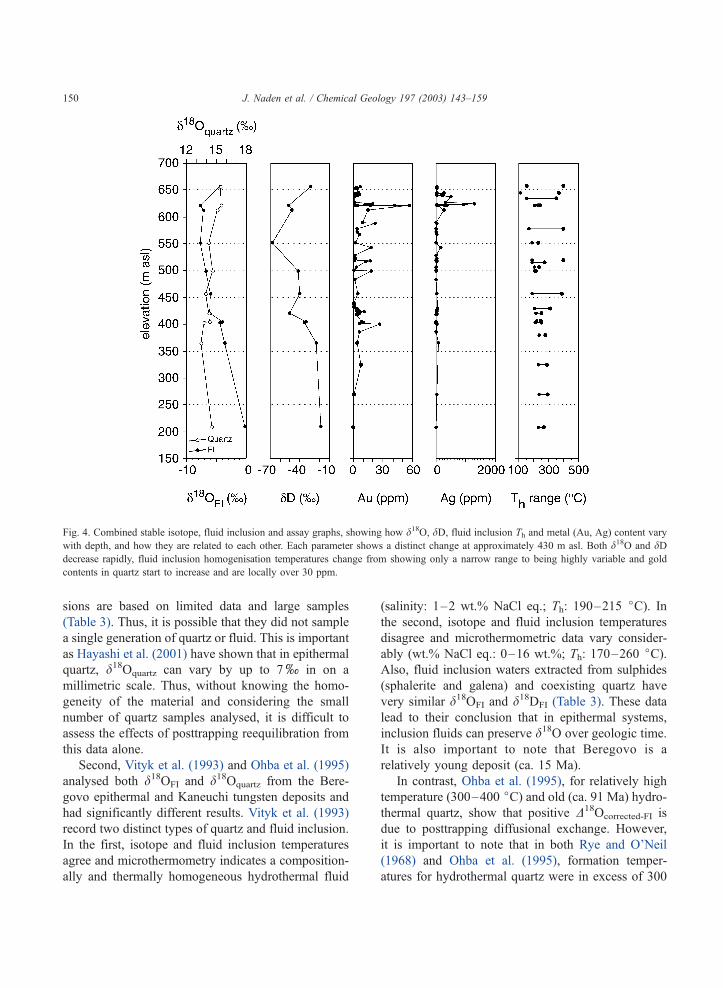
4.3. Correlations between stable isotope, fluid in-
clusion and geochemical data
In addition to isotope elevation data, it is also
possible to examine the relationships between stable
isotope, fluid inclusion and geochemical data (Au and
Ag). It is clear that 430 m asl marks a distinct transition
(Fig. 5). First, dD and d18OFI water show a significant
decrease to lighter values and relative changes in dDclosely parallel those in d18OFI water. Second, fluid
inclusion homogenisation temperatures start to show
a high degree of variability above 430 m asl. Here,
individual samples commonly record Th ranges in
excess of 100 jC, whilst below the transition temper-
ature, ranges are generally less than 20 jC. This
variation correlates with the shift in d18OFI and dDFI to
lighter values. Third, at 430 m asl, metal contents start
to increase and gold contents are commonly greater
than 20 ppm. In comparison, the variation in d18Oquartz
shows a gradual change along the entire depth profile
and there is no clearly marked change at 430 m asl.
5. Discussion
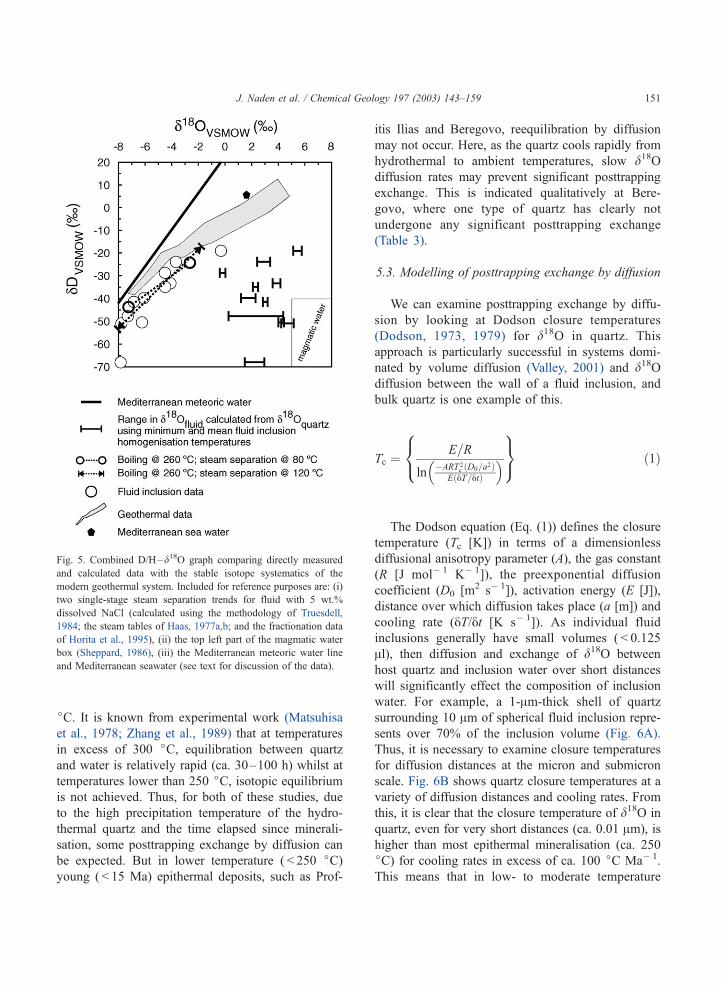
5.1. Combined dD and d18O, and comparisons with
the modern geothermal system
Comparison of the paleo- and modern systems on
Milos show that d18OFI has a number of features in
common with present day systematics. It has a similar
range in oxygen isotope composition, and combined
dDFI–d18OFI are close to the vaporisation–mixing
trend described by Pflumio et al. (1991) (Fig. 5). In
addition, the variation in the isotopic composition of
the fluid inclusion waters is modelled by boiling
processes. Fig. 5 shows two steam separation trends
that match the d18OFI data. Here, the heavier samples,
in both dD and d18O, are located at the lowest
elevations and are within the liquid-dominated portion
of the hydrothermal system (below f 430 m asl), and
correspond to the highest temperatures in the system.
Conversely, the lightest samples are located in the
vapor-rich part (above f 430 m asl) and have highly
variable fluid inclusion temperatures indicative of
heterogeneous trapping of liquid and vapor (Figs. 4
and 5). The observed depth–temperature– isotopic
variation in d18OFI can be explained by the trapping
of varying physical mixtures (as fluid inclusions) of
residual liquid and steam, with each ‘‘quartz extrac-
tion’’ recording an ‘‘averaged’’ isotopic composition.
In this manner, samples from the higher elevations will
contain more steam and record the lightest dD and
d18O values, whilst those in the deeper portions will be
more representative of the reservoir and residual fluid
compositions. However, in terms of d18Oquartz compo-
sitions, irrespective of the temperature used to calcu-
late quartz–water fractionation, the d18Ocalculated data
plot well to the right of the meteoric water line, in a
scattered manner that cannot be related to the modern
geothermal system and have no obvious trends.
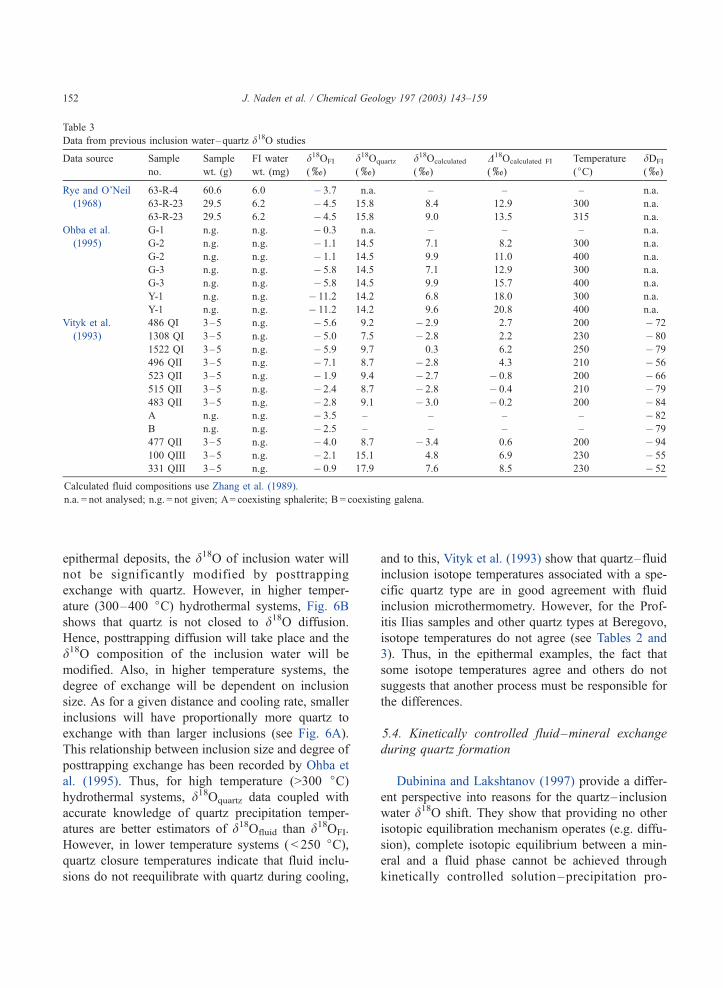
5.2. The quartz–inclusion water d18O shift
Table 2 compares d18OFI and d18Ocorrected and
clearly shows calculated fluid compositions do not
equate with those measured in the fluid inclusions.
In most cases, irrespective of the choice of temper-
ature, calculated compositions are generally 5–10xheavier than the measured fluid inclusion waters. To
address the reasons for this, let us examine the
limited number of cases reported in the literature
where both quartz and inclusion water have been
analysed (Table 3).
First, Rye and O’Neil (1968) analysed d18O in
inclusion waters hosted in calcite, sphalerite and
quartz, and concluded that d18OFI undergoes posttrap-
ping exchange with quartz. However, these conclu-
Fig. 3. Graph of dD versus sample elevation, showing a general
trend of increasing dD with increasing sample depth.
J. Naden et al. / Chemical Geology 197 (2003) 143–159 149
sions are based on limited data and large samples
(Table 3). Thus, it is possible that they did not sample
a single generation of quartz or fluid. This is important
as Hayashi et al. (2001) have shown that in epithermal
quartz, d18Oquartz can vary by up to 7xin on a
millimetric scale. Thus, without knowing the homo-
geneity of the material and considering the small
number of quartz samples analysed, it is difficult to
assess the effects of posttrapping reequilibration from
this data alone.
Second, Vityk et al. (1993) and Ohba et al. (1995)
analysed both d18OFI and d18Oquartz from the Bere-
govo epithermal and Kaneuchi tungsten deposits and
had significantly different results. Vityk et al. (1993)
record two distinct types of quartz and fluid inclusion.
In the first, isotope and fluid inclusion temperatures
agree and microthermometry indicates a composition-
ally and thermally homogeneous hydrothermal fluid
(salinity: 1–2 wt.% NaCl eq.; Th: 190–215 jC). Inthe second, isotope and fluid inclusion temperatures
disagree and microthermometric data vary consider-
ably (wt.% NaCl eq.: 0–16 wt.%; Th: 170–260 jC).Also, fluid inclusion waters extracted from sulphides
(sphalerite and galena) and coexisting quartz have
very similar d18OFI and d18DFI (Table 3). These data
lead to their conclusion that in epithermal systems,
inclusion fluids can preserve d18O over geologic time.
It is also important to note that Beregovo is a
relatively young deposit (ca. 15 Ma).
In contrast, Ohba et al. (1995), for relatively high
temperature (300–400 jC) and old (ca. 91 Ma) hydro-
thermal quartz, show that positive D18Ocorrected-FI is
due to posttrapping diffusional exchange. However,
it is important to note that in both Rye and O’Neil
(1968) and Ohba et al. (1995), formation temper-
atures for hydrothermal quartz were in excess of 300
Fig. 4. Combined stable isotope, fluid inclusion and assay graphs, showing how d18O, dD, fluid inclusion Th and metal (Au, Ag) content vary
with depth, and how they are related to each other. Each parameter shows a distinct change at approximately 430 m asl. Both d18O and dDdecrease rapidly, fluid inclusion homogenisation temperatures change from showing only a narrow range to being highly variable and gold
contents in quartz start to increase and are locally over 30 ppm.
J. Naden et al. / Chemical Geology 197 (2003) 143–159150
jC. It is known from experimental work (Matsuhisa
et al., 1978; Zhang et al., 1989) that at temperatures
in excess of 300 jC, equilibration between quartz
and water is relatively rapid (ca. 30–100 h) whilst at
temperatures lower than 250 jC, isotopic equilibriumis not achieved. Thus, for both of these studies, due
to the high precipitation temperature of the hydro-
thermal quartz and the time elapsed since minerali-
sation, some posttrapping exchange by diffusion can
be expected. But in lower temperature ( < 250 jC)young ( < 15 Ma) epithermal deposits, such as Prof-
itis Ilias and Beregovo, reequilibration by diffusion
may not occur. Here, as the quartz cools rapidly from
hydrothermal to ambient temperatures, slow d18Odiffusion rates may prevent significant posttrapping
exchange. This is indicated qualitatively at Bere-
govo, where one type of quartz has clearly not
undergone any significant posttrapping exchange
(Table 3).
5.3. Modelling of posttrapping exchange by diffusion
We can examine posttrapping exchange by diffu-
sion by looking at Dodson closure temperatures
(Dodson, 1973, 1979) for d18O in quartz. This
approach is particularly successful in systems domi-
nated by volume diffusion (Valley, 2001) and d18Odiffusion between the wall of a fluid inclusion, and
bulk quartz is one example of this.
Tc ¼E=R
ln�ART 2
c ðD0=a2ÞEðyT=ytÞ
� �8<:
9=; ð1Þ
The Dodson equation (Eq. (1)) defines the closure
temperature (Tc [K]) in terms of a dimensionless
diffusional anisotropy parameter (A), the gas constant
(R [J mol� 1 K� 1]), the preexponential diffusion
coefficient (D0 [m2 s� 1]), activation energy (E [J]),
distance over which diffusion takes place (a [m]) and
cooling rate (yT/yt [K s� 1]). As individual fluid
inclusions generally have small volumes ( < 0.125
Al), then diffusion and exchange of d18O between
host quartz and inclusion water over short distances
will significantly effect the composition of inclusion
water. For example, a 1-Am-thick shell of quartz
surrounding 10 Am of spherical fluid inclusion repre-
sents over 70% of the inclusion volume (Fig. 6A).
Thus, it is necessary to examine closure temperatures
for diffusion distances at the micron and submicron
scale. Fig. 6B shows quartz closure temperatures at a
variety of diffusion distances and cooling rates. From
this, it is clear that the closure temperature of d18O in
quartz, even for very short distances (ca. 0.01 Am), is
higher than most epithermal mineralisation (ca. 250
jC) for cooling rates in excess of ca. 100 jC Ma� 1.
This means that in low- to moderate temperature
Fig. 5. Combined D/H–d18O graph comparing directly measured
and calculated data with the stable isotope systematics of the
modern geothermal system. Included for reference purposes are: (i)
two single-stage steam separation trends for fluid with 5 wt.%
dissolved NaCl (calculated using the methodology of Truesdell,
1984; the steam tables of Haas, 1977a,b; and the fractionation data
of Horita et al., 1995), (ii) the top left part of the magmatic water
box (Sheppard, 1986), (iii) the Mediterranean meteoric water line
and Mediterranean seawater (see text for discussion of the data).
J. Naden et al. / Chemical Geology 197 (2003) 143–159 151
epithermal deposits, the d18O of inclusion water will
not be significantly modified by posttrapping
exchange with quartz. However, in higher temper-
ature (300–400 jC) hydrothermal systems, Fig. 6B
shows that quartz is not closed to d18O diffusion.
Hence, posttrapping diffusion will take place and the
d18O composition of the inclusion water will be
modified. Also, in higher temperature systems, the
degree of exchange will be dependent on inclusion
size. As for a given distance and cooling rate, smaller
inclusions will have proportionally more quartz to
exchange with than larger inclusions (see Fig. 6A).
This relationship between inclusion size and degree of
posttrapping exchange has been recorded by Ohba et
al. (1995). Thus, for high temperature (>300 jC)hydrothermal systems, d18Oquartz data coupled with
accurate knowledge of quartz precipitation temper-
atures are better estimators of d18Ofluid than d18OFI.
However, in lower temperature systems ( < 250 jC),quartz closure temperatures indicate that fluid inclu-
sions do not reequilibrate with quartz during cooling,
and to this, Vityk et al. (1993) show that quartz–fluid
inclusion isotope temperatures associated with a spe-
cific quartz type are in good agreement with fluid
inclusion microthermometry. However, for the Prof-
itis Ilias samples and other quartz types at Beregovo,
isotope temperatures do not agree (see Tables 2 and
3). Thus, in the epithermal examples, the fact that
some isotope temperatures agree and others do not
suggests that another process must be responsible for
the differences.
5.4. Kinetically controlled fluid–mineral exchange
during quartz formation
Dubinina and Lakshtanov (1997) provide a differ-
ent perspective into reasons for the quartz–inclusion
water d18O shift. They show that providing no other
isotopic equilibration mechanism operates (e.g. diffu-
sion), complete isotopic equilibrium between a min-
eral and a fluid phase cannot be achieved through
kinetically controlled solution–precipitation pro-
Table 3
Data from previous inclusion water–quartz d18O studies
Data source Sample
no.
Sample
wt. (g)
FI water
wt. (mg)
d18OFI
(x)
d18Oquartz
(x)
d18Ocalculated
(x)
D18Ocalculated FI
(x)
Temperature
(jC)dDFI
(x)
Rye and O’Neil 63-R-4 60.6 6.0 � 3.7 n.a. – – – n.a.
(1968) 63-R-23 29.5 6.2 � 4.5 15.8 8.4 12.9 300 n.a.
63-R-23 29.5 6.2 � 4.5 15.8 9.0 13.5 315 n.a.
Ohba et al. G-1 n.g. n.g. � 0.3 n.a. – – – n.a.
(1995) G-2 n.g. n.g. � 1.1 14.5 7.1 8.2 300 n.a.
G-2 n.g. n.g. � 1.1 14.5 9.9 11.0 400 n.a.
G-3 n.g. n.g. � 5.8 14.5 7.1 12.9 300 n.a.
G-3 n.g. n.g. � 5.8 14.5 9.9 15.7 400 n.a.
Y-1 n.g. n.g. � 11.2 14.2 6.8 18.0 300 n.a.
Y-1 n.g. n.g. � 11.2 14.2 9.6 20.8 400 n.a.
Vityk et al. 486 QI 3–5 n.g. � 5.6 9.2 � 2.9 2.7 200 � 72
(1993) 1308 QI 3–5 n.g. � 5.0 7.5 � 2.8 2.2 230 � 80
1522 QI 3–5 n.g. � 5.9 9.7 0.3 6.2 250 � 79
496 QII 3–5 n.g. � 7.1 8.7 � 2.8 4.3 210 � 56
523 QII 3–5 n.g. � 1.9 9.4 � 2.7 � 0.8 200 � 66
515 QII 3–5 n.g. � 2.4 8.7 � 2.8 � 0.4 210 � 79
483 QII 3–5 n.g. � 2.8 9.1 � 3.0 � 0.2 200 � 84
A n.g. n.g. � 3.5 – – – – � 82
B n.g. n.g. � 2.5 – – – – � 79
477 QII 3–5 n.g. � 4.0 8.7 � 3.4 0.6 200 � 94
100 QIII 3–5 n.g. � 2.1 15.1 4.8 6.9 230 � 55
331 QIII 3–5 n.g. � 0.9 17.9 7.6 8.5 230 � 52
Calculated fluid compositions use Zhang et al. (1989).
n.a. = not analysed; n.g. = not given; A= coexisting sphalerite; B = coexisting galena.
J. Naden et al. / Chemical Geology 197 (2003) 143–159152
cesses. Dubinina and Lakshtanov (1997) expressed
the degree of isotopic exchange (F) between quartz
and fluid, where the quartz has a silica gel precursor,
as
F ¼ D0 � Di
D0 � Deð2Þ
where D0, Di and De are differences in d values
between fluid and (i) silica gel (D0), (ii) freshly
precipitating quartz (Di) and (iii) quartz at equilibrium
(De). Additionally, they described the degree of
exchange (F) in terms of total mass of water (w),
total mass of mineral (M) and mass of dissolved and
reprecipitated mineral (m) as
F ¼ 1� exp � m
w
� �h i1þ w
M
� �ð3Þ
Eq. (3) means that during solution–precipitation,
isotopic fractionation between mineral and fluid can
exceed the predicted equilibrium value of Dmineral –
fluid. This has been recorded experimentally by Zhang
et al. (1989) who documented Di�De values of
+ 8.3xduring the early stages of a 250 jC silica
gel–water isotope equilibration experiment.
The modelling predicts changes in isotopic com-
position as an unstable mineral is transformed iso-
chemically into a stable one and is particularly
relevant to epithermal systems where crystalline
quartz can have amorphous precursors (e.g. Dong et
al., 1995). The following equation describes varia-
tions in the bulk isotopic composition of quartz (dBs)
formed during solution–precipitation processes (for a
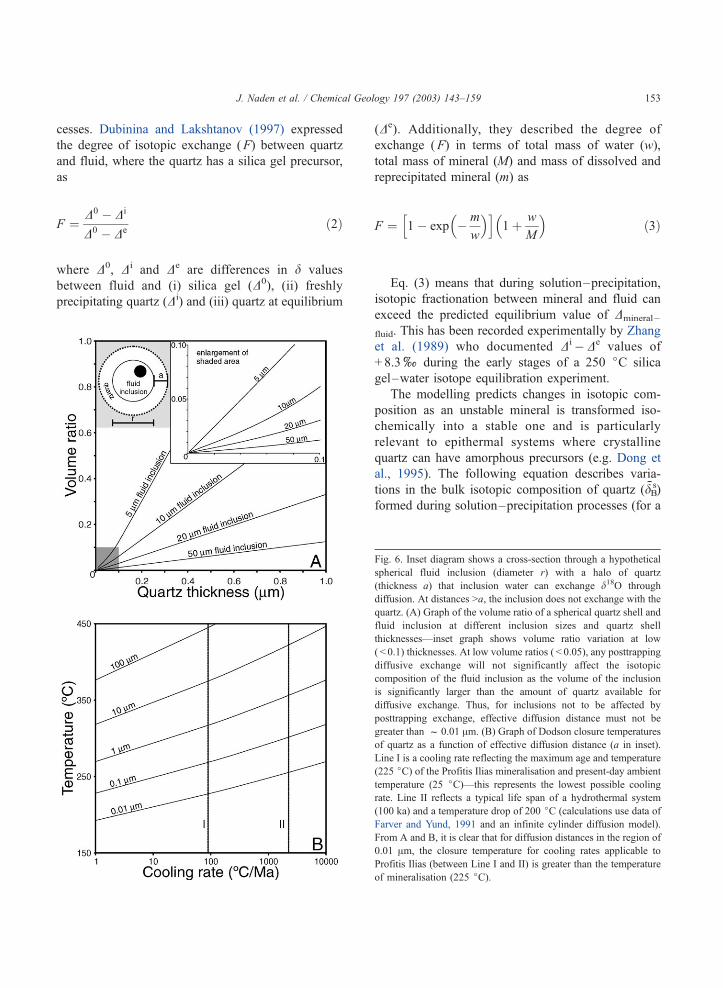
Fig. 6. Inset diagram shows a cross-section through a hypothetical
spherical fluid inclusion (diameter r) with a halo of quartz
(thickness a) that inclusion water can exchange d18O through
diffusion. At distances >a, the inclusion does not exchange with the
quartz. (A) Graph of the volume ratio of a spherical quartz shell and
fluid inclusion at different inclusion sizes and quartz shell
thicknesses—inset graph shows volume ratio variation at low
( < 0.1) thicknesses. At low volume ratios ( < 0.05), any posttrapping
diffusive exchange will not significantly affect the isotopic
composition of the fluid inclusion as the volume of the inclusion
is significantly larger than the amount of quartz available for
diffusive exchange. Thus, for inclusions not to be affected by
posttrapping exchange, effective diffusion distance must not be
greater than f 0.01 Am. (B) Graph of Dodson closure temperatures
of quartz as a function of effective diffusion distance (a in inset).
Line I is a cooling rate reflecting the maximum age and temperature
(225 jC) of the Profitis Ilias mineralisation and present-day ambient
temperature (25 jC)—this represents the lowest possible cooling
rate. Line II reflects a typical life span of a hydrothermal system
(100 ka) and a temperature drop of 200 jC (calculations use data of
Farver and Yund, 1991 and an infinite cylinder diffusion model).
From A and B, it is clear that for diffusion distances in the region of
0.01 Am, the closure temperature for cooling rates applicable to
Profitis Ilias (between Line I and II) is greater than the temperature
of mineralisation (225 jC).
J. Naden et al. / Chemical Geology 197 (2003) 143–159 153
detailed discussion of its derivation see Dubinina and
Lakshtanov, 1997):
dsB ¼ d0A � w
mðD0 � DiÞ 1� exp �m
w
� �h ið4Þ
where dA0 is the initial isotopic composition of the
amorphous (unstable) phase, D0 is derived from the
initial isotopic compositions of the fluid (dw0) and the
unstable silica phase (D0 = dA0� dw
0), Di is calculated
from the initial fluid composition and quartz–water
fractionation at the temperature at which the solution–
precipitation process take place (Di = dw0 + 1000Lna)
and m/w represents the reprecipitated mineral–fluid
ratio as the amount of quartz formed (m) changes from
0 to M. To model how kinetic processes relate to our
measured quartz compositions, we need to estimate the
initial isotopic compositions of the fluid, the unstable
silica phase and temperature. A first approximation of
solution–precipitation temperatures can be estimated
from fluid inclusion data (ca. 225 jC). For the initial
fluid, the composition of the modern reservoir
( + 3x, Pflumio et al., 1991) provides a good ana-
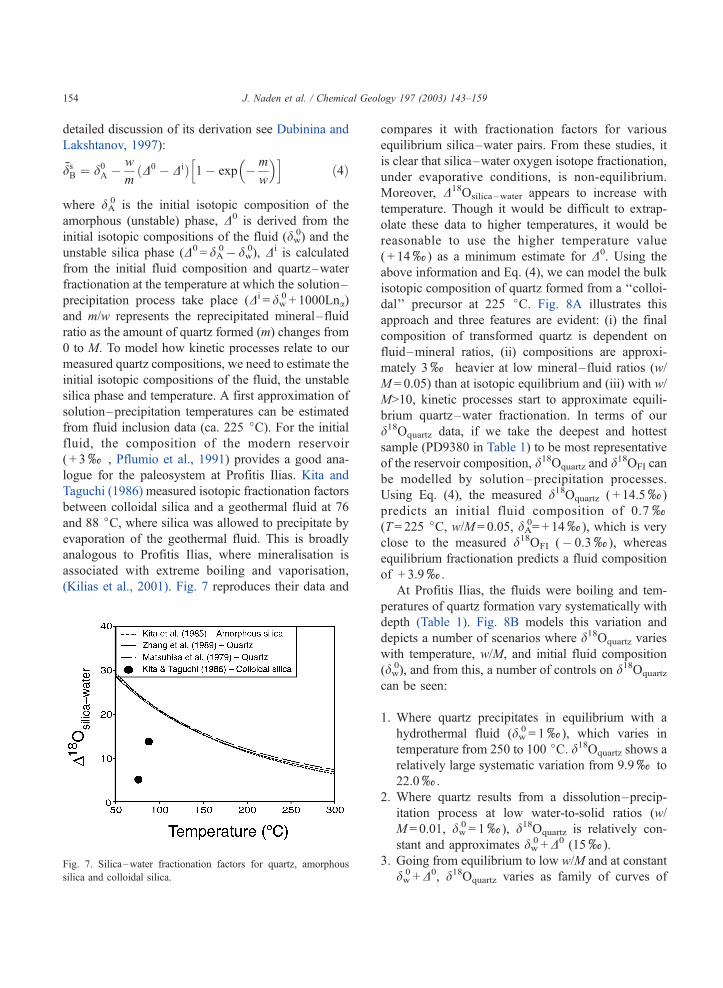
logue for the paleosystem at Profitis Ilias. Kita and
Taguchi (1986) measured isotopic fractionation factors
between colloidal silica and a geothermal fluid at 76
and 88 jC, where silica was allowed to precipitate by
evaporation of the geothermal fluid. This is broadly
analogous to Profitis Ilias, where mineralisation is
associated with extreme boiling and vaporisation,
(Kilias et al., 2001). Fig. 7 reproduces their data and
compares it with fractionation factors for various
equilibrium silica–water pairs. From these studies, it
is clear that silica–water oxygen isotope fractionation,
under evaporative conditions, is non-equilibrium.
Moreover, D18Osilica –water appears to increase with
temperature. Though it would be difficult to extrap-
olate these data to higher temperatures, it would be
reasonable to use the higher temperature value
( + 14x) as a minimum estimate for D0. Using the
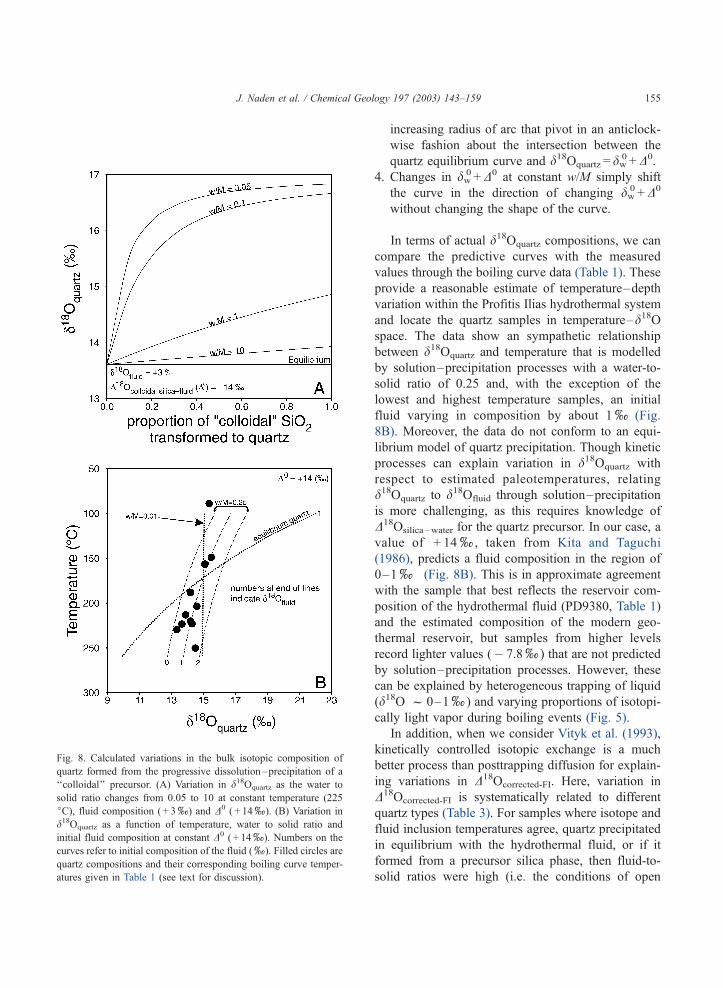
above information and Eq. (4), we can model the bulk
isotopic composition of quartz formed from a ‘‘colloi-
dal’’ precursor at 225 jC. Fig. 8A illustrates this
approach and three features are evident: (i) the final
composition of transformed quartz is dependent on
fluid–mineral ratios, (ii) compositions are approxi-
mately 3x heavier at low mineral–fluid ratios (w/
M = 0.05) than at isotopic equilibrium and (iii) with w/
M>10, kinetic processes start to approximate equili-
brium quartz–water fractionation. In terms of our
d18Oquartz data, if we take the deepest and hottest
sample (PD9380 in Table 1) to be most representative
of the reservoir composition, d18Oquartz and d18OFI can
be modelled by solution–precipitation processes.
Using Eq. (4), the measured d18Oquartz ( + 14.5x)
predicts an initial fluid composition of 0.7x(T= 225 jC, w/M= 0.05, dA
0= + 14x), which is very
close to the measured d18OFI (� 0.3x), whereas
equilibrium fractionation predicts a fluid composition
of + 3.9x.
At Profitis Ilias, the fluids were boiling and tem-
peratures of quartz formation vary systematically with
depth (Table 1). Fig. 8B models this variation and
depicts a number of scenarios where d18Oquartz varies
with temperature, w/M, and initial fluid composition
(dw0), and from this, a number of controls on d18Oquartz
can be seen:
1. Where quartz precipitates in equilibrium with a
hydrothermal fluid (dw0 = 1x), which varies in
temperature from 250 to 100 jC. d18Oquartz shows a
relatively large systematic variation from 9.9xto
22.0x.
2. Where quartz results from a dissolution–precip-
itation process at low water-to-solid ratios (w/
M = 0.01, dw0 = 1x), d18Oquartz is relatively con-
stant and approximates dw0 +D0 (15x).
3. Going from equilibrium to low w/M and at constant
dw0 +D0, d18Oquartz varies as family of curves of
Fig. 7. Silica–water fractionation factors for quartz, amorphous
silica and colloidal silica.
J. Naden et al. / Chemical Geology 197 (2003) 143–159154
increasing radius of arc that pivot in an anticlock-
wise fashion about the intersection between the
quartz equilibrium curve and d18Oquartz = dw0 +D0.
4. Changes in dw0 +D0 at constant w/M simply shift
the curve in the direction of changing dw0 +D0
without changing the shape of the curve.
In terms of actual d18Oquartz compositions, we can
compare the predictive curves with the measured
values through the boiling curve data (Table 1). These
provide a reasonable estimate of temperature–depth
variation within the Profitis Ilias hydrothermal system
and locate the quartz samples in temperature–d18Ospace. The data show an sympathetic relationship
between d18Oquartz and temperature that is modelled
by solution–precipitation processes with a water-to-
solid ratio of 0.25 and, with the exception of the
lowest and highest temperature samples, an initial
fluid varying in composition by about 1x(Fig.
8B). Moreover, the data do not conform to an equi-
librium model of quartz precipitation. Though kinetic
processes can explain variation in d18Oquartz with
respect to estimated paleotemperatures, relating
d18Oquartz to d18Ofluid through solution–precipitation
is more challenging, as this requires knowledge of
D18Osilica –water for the quartz precursor. In our case, a
value of + 14x, taken from Kita and Taguchi
(1986), predicts a fluid composition in the region of
0–1x (Fig. 8B). This is in approximate agreement
with the sample that best reflects the reservoir com-
position of the hydrothermal fluid (PD9380, Table 1)
and the estimated composition of the modern geo-
thermal reservoir, but samples from higher levels
record lighter values (� 7.8x) that are not predicted
by solution–precipitation processes. However, these
can be explained by heterogeneous trapping of liquid
(d18O f 0–1x) and varying proportions of isotopi-
cally light vapor during boiling events (Fig. 5).
In addition, when we consider Vityk et al. (1993),
kinetically controlled isotopic exchange is a much
better process than posttrapping diffusion for explain-
ing variations in D18Ocorrected-FI. Here, variation in
D18Ocorrected-FI is systematically related to different
quartz types (Table 3). For samples where isotope and
fluid inclusion temperatures agree, quartz precipitated
in equilibrium with the hydrothermal fluid, or if it
formed from a precursor silica phase, then fluid-to-
solid ratios were high (i.e. the conditions of open
Fig. 8. Calculated variations in the bulk isotopic composition of
quartz formed from the progressive dissolution–precipitation of a
‘‘colloidal’’ precursor. (A) Variation in d18Oquartz as the water to
solid ratio changes from 0.05 to 10 at constant temperature (225
jC), fluid composition ( + 3x) and D0 ( + 14x). (B) Variation in
d18Oquartz as a function of temperature, water to solid ratio and
initial fluid composition at constant D0 ( + 14x). Numbers on the
curves refer to initial composition of the fluid (x). Filled circles are
quartz compositions and their corresponding boiling curve temper-
atures given in Table 1 (see text for discussion).
J. Naden et al. / Chemical Geology 197 (2003) 143–159 155
flow). For samples where isotope and fluid inclusions
record different temperatures (D18Ocalculated-FI: 2.2–
8.5x), D18Ocalculated-FI can be explained by quartz
forming through solution–precipitation processes at
low fluid-to-solid ratios (Fig. 8A). This corresponds to
conditions where fluid flow was restricted and/or it
underwent extensive boiling. This feature has been
observed at lower temperatures by Kita and Taguchi
(1986). When we consider the alternative of posttrap-
ping diffusional exchange as a mechanism for the d18Oquartz–inclusion water shift in Vityk et al. (1993), it is
difficult to explain the variation. First, it would be
expected to affect all samples equally. That is, for a
given size of fluid inclusion, quartz age and mineral-
isation temperature, D18Ocorrected-FI should be constant
in all samples. This is not the case. Some show no shift
whilst others show D18Ocorrected-FI to be + 8x(Table
3). In terms of a diffusion mechanism, this can only be
explained by significantly different quartz ages or that
fluid inclusions are significantly larger in one type of
quartz. Vityk et al. (1993) do not indicate that either of
these are applicable to the Beregovo quartzes.
5.5. What does fluid inclusion d18O represent?
The modelling of Dodson closure temperatures for
quartz show, theoretically, that for inclusions larger
than about 5 Am and at temperatures less than 250 jC,quartz does not significantly exchange d18O with fluid
inclusion water. A number of independent lines of
evidence support this:
1. The epithermal mineralisation at Profitis Ilias
shows a consistency between d18OFI, dDFI and
fluid inclusion and geochemical data that is not
seen in the d18Ocalculated data (see Fig. 5).
2. On Milos, there is close isotopic and chemical
similarity between the composition of the fluid
inclusion waters and that of the modern geo-
thermal system (see Fig. 5), and there are sound
geological reasons that a continuum exists between
the ancient and modern systems (Kilias et al.,
2001).
3. The data of Vityk et al. (1993) record quartz–fluid
inclusion isotope temperatures that agree with fluid
inclusion data and cannot be explained by diffusion
alone. Also, quartz and coexisting sulphides have
similar dDFI and d18OFI (see Table 3).
4. The modelling of solution–precipitation processes
show that kinetic factors are a valid alternative to
posttrapping reequilibration for explaining differ-
ences between d18Ocalculated and d18OFI.
Thus, the above lend support to the assertion that,
in epithermal systems, d18O determined on fluid
inclusion waters may be a better guide to the original
isotopic composition of the hydrothermal fluid than
temperature-corrected quartz data (Fig. 5). This is
because d18Oquartz in solution–precipitation processes
can be significantly different from d18Oquartz at equi-
librium for a given temperature and d18Ofluid. How-
ever, in higher temperature (>300 jC) hydrothermal
systems, such as porphyry–Cu, Sn–W and orogenic–
Au deposits, Dodson closure temperatures show that
quartz and fluid inclusion water undergo posttrapping
exchange. Thus, in these cases, the indirect method
will always provide the best estimate of fluid d18O.Also, at Profitis Ilias, d18OFI contains a record of
fluid processes not seen in d18Ocalculated (Fig. 5 and
Section 5.1). First, this is probably because temper-
ature estimates within paleohydrothermal systems are
not precise enough to allow accurate reconstruction
of variations in d18O of the hydrothermal fluid. For
example, in a boiling epithermal system fluid, tem-
peratures can vary by up to 50–70 jC over a vertical
interval of only 100–200 m (Table 1). This can
represent differences of nearly 10xin fluid d18O(i.e. the difference in boiling-curve-estimated d18Obetween 457 and 657 m elevations, Table 1). Sec-
ond, formation of quartz via an amorphous precursor
(e.g. Dong et al., 1995) is a non-equilibrium process
and can result in estimates of d18Ofluid that are too
heavy.
5.6. Implications for d18O analysis of quartz
At Profitis Ilias, combined dD–d18Oquartz and dD–
d18OFI and comparison with the modern geothermal
system coupled with kinetic modelling of the data
(Figs. 5 and 8) show that the differences in d18Oquartz
and d18OFI can be related though a combination of
extensive boiling and quartz formation via an amor-
phous precursor. Whereas, calculation of equilibrium
fluid compositions appears to overestimate the fluid
composition by + 8xto + 10x. If the kinetic
model is valid, this places limitations on the use of
J. Naden et al. / Chemical Geology 197 (2003) 143–159156
d18Oquartz in low-temperature epithermal systems to
estimate d18Ofluid where solution–precipitation pro-
cesses operate. Failure to recognise this limitation can
result in significant errors in the estimation of
d18Ofluid. Observations that indicate d18Oquartz is
kinetically controlled and mitigate against using it
to calculate fluid compositions are:
1. Textural information indicating formation from an
amorphous precursor (e.g. Dong et al., 1995). This
can be documented through careful petrography
and cathodoluminescence studies.
2. Fluid inclusion data that indicate mineralisation is
associated with extensive boiling and vaporisation
(e.g. Simmons and Browne, 1997; Scott and
Watanabe, 1998; Kilias et al., 2001).
3. Where mineralisation temperatures are less than
250 jC and data are available. Systematic differ-
ences between d18Oquartz and d18OFI can also
indicate a kinetic control.
6. Summary and conclusions
In summary, dD and d18O in extracted fluid inclu-
sion waters from the Profitis Ilias epithermal miner-
alisation were found to show a linear correlation that
closely parallels the stable isotope systematics in the
active Milos geothermal system, with dD varying
from � 23.8xto � 68.0xand d18O from � 0.3
to � 7.8.x. d18O analysis of the quartz, using the
same samples, shows a restricted variation of 13.4–
15.9xand correction of this data, employing a
variety fluid inclusion temperature estimates, does
not match d18O in the corresponding fluid inclusion
waters. D18Ocorrected-FI ranges from + 8xto
+ 12xand calculated Dodson closure temperatures
for quartz, at scales appropriate to fluid inclusions and
at cooling rates compatible with the lifetime of a
geothermal systems, indicate that at temperatures
below 250 jC, these differences cannot be accounted
for by posttrapping diffusional exchange of 18O
between inclusion water and host quartz. Thus, for
the Profitis Ilias mineralisation, posttrapping reequili-
bration is not thought to be an appropriate process for
explaining the observed D18Ocorrected-FI. In our case,
solution–precipitation processes are preferred as
modelling shows that differences, in relative terms,
between d18OFI and d18Oquartz can be explained by
kinetic processes. However, insufficient data and
knowledge concerning the d18O composition of pos-
sible silica precursors at temperatures above 150 jCand fluid-to-solid ratios preclude a generalised recon-
struction of fluid compositions using this method.
The results of diffusion and kinetic modelling
coupled with independent lines of evidence, such as
the consistency of dDFI and d18OFI with other geo-
chemical data and their similarity to the isotope
systematics of the modern systems, lead us to believe
that fluid inclusion d18O has the potential to be a
better estimator of oxygen isotope systematics in low-
temperature hydrothermal systems than d18Oquartz and
fluid inclusion temperatures. However, as there are
only two published fluid inclusion d18O studies in the
epithermal environment, further data from other sys-
tems are required to extend the applicability our
findings. In the first instance, these should concentrate
on boiling systems as these provide the best temper-
ature constraints. In addition, good petrographic and
geologic control is a prerequisite for reliable interpre-
tations. In our case, this was achieved through detailed
petrography and fluid inclusion microthermometry
within a well-constrained spatial and geological
framework (Kilias et al., 2001) that enabled compar-
isons between a mineralised system and its modern
analogue. At a smaller scale, or in the absence of a
modern analogue for comparison, careful cathodolu-
minescence petrography coupled with localised iso-
topic analysis of the quartz will also fulfil the
requirement. Finally, recent analytical developments
for the rapid determination of dD and d18O in small
(0.1 Al) amounts of water (Sharp et al., 2001) indicate
it should be possible to routinely analyse inclusion
waters without the need for the lengthy sample
preparation and analytical procedures. Factors that
have so far hindered systematic investigations into
the applicability of oxygen isotope determination of
fluid inclusion water.
Acknowledgements
This work was funded by the British Council, The
Greek General Secretariat of Research and a Marie
Curie Experienced Researcher Fellowship to JN
(HPMF-CT-2000-00762). Special thanks go to J.A.
J. Naden et al. / Chemical Geology 197 (2003) 143–159 157
Crossing and Y. Simos, geologists at Midas S.A., who
allowed access to drill-core and proprietary company
data. Drs. T.H.E. Heaton and B. Spiro are thanked for
providing impetus and encouragement during the
research. J.N., M.J.L. and T.J.S. publish with the
permission of the Director, British Geological Survey
(NERC). [CA]
References
Bodnar, R.J., Reynolds, T.J., Kuehn, C.A., 1985. Fluid inclusion
systematics in epithermal systems. In: Berger, B.R., Bethke,
P.M. (Eds.), Geology and Geochemistry of Epithermal Systems.
Rev. Econ. Geol., vol. 2, pp. 73–97.
Briqueu, L., Javoy, M., Lancelot, J.R., Tatsumoto, M., 1986. Iso-
tope geochemistry of recent magmatism in the Aegean arc: Sr,
Nd, Hf, and O isotopic ratios in the lavas of Milos and San-
torini—geodynamic implications. Earth Planet. Sci. Lett. 80,
41–54.
Christanis, K., St. Seymor, K.S., 1995. A study of scale deposi-
tion an analog of mesothermal to epithermal one formation in
the volcano of Milos, Agean-arc, Greece. Geothermics 24,
541–552.
Clayton, R.N., Mayeda, T.K., 1963. The use of bromine pentafluor-
ide in the extraction of oxygen from oxide and silicates for
isotopic analysis. Geochim. Cosmochim. Acta 27, 43–52.
Craig, H., 1957. Isotopic standards for carbon and oxygen and
correction factors for mass spectromatic analysis of carbon di-
oxide. Geochim. Cosmochim. Acta 12, 133–149.
Deines, P., 1970. Mass spectrometer correction factors for the de-
tection of small isotopic variation of carbon and oxygen. Int. J.
Mass Spectrom. Ion Phys. 4, 283–295.
Dodson, M.H., 1973. Closure temperature in cooling geochrono-
logical and petrologic systems. Contrib. Mineral. Petrol. 40,
259–274.
Dodson, M.H., 1979. Theory of cooling ages. In: Jaeger, E., Hun-
ziker, J.C. (Eds.), Lectures in Isotope Geology. Springer-Verlag,
Heidelberg, pp. 194–202.
Dong, G., Morrison, G., Jaireth, S., 1995. Quartz textures in epi-
thermal veins, Queensland-classification, origin and implication.
Econ. Geol. 90, 1841–1856.
Dubinina, E.O., Lakshtanov, L.Z., 1997. A kinetic model of iso-
topic exchange in dissolution–precipitation processes. Geo-
chim. Cosmochim. Acta 61, 2265–2271.
Farver, J.R., Yund, R.A., 1991. Oxygen diffusion in quartz: de-
pendence on temperature and water fugacity. Chem. Geol. 90,
55–70.
Fytikas, M., 1989. Updating of the geological and geothermal re-
search on Milos island. Geothermics 18, 485–496.
Haas Jr., J.L., 1977a. Physical properties of the coexisting phases
and thermochemical properties of the H2O component in boil-
ing NaCl solutions. U.S. Geol. Surv. Prof. Pap., B 1421-A,
A1–A73.
Haas Jr., J.L., 1977b. Thermodynamic properties of the coexisting
phases and thermochemical properties of the NaCl component in
boiling NaCl solutions. U.S. Geol. Surv. Prof. Pap., B 1421-B,
B1–B71.
Hayashi, K.-I., Maruyama, T., Satoh, H., 2001. Precipitation of gold
in a low-sulfidation epithermal gold deposit: insights from a
submillimeter-scale oxygen isotope analysis of vein quartz.
Econ. Geol. 96, 211–216.
Hedenquist, J.W., Reyes, A.G., Simmons, S.F., Taguchi, S., 1992.
The thermal and geochemical structure of geothermal and epi-
thermal systems: a framework for interpreting fluid inclusion
data. Eur. J. Mineral. 4, 989–1015.
Horita, J., Cole, D.R., Wesolowski, D.J., 1995. The activity–com-
position relationship of oxygen and hydrogen isotopes in aque-
ous salt solutions: III. Vapor – liquid water equilibration of
NaCl solutions to 350jC. Geochim. Cosmochim. Acta 59,
1139–1151.
Kazahaya, K., Matsuo, S., 1984. A new ball-milling method for
extraction of fluid inclusions from minerals. Geochem. J. 19,
45–54.
Kilias, S., Naden, J., Cheliotis, I., Shepherd, T.J., Constandinidou, H.,
Crossing, J., Simos, I., 2001. Epithermal gold mineralisation in
the active Aegean Volcanic arc: the Profitis Ilias deposit, Milos
island, Greece. Miner. Depos. 36, 32–44.
Kishima, N., Sakai, H., 1980. Oxygen-18 and deuterium determi-
nations on a single water sample of a few milligrams. Anal.
Chem. 52, 356–358.
Kita, I., Taguchi, S., 1986. Oxygen isotopic behavior of precipitat-
ing silica from geothermal water. Geochem. J. 20, 153–157.
Lecuyer, C., O’Neil, J.R., 1994. Stable isotope compositions of fluid
inclusions in biogenic carbonates. Geochim. Cosmochim. Acta
58, 353–363.
Liakopoulos, A., 1987. Hydrothermalisme et mineralisations metal-
liferes de l’ile de Milos (Cyclades–Grece). Mem. Sci. Terre.
Universite Paris, VI, No. 36–87.
Liakopoulos, A., Katerinopoulos, A., Markopoulos, T., Boulegue,
J., 1991. A mineralogical, petrographic and geochemical study
of samples from wells in the geothermal field of Milos Island
(Greece). Geothermics 20, 237–256.
Luders, L., Pracejus, B., Halbach, P., 2001. Fluid inclusion and
sulfur isotope studies in probable modern analogue Kuroko-type
ores from the JADE hydrothermal field (Central Okinawa
Trough, Japan). Chem. Geol. 173, 45–58.
Matsuhisa, Y., Goldsmith, J.R., Clayton, R.N., 1978. Mechanisms
of hydrothermal crystallization of quartz at 250 jC and 15 kbar.
Geochim. Cosmochim. Acta 42, 173–182.
Ohba, T., Matsuo, S., 1988. Precise determination of hydrogen and
oxygen isotope ratios of water in fluid inclusions of quartz and
halite. Geochem. J. 22, 55–68.
Ohba, T., Kazahaya, K., Matsuo, S., 1995. Diffusional 18O loss
from inclusion water in a natural hydrothermal quartz from
the Kaneuchi tungsten deposit, Japan. Geochim. Cosmochim.
Acta 59, 3039–3047.
O’Neil, J.R., Adami, L.H., Epstein, S., 1975. Revised value for the18O fractionation between CO2 and water at 25 jC. J. Res. U.S.Geol. Surv. 3, 623–624.
O’Reilly, C., Jenkin, G.R.T., Feely, M., Alderton, D.H.M., Fallick,
A.E., 1997. A fluid inclusion and stable isotope study of fluid
J. Naden et al. / Chemical Geology 197 (2003) 143–159158
evolution in the Galway Granite, Connemara, Ireland. Contrib.
Mineral. Petrol. 129, 120–142.
Papazachos, C.B., Kiratzi, A.A., 1996. A detailed study of the
active crustal deformation in the Aegean and surrounding area.
Tectonophysics 253, 129–153.
Pflumio, C., Boulegue, J., Liakopoulos, A., Briqueu, L., 1991. Oxy-
gen, hydrogen, strontium isotopes and metals in the present-date
and past geothermal systems of Milos island (Aegean arc). In:
Pagel, M., Leroy, J.L. (Eds.), Source, Transport and Deposition
of Metals. Balkema, Rotterdam, pp. 107–112.
Pichavant, M., Ramboz, C., Weisbrod, A., 1982. Fluid immiscibil-
ity in natural processes; use and misuse of fluid inclusion data: I.
Phase equilibria analysis; a theoretical and geometrical ap-
proach. Chem. Geol. 37, 1–27.
Ramboz, C., Pichavant, M., Weisbrod, A., 1982. Fluid immiscibil-
ity in natural processes; use and misuse of fluid inclusion data:
II. Interpretation of fluid inclusion data in terms of immiscibility.
Chem. Geol. 37, 29–48.
Rye, R.O., O’Neil, J.R., 1968. The O18 content of water in primary
fluid inclusions from Providencia, north-central Mexico. Econ.
Geol. 63, 232–238.
Scott, A.M., Watanabe, Y., 1998. ‘‘Extreme boiling’’ model for
variable salinity of the Hokko low-sulfidation epithermal Au
prospect, southwestern Hokkaido, Japan. Miner. Depos. 33,
568–578.
Sharp, Z.D., Atudorei, V., Durakiewicz, T., 2001. A rapid method
for determination of hydrogen and oxygen isotope ratios from
water and hydrous minerals. Chem. Geol. 178, 197–210.
Sheppard, S.M.F., 1986. Characterization and isotopic variations in
natural waters. In: Valley, J.W., Taylor, Jr., H.P., O’Neil, J.R.
(Eds.), Stable Isotopes in High Temperature Geological Pro-
cesses. Reviews in Mineralogy, vol. 16. Mineralogical Society
of America, Washington, DC, pp. 165–183.
Simmons, S.F., Browne, P.R.L., 1997. Saline fluid inclusions in
sphalerite from the Broadlands-Ohaaki geothermal system: a
coincidental trapping of fluids being boiled toward dryness.
Econ. Geol. 92, 485–489.
Truesdell, A.H., 1984. Stable isotopes in hydrothermal systems. In:
Henley, R.W., Truesdell, A.H., Barton, P.B. (Eds.), Fluid–Min-
eral Equilibria in Hydrothermal Systems. Rev. Econ. Geol., vol.
1, pp. 129–142.
Tsokas, G.N., 1996. Interpretation of the Bouguer anomaly of Milos
island (Greece). J. Volcanol. Geotherm. Res. 72, 163–181.
Valley, J.W., 2001. Stable isotope thermometry at high temperatures.
In: Valley, J.W., Cole, D.R. (Eds.), Stable Isotope Geochemistry.
Rev. Mineral. Geochem., vol. 43, pp. 365–413.
Vityk, M.O., Krouse, H.R., Demihov, Y.N., 1993. Preservation of
d18O values of fluid inclusion water over geological time in an
epithermal environment: Beregovo deposit, Transcarpathia, Uk-
raine. Earth Planet. Sci. Lett. 119, 561–568.
Wilkinson, J.J., Jenkin, G.R.T., Fallick, A.E., Foster, R.P., 1995.
Oxygen and hydrogen isotopic evolution of Variscan crustal
fluids, south Cornwall, UK. Chem. Geol. 123, 239–254.
Zhang, L., Liu, J.X., Zhou, H., Chen, Z.S., 1989. Oxygen isotope
fractionation in the quartz–water– salt system. Econ. Geol. 84,
1643–1650.
J. Naden et al. / Chemical Geology 197 (2003) 143–159 159