Embed Size (px)
Citation preview


Documents 97/3• Statistics Norway, February 1997
Mette Rolland
Military Expenditure in Norway'sMain Partner Countries forDevelopment AssistanceRevised and Expanded Version
Abstract: In recent years military expenditure in developing countries has been the subject of increasedattention on the aid policy agenda, both in individual donor countries and in multilateral organizations.This highlights the need for exact information on the allocation of resources to the defence sector indeveloping countries. Based on the desire to gain insight into existing problems with regard to militaryexpenditure in general and the situation in Norway's main partner countries in particular, a study ofmilitary expenditure in developing countries was carried out by the author in the spring of 1994. Thisstudy is an expanded version of a follow-up of the empirical section of the report. It contains a reviewof the seven most widely used international sources with information concerning the military sector ofdeveloping countries. In keeping with the new guidelines for Norwegian development assistance, thecountry survey has been expanded to include eighteen countries that are part of the high-priorityregions. The figures show that military expenditure as a percentage of GDP has risen lately in three ofthe countries surveyed. For the majority of Norway's main partner countries for development assistancethe defense sector is, however, using an increasingly smaller share of the countries' resources.
Keywords: Developing countries, aid policy, data on military expenditure.
JEL classification:.054, 055.
Acknowledgement: This document was financed by the Ministry of Foreign Affaires. My thanks to PerRichard Johansen for useful comments on earlier versions.
Address: Mette Rolland, Statistics Norway, Research Department,P.O.Box 8131 Dep., N-0033 Oslo, Norway. E-mail: [email protected]


Contens
1. Introduction 4
2. International sources for military expenditure in developing countries 62.1. International Institute of Strategic Studies 72.2. U.S. Arms Control Disarmament Agency 92.3. Stockholm International Peace Research Institute 102.4. International Monetary Fund 112.5. United Nations 122.6. World Bank 122.7. Central Intelligence Agency 132.8. Summary 13
3. Data on military expenditure in Norway's main partner countries for developmentassistance 14
3.1. Africa 153.1.1. Botswana 153.1.2. Eritrea * 183.1.3. Ethiopia* 203.1.4. Malawi * 223.1.5. Mozambique* 243.1.6. Namibia 263.1.7. South Africa 283.1.8. Tanzania * 303.1.9. Uganda* 323.1.10. Zambia* 343.1.11. Zimbabwe * 363.2. Asia 383.2.1. Bangladesh * 383.2.2. India 403.2.3. Nepal * 423.2.4. Pakistan 443.2.5. Sri Lanka* 463.3. Central America 483.3.1. Guatemala 483.3.2. Nicaragua* 50
4. Conclusion 52
References 57
Recent publications in the series Documents 59
* Indicates priority country.
3

1. Introduction*In recent years military expenditure in developing countries has been the subject of increasedattention on the aid policy agenda, both in individual donor countries and in multilateralorganizations. The subject has particularly been discussed in connection with the debate on goodgovernance, i.e. transparent, efficient, accountable and democratic government management of theresources available, based on general principles of the rule of law and respect for human rights.'
Both public and private resources are very limited in most developing countries, a fact which willmost likely be the case into the next century. It is therefore important to analyze the use of resourcesin all parts of the economy, and to reduce expenditure which contributes least to economicdevelopment and higher living standards for the population.
The effect of military spending on economic growth has been the subject of many studies in recentyears. The results of simple econometric models have often been contradictory. However, the messageof more complex models seems to be clear: higher military expenditure results in lower economicgrowth2 . Arms purchases often drain scarce foreign exchange earnings which could have been used toimport productive capital equipment, thereby enhancing the possibilities for sustainable growth. Highmilitary expenditure in one country may also increase regional tensions and result in rearmament inneighbouring countries, with negative developments for the entire region.
One general conclusion also appears to be that social indicators such as life expectancy, infantmortality, illiteracy and nutrition are better in countries which use a relatively small share of resourcesfor the military establishment. In addition to lower physical living standards, resources for the miliarysector might be used to violate human rights in those countries where the armed forces have anoppressive role.
It is difficult to weigh and evaluate what may be considered unnecessarily high military expenditure.Countries have a legitimate need for security and must be able to defend themselves against externalthreats. On the other hand, we may consider an expanded security concept in which the country'scitizens in addition to security against traditional military threats have a right to security againstpoverty and environmental degradation. 3 It may thus be argued that resources used to combat povertyand protect the environment safeguard the security of the people just as much and perhaps more thanhigh military expenditure. In many cases a transfer of resources from the military sector to socialsectors will probably result in increased security for the country's inhabitants when the expandedconcept of security is applied. The inclusion of this element makes it simpler to compare the use ofresources for defence with other uses of public sector funds.
If greater attention is to be devoted to military expenditure in the aid policy dialogue, we must firsthave data on how much resources the defence sector actually uses. All empirical and econometricresults are based on statistical material. Moreover, the data used as a basis and the analyticaltechnique applied to draw conclusions must be of such a quality that the results are valid. This isparticularly a problem with regard to studies covering military expenditure. No other sector isshrouded with so much secrecy and attempts to manipulate the figures. One of the conclusions of the"Tokyo Workshop on Military Expenditure and Aid" in November 1992 was that there was also aconsiderable need for greater transparency of military expenditure and that better data collection isrequired.
* An earlier and shorter version of this document was first published in Norwegian in the series Notater 96/33, and wastranslated by Janet Aagenms.
I The definition of good governance was obtained from the Ministry of Foreign Affairs in Denmark (1994).2 See Deger (1992), Dunne (1996) and Knight et al. (1996).3 The expanded concept of security was raised in the OECD (1993).
4

Based on the desire to gain insight into existing problems with regard to military expenditure ingeneral and the situation in our main partner countries in particular, I carried out a study of militaryexpenditure in developing countries in the spring of 1994 (Rolland 1994). The study was divided intothree parts. I first examined problems of methodology linked to military expenditure and thedifficulties of obtaining consistent numerical series both as time series and cross-section data.
In addition to the discussion of the general reasons why various expert groups specify differentfigures for military expenditure, the study contained a review of the most widely used internationalsources with information concerning the military sector of developing countries. In this connection Ilooked at publications from the following institutions:
• U.S. Arms Control and Disarmament Agency (ACDA)• International Monetary Fund (IMF)• International Institute for Strategic Studies (IISS)• Stockholm International Peace Research Institute (SIPRI)• United Nations (UN)
The aim of the third part of the study was to concretize the general discussion by starting with theavailable data on military expenditure for Norway's main partner countries for developmentassistance. If the use of resources for military purposes is to be discussed bilaterally, it is necessary toknow how much is actually allocated to the defence sector. It is also of interest to see the attitudes thatare manifested in terms of publication of data on military expenditure and the existing capacity fordata collection.
Norway looks upon transparency as desirable so that as many people as possible have someknowledge of national/government economic issues, as this is considered an important basis fordemocracy in a country.4 I therefore calculated various indicators for the degree of militarization inour main partner countries for development assistance and compared these with indicators for thecountry's social standards. Here I wanted to reveal any pattern as it is often assumed that high militaryexpenditure provides little scope for resources for important public social sectors.
A follow-up of the empirical section of the report from 1994 was made in 1996 (Rolland 1996). Inaddition to evaluating new information in the sources for military expenditure that were discussed inRolland (1994), two new sources were added to the discussion:
• World Bank• Central Intelligence Agency (CIA)
This study is a revised version of the document from 1996. In keeping with the new guidelines forNorwegian development assistance, the country survey has been expanded to include new countriesthat are now part of the high-priority regions. Time series have also been revised and extended whenpossible. There are many indications that the data situation for military expenditure in Norway's mainpartner countries for development assistance has, with few exceptions, improved over the past years.The defence sector also uses increasingly fewer resources in relative terms.
4 This has been asserted by the Ministry of Foreign Affairs (1992).
5
2. International sources for military expenditure in developingcountries
In this section I will evaluate the publications of the most widely used international sources formilitary expenditure in developing countries. In Rolland (1994), the focus was on the reasons fordisparities in the estimates from various sources, both with regard to absolute size and indicators. Themost important factors are described briefly below, while reference is made to the 1994 report for amore comprehensive discussion.
The first problem often encountered when determining the size of military expenditure is that thereare several different definitions of the concept. The question of what is relevant to include in "militaryexpenditure" may be debated. The answer will depend somewhat on the subject of the study. If thestudy is to attempt to comment on military force, expenditure is perhaps not the best measure to startwith - and in any case the amount used, for example, for pensions for military personnel isuninteresting. If, on the other hand, the study is to focus on how much it actually costs a society tomaintain its military establishment, it is natural to start with "opportunity costs", i.e. the value of thegoods and services the civilian sector of the population is deprived of because the appropriatingauthorities allocate resources to military purposes. In this type of analysis it is important to be awarethat expenditure on pensions for former military personnel - which can be substantial in manycountries in which military personnel have higher pensions than civilians - is paid for by the publicsector and in this way uses resources that could have been allocated to other purposes. Pensionexpenditure should therefore be included in the total amount for military expenditure. Anotherexample is countries which have compulsory military service (as e.g. in Norway) and where wagespaid to conscripts are considerably lower than the alternative pay of conscripts. This results inartificially low figures for military expenditure. For developing countries with high unemployment,however, the opportunity cost of conscripts may be minimal. The fact that conscript wages in thesecountries seem to exceed the opportunity cost contributes to pushing up military expenditure in manydeveloping countries.
One problem closely related to different definitions is to what extent the existing statistical material ismutually consistent. Many analyses contain an element of cross-section surveys. If one sourcepresents total military expenditure for several countries, and this concept does not comprise the sameexpenditure items for all the countries, the basis for comparison becomes distorted and the validity ofthe analysis is reduced.
Differences in updating routines in the various sources give rise to considerable variations in thestatistical material. The figures presented are in many cases budgeted expenditure and not actualexpenditure. Several years may elapse between the publication of the first estimates and the actualamount, and there are often very substantial differences between budgeted and actual expenditure.
Many of the international sources that publish data on military expenditure obtain their figures fromnational sources - particularly government budgets and national accounts. One problem in thisconnection is that the fiscal year often does not coincide with the calendar year, and that thebeginning and end of the fiscal year vary from one country to another. Attempts at standardizationmay give rise to inconsistent data.
In cross-section analyses where countries are entities it is difficult to compare expenditure that ismeasured in different currencies. There are several methods for making the data comparable. Themost frequently used method is to convert all figures to a common currency - usually the US dollar -with the help of the countries' exchange rates. The method does not always produce a satisfactorybasis for comparison because the exchange rates have a tendency to be overvalued or undervalued,particularly in developing countries. Considerable efforts have therefore been made to construct
6

purchasing power parities, i.e. the valuation of goods and services is based on common set of pricesinstead of using the various national prices. In this way the conclusions of cross-section analyseswhich include military expenditure are drawn against the background of a more correct basis forcomparison. Another possibility is to calculate rates, i.e. military expenditure as a percentage of e.g.gross domestic product.
If a time-series analysis is to be carried out, it is necessary to deflate military expenditure for variousyears to separate the inflation component from the real changes. Depending on the problem to beanalyzed and the aim of the study, various price deflators are often used, a factor which may producedifferent results.
Precisely because a country's real military expenditure is such a sensitive subject, many methods havebeen devised to camouflage expenditure on both personnel and equipment in government budgets.The situation is rendered even more difficult in that a number of countries are prohibited by law frompublishing data on military expenditure since this is assumed to constitute a threat to the country'ssecurity.
The published figures are examined here in the light of how the institutions have chosen to tackle thedifficulties described above. It is obvious that it is difficult in terms of data compilation to guardagainst deliberate data manipulation, but it is possible to check the other factors I have looked at. Insome cases, however, this would require enormous efforts. Publications from the followinginstitutions will be evaluated:
• International Institute of Strategic Studies (IBS)• U.S. Arms Control Disarmament Agency (ACDA)• Stockholm International Peace Research Institute (SIPRI)• International Monetary Fund (IMF)• United Nations (UN)• World Bank• Central Intelligence Agency (CIA)
One common perception, also among researchers, is that data published by these recognizedinstitutions are more reliable than figures provided by different governments in their budgets. Beforedrawing this conclusion, however, it is necessary to be aware of two things. First, data on militaryexpenditure that are published by the authorities in various countries are the primary source for allinternational sources. Second, particularly with regard to developing countries, very few adjustmentsare made to the figure specified in the budgets under such items as "Defence", "Armed forces" or"Ministry of Defence" before these are published internationally. One of the reasons for this ispresumably access to data. It is difficult and requires considerable resources to collect all thedocuments that are necessary to compute figures for military expenditure based on one commondefinition for all the countries for which data are published.
2.1. International Institute of Strategic StudiesThe IBS provides information on countries' military expenditure in its annual publication TheMilitary Balance. The institute bases its figures on data obtained from national budgets and makesfew adjustments to the original data. This is probably because it is difficult to track down figures onmilitary spending, particularly on a disaggregated level (i.e. divided into sub-groups), but also becauseit is a time-consuming process and staff resources are limited. For several years the IISS only had oneperson in a half-time position who worked on collecting data on government military expenditure. 5
5 Information concerning the various institutions' staffing situation was obtained from Ball (1988).
7

In the technical description of the data processing it appears that for NATO countries a standarddefinition is used when calculating military expenditure. Data from most developing countries arelargely accepted as they are reported, and it is thus very likely that the various countries do not use thesame definition. It is noted that, when possible, capital expenditure is added to current militaryexpenditure. However, in the tables for each country no information is provided as to what is includedin the caption "defence". I would therefore maintain that there are considerable possibilities that thedata presented are inconsistent as a result of varying definitions of military expenditure from onecountry to another.
The Military Balance presents military expenditure in two different types of table. There is a sectionwith a relatively detailed economic and military description of each country covered. Here, militaryexpenditure is presented in national currency at current prices. In addition, there are tables showingmilitary expenditure in US dollars at constant prices and as a percentage of GDP. This table is omittedin some editions, but is included in the latest edition to which I had access (1995/96). However, onlyfigures for the last two years were published. (For the constant-price tables, one extra year is shown,probably the base year, but this is somewhat unclear in some editions.) With regard to updatingroutines, it is stated that the published figures are the latest estimates in the budgets, but that theremay be divergences between the various editions as a result of changes in the figures - as a rule by thegovernment itself. The latest figures are therefore assumed to be the most reliable. A review ofNorway's main partner countries, however, shows that there is little updating of previously publishedfigures. A large number of editions are required to prepare consistent and sufficiently long time series.
One problem which arises when using budgets as the primary source is that there are often differencesbetween the fiscal year and the calendar year. A review of figures published for Zimbabwe shows thatthe editions for the 1980s present military expenditure in national currency for the fiscal year, and thedata are in accord with the figures I received from the embassy in Harare. It is noted, however, thatthe fiscal year is from 1 July to 30 June. The calendar year is used for constant-price figures. Noinformation is provided in the technical comments on the method used to convert expenditure fromthe fiscal year to the calendar year. In the 1992-93 edition, however, figures in national currency arealso presented for the 1990 and 1991 calendar years. These deviate from the budget figures in mypossession and must be calculated, but thus far I have been unsuccessful in ascertaining how this isaccomplished.
As mentioned, the figures on military expenditure at constant prices are shown in US dollars.Exchange rates obtained from the IMF's International Finance Statistics were used. This method isshrouded with the uncertainty associated with the problem that exchange rates, particularly indeveloping countries, are often overvalued or undervalued, and it must be assumed that these figures,particularly for African countries, contain substantial sources of error. (See Rolland (1994) for afurther discussion of the problems arising when comparing figures measured in different currencies.)
No direct information is provided concerning the method used for converting the figures to constantprices (deflator) in the editions to which I have had access, but it is stated that "inflation" is measuredwith the help of the consumer price index, and it is therefore assumed that this is used to convert toconstant prices.
There are thus several factors which may entail that data from the IISS are inaccurate. Ball (1988)also maintains that among the most widely used sources for military expenditure many researchersconsider the IISS to be the least reliable. This particularly applies to developing countries which havenever been the institute's strongest area.
Brzoska (1981) has carried out econometric tests of figures presented for military expenditure in thesources I describe here. The aim of his study was to investigate whether there were significant
8

divergences between them. He found that the IISS deviates substantially and systematically from theother sources, and their published figures also have the largest standard deviations. I have not carriedout a similar econometric test of data from later periods, but sporadic tests of data for Norway's mainpartner countries do not show systematic deviation. Data from the IISS in many cases are very closeto the data published by other sources.
2.2. U.S. Arms Control Disarmament AgencyThe ACDA publishes figures on military expenditure in its publication World Military Expenditureand Arms Transfers (WMEAT). The first edition of WMEAT covers the period 1963-1973 and is anexpanded version of the annual publication World Military Expenditure which the ACDA previouslypublished. WMEAT has an extensive statistical description. Previously, the ACDA's primary sourceof data for developing countries was particularly the archives of the US Agency for InternationalDevelopment. However, after the USAID assigned lower priority to the task of data collection andcompilation, the archives and publications of other US departments, as well as the IMF, have beenused.
NATO's definition for member countries in the defence alliance is used as the definition of militaryexpenditure. In general the figure presented under the Ministry of Defence is used for other non-Communist countries. In those cases where it is known that this expenditure contains amounts usedfor internal security forces, attempts are made to eliminate them. However, it is noted explicitly thatdata on military expenditure are lacking and at times inaccurate. As an example it is pointed out that anumber of countries only specify current expenditure and do not include capital costs, including armspurchases. In order to adjust for this, the ACDA has published figures for which expenditure on armsimports is added to the reported figure for total military expenditure. This is an uncertain method,which the agency is aware of. The agency particularly emphasizes the difficulties which arise whenthe payment for arms does not always coincide with the delivery date. Moreover, there are cases inwhich arms purchases are financed by other countries. In accordance with the most widely useddefinition of military expenditure, such arms purchases shall be recorded under the donor countries.The figure is incorrectly inflated if it is added to the recipient country's military expenditure.
The ACDA itself maintains that it always publishes figures from the accounts and not budgetestimates. Since all the figures are only presented in US dollars, it is difficult to test this assertion.This is particularly true for the period prior to 1985 when it was extremely difficult to gain access toall the information possessed by the USAID. Ball (1988) maintains that the updating routines areperhaps not as satisfactory as indicated. There are, however, considerable revisions in later editions offigures presented in earlier editions, so some updating is made.
For those countries where the fiscal year does not coincide with the calendar year, the ACDA usesslightly different methods of calculation. Brzoska (1981) has found that if the fiscal year extends fromJuly to June, series with military expenditure are divided into twelve equal parts, and are then addedup to a calendar year. Otherwise the ACDA allocates the amount to the year containing the greatestnumber of budget months.
The ACDA publishes five series for military expenditure: in US dollars at current prices, in USdollars at constant prices, military expenditure as a percentage of GDP, military expenditure as apercentage of central government expenditure and military expenditure per capita in US dollars atconstant prices. All the series cover eleven years. The conversion method is described in detail. First,the data in national currency at current prices are deflated with the help of the GDP deflator so that allfigures in national currency are shown in base-year prices. The figures are then converted to USdollars by using the official exchange rate between the national currency and the US dollar for thebase year. To obtain series at current prices, the constant-price series are "reinflated" with the help ofthe US GDP deflator. However, for some countries, including the former Warsaw Pact countries
9

(excluding the former Soviet Union) and China, purchasing power parities for GDP obtained from theUN's International Comparisons Project are used. It is explicitly noted that the method has thedrawback that official exchange rates do not always reflect purchasing power parities. Moreover,another difficulty, which is not discussed, is that it is problematic to use the GDP deflator for militaryexpenditure since gross domestic product is a measure of income rather than a measure of costs. Bothexports and imports are included in GDP and the GDP deflator therefore contains a terms of tradecomponent. A change in the composition of gross domestic product measured in volume, or differentprice changes for the various components over time, may result in changes in the GDP deflator whichdo not reflect changes in real costs.
Some authors maintain that the ACDA's practice of changing the base year in its constant-price seriesin each edition of WMEAT makes it difficult to prepare series longer than ten years. The problem wasexacerbated inasmuch as it is only in recent years that the ACDA has provided any indication of howit calculates its constant-price series. It is also difficult to obtain a good result for long series atcurrent prices. The problems arise because when the base year for exchange rates is changed, theexchange rate will as a rule be different in the new and old base year. The figure for militaryexpenditure in US dollars will thus be different even if there has been no change in the nationalcurrency.
2.3. Stockholm International Peace Research InstituteThe SIPRI publishes its annual publication SIPRI Yearbook which contains tables with informationabout military expenditure in a great number of countries. However, there is a break with formerroutines in the editions for 1993 and 1994 since the tables containing detailed information on variouscountries' military expenditure are omitted. According to the SIPRI the tables showing militaryexpenditure were omitted from the 1993 and 1994 yearbooks due to the need to reconstruct the database in response to the new circumstances arising out of the end of the Cold War as well as a changeof staff during this period. In the latest editions of the SIPRI yearbook (1995 and 1996), publication ofthe tables was resumed. Figures are available for a ten-year period so the interruption of publicationhas not lead to a break in the series. It must be considered an advantage that the SIPRI has resumed itspublication routines since the institute is a recognised and widely used source for militaryexpenditure.
The SIPRI also uses NATO's definition of military expenditure. But at the same time it is noted thatthe main sources are the various countries' budgets and statistics from central banks. Other opensources such as publications from the institutions described here, newspapers and periodicals, are alsospecified. It is thus likely that some of the figures are not based on the same definition since variousgovernments have differing practices. Ball (1988) maintains that the SIPRI does not make sufficientuse of the primary material in its possession. This is primarily ascribable to limited staffing, with onlyone to two people, often working on a part-time basis, who process the source material. Her workreflected an earlier period, however, and at present there are three full-time researchers and asecretary in the military expenditure project of the SIPRI.
The SIPRI publishes its figures as time series for ten years in each edition. In the description ofmethodology the institute notes that caution should be exercised in interpreting the latest figures,which are provisional. There appears to be a functioning updating routine since the data are revised asfigures from accounts gradually become available. In the 1992 yearbook the institute states thatspecial care should be taken when using the figures for 1991. It has been very problematic todistribute expenditure in connection with the Gulf War. Moreover, as a result of price distortions andhigh inflation in many of the reported countries, the budgetary data are often irrelevant. It mustnevertheless be added that the SIPRI is aware of the difficulties and attempts to make the data asreliable as possible.
10

The SIPRI only publishes series which follow the calendar year. In those cases where the calenderyear does not coincide with the fiscal year, the institute distributes expenditure equally in each monthof the fiscal year and then uses its time series to make estimates for the calendar year. This is notentirely without problems. It would have been an advantage if it had also published data as presentedin the original sources.
The time series are presented in national currency at current prices. This is a considerable advantagesince each user of the material can make the conversions deemed appropriate for the analysis. Seriesin constant prices are also published, but it is important to be aware that here emphasis has beenplaced on obtaining consistent series over time for each country in order to show a correct trend. Noadjustments are made for different definitions between countries from one year to the next. This canproduce inconsistency in a cross-section analysis which covers many different countries.
Consumer prices are used as the deflator in the constant-price series. This implies that in studieswhich are looking at the opportunity cost it will implicitly be private consumption which militaryexpenditure is being measured against. The consumer price deflator is nevertheless probably betterthan the GDP deflator, as I noted in the description of the ACDA's methods of calculation (section2.2).
2.4. International Monetary FundThe IMF publishes data on military expenditure for its member countries in its annual publicationGovernment Finance Statistics Yearbook. The data are based on the figures reported by each membercountry. The IMF has its own definition (see Rolland (1994) section 2.1 for more detailedinformation) and assumes that the amounts reported are based on the IMF's guidelines. The data arechecked to some extent, but it is assumed that governments would be more reluctant to provideinformation if they know that the IMF critically examines the figures. It must therefore be assumedthat there are no substantial differences between the figures provided by national sources and thepublished figures.
The IMF updates its data. The figures are published as ten-year series for each country's fiscal year.No attempts are made to convert the figures to the calendar year. This must be seen as a plus since itis advantageous for independent analysts to have access to data that have been processed as little aspossible.
The IMF publishes all of its figures in national currency. This is also an advantage since, as I notedearlier, it is no easy task to make data internationally comparable, and the methods will depend on thepurpose of the study.
No attempt is made to prepare constant-price series so the problems of choosing a deflator are thusleft to each user of the material.
One drawback of the Government Finance Statistics Yearbook is that it lacks information for manycountries, particularly for developing countries. This must be viewed in the light of the IMF'sdependence on obtaining figures from its member countries. For those countries for which the IMFpublishes data, however, it seems to be one of the sources that is easiest for independent analysts touse. It is nevertheless not inconceivable that some data are inconsistent, partly as a result of deliberatemanipulation of information by the reporting authorities.
Another problem is that only central government expenditure is reported, i.e. state/provincialexpenditure is not included. This can result in substantial under-reporting, but probably has a greatereffect on social sectors such as health and education than on defence.
11
Another drawback is that military pension expenditure is not included in the IMF's definition and isthus probably not included when total military expenditure is reported.
2.5. United NationsFigures on military expenditure may be found in two annual publications from the UN:
Up to 1988/89 the UN Statistical Yearbook published time series of five years for member countries'military expenditure. These figures were obtained directly from the IMF's statistics, and do notdeviate in the presentation described above. After the 1988/89 edition the institutions changed theirpublication routines and eliminated information on military expenditure from this publication.
National Accounts: Main Aggregates and Detailed Tables presents tables with time series of elevenyears for military expenditure. The figures are presented in national currency at current prices. Forsome countries, information on a disaggregated level, i.e. divided into sub-groups, is provided inaddition to total expenditure for each sector. In these tables military expenditure is divided into twomain categories: current costs and capital costs, and the two main categories have in turn some sub-groups. All the series are based on figures supplied by the various governments which report theirdata in accordance with the UN's System of National Accounts. The source suffers from the sameshortcomings as the IMF; it is unknown whether the governments are reporting correctly, but it isvirtually impossible to guard against this. The disadvantage of using the UN's statistics is that it takesa very long time before the data are published. The latest edition to which I have had access is from1992, and for many developing countries the series end in 1988. Moreover, information on militaryexpenditure is lacking for many countries, particularly among developing countries.
2.6. World BankThe World Bank publishes data on military expenditure in its annual publication World DevelopmentReport. Data are obtained from the IMF's Government Finance Statistics Yearbook, and methodologyis dealt with in section 2.4. The World Bank only publishes expenditure for one year as well as thebase year in each edition of the yearbook.
All the information is found in one table, but the content varies from one year to the next. In theperiod 1981-1983 defence expenditure was shown in per cent of both GDP and total centralgovernment expenditure. Defence expenditure per capita in 1975-dollars (computed with the help ofofficial exchange rates) was also included. Beginning in 1984 the tables were revised and now onlycontain military expenditure as a percentage of total government expenditure.
One drawback of the World Development Report is that information on military expenditure isprovided for so few countries, particularly in the case of developing countries. (This naturally reflectsthe lack of access to data from the IMF.) Another problem is that data on military expenditure areshown in per cent of central government expenditure as this may make it difficult to make inter-country comparisons. There are considerable variations between countries in the degree of localautonomy. A country which has decentralized many government functions will have considerablyhigher military expenditure as a percentage of central government expenditure than a country that hasa high degree of centralization. This is the case even if the decentralized country in reality may usefewer resources on defence than the centrally governed country. The problems are amplified in thatthere are also disparities in what is included in "total central government expenditure". Somecountries provide budgetary data while others use consolidated figures, and there are often differencesbetween these two concepts. The World Bank is aware of the problems and cautions againstinterpreting the figures too literally - they are intended to give an indication of developments from oneyear to the next in the various countries.
12

Because only one year is published in each edition, no revisions are made to the data. If the analystwishes to make a time-series study, the World Development Report is also cumbersome to use since agreat number of editions are required to obtain sufficiently long time series.
2.7. Central Intelligence Agency6
Data on military expenditure from the Central Intelligence Agency (CIA) in the US can be found onthe CIA's Internet pages under the following address:
http://www.odci.gov/cia/publications195factlindex.html
The CIA's Internet pages contain a Factbook with extensive information about a great many countries,including developing countries. Each page only contains information for one year, but it is possible tofind some historical figures by examining various editions of the CIA Factbook. The series are veryshort (two-three years) since this type of publication is relatively new. It is also uncertain how longthe older editions will be available on the net. The CIA Factbook is, however, available in a printedversion every year in July.
Data on military expenditure are provided for the fiscal year in US dollars at current prices. Thefigures are based on official exchange rates, and users are cautioned against interpreting the methodof calculation too literally since considerable divergences may exist between real and officialexchange rates. (See Rolland (1994) for a discussion of problems when using exchange rates forinternational comparisons.) Military spending as a percentage of GDP is also included.
No information is provided as to whether the figures are final or budgeted figures. However, theinformation in the 1995 CIA Factbook, the latest available edition, is from the 1994/95 fiscal year fora number of countries. It must therefore be assumed that this refers to budgetary data since finalfigures are usually not available until a later date. Of all the sources examined here, the CIA's Internetpages contain the "freshest" figures. Because only one year is published in each edition, the series arenot updated as final figures become available. This is a drawback since the budgeted figures haveoften been revised substantially when the final accounts are available.
Publication through the CIA's Internet pages is interesting particularly because this form of communicationis ahead of most other publications with regard to new information. It is not possible to use the CIA'sInternet pages, however, in a time-series study as a result of the short series, and the figures must also beused with caution and be checked against other sources that revise the figures when final accounts areavailable.
2.8. SummaryIt is no simple task to evaluate and compare the various sources since all of them have bothadvantages and disadvantages. There are nevertheless many indications that the IISS is the leastsatisfactory with regard to data on developing countries, at least for the period prior to 1980. Themethod of calculation is also relatively poorly documented so that it is difficult to check the figuresand make the necessary corrections. It is also problematic that the time series in each edition are soshort since a satisfactory analysis requires many years. The advantage of the source is that it containsinformation about a great many countries, particularly in the latest editions, and the figures arepresented in national currency at current prices. It is also among the first to provide information byincluding budgeted figures.
6 I am grateful to Kristian LON for bringing the CIA's Internet pages to my attention.
13

The ACDA's publications have extensive documentation of the methods used for computing the data.The greatest drawback of this source is that all figures are shown in US dollars computed with the helpof official exchange rates. As noted earlier, this is problematic - particularly for developing countrieswith overvalued or undervalued exchange rates. The source also has the drawback that it is difficult tofind; only the library at the Ministry of Foreign Affairs has a complete set of editions in Norway.Anecdotal evidence suggested that the agency's budgets had been cut to such an extent that annualpublication had virtually become impossible! Editions have been published, however, for 1991-1992,1993-1994 as well as 1995 and publication is hopefully back on an annual basis. The ACDA'spublications have the advantage that each edition contains time series of eleven years and they also covera great many countries. This makes it possible to carry out an extensive cross-section analysis with thehelp of data from one source.
The UN's statistics are published at a late date, but have the positive feature that they contain somedisaggregated data (divided into sub-groups by sector) for some countries. In some cases expenditureat the state/provincial level is also included, but this is not always noted in the text to the tables. Onedrawback is that only few countries are covered.
The World Bank obtains its figures from the IMF so the quality of the data is the same for bothsources. It is, however, a problem that military expenditure is only specified as a percentage of centralgovernment expenditure since this can result in considerable distortions in the material. As a result ofthe routines in publishing data only for the latest available year, it is necessary to have access to manyannual editions in order to carry out a time-series analysis. A cross-section analysis is also hamperedby very low coverage, particularly of developing countries.
The CIA's Internet pages are interesting because they are among the first to provide information andare very comprehensive with regard to number of countries. This type of publication, however, haslimitations as a result of little documentation for the method used. The time series are too short tomake an analysis, and there are no updating routines.
The conclusion of the study indicates that the SIPRI and IMF are the best sources even though theyalso have some shortcomings. Statistical documentation is good, the figures are updated and they arepresented in national currency at current prices. The figures in the two sources have been in greateraccord in the latest editions. The SIPRI also has an additional advantage in that it usually providesinformation at an earlier date than the IMF and it also covers a far greater number of countries.
3. Data on military expenditure in Norway's main partnercountries for development assistance
In this section of the study I will provide an evaluation of available data on military expenditure inNorway's main partner countries for development assistance. The discussion will be based on generalobservations dealt with in the first part of Rolland (1994). Each country is discussed individually, andI look at the sources containing information on defence expenditure. Based on the number of sourcesand the accord between the figures, I will attempt to comment on the quality of data and openness inthe country with regard to the publication of military expenditure.
In general, the available data are of such a quality that it is primarily trends in military expenditurerelative to other variables in the economy that are most reliable. Shedding light on these trends isimportant from a development assistance standpoint. It is of interest to determine whether militaryspending is rising or declining over time. Since there are deflation problems associated with timeseries of absolute figures, I have chosen to look at the change in relative figures (rates) over time. Inmy opinion the use of rates as an indicator of the degree of militarization provides a more interestingpicture than changes in total figures. Even though military spending growth in itself is of significance,
14

from a development point of view it is more important to see the relative importance of the defencesector in relation to the rest of the economy. A country with high economic growth and a high level ofincome is in a better position to sustain high military expenditure than is the case for a poor countrywith declining output. The use of rates allows us to look at both the economic burden of defence andthe ranking of priorities between the military and civilian sector.
The SIPRI has estimated that for developing countries combined military expenditure in per cent of GDPwas about 5 per cent in 1985, while the rate had fallen to 3.8 per cent in 1991. It is obvious that there areconsiderable individual differences underlying these figures. I have calculated the rate for Norway's mainpartner countries for the following years: 1975, 1980 as well as the period from 1985 up to the latestpublished data. (The last year in the series varies as a result of different reporting of data from the variouscountries.) In this way I am able to indicate the pattern which has been manifested in the last fifteen totwenty years. In order to obtain as consistent results as possible, the IMF has been used as a source for allmy calculations when this has been possible. The IMF presents expenditure for the fiscal year, and has alsoconverted GDP to the fiscal year (but without indicating the method used). This provides consistency in therates, but the period of calculation will deviate slightly from that of the SIPRI, which converts militaryexpenditure specified in the budgets to the calendar year. The alternative source of my calculations has beenthe UN. The UN also presents government expenditure per fiscal year, while GDP refers to the calendaryear, a factor which can result in inaccuracies. In the strictest sense, calculations of the military burden(military expenditure/GDP) made on the basis of UN data are therefore not entirely consistent. This doesnot apply to the other rates which are calculated with the help of data from the same period. No indicatorsare calculated using figures from different sources, with the exception of Zambia where there was noalternative. For those countries where neither the IMF nor the UN publishes information on militaryexpenditure, figures from the ACDA have been used. For all countries, the SIPRI's rate for militaryexpenditure/GDP is presented as the basis for comparison. This enables us to determine whether thecountry in question is above or below the average for developing countries calculated by the SIPRI andwhether a change in status has taken place in recent years.
In addition, I have calculated two other indicators: military expenditure as a percentage of governmentexpenditure and military expenditure in relation to social expenditure. Social expenditure is defined as thesum of that part of total government expenditure used for education and health. I have then listed twoindicators of the society's social standard'. I selected infant mortality (number of deaths of infants under oneyear per thousand live births, converted to per cent) and primary education (the number of pupils enrolled inprimary schools, irrespective of age, divided by the number of persons in the age group for which the gradelevel is intended, converted to per cent). The last indicator may exceed 100 per cent if older pupils areenrolled in schools at a lower level than their age would imply. It is assumed that active efforts to improvethe primary health service and primary education will benefit the poorer segment of the population and laythe basis for economic growth and higher social standards for all members of society.
3.1. Africa
3.1.1. Botswana
Sources:The IMF has time series for military expenditure from 1976 through 1992 in its publicationGovernment Finance Statistics Yearbook. The figures are presented in national currency (pula) atcurrent prices for the fiscal year, which begins on 1 April. While there was no updating of the timeseries for military expenditure from the 1993 edition to the yearbook for 1994, the series were revisedand extended in the latest available edition of the yearbook (1995).
7 With few exceptions the indicators were obtained from the World Bank (1981 - 1996).
15

The UN's National Accounts Statistics has no figures for military expenditure.
The SIPRI has figures from 1977 through 1994. The figures for the period 1992-1994 are the institute's ownestimates. In the SIPRI yearbook for 1992 the figures for the period up to 1986 are largely in accord withthe figures from the IMF, but the 1MFs figures for subsequent years are considerably higher. As an exampleit may be mentioned that in 1991 the SIPRI puts military expenditure at 118 million pula, while the IMFindicates 359.1 million pula. This difference cannot solely be ascribed to the fact that the fiscal year doesnot coincide with the calendar year since the divergence is also substantial for the preceding four years.However, Botswana constructed a military airport in the period 1990-1992. There is some uncertainty as towho financed the construction. The US was involved in the project, and there are many indications thatfinancing was shared. It is thus possible that the EVIF's figures include infrastructure expenditure for theairport which was probably covered by the government in Botswana, whereas the SIPRI excluded thisexpenditure. In the SIPRI yearbook for 1995, however, considerable revisions were made to the figures forBotswana, entailing that they are now generally in accord with the series from the IMF. The series havebenn revised and extended in the SIPRI Yearbook 1996. The estimates of the military burden (militaryexpenditure/GDP) for 1993 and 1994 are 4.1 and 3.5 per cent, respectively.
The ACDA has figures from 1977 through 1994. Expenditure is only shown in US dollars and as theestimated rate for the military burden (military expenditure/GDP). The figures from the ACDA arehigher than those of the SIPRI through the whole period. For 1993 and 1994 the ACDA has estimatedmilitary expenditure as a share of GDP at 6.4 and 6.0 per cent, respectively.
The IISS publishes data from 1977 through 1995, but only for the last two years in each edition.Military expenditure is shown in national currency, US dollars (converted using the official exchangerate) and as a per cent of GDP. Budgeted figures for 1996 are given in the detailed section. There hasbeen a sharp upward revision of the military burden for 1994 from the yearbook for 1995/1996 to thelatest available edition (1996/1997). While the rate was put at 4.6 per cent in the next to last edition ofthe yearbook, the rate for 1994 is now calculated at 7.8 per cent of GDP. The MS estimates the rate at7.1 per cent in 1995.
The CIA's Internet pages contain information on military expenditure, but the time series are very shortand refer to the fiscal year (1 April to 31 March). Data are presented in US dollars (converted using theofficial exchange rate) and as a per cent of GDP. Expenditure is estimated at US $198 million for the1993/94 fiscal year, whereas the SIPRI's estimate is about US $130 million. The military burden isestimated at 5.2 per cent, and is thus higher than the SIPRI's estimate but lower than the estimates fromthe ACDA and the IBS.
My conclusion is that it is relatively easy to find statistics on total military expenditure in Botswana,but thus far it has not been possible to obtain disaggregated data (divided into sub-groups), thereby makingit impossible to check for consistency over time. It is nevertheless possible to make a time-series analysis,but the same source should then be used. The substantial divergences between various sources must beconsidered a problem, and it is difficult to judge the quality of the data. I tend to believe, however, that theinformation reported to the IMP is relatively correct. As seen in table 3.1.1, military expenditure as apercentage of government expenditure showed a worrisome trend up to 1991. The trend was also negativein relation to social expenditure. For 1992 the indicators calculated with the help of information from theIMF show a decline in military expenditure relatively speaking. More recent figures supplied to me fromthe Norwegian embassy in Gaborone point in the same direction. Military expenditure as a percentage ofcentral government expenditure has fallen lately and is estimated at 9.1 per cent for the fiscal year1995/1996. Nevertheless, military expenditure in Botswana is high compared with other African partnercountries. Botswana embarked on an ambitious arms-procurement programme in 1995 and 1996 byordering, among other weapons, main battle tanks. The tanks-procurement plan raised anxiety inneighbouring countries as well as donor countries and was blocked by Germany. There are some mitigating
16

factors concerning Botswana's military expenditure, however. The country has participated in peace-keeping operations on the African continent at two separate occations. Moreover, tasks generally performedby the police, such as anti-poaching work, are executed by military personell. It must also be added thatBotswana has low military expenditure relative to social expenditure if we compare the figures withNorway's other main partner countries. This is also reflected in relatively favourable social indicators.
Table 3.1.1. Indicators of the degree of militarization and social indicators. All figures in percent
Year 1976 1980 1985 1986 1987 1988 1989 1990 1991 1992 1993 1994
MilitarizationMil. exp./GDP SIPRI 2.01) 3.7 1.9 2.5 3.8 3.7 3.6 4.4 4.7 4.3 4.1 3.5Mil. exp./GDP2) .. 3.3 1.8 2.7 4.0 3.6 3.6 4.7 4.7 4.6 .. ••Mil. exp./Gov.exp. 2) 0.2 9.8 6.4 7.9 12.1 12.4 11.7 13.3 16.0 11.9 .. ••Mil. exp./Soc. exp. 2) 0.6 35.5 28.4 32.7 47.2 48.5 46.6 52.1 51.9 46.9 .. ••
Social indicatorsInfant mortality 9.53)
.. 7.1 6.9 6.7 4.1 3.9 3.8 3.6 3.5 4.2 3.4Primary education 653) .. 104 105 114 116 111 110 119 116 .. ••
1) Figure is for 1977.2) The indicators were calculated with the help of data from the IMF. No GDP figures for 1976 were found in IMF data.3) Figure is for 1970.
17

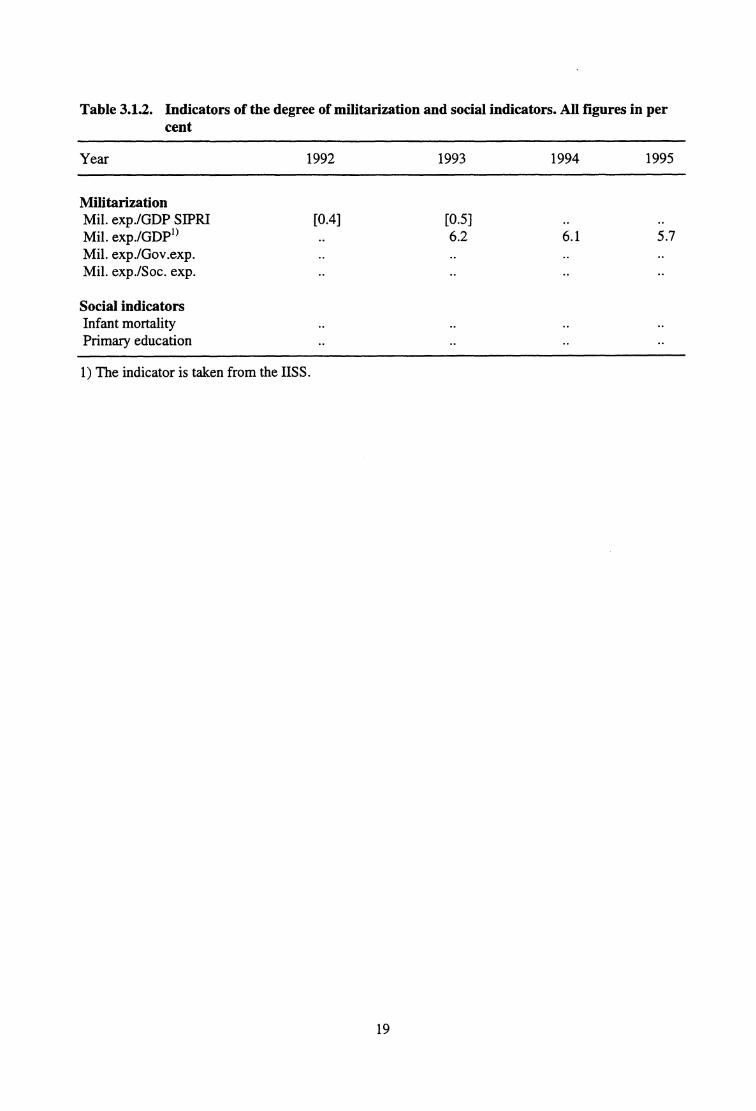
3.1.2. Eritrea*
Sources:Neither the IMF nor the UN publishes information on military expenditure in Eritrea.
The SIPRI has information about Eritrea for 1992 and 1993 in the SIPRI Yearbook 1996. The figuresare given as uncertain.
The ACDA publishes no information about Eritrea.
The IISS has series for Eritrea from 1993 through 1995 in US dollars and as a percentage of GDP. Allfigures are given as estimates. Budgeted military expenditure in 1996 is also presented in the detailedsection. As shown in table 3.1.2, the rates for the military burden (military expenditure/GDP) areconsiderably higher than the rates estimated by the SIPRI.
The CIA's Internet pages present no data on military expenditure in Eritrea.
Access to data on military expenditure in Eritrea is limited since Eritrea is a relatively newindependent country. Eritrea declared itself independent from Ethiopia on 27 april 1993. No infor-mation on division of military assets between Ethiopia and Eritrea is available. The IISS expectscontinued close cooperation with Ethiopia even to the possible extent of sharing military assets. Thedata situation on military expenditure in Eritrea is unsatisfactory. This must be expected, however,considering the country's recent history. There is a large divergence between figures published in thetwo sources with information. While the SIPRI has a very low estimate of military expenditure inEritrea (the lowest estimated military burden among all Norway's main partner countries for develop-ment assistance), the IISS publishes figures well above the average rate for the Norwegian partnercountries. I tend to believe that the figures from IISS are most plausible. Eritrea has been ravaged bywar for many years and even if some demobilisation of forces started as early as the end of 1993, thearmed forces are probably still rather large. In addition, there have been skirmishes between Eritreaand Djibouti recently in a border region where Eritrea claims 64 square kilometres of Djiboutiterritory, and in December 1995 Eritrea embarked on a military incursion against Yemen to seizeHanish Islands in the Red Sea. Funds are needed for operations of this kind. It must be stressed,however, that the figures on military expenditure in Eritrea are very uncertain. Eritrea is not includedin the World Development Report 1996 and no social indicators are available.
* Priority country.
18
[0.4]••
Table 3.1.2. Indicators of the degree of militarization and social indicators. All figures in percent
Year
1992 1993 1994 1995
MilitarizationMil. exp./GDP SIPRIMil. exp./GDP 1)
Mil. exp./Gov.exp.Mil. exp./Soc. exp.
Social indicatorsInfant mortalityPrimary education
[0.5]6.2 6.1 5.7
•• • •
•• ••
•• •• •• ••
•• •• •• • •
• • ••
1) The indicator is taken from the IISS.
19

3.1.3. Ethiopia *
Sources:The IMF has time series for military expenditure from 1985 through 1991 in its publicationGovernment Finance Statistics Yearbook 1995. It is, however, possible to find information from 1972in earlier editions, but in the period 1975-1984 data on military expenditure are only presented in acombined category "General public services and Defense". The data are shown in national currency(birr) at current prices for the fiscal year, which begins on 8 July. In the 1993 edition of the yearbookthere is only one observation: from 1989. In the latest version from 1995 the time series for militaryexpenditure have been revised and expanded, indicating easier access to data. Compared with the1994 yearbook the GDP figures have been revised upwards, entailing that the figures for the militaryburden (military expenditure as a percentage of GDP) are considerably lower when calculated withthe help of these latest figures.
The UN's National Accounts Statistics contains no data on military expenditure.
The SIPRI has figures from 1975 through 1994 in available editions of its yearbook. In thecomparable period, expenditure in national currency is slightly higher than that presented by the IMF.According to the SIPRI, military expenditure peaked in 1990 and has subsequently declined sharply.This must be viewed in the light of political developments in the country after the end of the civil war.Whereas military expenditure in 1990 amounted to about 10 per cent of GDP, it is estimated to havefallen to 2.6 per cent in 1994.
The ACDA has published data series for military expenditure in Ethiopia from 1968 through 1994 inUS dollars at current and constant prices and as a percentage of GDP. There are, however, severalbreaks and rough estimates in the time series for the 1980s, and this must be viewed in conjunctionwith the civil war. In the World Military Expenditure and Arms Transfers (WMEAT) 1993-1994 thepattern of development is the same as described by the SIPRI, but the level is higher: militaryexpenditure as a share of GDP is estimated at 21.9 per cent in the peak year 1990. In the latest editionof the WMEAT (1995), however, there have been major revisions downwards. The military burden ofthe peak year 1991 is now calculated at 11.1 per cent of GDP due to a downward revision if themilitary expenditure as well as an upward revision of GDP.The ACDA has no estimate for 1992, butindicates a rate for military expenditure/GDP of 2.9 per cent in 1993 and 2.6 per cent in 1994, i.e.approximately on a par with the figures from the SIPRI.
The IISS has figures for Ethiopia through 1996, with the latest year showing budgeted figures. Therates for military expenditure/GDP the last few years have differed from the other internationalsources in that they were considerably lower. However, with the latest revisions made by the othersources, the figures are now more in line with the calculations made by IISS. The IISS indicates amilitary burden of 2.4 per cent in 1994 and 2.1 per cent in 1995.
The CIA's Internet pages present a short time series for military expenditure in Ethiopia in US dollars(converted with the help of the official exchange rate) and as a percentage of GDP. The latest figuresare from the 1994/95 fiscal year, with military expenditure at 4.1 per cent of GDP.
Access to information on military expenditure in Ethiopia seems to have improved substantially thelast few years. There are many indications that during the 1990s the defence sector has laid claim toincreasingly fewer resources. At the moment the time series are too short to provide a consistent time-series analysis. As a result of the war which has ravaged the country for such a long period, militaryexpenditure in relation to government expenditure on health and education is among the highest inNorway's main partner countries for development assistance. Ethiopia's social indicators are also
* Priority country.
20

among the least favourable compared with other main partner countries. Infant mortality, however,has been declining the last few years. The primary education rate in 1992 was 22 per cent and is alsovery low compared with other poor countries.
Table 3.1.3 Indicators of the degree of militarization and social indicators. All figures in percent
Year 1975 1980 1985 1986 1987 1988 1989 1990 1991 1992 19931994
MilitarizationMil.exp./GDP SIPRI 4.5 8.5 8.9 6.5 7.5 9.2 10.2 10.2 6.1 3.0 [2.6] [2.6]Mil.exp./GDP 1) [2.6] [4.4] 6.7 6.4 6.5 8.4 9.9 11.0 8.9 .. ••Mil.exp./Gov.exp. 1) [14.6] [17.4] 29.4 26.3 28.1 32.5 35.0 40.5 40.0 .. ••Mil.exp./Soc. exp.' ) [71.2] [136.6] 193.4 184.7 182.8 232.7 269.9 307.4 290 .. ••
Social indicatorsInfant mortality .. 14.6 16.8 15.5 15.4 13.5 13.3 13.2 13.0 12.2 11.7 12.0Primary education 23 43 36 36 37 36 38 38 25 22 .. ••
[ ] denotes that the indicators are shrouded with considerable uncertainty.1) The indicators were calculated with the help of data from the IMF. Data on military expenditure in the period 1975-1984are only provided in a combined category "General public services and Defense". Based on earlier years, defence expenditureis estimated to account for a little more than 41 per cent of the total amount, and the indicators for 1975 and 1980 werecalculated based on this assumption.
21

3.1.4. Malawi *
Sources:The IMF has time series for military expenditure from 1972 through 1988 in the editions of itspublication Government Finance Statistics Yearbook to which I have access. The figures arepresented in national currency (Kwacha) at current prices for the fiscal year, which begins on 1 April.There has been no updating of the time series for military expenditure from the next to last edition(1994) to the latest available yearbook for 1995. The two editions present identical series from 1982to 1991, indicating a deterioration in reporting routines.
The UN's National Accounts Statistics has no figures on military expenditure.
The SIPRI has figures from 1975 through 1993 on military expenditure in Malawi. The figures arepresented in national currency at current prices, in US dollars at constant prices, and as a percentageof GDP. Major revisions of the figures have been made from the SIPRI Yearbook 1992 to the editionfor 1995. There has been no revision or extention of the series in the yearbook for 1996.
The ACDA has time series from 1965 through 1994 in the editions to which I have had access. Thefigures from 1990 onwards are all estimates, however. All figures are presented in current andconstant prices as well as a percentage of GDP. The rates for the military burden (militaryexpenditure/GDP) are in general very close to those presented by the SIPRI, with the exception of1993, where ACDA's rate is higher, estimated at 1.3 per cent. For 1994 the rate decreased to 1.1 percent.
The IISS has series for Malawi from 1983 through 1995. The country was first included in theyearbook for 1984/85. The figures for 1994 and 1995 are indicated as estimates. Budgeted militaryexpenditure in 1996 is also presented in the detailed section. Military expenditure as a percentage ofGDP is estimated at 1.3 per cent in 1994, which is slightly higher than the figures listed in othersources.
The CIA's Internet pages estimate military expenditure in Malawi at US $13 million for the 1993/94fiscal year. This is equivalent to about 0.7 per cent of GDP and is lower than the estimates from theother sources.
Since Malawi has not reported military expenditure to the IMF since 1988 or to the UN, it has notbeen possible to calculate separate indicators for the more recent period. The other sources, however,provide figures which are very similar in the latter part of the period. These sources have relativelylong time series, and there is no major divergence between the various sources. I have not succeededin obtaining the national budget, entailing that it has not been possible to carry out a more detailedexamination of the various sub-groups. This is probably because the country is relatively new in termsof Norway's official development aid, and libraries have therefore not yet given priority to obtainingsufficiently detailed information about the country. As shown in table 3.1.4, Malawi has low militaryexpenditure in per cent of GDP and social expenditure. The latest figures also indicate that thissituation is being maintained in that military expenditure is budgeted at 1.2 per cent of GDP in 1995.Social indicators show that Malawi has one of the highest infant mortality rates among our mainpartner countries for development assistance, and the primary education rate is low. Infant mortalitypeaked in 1980 and exhibited a downward trend during the 1980s and early 1990s. In 1993, however,infant mortality increased. This must be seen in conjunction with a large fall in GDP in 1992, and thelatest figures from the World Bank show that infant mortality decreased to 13.4 per cent in 1994. Thenegative impression left by the social indicators are more likely caused by general poverty thanexcessive militarization.
* Priority country.
22

Table 3.1.4 Indicators of the degree of militarization and social indicators. All figures in percent
Year 1975 1980 1985 1986 1987 1988 1989 1990 1991 1992 1993
MilitarizationMil. exp./GDP SIPRI 1.4 4.4 1.8 2.1 1.8 1.5 1.5 1.3 1.1 1.0 0.8Mil. exp./GDP 1) 1.7 4.3 1.8 2.1 1.7 1.5 .. .. .. .. ••Mil. exp./Gov. exp. 1) 6.6 12.8 6.0 6.6 5.6 5.3 .. .. .. .. ••Mil. exp./Soc. exp. 1) 43.6 51.9 33.5 37.1 35.3 27.0 .. .. .. .. ••
Social indicatorsInfant mortality 14.2 16.9 15.6 15.3 15.0 14.9 14.7 14.9 14.1 13.4 14.2Primary education 61 62 62 64 66 72 67 71 66 66 ..
1) The indicators were calculated based on figures obtained from the IMF.
23

3.1.5. Mozambique *
Sources:Neither the IMF nor the UN has data on military expenditure in Mozambique.
The SIPRI has time series for military expenditure in national currency from 1975 (the first year ofindependence) through 1994. The first rate for the military burden (military expenditure/GDP),however, is from 1980, probably as a result of problems in determining GDP. In the 1992 edition ofthe yearbook with tables for military expenditure in different countries, the series for the militaryburden only extend to 1985. The yearbook for 1995, however, contains information on militaryexpenditure as a percentage of GDP up to and including 1993 and the series have been revised andfurther extended in the latest edition of the yearbook (1996). The revision has brought the rates for themilitary burden (military expenditure/GDP) more in line with my own calculations based on figuresfrom the Statistical Yearbook of Mozambique. It thus appears that access to data on Mozambique hasimproved the last years, a development which must be viewed in conjunction with the politicalsituation in southern Africa in the first half of the 1990s.
The ACDA has published data on military expenditure from 1975 through 1993, but several years arelacking in the 1980s. There has been major revisions of the series from the World MilitaryExpenditures and Arms Transfers 1993-1994 to the latest available edition for 1995. In the latestedition, military expenditure as a percentage of GDP is calculated at 8.7 per cent in 1994, i.e.considerably higher than the rate calculated by the SIPRI. There have, however, been variationsbetween the two sources over the last few decades. The divergences are not systematic and thesources alternate in specifying the highest rate.
The IISS has series from 1975 through 1996 with some interruptions. The last year refers to budgetedfigures. According to the IISS the rates for the military burden (military expenditure/GDP) have fallensteadily during the 1990s and are estimated at 7.1 per cent in 1994 and 3.7 per cent in 1995.
The CIA's Internet pages indicate that military expenditure in Mozambique came to US $110 millionin 1993, or 7.3 per cent of GDP. This is close to the rate indicated by the ACDA and only slightlylower than the rate calculated by the SIPRI after the downwards revisions made in the latest edition ofthe SIPRI yearbook (1996).
In December 1994, Adne Cappelen, Statistics Norway, was involved in a project for the NorwegianDirectorate for Development Cooperation in Mozambique and in Maputo had access to the nationalbudgets. Based on the statistical annex in his report (Cappelen (1994)), I was able to gain access toconsistent time series for military expenditure in the period 1986 through 1994, with the last year anestimate. The rates I have calculated with the help of data from the national budgets are in accord withthe SIPRI's rates and very close to those provided by both the ACDA and the CIA's Internet pages.Moreover, I have had access to a report from the Ministry of Foreign Affairs in Denmark (1995)which shows military expenditure as a percentage of government expenditure for the period 1990 to1995, with the last two years presented as estimates. These calculations are considerably higher thanthe rates I have computed, but it is uncertain what is included in government expenditure.
Access to data on military expenditure in Mozambique has improved substantially over the past threeyears even though there are some shortcomings. The time series are short, only ten years, but there isnow greater accord between the sources. When I carried out my earlier analysis of militaryexpenditure in 1994, the situation was extremely unsatisfactory. The figures provided by the threesources that had information on military expenditure in Mozambique showed considerable variations,a factor which made it difficult to judge the credibility of the material. Information was lacking for
* Priority country.
24

long periods. The indicator for military expenditure/GDP varied considerably in 1985, the only yearfor which all sources had information: 7.4 (SIPRI), 9.4 (IISS) and 10.4 (ACDA). The fact that theSIPRI presented the figure for military expenditure in escudos, the IISS in meticais and the ACDAonly in US dollars further exacerbated the problems. Taking into account that the country was ravagedby war since the 1970s, it is not surprising that the data situation is poor and military expenditurehigh. It is therefore encouraging to see progress in the area of data availability. The military burden(military expenditure/GDP) in Mozambique has declined steadily since 1990. In the latter period costsof a demobilization programme has been included in the figures for military expenditure. As shown intable 3.1.5, it has now been possible to compute the indicator for military expenditure in relation tosocial expenditure. This rate is very high, but has exhibited a downward trend in the 1990s. However,the budget for 1996 shows that military expenditure as a percentage of expenditure for health andeducation is estimated at around 230 per cent and thereby represents a sharp increase. Infant mortalityis among the highest in our main partner countries for development assistance, and the primaryeducation rate has not picked up again to any extent following the sharp fall at the beginning of the1980s. With the onset of peace, it is possible to transfer more resources from defence to the socialsectors. However, there is still a need for better statistical material in order to determine how much isactually allocated to each sector.
Table 3.1.5. Indicators of the degree of militarization and social indicators. All figures in percent
Year 1975 1980 1985 1986 1987 1988 1989 1990 1991 1992 1993 1994
MilitarizationMil.exp./GDP SIPRI 7.5 10.2 10.6 9.2 10.3 10.1 8.7 8.3 7.6 [5.8]Mil.exp./GDP' .. .. 7.4 10.7 9.2 10.3 10.1 8.7 8.3 7.6 [6.3]Mil.exp./Gov.exp. 1) 24.0 26.1 20.1 21.6 19.6 18.6 17.3 18.1 [16.3]Mil.exp./Soc. exp.' s 172.2 285.7 208.6 210.7 191.3 160.4 137.0 159.8 [147.4]
Social indicatorsInfant mortality 9.3 11.5 12.3 12.0 14.1 13.9 13.7 13.7 14.9 [16.2] 14.6 14.6Primary education 52 93 84 82 68 58 63 60 .. .•
[ ] denotes that the indicator is shrouded with considerable uncertainty.1) The indicators were calculated with the help of figures from Cappelen (1994) which he bases on information from theStatistical Yearbook for Mozambique.
25

3.1.6. Namibia
Sources:The IMF presents time series for military expenditure in national currency (rand) at current prices forthe fiscal year, which begins on 1 April. The series only start in 1990 in connection with liberation. Inthe two last available editions of Government Finance Statistics Yearbook (1994 and 1995), the IMFhas removed the relevant table "Table B. Expenditure by function. Consolidated Central Government"in its survey of Namibia. The only figure on expenditure by function is thus found in the yearbook for1993, and only preliminary figures for 1990 and estimates for 1991 are provided.
The UN has no data on military expenditure in Namibia in the last available edition of NationalAccounts Statistics (1992).
In its latest yearbook (1996), the SIPRI has figures on military expenditure in Namibia for the period1985 through 1993 in national currency at current prices, in US dollars at constant prices and as apercentage of GDP. A break in the series is indicated in 1990 when Namibia bacame independent.The figures deviate somewhat from the IMF's figures on military expenditure, with higher amounts in1990 and lower amounts in 1991. The series have not been revised or extended from the yearbook for1995 to the 1996 edition.
The ACDA has time series from 1990 through 1994, but indicates that the figures for 1990 and 1991are estimates. The rates for military expenditure as a percentage of GDP are close to the ratescalculated by the SIPRI. For 1994 ACDA has calculated the rate at 1.9 per cent indicating a decliningmilitary burden.
The IISS has published figures on military expenditure in Namibia from 1989 through 1996. The lastyear refers to budgeted figures.The rates for military expenditure as a percentage of GDP calculatedby the IISS and the ACDA are generally in accord.
The CIA's Internet pages indicate that military expenditure as a share of GDP in the 1993/1994 fiscalyear was 2 per cent, i.e. approximately on a par with the other sources.
I have also had access to Namibia's three national budgets from 1991-1993. Here, the data are dividedinto sub-groups (disaggregated). The classification is in accordance with the UN's recommendations.(See Rolland (1994), section 2.1, for a further discussion of the UN's pidelines.) Current costs andcapital costs are shown separately, and there is accord between the categories for different years. TheMinistry's payments to the pension fund are specified in accordance with NATO's definition ofmilitary expenditure.
After Namibia showed promise of becoming a model country in the area of statistics on militaryexpenditure, a negative trend has taken place. The country has not reported to the IMF, which has thusnot updated or revised the estimates for 1990 and 1991. Nor have I had access to national budgets inlocal libraries for the last few years. These are available, however, and the Norwegian Embassy inWindhoek has kindly provided figures from the recent budgets. For the fiscal year 1995/1996 militaryexpenditure is budgeted at 5.3 per cent of total government expenditure and 13.5 per cent of socialexpenditure. In the budget for the fiscal year 1996/1997 the two rates have increased to 5.8 per centand 16.4 per cent, respectively. The rate of military expenditure as a percentage of social expenditureis low compared with other main partner countries, thereby indicating that Namibia is giving priorityto health and education. Infant mortality has been declining since the country became independent,and the primary education rate has risen. There is general accord between the various sources whichspecify military expenditure. Namibia is below the average of developing countries in terms of themilitary burden (military expenditure/GDP) as well as the other indicators for the degree of
26

militarization. However, the budget for the fiscal year 1996/1997 shows a planned increase in militaryexpenditure. This must be seen in conjunction with recent events in the region. The Namibianauthorities are concerned about developments in neighbouring Botswana, particularly the country'sarms-procurement programme (see section 3.1.1). The pronouncement of the South African Ministerof Defence in July 1996 supporting Botswana and recommending rearmament of the region in orderto make the Southern African countries capable of taking responsibility for peace keeping operationsin the area, further raised the Namibian concern.
Table 3.1.6. Indicators of the degree of militarization and social indicators. All figures in percent
Year
1985 1986 1987 1988 1989 1990 1991 1992 1993
MilitarizationMil. exp./GDP SIPRI 4.4 4.8 5.4 4.9 2.9 2.2 2.7 2.5 2.2Mil. exp./GDP' ) .. .. .. .. .. 2.1 3.0 2.6 2.3Mil. exp./Gov. exp.' ) .. .. .. .. .. 5.4 6.6 5.6 5.4Mil. exp./Soc. exp.2) .. .. .. .. .. 17.4 20.4
Social indicatorsInfant mortality .. .. .. .. 10.1 10.0 7.2 5.7 5.9Primary education .. .. .. •• .. 94 119 124 ••
1) The indicators were obtained from the ACDA.2) The indicator was calculated with the help of data from the IMF.
27

3.1.7. South Africa
Sources:The IMF has no figures on total military expenditure. In Government Finance Statistics Yearbook1988, however, there is only one single observation of capital expenditure for the defence sector in1984, whereas current expenditure is lacking. The relevant table "Table B. Expenditure by function.Consolidated Central Government" for South Africa is omitted from the yearbook for 1993. In theedition for 1994 this table is included, but only contains information for 1982 and defenceexpenditure is not specified. In the yearbook for 1995 the relevant table is once again omitted.
The UN's National Accounts Statistics contains no figures on military expenditure.
The SIPRI has time series from 1975 through 1994 in the editions to which I have had access. InSIPRI Yearbook 1996 the following data sources are given: Figures for 1986-90 are taken from theofficial budget while figures for 1991 onwards are taken from the returns supplied by the Office of theSecretary for Defence in response to the SIPRI questionnaire. The figures from the latest period havebeen revised since the publication of the SIPRI Yearbook 1995.
The ACDA has time series for military expenditure in South Africa from 1968 through 1994. Severalof the figures from the 1980s are estimates. As shown in table 3.1.7, there is some divergence betweenthe rates for military expenditure as a percentage of GDP calculated by the SIPRI and the ACDA, butthere are no systematic deviations. Towards the end of the period there seems to be greater accordbetween the two sources.
The IBS has figures for South Africa up through 1996 in its latest edition, with the last year referringto budgeted figures. The estimates for military expenditure relative to GDP are slightly higher thanthose indicated by the SIPRI and the ACDA. The rate is estimated at 3.3 per cent for 1994 and 2.9 percent for 1994.
The CIA's Internet pages put military expenditure in South Africa at US $3.2 billion in the 1993/1994fiscal year. This is equivalent to 2.8 per cent of GDP, and does not deviate to any extent from theestimates made by the SIPRI and the ACDA for the 1993 calendar year.
Since South Africa has not reported its military expenditure to either the IMF or the UN, it has notbeen possible to calculate separate indicators. Nor have I had access to earlier national budgets. Thesituation, however, is now changing. The budget for 1995/96 is readily available and contains detailedinformation on expenditure of all ministries, including the Ministry of Defence. In addition to theordinary budget, a special publication - "A citizen's guide to the 1995/96 budget" - has been prepared.Expenditure in the national budget is divided into capital and current expenditure and seems to bepresented in an orderly and satisfactory manner. There are many indications that it will be easy to gainaccess to statistics on military expenditure in South Africa in the period ahead. As shown in table3.1.7, data on social indicators are lacking, and only UNESCO has sporadically published primaryeducation figures. It nevertheless appears that the primary education rate is very high. Infant mortalityhas declined gradually throughout the period of study, but is still high. It must be added, however, thatthere are probably considerable differences between population groups.
28

Table 3.1.7. Indicators of the degree of militarization and social indicators. All figures in percent
Year 1975 1980 1985 1986 1987 1988 1989 1990 1991 1992 1993 1994
MilitarizationMil. exp./GDP SERI 3.4 3.9 3.1 3.0 3.8 4.1 4.0 3.7 14.3 3.0 3.0 2.8Mil. exp./GDP1) 3.8 3.2 3.8 3.9 4.3 4.3 4.3 4.2 3.5 3.0 3.1 2.4Mil. exp./Gov. exp.' ) 13.1 11.9 11.6 11.5 12.5 13.9 13.3 13.2 11.5 8.8 9.2 7.4Mil. exp./Soc. exp. .. .. .. .. •• .. .. .. .. .. .. ••
Social indicatorsInfant mortality .. 9.6 7.8 7.4 7.2 7.0 6.8 6.6 5.4 5.3 5.2 5.0
• 2).. 103 .. 111 111 111Primary education 107 .. .. .. ••
I Indicates break in the series.1) The indicators were obtained from the ACDA.2) The only source containing information on primary education in South Africa is the UNESCO Statistical Yearbook 1995,and only for certain years.
29

3.1.8. Tanzania *
Sources:The IMF publishes no information about Tanzania.
The UN's National Accounts Statistics has time series from 1970 through 1991. The figures arepresented in national currency (shilling) at current prices for the fiscal year, which begins on 1 July.The time series have not been updated or extended from the 1991 edition to the 1992 edition.
The SIPRI has time series from 1962 through 1991, but it is noted that the figures are uncertain forsome periods. The indicator for military expenditure as a percentage of GDP was revised substantiallydownwards in the yearbook for 1995 compared with the yearbook for 1992. For example, militaryexpenditure as a percentage of GDP was estimated at 6.9 per cent in 1989 in the 1992 yearbook, whilein the 1995 edition it is estimated at 2.2 per cent of GDP. As table 3.1.8 shows, the SIPRI's estimatesare now very close to my own calculations made with the help of figures from the UN. There has beenno revision or extention of the series in the SIPRI Yearbook 1996.
The ACDA has time series from 1968 through 1994, with the exception of 1986 and 1991. Thefigures are generally higher than the rates for military expenditure as a percentage of GDP calculatedby the SIPRI (1996) and my own calculations made with the help of data from the UN. For example,military expenditure as a percentage of GDP is estimated at 4.7 per cent in 1990 (the last year forwhich all the sources have data), i.e. more than double the indicators presented in table 3.1.8. TheACDA has estimated the military burden at 3.3 per cent in 1994.
The IISS also publishes time series through 1995, but with some observations lacking. In the lastedition (1996/97) budgeted figures in national currency and US dollars are included for 1996. Thefigures are higher than those provided by the UN, but slightly lower than those calculated by theACDA. The military burden is estimated at 2.9 per cent and 2.7 per cent in 1994 and 1995,respectively.
The CIA's Internet pages estimate military expenditure in Tanzania for the 1994/95 fiscal year atUS $69 million, which is considerably lower than the IBS estimate, which puts budgeted expenditureat US $114 million. No rate has been calculated for the country's military burden (militaryexpenditure/GDP), probably as a result of lacking data on GDP.
The access to data on military expenditure has improved somewhat the last few years, and thedivergences between figures published in different publications have been reduced. As is the case formost of Norway's main partner countries for development assistance, much remains to be done withregard to data collection. The indicator calculated on the basis of data from the UN does not indicatethat Tanzania has particularly high military expenditure in relative terms. Following a negative trendin the mid-1980s, Tanzania has substantially reduced military expenditure in relation to socialexpenditure. Social indicators have nevertheless moved in an unfavourable direction. Infant mortalityis higher and the number of pupils enrolled in primary schools is lower today than was the case tenyears ago. This is probably primarily ascribable to the economic setbacks experienced by Tanzaniarather than militarization.
* Priority country.
30

Table 3.1.8. Indicators of the degree of militarization and social indicators. All figures in percent
Year 1970 1980 1985 1986 1987 1988 1989 1990 1991
MilitarizationMil. exp./GDP SIPRI 3.8 1) 4.9 2.7 2.7 2.7 2.2 2.2 2.1 1.7Mil. exp./GDP2) 1.4 2.6 3.0 3.1 3.2 2.3 2.5 2.3 1.9Mil. exp./Gov. exp. 2) 5.9 8.9 13.3 15.0 14.5 10.4 9.1 8.6 6.2Mil. exp./Soc. exp. 2) 31.2 46.4 117.1 131.2 132.2 105.1 90.6 74.7 52.1
Social indicatorsInfant mortality 13.2 10.3 11.0 10.8 10.6 10.4 11.2 11.5 11.5Primary education 34 93 72 69 66 66 63 63 69
1) Figure is for 1975.2) The indicators were calculated based on figures obtained from the UN.
31

3.1.9. Uganda *
Sources:The IMF publishes time series from 1974 through 1986 (the last two years are estimates) in nationalcurrency (shilling) for the fiscal year, which ends on 30 June. However, the last edition ofGovernment Finance Statistics which contains information on military expenditure is from 1991, andin the yearbooks for the period 1988 to 1991 no updating or revision has been made. Since 1992Uganda has been removed from the IMF's country register, thereby eliminating an important sourcefor military expenditure.
The UN's National Accounts Statistics has no figures on military expenditure.
The SIPRI has figures from 1975 through 1993 on military expenditure in Uganda. The figures arepresented in national currency at current prices, in US dollars at constant prices, and as a percentageof GDP. Major revisions of the figures have been made from the SIPRI Yearbook 1992 to the editionfor 1995. The rates for the military burden (military expenditure/GDP) have been revised downwardsby around 0.3 percentage points in the yearbook for 1996 compared with the SIPRI Yearbook 1995.The revision must be due to higher figures for the GDP since the serie in national currency has notbeen revised. No information on additional years has been included.
The ACDA has time series from 1968 through 1994 in the editions to which I have had access. Allfigures are presented in current and constant prices as well as a percentage of GDP. The rates for themilitary burden (military expenditure/GDP) are during the 1980s considerably lower than thosepresented by the SIPRI, as will be seen in table 3.1.9. The only exception is 1987 where the ACDA'sfigure is more than double the SIPRI's rate. During the first part of the 1990s, however, the ACDA'srates are above SIPRI's figures on two occasions. There has been major revisions of the figures in theWorld Military Expenditures and Arms Transfers 1995 compared to the edition from 1993-1994. Theseries have also been extended by one year and the ACDA has estimated military expenditure as apercentage of GDP at 1.5 per cent in 1994.
The IISS has series for Uganda from 1974 through 1995 in the editions to which I have had access.Budgeted military expenditure in 1996 is also presented in the detailed section. Military expenditureas a percentage of GDP is estimated at 1.6 per cent in 1993, i.e. close to the figure presented by theSIPRI. The IBS has calculated the military burden at 1.8 per cent in 1994 and 2.6 per cent in 1995.These calculstions are based on military expenditure measured in US dollars. If the rates arecalculated in local currency (shillings) they are estimated at 1.6 and 2.5 per cent, respectively). Theincrease from 1994 to 1995 is mainly caused by an increase in military expenditure (from anestimated 77 billion shillings in 1994 to 122 billion shillings in 1995, entailing a real increase ofaround 50 per cent).
The CIA's Internet pages estimate military expenditure in Uganda at US $55 million for the 1993/94fiscal year. This is equivalent to about 1.7 per cent of GDP and is close to the estimates from the othersources.
Since Uganda has not reported military expenditure to the IMF since 1986 or to the UN, it has notbeen possible to calculate separate indicators. The other sources, however, provide figures which arevery similar in the latter part of the period. Because of the considerable divergences between sourcesin earlier years, it is difficult to carry out a time-series analysis. It appears as though Uganda hasgradually reduced military expenditure in relation to GDP after passing a peak at the beginning of the1990s. This must be viewed in conjunction with the political situation in the country. According to theIISS, however, an increase took place in 1995 and was budgeted to increase further in 1996. The
* Priority country.
32

increase is reflecting the instabilities caused by fighting and general lawlessness in neighbouringcountries, in particular Sudan and Rwanda, which has lead Uganda to raise imports of major militaryequipment. Infant mortality has exhibited a negative trend since 1980, while the primary educationrate has fallen by 10 percentage points since 1990. The country is, however, experiencing increasingdemocratization and sharp economic growth, and will thus be in a better position to give priority tosocial development in the near future. This situation may be reversed, however, if the ongoing conflictin Zaire spills over into Uganda.
Table 3.1.9 Indicators of the degree of militarization and social indicators. All figures in percent
Year 1975 1980 1985 1986 1987 1988 1989 1990 1991 1992 1993
MilitarizationMil. exp./GDP SIPRI 2.9 2.2 2.9 2.8 2.5 2.3 2.5 3.0 2.7 1.7 1.5Mil. exp./GDP 1) 2.7 1.5 1.8 2.7 5.9 2.2 2.1 2.4 3.2 2.4 1.7Mil. exp./Gov. exp.' ) 18.2 24.4 15.6 24.7 63.2 25.4 25.8 18.8 15 11.1 8.8Mil. exp./Soc. exp. .. .. .. .. .. .. .. .. .. .. ••
Social indicatorsInfant mortality .. 9.7 10.8 10.5 10.3 10.1 9.9 11.7 11.8 12.2 11.4Primary education2) 53 50 70 71 70 77 .. 76 71 71 67
1) The indicators were obtained from the ACDA.2) Because of lacking data, information on primary education was obtained from both the World Bank and UNESCO,entailing that the series are not consistent.
33

3.1.10. Zambia*
Sources:Neither the IMF nor the UN presents data on military expenditure. Previously, Zambia prohibited thepublication of defence expenditure.
The SIPRI has time series for military expenditure in Zambia from 1975 through 1994 in the yearbookeditions to which I have had access. The rate for military expenditure as a percentage of GDP is notcalculated for 1992 and 1994. After rising sharply in 1991, the SIPRI's calculations for 1993 showthat military expenditure as a percentage of GDP has fallen to 1.3 per cent. The estimated rate for1991 of 6.3 per cent is probably ascribable to a decline in GDP rather than rising military expenditure.Earlier editions of the SIPRI's yearbook note that the specified figures on military expenditure arevery uncertain. This reservation is not in the 1995 edition after the authorities removed the ban on thepublication of military expenditure. The series have not been revised or extended in the latest editionof the yearbook (1996).
The ACDA has time series from 1968 through 1994 for military expenditure, but there are severalobservations lacking for the 1980s. The ACDA's rate for the military burden (militaryexpenditure/GDP) is higher than the figures presented by the SIPRI in those years it is possible tocompare. The ACDA has calculated the rates for military expenditure as a percentage of GDP in 1993and 1994 at 1.7 per cent and 1.2 per cent respectively.
The IISS also publishes its own estimates for military expenditure and has long time series (from1965). Military expenditure is put at US $58 million in 1993, equivalent to 1.5 per cent of GDP. In1994, budgeted military expenditure amounts to US $38 million, corresponding to 1.0 per cent ofGDP. In absolute terms, the figures presented by the ACDA and the IISS are generally in accord,while the estimated rates for military expenditure in relation to GDP correspond more closely withfigures from the SIPRI. The difficulties of determining GDP, partly as a result of high inflation, maybe the reason for the divergences. The IISS has calculated the military burden at 1.8 per cent in 1994,which is higher than the rate published by the ACDA. The rate has been calculated with the help ofdata converted into US dollars. If the rate is calculated with figures in local currency taken from thedetailed section, however, it is estimated at 2.5 per cent. For 1995 the corresponding rates arecalculated at 1.9 per cent (based on US dollars) and 2.3 per cent (based on kwachas).
The CIA's Internet pages estimate military expenditure in Zambia at US $45 million in 1994, i.e.lower than the figure presented by the IISS at US $59 million. The estimated rate for the militaryburden (military expenditure/GDP) is 1.4 per cent.
The national budget is readily available, but previously contained no information on defenceexpenditure, whereas the other sectors were described in detail. In recent budgets (the fiscal yearcoincides with the calendar year), defence expenditure is included. It is divided into current andcapital costs and presented in great detail. It is somewhat uncertain whether pension expenditure isincluded, but the item "other emoluments" may include pensions since the allocated amount in thiscategory is about the same size as wages and salaries. Based on national accounts figures kindlysupplied by the Norwegian embassy in Lusaka, the rates for the military burden are calculated at 1.4per cent in 1993, 1.7 per cent in 1994 and 1.4 per cent in 1995. The figures also show that militaryexpenditure as a percentage of government expenditure has fallen from 11 per cent in 1993 to 7.9 percent in 1995.
* Priority country.
34

It must be considered a major step forward that Zambia has now started to publish its militaryexpenditure. The official figures show that the country has low military expenditure in relation toGDP. The recent figures from the IISS are rather confusing, however, since the military burden differsdepending on which currency the rates have been calculated with, probably due to a sharplydepreciating local currency rate. To carry out a time series analysis it is therefore essential that allfigures are measured in the same currency and preferably taken from one source. The country hasrecorded a negative trend in social indicators in recent years, with infant mortality at 10.3 per cent in1993, rising further to 10.8 per cent in 1994. This is probably ascribable to the economic setbacksexperienced by Zambia rather than high military expenditure.
Table 3.1.10. Indicators of the degree of militarization and social indicators. All figures in percent
Year 1975 1980 1985 1986 1987 1988 1989 1990 1991
MilitarizationMil. exp./GDP SIPRI [2.9] [3.5] 2.4 3.7 3.2 2.4 1.6 1.9 6.3Mil. exp./Gov. exp.' s [6.8] [9.3] 6.7 8.9 9.3 8.4 7.5P) .. ••Mil. exp./Soc. exp. 1) [28.6] [53.6] 37.4 76.3 67.5 52.2
Social indicatorsInfant mortality 10.62) 10.6 8.4 8.2 8.0 7.8 7.6 8.2 10.6Primary education 96 95 103 104 97 .. 95 93 92
[ ] indicates an estimate entailing considerable uncertainty.1) The indicator was calculated with the help of the estimate for military expenditure provided by the SIPRI, while the otherfigures were obtained from the IMF. There is a break in the IMF's series from 1986 so the time series are not consistent. Theindicators must be considered very uncertain.2) Figure is for 1970.p) Projection of total government expenditure.
35

3.1.11. Zimbabwe *
Sources:The IMF publishes time series from 1976 through 1989 in national currency (dollar) at current pricesfor the fiscal year. Zimbabwe changed the period of calculation for the fiscal year in 1985 when theauthorities decided that instead of having the fiscal year coincide with the calendar year it wouldextend from 1 July to 30 June. As a result, the figures are not necessarily consistent prior to and after1985, a factor which makes it difficult to carry out a time-series analysis. There has been no revisionor extension of the time series in Government Finance Statistics Yearbook 1994 and 1995 comparedwith the edition from 1993.
The UN publishes data from 1970 to 1991. In the period through 1988, however, it is not possible toobtain detailed information on defence expenditure. In the classification by sector there is only onecombined category for "general public services, defence, public order and safety". In the latestavailable edition of National Accounts Statistics (1992), the combined category for the period 1989-1991 is split up into three sub-groups with a specification of defence expenditure. The time series arepresented in national currency at current prices. There is no information as to whether the seriesfollow the fiscal year or the calendar year.
In the editions to which I have had access, the SIPRI has figures from 1965 through 1995. Up to 1985the figures are slightly lower than those of the IMF, but this situation has been reversed in thattowards the end of the 1980s the SIPRI has reported higher military expenditure. This may be due tothe fact that SIPRI converts military expenditure to apply to the calendar year while the IMF uses thefiscal year for expenditure and converts GDP to obtain consistency. The divergence is greatest in1986, amounting to 80 million Zimbabwe dollars. In the last part of the period the figures from thetwo sources are in greater accord. The series have been extended but not revised in the SIPRIYearbook 1996.
The ACDA has figures from 1973 through 1994. There are some divergences between the ratesprovided by the ACDA and the two rates shown in table 3.1.11, but the trend is the same. Afterpeaking in 1987, with miliary expenditure estimated at 7.5 per cent of GDP, the rate graduallydeclines to 3.7 per cent in 1994. This is slightly higher than the calculations made by the SIPRI.
The IISS has long time series for military expenditure in Zimbabwe (Rhodesia is reported in earliereditions). The latest estimate is from 1996 and refers to budgeted figures. The IISS publishes figuresvery close to the official figures (in current prices and local currency) from the Zimbabwean Ministryof Finance kindly provided by the Norwegian Embassy in Harare. Military expenditure is estimated at3.6 per cent of GDP in 1994, which is close to the rates calculated by the SIPRI and the ACDA. Therate in 1995 is put at 4.2 per cent reflecting a nominal rise in military expenditure.
The CIA's Internet pages contain information on military expenditure for the 1994/95 fiscal year,putting the figure at US $175 million, or 3.1 per cent of GDP. This is slightly lower than the levelindicated by the IISS, which has an estimate of US $196 million.
The national budget is organized according to branches of the armed forces. Current costs and capitalcosts are shown separately in a satisfactory manner, and the presentation of the different sub-categories is the same for the annual editions to which I have had access. Expenditure on pensionsdoes not appear to be included, in accordance with the IMF's guidelines. The budgeted figures arehigher than the final figures published by the IMF. There is greatest accord between the nationalbudget and the IISS, but also here the budgeted figures are slightly higher than the level publishedinternationally.
* Priority country.
36

The conclusion for Zimbabwe must be that access to data is satisfactory and there is a large degree ofopenness. However, considerable divergences between data from various sources entail that foranalytical purposes material should be obtained from one source. According to the SIPRI the militaryburden peaked in 1987 and has fallen since. The most recent figures from the IISS, however, indicatesthat this downward trend has been reversed. The budget for the fiscal year 1996/1997 shows a slightnominal increase in military expenditures. This entails a real decrease, however, since the inflationrate is expected to be around 20 per cent. As shown in table 3.1.11, Zimbabwe has reduced its militaryexpenditure in relation to social expenditure to a little less than 42 per cent in 1991. The country'sposition was relatively favourable with regard to social indicators, but infant mortality rose sharply in1993, to 6.7 per cent. This is probably due more to the difficulties experienced by the country,including a protracted drought, than increasing militarization. For 1994 the infant mortality wasreduced to 5.4 per cent. The education rate is very high, and it is obvious that the authorities aregiving priority to having as many people as possible receive a primary education inasmuch as agreater number of pupils are enrolled outside their relevant grade level.
Table 3.1.11. Indicators of the degree of militarization and social indicators. All figures in percent
Year 1976 1980 1985 1986 1987 1988 1989 1990 1991 1992 1993 1994
MilitarizationMil. exp./GDP SIPRI 4.3 [8.6] 6.1 6.8 7.0 6.4 6.1 6.3 5.0 4.4 3.8 3.3Mil. exp./GDP' ) 4.0 8.7 5.9 6.5 7.3 4.7 6.8 15.9 5.1 .. .. ••Mil. exp./Gov. exp.' ) 16.1 8.7 15.5 16.5 17.1 16.3 16.5 13.1 14.3 .. .. ••Mil. exp./Soc. exp.' ) 72.9 119.7 56.5 57.1 61.5 55.3 53.1 49.9 41.8 .. .. ••
Social indicatorsInfant mortality 9.62) 7.4 7.7 7.4 7.2 4.9 4.6 4.9 4.8 6.7 5.4Primary education 742) 115 131 129 136 128 125 117 ..
1)The indicators were calculated on the basis of figures from the IMF up to and including 1989, and thereafter figures fromthe UN.2) Figure is for 1970.[ ] indicates an estimate entailing considerable uncertainty.I indicates a break in the series.The IMF has a break in the time series from 1985.
37

3.2. Asia
3.2.1. Bangladesh *
Sources:The IMF published data on military expenditure on a somewhat sporadic basis up to 1985. The latesteditions of Government Finance Statistics contain no information about the country.
The UN has time series from 1980 through 1990 in national currency (taka) at current prices for thefiscal year, which begins on 1 July. There is a rough breakdown into current expenditure and capitalexpenditure which seems to contain the same sub-groups each year. It is not possible to verifywhether expenditure on pensions is included in the total amount. In National Accounts Statistics1992, the figures for 1990 have been revised compared with earlier editions, but the time series werenot extended.
The SIPRI has time series from 1972 to 1994 in national currency at current prices for the calendaryear. As noted in the discussion on Bangladesh in Rolland (1994), there were considerabledivergences between the published estimates for military expenditure in SIPRI Yearbook 1992 andthe UN's National Accounts Statistics 1990. The divergence was particularly great in 1985. While theUN reported total military expenditure of 1138 million taka, the SIPRI estimated the amount at 5790million taka. (This was more in line with the IMF which estimated military expenditure at 5061million taka in 1985.) In the latest available editions of the yearbooks with information on 1985(SIPRI Yearbook 1995 and National Accounts Statistics 1992), the UN's figure is very close to that ofthe SIPRI, putting military expenditure in 1985 at 5815 million taka, whereas the SIPRI has retainedits figure. There are now only small divergences in the information from the two sources in the periodit is possible to compare. The last rate for military expenditure/GDP which the SIPRI has calculated isfor 1992, probably as a result of the lack of information on GDP. The series have not been revised orextended in the SIPRI Yearbook 1996.
The ACDA has time series from 1972 through 1994 and, as noted in section 2.2, these are onlypresented in US dollars calculated with the help of the official exchange rate. The source has alsocalculated military expenditure as a percentage of GDP and total government expenditure. TheACDA's rate for the military burden (military expenditure/GDP) is slightly higher than that of theSIPRI up to 1989. The divergence, however, is marginal and since 1990 the two sources have virtuallythe same rates. The ACDA has calculated military expenditure as a percentage of GDP at 1.7 per centin 1994.
The IISS has time series for military expenditure through 1995. The budgeted figure for 1996 is alsopresented. For 1992, the rate for military expenditure as a percentage of GDP calculated by the IISS isthe same as the rate indicated by the SIPRI. Changes in military expenditure as a share of GDP for1993 indicate that resources for the military sector increased in relative terms, with a rate of 1.9 percent. For 1994 and 1995 the IISS has calculated the military burden at 1.8 per cent.
The CIA's Internet pages indicate that military expenditure as a share of GDP was 1.7 per cent for the1993/94 fiscal year.
During the last two years it has become easier to judge the quality of data on military expenditure inBangladesh. There is now considerably greater accord between the sources after the UN revised itsdata upwards. It is not inconceivable, however, that the various sources make use of each other'spublications, which may have a certain contagious effect. It is nevertheless easier to use series that do
* Priority country.
38

not diverge substantially. The latest figures from the IISS indicate that military expenditure did riseslightly relative to GDP, but has lately levelled off and the country does not appear to be particularlymilitarized. The social indicators point to a negative situation for the country's social standards, butthe trend has been positive the last few years. One exception, however, is the figure on infantmortality in 1993, which shows that it rose to 10.6 per cent. The rate fell sharply in 1994 to 8.1 percent, however, representing the lowest infant mortality rate ever registered in Bangladesh in thepublications to which I have had access.
Table 3.2.1. Indicators of the degree of militarization and social indicators. All figures in percent
Year 1980 1985 1986 1987 1988 1989 1990 1991 1992 1993
MilitarizationMil. exp./GDP SIPRI 1.3 1.3 1.5 1.6 1.5 1.5 1.5 1.4 1.5 1.6Mil. exp./GDP' ) 0.9 1.3 1.4 1.4 1.5 1.5 1.3 .. .. ••Mil. exp./Gov. exp.' ) 5.5 8.2 9.4 9.3 9.3 9.2 8.9 ••Mil. exp./Soc. exp.' ) 47.2 53.5 57.2 52.3 59.8 56.1 57.0 ••
Social indicatorsInfant mortality 13.6 12.3 12.1 11.9 11.8 10.6 10.5 10.3 9.1 10.6Primary education 62 60 60 59 .. 70 73 77 .• ••
1) The indicators were calculated on the basis of figures from the UN's National Accounts Statistics, 1992.
39

3.2.2. India
Sources:The IMF publishes figures for military expenditure in national currency (rupees) at current prices forthe fiscal year, which starts on 1 April. The latest official figures are from 1992, but there areprovisional figures for 1993 and projections for 1994. A check of the provisional figures shows thatthey are updated regularly as the final figures become available. The series are consistent and suitablefor a time-series analysis.
The UN has time series for military expenditure through 1990. The amounts are also presented innational currency at current prices for the fiscal year. The series were extended by two years from the1990 to the 1991 edition of National Accounts Statistics, but in the latest available edition (1992) theseries were neither revised nor extended. The total amount is roughly broken down into sub-groupswhich primarily distinguish between current expenditure and capital costs. It is not possible todetermine whether pension expenditure is included. Informal information indicates, however, that it isincluded in the total amount even though the IMF's definition presupposes that pension expenditure isexcluded. The UN's figure is virtually identical to that of the IMF up to 1984, but expenditure issubsequently considerably higher.
In its yearbook for 1996, the SIPRI has time series for military expenditure in national currencythrough 1995. The time series coincide closely with those of the IMF. In STPRI's yearbook for 1992,military expenditure as a percentage of GDP is slightly higher than my own calculations made withthe help of data from the IMF, but in the latest two editions there is greater accord between the rates.The series have been revised and extended from the SIPRI Yearbook 1995 to the edition for 1996.
The ACDA has series for military expenditure in India through 1994. The agency's figures reported inthe World Military Expenditure and Arms Transfers 1993-1994 are very close to the rates for themilitary burden (military expenditure/GDP) reported by the SIPRI up to 1991, but the ACDA's ratesfor 1992 and 1993 are higher, at 3.1 and 3.3 per cent, respectively. In the 1995 edition, however, therates for the latter period have been revised downwards and are now on a par with the rates calculatedby the SIPRI.
The IISS publishes time series through 1996, with the last year referring to budgetary data. Thefigures in national currency for the last few years are slightly higher than those reported by the IMFand the SIPRI. The rates for the military burden are lower, however, implying a higher estimate ofGDP. The IISS has calculated that military expenditure as a percentage of GDP was 2.5 per cent inboth 1994 and 1995.
The CIA's Internet indicate that military expenditure as a share of GDP was 2.8 per cent for the1994/95 fiscal year.
Access to data on military expenditure in India appears to be satisfactory. National budgets areavailable to the public, and the country reports on a regular basis to international sources. Divergencesbetween the various sources exist, but they are not substantial. The greatest divergence I have comeacross is in the calculation of the rate for military expenditure in relation to social expenditure. In thecalculations I have made use of figures from the IMF when this has been possible. However, the IMFonly reports central government expenditure. A different indicator will be obtained when considerablelocal government resources are involved. In the case of India, for example, military expenditureamounts to more than 410 per cent of total central government expenditure on health and education in1990, while the same rate calculated with figures from the UN is 73 per cent. The UN includesexpenditure from the various states in its total amount. Expenditure on education in particular shows asharp increase, with the figure nine times higher when the various states are included, while health
40

2.9•••
•.
expenditure shows a threefold increase. The social indicators also indicate that priority is being givento education, but infant mortality remains high. As shown in table 3.2.2, however, infant mortality hasbeen reduced substantially the last twenty years.
Table 3.2.2. Indicators of the degree of militarization and social indicators. All figures in percent
Year 1975 1980 1985 1986 1987 1988 1989 1990 1991 1992 1993 1994
MilitarizationMil. exp./GDP SIPRI 3.3 3.1 3.0 3.4 3.6 3.4 3.2 2.9 2.7 2.5 2.7Mil. exp./GDP 1) 3.2 2.6 3.0 3.6 3.6 3.4 3.1 2.9 2.6 2.5 2.7Mil. exp./Gov. exp.' ) 22.4 19.8 18.5 20.2 19.9 19.1 17.5 16.6 15.5 14.4 15.2Mil. exp./Soc. exp.' ) 538.8 570.5 465.5 535.4 444.9 404.9 454.0 410.7 408.3 397.7 400.1Mil. exp./Soc. exp. 2) 256.5 3) 72.8 79.2 92.4 91.9 88.1 80.6 72.9 .. .. ••
Social indicatorsInfant mortality 12.2 12.3 8.9 8.6 9.9 9.7 9.5 9.2 9.0 7.9 8.0 7.0Primary education 65 76 92 .. 98 99 98 97 98 102 .. ••
1) The indicators were calculated on the basis of figures from the IMF.2) The indicators were calculated on the basis of figures from the UN.3) Figure is for 1970.
41

3.2.3. Nepal*
Sources:The IMF presents time series for military expenditure from 1973 through 1991 in the editions towhich I have had access. All figures are presented in national currency (Rupee) at current prices forthe fiscal year, which ends on 14/15 July. There are no figures for 1986.
The UN has time series for military expenditure in Nepal from 1983 through 1988 in its publicationNational Accounts Statistics 1992. All figures are in national currency at current prices for the fiscalyear. There is no breakdown of current and capital costs. The rates calculated for military burden(military expenditure/GDP) with the figures from UN are slightly higher than the rates calculatedbased on figures obtained from the IMF.
The SIPRI has time series from 1975 to 1991. The indicator for military expenditure as a percentageof GDP was revised slightly downwards in the yearbook for 1996 compared with the yearbook for1995. The series have not been extended.
The ACDA presents time series for military expenditures in Nepal from 1963 through 1994. The ratesfor the military burden (military expenditure/GDP) are identical to the rates calculated with the helpof data from the IMF for the period where both sources publish information. Military expenditure as apercentage of GDP is estimated at 1.1 per cent in both 1993 and 1994.
The IISS has time series from 1973 through 1995. In the latest edition (1996/97) budgeted figures innational currencies and US dollars are included for 1996. The rates are similar to my own calculationsbased on information from the IMF and the rates presented by the ACDA.
The CIA's Internet pages estimate military expenditure in Nepal at US $ 36 million for the 1992/93fiscal year. This is equivalent to about 1.2 per cent of GDP and is on a par with the rate estimated bythe ACDA and the IBS.
Access to data on military expenditure in Nepal appears to be satisfactory. Most sources haverelatively long time series, and there is no major divergence between the various sources. I have notsucceeded in obtaining the national budget, entailing that it has not been possible to carry out a moredetailed examination of the various sub-groups. This is probably because the country is relatively newin terms of Norway's official development aid, and libraries have therefore not yet given priority toobtaining sufficiently detailed information about the country. As shown in table 3.2.3, Nepal has lowmilitary expenditure in per cent of GDP and social expenditure if we compare the figures withNorway's other main partner countries. Nevertheless, the country's position is relatively unfavourablewith regard to social indicators. Infant mortality is high, 9.1 per cent in 1994, but has exhibited adownward trend since 1980.
* Priority country.
42

Table 3.2.3 Indicators of the degree of militarization and social indicators. All figures in percent
Year 1975 1980 1985 1986 1987 1988 1989 1990 1991
MilitarizationMil. exp./GDP SIPRI 0.7 1.0 1.3 1.1 1.1 1.0 1.0 1.2 1.2Mil. exp./GDP 1) 0.6 1.0 1.1 .. 1.1 1.0 1.0 1.0 0.9Mil. exp./Gov. exp.' ) 6.5 6.7 6.2 .. 6.4 5.6 5.2 6.1 5.9Mil. exp./Soc. exp. 1) 40.1 48.4 36.3 .. 40.2 36.9 34.5 38.4 37.6
Social indicatorsInfant mortality .. 14.2 13.3 13.0 12.8 12.6 12.4 12.1 10.1Primary education 27 91 79 79 82 86 86 86 ..
1) The indicators were calculated based on figures obtained from the IMF. Preliminary data for 1990 and projections for1991.
43

3.2.4. Pakistan
Sources:The IMF publishes figures up through 1986 in national currency (rupees) at current prices for thefiscal year, which ends on 30 June. In Government Finance Statistics Yearbook 1993 the series ongovernment expenditure by function ends in 1982, while total government expenditure is presented upto 1991. In the latest available editions (1994 and 1995), the table which contains governmentexpenditure by function is omitted. I have not been able to ascertain why the IMF has stoppedpublishing data the last few years. There have been no changes in budget routines so the time seriesare consistent, but not particularly interesting due to the lack of information for the past decade.
The UN has time series for government expenditure through 1991 in national currency at currentprices. However, it is still difficult to find data on military expenditure in the UN's publications sinceonly a total amount for "general public services and defence" is reported. In addition to the totalamount, the publication contains tables with a rough breakdown into sub-groups for the varioussectors. A distinction is made between current costs and capital costs, but here as well the defencesector is included in the above-mentioned combined category. The figures for expenditure on socialsectors are considerably higher than those published by the IMF. I assume that this is due to theinclusion of expenditure at state level in the total amount (as described for India in section 3.2.2), butthis is not explicitly stated in the text to the table.
In the editions to which I have had access, the SIPRI has data on military expenditure from 1954 to1995, as well as its own estimate for 1994. As shown in table 3.2.4, the rates for the military burden(military expenditure/GDP) are on the whole slightly lower than my own calculations made with thehelp of figures from the UN and a distribution formula based on earlier figures from the IMF. (Seefootnote under the table for a more detailed description of the method of calculation.) The series wererevised downwards and extended from the SIPRI Yearbook 1995 to the edition for 1996.
The ACDA publishes data through 1994. In the latest edition of the yearbook (1995), the estimates formilitary expenditure were revised slightly compared with the previous edition. This may be due to achange in the base year, and changes in the exchange rate have probably resulted in lower militaryexpenditure measured in US dollars. The ACDA's estimate for military expenditure as a percentage ofGDP is higher than the corresponding rate from SIPRI; their rate for 1994 shows that militaryexpenditure as a percentage of GDP came to 6.0 per cent.
The IISS publishes figures from 1971 to 1996 (the last year refers to budgeted amounts). The amountsin national currency are higher than those reported by the SIPRI, which is also reflected in higherrates for the military burden (military expenditure/GDP). The series provided by the IBS and theSIPRI seem to be in accord up to the end of the 1980s, but in recent years the figures reported by theIISS have been slightly higher than those of both the SIPRI and the ACDA. Military expenditure as apercentage of GDP is estimated at 6.9 per cent in 1994 and 6.5 per cent in 1995.
The CIA's Internet pages put Pakistan's military expenditure for the 1994/95 fiscal year at US $3.2billion. This is slightly less than the figures published by the IISS, and is equivalent to a militaryexpenditure/GDP rate of 5.6 per cent.
The availability of data on military expenditure in Pakistan appears to be satisfactory. However, theinformation provided shows fairly considerable variation, a factor which makes it difficult to evaluatethe material. My conclusion is that there are shortcomings in the routines for the publication of themagnitude of resources used by the defence sector. There is nevertheless no doubt that Pakistan hashigh military expenditure in relative terms. This is particularly true when measured against theamounts allocated to health and education. Even when the indicator is calculated with the help of the
44

highest reported figures for social expenditure, military expenditure is more than two and a half timesgreater. The social indicators also reflect Pakistan's priorities. Infant mortality is high, and the countryhas one of the lowest primary education rates among all of Norway's main partner countries fordevelopment assistance. To some extent this may be ascribable to cultural factors since the rate forboys enrolled in primary education was 49 per cent in 1990 compared with only 27 per cent for girls.However, it is still low when the figure is compared with another Muslim country, Bangladesh, wherethe rates are 78 and 68 per cent, respectively.
Table 3.2.4. Indicators of the degree of militarization and social indicators. All figures in percent
Year 1975 1980 1985 1986 1987 1988 1989 1990 1991 1992 1993 1994
MilitarizationMil. exp./GDP SIPRI 6.2 5.3 7.1Mil. exp./GDP' ) [6.2] [5.6] [7.5]Mil. exp./Gov exp.' ) [35.4] [47.8] [47.3]Mil. exp./Soc. exp.' ) [353] [265] [271]
7.5 7.6 6.9 6.5 6.8 6.6 6.3 6.8 [5.7][7.8] [9.7] [9.2] [8.5] [7.8] [6.8] ..
[46.7] [51.4] [44.6] [47.2] [45.7] [45.5] ..[253] [300] [228] [254] [238] [236] ..
••
••
••
Social indicatorsInfant mortality
11.3 12.6 11.5 11.1 10.9 10.7 10.6 10.3 9.7 9.5 8.8 9.2Primary education 51 57 47 44 52 40 38 37 46 46 .. ••
[ ] denotes that the indicators are shrouded with considerable uncertainty.1) The indicators were calculated with the help of figures from the UN's National Accounts Statistics. Since the UN onlyspecified a combined amount for "General public services and Defence", it is estimated that defence expenditure accounts for80 per cent of the total amount based on IMF publications for earlier years, and the indicators were calculated on the basis ofthis assumption. No explicit information is provided in the statistical annex as to the content of the expenditure, but it isassumed that the amounts also cover expenditure at state level as described for India under section 3.2.2.
45

3.2.5. Sri Lanka*
Sources:The IMF publishes time series up to 1994 (preliminary figures for the last year) on militaryexpenditure in national currency (rupees) at current prices for the fiscal year, which coincides withthe calendar year. The figures are updated and are consistent in the reporting period.
The UN has figures on final government consumption expenditure on the military sector up to 1992.The series are extended and updated in National Accounts Statistics 1992 from the 1991 edition.There is no breakdown of current and capital costs as I have seen for various other countries. Thefigures differ substantially from the time series published by the IMF where reported expenditure ondefence is higher while expenditure on social sectors is lower (see table 3.2.4 for indicators calculatedwith the help of the two sources). The differences are probably ascribable to the different basis ofmeasurement for the two sources. The UN looks at government final consumption expenditure andalso includes local government expenditure, whereas the IMF looks at consolidated governmentexpenditure.
The SIPRI has information on military expenditure in Sri Lanka in national currency at current pricesfrom 1954 through 1995. Considerable revisions of the figures from 1985 to 1992 are presented in theyearbook for 1995. In this edition, military expenditure in national currency is identical to the figurespublished in the IMF's Government Finance Statistics Yearbook 1993. The SIPRI states that thefigures are uncertain, probably because it has not been possible to check these against other sources.In the SIPRI's yearbook for 1992, military expenditure as a percentage of GDP is considerably higherthan my own rates calculated with the help of figures from the IMF's 1993 edition (see Rolland (1994,p. 23), particularly towards the end of the period. The SIPRI has in other words now chosen todisregard these figures. The series have been further revised and extended in the SIPRI Yearbook1996 and the rates for the military burden (military expenditure/GDP) are on a par with my owncalculations based on information from the IMF.
The ACDA publishes figures up through 1993. Their calculations are in accord with my owncalculations made with the help of information from the IMF in the period through 1987. Thedivergences are subsequently considerable, and the ACDA's rates for military expenditure as apercentage of GDP are considerably higher than calculations made using figures from the IMF.Military expenditure as a percentage of GDP is estimated at 4.8 per cent in 1993.
The MS has figures up through 1995. Budgetary data are also presented for 1996. The figuresreported by the IISS are close to the ACDA's rates for military expenditure as a percentage of GDP,i.e. considerably higher than the rates calculated with the help of figures from the IMF. The IBS putsthe military burden (military expenditure/GDP) in 1994 at 4.4 per cent and at 4.9 per cent in 1995.
The CIA's Internet pages put military expenditure in Sri Lanka at US $412 million in 1994. This isabout US $100 million lower than the figures estimated by the MS and corresponds to a militaryburden (miliary expenditure/GDP) of 3.6 per cent.
There are many sources that publish military expenditure for Sri Lanka, but because of the substantialdivergences in the amounts reported it is difficult to judge which information is correct. I amnevertheless inclined to believe that the estimates provided by the IISS and the ACDA for more recentyears are the most credible. A state of war has existed in several provinces in Sri Lanka, and this willnaturally be reflected in higher expenditure on military activities. Moreover, according to officialfigures kindly supplied by the Norwegian Embassy in Colombo budgeted military expenditure for1996, approved by the Parliament in 1995, amounted to 38 billion rupees, the same as presented by
* Priority country.
46

the IISS. An additional amount of 12 billion was granted during the summer of 1996 bringing the totalamount to 50 billion rupees, entailing a considerable rise in the military burden for 1996. However,the rising trend in military expenditure during the 1990s has not had a negative effect on the socialindicators thus far. The country has the lowest infant mortality rate among all of Norway's mainpartner countries for development assistance, and the primary education rate is very high.
Table 3.2.5. Indicators of the degree of militarization and social indicator. All figures in per cent
Year 1975 1980 1985 1986 1987 1988 1989 1990 1991 1992 1993 1994
MilitarizationMil. exp./GDP SIPRI 1.5 1.5 [2.8] 2.6 3.5 2.4 1.8 2.7 3.0 3.2 3.2 [3.5]Mil. exp./GDP 1) 0.8 0.7 2.8 2.4 3.1 2.1 1.6 2.1 2.8 3.0 3.1 3.4Mil. exp./Gov. exp.' ) 2.9 1.7 8.5 7.6 9.6 6.9 5.3 7.4 9.5 11.2 11.4 12.3Mil. exp./Soc. exp.' ) 17.2 14.4 70.5 59.8 72.9 48.2 31.9 46.4 71.9 67.5 73.0 72.2Mil. exp./Soc. exp. 2) .. 30.6 96.7 151.8 153.1 130.4 79.7 104.1 112.2 116.9 .. ••
Social indicatorsInfant mortality 4.5 4.4 3.6 2.9 3.3 2.1 2.0 1.9 1.8 1.8 1.7 1.6Primary education 77 100 103 103 104 107 107 107 108 .. •• ••
[ ] denotes that the indicators are shrouded with considerable uncertainty.1) The indicators were calculated based on figures from the IMF.2) The indicator was calculated with the help of figures from the UN.
47

3.3. Central America
3.3.1. Guatemala
Sources:The IMF publishes time series for military expenditure from 1972 through 1994 in national currency(quetzale) at current prices for the fiscal year, which coincides with the calendar year. However, theseries are somewhat sporadically reported in the various editions of Government Finance StatisticsYearbook, entailing that many editions are required to obtain the longest time series. There is a breakin the series in 1984, thereby making it difficult to carry out a consistent time-series analysis with thehelp of this statistical material. There was no updating or reporting of new figures for militaryexpenditure from the 1993 edition, where the series ended in 1989, to the 1994 edition of GovernmentFinance Statistics. In the latest edition of the yearbook (1995), however, the series have been extendedthrough 1994.
The UN's National Account Statistics contains no figures on military expenditure.
In the editions to which I have had access, the SIPRI publishes military expenditure for the period1975 to 1995. Throughout the comparable period the figures are between 20 and 50 million quetzaleshigher than those reported by the IMF. The entire time series were revised in the 1995 yearbookcompared with the 1992 edition where expenditure in the period 1985 to 1988 now appears to belower than previously. The opposite is the case for the latter part of the period. The series have beenrevised further downwards and extended in the SIPRI Yearbook 1996. The SIPRI states that the figurereported for 1993 is that reported to the United Nations (603.3 million quetzales). Final reportedoutlays, however, were 692.98 million quetzales. Figures for 1994 and 1995 are budgeted figures. Asshown in table 3.3.1, the SIPRI's rates for military expenditure as a percentage of GDP areconsiderably lower than my own calculations based on data from the IMF, particularly from 1989onwards.
The ACDA provides figures on military expenditure from 1968 through 1994 in the editions to whichI have had access. Estimates are provided for the period 1982-1984. The series are identical to thecalculations I have made with the help of data from the IMF presented in table 3.3.1, and are slightlyhigher than the figures reported by the SIPRI for the entire period it is possible to compare.
The IISS has series for military expenditure in Guatemala from 1980 to 1993 as well as its ownestimates for expenditure in 1994 and 1995 and budgeted figures for 1996. The rates for militaryexpenditure as a percentage of GDP are close to those reported by the ACDA and my owncalculations made with the help of data from the IMF. The IISS puts military expenditure as apercentage of GDP at 1.4 per cent in both 1994 and 1995.
The CIA's Internet pages estimate military expenditure in Guatemala at US $121 million, or 1.0 percent of GDP, in 1993.
Access to data on military expenditure in Guatemala appears to be satisfactory. Most sources haverelatively long time series, and there is no major divergence between the various sources. I have notsucceeded in obtaining the national budget, entailing that it has not been possible to carry out a moredetailed examination of the various sub-groups. This is probably because the country is relatively newin terms of Norway's official development aid, and libraries have therefore not yet given priority toobtaining sufficiently detailed information about the country. As shown in table 3.3.1, Guatemala hassurprisingly low military expenditure in per cent of GDP and social expenditure in view of theprotracted civil war in the country. Social indicators have improved in recent years. Infant mortality
48

was more than 6 per cent at the beginning of the 1990s, while the World Bank's latest figure showsthat it fell to 4.4 per cent in 1994.
Table 3.3.1. Indicators of the degree of militarisation and social indicators. All figures in percent
Year 1975 1980 1985 1986 1987 1988 1989 1990 1991 1992 1993 1994
MilitarizationMil. exp./GDP STRI 1.2 1.8 1.8 1.1 1.6 1.5 1.4 1.2 1.1 1.0 0.9 0.8Mil. exp./GDP 1) 1.2 1.3 1.6 1.2 1.8 1.6 1.6 1.5 1.4 1.5 1.4 1.4Mil. exp./Gov. exp.' ) 12.3 10.6 17.1 12.7 15.7 13.7 13.3 14.6 15.5 14.0 14.0 15.2Mil. exp./Soc. exp.' ) 49.7 42.1 95.7 59.7 56.3 48.1 45.0 59.6 60.4 56.7 51.3 51.4
Social indicatorsInfant mortalityPrimary education
7.5 7.0 6.5 6.1 5.9 5.7 5.5 6.2 6.0 .. 4.6 4.462 69 76 .. 77 .. 79 .. 79 .. ••
1) The indicators were calculated based on data from the IMF.
49

3.3.2. Nicaragua *
Sources:The IMF publishes figures for military expenditure in Nicaragua for the first time in GovernmentFinance Statistics Yearbook 1994. The time series are short, running from 1990 to 1993, and arepresented in national currency (gold cOrdoba) at current prices for the fiscal year, which coincideswith the calendar year. In the latest available edition of the yearbook (1995) the series have beenrevised and extended through 1994.
The UN publishes no information on military expenditure in Nicaragua.
The SIPRI presents figures in national currency at current prices from 1960 to 1988 in its SIPRIYearbook 1992. In the yearbook for 1995, the times series have been changed and only contain fouryears in national currency at current prices. The information is identical to the figures from the IMF.In the SIPRI Yearbook 1996 the only serie presented is figures from 1990 through 1995 in US dollarsand SIPRI informs that figures in current prices supplied by Nicaragua to SIPRI were expressed in USdollars. No information is provided on military expenditure at constant prices or in per cent of GDPdue to the lack of reliable economic data for Nicaragua.
The ACDA has series through 1994, but there are major breaks in the time series. Data for the period1986-1990 are not available. As noted, the source always publishes figures in US dollars only as wellas estimated rates. There are considerable divergences from the SIPRI rates when it has been possibleto compare them, and the two sources alternate as to presenting the highest level. For the latter part ofthe period, table 3.3.2 shows that the ACDA's figures are higher than the rates for militaryexpenditure as a percentage of GDP which I have calculated with the help of data from the IMF.
The MS provides data from 1965 through 1996, with the last year being budgeted figures, but there isa break in the series. For 1985, the figures are closer to those of the ACDA than the SIPRI, but for1991 the MS estimates military expenditure as a percentage of GDP at 9.1 per cent, i.e. almost twoand a half times the rate reported by the ACDA. Towards the end of the period, however, the figuresin US dollars reported by the IISS are very close to the ACDA's estimates, while military expenditureas a percentage of GDP appears to be lower. Military expenditure as a share of GDP is estimated at2.0 per cent by the IBS for 1993 and 1.9 and 1.8 per cent for 1994 and 1995 respectively. These ratesare identical to my own calculations made with data from the IMF.
The CIA's Internet pages estimate military expenditure in Nicaragua at US $32 million in 1994,equivalent to 1.7 per cent of GDP. The estimate is US $7 million lower than the figure published bythe IBS.
It is very difficult to find long, consistent time series for military expenditure in Nicaragua. Since theend of the war, however, it appears that the defence sector is laying claim to considerably fewerresources. It is easier to find data on military expenditure for the period after 1990. Several sourcespublish figures, and the sources are in greater accord even though there are still some divergences.There are many indications that the country is heading in the right direction with regard to access todata on military expenditure. The country has also recorded a positive change in social indicatorsfollowing the end of the war. Even though infant mortality is relatively high, the figures are movingon a downward trend, and the primary education rate is on a par with that of OECD countries.
* Priority country.
50

Table 3.3.2 Indicators of the degree of militarization and social indicators. All figures in percent
Year 1975 1980 1985 1990 1991 1992 1993 1994
MilitarizationMil. exp./GDP SIPRI 1) 1.7 5.7 23.2 115.7 3.8 3.1 2.7 2.6Mil. exp./GDP2) .. .. .. 10.3 2.9 2.3 2.0 1.9Mil. exp./Gov. exp. 2) .. .. .. 28.5 10.3 7.6 6.7 5.8Mil. exp./Soc. exp. 2) .. .. .. 105.8 34.3 27.0 24.4 20.2
Social indicatorsInfant mortality 4.6 9.1 6.9 5.5 5.6 .. 5.1 5.1Primary education 85 100 101 98 101 102 •• ••
1) The indicators were obtained from the SIPRI Yearbook 1985, 1989 and 1992 and the ACDA's WMEAT 1995 (the period1990-1994).I indicates a break in the time series.2) The indicators were calculated based on figures from the IMF's Government Finance Statistics Yearbook 1995.
51

4. ConclusionIn recent years the size of a country's military expenditure has been the subject of increased attentionon the aid policy agenda. This has been particularly relevant in connection with the debate on goodgovernance where increased transparency is an important ingredient. The purpose of this study hasbeen to provide an updated picture of the degree of militarization in Norway's main partner countriesfor development assistance. The study is a revised and expanded version of Rolland (1996) which wasa direct follow-up of Rolland (1994) where I evaluated problems that may arise in connection with theuse of economic statistics in general and data on military expenditure in particular. Furthermore, inthe light of these problems I have analyzed the most widely used international sources for militaryexpenditure. Moreover, I calculated the following indicators: military expenditure as a percentage ofGDP (the military burden), military expenditure as a percentage of government expenditure andmilitary expenditure in relation to total expenditure on health and education. Norwegian developmentaid is poverty oriented, and the last indicator was calculated based on the notion that a good publichealth and education programme will benefit the poorest segment of the population. In order to obtainsome indication of the society's social standards I also included infant mortality and the primaryeducation rate for the countries. In this study all the figures were calculated with the help of newinformation that is now available, and the number of countries covered was increased in line with newNorwegian priorities. The data situation for Norway's main partner countries for developmentassistance was reviewed with the following two aims:
• Evaluate available statistics in order to identify data quality and the authorities' openness withregard to military expenditure
• Indicate the degree of militarization and priorities between various welfare purposes amongour main partner countries
If the countries are to be judged on the basis of data availability, Zimbabwe is in a class by itself. It isrelatively simple to obtain detailed information from the government budgets, the country is coveredin most international sources, and there are few divergences between the various publications. Indiaalso appears to have a liberal attitude towards public inspection of military budgets, but there aregreater divergences between the various sources, and it is thereby more difficult to judge the qualityof the data. Traditionally, Namibia provided extensive data, but the situation has deteriorated and thecountry has not reported data on military expenditure to the IMF the last two years. The mostgratifying change has taken place in Zambia. Previously, it was not possible to find satisfactoryinformation about military resource use since the government refused to disclose military expenditure.This emerged clearly in that the military sector was not discussed in the readily available and detailednational budgets. In Zambia's national budget for 1995, however, the defence sector is included andbroken down into current and capital expenditure as prescribed. Access to data from Norway's mainpartner countries which were in a state of war until recently has also improved during the last fewyears. Even though the situation has improved with regard to data availability, there is with fewexceptions a constant need for a dialogue with our main partner countries concerning the publicationof military expenditure. In some cases it may also be advantageous to provide assistance in the formof general training in data processing since the lack of statistical know-how is a problem which doesnot only apply to military expenditure.
Without making this a main element in Norway's development assistance programme, it wouldprobably still be useful to discuss the routines for access to data on military expenditure in bilateraltalks with our main partner countries. Moreover, this is a subject which is also on the agenda inmultilateral talks. As early as 1981 the UN General Assembly adopted a resolution on the obligationof member states to report the size of military expenditure to the UN. As members of the UN, ourmain partner countries can also be urged to comply with UN resolutions. Several UN agencies arealso interested in military resource use, and the UNDP has raised the issue of military expenditure
52

Figur 4.1
0 4-
0 . 3- Both the IMF and the World Bank areattempting to improve the data base and
2- are analyzing the relationship betweenmilitary expenditure and development.
1- Through their "Public ExpenditureReviews" and Article IV consultations,
0 21984 1986 1988 1990 1992 1994 they are also making efforts to ensure
that maximum resources are used fordevelopment and minimum resources
- Avg. developing Avg. main for defence. The IMF and World Bank,countriespartner countrieshowever, have thus far experienceddifficulties in obtaining sufficientlydetailed information in order to carryout sound analyses. Another problem is
that the aim of the institutions is not to become involved in political decisions in the various countries,and the defence sector is an area in which countries do not want external interference. With a view tothe data problems which continue to exist with regard to military expenditure, it would be anadvantage for Norway to support the IMF and the World Bank in their efforts to improve dataavailability and openness in this area.
The SIPRI has estimated the average military burden (military expenditure/GDP) for developingcountries at 3.8 per cent in 1991, down from about 5 per cent in 1985. By starting with the SIPRI ratesfor seventeen of Norway's main partner countries (Eritrea is excluded due to a lack of data), we findthat seven countries were above the average in 1991 while ten countries were at or below the average.The calculations also show that military expenditure as a percentage of GDP rose from 1985 to 1991in three countries, notably Botswana, Zambia and Sri Lanka. This is a worrisome development and atvariance with the trend in developing countries. The figures for Zambia must be considered uncertain,though.
In its yearbook for 1995, the ACDA has calculated the military burden (military expenditure/GDP) fordeveloping countries for the period 1984-1994, and thus has slightly more recent figures than theSIPRI. As shown in figure 4.1, the average (unweighted) for Norway's main partner countries wasconsiderably lower than the average for all developing countries up to 1987, but has since been closeto or higher than the average, especially during the latter period. The average figure for Norway'smain partner countries conceals considerable variations. Details for the last five years are presented intable 4.1.
7
5-
with recipient countries in connectionwith talks on public sector reforms.Meetings in the consultative groups(C.G. meetings) for cooperationbetween developing countries and theIMF/World Bank also appear to be anappropriate forum for talks on goodgovernance, including militaryexpenditure.
Source: ACDA (1995).
53

Table 4.1 Military expenditure in per cent of GDP for developing countries and Norway's mainpartner countries
1990 1991 1992 1993 1994
Developing countries 4.5 4.3 3.6 2.8 2.6Avg. partner countries' 4.9 4.2 3.4 3.4 3.1Africa:
Botswana 5.5 5.3 4.8 6.4 6.0Eritrea .. .. .. 6.2 6.1Ethiopia 11.1 9.0 .. 2.9 2.6Malawi 1.3 1.1 1.1 1.2 1.1Mozambique 9.2 11.7 10.1 8.7 8.7Namibia 1.9 2.7 2.4 2.2 1.9South Africa 4.2 3.5 3.0 3.1 2.4Tanzania 4.7 .. 4.5 4.1 3.3Uganda 2.4 3.2 2.4 1.7 1.5Zambia 2.7 .. 1.5 1.7 1.2Zimbabwe 5.3 5.6 5.5 4.3 3.7
Asia:Bangladesh 1.5 1.4 1.5 1.7 1.7Nepal 1.0 0.9 0.9 1.1 1.1India 2.9 2.7 2.5 2.8 2.9Pakistan 6.9 6.1 6.2 6.5 6.0Sri Lanka 4.8 4.8 3.8 4.9 4.5
Central America:Guatemala 1.5 1.4 1.5 1.4 1.4Nicaragua 15.7 3.8 3.1 2.7 2.6
'Excluding EritreaSource: ACDA (1995) and IISS (1996/97) for Eritrea.
The table shows that whereas in 1990 eight countries were above the average for developingcountries, this was the case for six of these countries in 1994, notably Botswana, Mozambique,Tanzania, Zimbabwe, Pakistan and Sri Lanka. The figures for Ethiopia and Nicaragua, which werevery high in 1990, had been reduced to the average level five years later. Developments in the lattertwo countries are typical for countries that move from a state of war to peace. The pattern fordifferences between countries in a state of war and those that are spared emerges clearly in figure 4.2where countries that have not been in a state of war throughout the period 8 are shown separately.Military expenditure in per cent of GDP for this group is stable and low, whereas the rate for the twocountries that have experienced a protracted war has risen sharply. This applies in particular toNicaragua which, according to the SIPRI Yearbook 1992, had a military burden of 34.2 per cent in1987. Even though Ethiopia never used such a high percentage, the trend is the same, with a sharp riseprior to the decline in the wake of peace.
8 Countries without war in the period are Botswana, Malawi, Tanzania, Zambia, Bangladesh and Nepal.
54

Avg.total
- -- Noarmedconflict
Ethiopia - Nica-ragua
Figur 4.2
35
30-
1980 1982 19164 1986 1988 1990 1992 I
Source: SIPRI (1992, 1995 and 1996).
•Ethiopia
250-
8 200-
a)
d.xal 150-
0
a)100-
•Sri Lanka
•South Africa
•
Pakistan
•
Mozambique
50- Botswana GuatemalasZimbabwe
* India Bangladesh
* Zambia* Nepal
les 'III' Tanzania
•Nicaragua
* Namibia•
Malawi
If we look at the trend in the five-yearperiod, the figures indicate thatBotswana continues to increase itsmilitary spending in relative terms.Bangladesh and Nepal have alsorecorded a slight rise in their militaryburden, but the starting level here waslow. The other countries have eithershown a substantial fall in militaryexpenditure in per cent of GDP or had avirtually constant rate.
As will be seen in figures 4.3 and 4.4 9 ,there appears to be a certain patternwith regard to the size of militaryexpenditure in relation to socialexpenditure and the social indicators.The countries with the highest militaryexpenditure in relative terms also havehigh infant mortality. This particularlyapplies to three countries, Pakistan,Ethiopia and Mozambique, and thelatter two have experienced a
Figure 4.3 Military expenditure in per cent of social expenditure and infant mortality insixteen of Norway's main partner countries for development assistance
300-
0 0
4
12 14
16Infant mortality. Per cent
Source: IMF and World Bank.
9 The figures were obtained by using the information from the latest available year for all countries when this is possible.In other words, the figures have not been obtained for the same year for all countries. The figures cover 16 countries as it hasnot been possible to find information about expenditure on social sectors in Eritrea and Uganda in the sources I have evaluated.
55

30 40 g0 go 60 100 1110
Primary education rate. Per cent
020 120
Figure 4.4 Military expenditure in per cent of social expenditure and the primary educationrate for sixteen of Norway's main partner countries for development assistance
300
Ethiopia
250-
SPakistan
E8 200-
aD
cixa) 150-00
><(2) 100-2
50-
0
Mozambique
IndiaBangladesh
Tanzania Zambia BotswanaGuatemala •
Nepal ZimbabweNamibiaMalaw i
Nicaragua
Sri Lanka•
S
South Africa
Source: IMF and World Bank.
protracted war. With regard to the relationship between the primary education rate and militaryexpenditure in relation to social expenditure, it seems that countries with high relative militaryexpenditure have a low primary education rate. However, this picture is again dominated by the samethree countries as for infant mortality. One exception is South Africa, which in spite of high relativemilitary expenditure has rather low infant mortality and a very high primary education rate. This isprobably ascribable to the country's very special recent history. In the wake of the demise of theapartheid system, the transitional government has made considerable efforts to educate the blackmembers of the population, at the same time that too swift a reduction in defence might have adestabilizing effect. I would emphasize, however, that the figures are only meant to serve as anillustration. No statistical causal analysis has been carried out here, and the problems are so complexthat a greater number of explanatory variables is required. The indicators are also rough, and they donot capture the possibility that high government health and education expenditure can be distributedwithin each sector in a manner which favours costly hospitals and universities and gives little priorityto primary programmes. Nor has account been taken of private programmes, a factor which influencesthe situation particularly in South Africa, but also some of the other countries.
The conclusion of my study is that the data situation for military expenditure in Norway's mainpartner countries for development assistance has, with few exceptions, improved during the last fewyears. The figures indicate that for the majority of countries the defence sector is using anincreasingly smaller share of resources.
56

ReferencesBall, N. (1988): Security and Economy in the Third World, New Jersey: Princeton University Press.
Brzoska, M. (1981): The Reporting of Military Expenditures, Journal of Peace Research, 18,3, 261-275.
Cappelen, A.: Mosambiks Okonomi - utvikling og problemstillinger for politikken (Mozambique'seconomy - development and problems for policy). Unpublished.
Danish Ministry of Foreign Affairs (1995): Review and Appraisal of Danish Balance of PaymentsSupport to Mozambique. Unpublished.
Danish Ministry of Foreign Affairs (1994): Udviklingslandenes militwrudgifter - og perspektiver forat nedbringe disse" (Developing countries' military expenditure and the prospects for reducing them),Copenhagen: memorandum.
Deger, S. (1992): "Military Expenditure and Economic Development", Military Expenditure andEconomic Development, Washington D.C.: World Bank Discussion Paper 185.
Dunne, J.P. (1996): "Economic Effects of Military Expenditure in Developing Countries: A Survey",in N.P. Gleditsch, 0. Bjerkholt, A. Cappelen, R.P. Smith and J.P. Dunne (eds.): The Peace Dividend,Amsterdam: North Holland, 439-464.
IMF (1975 -94): Government Finance Statistics Yearbook, Washington D.C.
IMF (1993): International Financial Statistics, Washington D.C.
Indian Ministry of Finance (1987-91): Economic Survey, New Delhi, India: Controller ofPublications.
Knight, M., N. Loayza and D. Villanueva (1996): The Peace Dividend: Military Spending Cuts andEconomic Growth, IMF Staff Papers, 43: 1, 1-37.
Mogae, F. G., Minister of Finance and Development Planning (1990): Budget Speech, Gaborone,Botswana: Government Printer.
Norwegian Ministry of Foreign Affairs (1992): "Strateginotat om demokratistotte i bistandsarbeidet"(Strategy paper on support for democracy in development assistance), Oslo.
OECD (1993): "Military Expenditure in Developing Countries, Outcome of the Tokyo Conferenceson Military Expenditure November 4-6, 1992", Paris: Room Document.
Rolland, M. (1994): Militcerutgifter i utviklingsland. Metodeproblemer knyttet til waling avmilitcerutgifter i norske programland (Military expenditure in developing countries. Problems ofmethodology in the measurement of military expenditure in Norway's main partner countries fordevelopment assistance). Reports 94/26, Statistics Norway.
Rolland, M. (1996): Military Expenditure in Norway's main partner countries for developmentassistance. Documents 96/20, Statistics Norway.
57

Sen, S. (1992): "Military Expenditure Data for Developing Countries: Methods and Measurement",Military Expenditure and Economic Development, Washington D.C.: World Bank Discussion Paper185.
South African Department of Finance (1995): Budget review, Cape Town: The Ministry.
State Revenue Fund (1991-93): Estimate of Revenue and Expenditure for the Financial Year ending31 March, Windhoek, Republic of Namibia.
Stockholm International Peace Research Institute (1976-95): SIPRI Yearbook, Oxford: OxfordUniversity Press.
Summers, R. and Alan Heston (1988): A New Set of International Comparisons of Real Products andPrices for 130 Countries, 1950-85, Review of Income and Wealth, 34: 1, 1-25.
The International Institute for Strategic Studies (1976-96): The Military Balance, London. Brassey's.
UNESCO (1990, 1992, 1995): Statistical Yearbook, Paris: Publishing Division.
United Nations (1992): The Relationship between Disarmament and Development, Study Series 5,New York: Publishing Division.
United Nations (1975-89): Statistical Yearbook, New York: Publishing Division.
United Nations (1980-92): National Accounts Statistics: Main Aggregates and Detailed Tables I & II,New York: Publishing Division.
United States Arms Control and Disarmament Agency (1979, 1989, 1994): World MilitaryExpenditures and Arms Transfers, Washington D.C.: U.S. Government Printing Office.
Wijetunga, D.B. Prime Minister and Minister of Finance (1990): Budget Speech, Colombo, TheDemocratic Socialist Republic of Sri Lanka: Government Press.
World Bank (1994): Adjustment in Africa; Reforms, Results and the Road Ahead, Washington D.C.
World Bank (1985): World Bank Country Study: Argentina Economic Memorandum, WashingtonD.C.
World Bank (1981 - 1995): World Development Report, Washington D.C.
Zambian Ministry of Finance (1984-89, 1995): Estimates of Revenue and Expenditure, Lusaka,Zambia: Government Printer.
Zimbabwean Ministry of Finance (1987-89, 1993): Estimates of Expenditure for the Financial Yearending June 30, Harare, Zimbabwe: Government Printer.
58

Recent publications in the series Documents
95/10 P.J. Bjerve (1995): The Influence of RagnarFrisch on Macroeconomic Planning and Policy inNorway
96/1 D. Kolsrud (1996): Documentation of ComputerPrograms that Extend the SEEM Model andProvide a Link to the RAINS Model
96/2 E. Bowitz, V.S. Sasmitawidjaja and G. Sugiarto(1996): The Indonesian Economy and Emission ofCO2: An Analysis Based on the Environmental-Macroeconomic-Model MEMLI, 1990-2020
96/3 H.V. Smbro (1996): Use of GeographicalInformation Systems (GIS) in Statistics Norway
96/4 E. Berg (1996): Some Results from the Literatureon the Impact of Carbon Taxes on the PetroleumWealth
96/5 E.J. Flottum (1996): Norwegian NationalAccounts — Documentation of the Compilationand Methods Applied. I General Description. IIGDP From the Output Approach
96/6 E.J. FlOttum (1996): Norwegian NationalAccounts — Documentation of the Compilationand Methods Applied. III GDP by ExpenditureApproach. IV GDP by Income Approach
96/7 0. Bjerkholt, K.A. Brekke and R. Choudhury(1996): The Century Model - on the Long TermSustainability of the Saudi Arabian Economy
96/8 R. Choudhury (1996): The Century Model.Technical Documentation of Computer Programsand Procedures
96/9 R. Choudhury and K.A. Magnussen (1996): TheImplementation Model. Technical Documentationof Computer Programs and Procedures
96/10 R. Choudhury (1996): The Selection Model.Technical Documentation of Computer Programsand Procedures
96/11 R. Choudhury (1996): The 0M95 — An Oil Modelfor the Kingdom of Saudi Arabia. TechnicalDocumentation of Computer Programs andProcedures
96/12 K. Nyborg (1996): Environmental Valuation,Cost-Benefit Analysis and Policy Making: ASurvey
96/13 P.R. Johansen and K.A. Magnussen (1996): TheImplementation Model. A Macroeconomic Modelfor Saudi Arabia
96/14 A. Capplen and K. A. Magnussen (1996): TheSelection Model. A General Equilibrium Modelfor Saudi Arabia
96/15 P. Boug and L. Brubakk (1996): Impacts ofEconomic Integration on Energy Demand andCO2 emissions in Western Europe
96/16 J.K. Dagsvik (1996): Probabilistic Models forQualitative Choice Behavior: An Introduction
96/17 K.H. Alfsen and K.E. Rosendahl (1996):Economic Damage of Air Pollution
96/18 K.H. Alfsen (1996): Why Natural ResourceAccounting?
96/19 F. R. Aune, T. Bye, T.A. Johnsen and A. Katz(1996): NORMEN: A General Equilibrium Modelof the Nordic Countries Featuring a DetailedElectricity Block
96/20 M. Rolland (1996): Military Expenditure inNorway's Main Partner Countries forDevelopment Assistance
96/21 P.J. Bjerve (1996): Contributions of Ragnar Frischto National Accounting
96/22 N.M. StOlen (1996): Effects on Wages fromChanges in Pay-roll Taxes in Norway
96/23 0. Ljones (1996): Building Confidence inStatistics. Reliable Statistics in Market EconomyCountries
96/24 A. Kaurin, E. Vinju and L. Solheim (1996):Statistics on Waste and Recycling from Parts ofthe Public Sector
96/25 T. Bye and S. Kverndokk (1996): NordicNegotiations on CO2 Emissions Reduction. TheNorwegian Negotiation Team's Considerations.
96/26 L. Rogstad and M. Dysterud (1996): Land UseStatistics for Urban Agglomerations. Developmentof a Method Based on the Use of GeographicalInformation Systems (GIS) and AdministrativeRecords.
96/27 K. Rypdal (1996): NOSE — Nomenclature forSources of Emissions
97/1 T. C. Mykkelbost and K. Rypdal (1997): Materialflow analysis of Cadmium and di-2-etylhexylphthalate (DEHP) in Norway
97/2 S. Grepperud (1997): The Impact of Policy onFarm Conservation Incentives in Developingcountries: What can be Learned from Theory
97/3 M. Rolland (1996): Military Expenditure inNorway's Main Partner Countries forDevelopment Assistance. Revised and ExpandedVersion
59

r3 Returadresse:Statistisk sentralbyraPostboks 8131 Dep.N-0033 Oslo
Documents
Statistics NorwayP.O.B. 8131 Dep.N-0033 Oslo
Tel: +47-22 86 45 00Fax: +47-22 86 49 73
ISSN 0805-9411
Statistisk sentralbyrfi4110 Statistics Norway


![TTT TTTT TTTD TTTTT TTTT TTT - datrix.it · '$75,; tttt ttt tttt tttd ttttt tttt ttt ttttt ttdt tttt ttt 'dwd˛ ˘ 3dj ˛ 6l]h˛ t $9(˛ t 7ludwxud˛ 'liixvlrqh˛ ˇˇ ˝ /hwwrul˛](https://img.pdfslide.us/doc/110x75/5f41f4077d7bcc38d64069a0/ttt-tttt-tttd-ttttt-tttt-ttt-75-tttt-ttt-tttt-tttd-ttttt-tttt-ttt-ttttt-ttdt.jpg)