Embed Size (px)
Citation preview
DISTRICT SCHOOL BOARD OF MARTIN COUNTY, FLORIDA
Comprehensive Annual Financial Report
For the Fiscal Year Ended June 30, 2013
Prepared by the Finance Department

DISTRICT SCHOOL BOARD OF MARTIN COUNTY, FLORIDA Comprehensive Annual Financial Report For the Fiscal Year Ended June 30, 2013
TABLE OF CONTENTS
INTRODUCTORY SECTION
Letters of Transmittal ................................................................................................................... i-vi 2012-13 Fiscal Year Superintendent and School Board Members ................................................ vii List of Principal Officials-Appointed ........................................................................................... viii Organizational Chart ....................................................................................................................... ix GFOA Certificate of Achievement for Excellence in Financial Reporting ...................................... x ASBO Certificate of Excellence in Financial Reporting ................................................................. xi
FINANCIAL SECTION
Independent Auditor’s Report ..................................................................................................... 1-3 Management’s Discussion and Analysis .................................................................................... 5-16 Basic Financial Statements: Government-wide Financial Statements: Statement of Net Position ........................................................................................................ 19 Statement of Activities .................................................................................................... 20-21 Fund Financial Statements: Balance Sheet—Governmental Funds ............................................................................... 22-23 Reconciliation of the Balance Sheet of Governmental Funds to the Statement of Net Position .................................................................................................... 25 Statement of Revenues, Expenditures, and Changes In Fund Balances—Governmental Funds ....................................................................... 26-27 Reconciliation of the Statement of Revenues, Expenditures, and Changes In Fund Balances of Governmental Funds to the Statement of Activities ............................ 29 Statement of Revenues, Expenditures, and Changes in Fund Balances—Budget and Actual—General Fund, Other Federal Programs, And Federal Economic Stimulus Fund ........................................................................... 30-37 Statement of Fiduciary Net Position—Fiduciary Funds .......................................................... 39 Statement of Changes in Fiduciary Net Position—Fiduciary Funds ....................................... 40 Notes to the Basic Financial Statements ............................................................................... 41-72 Other Required Supplementary Information Schedule of Funding Progress—Early Retirement Plan .......................................................... 74 Schedule of Employer Contributions—Early Retirement Plan ............................................... 75 Schedule of Funding Progress— Other Postemployment Benefits Plan ................................. 77 Combining and Individual Fund Financial Statements and Schedules: Combining Balance Sheet—Nonmajor Governmental Funds ........................................... 82-83 Combining Statement of Revenues, Expenditures, and Changes In Fund Balances—Nonmajor Governmental Funds ...................................................... 84-85

Schedule of Revenues, Expenditures, and Changes In Fund Balances—Budget and Actual - Other Major and Nonmajor Governmental Funds .................................................................................................................................. 89-96 Fiduciary Funds: Combining Statement of Fiduciary Net Position—Private-Purpose Trust Funds....................... 98 Combining Statement of Changes in Fiduciary Net Position—Private-Purpose Trust Funds .... 99 Combining Statement of Changes in Assets and Liabilities—Agency Funds .......................... 100
STATISTICAL SECTION Table 1 Net Position by Component ........................................................................ 104-105 Table 2 Changes in Net Position—Government-wide ............................................. 106-107 Table 3 Fund Balances—Governmental Funds ....................................................... 108-109 Table 4 Changes in Fund Balances—Governmental Funds ..................................... 110-113 Table 5 Assessed and Estimated Actual Value of Taxable Property .............................. 114 Table 6 Property Tax Levies and Collections ................................................................. 115 Table 7 Direct and Overlapping Property Tax Rates ...................................................... 116 Table 8 Ratios of Outstanding Debt by Type .................................................................. 117 Table 9 Demographic and Economic Statistics ............................................................... 118 Table 10 Principal Property Taxpayers ............................................................................. 119 Table 11 District Employees ...................................................................................... 120-121 Table 12 Teacher Salaries ................................................................................................. 123 Table 13 School Building Information....................................................................... 124-131 Table 14 Principal Employers ........................................................................................... 132 Table 15 Operating Statistics ............................................................................................ 133 Table 16 Food Service Operating Data ...................................................................... 134-135
SINGLE AUDIT Federal Reports and Schedules………………………………………………………...……….139 Schedule of Expenditures of Federal Awards………………………..………………………140 Independent Auditor’s Report on Internal Control over Financial Reporting and on Compliance and Other Matters Based on an Audit of the Financial Statements Performed in Accordance with Governmental Auditing Standards………..………… 141-142 Independent Auditor’s Report on Compliance for Each Major Federal Program and Report on Internal Control over Compliance .. ......................... ………………………….……143-144 Schedule of Findings and Questioned Costs………………………………….……..…...145-146 Summary Schedule of Prior Audit Findings - Federal Awards…………………..…………...147 Exhibit A—Management’s Response……………… ...................................... …..…………...148

INTRODUCTORY SECTION

This page was intentionally left blank

THE SCHOOL BOARD OF MARTIN COUNTY, FLORIDA
500 East Ocean Blvd • Stuart, Florida 34994 • Telephone (772) 219-1200 EXT 30200 • Facsimile: (772) 219-1231
Laurie J. Gaylord, Superintendent School Board Members: Maura Barry-Sorenson • Michael Busha • Michael DiTerlizzi • Rebecca Negron • Marsha Powers
“An Equal Opportunity Agency”
December 11, 2013 Dear Chairman, School Board Members, and Citizens of Martin County: State law requires that all school districts publish after the close of each fiscal year, a complete set of financial statements presented in conformity with generally accepted accounting principles in the United States of America (“GAAP”), and audited in accordance with auditing standards generally accepted in the United States of America by a licensed certified public accountant. Pursuant to this requirement, we hereby issue the Comprehensive Annual Financial Report (“CAFR”) of the District School Board of Martin County, Florida (the “District”) for the fiscal year ended June 30, 2013. This report consists of management’s representations concerning the finances of the District. Consequently, management assumes full responsibility for the completeness and reliability of all of the information presented in this report. To provide a reasonable basis for making these representations, management has established a comprehensive internal control framework that is designed both to protect the District’s assets from loss, theft, or misuses and to compile sufficient reliable information for the preparation of the District’s financial statements in conformity with GAAP. Because the cost of internal controls should not outweigh their benefits, the District’s comprehensive framework of internal controls has been designed to provide reasonable, rather than absolute assurance that the financial statements will be free from material misstatement. As management, we assert that, to the best of our knowledge and belief, this financial report is complete and reliable in all material respects. The audit staff of the Auditor General, State of Florida, has audited the District’s financial statements. The goal of the independent audit is to provide reasonable assurance that the financial statements of the District for the fiscal year ended June 30, 2013, are free of material misstatement. The independent audit involved examining, on a test basis, evidence supporting the amounts and disclosures in the financial statements; assessing the accounting principles used and significant estimates made by management; and evaluating the overall financial statement presentation. The independent auditor concluded that there was a reasonable basis for rendering an unmodified opinion that the District’s financial statements for the fiscal year ended June 30, 2013, are fairly presented in conformity with GAAP. The independent auditor’s report is presented as the first component of the financial section of this report. The independent audit of the financial statements of the District was part of a broader, Federally mandated “Single Audit” designed to meet the special needs of the Federal grantor agencies. The District is required to undergo an annual single audit in conformity with the provisions of the Single Audit Act of 1996 and the United States Office of Management and Budget (OMB) Circular A-133, Audits of States, Local Governments, and Non-Profit Organizations. The standards governing the Single Audit engagement require the independent auditor to report not only on the fair presentation of the financial statements, but also on the audited government’s internal controls and compliance with legal requirements, with special emphasis on internal controls and legal requirements involving the administration of Federal awards.
ii
Information related to this single audit, including the Schedule of Expenditures of Federal Awards, findings and questioned costs, summary of prior audit findings, and the independent auditor’s reports on the system of internal control and on compliance with applicable requirements, are included in the single audit section. This report includes all funds of the District, The Martin County School Board Leasing Corporation, and The Hope Center for Autism Charter School, Inc., which comprises the reporting entity. The Martin County School Board Leasing Corporation was formed by the School Board to be the lessor in connection with financing the construction of the Dr. David L. Anderson Middle School and is included as a blended component unit. The Hope Center for Autism is a public school operating under a charter issued by the District’s governing board (the “Board”). The charter school is included as a discretely presented component unit. GAAP require that management provide a narrative introduction, overview, and analysis to accompany the basic financial statements in the form of Management’s Discussion and Analysis (MD&A). This letter of transmittal is designed to complement MD&A and should be read in conjunction with it. The District’s MD&A can be found immediately following the independent auditor’s report.
PROFILE OF THE GOVERNMENT
The District and the Board were created pursuant to Section 4, Article IX of the Constitution of the State of Florida. The District is an independent taxing and reporting entity managed, controlled, operated, administered, and supervised by the District officials in accordance with Chapter 1001, Florida Statutes. The Board consists of five elected officials responsible for the adoption of policies, which govern the operation of the District’s public schools. The elected Superintendent of Schools (“Superintendent”) is the executive officer of the Board and is responsible for the administration and management of the schools within the applicable parameters of Florida Statutes, State Board of Education Rules, and Board policies. The Superintendent has the specific responsibility for maintaining a uniform system of records and accounts in the District as prescribed by the State Board of Education. The geographic boundaries of the District are those of Martin County, Florida. During the 2012-13 fiscal year, the District operated 22 schools, including 12 elementary schools, 5 middle schools, 3 high schools, and 2 special schools. The District operates 2 specialized schools for special needs students and sponsors 1 charter school, the Hope Center for Autism, which is considered a component unit. The Board also awarded a charter to Indian River State College (“IRSC”) for the Clark Advanced Learning Center. The school is operated under the direction of IRSC and is not considered a component unit of the District. In the fiscal year 2012-13, the District provided general, special, vocational, and other education programs to 18,267 unweighted full-time equivalent students. The District receives the majority of its operating funds through a State funding formula that is intended to equalize funding received from the State and local property tax between districts within the State. Charter schools operating through a contract with the District are provided with their proportionate share of these funds, based upon the number of full-time equivalent students enrolled at the charter school.

iii
ECONOMIC CONDITION AND OUTLOOK
Martin County is part of the area known as the Treasure Coast along with St. Lucie and Indian River Counties. It is located on the East Central Coast of Florida. There are approximately 15,963 linear feet of public beaches in the county and 556 square miles of land. Martin County was established in 1925 and named for the then Governor of Florida, John Wellborn Martin. The County is largely agricultural with a major tourist sector. It is home to many winter citizens and has developed a pattern for slow but steady growth. The City of Stuart, (County Seat) is known as the “Sailfish Capital of the World” and as such, attracts many anglers visiting from all over the world. The student population increased from 17,964 in September 2012 to 18,267 in September 2013. Based on the October 2013 survey, the District will have no significant change in student population for fiscal year 2013-14. The District is included among the largest employers in the County along with Martin Health Systems and the Martin County Government.
MAJOR INITIATIVES The District has developed a master plan for all of its facilities and is in the process of remodeling and adding new buildings as designed in the future plans. The District is in the final phases of completing Murray Middle School, Chiller Addition and Waterline and South Fork High School, Building and Site Improvements. The District has ongoing construction for the Martin County High School, Phase III Replace Classroom. The District has planned facility maintenance, improvements, additions, and technology enhancements to be completed within the next five years.
ACCOMPLISHMENTS The District is dedicated to providing students with a quality education. Among the many educational tools administered by the District for teachers, parents, and students are:
Pinnacle - a secure, online grade book that provides parents with instant information on how their student is performing in school;
Alert Now - an outbound calling system capable of sending recorded community outreach, attendance, or emergency phone messages to thousands of students and staff members in just minutes in both English and Spanish;
Performance Matters - a software program that puts valuable student testing data right on teachers’ desktops to help them pinpoint the specific areas where an individual student may need extra attention in the classroom.
Safari Montage - a comprehensive platform for digital media distribution and visual instruction needs via a suite of integrated products, giving educators and administrators a single interface for accessing all visual resources;
iReady – A diagnostic and instructional product for teachers aligned with the Common Core State Standards.

iv
These tools, combined with the knowledge and dedication of the District’s teachers, administrators, and staff, have helped the District become one of the highest performing school districts in the state. Among the noted accomplishments:
The 2012-13 school year marked the sixth consecutive year the District has earned the “Academically High-Performing School District” designation from the Florida Department of Education.
In the 2012-13 school year, the District ranked 8th highest in the state for the total points earned on the Florida Comprehensive Assessment Test (FCAT).
2012-13 school year SAT and ACT scores were above state and national averages. FCAT Reading Scores for Martin County students in grades 7-10 are among the best in
the state. Martin County seventh graders ranked fifth highest among Florida’s 67 school districts; eighth grade students ranked sixth highest; ninth graders ranked third highest in the state; and tenth graders also ranked third highest in the state.
Martin County FCAT results exceeded the state averages in every grade level and subject. Several schools accomplished significant gains in math, reading, and science.
Martin County students exceeded the state averages on all End of Course Exams (EOC) , and:
o Algebra I: One hundred percent of all Martin County middle school students who took the Algebra I EOC passed the exam;
o Biology: The Martin County School District ranked seventh among the 67 school districts with 77 percent of students passing the Biology EOC;
o Geometry: Ninety-nine percent of all Martin County middle school students who took the Geometry EOC passed the exam;
o US History: This was the first time the US History EOC was administered and Martin County students exceeded the state average.
FINANCIAL PLANNING
Providing adequate facilities to all students is fundamental to maintaining an effective education system. It speaks to a range of standards, including safety, class size, and equity. The District’s school building ages range from 1932 to 2011. The District has a master facility plan to rebuild, remodel, and expand schools and sites, which shall take place over a number of years. Recruiting and retaining District teachers and other staff members is a high priority for the Board and the Superintendent. District employee benefits continue to lead much of the State as the Board offers an ample benefit and salary package in an effort to retain teachers throughout their career.
FINANCIAL POLICIES The District has a policy to operate in accordance with State law and has developed a long-range strategic plan (Plan). The Plan sets forth goals and objectives for progress in all areas of District operations and outlines steps to be taken for their achievement. As part of the strategic plan for the District, the School Board approves strategic goals and objectives to serve as a guide for planning on an annual basis in all areas of operations. The Board reviews the Plan annually with periodic progress reports made by staff. The Superintendent is responsible for keeping the Plan updated as needed.

v
The District has an investment policy in place for the investment of temporarily idle funds. The purpose of the policy is to outline the responsibility, authority, and general guidelines for the investment management of the District’s cash reserves and to ensure compliance with Florida Statutes. See related Notes to the Basic Financial Statements for more information on the investment policy.
BUDGETARY CONTROLS The annual budget serves as the basis for the District’s financial planning and control and the level of budgetary control is established at the function and object level. Project length financial plans are adopted for the capital project funds. Activities of all governmental fund types are included in the annual appropriated budget. Budgetary information is integrated into the accounting system and to facilitate budgetary control, budget balances are encumbered when purchase orders are issued. Appropriations lapse at year-end, and encumbrances are reappropriated as part of the subsequent year’s budget. In order to provide budgetary control for salaries, the District utilizes a centralized position control system. On October 15, 2013, the Board adopted a District staffing plan that establishes teaching positions based generally on student populations served. Additionally, support and administrative positions are created based upon established criteria.
RISK MANAGEMENT The District is exposed to a variety of accidental losses including destruction of assets and natural disasters among others. The District is a member of the South Central Educational Risk Management Program (SCERMP). SCERMP, having several school district members, has established a combined limited self-insurance program for property, general liability, auto liability, workers compensation, money and securities, employee fidelity and faithful performance, boiler and machinery, and other insurance as needed. See related Notes to the Basic Financial Statements for more information on the risk management activities.
REPORTING ACHIEVEMENT
Certificate of Achievement for Excellence in Financial Reporting (GFOA) - The Government Finance Officers Association of the United States and Canada (GFOA) awarded a Certificate of Achievement for Excellence in Financial Reporting to the District for its Comprehensive Annual Financial Report (CAFR) for the fiscal year ended June 30, 2012. This was the seventh consecutive year that the District has received this prestigious award. The Certificate is a national award, recognizing conformance with the highest standards for preparation of state and local government financial reports. In order to be awarded a Certificate of Achievement, a government unit must publish an easily readable and efficiently organized


vii
District School Board
of Martin County, Florida
2012-13 Fiscal Year Superintendent and School Board Members
Laurie J. Gaylord Superintendent
Michael Busha School Board Vice-Chair
District 1
Marsha Powers School Board Member
District 2
Rebecca Negron School Board Member
District 3
Maura Barry-Sorenson School Board Chair
District 4
Michael DiTerlizzi School Board Member
District 5

viii
District School Board
of Martin County, Florida
LIST OF PRINCIPAL OFFICIALS – APPOINTED
Henry A. Salzler Assistant Superintendent Xenobia Poitier-Anderson Executive Director of Human Resources and Staff Development Dr. Tracey Miller Executive Director for Instructional Services Helene DiBartolomeo Director of Finance Steven Weil Executive Director for Operations Services

ix

x

xi

FINANCIAL SECTION

This page was intentionally left blank

1
AUDITOR GENERAL STATE OF FLORIDA
G74 Claude Pepper Building 111 West Madison Street
Tallahassee, Florida 32399-1450
The President of the Senate, the Speaker of the
House of Representatives, and the
Legislative Auditing Committee
INDEPENDENT AUDITOR’S REPORT
Report on the Financial Statements
We have audited the accompanying financial statements of the governmental activities, the discretely presented
component unit, each major fund, and the aggregate remaining fund information of the Martin County District
School Board, as of and for the fiscal year ended June 30, 2013, which collectively comprise the District’s basic
financial statements as listed in the table of contents.
Management’s Responsibility for the Financial Statements
Management is responsible for the preparation and fair presentation of these financial statements in accordance with
accounting principles generally accepted in the United States of America; this includes the design, implementation,
and maintenance of internal control relevant to the preparation and fair presentation of financial statements that are
free from material misstatement, whether due to fraud or error.
Auditor’s Responsibility
Our responsibility is to express opinions on these financial statements based on our audit. We did not audit the
financial statements of the discretely presented component unit, as described in note 1 to the financial statements,
which represents 100 percent of the transactions and account balances of the discretely presented component unit
columns. Those financial statements were audited by other auditors whose report thereon has been furnished to us,
and our opinion, insofar as it relates to the discretely presented component unit, is based solely on the report of the
other auditors.
We conducted our audit in accordance with auditing standards generally accepted in the United States of America and
the standards applicable to financial audits contained in Government Auditing Standards, issued by the Comptroller
General of the United States. Those standards require that we plan and perform the audit to obtain reasonable
assurance about whether the financial statements are free of material misstatement.
An audit involves performing procedures to obtain audit evidence about the amounts and disclosures in the financial
statements. The procedures selected depend on the auditor’s judgment, including the assessment of the risks of
DAVID W. MARTIN, CPA
AUDITOR GENERAL
PHONE: 850-412-2722
FAX: 850-488-6975

2
material misstatement of the financial statements, whether due to fraud or error. In making those risk assessments,
the auditor considers internal control relevant to the entity’s preparation and fair presentation of the financial
statements in order to design audit procedures that are appropriate in the circumstances, but not for the purpose of
expressing an opinion on the effectiveness of the entity’s internal control. Accordingly, we express no such opinion.
An audit also includes evaluating the appropriateness of accounting policies used and the reasonableness of significant
accounting estimates made by management, as well as evaluating the overall presentation of the financial statements.
We believe that the audit evidence we have obtained is sufficient and appropriate to provide a basis for our audit
opinions.
Opinions
In our opinion, based on our audit and the report of the other auditors, the financial statements referred to above
present fairly, in all material respects, the respective financial position of the governmental activities, the discretely
presented component unit, each major fund, and the aggregate remaining fund information for the Martin County
District School Board as of June 30, 2013, and the respective changes in financial position, and the budgetary
comparison for the general fund and each major special revenue fund for the fiscal year then ended in accordance
with accounting principles generally accepted in the United States of America.
Other Matters
Required Supplementary Information
Accounting principles generally accepted in the United States of America require that MANAGEMENT’S
DISCUSSION AND ANALYSIS, SCHEDULE OF FUNDING PROGRESS – EARLY RETIREMENT
PLAN, SCHEDULE OF EMPLOYER CONTRIBUTIONS – EARLY RETIREMENT PLAN, and
SCHEDULE OF FUNDING PROGRESS - OTHER POSTEMPLOYMENT BENEFITS PLAN, as listed
in the table of contents, be presented to supplement the basic financial statements. Such information, although not a
required part of the basic financial statements, is required by the Governmental Accounting Standards Board who
considers it to be an essential part of financial reporting for placing the basic financial statements in an appropriate
operational, economic, or historical context. We have applied certain limited procedures to the required
supplementary information in accordance with auditing standards generally accepted in the United States of America,
which consisted of inquiries of management about the methods of preparing the information and comparing the
information for consistency with management’s responses to our inquiries, the basic financial statements, and other
knowledge we obtained during our audit of the basic financial statements. We do not express an opinion or provide
any assurance on the information because the limited procedures do not provide us with sufficient evidence to
express an opinion or provide any assurance.
Supplementary and Other Information
Our audit was conducted for the purpose of forming opinions on the financial statements that collectively comprise
the District’s basic financial statements. The combining and individual fund financial statements and schedules, and
the introductory and statistical sections, as listed in the table of contents, are presented for purposes of additional
analysis and are not a required part of the basic financial statements. Also, the accompanying SCHEDULE OF
EXPENDITURES OF FEDERAL AWARDS is presented for purposes of additional analysis as required by the
United States Office of Management and Budget (OMB) Circular A-133, Audits of States, Local Governments, and Non-
Profit Organizations, and is not a required part of the basic financial statements.
The combining and individual fund financial statements and schedules, and SCHEDULE OF EXPENDITURES
OF FEDERAL AWARDS, are the responsibility of management and were derived from and relate directly to the

3
underlying accounting and other records used to prepare the basic financial statements. Such information has been
subjected to the auditing procedures applied in the audit of the basic financial statements and certain additional
procedures, including comparing and reconciling such information directly to the underlying accounting and other
records used to prepare the basic financial statements or to the basic financial statements themselves, and other
additional procedures in accordance with auditing standards generally accepted in the United States of America. In
our opinion, the combining and individual fund financial statements and schedules, and SCHEDULE OF
EXPENDITURES OF FEDERAL AWARDS, are fairly stated in all material respects in relation to the basic
financial statements as a whole.
The introductory and statistical sections have not been subjected to the auditing procedures applied in the audit of the
basic financial statements and, accordingly, we do not express an opinion or provide any assurance on them.
Other Reporting Required by Government Auditing Standards
In accordance with Government Auditing Standards, we have also issued a report on our consideration of the Martin
County District School Board’s internal control over financial reporting and on our tests of its compliance with
certain provisions of laws, rules, regulations, contracts, and grant agreements and other matters included under the
heading INDEPENDENT AUDITOR’S REPORT ON INTERNAL CONTROL OVER FINANCIAL
REPORTING AND ON COMPLIANCE AND OTHER MATTERS BASED ON AN AUDIT OF THE
FINANCIAL STATEMENTS PERFORMED IN ACCORDANCE WITH GOVERNMENT AUDITING
STANDARDS. The purpose of that report is to describe the scope of our testing of internal control over financial
reporting and compliance and the results of that testing, and not to provide an opinion on internal control over
financial reporting or on compliance. That report is an integral part of an audit performed in accordance with
Government Auditing Standards in considering the District’s internal control over financial reporting and compliance.
Respectfully submitted,
David W. Martin, CPA
Tallahassee, Florida
December 11, 2013
Audit Report No. 2014-059

This page was intentionally left blank
4

MANAGEMENT’S DISCUSSION AND ANALYSIS The management of the District School Board of Martin County has prepared the following discussion and analysis of financial activities for the fiscal year ended June 30, 2013. The intent of this discussion and analysis is to assist the reader in focusing on significant financial issues, provide an overview and analysis of the District’s financial activities, identify changes in the District’s financial position, identify material deviations from the approved budget, and highlight significant issues in individual funds. Because the information contained in the Management’s Discussion and Analysis (MD&A) is to highlight significant transactions, events, and conditions, it should be considered in conjunction with the District’s financial statements and notes to the basic financial statements found on pages 19 through 72. OVERVIEW OF THE FINANCIAL STATEMENTS This discussion and analysis is intended to serve as an introduction to the District’s basic financial statements. The District’s basic financial statements consist of three components:
1. Government-wide financial statements 2. Fund financial statements 3. Notes to the basic financial statements
This report also contains supplementary information intended to furnish additional details to support the basic financial statements. Government-wide Financial Statements The government-wide financial statements are designed to provide readers with a broad overview of the District’s finances in a manner similar to those of a private-sector business and consist of the following two statements:
The statement of net position presents information on most of the District’s assets and liabilities, with the difference between the two reported as net position. Over time, increases or decreases in net position may serve as a useful indicator of whether the financial position of the District is strengthening or weakening.
The statement of activities presents information showing how the government’s
net position changed during the 2012-13 fiscal year. All changes in net position are reported as soon as the underlying event giving rise to the change occurs, regardless of the timing of related cash flows. Thus, revenues and expenses are reported in this statement for some items that will only result in cash flows in future fiscal periods (e.g., earned but unused vacation leave).
The statement of activities presents functions of the District that are principally supported by taxes and intergovernmental revenues (governmental activities). The governmental
5

activities of the District include educational programs (basic, vocational, adult, and exceptional education), and school support functions such as transportation, facilities, and administration. The government-wide financial statements include not only the District itself (known as the primary government), but also the Hope Center for Autism, Inc., charter school. Although a legally separate organization, the component unit is included in this report because it meets the criteria for inclusion provided by generally accepted accounting principles. Financial information, for the component unit, is reported separately from the financial information presented for the primary government. The government-wide financial statements may be found on pages 19-21 of this report. Fund Financial Statements Fund financial statements are one of the components of the basic financial statements. A fund is a grouping of related accounts that are used to maintain control over resources that have been segregated for specific activities or objectives. The District uses fund accounting to ensure and demonstrate compliance with finance-related legal requirements and prudent fiscal management. Certain funds are established by law while others are created by legal agreements, such as bond covenants. Fund financial statements provide detailed information about the District’s financial activities, focusing on its most significant or “major” funds rather than fund types. This is in contrast to the entity-wide perspective contained in the government-wide statements. All of the District’s funds may be classified within one of two broad categories: governmental funds or fiduciary funds. Governmental Funds Governmental funds are used to account for essentially the same functions reported as governmental activities in the government-wide financial statements; however, the governmental funds utilize a spendable financial resources measurement focus rather than the economic resources measurement focus found in the government-wide financial statements. The financial resources measurement focus allows the governmental fund statements to provide information on near-term inflows and outflows of spendable resources, as well as balances of spendable resources available at the end of the fiscal year. Such information may be useful in evaluating the District’s near-term financing requirements. Because the focus of governmental funds is narrower than that of the government-wide financial statements, it is useful to compare the information presented for the governmental funds with similar information presented for governmental activities in the government-wide financial statements. By doing so, readers may better understand the long-term impact of the government’s near-term financing decisions. Both the governmental fund balance sheet and the governmental fund statement of revenues, expenditures, and changes in fund balances provide a reconciliation to facilitate this comparison between governmental funds and governmental activities. The governmental funds balance sheet and statement of revenues, expenditures, and changes in fund
6

balances provide detailed information about the District’s most significant funds. The District’s major funds are the General, Special Revenue - Other Federal Programs, Special Revenue - Federal Economic Stimulus, and Capital Projects - Local Capital Improvement Tax Funds. Data from the other seven governmental funds is combined into a single, aggregated presentation. Individual fund data for each of these non-major governmental funds is provided in the form of combining statements in the supplementary information section of this report. The District adopts annual budgets for its General, Special Revenue - Other Federal Programs, and Special Revenue - Federal Economic Stimulus Funds. Budgetary to actual comparisons have been provided for these funds to demonstrate budgetary compliance. The basic governmental funds financial statements can be found on pages 22-37 of this report. Fiduciary Funds Fiduciary funds are used to report assets held in a trustee or fiduciary capacity for the benefit of external parties, such as student activity funds. Fiduciary funds are not reflected in the government-wide statements because the resources of those funds are not available to support the District’s own programs. In its fiduciary capacity, the District is responsible for ensuring that the assets reported in these funds are used only for their intended purposes. The District reports the following fiduciary fund types: Pension Trust Fund – to account for resources used to finance the early retirement
program. Private-Purpose Trust Funds – to account for resources of various scholarship
trust funds. Agency Funds – to account for resources held for student activities and groups.
The basic fiduciary fund financial statements can be found on pages 39-40 of this report. Notes to the Basic Financial Statements The notes provide additional information that is essential for a full understanding of the data provided in the government-wide and fund financial statements. The notes to the basic financial statements can be found on pages 41-72 of this report. Other Information Combining statements referred to earlier, present a more detailed view of nonmajor funds used in governmental funds. This section includes budget to actual schedules for nonmajor special revenue, debt service, and capital projects funds. Also included are statements for agency funds. Combining and individual fund schedules can be found on pages 82-100. Additional information about the District that may be of interest to the reader is found under the Statistical section on pages 104-135 of this report.
7

FINANCIAL HIGHLIGHTS Key financial highlights for the 2012-13 fiscal year are as follows: Government-wide Statements The District’s assets exceed its liabilities at June 30, 2013, by $285 million (net
position). The District’s total net position decreased by $15.8 million, which represents a
5.2 percent decrease from the 2011-12 fiscal year. General revenues total $170.4 million, or 93.0 percent of all revenues. Program
specific revenues in the form of charges for services, operating grants and contributions, and capital grants and contributions total $12.9 million, or 7.0 percent of all revenues.
Expenses total $199.1 million; $12.9 million of these expenses are offset by
program specific charges, with the remainder paid from general revenues. Total expenses exceed total revenues by $15.8 million.
Fund Statements At June 30, 2013, the District’s governmental funds report combined ending fund
balances of $29.8 million, a decrease of $6.4 million from the prior fiscal year. At June 30, 2013, assigned and unassigned fund balance of the General Fund,
representing the net current financial resources available for general appropriations by the Board, totals $3.3 million or 2.5 percent of total General Fund revenues.
8

GOVERNMENT-WIDE FINANCIAL ANALYSIS The following is a summary of the District’s net position as of June 30, 2013, compared to the net position as of June 30, 2012:
Percent Change
2013 2012Current and other assets 39,734,277$ 47,061,595$ -15.6%Capital assets 373,271,475 376,202,540 -0.8%
Total assets 413,005,752 423,264,135 -2.4%
Other liabilities 8,449,696 7,072,691 19.5%Long-term liabilities 119,321,455 115,186,040 3.6%
Total liabilities 127,771,151 122,258,731 4.5%
Net position:Net investment in capital assets 327,870,571 328,366,440 -0.2%Restricted 25,931,065 30,311,138 -14.5%Unrestricted Deficit (68,567,035) (57,672,174) 18.9%
Total net position 285,234,601$ 301,005,404$ -5.2%
Governmental Activities
District School Board of Martin County, FloridaNet Position
The largest portion of the District’s net position ($327.9 million) reflects its investment in capital assets (e.g., land, buildings, furniture, fixtures, and equipment) less any related outstanding debt used to acquire those assets. The District uses these capital assets to provide services to students; consequently, these assets are not available for future spending. Although the District’s investment in its capital assets are reported net of related debt, it should be noted that the resources needed to repay this debt must be provided from other sources, since the capital assets themselves cannot be used to liquidate liabilities. An additional portion of the District’s net position, $25.9 million, represents resources that are subject to external restrictions on how they may be used. The remaining balance of net assets is unrestricted net assets $5.4 million - after exclusion of $13.9 million in compensated absences payable and $60.1 million in other postemployment benefits obligations. The District’s unrestricted net assets balance is negative because of the District’s future liabilities for employee compensated absences and other postemployment benefits; however, the District has sufficient current assets to meet its current obligations. Restricted net position has decreased $4.4 million from June 30, 2012, to June 30, 2013. This net position represents restrictions from specific revenue sources and grants. The deficit in unrestricted net position in the governmental type activities has increased by $10.9 million, primarily due to the recognition and presentation of other postemployment benefit liability obligations of the District.
9

The key elements of the changes in the District’s net position for the fiscal years ended June 30, 2013, and June 30, 2012 are as follows:
Percent2013 2012 Change
RevenuesProgram revenues:
Charges for services 5,855,734$ 6,003,286$ -2.5%Operating grants and contributions 5,385,431 4,830,648 11.5%Capital grants and contributions 1,650,204 1,994,232 -17.3%Total Program revenues 12,891,369 12,828,166 0.5%
General revenues:Property taxes, levied for operational purposes 93,749,587 89,175,396 5.1%Property taxes, levied for capital purposes 26,034,115 26,224,667 -0.7%Grants and contributions not restricted to specific prog. 45,816,980 45,362,980 1.0%Other 4,836,979 2,899,401 66.8%Total General revenues 170,437,661 163,662,444 4.1%
Total revenues 183,329,030 176,490,610 3.9%
ExpensesInstruction 94,230,526 96,030,312 -1.9%Pupil personnel services 9,835,181 9,903,132 -0.7%Instructional media services 2,209,088 2,213,015 -0.2%Instructional and curriculum development services 3,615,999 3,711,583 -2.6%Instructional staff training services 2,365,365 2,895,164 -18.3%Instruction related technology 1,655,201 1,741,333 -4.9%School board 902,968 729,644 23.8%General administration 659,120 729,721 -9.7%School administration 9,598,008 10,316,230 -7.0%Facilities services 29,581,334 26,041,389 13.6%Fiscal services 908,486 1,066,902 -14.8%Food services 7,678,953 7,170,203 7.1%Central services 5,086,568 4,822,277 5.5%Pupil transportation services 6,593,395 6,468,443 1.9%Operation of plant 14,098,913 13,838,429 1.9%Maintenance of plant 4,438,963 4,373,070 1.5%Administrative technology services 614,590 563,865 9.0%Community services 2,931,948 2,740,540 7.0%Unallocated interest on long-term debt 2,095,227 2,203,833 -4.9%
Total expenses 199,099,833 197,559,085 0.8%
Change in net position (15,770,803) (21,068,475) Net position - beginning 301,005,404 322,073,879 Net position - ending 285,234,601$ 301,005,404$ -5.2%
District School Board of Martin County, Florida
Governmental Activities
Changes in Net Position
10

Major changes in revenues were caused by the following:
Capital Grants – Decreased by 17.3 percent due to a decrease in State capital outlay appropriations.
Property taxes levied for operational purposes - Increased $4.6 million due to the
increase in assessed property value and millage levy.
Other – Increased by 66.8 percent, primarily due to an increase in recovery of insurance losses.
Major changes in expenses were caused by the following: School Board – Increased by $0.2 million or 23.8 percent due to settlement payouts
for personnel. Central Services – Increased by $0.3 million or 5.5 percent, due primarily to the
increase in the Board’s contribution for retiree health insurance.
Charges for Services3%
Operating Grants & Contributions
3%
Capital Grants & Contributions
1%
Property Taxes65%
Grants & Contributions Not Restricted to Specific
Programs25%
Other3%
Revenues by Source - Governmental Activities
11

FUND FINANCIAL ANALYSIS
The District uses fund accounting to ensure and demonstrate compliance with finance-related legal requirements. Major Governmental Funds The focus of the District’s governmental funds is to provide information on near-term inflows, outflows, and balances of spendable resources. Such information is useful when assessing the District’s financing requirements. For example, unassigned fund balance may serve as a useful measure of the District’s resources available to finance future contracts or services.
2013 2012Fund balance:
Nonspendable 941,030$ 600,559$ Restricted 25,583,236 30,245,201 Assigned 97,986 6,545 Unassigned 3,177,357 5,372,118
Total fund balance 29,799,609$ 36,224,423$
District School Board of Martin County, FloridaFund Balance
As of the end of the 2012-13 fiscal year, the District’s governmental funds reported combined ending fund balances of $29.8 million, a decrease of $6.4 million in comparison with the prior fiscal year. Major Funds The General, Special Revenue - Other Federal Programs, Special Revenue - Federal Economic Stimulus, and Capital Projects - Local Capital Improvement Tax Funds were reported as major funds. The General Fund is the chief operating fund of the District. The General Fund has a decrease in fund balance of $2.2 million, primarily due to raises and increased employee benefits and a reduction of the capital transfer from the Local Capital Improvement Fund. The total fund balance is $4.9 million, of which $3.2 million is unassigned. As a measure of the General Fund’s liquidity, it may be useful to compare both unassigned fund balance and total fund balance to total fund revenues. Unassigned fund balance represents 2.5 percent of total General Fund operating revenue, while total fund balance represents 3.7 percent of that same amount. The Special Revenue – Other Federal Programs Fund accounts for the financial resources of certain Federal grant programs. Revenues and expenditures totaled $10.6 million each, a 4.6 percent decrease from 2011-12 fiscal year, primarily due to decreases in
12

program awards. Because revenues are recognized to the extent of allowable expenditures, this fund does not generally accumulate fund balance. The Special Revenue – Federal Economic Stimulus Fund have total revenues and expenditures of $0.3 million each, and the funding was mainly used for Race-to-the-Top grant activities. Because revenues are recognized to the extent of allowable expenditures, this fund does not generally accumulate fund balance. Overall revenues and expenditures decreased in the fiscal year as ARRA programs expired. The Capital Projects - Local Capital Improvement Tax Fund has a decrease in fund balance of $4.9 million to a total fund balance of $19.8 million, which is restricted for acquisition, construction, and maintenance of capital assets. The decrease is primarily due to the continued construction of projects and a decrease in capital millage levy proceeds. It should be noted that several projects are currently under construction, and $9.2 million has been encumbered for specific projects. Nonmajor Funds The fund balance increased by $0.6 million, or 14 percent, primarily caused by the increase in the Food Service Fund. Nonmajor governmental funds consist of debt service and capital projects funds. The total fund balance of $5.0 million is restricted to be expended on specific programs.
13

GENERAL FUND BUDGETARY HIGHLIGHTS
During the course of the 2012-13 fiscal year, the District amended its General Fund budget several times. Budget revisions were due primarily to workforce reductions due to attrition, termination payouts, and corresponding adjustments to planned expenditures to ensure maintenance of an adequate fund balance and compliance with State-mandated class-size reduction. Final budgeted revenues and expenditures were in line with original budgeted amounts. A final budget amendment was approved at year-end to amend the budget to actual revenues and expenditures. The Board is authorized by State statute to make budget amendments up to the date that the District’s Annual Financial Report is approved. The District typically elects to amend its budget to actual at that time to ensure that all expenditures adjustments are covered by the budget amendments. A General Fund budgetary comparison statement can be found in the Financial Section, pages 30-33. CAPITAL ASSETS AND DEBT ADMINISTRATION Capital Assets The District’s investment in capital assets as of June 30, 2013, is $373.3 million (net of accumulated depreciation). The investment in capital assets includes land; construction in progress; improvements other than buildings; buildings and fixed equipment; furniture, fixtures, and equipment; motor vehicles; property under capital lease; and audio visual materials and computer software. The District experienced an overall decrease in net investment in capital assets from the previous fiscal year of .8 percent. Major capital assets events during the 2012-2013 fiscal year include: Major construction in progress at June 30, 2013, includes the amount completed
to date for architectural work and construction costs associated with Martin County High School – Phase III – Replace Classrooms
Projects in final phase of completion, awaiting the completion of a punch list:
o Murray Middle School – Chiller Addition and Waterline o South Fork High School – Building and Site Improvements
14

2013 2012Percent Change
Land 10,354,648$ 10,354,648$ 0.0%Construction in progress 11,293,085 21,662,247 -47.9%Improvements other than buildings 11,828,090 8,309,940 42.3%Buildings and fixed equipment 330,082,002 325,409,714 1.4%Furniture, fixtures, and equipment 5,769,406 5,712,642 1.0%Motor vehicles 2,741,002 3,222,918 -15.0%Property under capital leases 497,621 704,255 -29.3%Audio visual materials & computer software 705,621 826,176 -14.6%
Total Capital Assets (Net of Depreciation) 373,271,475$ 376,202,540$ -0.8%
District School Board of Martin County, FloridaCapital Assets
(net of depreciation)
As shown on the above table, construction in progress has decreased. This is due to the decrease in the number of construction projects of the District, as compared to the number of projects that have been completed by the District. Additional information on the District’s capital assets can be found in Notes VI and X(C) of this report. Long-Term Debt At June 30, 2013, the District has total long-term debt outstanding of $45.4 million, comprised of Certificates of Participation (COPS) Series 2005A, State Board of Education (SBE) Bonds, and capital leases.
2013 2012
COPS 34,360,000$ 35,530,000$ State School (SBE) Bonds Payable 10,580,000 13,165,000 Obligations under Capital Leases 460,904 646,100
45,400,904$ 49,341,100$
District School Board of Martin County, FloridaOutstanding Debt
The District’s outstanding debt decreased $3.9 million during 2012-13 fiscal year. The decrease was primarily due to scheduled principal retirements. Additional information on the District’s debt may be found in Note VII of this report.
15

ECONOMIC FACTORS AND NEXT YEAR’S BUDGETS AND RATES Local property taxes are the District’s primary source of revenue. The required local effort (RLE) for the 2013-14 fiscal year is projected to be 5.026 mills (an increase of .37 mills), the discretionary millage is projected to be .748 mills, and the capital outlay millage is projected to be 1.50 mills. General Fund revenues and other financing sources are projected to be at $148.5 million, and expenditures are expected to be $148.7 million. Approximately 95 percent of total General Fund revenues are from the State of Florida and local taxes; therefore, economic condition at the national, state, and local levels will affect the general operating funds and activities of the District. Changes in levels of tourism, immigration into the State of Florida, and unemployment may affect the State revenue streams, which in turn, will affect District revenue streams.
The unemployment rate for Martin County is currently 7.8 percent, which is a decrease from the rate of 9.8 percent a year ago.
Student enrollment increased from 17,964 in September 2012 to 18,267 in September 2013.
The County population increased for the 2012-13 fiscal year from 147,203 to 148,077.
REQUESTS FOR INFORMATION
This financial report is designed to provide users with a general overview of the District’s finances. Questions concerning any of the information provided in this report or requests for additional financial information should be addressed to Martin County School Board, Finance Department, 500 East Ocean Boulevard, Stuart, FL 34994. Additional financial information can be found on our web site http://www.martinschools.org/pages/Martin_County_School_District/General_Info/Department_Groups/Finance. .
16

BASIC FINANCIAL STATEMENTS
17

This page was intentionally left blank
18

PrimaryGovernment
Governmental ComponentActivities Unit
AssetsUnrestricted:
Cash and cash equivalents 33,447,964$ 291,933$ Investments 1,128,039 - Accounts receivable 1,493,155 746 Deposits - 1,488 Due from other governmental agencies 1,550,113 - Inventories 580,968 -
Prepaid items 229,578 9,678 Restricted:
Equity in property and casualty group 1,304,460 -
Capital assets not being depreciated:Land 10,354,648 301,520 Construction in progress 11,293,085 -
Capital assets net of accumulated depreciation:Improvements other than buildings 11,828,090 2,735 Buildings and fixed equipment 330,082,002 - Leasehold Improvements - 46,292 Furniture, fixtures, and equipment 5,769,406 5,816 Motor vehicles 2,741,002 - Property under capital lease 497,621 - Audio visual materials and computer software 705,621 -
Total assets 413,005,752$ 660,208$
LiabilitiesSalaries and benefits payable 6,063,470 5,502 Accounts payable 1,731,633 2,276 Construction contracts payable - retainage 414,447 - Unearned revenue 240,146 - Long-term liabilities:
Portion due in one year:Notes payble - 10,659 Obligations under capital lease 194,671 - Bonds payable 935,000 - Certificates of participation payable 1,215,000 - Compensated absences payable 2,071,833 -
Portion due in more than one year:Notes payble - 222,251 Obligations under capital lease 266,233 - Bonds payable 9,645,000 - Certificates of participation payable 33,145,000 - Compensated absences payable 11,792,604 - Other postemployment benefits obligation 60,056,114 -
Total liabilities 127,771,151 240,688
Net positionNet investment in capital assets 327,870,571 123,453 Restricted for:
State required carryover programs 1,077,255 - Capital projects 21,472,268 57,651 Debt service 266,278 - Food service 3,043,525 - Other 71,739 -
Unrestricted net position (deficit) (68,567,035) 238,416 Total net position 285,234,601$ 419,520$
The accompanying notes are an integral part of the basic financial statements.
DISTRICT SCHOOL BOARD OF MARTIN COUNTY, FLORIDAStatement of Net PositionJune 30, 2013
19

Operating CapitalCharges for Grants and Grants and
Functions/Programs Expenses Services Contributions ContributionsPrimary government:Governmental activities:
Instruction 94,230,526$ 434,820$ -$ -$ Pupil personnel services 9,835,181 - - - Instructional media services 2,209,088 - - - Instruction and curriculum development services 3,615,999 - - - Instructional staff training services 2,365,365 - - - Instruction related technology 1,655,201 - - - School board 902,968 - - - General administration 659,120 - - - School administration 9,598,008 - - - Facilities services 29,581,334 - - 224,379 Fiscal services 908,486 - - - Food services 7,678,953 2,573,283 5,385,431 - Central services 5,086,568 - - - Pupil transportation services 6,593,395 - - - Operation of plant 14,098,913 - - - Maintenance of plant 4,438,963 - - - Administrative technology services 614,590 - - - Community services 2,931,948 2,847,631 - - Unallocated interest on long-term debt 2,095,227 - - 1,425,825
Total primary government 199,099,833$ 5,855,734$ 5,385,431$ 1,650,204$
Component unit:Hope Center for Autism, Inc. 952,840$ 27,994$ -$ 8,584$
General revenues:Taxes:
Property taxes, levied for operational purposesProperty taxes, levied for capital purposes
Grants and contributions not restricted to specific programsUnrestricted investment earningsMiscellaneous Total general revenues Change in net position
Total net position - beginningTotal net position - ending
The accompanying notes are an integral part of the basic financial statements.
DISTRICT SCHOOL BOARD OF MARTIN COUNTY, FLORIDAStatement of ActivitiesFor the Fiscal Year Ended June 30, 2013
Program Revenues
20

Primary GovernmentGovernmental Component
Activities Unit
(93,795,706)$ -$ (9,835,181) - (2,209,088) - (3,615,999) - (2,365,365) - (1,655,201) -
(902,968) - (659,120) -
(9,598,008) - (29,356,955) -
(908,486) - 279,761 -
(5,086,568) - (6,593,395) -
(14,098,913) - (4,438,963) -
(614,590) - (84,317) -
(669,402) - (186,208,464)$ -$
-$ (916,262)$
93,749,587 - 26,034,115 - 45,816,980 938,208
387,295 120 4,449,684 -
170,437,661 938,328 (15,770,803) 22,066 301,005,404 397,454 285,234,601$ 419,520$
Net (Expense) Revenue andChanges in Net Position
21

Special Revenue - Special Revenue -Other Federal Federal
General Programs EcomomicFund Fund Stimulus Fund
AssetsCash and cash equivalents 10,566,346$ -$ -$ Investments 121,802 - - Accounts receivable 622,610 10,217 245 Due from other governmental agencies - 988,437 89,346 Inventories 422,333 - - Prepaid items 49,066 - -
Total assets 11,782,157$ 998,654$ 89,591$
Liabilities and fund balancesLiabilities:
Temporary negative cash -$ 906,438$ 77,604$ Salaries and benefits payable 5,990,418 50,402 2,597 Accounts payable 700,328 41,814 9,390 Constructions contracts payable - retainage - - - Unearned revenue 145,612 - -
Total liabilities 6,836,358 998,654 89,591
Fund balances:Nonspendable 593,201 - - Restricted 1,077,255 - - Assigned 97,986 - - Unassigned 3,177,357 - -
Total fund balances 4,945,799 - -
Total liabilities and fund balances 11,782,157$ 998,654$ 89,591$
The accompanying notes are an integral part of the basic financial statements.
DISTRICT SCHOOL BOARD OF MARTIN COUNTY, FLORIDABalance SheetGovernmental FundsJune 30, 2013
22

Capital Projects - Local Capital Nonmajor TotalImprovement Governmental Governmental
Tax Fund Funds Funds
20,076,626$ 3,789,034$ 34,432,006$ 553,876 452,361 1,128,039
4,674 855,409 1,493,155 417,979 54,351 1,550,113
- 158,635 580,968 - - 49,066
21,053,155$ 5,309,790$ 39,233,347$
-$ -$ 984,042$ - 20,053 6,063,470
810,500 169,601 1,731,633 414,447 - 414,447
- 94,534 240,146 1,224,947 284,188 9,433,738
553,876 347,829 1,494,906
19,274,332 4,677,773 25,029,360 - - 97,986 - - 3,177,357
19,828,208 5,025,602 29,799,609
21,053,155$ 5,309,790$ 39,233,347$
23

This page was intentionally left blank
24

29,799,609$
Capital assets not being depreciated 21,647,733$ Capital assets being depreciated 351,623,742
373,271,475
1,304,460
180,512
Obligations under capital lease (460,904)$ Bonds payable (10,580,000) Certificates of participation Series 2005A (34,360,000) Compensated absences payable (13,864,437) Other postemployment benefits obligation (60,056,114)
(119,321,455)
285,234,601$
The accompanying notes are an integral part of the basic financial statements.
Total Net Position - Governmental Activities
Amounts reported for governmental activities in the statement of net position are different because:
Long-term liabilities are not due and payable in the current period and, therefore, are notreported as liabilities in the governmental funds. Long-term liabilities at year-end consistof:
Contributions to the early retirement programs in excess of actuarial required contributionsare recognized as a prepaid expense in the government-wide statements, but are not reportedas assets in the governmental funds.
The District's portion of the equity held in the risk management consortium is not reportedas an asset of the governmental funds.
Capital assets, net of accumulated depreciation, used in governmental activities are notfinancial resources and, therefore, are not reported as assets in governmental funds.
DISTRICT SCHOOL BOARD OF MARTIN COUNTY, FLORIDAReconciliation of the Balance Sheet of Governmental Funds to the Statement of Net PositionJune 30, 2013
Total fund balances - governmental funds
25

Special Revenue - Special Revenue -Other Federal Federal
General Programs EcomomicFund Fund Stimulus Fund
RevenuesFederal direct 452,898$ 1,901,223$ -$ Federal through state and local 960,648 8,660,907 360,951 State 33,381,110 - - Local:
Taxes 93,749,587 - - Charges for services - food services - - - Impact fees - - - Miscellaneous 5,023,805 - -
Total revenues 133,568,048 10,562,130 360,951
ExpendituresCurrent:
Instruction 84,886,775 3,767,166 39,254 Pupil personnel services 6,536,789 2,849,566 - Instructional media services 2,095,209 16,253 - Instruction and curriculum development services 1,882,801 1,381,658 216,095 Instructional staff training services 240,177 2,000,647 34,411 Instruction related technology 1,473,490 - 63,691 School board 869,548 - - General administration 728,911 387,456 - School administration 8,972,904 - - Facilities services 979,357 - - Fiscal services 844,077 - - Food services - 488 - Central services 4,695,849 - - Pupil transportation services 6,279,089 84,967 - Operation of plant 13,520,162 50,492 - Maintenance of plant 4,290,026 - - Administrative technology services 589,731 - - Community services 2,760,649 1,585 -
Capital outlay:Facilities acquisition and construction - - - Other capital outlay 34,387 21,852 7,500
Debt service:Principal - - - Interest and fees - - - Paying agent fees - - -
Total expenditures 141,679,931 10,562,130 360,951
Excess (deficiency) of revenues over (under) expenditures (8,111,883) - -
Other financing sources (uses)Insurance loss recoveries - - - Transfers in 6,260,089 - - Transfers out (316,984) - -
Total other financing sources (uses) 5,943,105 - -
Net change in fund balances (2,168,778) - -
Fund balances - beginning 7,114,577 - -
Fund balances - ending 4,945,799$ -$ -$
The accompanying notes are an integral part of the basic financial statements.
DISTRICT SCHOOL BOARD OF MARTIN COUNTY, FLORIDAStatement of Revenues, Expenditures, and Changes in Fund BalancesGovernmental FundsFor the Fiscal Year Ended June 30, 2013
26

Capital Projects -Local Capital Nonmajor TotalImprovement Governmental Governmental
Tax Fund Funds Funds
-$ -$ 2,354,121$ - 5,223,047 15,205,553 - 1,832,218 35,213,328
26,034,115 - 119,783,702 - 2,573,283 2,573,283 - 1,752,609 1,752,609
479,100 15,501 5,518,406 26,513,215 11,396,658 182,401,002
- 503 88,693,698 - - 9,386,355 - - 2,111,462 - - 3,480,554 - - 2,275,235 - - 1,537,181 - - 869,548 - - 1,116,367 - - 8,972,904
8,679,693 94,689 9,753,739 - - 844,077 - 7,305,960 7,306,448 - - 4,695,849 - - 6,364,056 - - 13,570,654 - - 4,290,026 - - 589,731 - - 2,762,234
13,532,818 215,518 13,748,336 3,162,379 72,625 3,298,743
185,196 2,085,000 2,270,196 28,099 2,080,690 2,108,789
- 14,537 14,537 25,588,185 11,869,522 190,060,719
925,030 (472,864) (7,659,717)
1,234,903 - 1,234,903 240,491 2,799,313 9,299,893
(7,262,909) (1,720,000) (9,299,893) (5,787,515) 1,079,313 1,234,903
(4,862,485) 606,449 (6,424,814)
24,690,693 4,419,153 36,224,423
19,828,208$ 5,025,602$ 29,799,609$
27

This page was intentionally left blank
28

Net change in fund balances - total governmental funds (6,424,814)$
Amounts reported for governmental activities in the statement of activities are different because:
Capital outlay 17,047,079$ Less, depreciation expense (13,080,603)
3,966,476
(6,897,541)
(604,696)
3,195,457
(1,505,000)
Bonds, refunding payments $ 1,670,000 Bonds, scheduled debt service payments 915,000 Certificates of participation repayments 1,170,000 Capital lease repayments 185,196
3,940,196
Current year expense $ (14,469,519) Current year contribution 3,198,451
(11,271,068)
(169,813)
Change in net position of governmental activities (15,770,803)$
The accompanying notes are an integral part of the basic financial statements
Statement of Activities
DISTRICT SCHOOL BOARD OF MARTIN COUNTY, FLORIDAReconciliation of the Statement of Revenues, Expenditures andChanges in Fund Balances of Governmental Funds to the
For the Fiscal Year Ended June 30, 2013
Issuance costs on new debt are reported as expenditures in the governmental funds, but are deferred and amortizedon the statement of activities.
Annual required contributions to the Early Retirement Plan in the statement of activities does not require the use ofcurrent financial resources due to amounts prepaid in prior years. This is the current year reduction in the prepaidamount.
Governmental funds report capital outlays as expenditures. However, in the statement of activities, the cost of thoseassets is allocated over their estimated useful lives as depreciation expense. This is the amount by which capitaloutlays exceed depreciation expense in the current period.
The District's portion of equity held in the risk management consortium is recognized in the government-widestatement of activities, but not in the governmental funds. This is the decrease in the District's equity in theconsortium.
Repayment of long-term debt principal is an expenditure in the governmental funds, but the repayment reduces long-term liabilities in the statement of net position. This is the amount of repayments in the current period.
Expenses for other postemployment benefits in the statement of activities that do not require the use of currentfinancial resources, are not reported in the governmental funds.
In the statement of activities, the cost of compensated absences is measured by the amounts earned during the year,while in the governmental funds expenditures are recognized based on the amounts actually paid for leave used.This is the net amount of vacation and sick leave paid in excess of the amount earned in the current period.
The statement of activities reflects only the gain/loss on the sale of assets, whereas the governmental funds include all proceeds from these sales. Thus, the change in net assets differs from the change in fund balances by the undepreciated cost of assets sold.
29

Variance withFinal Budget -
Actual PositiveOriginal Final Amounts (Negative)
RevenuesFederal direct 456,650$ 452,898$ 452,898$ -$ Federal through state and local 921,659 960,648 960,648 - State 32,944,404 33,381,110 33,381,110 - Local -
Taxes 93,066,978 93,749,587 93,749,587 - Miscellaneous 4,881,690 5,023,805 5,023,805 -
Total revenues 132,271,381 133,568,048 133,568,048 -
ExpendituresCurrent:
Instructional servicesSalaries 59,163,922 59,099,372 59,099,372 - Employee benefits 17,639,095 17,156,047 17,156,047 - Purchased services 4,738,457 5,088,306 5,088,306 - Materials and supplies 2,233,514 1,948,360 1,948,360 - Capital outlay 251,987 89,426 89,426 - Other 1,576,778 1,505,264 1,505,264 -
Total instructional services 85,603,753 84,886,775 84,886,775 -
Pupil personnel services Salaries 4,274,430 4,541,335 4,541,335 - Employee benefits 1,265,873 1,273,249 1,273,249 - Purchased services 678,054 688,911 688,911 - Materials and supplies 28,008 24,330 24,330 - Capital outlay 9,149 697 697 - Other 19,187 8,267 8,267 -
Total pupil personnel services 6,274,701 6,536,789 6,536,789 -
Instructional media servicesSalaries 1,468,832 1,512,826 1,512,826 - Employee benefits 451,424 442,708 442,708 - Purchased services 8,756 1,697 1,697 - Materials and supplies 60,997 44,699 44,699 - Capital outlay 89,625 79,885 79,885 - Other 8,298 13,394 13,394 -
Total instructional media services 2,087,932 2,095,209 2,095,209 -
Instruction and curriculum development servicesSalaries 1,378,919 1,471,964 1,471,964 - Employee benefits 381,025 382,223 382,223 - Purchased services 13,893 18,192 18,192 - Materials and supplies 13,596 7,595 7,595 - Capital outlay 26 26 - Other 2,619 2,801 2,801 -
Total instruction and curriculum development services 1,790,052 1,882,801 1,882,801 -
The accompanying notes are an integral part of the basic financial statements. (Continued)
Budgeted Amounts
DISTRICT SCHOOL BOARD OF MARTIN COUNTY, FLORIDA
General FundFor the Fiscal Year Ended June 30, 2013
Statement of Revenues, Expenditures, and Changes in Fund Balances-Budget and Actual
30

Variance withFinal Budget -
Actual PositiveOriginal Final Amounts (Negative)
Budgeted Amounts
DISTRICT SCHOOL BOARD OF MARTIN COUNTY, FLORIDA
General FundFor the Fiscal Year Ended June 30, 2013
Statement of Revenues, Expenditures, and Changes in Fund Balances-Budget and Actual
Instructional staff training servicesSalaries 66,215$ 118,915$ 118,915$ -$ Employee benefits 7,885 8,191 8,191 - Purchased services 24,909 49,925 49,925 - Materials and supplies 73,831 48,826 48,826 - Capital outlay 13,344 - - - Other 65,449 14,320 14,320 -
Total instructional staff training services 251,633 240,177 240,177 -
Instruction related technologySalaries 1,149,595 1,094,634 1,094,634 - Employee benefits 294,450 279,306 279,306 - Purchased services 52,450 9,130 9,130 - Materials and supplies 60,638 23,684 23,684 - Other 3,183 66,736 66,736 -
Total instruction related technology 1,560,316 1,473,490 1,473,490 -
School boardSalaries 433,457 346,253 346,253 - Employee benefits 131,843 93,651 93,651 - Purchased services 90,588 227,154 227,154 - Materials and supplies 5,604 611 611 - Capital outlay 374 135 135 - Other 24,616 201,744 201,744 -
Total school board 686,482 869,548 869,548 -
General administrationSalaries 473,360 544,315 544,315 - Employee benefits 108,465 106,607 106,607 - Purchased services 8,279 36,714 36,714 - Materials and supplies 1,557 3,536 3,536 - Capital outlay 250 75 75 - Other 41,796 37,664 37,664 -
Total general administration 633,707 728,911 728,911 -
School administrationSalaries 7,097,158 7,043,571 7,043,571 - Employee benefits 1,955,912 1,893,879 1,893,879 - Purchased services 13,451 14,042 14,042 - Materials and supplies 12,746 13,652 13,652 - Capital outlay 18,208 324 324 - Other 3,417 7,436 7,436 -
Total school administration 9,100,892 8,972,904 8,972,904 -
The accompanying notes are an integral part of the basic financial statements. (Continued)
31

Variance withFinal Budget -
Actual PositiveOriginal Final Amounts (Negative)
Budgeted Amounts
DISTRICT SCHOOL BOARD OF MARTIN COUNTY, FLORIDA
General FundFor the Fiscal Year Ended June 30, 2013
Statement of Revenues, Expenditures, and Changes in Fund Balances-Budget and Actual
Facilities servicesSalaries 734,840$ 764,044$ 764,044$ -$ Employee benefits 187,165 190,620 190,620 - Purchased services 18,521 10,713 10,713 - Materials and supplies 4,146 13,236 13,236 - Other 1,744 744 744 -
Total facilities services 946,416 979,357 979,357 -
Fiscal servicesSalaries 681,166 619,686 619,686 - Employee benefits 197,217 182,197 182,197 - Purchased services 50,076 15,454 15,454 - Materials and supplies 10,685 6,637 6,637 - Capital outlay 755 235 235 - Other 10,793 19,868 19,868 -
Total fiscal services 950,692 844,077 844,077 -
Central servicesSalaries 2,157,155 1,495,676 1,495,676 - Employee benefits 2,596,771 2,837,577 2,837,577 - Purchased services 261,939 288,826 288,826 - Energy services 424 323 323 - Materials and supplies 42,036 37,848 37,848 - Capital outlay 9,749 1,998 1,998 - Other 47,897 33,601 33,601 -
Total central services 5,115,971 4,695,849 4,695,849 -
Pupil transportation servicesSalaries 2,773,853 2,949,009 2,949,009 - Employee benefits 1,405,288 1,385,357 1,385,357 - Purchased services 476,667 529,923 529,923 - Energy services 953,803 942,747 942,747 - Materials and supplies 345,204 379,974 379,974 - Capital outlay 11,037 8,182 8,182 - Other 148,034 83,897 83,897 -
Total pupil transportation services 6,113,886 6,279,089 6,279,089 -
The accompanying notes are an integral part of the basic financial statements. (Continued)
32
Variance withFinal Budget -
Actual PositiveOriginal Final Amounts (Negative)
Budgeted Amounts
DISTRICT SCHOOL BOARD OF MARTIN COUNTY, FLORIDA
General FundFor the Fiscal Year Ended June 30, 2013
Statement of Revenues, Expenditures, and Changes in Fund Balances-Budget and Actual
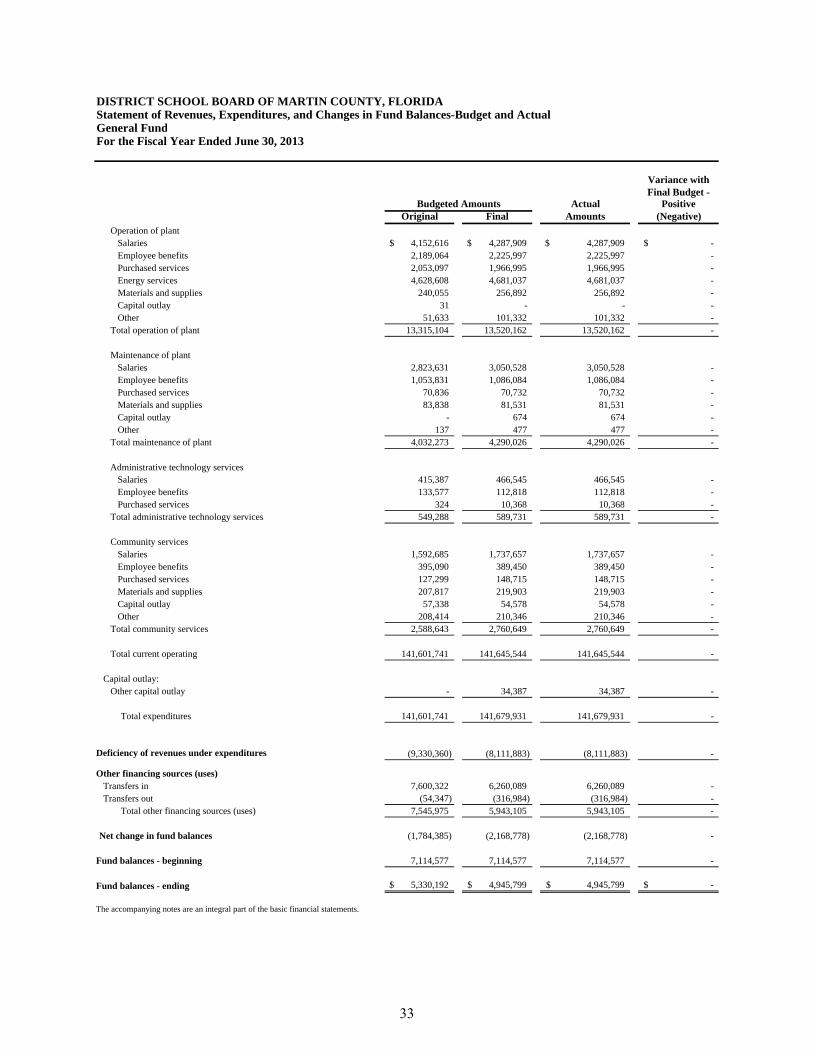
Operation of plantSalaries 4,152,616$ 4,287,909$ 4,287,909$ -$ Employee benefits 2,189,064 2,225,997 2,225,997 - Purchased services 2,053,097 1,966,995 1,966,995 - Energy services 4,628,608 4,681,037 4,681,037 - Materials and supplies 240,055 256,892 256,892 - Capital outlay 31 - - - Other 51,633 101,332 101,332 -
Total operation of plant 13,315,104 13,520,162 13,520,162 -
Maintenance of plantSalaries 2,823,631 3,050,528 3,050,528 - Employee benefits 1,053,831 1,086,084 1,086,084 - Purchased services 70,836 70,732 70,732 - Materials and supplies 83,838 81,531 81,531 - Capital outlay - 674 674 - Other 137 477 477 -
Total maintenance of plant 4,032,273 4,290,026 4,290,026 -
Administrative technology servicesSalaries 415,387 466,545 466,545 - Employee benefits 133,577 112,818 112,818 - Purchased services 324 10,368 10,368 -
Total administrative technology services 549,288 589,731 589,731 -
Community servicesSalaries 1,592,685 1,737,657 1,737,657 - Employee benefits 395,090 389,450 389,450 - Purchased services 127,299 148,715 148,715 - Materials and supplies 207,817 219,903 219,903 - Capital outlay 57,338 54,578 54,578 - Other 208,414 210,346 210,346 -
Total community services 2,588,643 2,760,649 2,760,649 -
Total current operating 141,601,741 141,645,544 141,645,544 -
Capital outlay:Other capital outlay - 34,387 34,387 -
Total expenditures 141,601,741 141,679,931 141,679,931 -
Deficiency of revenues under expenditures (9,330,360) (8,111,883) (8,111,883) -
Other financing sources (uses)Transfers in 7,600,322 6,260,089 6,260,089 - Transfers out (54,347) (316,984) (316,984) -
Total other financing sources (uses) 7,545,975 5,943,105 5,943,105 -
Net change in fund balances (1,784,385) (2,168,778) (2,168,778) -
Fund balances - beginning 7,114,577 7,114,577 7,114,577 -
Fund balances - ending 5,330,192$ 4,945,799$ 4,945,799$ -$
The accompanying notes are an integral part of the basic financial statements.
33

Statement of Revenues, Expenditures, and Changes in Fund Balances - Budget and ActualMajor Special Revenue Fund - Other Federal Programs FundFor the Fiscal Year Ended June 30, 2013
Variance withFinal Budget -
Actual PositiveOriginal Final Amounts (Negative)
RevenuesFederal direct 831,407$ 1,901,223$ 1,901,223$ -$ Federal through state and local 10,036,312 8,660,907 8,660,907 -
Total revenues 10,867,719 10,562,130 10,562,130 -
ExpendituresCurrent:
Instructional services Salaries 2,228,860 1,960,273 1,960,273 - Employee benefits 883,091 715,278 715,278 - Purchased services 241,955 563,131 563,131 - Materials and supplies 320,043 273,191 273,191 - Capital outlay 242,792 56,319 56,319 - Other 93,928 198,974 198,974 - Total instructional services 4,010,669 3,767,166 3,767,166
Pupil personnel services Salaries 1,747,952 2,070,317 2,070,317 - Employee benefits 483,444 644,740 644,740 - Purchased services 342,762 87,812 87,812 - Materials and supplies 82,006 45,048 45,048 - Capital outlay 29,492 1,499 1,499 - Other - 150 150 - Total pupil personnel services 2,685,656 2,849,566 2,849,566 -
Instructional media services Salaries 10,360 10,960 10,960 - Employee benefits 5,075 5,293 5,293 - Other 922 - - - Total instructional media services 16,357 16,253 16,253 -
Instruction and curriculum development services Salaries 929,503 1,010,776 1,010,776 - Employee benefits 259,959 267,511 267,511 - Purchased services 49,975 45,097 45,097 - Materials and supplies 25,066 24,125 24,125 - Capital outlay 7,450 137 137 - Other 11,034 34,012 34,012 - Total instruction and curriculum development services 1,282,987 1,381,658 1,381,658 -
Instructional staff training - Salaries 1,583,448 1,455,335 1,455,335 - Employee benefits 435,498 404,832 404,832 - Purchased services 119,933 86,713 86,713 - Materials and supplies 137,332 42,687 42,687 - Capital outlay 2,044 - - - Other 9,263 11,080 11,080 - Total instructional staff training 2,287,518 2,000,647 2,000,647 -
The accompanying notes are an integral part of the basic financial statements. (Continued)
Budgeted Amounts
DISTRICT SCHOOL BOARD OF MARTIN COUNTY, FLORIDA
Other Federal Programs Fund
34

Statement of Revenues, Expenditures, and Changes in Fund Balances - Budget and ActualMajor Special Revenue Fund - Other Federal Programs FundFor the Fiscal Year Ended June 30, 2013
Variance withFinal Budget -
Actual PositiveOriginal Final Amounts (Negative)
Budgeted Amounts
DISTRICT SCHOOL BOARD OF MARTIN COUNTY, FLORIDA
Other Federal Programs Fund
General Administration Other 532,655 387,456 387,456 - Total general administration 532,655 387,456 387,456 -
School administration Salaries 22,632 - - - Employee benefits 7,756 - - - Total school administration 30,388 - - -
Food services Other 480 488 488 - Total food services 480 488 488 -
Pupil transportation services Purchased services 4,125 80,904 80,904 - Energy services - 1,686 1,686 - Materials and supplies - 52 52 - Capital outlay 1,000 2,325 2,325 - Total pupil transportation services 5,125 84,967 84,967 -
Operation of plant Purchased services 13,363 38,685 38,685 - Materials and supplies 451 10,644 10,644 - Capital outlay - 1,163 1,163 - Total operation of plant 13,814 50,492 50,492 -
Community services Materials and supplies 2,070 1,585 1,585 - Total community services 2,070 1,585 1,585 -
Capital outlay Other capital outlay - 21,852 21,852 - Total capital outlay - 21,852 21,852 -
Total expenditures 10,867,719 10,562,130 10,562,130 -
Excess (deficiency) of revenues over (under) expenditures - - - -
Fund balance - beginning - - - -
Fund balance - ending -$ -$ -$ -$
The accompanying notes are an integral part of the basic financial statements.
35

DISTRICT SCHOOL BOARD OF MARTIN COUNTY, FLORIDAStatement of Revenues, Expenditures, and Changes in Fund Balances - Budget and ActualMajor Special Revenue Fund - Federal Economic Stimulus FundFor the Fiscal Year Ended June 30, 2013
Variance withFinal Budget -
Actual Positive
Original Final Amounts (Negative)Revenues
Federal through state and local 734,803$ 360,951$ 360,951$ -$ Total revenues 734,803 360,951 360,951 -
ExpendituresCurrent:
InstructionSalaries - 33,868 33,868 - Employee benefits 376 5,386 5,386 - Other 13,875 - - -
Total instruction 14,251 39,254 39,254 -
Pupil personnel servicesSalaries 19,315 - - - Employee benefits 438 - - -
Total pupil personnel services 19,753 - - -
Instruction and curriculum development servicesSalaries 124,510 101,560 101,560 - Employee benefits 23,578 23,579 23,579 - Purchased services 133,843 86,485 86,485 - Materials and supplies 72,255 3,771 3,771 - Capital outlay 159,099 700 700 -
Total instruction & curriculum development serv. 513,285 216,095 216,095 -
Instructional staff training servicesPurchased services 14,208 2,845 2,845 - Materials and supplies 19,209 329 329 - Capital outlay 1,356 31,237 31,237 -
Total instructional staff training services 34,773 34,411 34,411 -
Instruction Related TechnologySalaries 49,168$ 49,168$ 49,168$ -$ Employee benefits 16,628 14,523 14,523 -
Total instruction related technology 65,796 63,691 63,691 -
Facilities servicesCapital outlay 86,945 - - -
Total general administration 86,945 - - -
Capital outlay:Other capital outlay - 7,500 7,500 -
Total expenditures 734,803 360,951 360,951 -
The accompanying notes are an integral part of the basic financial statements. (Continued)
Budgeted Amounts
Federal Economic Stimulus Fund
36

DISTRICT SCHOOL BOARD OF MARTIN COUNTY, FLORIDAStatement of Revenues, Expenditures, and Changes in Fund Balances - Budget and ActualMajor Special Revenue Fund - Federal Economic Stimulus FundFor the Fiscal Year Ended June 30, 2013
Variance withFinal Budget -
Actual Positive
Original Final Amounts (Negative)
Budgeted Amounts
Federal Economic Stimulus Fund
Excess (deficiency) of revenues over (under) expenditures - - - -
Net change in fund balance - - - -
Fund balance - beginning - - - -
Fund balance - ending -$ -$ -$ -$
The accompanying notes are an integral part of the basic financial statements.
37

This page was intentionally left blank
38

Statement of Fiduciary Net PositionFiduciary FundsJune 30, 2013
Private -Pension PurposeTrust Trust AgencyFund Funds Funds
AssetsCash and cash equivalents -$ 100,954$ 1,796,435$ Investments Common stock 3,205,024 - - Corporate debt obligations 1,231,161 - - Money market fund 727,936 - - American depository receipts 383,035 - - United States agencies and instrumentalities obligations 312,420 - - United States treasury notes 160,722 - - Other 84,791 - - Accounts receivable - - 1,458
Inventory - - 62,324 Total assets 6,105,089$ 100,954$ 1,860,217$
LiabilitiesTemporary negative cash 270,425$ -$ -$ Due to student organizations - - 1,827,051 Accounts payable - - 33,166
Total liabilities 270,425 - 1,860,217$
Net position Assets held in trust for pension benefits 5,834,664 - Assets held in trust for scholarships - 100,954
Net position 5,834,664$ 100,954$
The accompanying notes are an integral part of the basic financial statements.
DISTRICT SCHOOL BOARD OF MARTIN COUNTY, FLORIDA
39
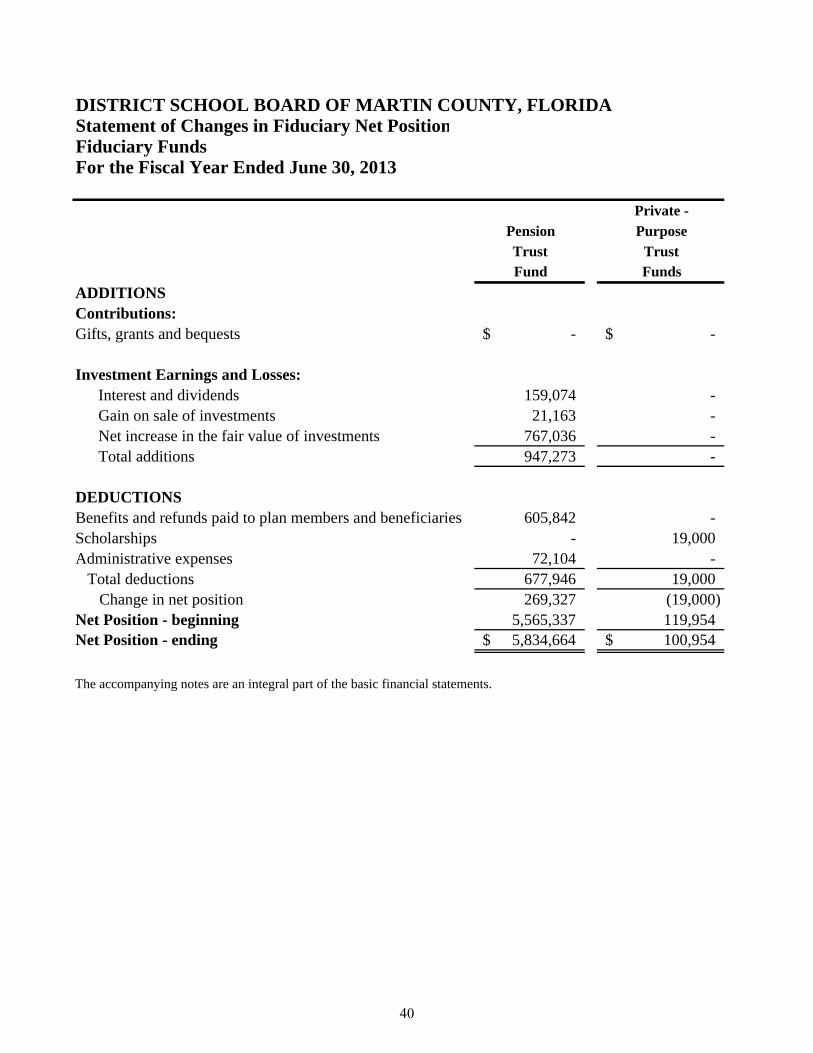
Private -
Pension Purpose
Trust TrustFund Funds
ADDITIONSContributions:Gifts, grants and bequests -$ -$
Investment Earnings and Losses:Interest and dividends 159,074 - Gain on sale of investments 21,163 - Net increase in the fair value of investments 767,036 - Total additions 947,273 -
DEDUCTIONSBenefits and refunds paid to plan members and beneficiaries 605,842 - Scholarships - 19,000 Administrative expenses 72,104 - Total deductions 677,946 19,000 Change in net position 269,327 (19,000) Net Position - beginning 5,565,337 119,954 Net Position - ending 5,834,664$ 100,954$
The accompanying notes are an integral part of the basic financial statements.
DISTRICT SCHOOL BOARD OF MARTIN COUNTY, FLORIDAStatement of Changes in Fiduciary Net PositionFiduciary FundsFor the Fiscal Year Ended June 30, 2013
40

District School Board of Martin County, Florida Notes to the Basic Financial Statements June 30, 2013
I. SUMMARY OF SIGNIFICANT ACCOUNTING POLICIES .......................................................43 A. Reporting Entity .........................................................................................................................43 B. Government-wide and Fund Financial Statements—Basis of Presentation ...............................43 1. Government-wide Financial Statements .......................................................................44 2. Fund Financial Statements ............................................................................................44 C. Measurement Focus, Basis of Accounting, and Financial Statement Presentation ...................45 1. Government-wide Financial Statements .......................................................................45 2. Governmental Fund Financial Statements ....................................................................46 3. Fiduciary Fund Financial Statements ............................................................................46 4. Component Units ..........................................................................................................47 D. Assets, Liabilities, and Net Position/Fund Balance ...................................................................47 1. Deposits and Investments ..............................................................................................47 2. Inventories and Prepaid Items ........................................................................................48 3. Capital Assets.................................................................................................................48 4. Unearned Revenue .........................................................................................................49 5. Accrued Compensated Absences ...................................................................................49 6. Other Long-Term Liabilities ..........................................................................................49 E. Revenue Sources ........................................................................................................................50 1. State Revenue Sources ...................................................................................................50 2. District Property Taxes ..................................................................................................50 3. Federal Revenue Sources ...............................................................................................51 4. Educational Impact Fees ................................................................................................51 II. STEWARDSHIP, COMPLIANCE, AND ACCOUNTABILITY ...................................................51 III. PROPERTY TAXES .......................................................................................................................52 IV. INVESTMENTS ..............................................................................................................................53 V. DUE FROM OTHER GOVERNMENTAL AGENCIES ...............................................................56 VI. CAPITAL ASSETS .........................................................................................................................57 VII. LONG-TERM OBLIGATIONS ......................................................................................................58 A. Obligations under Capital Lease ..............................................................................................58 B. Certificates of Participation ......................................................................................................58 C. Bonds Payable ..........................................................................................................................59 D. Changes in Long-Term Liabilities ...........................................................................................60 VIII. INTERFUND TRANSFERS ...........................................................................................................61
41
District School Board of Martin County, Florida Notes to the Basic Financial Statements June 30, 2013
IX. EMPLOYEE BENEFITS ................................................................................................................61 A. State Retirement Program ........................................................................................................61 B. Early Retirement Plan ..............................................................................................................63 C. Other Postemployment Benefits...............................................................................................65 X. OTHER INFORMATION ...............................................................................................................68 A. Schedule of State Revenue Sources .........................................................................................68 B. Risk Management Programs ....................................................................................................68 C. Construction and Other Significant Commitments ..................................................................69 D. Fund Balance Reporting...........................................................................................................70 XI. SUBSEQUENT EVENTS ...............................................................................................................72
42

District School Board of Martin County, Florida Notes to the Basic Financial Statements June 30, 2013
NOTE I - SUMMARY OF SIGNIFICANT ACCOUNTING POLICIES
A. Reporting Entity
The Martin County District School Board (Board) has direct responsibility for operation, control, and supervision of District schools and is considered a primary government for financial reporting. The Martin County School District (District) is considered part of the Florida system of public education. The governing body of the District is the Board, which is composed of five elected members. The elected Superintendent of Schools is the executive officer of the Board. Geographic boundaries of the District correspond with those of Martin County.
Criteria for determining if other entities are potential component units that should be reported within the District's basic financial statements are identified and described in the Governmental Accounting Standards Board's (GASB) Codification of Governmental Accounting and Financial Reporting Standards, Sections 2100 and 2600. The application of these criteria provides for identification of any entities for which the Board is financially accountable and other organizations for which the nature and significance of their relationship with the School Board are such that the exclusion would cause the District's basic financial statements to be misleading or incomplete. Based on the application of these criteria, the following component units are included within the District's reporting entity:
Blended Component Unit
The Martin County School Board Leasing Corporation (Leasing Corporation) was formed to facilitate financing for the acquisition of facilities and equipment as further discussed in Note VII B. Due to the substantive economic relationship between the Board and the Leasing Corporation, the financial activities of the Leasing Corporation are included in the accompanying basic financial statements. Separate financial statements for the Leasing Corporation are not published.
Discretely Presented Component Unit
The Hope Center for Autism, Inc., is a separate not-for-profit corporation organized pursuant to Chapter 617, Florida Statutes, the Florida Not For Profit Corporation Act, and Section 1002.33, Florida Statutes. The Hope Center for Autism, Inc., operates as a charter school and is considered to be a component unit since it is fiscally dependent on the District to levy taxes for its support and there is a potential for the charter school to provide specific financial benefits to, or impose, specific financial burdens on, the District. A copy of the separate financial statements for the charter school is available at the District’s administrative office.
The District also considered the Clark Advanced Learning Center Charter School operated by Indian River State College for inclusion in its reporting entity; however, because the Clark Advanced Learning Center is an operating component unit of the College and is not a separate legal entity, it does not meet the criteria for inclusion as a District component unit. The charter school’s financial statements were audited by an independent certified public accountant and are filed in the District’s administrative office.
B. Government-wide and Fund Financial Statements – Basis of Presentation
The basic financial statements of the District are composed of the following:
Government-wide financial statements Fund financial statements Notes to the basic financial statements
43

District School Board of Martin County, Florida Notes to the Basic Financial Statements June 30, 2013
1. Government-wide Financial Statements
Government-wide financial statements (the Statement of Net Position and the Statement of Activities) present information about the School District as a whole. These statements include the non-fiduciary financial activity of the primary government and its component units.
Government-wide financial statements include separate columns for the primary government and its component units. Governmental activities are supported by taxes and intergovernmental revenues. The primary government is reported separately from certain legally separate component units for which the primary government is financially accountable.
The statement of activities presents a comparison between direct expenses and program revenues for each function or program of the District’s governmental activities. Direct expenses are those that are specifically associated with a service, program, or department and are thereby clearly identifiable to a particular function. Depreciation expense, if not specifically associated with a particular function, is reported as unallocated. Program revenues include charges paid by the recipient of the goods or services offered by the program and grants and contributions that are restricted to meeting the operational or capital requirements of a particular program. Revenues that are not classified as program revenues are presented as general revenues. The comparison of direct expenses with program revenues identifies the extent to which each governmental function is self-supporting or draws from the general revenues of the District.
As a general rule, the effects of interfund activity have been eliminated from the government-wide financial statements. Exceptions to this general rule are when eliminations would distort the direct costs and program revenues reported for the various functions concerned.
2. Fund Financial Statements
The financial records of the District are organized on the basis of funds, each of which is considered a separate accounting entity. The operations of each fund are accounted for with a separate set of self-balancing accounts that comprises its assets, liabilities, fund equity, revenue and expenditures or expenses, as appropriate. Government resources are allocated to, and accounted for, in individual funds based upon the purposes for which they are to be spent and the means by which spending activities are controlled.
Fund financial statements for the District’s governmental and fiduciary funds are presented after the government-wide financial statements. The focus of governmental fund financial statements is on major funds rather than reporting funds by type. Each major fund is reported in a separate column. Nonmajor funds are aggregated and reported in a single column. The fiduciary fund statements include financial information for the agency funds, the pension trust fund, and private purpose trust funds. The agency funds of the District primarily represent assets held by the District in a custodial capacity for other individuals or governments.
Because the focus of governmental fund financial statements differs from the focus of government-wide financial statements, a reconciliation is presented with each of the governmental fund financial statements.
44

District School Board of Martin County, Florida Notes to the Basic Financial Statements June 30, 2013
The District reports the following major governmental funds:
General Fund – to account for all financial resources not required to be accounted for in another fund, and for certain revenues from the State that are legally restricted to be expended for specific current operating purposes.
Special Revenue – Other Federal Programs – to account for the financial resources generated for federal grants.
Special Revenue – Federal Economic Stimulus Fund– to account for certain Federal grant program resources related to the American Recovery and Reinvestment Act (ARRA).
Capital Projects – Local Capital Improvement Tax Fund – to account for the financial resources generated by the local capital improvement tax levy to be used for educational capital outlay needs, including new construction, renovation and remodeling projects, maintenance, repairs, and site improvement.
Additionally, the District reports the following fiduciary fund types:
Pension Trust Fund – to account for resources used to finance the early retirement plan.
Private-Purpose Trust Funds – to account for resources of the following scholarship trust funds: M.H. Correll Research Trust Fund; T.L. Showalter Scholarship Trust Fund; J.M. Phillips, Jr., Memorial Trust Fund; Clara Neuman Scholarship Trust Fund; Dr. Tom Goodman Scholarship Trust Fund; and Nonendowment Scholarship Trust Fund.
Agency Funds – to account for resources of the school internal funds which are used to administer moneys collected at the several schools in connection with school, student athletic, class, and club activities.
Noncurrent Governmental Assets/Liabilities
GASB Statement No. 34 requires noncurrent governmental assets, such as land and buildings, noncurrent governmental liabilities such as bonds and capital leases, to be reported in the governmental activities column in the government-wide Statement of Net Position.
C. Measurement Focus, Basis of Accounting, and Financial Statement Presentation
1. Government-wide Financial Statements
Basis of accounting refers to when revenues and expenditures, or expenses, are recognized in the accounts and reported in the financial statements. Basis of accounting relates to the timing of the measurements made, regardless of the measurement focus applied.
The government-wide financial statements and fiduciary fund financial statements are reported using the economic resources measurement focus and the accrual basis of accounting. Under the accrual basis of accounting, revenues, expenses, gains, losses, assets, and liabilities resulting from exchange and exchange-like transactions are recognized when the exchange takes place. Revenues, expenses, gains, losses, assets, and liabilities resulting from nonexchange transactions are recognized in accordance with the requirements of GASB Statement 33 – Accounting and Financial Reporting for Nonexchange Transactions. Revenues from grants, entitlements, and donations are recognized in the fiscal year in which all eligibility requirements imposed by the provider have been satisfied.
Amounts paid to acquire capital assets are capitalized as assets in the government-wide financial statements, rather than reported as expenditures. Proceeds of long-term debt are recorded as liabilities in
45

District School Board of Martin County, Florida Notes to the Basic Financial Statements June 30, 2013
the government-wide financial statements, rather than as an “other financing source”. Amounts paid to reduce the District’s long-term indebtedness are reported as a reduction of related liability, rather than as expenditures.
2. Governmental Fund Financial Statements
Governmental fund financial statements are reported using the current financial resources measurement focus and the modified accrual basis of accounting. Revenues, except for certain grant revenues, are recognized when they become measurable and available. Revenues are considered to be available when they are collectible within the current period or soon enough thereafter to pay liabilities of the current period. The District considers revenues to be available if they are collected within 30 days of the end of the current fiscal year. Taxes, grants, and interest associated with the current fiscal period are all considered to be susceptible to accrual and so have been recognized as revenues of the current fiscal period. When grant terms provide that the expenditure of resources is the prime factor for determining eligibility for Federal, State, and other grant resources, revenue is recognized at the time the expenditure is made. Under the modified accrual basis of accounting, expenditures are generally recognized when the related fund liability is incurred, except for principal and interest on long-term debt, claims and judgments, other postemployment benefits, and compensated absences, which are recognized when due. Amounts expended to acquire capital assets are recorded as expenditures in the year that resources were expended, rather than as fund assets. Allocations of cost, such as depreciation, are not recognized in governmental funds.
Under the current financial resources measurement focus, only current assets and current liabilities are generally included on the balance sheet. The reported fund balance is considered to be a measure of “available spendable resources”. Governmental funds operating statements present increases (revenues and other financing sources) and decreases (expenditures and other financing uses) in net current assets. Accordingly, they are said to present a summary of sources and uses of “available spendable resources” during a period.
When both restricted and unrestricted resources are available for use, it is the District’s policy to use restricted resources first, then unrestricted resources as they are needed. When committed, assigned, or unassigned resources are available for use in governmental fund financial statements, it is the District’s policy to use committed resources first, followed by assigned resources, and then unassigned resources as they are needed.
Because of their spending measurement focus, expenditure recognition for governmental fund types excludes amounts represented by noncurrent liabilities. Since they do not affect net current assets, such long-term amounts are not recognized as governmental fund type expenditures or fund liabilities.
3. Fiduciary Fund Financial Statements
Fiduciary fund statements include trust funds and agency funds. All trust funds use the economic resources measurement focus and accrual basis of accounting. Agency funds are unlike all other types of funds and report only assets and liabilities. So, agency funds do not have a measurement focus, but do use an accrual basis of accounting to recognize receivables and payables.
46

District School Board of Martin County, Florida Notes to the Basic Financial Statements June 30, 2013
4. Component Unit
The Hope Center for Autism, Inc. (charter school), shown as a discretely presented component unit, is accounted for as a governmental organization and follows the same accounting model as the District’s governmental activities.
D. Assets, Liabilities, and Net Position/Fund Balance
1. Deposits and Investments
Cash deposits are held by banks qualified as public depositories under Florida law. All deposits are insured by Federal depository insurance and collateralized with securities held in Florida's multiple financial institution collateral pool as required by Chapter 280, Florida Statutes. The District considers cash as those accounts used as demand deposit accounts and considers cash equivalents as those amounts on deposit in money market funds and amounts placed in the State Board of Administration’s (SBA) Florida Local Government Surplus Funds Trust Fund (“Florida PRIME”), except that money market funds in the Pension Trust Fund are not classified as cash equivalents. This investment pool operates under investment guidelines established by Section 215.47, Florida Statutes. The District’s investments in Florida PRIME, which the SBA indicates is a Securities and Exchange Commission Rule 2a7 like external investment pool, as of June 30, 2013, are similar to money market funds in which shares are owned in the fund rather than the underlying investments. These investments are reported at fair value, which is amortized cost.
The Board has a formal investment policy. The purpose of this policy is to set forth the investment objectives and parameters for the management of the District’s public funds. These policies are designed to ensure the prudent management of public funds, the availability of operating and capital funds when needed, and an investment return competitive with comparable funds and financial market indices. The District’s investment policy limits investments to a maximum of 5 years or less. Obligations of United States Government agencies and instrumentalities include embedded options to call the entire security or portion thereof, at the option of the issuer; or, depending on market conditions, the District may decide to leave the security intact, at a stated interest rate, until final maturity. These securities have various call dates between September 2013 and April 2017.
In accordance with Section 218.415, Florida Statutes, this investment policy applies to all cash and investments held or controlled by the District and shall be identified as "Pooled Funds" of the District with the exception of pension funds and funds related to the issuance of debt where there are other existing policies or indentures in effect for such funds. Funds held by state agencies (e.g., Department of Education) are not subject to the provisions of this policy.
The foremost objective of this investment program is the safety of the principal of those funds within the portfolios. Investment transactions shall seek to keep capital losses at a minimum, whether they are from securities defaults or erosion of market value. The second highest priority is liquidity of funds, and the third highest priority is investment income.
Investments consist of amounts placed in SBA Debt Service accounts for investment of debt service moneys, and the Florida PRIME and Fund B Surplus Trust Fund (Fund B) investment pools created by Sections 218.405 and 218.417, Florida Statutes, and those made locally.
The District’s investments in Fund B are accounted for as a fluctuating net asset value pool, with a fair value factor of 1.11845939 at June 30, 2013. Fund B is not subject to participant withdrawal requests.
47

District School Board of Martin County, Florida Notes to the Basic Financial Statements June 30, 2013
Distributions from Fund B, as determined by SBA, are effected by transferring eligible cash or securities to Florida PRIME, consistent with the pro rata allocation of pool shareholders of record at the creation of Fund B. One hundred percent of such distributions from Fund B are available as a liquid balance within Florida PRIME.
Section 218.45, Florida Statutes, limits the types of investments that the District can invest in unless specifically authorized in the District’s investment policy. The District has a formal investment policy that allows for the following investments: Florida PRIME, United States Government securities, United States Government agencies, Federal instrumentalities (United States Government sponsored agencies), interest bearing time deposit or savings accounts, repurchase agreements, commercial paper, bankers’ acceptances, state and/or local government taxable and/or tax-exempt debt, registered investment companies (money market mutual funds), intergovernmental investment pools, and corporate obligations in the FDIC’s Temporary Liquidity Guarantee Program.
Investments made locally for the Early Retirement Plan and the Certificates of Participation, Series 2005A, are reported at fair value. Types and amounts of investments held at fiscal year-end are described in a subsequent note on investments.
As of June 30, 2013, the special revenue funds and the Early Retirement Fund cash accounts reflect a negative cash balance which represents timing differences between expenditures and the receipt of the reimbursement from the cash drawdown request. The funds are part of our pooled funds, so no District bank account is overdrawn per bank records at June 30, 2013.
2. Inventories and Prepaid Items
Inventories consist of expendable supplies held for consumption in the course of District operations. Warehouse inventories are stated at weighted average unit cost. Food service inventories are stated at the last invoice cost, which approximates the first-in, first-out basis, except that United States Department of Agriculture surplus donated foods are stated at their fair value as determined at the time of donation to the District’s food service program by the Florida Department of Agriculture and Consumer Services, Bureau of Food Distribution. The costs of inventories are recorded as expenditures when consumed on government-wide financial statements and as expenditures when purchased on fund financial statements. However, inventory and prepaid balances are offset on the balance sheet by nonspendable fund balance accounts to indicate that they do not constitute available expendable resources, even though they are components of current assets.
Certain payments to vendors reflect costs applicable to future accounting periods and are recorded as prepaid items in both the government-wide and fund financial statements. The costs of prepaid items are recorded as expenditures when consumed.
3. Capital Assets
Expenditures for capital assets acquired or constructed for general District purposes are reported in the governmental fund that financed the acquisition or construction. The capital assets so acquired are reported at cost in the government-wide statement of net assets but are not reported in the governmental fund financial statements. Capital assets are defined by the District as those costing more than $1,000. Such assets are recorded at historical cost or estimated historical cost if purchased or constructed. Donated assets are recorded at fair value at the date of donation. Buildings and fixed equipment totaling $24,106,121 acquired or constructed prior to the 1979-80 fiscal year are stated at estimated historical
48

District School Board of Martin County, Florida Notes to the Basic Financial Statements June 30, 2013
cost using Florida Department of Education average square foot construction costs for the year of acquisition or construction.
Interest costs incurred during construction of capital assets are not considered material and are not capitalized as part of the cost of construction.
Capital assets are depreciated using the straight-line method over the following estimated useful lives:
Assets Years Improvements Other than Buildings 10 - 40 Buildings and Fixed Equipment 50 Furniture, Fixtures, and Equipment 3 - 15 Motor Vehicles 5 - 10 Property Under Capital Lease 6 Audio Visual Materials and Computer Software 3 - 5
Current year information relative to changes in capital assets is described in a subsequent note.
4. Unearned Revenue
The unearned revenues will be recognized as revenue in the fiscal year that they are earned, in accordance with the accrual basis of accounting. Unearned revenues reported in governmental fund financial statements represent revenues that are measurable but not available.
5. Accrued Compensated Absences
The District accrues accumulated unpaid vacation and sick leave when earned by the employee. The District’s employee vacation and sick leave policies provide for the granting of a specific number of days of vacation based on years of service and governed by applicable labor contracts and sick leave with pay per each month of employment. Employees will be paid in one lump sum for accrued annual (vacation) leave as of last day of employment not to exceed the 60 day maximum allowable balance. A maximum of 500 hours of annual leave may be accrued by employees, except those with balances exceeding 500 as of June 30, 1988, which will be the balance accrued as of June 30, 1988. Employees who work a complete contracted year and who have accrued thirty or more sick days as of the last duty day, and who have used no more than two of their ten days of accrued sick/personal leave during the year may receive pay for the unused days at 80 percent of the employees daily rate. Compensated absences are reported in the governmental funds only if they have matured. The amount estimated to be paid in the following year is the current amount. The amount estimated to be used or paid in subsequent fiscal years is the noncurrent amount. The current and noncurrent amounts for government funds are maintained separately and represent a reconciling item between the fund and government-wide presentations. A liability is reported in the governmental fund financial statements only for the current portion of compensated absences expected to be paid using expendable available resources. 6. Other Long-Term Liabilities
Long-term obligations that will be financed from resources to be received in the future by governmental funds are reported as liabilities in the government-wide statement of net assets. In the governmental
49

District School Board of Martin County, Florida Notes to the Basic Financial Statements June 30, 2013
fund financial statements, bonds and other long-term obligations are not recognized as liabilities until due.
E. Revenue Sources
1. State Revenue Sources
Significant revenues from State sources for current operations include the Florida Education Finance Program administered by the Florida Department of Education (Department) under the provisions of Section 1011.62, Florida Statutes. In accordance with this law, the District determines and reports the number of full-time equivalent (FTE) students and related data to the Department. The Department performs certain edit checks on the reported number of FTE and related data, and calculates the allocation of funds to the District. The District is permitted to amend its original reporting for a period of five months following the date of the original reporting. Such amendments may impact funding allocations for subsequent years. The Department may also adjust subsequent fiscal period allocations based upon an audit of the District's compliance in determining and reporting FTE and related data. Normally, such adjustments are treated as reductions or additions of revenue in the year when the adjustments are made.
The State provides financial assistance to administer certain educational programs. State Board of Education rules require that revenue earmarked for certain programs be expended only for the program for which the money is provided, and require that the money not expended as of the close of the fiscal year be carried forward into the following year to be expended for the same educational programs. The Department generally requires these educational program revenues be accounted for in the General Fund. A portion of the fund balance of the General Fund is restricted in the governmental fund financial statements for the balance of categorical and earmarked educational program resources.
The State allocates gross receipts taxes, generally known as Public Education Capital Outlay money, to the District on an annual basis. The District is authorized to expend these funds only upon applying for and receiving an encumbrance authorization from the Department. A schedule of revenues from State sources for the current year is presented in a subsequent note.
2. District Property Taxes
The Board is authorized by State law to levy property taxes for district school operations, capital improvements, and debt service.
Property taxes consist of ad valorem taxes on real and personal property within the District. Property values are determined by the Martin County Property Appraiser, and property taxes are collected by the Martin County Tax Collector.
The Board adopted the 2012 tax levy on September 4, 2012. Tax bills are mailed in October and taxes are payable between November 1 of the year assessed and March 31 of the following year at discounts of up to 4 percent for early payment.
Taxes become a lien on the property on January 1, and are delinquent on April 1, of the year following the year of assessment. State law provides for enforcement of collection of personal property taxes by seizure of the property to satisfy unpaid taxes, and for enforcement of collection of real property taxes by the sale of interest-bearing tax certificates to satisfy unpaid taxes. The procedures result in the collection of essentially all taxes prior to June 30 of the year following the year of assessment.
50

District School Board of Martin County, Florida Notes to the Basic Financial Statements June 30, 2013
Property tax revenues are recognized in the government-wide financial statements when the Board adopts the tax levy. Property tax revenues are recognized in the governmental fund financial statements when taxes are received by the District, except that revenue is accrued for taxes collected by the Martin County Tax Collector at fiscal year-end but not yet remitted to the District.
Millage and taxes levied for the current year are presented in Note III.
3. Federal Revenue Sources
The District receives Federal awards for the enhancement of various educational programs. Federal awards are generally received based on applications submitted to, and approved by, various granting agencies. For Federal awards in which a claim to these grant proceeds is based on incurring eligible expenditures, revenue is recognized to the extent that eligible expenditures have been incurred.
The District also receives Race-to-the-Top funds, which are scheduled to expire on June 30, 2014.
4. Educational Impact Fees
The District receives educational impact fees based on an ordinance adopted by the Martin County Commission on July 25, 1995, and amended on February 5, 2008. The educational impact fees are collected by the County for most new residential construction. The fees shall be used solely for the purpose of capital costs of educational facilities, including repayment of indebtedness for such facilities. The authorized uses include, but are not limited to, school planning and design, land acquisition, site improvements, buildings, and capital equipment with an expected useful life of three years or longer, but excludes maintenance and operations.
NOTE II – STEWARDSHIP, COMPLIANCE AND ACCOUNTABILITY
I. Accounting Changes
A. The District adopted new accounting guidance GASB Statement No. 63, Financial Reporting of Deferred Outflows of Resources, Deferred Inflows of Resources, and Net Position, and GASB Concepts Statement No. 4, Elements of Financial Statements. These statements incorporated deferred outflows of resources and deferred inflows of resources into the definitions of the required components of the residual measure and renamed that measure as “net position”, rather than net assets, affecting the comparability of the financial statements from the 2011-12 to the 2012-13 fiscal years.
B. The GASB issued Statement No. 65, Items Previously Reported as Assets and Liabilities (GASB 65), effective for reporting periods beginning after December 15, 2012. The statement amends or supersedes the accounting and financial reporting guidance for certain items previously required to be reported as assets or liabilities. The District has elected early adoption of GASB No. 65 in the 2012-13 fiscal year financial statements. There was no impact on the District’s financial statements as a result of this early adoption.
The Board follows procedures established by State statutes and State Board of Education rules in establishing budget balances for governmental funds as described below:
51

District School Board of Martin County, Florida Notes to the Basic Financial Statements June 30, 2013
1. Budgets are prepared, public hearings are held, and original budgets are adopted annually for all governmental fund types in accordance with procedures and time intervals prescribed by law and State Board of Education rules.
2. Appropriations are controlled at the object level (e.g., salaries, purchased services, and capital outlay) within each function level (e.g., instruction, pupil personnel services, and school administration) and may be amended by resolution at any Board meeting prior to the due date for the annual financial report.
3. Budgets are prepared using the same modified accrual basis as is used to account for governmental funds.
4. Appropriations for the District lapse at the close of the fiscal year. Encumbered appropriations are reappropriated in the ensuing year’s budget.
5. Formal budgetary integration is used as a management control device for all funds of the District.
NOTE III - PROPERTY TAXES
The following is a summary of millages and taxes levied on the 2012 tax roll for the 2012-13 fiscal year:
TAX ROLL MILLAGES TAXES LEVIEDGeneral FundNonvoted School Tax:
Required Local Effort 4.656 83,526,062$ Basic Discretionary Local Effort 0.748 13,418,706
Capital Projects FundsNonvoted Tax: Local Capital Improvements 1.500 26,909,170
Total 6.904 123,853,938$
52

District School Board of Martin County, Florida Notes to the Basic Financial Statements June 30, 2013
NOTE IV – INVESTMENTS
As of June 30, 2013, the District had the following investments and maturities:
Investments Maturities Fair Value
State Board of Administration:Florida PRIME (1) 40 Day Average 1,003,963$ Fund B Surplus Funds Trust Fund 3.98 Year Average 872,608Debt Service Accounts 6 Months 263,167
PFM Asset Management LLC PFM Funds Prime Series Institutional Class Shares Fund (1) 47 Day Average 7,848,058 PFM Funds Government Series Fund (1) 42 Day Average 7,825,626Wells Fargo Advantage Government Money Market Fund (1) 39 Day Average 8,001,639Schwab Money Market Fund 53 Day Average 727,934Wells Fargo Heritage Money Market Fund (1)(2) 31 Day Average 2,394,243
Corporate Debt ObligationsSeptember 2013 - December 2022 1,231,162
Obligations of United States Government Agencies and InstrumentalitiesNovember 2013 -
April 2016 312,420American Depository Receipts N/A 383,035
United States Treasury NotesMarch 2015 - April
2017 160,722Common Stock N/A 3,205,024Total Investments, Primary Government 34,229,601$
Notes:
(1) These investments are classified as cash and cash equivalents on the basic financial statements.
(2) Includes $413,660, classified as cash and cash equivalents, held under a trust agreement with the Certificates of Participation, Series 2005A, financing arrangements. See Note VII B
53

District School Board of Martin County, Florida Notes to the Basic Financial Statements June 30, 2013
A reconciliation of cash and investments as shown on the Statement of Net Position and fiduciary funds for the primary government follows:
Statement of Net Position
Fair Value of Investments 34,229,601$ Cash in Bank 8,078,455Total 42,308,056$
Cash and Cash Equivalents - Statement of Net Position 33,447,964$ Cash and Cash Equivalents - Fiduciary Funds, Net of Temporary Negative Cash of $270,425 1,626,964 Total Cash and Cash Equivalents 35,074,928
Investments - Statements of Net Position 1,128,039 Investments - Pension Trust Fund 6,105,089 Total Investments 7,233,128 Total 42,308,056$
Interest Rate Risk
Interest rate risk is the risk that changes in interest rates will adversely affect the fair value of an investment. The District’s investment policy provides that investments of current operating funds shall have maturities of no longer than twelve (12) months. Investments of reserves, project funds, debt proceeds and other non-operating funds (“core fund”) shall have a term appropriate to the need for funds and in accordance with debt covenants, but in no event shall exceed five (5) years and the average duration of the funds as a whole may not exceed three (3) years.
The District utilizes “weighted average maturity” as a measurement of interest rate risk and as of June 30, 2013, the investment portfolio had a weighted average maturity of .25 years. The maturity of SBA Local Government Fund B Surplus Funds Trust Fund (Fund B) is based on the weighted average life (WAL). A portfolio’s WAL is the dollar weighted average length of time until securities held reach maturity. WAL is based on legal final maturity dates as of June 30, 2013. Fund B had a WAL of 3.98 years at June 30, 2013. However, because Fund B consists of restructured or defaulted securities, there is considerable uncertainty regarding WAL. Participation in Fund B is involuntary.
Credit Risk
Credit risk is the risk that an issuer or other counterparty to an investment will not fulfill its obligations. Section 218.415(16), Florida Statutes, provides the authority to invest in the SBA LGIP and limits investments in money market funds to Securities and Exchange Commission registered money market funds with the highest credit quality rating from a nationally recognized rating agency, and investments in interest-bearing time deposits to qualified public depositories, as defined in Section 280.02, Florida Statutes, and direct obligations of the United States Treasury.
The District invested available certificate of participation funds in AAAm-rated money market funds.
54
District School Board of Martin County, Florida Notes to the Basic Financial Statements June 30, 2013
The District’s investment policy permits for investments in the following investments, which are limited to credit quality ratings from nationally recognized rating agencies as follows:
The Florida Local Government Surplus Funds Trust Fund (“Florida PRIME”) shall be rated “AAAm” or “AAAm-G” or better by Standards & Poor’s or the equivalent by another rating agency.
Commercial paper of any United States company that is rated, at the time or purchase, “Prime-1” by Moody’s Investors Service and “A-1” by Standard & Poor’s (prime commercial paper).
Bankers’ acceptances issued by a domestic bank or a federally chartered domestic office of a foreign bank, which are eligible for purchase by the Federal Reserve System, at the time or purchase, the short-term paper is rated, at a minimum, “P-1” by Moody’s and “A-1” Standard & Poor’s.
State and/or local government taxable and/or tax-exempt debt, general obligation and/or revenue bonds, rated at least “Aa” by Moody’s and “AA” by Standard & Poor’s for long-term debt, or rated at least “MIG-1” by Moody’s and “SP-1” by Standard & Poor’s for short-term debt.
Registered investment companies (money market mutual funds) shall be rated “AAAm” by Standard & Poor’s or the equivalent by another rating agency.
Intergovernmental investment pools shall be rated “AAAm” by Standard & Poor’s or the equivalent rating agency.
The District’s Early Retirement Trust Fund investment policy authorizes the following investments: SBA Florida PRIME; direct obligations of United States Treasury; United States Federal Government agency securities; corporate debt securities with at least an “A” rating; commercial paper rated A1/P1; certificates of deposits; common and preferred stocks from domestic or foreign corporations; and passbook savings accounts maintained in State certified qualified public depositories as defined in Section 280.02, Florida Statutes. As of June 30, 2013, all state and local government bonds and all Treasury notes and Federal Government instrumentalities were rated AA+ by Standard & Poor’s; and the District’s investments in corporate debt were rated A through AA+ by Standard & Poor’s.
The District’s investments in SBA Debt Service accounts are to provide for debt service payments on bond debt issued by the State Board of Education for the benefit of the District. The District relies on policies developed by SBA for managing credit risk for this account.
As of June 30, 2013, the District’s money market funds were individually rated AAAm by Standard & Poor’s. The District’s investments in Fund B and American depository receipts are not rated.
Custodial Credit Risk
Custodial credit risk for investments is the risk that, in the event of the failure of the counterparty to a transaction, the District will not be able to recover the value of investment or collateral securities that are in the possession of an outside party. Section 218.415(18), Florida Statutes, requires the District to earmark all investments and 1) if registered with the issuer or its agents, the investment must be
55
District School Board of Martin County, Florida Notes to the Basic Financial Statements June 30, 2013
immediately placed for safekeeping in a location that protects the governing body’s interest in the security; 2) if in book entry form, the investment must be held for the credit of the governing body by a depository chartered by the Federal Government, the State, or any other state or territory of the United States which has a branch or principal place of business in this State as defined in 658.12 F.S., or by a national association organized and existing under the laws of the United States which is authorized to accept and execute trusts and which is doing business in this State, and must be kept by the depository in an account separate and apart from the assets of the financial institution; or 3) if physically issued to the holder but not registered with the issuer or its agents, must be immediately placed for safekeeping in a secured vault. The District’s investments in obligations of the United States Government agencies and instrumentalities and corporate debt securities are held by the safekeeping agent, in the name of the District. As of June 30, 2013, the District’s investment portfolios were held with a third-party custodian as required by the District’s investment policy.
The District’s Early Retirement Trust Fund investment policy and Certificates of Participation, Series 2005A, trust agreement, require securities in those funds to be held by a safekeeping agent in the name of the District.
Concentration of Credit Risk
Concentration of credit risk is the risk of loss attributed to the magnitude of the District’s investment in a single issuer. The District’s investment policy has established asset allocation and issuer limits on the following investments which are designed to reduce concentration of credit risk of the District’s investment portfolio. A maximum of 25 percent of available funds, may be invested in the Florida Local Government Surplus Funds Trust Fund (“Florida PRIME”), 100 percent of available funds may be invested in United States Government Securities, 50 percent of available funds may be invested in United States Government agencies with a 25 percent limit on individual issuers, 75 percent of available funds may be invested in Federal instrumentalities with a 30 percent limit on individual issuers, 25 percent of available funds may be invested in interest bearing time deposit or savings accounts with a 15 percent limit on individual issuers, 50 percent of available funds may be invested in repurchase agreements with a 25 percent limit on individual issuers, 25 percent of available funds may be invested in commercial paper with a 5percent limit on individual issuers, 20 percent of available funds may be invested in state and/or local government taxable and/or tax-exempt debt, 75 percent of available funds may be invested in registered investment companies (money market mutual funds) with a 25 percent limit of individual issuers, 25 percent of available funds may be invested in intergovernmental investment pools, 50 percent of available funds may be invested in corporate obligations issued by financial institutions that participate in the FDIC’s Temporary Liquidity Guarantee Program with a 25 percent limit on individual issuers.
The District’s Early Retirement Plan (Plan) is governed by a separate investment policy that limits investment in equities to 70 percent of the total portfolio and limits the investment in any single issuer to 5 percent of the total portfolio. No investment by any one issuer represents 5 percent or more of the Plan’s assets.
NOTE V – DUE FROM OTHER GOVERNMENTAL AGENCIES
At June 30, 2013, the District has a total of approximately $1.5 million of Due from other Governmental Agencies consisting of $0.4 million for FEMA, $1.0 million for Federal grants, and $0.1 for food service.
56

District School Board of Martin County, Florida Notes to the Basic Financial Statements June 30, 2013
NOTE VI - CAPITAL ASSETS
Changes in capital assets are presented in the table below:
Balance BalanceGovernment Activities 7/1/2012 6/30/2013
Capital Assets Not being Depreciated:Land 10,354,648$ -$ -$ 10,354,648$ Construction in Progress 21,662,247 10,036,406 20,405,568 11,293,085 Sub total 32,016,895 10,036,406 20,405,568 21,647,733
Capital Assets being Depreciated:Improvements Other than Buildings 17,741,939 4,338,630 - 22,080,569$ Buildings and Fixed Equipment 430,527,740 19,778,868 19,481,756 430,824,852 Furniture, Fixtures, and Equipment 22,144,697 2,408,461 720,750 23,832,408 Motor Vehicles 9,565,327 475,175 116,492 9,924,010 Property Under Capital Lease 1,239,801 - - 1,239,801 Audio Visual Materials and Software 5,087,926 415,107 434,785 5,068,248 Sub total 486,307,430 27,416,241 20,753,783 492,969,888
Less Accumulated Depreciation for:Improvements Other than Buildings 9,431,999 820,480 - 10,252,479 Buildings and Fixed Equipment 105,118,026 8,425,500 12,800,676 100,742,850 Furniture, Fixtures, and Equipment 16,432,055 2,146,039 515,092 18,063,002 Motor Vehicles 6,342,409 956,172 115,573 7,183,008 Property Under Capital Lease 535,546 206,634 - 742,180 Audio Visual Materials and Software 4,261,750 525,778 424,901 4,362,627 Total Accumulated Depreciation 142,121,785 13,080,603 13,856,242 141,346,146
Depreciated Capital Assets - Net 344,185,645 14,335,638 6,897,541 351,623,742
Government Activities Funds Net 376,202,540$ 24,372,044$ 27,303,109$ 373,271,475$
Additions Deletions
The class and amount of property under capital lease is presented on Note VIIA.
Depreciation expense was charged to functions/programs of the District as follows:
Instruction 47,724$ Pupil Personnel 1,945 Instructional Media Services 2,371 Instruction and Curriculum Development Services 9,319 Facilities Services 12,940,610 Food Services 74,558 Community Services 4,076 Total Depreciation Expense 13,080,603$
57

District School Board of Martin County, Florida Notes to the Basic Financial Statements June 30, 2013
NOTE VII – LONG-TERM OBLIGATIONS
A. OBLIGATIONS UNDER CAPITAL LEASE
The class and amount of property being acquired under capital lease are as follows:
Asset Balance Copy Machines $1,239,801
Future minimum capital lease payments and the present value of the minimum lease payment as of June 30 are as follows:
Fiscal Year Total Principal Interest2014 213,295 194,671 18,624 2015 213,295 204,631 8,664 2016 62,338 61,602 736 Total 488,928$ 460,904$ 28,024$
Capital Lease
The stated interest rates are 5.0 percent.
B. CERTIFICATES OF PARTICIPATION
The District entered into a financing arrangement which was characterized as a lease-purchase agreement, with the Leasing Corporation whereby the District secured financing in the total amount of $40,790,000. The financing was accomplished through the issuance of Certificates of Participation, Series 2005A, to be repaid from the proceeds of rents paid by the District.
As a condition of the financing arrangement, the District has given a ground lease on District property to the Leasing Corporation, with a rental fee of $1 per year. The initial term of the lease commenced on December 1, 2005, and will end on July 1, 2031. The lease is automatically renewable annually thereafter through July 1, 2031, unless terminated sooner in accordance with the provisions of the Series 2005A financing arrangement. The property covered by the ground lease is, together with the improvements constructed thereon from the financing proceeds, leased back to the District. If the District fails to renew the lease and to provide for the rent payments through to term, the District may be required to surrender the site included under the Ground Lease Agreement for the benefit of the securers of the Certificates for a period of time specified by the arrangement which may be up to 30 years from the date of inception of the arrangement.
The District property included in the ground lease under this arrangement is the Dr. David L. Anderson Middle School.
The lease payments are payable by the District, semiannually, on July 1 and January 1 at interest rates ranging from 3.9 to 4.5 percent. The following is a schedule by years of future minimum lease payments under the lease agreement together with the present value of minimum lease payments as of June 30:
58

District School Board of Martin County, Florida Notes to the Basic Financial Statements June 30, 2013
Fiscal Year Principal Interest Total2014 1,215,000 1,505,191 2,720,191 2015 1,265,000 1,456,224 2,721,224 2016 1,310,000 1,405,356 2,715,356 2017 1,365,000 1,351,856 2,716,856 2018 1,420,000 1,295,269 2,715,269
2019-2023 8,050,000 5,502,356 13,552,356 2024-2028 9,975,000 3,514,281 13,489,281 2029-2032 9,760,000 986,597 10,746,597
Total 34,360,000$ 17,017,130$ 51,377,130$
Certificates of Participation
C. BONDS PAYABLE
Bonds payable at June 30, 2013, are as follows:
State School Bonds:Series 2004A 4.00% - 4.625% 2024 2,140,000 Series 2005B 5.00% 2020 2,310,000 Series 2006A 4.424% - 4.628% 2026 2,500,000 Series 2008A 3.50% - 5.00% 2028 820,000 Series 2009A 4.00% - 5.00% 2019 185,000 Series 2010A 4.00% - 5.00% 2022 1,120,000 Series 2011A 3.00% - 5.00% 2023 1,505,000
$ 10,580,000
Bond Type Interest RateAnnual
Maturity toAmount
Outstanding
Total Bonds Payable
The various bonds were issued to finance capital outlay projects of the District. The following is a description of the bonded debt issues:
State School Bonds
These bonds are issued by the State Board of Education on behalf of the District. The bonds mature serially, and are secured by a pledge of the District's portion of the State-assessed motor vehicle license tax. The State's full faith and credit is also pledged as security for these bonds. Principal and interest payments, investment of Debt Service Fund resources, and compliance with reserve requirements are administered by the State Board of Education and the State Board of Administration.
59

District School Board of Martin County, Florida Notes to the Basic Financial Statements June 30, 2013
Annual requirements to amortize all bonded debt outstanding as of June 30, 2013, are as follows:
Fiscal Year Principal Interest Total2014 935,000 488,540 1,423,540 2015 980,000 444,915 1,424,915 2016 1,030,000 398,630 1,428,630 2017 1,085,000 349,905 1,434,905 2018 1,140,000 298,343 1,438,343
2019-2023 3,925,000 870,125 4,795,125 2024-2028 1,485,000 149,744 1,634,744
Total 10,580,000$ 3,000,202$ $ 13,580,202
Bonds Payable
D. CHANGES IN LONG-TERM LIABILITIES
The following is a summary of changes in long-term liabilities:
Balance Additions Deletions Balance Due in7/1/2012 6/30/2013 One Year
Obligations Under Capital Lease 646,100$ -$ 185,196$ 460,904$ 194,671$ Bonds Payable 13,165,000 - 2,585,000 10,580,000 935,000 Certificates of Participation 35,530,000 - 1,170,000 34,360,000 1,215,000 Compensated Absences Payable 17,059,894 2,997,521 6,192,978 13,864,437 2,071,833 Other Postemployment Benefits Obligation 48,785,046 14,469,519 3,198,451 60,056,114 - Total Governmental Activities 115,186,040$ 17,467,040$ 13,331,625$ 119,321,455$ 4,416,504$
GOVERNMENTAL ACTIVITIES
For the governmental activities, compensated absences are generally liquidated with resources of the General Fund, and other postemployment benefits are generally liquidated with resources of the General Fund and special revenue funds.
60

District School Board of Martin County, Florida Notes to the Basic Financial Statements June 30, 2013
NOTE VIII - INTERFUND TRANSFERS
Transfers In Transfers Out
Major Funds:General 6,260,089$ 316,984$ Capital Projects:
Local Capital Improvement Tax 240,491 7,262,909 Nonmajor Governmental Funds 2,799,313 1,720,000
Total 9,299,893$ 9,299,893$
The purpose of the transfers from the Local Capital Improvement Tax Fund to the General Fund was for property insurance premium payments and annual maintenance costs. Transfers out from the Local Capital Improvement Tax Fund and the nonmajor Other Capital Projects Fund to the nonmajor Debt Service – Other Fund were made in order to make the required interest and principal payment for the Certificates of Participation, Series 2005A. The purpose of the transfer out from General Fund to the nonmajor Food Service Fund was to provide School Recognition bonuses to food service workers. The reason for the transfers out from the General Fund to the Local Capital Improvement Tax Fund was for reimbursement of indirect costs of finance, payroll, purchasing, and operations department personnel salaries and benefits charged that were considered unallowable costs in the 2011-12 fiscal year.
NOTE IX – EMPLOYEE BENEFITS A. STATE RETIREMENT PROGRAM
Essentially all regular employees of the District are eligible to enroll as members of the State-administered Florida Retirement System (FRS). Provisions relating to the FRS are established by Chapters 121 and 122, Florida Statutes; Chapter 112, Part IV, Florida Statutes; Chapter 238, Florida Statutes; and Florida Retirement System Rules, Chapter 60S, Florida Administrative Code, wherein eligibility, contributions, and benefits are defined and described in detail. The FRS is a single retirement system administered by the Florida Department of Management Services, Division of Retirement, and consists of two cost-sharing, multiple-employer retirement plans and other nonintegrated programs. These include a defined benefit pension plan (Plan), a Deferred Retirement Option Program (DROP), and a defined contribution plan, referred to as the Florida Retirement System Investment Plan (Investment Plan).
Employees enrolled in the Plan prior to July 1, 2011, vest at six years of creditable service and employees enrolled in the Plan on or after July 1, 2011, vest at eight years of creditable service. All vested members, enrolled prior to July 1, 2011, are eligible for normal retirement benefits at age 62 or at any age after 30 years of service. All members enrolled in the Plan on or after July 1, 2011, once vested, are eligible for normal retirement benefits at age 65 or any time after 33 years of creditable service. Members of both plans may include up to 4 years of credit for military service toward creditable service. The Plan also includes an early retirement provision; however, there is a benefit reduction for each year a member retires before his or her normal retirement date. The Plan provides retirement, disability, and death benefits and annual cost-of-living adjustments.
61

District School Board of Martin County, Florida Notes to the Basic Financial Statements June 30, 2013
DROP, subject to provisions of Section 121.091, Florida Statutes, permits employees eligible for normal retirement under the Plan to defer receipt of monthly benefit payments while continuing employment with an FRS employer. An employee may participate in DROP for a period not to exceed 60 months after electing to participate, except that certain instructional personnel may participate for up to 96 months. During the period of DROP participation, deferred monthly benefits are held in the FRS Trust Fund and accrue interest.
As provided in Section 121.4501, Florida Statutes, eligible FRS members may elect to participate in the Investment Plan in lieu of the FRS defined-benefit plan. District employees participating in DROP are not eligible to participate in this program. Employer and employee contributions are defined by law, but the ultimate benefit depends in part on the performance of investment funds. The Investment Plan is funded by employer and employee contributions that are based on salary and membership class (Regular, Senior Management Service, etc.). Contributions are directed to individual member accounts, and the individual members allocate contributions and account balances among various approved investment choices. Employees in the Investment Plan vest at one year of service.
The contribution rates for members are established, and may be amended, by the State of Florida. During the 2012-13 fiscal year, contribution rates were as follows:
Class Employee Employer (a)
Florida Retirement System, Regular 3.00 5.18
Florida Retirement System, Elected County Officers 3.00 10.23
Florida Retirement System, Senior Management Service 3.00 6.30
Deferred Retirement Option Program – applicable to all members of the above classes - 5.44
Florida Retirement System, Re-employed Retiree (b) (b)
Notes:
(b) Contribution rates are dependent upon the retirement class in which reemployed.
Percent of Gross Salary
(a) Employer rates include 1.11 percent for the postemployment health insurance subsidy. Also, employer rates, other than for DROP participants, include 0.03 percent for administrative costs of the Investment Plan.
The District’s liability for participation is limited to the payment of the required contribution at the rates and frequencies established by law on future payrolls of the District. The District’s contributions including employee contributions for the fiscal year ending June 30, 2011, June 30, 2012, and June 30, 2013, totaled $9,060,783, $6,070,822, and $6,344,191 respectively, which were equal to the required contributions for each fiscal year.
There were 476 District participants in the Investment Plan during the 2012-13 fiscal year. The District’s contributions, including employee contributions to the Investment Plan totaled $1,375,019, which was equal to the required contribution for the 2012-13 fiscal year.
62

District School Board of Martin County, Florida Notes to the Basic Financial Statements June 30, 2013
Financial statements and other supplementary information of the FRS are included in the State’s Comprehensive Annual Financial Report, which is available from the Florida Department of Financial Services. An annual report on the FRS, which includes its financial statements, required supplemental information, actuarial report, and other relevant information, is available from the Florida Department of Management Services, Division of Retirement.
B. EARLY RETIREMENT PLAN
Plan Description
As authorized by Section 1012.685, Florida Statutes, the District implemented an Early Retirement Plan (Plan) effective July 1, 1986. The Plan is a single-employer defined benefit pension plan. The purpose of the Plan is to provide District employees, who elected to retire under the early retirement provisions of the Florida Retirement System, described in Note IX A, with a monthly benefit equal to the statutory reduction of the normal retirement benefits when early retirement proceeds the normal retirement. The District administers Plan assets in a Pension Trust Fund and is responsible for their investment. The District acts as the administrative agent for the Plan. The Plan does not issue a stand-alone financial report and is not included in the report of a public employee retirement system or another entity.
As of June 30, 2013, the Plan had 79 active plan participants receiving benefits.
A summary of eligibility and benefits follows:
Eligibility
During the 2002-03 fiscal year, the Plan was amended by union contract to limit future eligibility to only those employees who elected to remain covered by the Plan and who become eligible within the next seven years. A total of 41 employees chose to enter the Plan. These employees have elected a specific retirement date and must retire on that date if they are still employed by the District. No additional employees are eligible to join the Plan.
Benefits
The amount of monthly benefits will be equal to the reduction imposed on the retirement benefit by the Florida Retirement System due to early retirement and will increase annually at the rate of 3 percent. Benefits and refunds of the Plan are recognized when due and payable in accordance with the terms of the plan.
Summary of Significant Accounting Policies
Significant accounting policies related to basis of accounting and method of asset valuation are disclosed in Note I. Investment disclosures related to the Pension Trust Fund are in Note IV.
Contributions and Reserves
The Plan was established by the Board on July 1, 1986, and may be amended by Board action. Pursuant to the Plan agreement, no contributions shall be required or permitted from any member. District contributions shall be sufficient to meet the annual pension cost of the Plan and to amortize the unfunded actuarial accrued liability within 20 years based on an actuarial study. Subsequent changes in the level of the liability due to plan amendments or changes in actuarial assumptions are to be amortized on a straight-line basis over a period of 20 years.
63
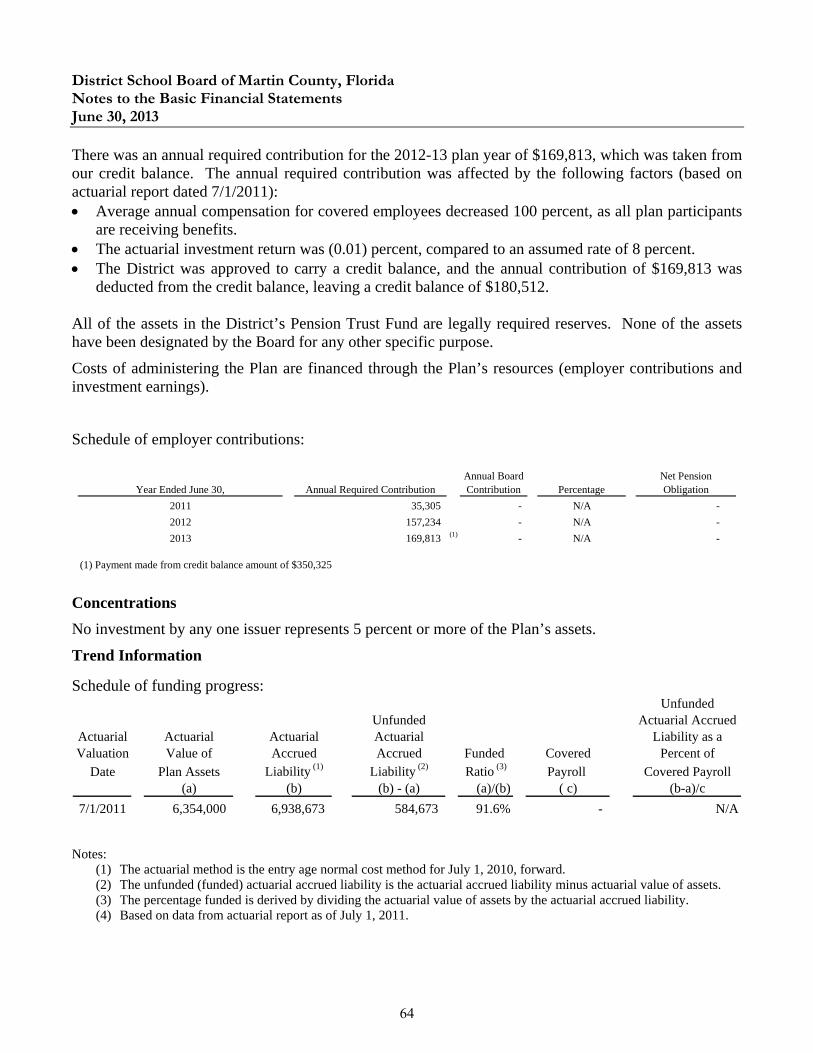
District School Board of Martin County, Florida Notes to the Basic Financial Statements June 30, 2013
There was an annual required contribution for the 2012-13 plan year of $169,813, which was taken from our credit balance. The annual required contribution was affected by the following factors (based on actuarial report dated 7/1/2011): Average annual compensation for covered employees decreased 100 percent, as all plan participants
are receiving benefits. The actuarial investment return was (0.01) percent, compared to an assumed rate of 8 percent. The District was approved to carry a credit balance, and the annual contribution of $169,813 was
deducted from the credit balance, leaving a credit balance of $180,512.
All of the assets in the District’s Pension Trust Fund are legally required reserves. None of the assets have been designated by the Board for any other specific purpose.
Costs of administering the Plan are financed through the Plan’s resources (employer contributions and investment earnings).
Schedule of employer contributions:
Year Ended June 30, Annual Required ContributionAnnual Board Contribution Percentage
Net Pension Obligation
2011 35,305 - N/A -
2012 157,234 - N/A -
2013 169,813 (1) - N/A -
(1) Payment made from credit balance amount of $350,325
Concentrations
No investment by any one issuer represents 5 percent or more of the Plan’s assets.
Trend Information
Schedule of funding progress: Unfunded
Unfunded Actuarial AccruedActuarial Actuarial Actuarial Actuarial Liability as aValuation Value of Accrued Accrued Funded Covered Percent of
Date Plan Assets Liability (1) Liability (2) Ratio (3) Payroll Covered Payroll(a) (b) (b) - (a) (a)/(b) ( c) (b-a)/c
7/1/2011 6,354,000 6,938,673 584,673 91.6% - N/A
Notes: (1) The actuarial method is the entry age normal cost method for July 1, 2010, forward. (2) The unfunded (funded) actuarial accrued liability is the actuarial accrued liability minus actuarial value of assets. (3) The percentage funded is derived by dividing the actuarial value of assets by the actuarial accrued liability. (4) Based on data from actuarial report as of July 1, 2011.
64
District School Board of Martin County, Florida Notes to the Basic Financial Statements June 30, 2013
The required schedule of funding progress immediately following the notes to the basic financial statements presents multiyear trend information about whether the actuarial value of Plan assets is increasing or decreasing over time relative to the actuarial accrued liability for benefits. Actuarial Methods and Assumptions
The projection of benefits for financial reporting purposes does not explicitly incorporate the potential effects of legal or contractual funding limitations.
Additional information as of the latest actuarial valuation is as follows:
Valuation Date 7/1/2011Actuarial Cost MethodAmortization Method Open Amortization, Level DollarRemaining Amortization Period 5 YearsAsset Valuation Method Smoothed market valueActuarial Assumptions: Investment Rate of Return 8.0% Projected Salary Increases Not Applicable
Inflation Rate 3.0% Postemployment Benefit Increases 3.0%
Entry Age Normal Cost Method
C. OTHER POSTEMPLOYMENT BENEFITS
Plan Description. The Other Postemployment Benefits Plan (OPEB Plan) is a single-employer defined benefit plan administered by the District. Pursuant to Section 112.0801, Florida Statutes, the District must offer similar health care benefits for retired employees as it does to active employees. The District subsidizes the premium rates paid by retirees by allowing them to participate in the OPEB Plan at reduced or blended group (implicitly subsidized) premium rates for both active and retired employees for health, dental, vision, and life insurance benefits. These rates provide an implicit subsidy for retirees because, on an actuarial basis, their current and future claims are expected to result in higher costs to the OPEB Plan on average than those of active employees. Additionally, certain retirees receive insurance coverage at a lower (explicitly subsidized) premium rate than active employees. All of the District's employees may become eligible for those benefits if they reach normal retirement age (as defined by the pension or investment option) and have at least six years of service with the District and are activating their pension upon separation from service. Also, in accordance with union contracts and District policy, the District pays 25 percent of this benefit for employees with 15 years of service, 50 percent with 20 years of service, 75 percent for employees with 25 years of service, and 100 percent for employees with 30 years of service. For employees hired as of July 1, 2011, or later, no insurance will be paid upon retirement. All service must be within the District. Retirees are required to enroll in the Federal Medicare program for their primary coverage as soon as they are eligible. The OPEB Plan does not issue a stand-alone report and is not included in the report of a public employee retirement system or another entity.
65

District School Board of Martin County, Florida Notes to the Basic Financial Statements June 30, 2013
Funding Policy. The District has not advance-funded or established a funding methodology for the annual Other Postemployment Benefit (OPEB) costs or the net OPEB obligation, and the OPEB Plan is financed on a pay-as-you-go basis. For the 2012-13 fiscal year, 544 retirees received postemployment benefits. The District provided required contributions of $3,198,451 toward the annual OPEB cost, comprised of premium payments made on behalf of retirees net of retiree contributions totaling $2,076,346, which represents 2.4 percent of covered payroll. Annual OPEB Cost and Net OPEB Obligation. The District’s annual OPEB cost (expense) is calculated based on the annual required contribution (ARC), an amount actuarially determined in accordance with parameters of GASB Statement No. 45, Accounting and Financial Reporting by Employers for Postemployment Benefits Other Than Pensions. The ARC represents a level of funding that, if paid on an ongoing basis, is projected to cover normal costs each year and amortize any unfunded actuarial liability over a period not to exceed 30 years. The following table shows the District’s annual OPEB cost for the year, the amount actually contributed to the plan, and the changes in the District’s net OPEB obligation for postemployment benefits:
Description Amount
Normal Cost (service cost for one year) 7,278,157$ Amortization of Unfunded Actuarial Accrued Liability 7,171,733
Annual Required Contribution 14,449,890 Interest on Net OPEB Obligation 1,848,953 Adjustment to Annual Required Contribution (1,829,324)
Annual OPEB Cost (Expense) 14,469,519 Contribution Toward the OPEB Cost (3,198,451)
Increase in Net OPEB Obligation 11,271,068 Net OPEB Obligation, Beginning of Year 48,785,046
Net OPEB Obligation, End of Year 60,056,114$
The District’s annual OPEB cost, the percentage of annual OPEB cost contributed to the plan, and the net OPEB obligation as of June 30, 2013, and the preceding two years, were as follows:
66

District School Board of Martin County, Florida Notes to the Basic Financial Statements June 30, 2013
Fiscal YearAnnual OPEB
Cost
Percentage of Annual OPEB
Cost Contributed
Net OPEB Obligation
2010-11 $ 14,026,570 24.47% $ 37,835,420 2011-12 13,771,116 20.49% 48,785,046
2012-13 14,469,519 22.10% 60,056,114
Funded Status and Funding Progress. As of January 1, 2012, the most recent valuation, the actuarial accrued liability for benefits was $177,191,403, and the actuarial value of assets was $0, resulting in an unfunded actuarial accrued liability of $177,191,403 and a funded ratio of 0 percent. The covered payroll (annual payroll of active participating employees) was $87,746,600, and the ratio of the unfunded actuarial accrued liability to the covered payroll was 201.94 percent. Actuarial valuations of an ongoing plan involve estimates of the value of reported amounts and assumptions about the probability of occurrence of events far into the future. Examples include assumptions about future employment and termination, mortality, and the healthcare cost trends. Amounts determined regarding the funded status of the plan and the annual required contributions of the employer are subject to continual revision as actual results are compared with past expectations and new estimates are made about the future. The required schedule of funding progress immediately following the notes to the basic financial statements presents multiyear trend information about whether the actuarial value of plan assets is increasing or decreasing over time relative to the actuarial accrued liability for benefits. Actuarial Methods and Assumptions. Projections of benefits for financial reporting purposes are based on the substantive plan provisions, as understood by the employer and participating members, and include the types of benefits provided at the time of each valuation and the historical pattern of sharing of benefit costs between the employer and participating members. The actuarial methods and assumptions used include techniques that are designed to reduce the effects of short-term volatility in actuarial accrued liabilities and the actuarial value of assets, consistent with the long-term perspective of the calculations. The District’s OPEB actuarial valuation as of January 1, 2012, used the individual entry age normal cost actuarial cost method to estimate the unfunded actuarial liability as of June 30, 2013, and to estimate the 2012-13 fiscal year annual required contribution. Because the OPEB liability is currently unfunded, the actuarial assumptions included a 3.79 percent rate of return on invested assets, which is the District’s expectation of investment returns under its investment policy. The actuarial assumptions also included a payroll growth rate of 4 percent per year, an annual healthcare cost trend rate of 12.9 percent initially for the 2012-13 fiscal year, reduced by an average of 1.13 percent per year, to an ultimate rate of 5.0 percent for the fiscal year ending June 30, 2019, and a general price inflation rate of 3 percent per year. The unfunded actuarial accrued liability is being amortized as a level percentage of projected payroll on a closed basis. The remaining amortization period at June 30, 2013, was 25 years.
67

District School Board of Martin County, Florida Notes to the Basic Financial Statements June 30, 2013
NOTE X – OTHER INFORMATION
A. SCHEDULE OF STATE REVENUE SOURCES
The following is a schedule of the District’s State revenue sources for the 2012-13 fiscal year:
AmountCategorical Program (Class Size Reduction) 20,564,881$ Florida Education Finance Program 8,354,799 Workforce Development Program 1,928,688 Motor Vehicle License Tax (Capital Outlay and Debt Service) 1,650,205 School Recognition 1,376,338 Voluntary Prekindergarten 591,625 Adults with Disabilities 242,797 Gross Receipts Tax (Public Education Capital Outlay) 94,689 Miscellaneous 409,306 Total 35,213,328$
Source
Accounting policies relating to certain State revenue sources are described in Note I.E.1.
B. RISK MANAGEMENT PROGRAMS
The District is exposed to various risks of loss related to torts; theft of, damage to, and destruction of assets; errors and omissions; injuries to employees; third party injuries and/or property damage and natural disasters. The District is a member of the South Central Educational Risk Management Program (SCERMP), a consortium under which eight district school boards have established a public entity risk sharing-pool for Property, General Liability, Automobile Liability, Workers' Compensation, Government Crime and other coverage deemed necessary by the members of the SCERMP. Section 1001.42(12)(k), Florida Statutes, provides the authority for the District to enter into such a risk management program. The interlocal agreement and bylaws of SCERMP provide that risk of loss is transferred to the consortium. SCERMP is self-sustaining through member contributions (premiums), and purchased insurance coverage through commercial companies for claims in excess of specified amounts. Member school boards are also subject to supplemental contributions in the event of a deficiency except to the extent that the deficiency results from a specific claim against a member school board in excess of the coverage available, then such deficiency is solely the responsibility of that member school board.
The Board of Directors for SCERMP is composed of superintendents/finance directors or an authorized representative of all participating districts. Ascension, Inc. serves as the third-party administrator, insurance broker, and fiscal agent for SCERMP.
Property damage coverage is managed by SCERMP by purchase of excess property coverage through commercial insurance carriers for property loss claims in excess of $100,000 (except named wind and flood), respectively. The named wind/hurricane deductible is 5 percent of replacement cost value with a minimum of $100,000 per occurrence. The deductibles for all other wind events is $100,000. Special hazard flood area deductibles are $500,000 per building and $500,000 contents plus $100,000 time element per occurrence. The flood deductible outside a special flood hazard area is $100,000.
68

District School Board of Martin County, Florida Notes to the Basic Financial Statements June 30, 2013
SCERMP’s purchased excess property loss limit during the 2012-13 fiscal year was $100 million, except for Flood/Earthquake of $75 million.
Workers’ compensation claims are limited based on a per claim self-insured retention. The self-insured retention for the 2012-13 fiscal year was $850,000. SCERMP purchases excess liability coverage through a commercial insurance carrier, which covers workers’ compensation losses in excess of the self-insured retention. Employers liability is included subject to $2,000,000 per occurrence and $4,000,000 in the aggregate.
The District is protected by Section 768.28, Florida Statutes, under the Doctrine of Sovereign Immunity, as it is now written, as it may be amended by the Legislature at future dates, which effectively limits the amount of liability of governmental entities for tort claims to $200,000 per claim and $300,000 per occurrence.
As a result of recording a liability for specific reserves for claims incurred, but not reported, the property and casualty group has ending retained earnings of $8,928,540. The District’s portion of the retained earnings is calculated at 14.61 percent of the total or $1,304,460.
During the 2012-13 fiscal year, the Board provided health and prescription insurance through purchased commercial insurance. Dental and vision coverage were also provided through purchased commercial insurance under a separate agreement.
Settled claims resulting from these risks described above have not exceeded commercial insurance coverage in any of the past three fiscal years.
C. CONSTRUCTION AND OTHER SIGNIFICANT COMMITMENTS
Encumbrances Appropriations in governmental funds are encumbered upon issuance of purchase orders for goods and services. Even though appropriations lapse at the end of the fiscal year, unfilled purchase orders of the current year are carried forward and the next year’s appropriations are likewise encumbered. The following is a schedule of encumbrances at June 30, 2013:
Special Revenue - Capital Projects - Special Revenue - Federal Local Capital Nonmajor Total
Other Federal Economic Improvement Governmental GovernmentalGeneral Programs Stimulus Tax Funds Funds
97,986$ 2,607$ 15,267$ 9,206,506$ 61,303$ 9,383,669$
Major Funds
69

District School Board of Martin County, Florida Notes to the Basic Financial Statements June 30, 2013
Construction Contracts Encumbrances include the following major construction contract commitments remaining at fiscal year-end:
Project Contract AmountCompleted to
DateBalance
Committed
Martin County High School Architect 1,310,674 1,182,046 128,628
Phase III Replace Classrooms 3108 Contractor 10,681,318 7,355,612 3,325,706
South Fork High School Architect 39,522 39,522 -
Building and Site Improvement Project 3204 Contractor 1,707,689 1,651,668 56,021
13,739,203$ 10,228,848$ 3,510,355$
D. FUND BALANCE REPORTING
GASB Statement No. 54, Fund Balance Reporting and Governmental Fund Types Definitions, establishes hierarchy for fund balance classifications and the constraints imposed on the uses of the resources. The District reports its governmental fund balances in the following categories, as applicable: Nonspendable The net current financial resources that cannot be spent because they are either not in spendable form or are legally or contractually required to be maintained intact. Generally, not in spendable form means that an item is not expected to be converted to cash. Examples of items that are not in spendable form include inventory, prepaid amounts, long-term amounts of loans and notes receivable, and property acquired for resale. The District classifies its amounts reported as inventories, Fund B investments, and prepaid amounts as nonspendable. Restricted The portion of fund balance on which constraints have been placed by creditors, grantors, contributors, laws or regulations of other governments, constitutional provisions, or enabling legislation. Restricted fund balance places the most binding level of constraint on the use of fund balance. The District classifies most of its fund balances other than General Fund as restricted, as well as unspent State categorical and earmarked educational funding reported in the General Fund, that are legally or otherwise restricted. Committed The portion of fund balance that can only be used for specific purposes pursuant to constraints imposed by formal action of the highest level of decision-making authority (i.e. the Board). These amounts cannot be used for any other purpose unless the Board removes or changes the specified use by taking the same action it employed to previously commit the amounts. The District did not have any committed balance as of June 30, 2013.
70

District School Board of Martin County, Florida Notes to the Basic Financial Statements June 30, 2013
Assigned The portion of fund balance that is intended to be used for specific purposes, but is neither restricted nor committed. Assigned amounts include those that have been set aside for a specific purpose by an authorized government body or official, but the constraint imposed does not satisfy the criteria to be classified as restricted or committed. The District does not have a policy regarding the assignment of fund balance. The Board authorized the Superintendent and the Director of Finance to assign fund balance by approval of the annual financial report. This category includes any remaining positive amounts, for governmental funds other than the General Fund, not classified as nonspendable, restricted, or committed. Unassigned The portion of fund balance that is residual classification for the General Fund. This balance represents amounts that have not been assigned to other funds and that have not been restricted, committed, or assigned for specific purposes.
71

District School Board of Martin County, Florida Notes to the Basic Financial Statements June 30, 2013
The following is a schedule of fund balances by category at June 30, 2013:
Special Revenue - Special Revenue - Capital Projects -Other Federal Local Capital Nonmajor Total
Federal Economic Improvement Governmental GovernmentalGeneral Programs Stimulus Tax Funds Funds
Fund BalancesNonspendable:
Inventories 422,333$ -$ -$ -$ 158,635$ 580,968$ Prepaid Items 49,066 - - - - 49,066 Investments - Fund B 121,802 - - 553,876 189,194 864,872
Spendable:Restricted:
State Req. Carryover 1,077,255 - - - - 1,077,255 Food Service - - - - 2,884,890 2,884,890 Debt Service - - - - 266,278 266,278 Capital Projects - - - 19,274,332 1,454,866 20,729,198 Tourism Awareness Trust - - - - 71,739 71,739
Assigned for purchaseobligations 97,986 - - - - 97,986
Unassigned 3,177,357 - - - - 3,177,357 Total Fund Balances 4,945,799$ -$ -$ 19,828,208$ 5,025,602$ 29,799,609$
Major Funds
Minimum Fund Balance Policy The District has adopted Board Policy 6210, which provides that the Board shall strive to maintain an unassigned fund balance in its operating funds equal to five (5) percent of the annual resources. The District prepares its operating budget to maintain a five (5) percent unassigned fund balance to comply with the intent of Section 1011.051, Florida Statutes. On June 6, 2013, the Board approved a waiver of Board Policy 6210 that governs the five (5) percent unassigned fund balance in its operating funds. It is the intent of the Board to implement strategies over the next two fiscal school years to achieve an unassigned fund balance of five (5) percent by June 30, 2015. NOTE XI – SUBSEQUENT EVENTS On September 17, 2013, the School Board approved the issuance of Tax Anticipation Notes in the amount of $9.9 million. The proceeds will be used for operating purposes for the fiscal year ending June 30, 2014.
72

OTHER REQUIRED SUPPLEMENTARY INFORMATION
SCHEDULE OF FUNDING PROGRESS- EARLY RETIREMENT PLAN
SCHEDULE OF EMPLOYER CONTRIBTIONS- EARLY RETIREMENT PLAN
SCHEDULE OF FUNDING PROGRESS– OTHER POSTEMPLOYMENT BENEFITS PLAN
73

District School Board of Martin County, Florida Required Supplementary Information – Schedule of Funding Progress Early Retirement Plan
UnfundedUnfunded Actuarial Accrued
Actuarial Actuarial Actuarial Liability as aActuarial Value of Accrued Accrued Funded Covered Percent of
Valuation Plan Assets (10)
Liability (1)
Liability (2)
Ratio (3)
Payroll (9)
Covered PayrollDate (a) (b) (b) - (a) (a)/(b) ( c) (b-a)/c
7/1/2003 6,327,916$ 6,333,190$ (4)
5,274$ 99.9% 1,347,779$ (4)
0.4%
7/1/2004 7,774,204 6,497,402 (4)
(1,276,802) 119.7% 1,408,429 (4)
-90.7%
7/1/2005 7,897,497 6,626,487 (4)
(1,271,010) 119.2% 1,023,281 (4)
-124.2%
7/1/2006 7,967,973 6,724,542 (4)
(1,243,431) 118.5% 1,069,329 (4)
-116.3%
7/1/2007 8,751,289 6,954,311 (5)
(1,796,978) 125.8% 838,930 (5)
-214.2%
7/1/2009 5,906,314 6,909,111 (6)
1,002,797 85.5% 314,007 (6)
319.4%
7/1/2010 6,880,004 6,975,955 (7)
95,951 98.6% 57,637 (7)
166.5%
7/1/2011 6,354,000 6,938,673 (8)
584,673 91.6% - (8)
N/A
Notes:
(1) The actuarial method is entry age normal cost method for July 1, 2010, forward. For years July 1, 2003 through July 1, 2006, the actuarial method used was entry age. For years July 1, 2007 through July 1, 2009, the actuarial method used was the aggregate cost method.
(2) The unfunded (funded) actuarial accrued liability is the actuarial accrued liability minus the actuarial value of assets.
(3) The percentage funded is derived by dividing the actuarial value of assets by the actuarial accrued liability. (4) Based on data from interim accounting valuation report as of July 1, 2006. (5) Based on data from actuarial report as of July 1, 2007. (6) Based on data from actuarial report as of July 1, 2009. (7) Based on data from actuarial report as of July 1, 2010. (8) Based on data from actuarial report as of July 1, 2011. (9) During the 2002-03 fiscal year, the Plan was amended by union contract to limit future eligibility to only
those employees who elected to remain covered by the Plan and who become eligible within the next seven years. Thus, covered payroll was eliminated as a result.
(10) The asset valuation method was changed from market value to a smoothed market value, which spreads recognition of the difference between actual and expected market value over five years. This method tempers the effect of large swings in the rate of return on the required contributions.
As the aggregate cost method does not identify or separately amortize unfunded actuarial accrued liabilities, information about funded status and funding progress is presented using the entry age actuarial cost method for that purpose, and the information presented is intended to serve as a surrogate for the funding progress of the plan.
74

District School Board of Martin County, Florida Required Supplementary Information – Schedule of Employer Contributions Early Retirement Plan
Annual Required Annual BoardFiscal Year Ended June 30 Contribution Contribution Percentage
2005 75,003$ 75,003$ 100%
2006 - - N/A
2007 - - N/A
2008 - - N/A
2009 - - N/A
2010 75,652 - N/A
2011 35,305 - N/A
2012 157,234 (1)
- N/A
2013 169,813 (2)
- N/A
(1) Payment made from credit balance amount of $350,325(2) Payment made from remaining fair market value credit balance.
75

This page was intentionally left blank
76

District School Board of Martin County, Florida Required Supplementary Information – Schedule of Funding Progress Other Postemployment Benefits Plan
Actuarial Accrued
Liability (AAL) - UAAL as a Actuarial Actuarial Value Entry Age Unfunded Percentage ofValuation of Assets Normal Cost AAL (UAAL) Funded Ratio Covered Payroll Covered Payroll
Date (A) (B) (B-A) (A/B) (C) [(B-A)/C]October 1, 2006 $ - $ 130,668,397 $ 130,668,397 0% $ 85,608,688 152.63%
January 1, 2009 - 170,035,245 170,035,245 0% 90,042,692 188.84%
January 1, 2012 - 177,191,403 177,191,403 0% 87,746,600 201.94%
Note: The District’s OPEB actuarial valuation used the entry age normal cost method to estimate the unfunded actuarial liability.
77

This page was intentionally left blank
78

COMBINING AND INDIVIDUAL FUND FINANCIAL STATEMENTS AND SCHEDULES
79

DISTRICT SCHOOL BOARD
OF MARTIN COUNTY, FLORIDA
Nonmajor Governmental Funds
Special Revenue Funds
The Special Revenue Funds account for certain revenues received from the State of Florida, the Federal Government and other local and private sources that are intended to finance designated activities. Activities included within the funds are as follows:
Food Service Fund - To account for and report on activities of the food service program when serving breakfast and lunch at the schools. Miscellaneous Special Revenue Fund - To account for and report on activities of the Travel and Tourism Funds.
Debt Service Funds
The Debt Service Funds are used to account for payment of interest and principal of the current portion of long-term debt. State Board of Education Bonds Fund - To account for and report on payment of principal, interest, and related costs on the state school bonds issued by the State Board of Education on behalf of the District. The-se bonds are payable from the District’s portion of the state-assessed motor vehicle license tax. Debt Service - Other Fund - To account for and report on other long term debt payments of principal, interest, and related costs including the Certificates of Participation, Series 2005A, debt issue.
80

DISTRICT SCHOOL BOARD
OF MARTIN COUNTY, FLORIDA
Nonmajor Governmental Funds (continued)
Capital Projects Funds
The Capital Projects Funds are used to account for the financing and acquisition or construction of major capital facilities, such as new school buildings or additions to existing buildings, or for major renovation projects. Specific funding sources included are: Public Education Capital Outlay - To account for capital project activity funded by the District’s portion of the State Public Education Capital Outlay Program. Capital Outlay and Debt Service Fund - To account for capital project activity funded by the District’s portion of the State Capital Outlay and Debt Service Program. Other Capital Projects Fund - To account for the financial resources generated by impact fees, fuel tax rebates, and other miscellaneous sources to be used for various capital outlay needs, including new construction, renovation and remodeling projects, environmental compliance, and maintenance of capital assets.
Fiduciary Funds
Fiduciary Funds are used to report resources held by the school district in a purely custodial capacity. Fiduciary funds typically involve only the receipt, temporary investment, and remittance of fiduciary resources to individuals, private organizations, or other governments. Private-Purpose Trust Funds - To account for scholarships and other purposes. Agency Fund - To account for the financial transactions of school organizations.
81
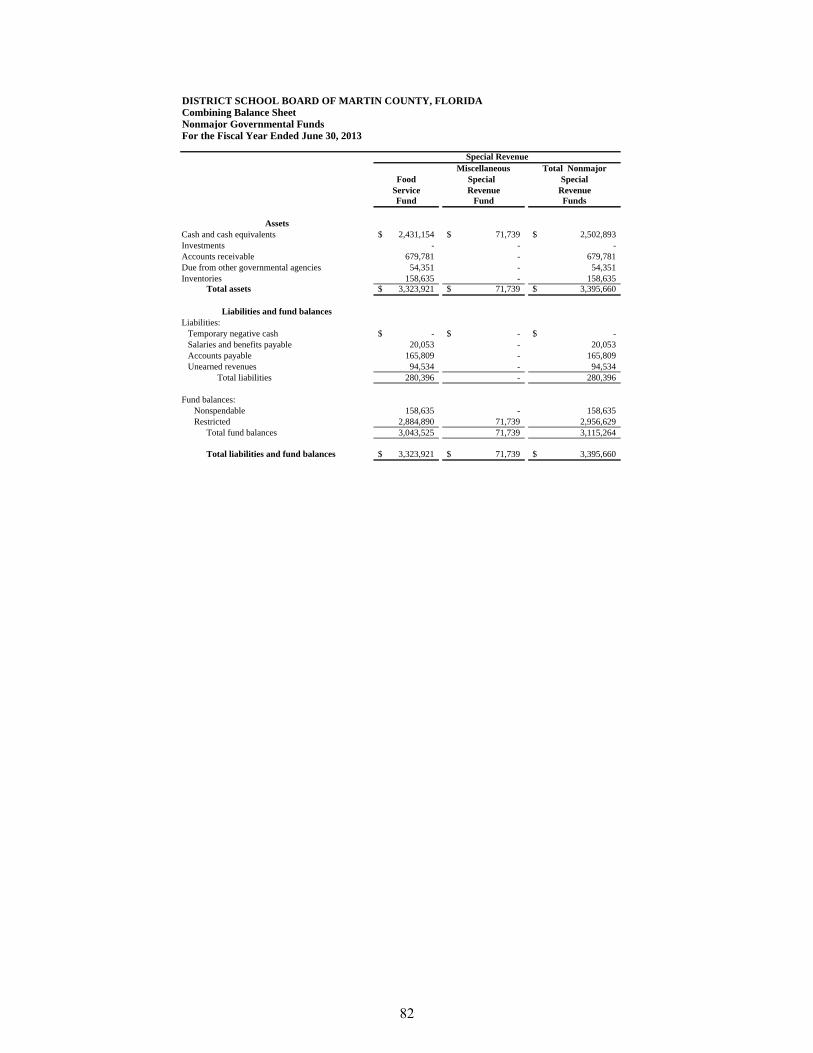
Miscellaneous Total NonmajorFood Special Special
Service Revenue RevenueFund Fund Funds
AssetsCash and cash equivalents 2,431,154$ 71,739$ 2,502,893$ Investments - - - Accounts receivable 679,781 - 679,781 Due from other governmental agencies 54,351 - 54,351 Inventories 158,635 - 158,635
Total assets 3,323,921$ 71,739$ 3,395,660$
Liabilities and fund balancesLiabilities:
Temporary negative cash -$ -$ -$ Salaries and benefits payable 20,053 - 20,053 Accounts payable 165,809 - 165,809 Unearned revenues 94,534 - 94,534
Total liabilities 280,396 - 280,396
Fund balances:Nonspendable 158,635 - 158,635 Restricted 2,884,890 71,739 2,956,629
Total fund balances 3,043,525 71,739 3,115,264
Total liabilities and fund balances 3,323,921$ 71,739$ 3,395,660$
DISTRICT SCHOOL BOARD OF MARTIN COUNTY, FLORIDACombining Balance SheetNonmajor Governmental FundsFor the Fiscal Year Ended June 30, 2013
Special Revenue
82
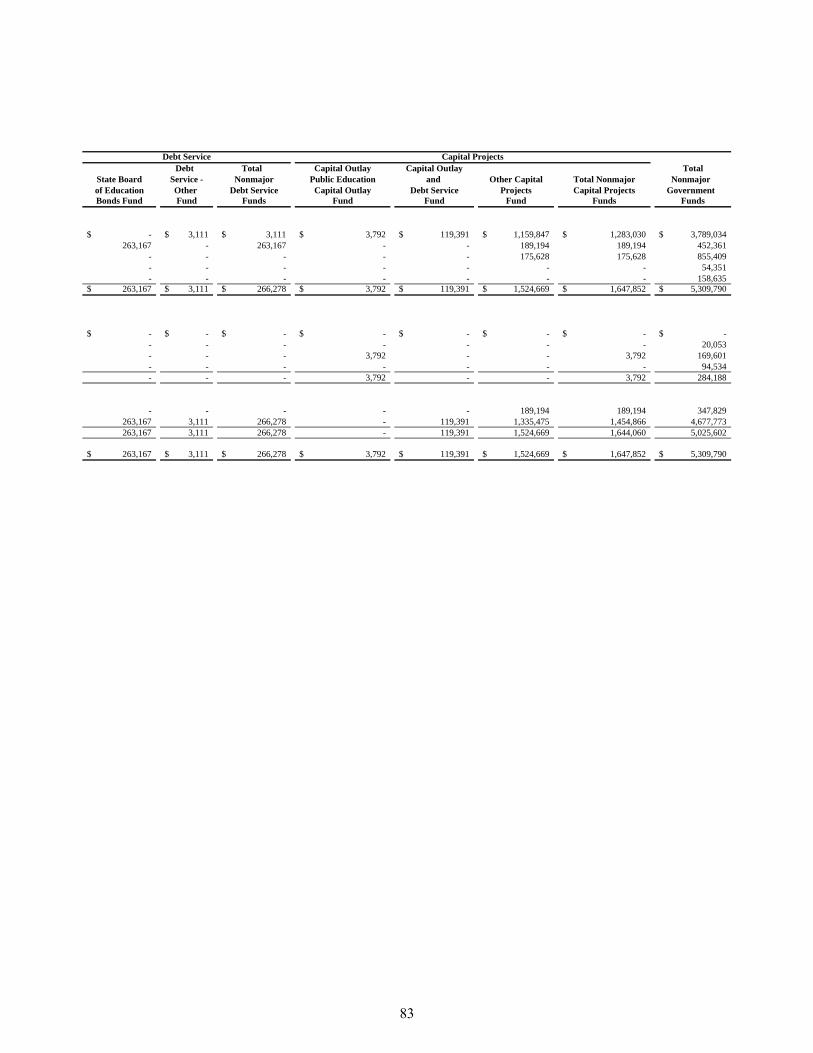
Debt Total Capital Outlay Capital Outlay TotalState Board Service - Nonmajor Public Education and Other Capital Total Nonmajor Nonmajor of Education Other Debt Service Capital Outlay Debt Service Projects Capital Projects Government Bonds Fund Fund Funds Fund Fund Fund Funds Funds
-$ 3,111$ 3,111$ 3,792$ 119,391$ 1,159,847$ 1,283,030$ 3,789,034$ 263,167 - 263,167 - - 189,194 189,194 452,361
- - - - - 175,628 175,628 855,409 - - - - - - - 54,351 - - - - - - - 158,635
263,167$ 3,111$ 266,278$ 3,792$ 119,391$ 1,524,669$ 1,647,852$ 5,309,790$
-$ -$ -$ -$ -$ -$ -$ -$ - - - - - - - 20,053 - - - 3,792 - - 3,792 169,601 - - - - - - - 94,534 - - - 3,792 - - 3,792 284,188
- - - - - 189,194 189,194 347,829 263,167 3,111 266,278 - 119,391 1,335,475 1,454,866 4,677,773 263,167 3,111 266,278 - 119,391 1,524,669 1,644,060 5,025,602
263,167$ 3,111$ 266,278$ 3,792$ 119,391$ 1,524,669$ 1,647,852$ 5,309,790$
Capital ProjectsDebt Service
83

Food Miscellaneous Total NonmajorService Special Revenue Special RevenueFund Fund Funds
RevenuesFederal through state and local 5,223,047$ -$ 5,223,047$ State 81,804 - 81,804 Local: Charges for food services 2,573,283 - 2,573,283 Impact fees - - - Miscellaneous 662 - 662
Total revenues 7,878,796 - 7,878,796
ExpendituresCurrent:
Instruction - 503 503 Pupil personnel services - - - Instructional media services - - - Instruction and curriculum development services - - - Instructional staff training services - - - Instructional related technology - - - General administration - - - School administration - - - Facilities services - - - Food services 7,305,960 - 7,305,960 Pupil transportation services - - - Operation of plant - - - Community services - - -
Capital outlay:Facilities acquisition and construction - - - Other capital outlay 72,625 - 72,625
Debt Service:Principal - - - Interest and fees - - - Paying agent fees - - -
Total expenditures 7,378,585 503 7,379,088
Excess (deficiency) of revenues over (under) expenditures 500,211 (503) 499,708
Other financing sources (uses)Transfers in 76,493 - 76,493 Transfers out - - -
Total other financing sources (uses) 76,493 - 76,493
Net change in fund balances 576,704 (503) 576,201
Fund balances - beginning 2,466,821 72,242 2,539,063 Fund balances - ending 3,043,525$ 71,739$ 3,115,264$
For the Fiscal Year Ended June 30, 2013
DISTRICT SCHOOL BOARD OF MARTIN COUNTY, FLORIDACombining Statement of Revenues, Expenditures, and Changes in Fund BalancesNonmajor Governmental Funds
Special Revenue
84

Capital Outlay Capital Outlay TotalState Board Debt Service - Total Nonmajor Public Education and Other Capital Total Nonmajor Nonmajor of Education Other Debt Service Capital Outlay Debt Service Projects Capital Projects Government Bonds Fund Fund Funds Fund Fund Fund Funds Funds
-$ -$ -$ -$ -$ -$ -$ 5,223,047$ 1,425,825 - 1,425,825 94,689 199,950 29,950 324,589 1,832,218
- - - - - - - 2,573,283 - - - - - 1,752,609 1,752,609 1,752,609 - 952 952 - 21 13,866 13,887 15,501
1,425,825 952 1,426,777 94,689 199,971 1,796,425 2,091,085 11,396,658
- - - - - - - 503 - - - - - - - - - - - - - - - - - - - - - - - - - - - - - - - - - - - - - - - - - - - - - - - - - - - - - - - - - - - 94,689 - - 94,689 94,689 - - - - - - - 7,305,960 - - - - - - - - - - - - - - - - - - - - - - - -
- - - - 86,355 129,163 215,518 215,518 - - - - - - - 72,625
915,000 1,170,000 2,085,000 - - - - 2,085,000 527,870 1,552,820 2,080,690 - - - - 2,080,690
13,665 - 13,665 - 872 - 872 14,537 1,456,535 2,722,820 4,179,355 94,689 87,227 129,163 311,079 11,869,522
(30,710) (2,721,868) (2,752,578) - 112,744 1,667,262 1,780,006 (472,864)
- 2,722,820 2,722,820 - - - - 2,799,313 - - - - - (1,720,000) (1,720,000) (1,720,000) - 2,722,820 2,722,820 - - (1,720,000) (1,720,000) 1,079,313
(30,710) 952 (29,758) - 112,744 (52,738) 60,006 606,449
293,877 2,159 296,036 - 6,647 1,577,407 1,584,054 4,419,153 263,167$ 3,111$ 266,278$ -$ 119,391$ 1,524,669$ 1,644,060$ 5,025,602$
Debt Service Capital Projects
85

This page was intentionally left blank
86

BUDGET AND ACTUAL
OTHER MAJOR AND NONMAJOR FUNDS
87

This page was intentionally left blank
88

Schedule of Revenues, Expenditures, and Changes in Fund Balances - Budget and ActualOther Major and Nonmajor Governmental FundsFor the Fiscal Year Ended June 30, 2013
Variance withFinal Budget -
Actual PositiveOriginal Final Amounts (Negative)
RevenuesFederal through state and local 4,906,637$ 5,223,047$ 5,223,047$ -$ State 79,600 81,804 81,804 - Local Charges for services - food services 2,916,683 2,573,283 2,573,283 - Miscellaneous 20,450 662 662 -
Total revenues 7,923,370 7,878,796 7,878,796 -
ExpendituresCurrent:
Food servicesSalaries 2,128,482 2,212,792 2,212,792 - Employee benefits 1,125,210 757,408 757,408 - Purchased services 436,985 439,622 439,622 - Energy services 204,600 166,825 166,825 - Materials and supplies 3,927,000 3,490,461 3,490,461 - Capital outlay 375,140 35,790 35,790 - Other 55,000 203,062 203,062 -
Total food services 8,252,417 7,305,960 7,305,960 -
Capital outlayOther capital outlay - 72,625 72,625 -
Total capital outlay - 72,625 72,625 -
Total expenditures 8,252,417 7,378,585 7,378,585 -
Excess (deficiency) of revenues over (under) expenditures (329,047) 500,211 500,211 -
Other financing sourcesTransfers in 54,347 76,493 76,493 -
Total other financing sources 54,347 76,493 76,493 -
Net change in fund balance (274,700) 576,704 576,704 -
Fund balance - beginning 2,466,821 2,466,821 2,466,821 -
Fund balance - ending 2,192,121$ 3,043,525$ 3,043,525$ -$
DISTRICT SCHOOL BOARD OF MARTIN COUNTY, FLORIDA
Budgeted Amounts
Food Service Fund
89

DISTRICT SCHOOL BOARD OF MARTIN COUNTY, FLORIDASchedule of Revenues, Expenditures, and Changes in Fund Balances - Budget and ActualOther Major and Nonmajor Governmental FundsFor the Fiscal Year Ended June 30, 2013
Variance withFinal Budget -
Actual PositiveOriginal Final Amounts (Negative)
RevenuesLocal -$ -$ -$ -$
Total revenues - - - -
ExpendituresCurrent:
InstructionPurchased services - 503 503 - Materials and supplies 3,640 - - -
Capital outlay:Other capital outlay 6,225 - - -
Total expenditures 9,865 503 503 -
Excess (deficiency) of revenues over (under) expenditures (9,865) (503) (503) -
Net change in fund balances (9,865) (503) (503) -
Fund balance - beginning 72,242 72,242 72,242 -
Fund balance - ending 62,377$ 71,739$ 71,739$ -$
Budgeted Amounts
Miscellaneous Special Revenue Fund
90

DISTRICT SCHOOL BOARD OF MARTIN COUNTY, FLORIDASchedule of Revenues, Expenditures, and Changes in Fund Balances - Budget and ActualOther Major and Nonmajor Governmental FundsFor the Fiscal Year Ended June 30, 2013
Variance withFinal Budget -
Actual PositiveOriginal Final Amounts (Negative)
RevenuesState 1,454,381$ 1,425,825$ 1,425,825$ -$
Total revenues 1,454,381 1,425,825 1,425,825 -
ExpendituresDebt service:
Principal 895,000 915,000 915,000 - Interest and fees 561,580 527,870 527,870 - Paying agent fees - 13,665 13,665 -
Total expenditures 1,456,580 1,456,535 1,456,535 -
Excess (deficiency) of revenues over (under) expenditures (2,199) (30,710) (30,710) -
Net change in fund balance (2,199) (30,710) (30,710) -
Fund balance - beginning 293,877 293,877 293,877 -
Fund balance - ending 291,678$ 263,167$ 263,167$ -$
Budgeted Amounts
State Board of Education Bonds Fund
91

DISTRICT SCHOOL BOARD OF MARTIN COUNTY, FLORIDASchedule of Revenues, Expenditures, and Changes in Fund Balances - Budget and ActualOther Major and Nonmajor Governmental FundsFor the Fiscal Year Ended June 30, 2013
Variance withFinal Budget -
Actual PositiveOriginal Final Amounts (Negative)
RevenuesLocal 1,100$ 952$ 952$ -$
Total revenues 1,100 952 952 -
ExpendituresDebt service:
Principal 1,170,000 1,170,000 1,170,000 - Interest and fees 1,550,692 1,552,820 1,552,820 -
Total expenditures 2,720,692 2,722,820 2,722,820 -
Excess (deficiency) of revenues over (under) expenditures (2,719,592) (2,721,868) (2,721,868) -
Other financing sourcesTransfers in 2,722,891 2,722,820 2,722,820 -
Total other financing sources 2,722,891 2,722,820 2,722,820 -
Net change in fund balance 3,299 952 952 -
Fund balance - beginning 2,159 2,159 2,159 -
Fund balance - ending 5,458$ 3,111$ 3,111$ -$
-
Budgeted Amounts
Debt Service - Other Fund
92

DISTRICT SCHOOL BOARD OF MARTIN COUNTY, FLORIDASchedule of Revenues, Expenditures, and Changes in Fund Balances - Budget and ActualOther Major and Nonmajor Governmental FundsFor the Fiscal Year Ended June 30, 2013
Variance withFinal Budget -
Actual PositiveOriginal Final Amounts (Negative)
RevenuesState 141,424$ 94,689$ 94,689$ -$ Local - - - -
Total revenues 141,424 94,689 94,689 -
ExpendituresCurrent:
Facilities services 141,424 94,689 94,689 - Total expenditures 141,424 94,689 94,689 -
Excess (deficiency) of revenues over (under) expenditures - - - -
Net change in fund balance - - - -
Fund balance - beginning - - - -
Fund balance - ending -$ -$ -$ -$
Budgeted Amounts
Public Education Capital Outlay Fund
93

DISTRICT SCHOOL BOARD OF MARTIN COUNTY, FLORIDASchedule of Revenues, Expenditures, and Changes in Fund Balances - Budget and ActualOther Major and Nonmajor Governmental FundsFor the Fiscal Year Ended June 30, 2013
Variance withFinal Budget -
Actual PositiveOriginal Final Amounts (Negative)
RevenuesState 532,611$ 199,950$ 199,950$ -$ Local 125 21 21 -
Total revenues 532,736 199,971 199,971 -
ExpendituresDebt service:
Paying agent fees - 872 872 - Capital outlay:
Facilities acquisition and construction - 86,355 86,355 - Total expenditures - 87,227 87,227 -
Excess (deficiency) of revenues over (under) expenditures 532,736 112,744 112,744 -
Net change in fund balance 532,736 112,744 112,744 -
Fund balance - beginning 6,647 6,647 6,647 -
Fund balance - ending 539,383$ 119,391$ 119,391$ -$
Budgeted Amounts
Capital Outlay and Debt Service Fund
94
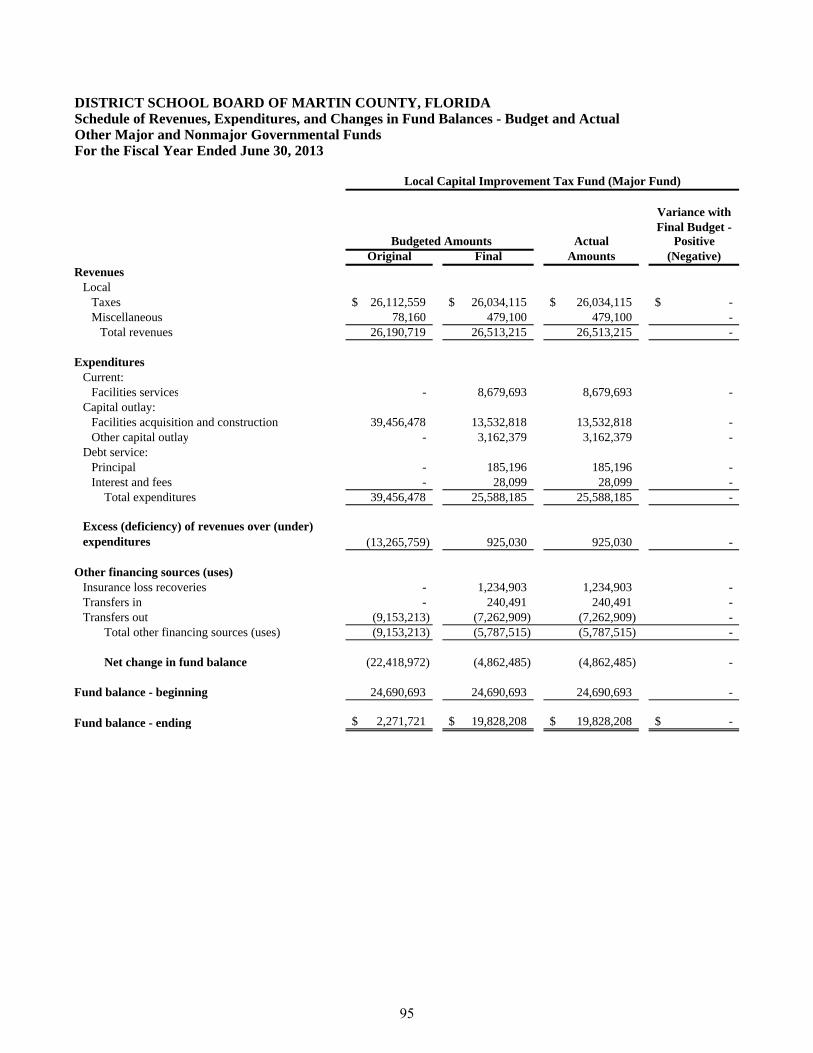
DISTRICT SCHOOL BOARD OF MARTIN COUNTY, FLORIDASchedule of Revenues, Expenditures, and Changes in Fund Balances - Budget and ActualOther Major and Nonmajor Governmental FundsFor the Fiscal Year Ended June 30, 2013
Variance withFinal Budget -
Actual PositiveOriginal Final Amounts (Negative)
RevenuesLocal
Taxes 26,112,559$ 26,034,115$ 26,034,115$ -$ Miscellaneous 78,160 479,100 479,100 -
Total revenues 26,190,719 26,513,215 26,513,215 -
ExpendituresCurrent:
Facilities services - 8,679,693 8,679,693 - Capital outlay:
Facilities acquisition and construction 39,456,478 13,532,818 13,532,818 - Other capital outlay - 3,162,379 3,162,379 -
Debt service:Principal - 185,196 185,196 - Interest and fees - 28,099 28,099 -
Total expenditures 39,456,478 25,588,185 25,588,185 -
Excess (deficiency) of revenues over (under) expenditures (13,265,759) 925,030 925,030 -
Other financing sources (uses)Insurance loss recoveries - 1,234,903 1,234,903 - Transfers in - 240,491 240,491 - Transfers out (9,153,213) (7,262,909) (7,262,909) -
Total other financing sources (uses) (9,153,213) (5,787,515) (5,787,515) -
Net change in fund balance (22,418,972) (4,862,485) (4,862,485) -
Fund balance - beginning 24,690,693 24,690,693 24,690,693 -
Fund balance - ending 2,271,721$ 19,828,208$ 19,828,208$ -$
Budgeted Amounts
Local Capital Improvement Tax Fund (Major Fund)
95

DISTRICT SCHOOL BOARD OF MARTIN COUNTY, FLORIDA
Variance withFinal Budget -
Actual PositiveOriginal Final Amounts (Negative)
RevenuesState 28,000$ 29,950$ 29,950$ -$ Local Impact fees - 1,752,609 1,752,609 - Miscellaneous 879,665 13,866 13,866 -
Total revenues 907,665 1,796,425 1,796,425 -
ExpendituresCapital outlay:
Facilities acquisition and construction 155,414 129,163 129,163 - Total expenditures 155,414 129,163 129,163 -
Excess (deficiency) of revenues over (under) expenditures 752,251 1,667,262 1,667,262 -
Other financing sources (uses)Transfers out (1,170,000) (1,720,000) (1,720,000) -
Total other financing sources (uses) (1,170,000) (1,720,000) (1,720,000) -
Net change in fund balance (417,749) (52,738) (52,738) -
Fund balance - beginning 1,577,407 1,577,407 1,577,407 -
Fund balance - ending 1,159,658$ 1,524,669$ 1,524,669$ -$
Schedule of Revenues, Expenditures, and Changes in Fund Balances - Budget and ActualOther Major and Nonmajor Governmental FundsFor the Fiscal Year Ended June 30, 2013
Budgeted Amounts
Other Capital Projects Fund
96

FIDUCIARY FUNDS
97

DISTRICT SCHOOL BOARD OF MARTIN COUNTY, FLORIDACombining Statement of Fiduciary Net PositionPrivate-Purpose Trust FundsFor the Fiscal Year Ended June 30, 2013
Clara Newman TotalM.H. Correll T.L. Showalter Non-Endowment Tom Goodman Estate J.M. Phillips, Jr. Private-Purpose
Research Trust Scholarship Scholarships Scholarship Scholarship Memorial TrustFund Fund Fund Fund Fund Fund Funds
ASSETSCash and Cash Equivalents 2,249$ 1,906$ 425$ 6,294$ 80,622$ 9,458$ 100,954$
NET POSITIONNet Position Held in Trust for Scholarships and Other Purposes 2,249$ 1,906$ 425$ 6,294$ 80,622$ 9,458$ 100,954$
98

DISTRICT SCHOOL BOARD OF MARTIN COUNTY, FLORIDACombining Statement of Changes in Fiduciary Net PositionPrivate-Purpose Trust FundsFor the Fiscal Year Ended June 30, 2013
Clara Newman TotalM.H. Correll T.L. Showalter Non-Endowment Tom Goodman Estate J.M. Phillips, Jr. Private-Purpose
Research Trust Scholarship Scholarships Scholarship Scholarship Memorial TrustFund Fund Fund Fund Fund Fund Funds
ADDITIONSContributions: Gifts, Grants and Bequests -$ -$ -$ -$ -$ -$ -$ Investment Earnings: Interest and Dividends - - - - - - - Total Additions - - - - - - -
DEDUCTIONSScholarships - - - - 19,000 - 19,000 Change in Net Position - - - - (19,000) - (19,000) Net Position - Beginning 2,249 1,906 425 6,294 99,622 9,458 119,954 Net Position - Ending 2,249$ 1,906$ 425$ 6,294$ 80,622$ 9,458$ 100,954$
99

DISTRICT SCHOOL BOARD OF MARTIN COUNTY, FLORIDACombining Statement of Changes in Assets and LiabilitiesAgency FundsFor the Fiscal Year Ended June 30, 2013
Balance at Balance atJuly 1, 2012 Additions Deductions June 30, 2013
Internal School FundsAssets
Cash and cash equivalents 1,710,753$ 4,405,558$ 4,319,876$ 1,796,435$ Accounts receivable 1,345 1,458 1,345 1,458 Inventory 64,253 71,514 73,443 62,324
Total assets 1,776,351$ 4,478,530$ 4,394,664$ 1,860,217$
LiabilitiesDue to student organizations 1,769,604$ 4,445,364$ 4,387,917$ 1,827,051$ Accounts payable 6,747 33,166 6,747 33,166
Total liabilities 1,776,351$ 4,478,530$ 4,394,664$ 1,860,217$
100

STATISTICAL SECTION
The information contained in this statistical section has been obtained from public documents, records and other sources considered to be reliable and, while not guaranteed as to completeness or accuracy, management believes it to be correct.
101

This page was intentionally left blank
102

STATISTICAL SECTION
This part of the District School Board of Martin County’s Comprehensive Annual Financial Report presents detailed information as a context for understanding what the information in the financial statements, note disclosures and required supplementary information says about the government’s overall financial health. Contents Financial Trends ....................................................................................................... 104-113 These schedules contain trend information to help the reader understand how the government’s financial performance and well-being have changed over time. Revenue Capacity .................................................................................................... 114-116 These schedules contain information to help the reader assess the government’s most significant local revenue source, the property tax. Debt Capacity .................................................................................................................. 117 These schedules present information to help the reader assess the affordability of the government’s current levels of outstanding debt and the government’s ability to issue additional debt in the future. Demographic and Economic Information ................................................................ 118-119 These schedules offer demographic and economic indicators to help the reader understand the environment within which the government’s financial activities take place. Operating Information ............................................................................................. 120-135 These schedules contain service and infrastructure data to help the reader understand how the information in the government’s financial report relates to the services the government provides and activities it performs.
103

Table 1
DISTRICT SCHOOL BOARD OF MARTIN COUNTY, FLORIDANet Position by ComponentLast 10 Fiscal Years(Unaudited)
Fiscal Year Ending June 30, 2004 June 30, 2005 June 30, 2006 June 30, 2007 June 30, 2008
Primary Government:Net investment in capital assets 177,867,748$ 215,680,230$ 210,538,436$ 224,729,723$ 269,985,466$ Restricted 50,671,472 45,499,278 74,856,275 94,150,769 79,028,507 Unrestricted (3,053,300) (836,363) (432,723) (2,022,548) (12,173,357)
Total primary government net position 225,485,920$ 260,343,145$ 284,961,988$ 316,857,944$ 336,840,616$
Note:
Source: District Records
Net Position increased significantly between 2004 and2008 due primarily to an increase in property tax used toacquire and construct capital assets that depreciate infuture years. Net position began to decrease in 2009 dueto the decrease in millage levy from 2.00 in 2008 to 1.50in 2010 and decrease in property values
104

Table 1
June 30, 2009 June 30, 2010 June 30, 2011 June 30, 2012 June 30, 2013
281,062,894$ 300,336,151$ 319,932,319$ 328,366,440$ 327,870,571$ 75,730,138 63,951,404 42,529,840 30,311,138 25,931,065
(21,623,079) (32,814,040) (40,388,280) (57,672,174) (68,567,035)
335,169,953$ 331,473,515$ 322,073,879$ 301,005,404$ 285,234,601$
105

Table 2
DISTRICT SCHOOL BOARD OF MARTIN COUNTY, FLORIDAChanges in Net Position - Government-wide (1)Last 10 Fiscal Years(Unaudited)
Primary Government June 30, 2004 June 30, 2005 June 30, 2006 June 30, 2007 June 30, 2008ExpensesGovernmental activities:
Instruction 71,228,030$ 78,763,307$ 84,298,588$ 92,186,209$ 100,088,071$ Pupil personnel services 6,750,749 7,229,200 7,823,268 8,588,915 9,416,081 Instructional media services 2,095,148 2,103,233 2,321,712 2,512,530 2,718,646
Instruction and curriculum development services 2,800,593 3,093,555 3,248,984 3,417,083 3,654,795 Instructional staff training services 809,771 809,517 1,003,658 1,302,224 2,094,178 Instructional technology (3) - - 1,174,206 1,182,214 1,301,506 School board 767,953 599,271 699,356 951,845 743,919 General administration 1,054,049 1,076,826 1,105,237 896,706 961,588 School administration 6,977,310 7,669,796 8,134,751 8,940,370 10,127,670 Facilities services 8,097,769 20,395,079 13,718,422 23,766,287 25,904,672 Fiscal services 787,316 764,175 815,701 818,099 857,860 Food services 5,275,135 5,988,710 6,464,961 7,090,471 7,400,658 Central services (3) 3,787,386 4,313,133 2,795,938 3,075,766 3,623,885 Pupil transportation services 4,954,285 5,035,298 5,532,049 6,688,004 7,213,168 Operation of plant 9,179,127 10,677,630 12,578,662 14,182,308 15,511,085 Maintenance of plant 2,611,260 2,753,158 2,733,502 3,122,998 3,344,687 Administrative technology (3) - - 558,610 540,097 600,242 Community services 2,677,590 2,194,116 2,410,540 2,682,319 3,190,881 Unallocated Interest on long-term debt 503,636 578,419 1,468,301 2,463,642 2,414,359 Unallocated depreciation expense 8,468,762 9,718,426 5,230,503 - - Loss on disposal of assets - 104,193 - - -
Total expenses 138,825,869 163,867,042 164,116,949 184,408,087 201,167,951
Governmental activities:Charges for services
Instruction 2,457,453 2,280,820 2,640,392 2,845,113 2,836,003 Food 2,800,871 3,007,232 3,286,653 3,452,163 3,324,172 Pupil transportation 8,072 28,149 - - - Community service - - - - -
Operating grants and contributions 7,000,846 6,938,764 6,874,323 7,228,223 7,457,767 Capital grants and contributions 10,612,219 3,861,768 3,596,577 11,643,707 12,047,688
Total program revenues 22,879,461 16,116,733 16,397,945 25,169,206 25,665,630
Primary government net expense (115,946,408)$ (147,750,309)$ (147,719,004)$ (159,238,881)$ (175,502,321)$
Governmental activities:Property taxes:
Levied for operational purposes 80,405,574$ 83,352,650$ 89,995,924$ 97,894,199$ 101,005,604$ Levied for capital projects 25,673,154 29,795,761 33,929,970 41,261,608 43,886,882
Grants and contributions not restrictedto specific programs 31,354,334 36,786,734 38,482,136 42,392,038 43,765,216
Insurance loss recoveries - 25,927,356 4,121,131 233,152 56,190 Miscellaneous 4,237,299 5,232,594 5,692,955 3,883,932 2,914,896 Unrestricted investment earnings 999,270 1,512,437 3,716,156 5,469,908 3,856,205 Total primary government 142,669,631$ 182,607,532$ 175,938,272$ 191,134,837$ 195,484,993$
Change in Net Position Total primary government (2) 26,723,223$ 34,857,223$ 28,219,268$ 31,895,956$ 19,982,672$
Notes: (1) Includes all governmental fund types
(2) The District has no business type activities.
(3) Functions to report technology expenses were added in the 2005-06 fiscal year.
Source: District Records
106

Table 2
June 30, 2009 June 30, 2010 June 30, 2011 June 30, 2012 June 30, 2013
96,028,710$ 99,394,082$ 101,154,165$ 96,030,312$ 94,230,526$ 8,990,622 10,769,701 9,928,751 9,903,132 9,835,181 2,755,296 2,393,206 2,263,085 2,213,015 2,209,088 3,454,527 3,333,307 3,418,956 3,711,583 3,615,999 1,982,599 3,001,115 3,155,887 2,895,164 2,365,365
832,089 1,641,862 1,699,938 1,741,333 1,655,201 826,006 866,172 731,165 729,644 902,968 753,206 739,511 750,550 729,721 659,120
9,990,153 10,209,565 9,925,657 10,316,230 9,598,008 25,881,704 19,629,027 26,211,680 26,041,389 29,581,334
829,305 1,162,258 1,159,594 1,066,902 908,486 7,332,469 6,854,384 6,591,543 7,170,203 7,678,953 3,630,236 3,669,788 4,216,113 4,822,277 5,086,568 6,595,659 6,451,503 6,143,955 6,468,443 6,593,395
15,083,575 14,207,089 15,184,217 13,838,429 14,098,913 3,241,597 4,392,925 4,595,135 4,373,070 4,438,963
408,321 656,490 563,005 563,865 614,590 3,164,681 2,880,821 2,729,930 2,740,540 2,931,948 2,366,566 2,291,704 2,239,480 2,203,833 2,095,227
- - - - - - - - - -
194,147,321 194,544,510 202,662,806 197,559,085 199,099,833
2,865,145 2,731,917 371,096 429,597 434,820 3,156,448 2,923,061 2,954,156 2,808,455 2,573,283
- - - - - - - 2,559,255 2,765,234 2,847,631
7,590,006 4,046,600 4,520,960 4,830,648 5,385,431 3,496,132 3,503,253 3,075,398 1,994,232 1,650,204
17,107,731 13,204,831 13,480,865 12,828,166 12,891,369
(177,039,590)$ (181,339,679)$ (189,181,941)$ (184,730,919)$ (186,208,464)$
93,508,345$ 99,281,016$ 97,202,185$ 89,175,396$ 93,749,587$ 36,356,391 28,656,156 26,738,877 26,224,667 26,034,115
43,493,062 46,726,435 52,672,114 45,362,980 45,816,980 116,796 - - - 1,234,903
1,896,946 2,072,294 2,701,383 2,719,167 3,214,781 (2,613) 907,340 467,746 180,234 387,295
175,368,927$ 177,643,241$ 179,782,305$ 163,662,444$ 170,437,661$
(1,670,663)$ (3,696,438)$ (9,399,636)$ (21,068,475)$ (15,770,803)$
107

Table 3
Fund Balances - Governmental Funds (1)
Last 10 Fiscal Years(unaudited)
Post-GASB 54
2011 2012
General FundNonspendable 488,370$ 534,622$ Restricted 2,227,392 1,201,292 Assigned 611,930 6,545 Unassigned 9,389,240 5,372,118
Total General Fund 12,716,932$ 7,114,577$
All Other Governmental FundsNonspendable 209,683$ 65,937$ Restricted 40,092,765 29,043,909
Total All Other Governmental Funds 40,302,448$ 29,109,846$
Pre-GASB 54
2004 2005
General Fund Reserved 2,375,967$ 1,880,160$ Unreserved 5,903,895 8,139,110
Total General Fund 8,279,862$ 10,019,270$
All Other Governmental FundsReserved 15,165,509$ 16,857,750$ Unreserved, reported in:
Capital projects funds 34,433,691 27,864,767 Special revenue funds 1,921,205 1,687,739
Total All Other Governmental Funds 51,520,405$ 46,410,256$
Note: (1) Includes all governmental fund types
Source: District records
Fiscal Year
DISTRICT SCHOOL BOARD OF MARTIN COUNTY, FLORIDA
108

Table 3
Fiscal Year2013
593,201$ 1,077,255
97,986 3,177,357
4,945,799$
901,705$ 23,952,105
24,853,810$
2006 2007 2008 2009 2010
2,125,669$ 2,463,228$ 2,044,033$ 956,033$ 2,744,719$ 9,226,624 8,076,751 7,533,302 7,006,402 8,156,558
11,352,293$ 10,539,979$ 9,577,335$ 7,962,435$ 10,901,277$
17,532,385$ 26,117,711$ 19,585,661$ 18,539,720$ 23,840,637$
56,291,724 67,413,737 58,508,274 56,861,866 37,558,622 1,469,550 650,426 324,357 254,141 671,564
75,293,659$ 94,181,874$ 78,418,292$ 75,655,727$ 62,070,823$
Fiscal Year
$-
$10
$20
$30
$40
$50
$60
$70
$80
$90
$100
$110
2004 2005 2006 2007 2008 2009 2010 2011 2012 2013
Mil
lion
s
Total Fund Balance - Governmental Funds
109

Table 4
DISTRICT SCHOOL BOARD OF MARTIN COUNTY, FLORIDAChanges in Fund Balances - Governmental Funds (1)Last 10 Years(Modified Accrual Basis of Accounting)(Unaudited)
2004 2005 2006 2007
RevenuesFederal sources: Federal grants 11,238,974$ 11,956,044$ 12,159,646$ 11,660,006$ Food services 2,916,692 2,750,335 3,002,897 2,874,851
Total federal sources 14,155,666 14,706,379 15,162,543 14,534,857
State sources: Florida education finance program 8,324,716 8,759,498 6,459,587 7,958,571 Public education capital outlay 2,185,956 1,472,984 1,594,564 2,921,933 Food services 95,795 96,160 88,518 86,732 State grants and other 23,561,968 22,203,732 25,438,866 35,761,875
Total state sources 34,168,435 32,532,374 33,581,535 46,729,111
Local sources: Ad valorem taxes 106,078,728 113,129,401 123,861,840 139,155,807
Food service sales 2,807,500 3,025,680 3,286,653 3,549,624 Interest and other income 999,221 1,512,438 3,716,156 5,469,908 Other revenues 7,191,611 7,890,639 8,461,358 6,962,523
Total local sources 117,077,060 125,558,158 139,326,007 155,137,862 Total revenues 165,401,161 172,796,911 188,070,085 216,401,830
ExpendituresInstruction 71,059,991 78,919,442 84,058,619 91,820,583 Pupil personnel services 6,731,577 7,259,741 7,801,929 8,600,273 Instructional media services 2,088,917 2,111,265 2,313,271 2,512,236 Instruction and curriculum development services 2,792,893 3,104,161 3,188,203 3,383,843 Instructional staff training services 809,771 814,022 1,005,353 1,295,385 Instructional related technology(2) - - 1,164,873 1,179,755 Board of education 767,951 601,737 689,525 908,266 General administration 1,054,049 1,082,796 1,107,102 1,095,254 School administration 6,915,603 7,694,958 8,096,343 9,003,542 Facilities services 5,127,475 20,396,158 11,678,947 12,836,647 Fiscal services 775,640 766,774 808,644 805,616 Food services 5,268,691 6,024,723 6,439,565 7,033,624 Central services(2) 5,120,628 4,476,188 2,778,151 3,079,037 Pupil transportation services 4,944,019 5,061,765 5,536,631 6,682,415 Operation of plant 9,166,997 10,744,197 12,573,720 14,260,919 Maintenance of plant 2,597,579 2,763,874 2,719,203 3,100,833 Administrative technology(2) - - 547,887 541,725 Community services 2,677,590 2,203,440 2,414,611 2,697,668
Capital Outlay:Facilities acquisition and construction 47,328,450 43,775,415 45,856,668 20,626,860 Other capital outlay 3,823,515 7,103,040 3,107,210 3,920,957
Debt Service:Principal 478,274 622,659 715,034 710,000 Interest and fiscal charges 470,809 548,922 1,175,315 2,463,643 Total expenditures 180,000,419$ 206,075,277$ 205,776,804$ 198,559,081$
Fiscal Year
110

Table 4
2008 2009 2010 2011 2012 2013
10,007,447$ 10,598,248$ 20,657,783$ 24,325,420$ 13,059,853$ 12,336,627$ 3,115,573 3,592,138 3,878,793 4,404,315 4,755,475 5,223,047
13,123,020 14,190,386 24,536,576 28,729,735 17,815,328 17,559,674
5,964,391 6,996,147 2,403,077 3,740,327 8,056,777 8,354,799 4,442,279 1,491,672 493,045 1,080,309 122,073 94,689
84,008 83,029 83,508 76,029 106,461 81,804 39,656,973 31,817,966 25,740,509 26,642,072 26,087,224 26,682,036 50,147,651 40,388,814 28,720,139 31,538,737 34,372,535 35,213,328
144,892,486 129,864,736 127,937,172 123,941,062 115,400,063 119,783,702 3,403,489 3,156,448 2,923,061 2,954,156 2,808,455 2,573,283 3,856,205 (2,613) 907,340 467,786 180,234 387,295 5,902,759 5,149,261 6,030,595 6,131,098 6,415,634 6,883,720
158,054,939 138,167,832 137,798,168 133,494,102 124,804,386 129,628,000 221,325,610 192,747,032 191,054,883 193,762,574 176,992,249 182,401,002
94,605,958 90,758,627 91,793,659 95,516,711 88,504,026 88,693,698 8,960,642 8,515,685 9,985,276 9,519,092 9,126,374 9,386,355 2,571,184 2,599,008 2,141,954 2,220,756 2,026,156 2,111,462
3,425,227 3,290,025 3,031,846 3,469,525 3,283,924 3,480,554 1,998,475 1,885,811 2,830,290 3,086,300 2,687,875 2,275,235 1,230,586 753,182 1,532,256 1,590,478 1,607,734 1,537,181
705,570 781,836 825,496 681,689 680,731 869,548 1,180,544 1,100,042 1,214,885 1,294,507 1,072,389 1,116,367 9,509,932 9,477,912 9,265,796 9,403,915 9,287,670 8,972,904 9,874,902 10,778,771 8,106,544 12,545,299 12,711,138 9,753,739
818,681 774,884 1,047,597 1,077,272 974,087 844,077 7,170,356 7,102,339 6,527,545 6,635,390 6,858,976 7,306,448 3,444,513 3,435,115 3,322,138 3,916,853 4,304,803 4,695,849 6,972,314 6,317,510 6,103,839 5,758,515 6,086,852 6,364,056
15,136,879 14,630,408 13,755,521 14,121,493 13,220,275 13,570,654 3,164,044 3,040,362 4,083,006 4,350,845 3,985,346 4,290,026
566,930 370,795 601,882 524,156 518,326 589,731 3,050,637 3,009,962 2,646,810 2,543,416 2,544,048 2,762,234
56,881,422 20,826,632 26,332,897 28,348,362 18,359,013 13,748,336 3,663,269 3,620,821 2,675,971 4,276,078 2,638,689 3,298,743
1,720,000 1,805,000 1,870,000 1,935,000 2,201,182 2,270,196 2,414,358 2,366,566 2,316,365 2,234,938 2,203,832 2,123,326
239,066,423$ 197,241,293$ 202,011,573$ 215,050,590$ 194,883,446$ 190,060,719$
(continued)
Fiscal Year
111

Table 4
DISTRICT SCHOOL BOARD OF MARTIN COUNTY, FLORIDAChanges in Fund Balances - Governmental Funds (1)Last 10 Years(Modified Accrual Basis of Accounting)(Unaudited)
2004 2005 2006 2007Fiscal Year
Excess of revenues over (under)expenditures (14,599,258)$ (33,278,366)$ (17,706,719)$ 17,842,749$
Other Financing Sources (Uses)Long-term debt issued 2,657,173 3,195,503 44,095,000 - Refunding bond issue - - 4,040,000 - Payment to escrow agent for refunded bonds - - (4,418,053) - Premium of sale/refunding of bonds/COP - - 608,202 - Discount on sale of bonds/COP - - (523,135) - Capital leases - 784,767 - - FEMA and insurance loss recoveries 65,889 25,927,356 4,121,131 233,152 Transfers in 810,000 542,357 2,992,935 2,250,387 Transfers out (810,000) (542,357) (2,992,935) (2,250,387) Total other financing sources (uses) 2,723,062 29,907,626 47,923,145 233,152
Prior period adjustments & other 82,042 - - -
Net change in fund balances (11,794,154)$ (3,370,740)$ 30,216,426$ 18,075,901$
Debt service as a percentage of noncapital expenditures 0.68% 0.71% 1.15% 1.71%
Notes: (1) Includes all governmental fund types
(2) Technology expenses were included in central services until the 2005-06 fiscal year.
Source: District records
112

Table 4
2008 2009 2010 2011 2012 2013Fiscal Year
(17,740,813)$ (4,494,261)$ (10,956,690)$ (21,288,016)$ (17,891,197)$ (7,659,717)$
925,000 - - - - - - - 350,000 1,205,000 1,505,000 - - - (377,799) (1,404,877) (1,730,010) -
33,397 - 30,978 195,334 229,483 - - - - - - - - - - 1,239,801 - -
56,190 116,796 307,449 100,038 1,091,767 1,234,903 5,446,766 8,178,799 8,804,532 8,426,038 8,852,137 9,299,893
(5,446,766) (8,178,799) (8,804,532) (8,426,038) (8,852,137) (9,299,893) 1,014,587 116,796 310,628 1,335,296 1,096,240 1,234,903
- - - - - -
(16,726,226)$ (4,377,465)$ (10,646,062)$ (19,952,720)$ (16,794,957)$ (6,424,814)$
2.13% 2.38% 2.41% 2.26% 2.53% 2.61%
-
50
100
150
200
250
300
Mil
lion
s
Revenues vs. Expenditures
Revenues Expenditures
113

Table 5
DISTRICT SCHOOL BOARD OF MARTIN COUNTY, FLORIDAAssessed and Estimated Actual Value of Taxable PropertyLast 10 Fiscal Years(Amounts expressed in thousands)(Unaudited)
Centrally Estimated Homestead Total Ratio of TotalFiscal Real Personal Assessed Actual and Other Taxable Taxable Value Direct
Year Property Property Value Value (1)Exemptions Valuation to Assessed Value Rate
2004 16,491,340 1,579,700 33,991 18,105,031 4,821,533 13,283,498 73.37% 8.2632005 20,430,688 1,644,385 36,316 22,111,389 6,659,157 15,452,233 69.88% 7.5922006 25,063,423 1,711,694 36,530 26,811,647 9,126,414 17,685,233 65.96% 7.3002007 31,967,821 2,121,882 40,120 34,129,823 12,757,499 21,372,324 62.62% 6.7442008 33,089,406 2,159,406 45,924 35,294,736 12,594,110 22,700,626 64.32% 6.6022009 29,582,296 2,166,888 60,595 31,809,779 11,183,140 20,626,639 64.84% 6.2522010 26,216,447 2,094,540 47,272 28,358,259 9,567,827 18,790,433 66.26% 6.7032011 23,131,078 2,069,709 45,744 25,246,531 7,753,621 17,492,910 69.29% 6.9562012 21,379,718 2,378,906 47,993 23,806,617 5,735,774 18,070,843 75.91% 6.6042013 20,400,691 2,691,034 43,327 23,135,052 5,212,197 17,922,855 77.47% 6.904
Source: Martin County Property Appraiser Note: (1) Estimated actual values are the total "just" values of property subject to taxation, as defined by Section 193.011, Florida Statutes.
0.00%
10.00%
20.00%
30.00%
40.00%
50.00%
60.00%
70.00%
80.00%
90.00%
100.00%
Ratio of Actual Taxable Value to Assessed Value
114

Table 6
Fiscal Year
Taxes Levied for the Fiscal
Year AmountPercentage
of Levy
Collections in Subsequent
Years AmountPercentage
of Levy2004 110,298,245 105,680,992 95.81% 131 105,681,123 95.81%2005 118,563,359 112,871,144 95.20% - 112,871,144 95.20%2006 129,202,101 123,925,894 95.92% - 123,925,894 95.92%2007 144,252,079 139,110,202 96.44% - 139,110,202 96.44%2008 150,151,251 144,892,486 96.50% - 144,892,486 96.50%2009 135,139,841 129,864,736 96.10% - 129,864,736 96.10%2010 132,510,715 127,937,173 96.55% 23,148 127,960,321 96.57%2011 128,512,929 123,917,914 96.42% 58,945 123,976,859 96.47%2012 119,608,739 115,341,118 96.43% 89,639 115,430,757 96.51%2013 123,853,938 119,694,063 96.64% - 119,694,063 96.64%
Source: Martin County Tax Collector and District records.
Total Collections to Date
DISTRICT SCHOOL BOARD OF MARTIN COUNTY, FLORIDAProperty Tax Levies and CollectionsLast 10 Years(Unaudited)
Collected within the Fiscal Year of the Levy
-
20
40
60
80
100
120
140
160
Mil
lion
s
Property Tax Levies and Collections
Taxes Levied Amount Collected
115

Table 7
DISTRICT SCHOOL BOARD OF MARTIN COUNTY, FLORIDADirect and Overlapping Property Tax RatesLast 10 Years(Unaudited)(per $1,000 assessed valuation)
Fiscal Debt City of Jupiter Sewall's Ocean BreezeYear Operating Capital Total Operating Service Other MSTU Stuart Island Point Park2004 6.263 2.000 8.263 5.395 0.4120 1.0510 1.0893 4.1539 3.6170 1.8990 - 2005 5.592 2.000 7.592 5.230 0.3720 1.0692 1.0760 4.1539 3.2540 1.8990 2.88202006 5.300 2.000 7.300 4.895 0.3250 1.0690 0.8287 5.4615 3.0904 1.9410 5.19492007 4.744 2.000 6.744 4.928 0.1140 1.0557 0.7722 5.3442 2.9994 2.4000 3.48152008 4.602 2.000 6.602 4.548 0.1220 0.9557 0.6796 4.5573 2.9994 2.1690 2.29112009 4.502 1.750 6.252 4.897 0.1270 1.0108 0.7027 4.5788 3.1400 2.2300 2.42412010 5.203 1.500 6.703 5.309 0.1382 1.0108 0.8754 4.6081 3.2350 2.2300 2.24592011 5.456 1.500 6.956 5.525 0.0826 1.0100 0.9610 4.6436 3.3841 2.1800 2.62952012 5.104 1.500 6.604 5.734 0.0368 0.8401 0.9636 4.6674 4.9528 2.2896 4.67992013 5.404 1.500 6.904 5.696 0.0373 0.8327 0.9755 4.9041 4.2861 2.2896 4.7910
(1) Direct rates are the District's rate for capital outlay, discretionary, and required local effort.(2) Overlapping rates are those of local and county governments that apply to property owners within the incorporated areas.
Source: Martin County Tax Collector's Office
Martin County Property Appraiser
Martin County Clerk of Court
Overlapping Rates (2)
Martin CountyDistrict School Board of Martin
County
Direct Rates (1)
0
1
2
3
4
5
6
7
2004 2005 2006 2007 2008 2009 2010 2011 2012 2013
Mil
lage
County and School District Operating Millages
School County
116

Table 8
DISTRICT SCHOOL BOARD OF MARTIN COUNTY, FLORIDARatios of Outstanding Debt by TypeLast 10 Fiscal Years(Amounts expressed in thousands, except per capita amount)(Unaudited)
State Board Total Percentage DebtFiscal of Education Certificates of Capital Primary of Personal PerYear Bonds Participation Leases Government Income Capita2004 10,465 - 297 10,762 0.16% 78.19 2005 13,135 - 785 13,920 0.19% 98.68 2006 15,700 40,790 597 57,087 0.71% 400.20 2007 14,990 40,790 472 56,252 0.66% 391.35 2008 15,175 39,810 341 55,326 0.66% 384.56 2009 14,385 38,795 204 53,384 0.65% 371.09 2010 13,540 37,745 61 51,346 0.68% 357.12 2011 13,895 36,660 822 51,377 0.66% 350.49 2012 13,165 35,530 646 49,341 N/A 335.19 2013 10,580 34,360 461 45,401 N/A 306.60
Note:
*
Source: District records
Details regarding the District's outstanding debt can be found in the notes to the basic financial statements. Total personal income is not available for 2012 and 2013.
See Table 9 Demographic and Economic Statistics for personal income and population data. These ratios are calculated using personal income and population for the calendar year.
$-
$50
$100
$150
$200
$250
$300
$350
$400
$450
2004 2005 2006 2007 2008 2009 2010 2011 2012 2013
Debt per Capita
117

Table 9
DISTRICT SCHOOL BOARD OF MARTIN COUNTY, FLORIDADemographic and Economic StatisticsLast Ten Years(Unaudited)
Personal
Income (2) Per Capita Fiscal Estimated (thousands of Personal Student Unemployment
Year Population(1)dollars) Income (2) Membership(3) Rate(4)
2004 137,637 6,677,228 48,801 17,447 4.82005 141,059 7,197,354 52,068 17,657 3.62006 142,645 8,046,739 58,295 17,760 3.92007 143,737 8,586,709 61,868 17,826 4.12008 143,868 8,364,241 60,140 17,703 6.32009 143,856 8,207,593 58,712 17,631 11.22010 143,777 7,576,859 51,723 17,612 11.72011 146,587 7,787,403 52,798 17,759 10.92012 147,203 N/A N/A 17,964 9.82013 148,077 N/A N/A 18,267 7.8
N/A = Data not currently available
Source: (1) Office of Economic and Business Research
(2) US Department of Commerce, Bureau of Economic Analysis
(3) The Florida Department of Education's statistical brief entitled "Membership
in Florida's Public Schools Fall" for each respective year(4) Florida Agency for Workforce Innovation, Labor Market Statistics Center, Local Area Unemployment
Statistics Program
118

Table 10
Principal Property TaxpayersJanuary 1, 2013 and 9 years ago(Amounts expressed in thousands)(Unaudited)
Taxable Percentage of Taxable Percentage ofAssessed Total Assessed Assessed Total Assessed
Taxpayer Rank Valuation Value Rank Valuation Value
Florida Power & Light Co. 1 1,842,698$ 7.96% 1 774,818$ 4.28%Indiantown Cogeneration LP 2 266,756 1.15% 2 304,899 1.68%Treasure Coast - JCP Associates Ltd. 3 74,374 0.32% 3 59,723 0.33%Florida Gas Transmission 4 55,045 0.24% - ----- -----Hubman, Christopher J 5 46,315 0.20% - ----- -----Gulfstream Natural Gas 6 43,787 0.19% - ----- -----Louis Drefus Citrus Inc. 7 30,307 0.13% - ----- -----Bellsouth Telecom 8 27,863 0.12% 4 51,801 0.29%Sandhill Cove Properties, Inc. 9 26,677 0.12% 8 23,078 0.13%Hamm, Edward H 10 27,666 0.12% - ----- -----Knickerbocker Properties DBA St. Andrews Apt. - ----- ----- 5 25,279 0.14%Medalist Golf Company - ----- ----- 6 23,492 0.13%Columbia Properties Stuart - ----- ----- 7 22,474 0.12%Lowe's Home Centers, Inc. - ----- ----- 9 21,037 0.12%Running W Citrus Limited - ----- ----- 10 8,569 0.05%
Total 2,441,488$ 10.26% 1,315,170$ 8.29%
Source: Martin County Tax Collector's Office
DISTRICT SCHOOL BOARD OF MARTIN COUNTY, FLORIDA
2013 2004
119

Table 11
DISTRICT SCHOOL BOARD OF MARTIN COUNTY, FLORIDADistrict EmployeesLast 10 Fiscal Years(Unaudited)
2004 2005 2006 2007Instructional administrators 10 7 14 9Non-instructional administrators 7 7 6 6Consultants/supervisors of instruction 2 1 2 2Principals 19 20 20 20Assistant principals 26 28 30 30Elementary classroom teachers 380 390 395 407Secondary classroom teachers 414 435 455 449ESE teachers 183 201 212 213Other teachers (adult) 39 41 42 39Guidance counselors 39 36 38 41Visiting teachers/Social workers 1 1 1 1Psychologists 5 6 6 7Librarians 17 22 24 24Other professionals (instructional) 80 78 76 86Other professionals (non-instructional) 82 74 75 87Aides 249 256 265 277Technicians 15 15 14 13Clerical/secretarial 133 143 163 170Service workers 265 228 255 289Skilled crafts 33 29 32 30Unskilled laborers 16 16 15 17
Total employees 2,015 2,034 2,140 2,217
Source: Florida Department of Education Statistical Brief entitled "Staff in Florida's Public Schools"
Notes: (a) Employee data includes only full-time staff.
(b) Information presented above excludes Charter Schools and Second Chance Schools.
(c) The number of personnel is total employees.
120

Table 11
2008 2009 2010 2011 2012 20139 8 8 9 11 126 4 6 8 7 72 3 3 4 3 421 23 23 23 23 2330 32 31 32 32 31
414 414 415 461 455 460468 460 461 464 453 451214 218 230 238 231 23338 100 99 72 58 5443 39 37 37 35 381 1 1 0 0 07 7 7 7 7 724 24 20 20 20 2074 85 99 94 101 10989 89 93 89 85 84
270 268 282 279 290 28714 15 14 10 11 10
171 164 169 163 168 168295 297 290 292 297 29933 34 34 36 32 3218 18 18 11 12 12
2,241 2,303 2,340 2,349 2,331 2,341
121

This page was intentionally left blank
122

Table 12
DISTRICT SCHOOL BOARD OF MARTIN COUNTY, FLORIDATeacher SalariesLast 10 Years(Unaudited)
Martin StatewideFiscal Minimum Maximum Average Average
Year Salary(1) Salary(1) Salary(2) Salary(2)
2004 30,725 59,255 39,294 40,598 2005 31,675 60,855 42,337 41,590 2006 32,800 63,289 43,585 42,702 2007 35,000 65,339 45,646 45,296 2008 37,000 67,952 48,384 46,922 2009 37,000 67,952 47,102 46,938 2010 37,000 67,952 46,455 46,696 2011 37,000 68,427 45,841 45,723 2012 37,000 68,901 45,604 46,479 2013 37,000 68,901 45,603 46,583
Source: (1) District records
(2) Florida Department of Education
32,000
34,000
36,000
38,000
40,000
42,000
44,000
46,000
48,000
50,000
2004 2005 2006 2007 2008 2009 2010 2011 2012 2013
Teacher Average Salary
Martin Average Salary(1) Statewide Average Salary(2)
123

Table 13
DISTRICT SCHOOL BOARD OF MARTIN COUNTY, FLORIDASchool Building Information (1)Last 10 Fiscal Years(Unaudited)
School 2004 2005 2006 2007
ElementarySeawind Elementary (1993) Square feet 119,804 119,804 119,804 119,804 Capacity 788 589 589 589 Enrollment 670 630 651 667
JD Parker Elementary (2004/re-built)(2) Square feet - 125,940 125,940 125,940 Capacity - 804 804 804 Enrollment 562 604 585 598Palm City Elementary (1958) Square feet 106,954 106,954 106,954 106,954 Capacity 930 713 713 713 Enrollment 951 925 899 875
Port Salerno Elementary (2002/re-built) (2) Square feet 108,962 108,962 108,962 108,962 Capacity 923 757 757 757 Enrollment 682 688 659 660
Hobe Sound Elementary (2004/re-built) (2)
Square feet - 112,190 112,190 112,190 Capacity - 816 816 816 Enrollment 457 577 588 703Warfield Elementary (1959) Square feet 123,584 123,584 123,584 139,520 Capacity 1,156 875 875 875 Enrollment 608 617 617 614Jensen Beach Elementary (1970) Square feet 95,159 95,159 95,159 95,159 Capacity 939 721 721 721 Enrollment 608 617 622 625Pinewood Elementary (1988) Square feet 103,756 103,756 103,756 104,570 Capacity 838 622 622 644 Enrollment 784 747 879 764Crystal Lake Elementary (1989) Square feet 101,628 101,628 101,628 101,628 Capacity 841 620 620 620 Enrollment 747 712 700 736
(continued)
Fiscal Year
124

Table 13
2008 2009 2010 2011(3) 2012(4) 2013(5)
137,803 136,075 127,350 127,350 127,350 127,350837 797 783 783 764 764673 689 735 738 721 687
125,940 125,940 125,691 125,691 125,691 125,691757 757 754 754 695 695607 610 612 626 614 682
118,524 114,074 107,872 102,532 102,532 103,422929 953 808 698 670 696881 794 740 700 649 639
108,962 108,962 109,944 109,944 115,120 126,076757 757 757 757 805 877660 646 653 722 761 789
110,804 110,804 115,632 115,632 115,632 115,632797 797 793 793 776 776711 712 689 696 665 647
142,024 114,653 147,410 145,941 145,941 133,961911 845 1,084 1,048 1,048 886618 638 643 671 704 730
97,829 96,760 100,201 100,201 100,468 102,196775 721 721 721 668 704626 603 571 555 576 583
132,001 129,603 128,796 120,994 122,256 126,576982 996 888 718 756 784761 730 710 710 754 742
106,147 106,027 104,574 100,176 103,681 108,079720 720 720 630 621 688733 505 504 492 528 557
Fiscal Year
125

Table 13
DISTRICT SCHOOL BOARD OF MARTIN COUNTY, FLORIDASchool Building Information (1)Last 10 Fiscal Years(Unaudited)
School 2004 2005 2006 2007
Fiscal Year
Bessey Creek Elementary (1995) Square feet 111,296 111,296 111,296 111,296 Capacity 779 589 589 589 Enrollment 705 753 800 747Felix A. Williams Elementary (1993) Square feet 137,605 137,605 137,605 137,605 Capacity 910 705 705 705 Enrollment 720 704 718 650Citrus Grove Elementary (2009) Square feet Capacity Enrollment
Sources:
District records - Five-year facilities work plan
Florida Inventory of School Houses
(1) The District caps its enrollment at 750 for elementary schools,
1,200 for middle schools, and 1,800 for high schools.(2) Rebuilt schools include only information after rebuilding.(3)Square footage and capacity have changed for some schools due to the re-measurement
and change of use by BRPH for the Five-Year Plant Survey.(4)Square footage and capacity have changed for some schools due to remodeling work
completed in 2011-12, building demolitions, ESE cluster sites per DOE, and vacant buildings pending demolition.(5)Square footage and capacity have changed for some schools due to portable relocations and demolitions.
126

Table 13
2008 2009 2010 2011(3) 2012(4) 2013(5)
Fiscal Year
118,312 111,296 122,445 122,445 122,445 112,445745 589 599 599 599 599752 572 556 534 525 544
140,197 138,469 111,844 111,059 111,059 112,709759 723 653 635 635 671653 633 684 647 631 662
124,838 124,838 124,838 124,838767 767 767 767 767457 521 565 603 590
127

Table 13
DISTRICT SCHOOL BOARD OF MARTIN COUNTY, FLORIDASchool Building Information (1)Last 10 Fiscal Years(Unaudited)
School 2004 2005 2006 2007
MiddleDr. David L. Anderson Middle School (2005) Square feet - - - 210,194 Capacity - - - 1,255 Enrollment - - - 897 Hidden Oaks Middle School (1991) Square feet 166,779 166,779 166,779 166,779 Capacity 1,446 1,241 1,241 1,241 Enrollment 1,437 1,452 1,075 1,125 Indiantown Middle School (1969) Square feet 99,053 99,053 99,053 99,053 Capacity 1,096 804 770 693 Enrollment 481 482 441 403 Murray Middle School(1961) Square feet 131,551 131,551 131,551 142,157 Capacity 1,244 1,033 1,033 828 Enrollment 1,095 1,032 805 748 Stuart Middle School(1971) Square feet 164,307 164,307 164,307 164,307 Capacity 1,507 1,318 1,318 1,278 Enrollment 1,298 1,250 980 912 HighMartin County High School (1963) Square feet 365,764 365,764 365,764 365,764 Capacity 2,480 2,432 2,432 2,432 Enrollment 1,946 1,809 1,937 1,958 South Fork High School(1982) Square feet 295,394 295,394 295,394 295,394 Capacity 2,060 1,906 1,906 1,906 Enrollment 2,072 2,057 2,059 1,979 Jensen Beach High School (2002) Square feet 323,747 323,747 323,747 323,747 Capacity 1,676 1,676 1,676 1,676 Enrollment 1,037 1,357 1,510 1,520
(continued)
Fiscal Year
128

Table 13
Fiscal Year
2008 2009 2010 2011(3) 2012(4) 2013(5)
210,194 210,194 219,253 219,253 219,253 219,253 1,255 1,395 1,316 1,184 1,184 1,184
901 904 889 984 956 941
177,323 172,041 178,828 173,566 173,566 178,828 1,458 1,445 1,455 1,210 1,210 1,329 1,119 1,113 1,147 1,090 1,086 1,048
102,183 98,053 155,404 155,404 155,404 155,404 706 770 1,348 1,213 1,213 1,213 408 400 399 401 421 463
188,198 185,670 213,597 211,889 211,889 215,345 1,509 1,641 1,643 1,439 1,177 1,256
750 767 757 760 747 815
166,760 148,006 198,350 174,517 174,517 174,517 11,337 1,130 1,852 1,156 1,156 1,179
919 877 854 881 927 967
371,536 426,584 431,008 431,008 396,341 417,947 2,489 2,589 2,517 2,391 1,651 2,214 1,951 1,993 1,966 1,945 1,998 2,119
337,462 311,353 298,302 313,984 313,984 317,078 2,603 2,369 2,114 1,672 1,634 1,685 1,964 1,917 1,863 1,829 1,840 1,933
323,747 323,747 323,999 323,857 323,857 323,999 1,590 1,674 1,636 1,554 1,554 1,554 1,523 1,527 1,542 1,573 1,634 1,771
129

Table 13
DISTRICT SCHOOL BOARD OF MARTIN COUNTY, FLORIDASchool Building Information (1)Last 10 Fiscal Years(Unaudited)
School 2004 2005 2006 2007
Fiscal Year
OtherSpectrum JR/SR High School (1932) Square feet 26,480 16,794 16,794 16,794 Capacity 304 142 179 142 Enrollment 94 81 92 104 Challenger School (1988) Square feet 46,458 46,458 46,458 46,458 Capacity 156 156 156 171 Enrollment 66 64 70 79
Sources:
District records - Five-year facilities work plan
Florida Inventory of School Houses
(1) The District caps its enrollment at 750 for elementary schools,
1,200 for middle schools, and 1,800 for high schools.(2) Rebuilt schools include only information after rebuilding.(3)Square footage and capacity have changed for some schools due to the re-measurement
and change of use by BRPH for the Five-Year Plant Survey.(4)Square footage and capacity have changed for some schools due to remodeling work
completed in 2011-12, building demolitions, ESE cluster sites per DOE, and vacant buildings pending demolition.(5)Square footage and capacity have changed for some schools due to portable relocations and demolitions.
130

Table 13
Fiscal Year
2008 2009 2010 2011(3) 2012(4) 2013(5)
23,234 20,298 20,024 15,655 15,655 19,159 317 218 231 130 130 218 111 155 77 90 85 61
46,573 51,577 44,205 44,105 44,105 44,155 171 171 171 171 171 171
80 75 71 58 38 31
131

Table 14
DISTRICT SCHOOL BOARD OF MARTIN COUNTY, FLORIDAPrincipal Employers
Current Year and Nine Years Ago1
(Unaudited)
Percentage of Total
Current year (2012): County Employer Rank Employees Employment Product/Service
Martin Health Systems 1 2,783 4.41% Health CareMartin County School District 2 2,590 4.11% GovernmentMartin County 3 1,565 2.48% GovernmentState of Florida 4 580 0.92% GovernmentTriumph Group - Vought Aircraft Division 5 408 0.65% Aerospace ProductsTurboCombustor Technologies Inc. 6 396 0.63% Telephone Co.Liberator Medical Holdings Inc. 7 340 0.54% Aerospace ProductsSeacoast National Bank 8 294 0.47% BankingLouis Dreyfus Commodities 9 250 0.40% MerchandiserArmellini Express Lines 10 223 0.35% Trucking
Total 9,429 14.96%
Nine years ago (2003):Martin County School District 1 2,554 4.18% GovernmentMartin Health Systems 2 2,483 4.06% Health CareMartin County Government 3 1,664 2.72% GovernmentPublix Super Markets, Inc. 4 1,173 1.92% Grocery ChainArmellini Express Lines 5 719 1.18% TruckingState of Florida 6 706 1.16% GovernmentWinn-Dixie 7 423 0.69% Grocery ChainTriumph Group - Vought Aircraft Division 8 400 0.65% Aerospace ProductsThe Home Depot 9 363 0.59% Retail Department StoreScripps Treasure Coast Publishing 10 300 0.49% Newspaper
Total 10,785 17.64%
Note: The labor force figures for 2012 and 2003 are 63,073 and 61,107, respectively. These numbers were used to calculate
the percentage of total county employment.
Source: Martin County Clerk's Office provided the 2003 and 2012 data.
FL Labor Market Statistics, Quarterly Census of Employment and Wages Program1 Information for 2013 is not available, so this schedule was prepared with the data of 2012 and 2003.
132

Table 15
DISTRICT SCHOOL BOARD OF MARTIN COUNTY, FLORIDAOperating StatisticsLast Ten Fiscal Years(Unaudited)
(1) (1) Cost (2)
Fiscal Operating Student per Percentage Teaching Pupil/TeacherYear Expenditures Memberships Pupil Change Staff Ratio2004 121,462,073 17,447 6,962 1.96% 1,121 15.62005 132,962,947 17,657 7,530 8.17% 1,142 15.52006 144,888,287 17,760 8,158 8.34% 1,210 14.72007 156,144,085 17,826 8,759 7.37% 1,224 14.62008 161,461,835 17,703 9,121 4.12% 1,253 14.12009 155,166,255 17,631 8,801 -3.51% 1,289 13.72010 158,062,988 17,612 8,975 1.98% 1,309 13.5
2011 163,167,496 17,759 9,188 2.38% 1,355 13.12012 155,162,209 17,964 8,637 -6.00% 1,265 14.22013 157,085,087 18,267 8,599 -0.44% 1,352 13.5
Source: (1) District records(2) Florida Department of Education - includes all instructional personnel. (classroom teachers,
guidance counselors, other, etc.)Notes: Expenditures include General and Special Revenue Funds.
Community service, facility acquisition and construction, and other capital outlay expenditures are excluded from amounts shown above.
133

Table 16
DISTRICT SCHOOL BOARD OF MARTIN COUNTY, FLORIDAFood Service Operating DataLast Ten Fiscal Years(Unaudited)
2004 2005 2006 2007
Days meals were served 180 177 177 180
Average number of free and reduced lunches served daily 4,708 4,887 4,574 4,421
Total number of free and reduced lunches served 847,366 864,934 809,664 795,803
Average daily subsidy received 16,736$ 16,082$ 17,268$ 16,453$
Total subsidy received 3,012,488$ 2,846,495$ 3,056,415$ 2,961,584$
Average number of lunches served daily 8,260 8,587 8,479 8,618
Total number of lunches served 1,486,737 1,519,851 1,500,753 1,551,266
Percentage of free and reduced lunches served to total meals 57.00% 56.91% 53.95% 51.30%
Average daily revenues 32,480$ 33,657$ 36,755$ 36,173$
Total revenues 5,846,321$ 5,957,317$ 6,505,702$ 6,511,207$
Average daily costs 30,593$ 35,293$ 36,816$ 39,867$
Total costs 5,506,669$ 6,246,919$ 6,516,430$ 7,176,124$
Source: District Records
Fiscal Year
134

Table 16
2008 2009 2010 2011 2012 2013
180 180 180 180 180 180
4,536 4,930 5,336 5,916 6,201 6,260
816,466 887,337 960,559 1,064,941 1,116,133 1,126,823
17,775$ 20,418$ 22,013$ 24,891$ 27,011$ 29,471$
3,199,581$ 3,675,167$ 3,962,301$ 4,480,344$ 4,861,936$ 5,304,851$
8,998 8,806 8,712 9,425 9,630 9,405
1,619,721 1,585,167 1,568,250 1,696,459 1,733,429 1,692,924
50.41% 55.98% 61.25% 62.77% 64.39% 66.56%
36,684$ 38,050$ 38,257$ 41,333$ 42,686$ 43,771$
6,603,070$ 6,849,010$ 6,886,294$ 7,439,956$ 7,683,416$ 7,878,796$
40,252$ 39,502$ 36,279$ 36,890$ 38,313$ 40,992$
7,245,316$ 7,110,363$ 6,530,245$ 6,640,240$ 6,896,268$ 7,378,585$
Fiscal Year
135

This page was intentionally left blank
136

SINGLE AUDIT SECTION
137

This page was intentionally left blank
138

DISTRICT SCHOOL BOARD OF MARTIN COUNTY,
FLORIDA
Federal Reports and Schedules
Schedule of Expenditures of Federal Awards Independent Auditor’s Report on Internal Control Over Financial Reporting and on Compliance and Other Matters Based on an Audit of the Financial Statements Performed in Accordance with Government Auditing Standards Independent Auditor’s Report on Compliance for Each Major Federal Program and Report on Internal Control Over Compliance Schedule of Findings and Questioned Costs Summary Schedule of Prior Audit Findings—Federal Awards
139

DISTRICT SCHOOL BOARD OF MARTIN COUNTYSCHEDULE OF EXPENDITURES OF FEDERAL AWARDSFor the Fiscal Year Ended June 30, 2013
Catalog of Federal Domestic Assistance
NumberPass - Through
Grantor Number Amount of
Expenditures (1)
Amount Provided to
SubrecipientsUnited States Department of Agriculture:
Indirect:Child Nutrition Cluster:
Florida Department of Agriculture and Consumer Services:School Breakfast Program 10.553 321 960,148.84$ -$ National School Lunch Program 10.555 (2) (A) 300, 350 4,036,877.09 Summer Food Service Program for Children 10.559 323 120,485.44
Total Child Nutrition Cluster 5,117,511.37 -
Florida Department of Agriculture and Consumer Services:Fresh Fruit and Vegetable Program 10.582 330 105,535.88
Total United States Department of Agriculture 5,223,047.25 -
United States Environmental Protection Agency:Indirect:
St. Johns River Water Management District:National Estuary Program 66.456 None 21,084.00
United States Department of Energy:Indirect:
University of Central FloridaARRA - State Energy Program 81.041(2)(B) None 137,010.74
United States Department of Education:Indirect:
Special Education Cluster:Florida Department of Education:
Special Education - Grants to States 84.027 (4) 263 3,761,636.19 15,871.50 Special Education - Preschool Grants 84.173 267 137,806.43
University of South Florida:Special Education - Grants to States 84.027 (4) None 23,900.00
St. Lucie County District School Board:Special Education - Grants to States 84.027 (4) None 23,166.00
Total Special Education Cluster 3,946,508.62 15,871.50
Florida Department of EducationAdult Education - Basic Grants to States 84.002 191, 193 111,340.61 Title I Grants to Local Educational Agencies 84.010 212, 220, 221, 226, 228 3,520,242.83 Migrant Education - State Grant Program 84.011 217 89,099.80 Career and Technical Education - Basic Grants to States 84.048 161 136,819.04 English Language Acquisition Grants 84.365 102 232,814.73 Improving Teacher Quality State Grants 84.367 224 631,843.49
ARRA - State Fiscal Stabilization Fund (SFSF) - Race-to-the-Top Incentive Grants, Recovery Act 84.395 RL111 321,696.89 Education Jobs Fund 84.410 541 39,253.88
University of Central Florida:Mathematics and Science Partnerships 84.366 None 39,303.69
Total United States Department of Education 9,068,923.58 15,871.50
United States Department of Health and Human Services:Direct:
Head Start 93.600 (3) N/A 1,901,223.40 -
Total United States Department of Health and Human Services 1,901,223.40 -
United States Department of Defense:Direct:
Army Junior Reserve Officers Training Corps None N/A 72,777.91 Air Force Junior Reserve Officers Training Corps None N/A 131,155.58
Total United States Department of Defense 203,933.49 -
Total Expenditures of Federal Awards 16,555,222.46$ 15,871.50$
Notes: (1)
(2)(A)
donation.(B)
(3)
(4) Special Education - Expenditures total $3,808,702.19 for CFDA No. 84.027.
Head Start - Expenditures include $843,092.67 for grant number/program year 4CH0466/20 and $1,058,130.73 for grant number/program year 04CH0466/21.
National School Lunch Program - Includes $470,058 of donated food received during the fiscal year. Donated foods are valued at fair value as determined at the time of
State Energy Program - Includes $137,010.74 representing the Federally-paid portion of solar panels and related site preparation and installation costs.
Federal Grantor/Pass-Through Grantor/Program Title
Basis of Presentation. The Schedule of Expenditures of Federal Awards represents amounts expended from Federal Programs during the fiscal year as determined based on the modifiedaccrual basis of accounting. The amounts reported on the Schedule have been reconciled to and are in material agreement with amounts recorded in the District's accounting recordsfrom which the basic financial statements have been reported.Noncash Assistance:
140

141
AUDITOR GENERAL STATE OF FLORIDA
G74 Claude Pepper Building 111 West Madison Street
Tallahassee, Florida 32399-1450
The President of the Senate, the Speaker of the
House of Representatives, and the Legislative Auditing Committee
INDEPENDENT AUDITOR’S REPORT ON INTERNAL CONTROL OVER
FINANCIAL REPORTING AND ON COMPLIANCE AND OTHER MATTERS
BASED ON AN AUDIT OF THE FINANCIAL STATEMENTS PERFORMED
IN ACCORDANCE WITH GOVERNMENT AUDITING STANDARDS
Report on the Financial Statements
We have audited, in accordance with auditing standards generally accepted in the United States of America and the
standards applicable to financial audits contained in Government Auditing Standards issued by the Comptroller General
of the United States, the financial statements of the governmental activities, the discretely presented component unit,
each major fund, and the aggregate remaining fund information of the Martin County District School Board as of and
for the fiscal year ended June 30, 2013, and the related notes to the financial statements, which collectively comprise the District’s basic financial statements, and have issued our report thereon dated December 11, 2013, included under
the heading INDEPENDENT AUDITOR’S REPORT. Our report includes a reference to other auditors who
audited the financial statements of the discretely presented component unit, as described in our report on the Martin
County District School Board’s financial statements. This report does not include the results of the other auditors’
testing of internal control over financial reporting or compliance and other matters that are reported on separately by those auditors.
Internal Control Over Financial Reporting
In planning and performing our audit of the financial statements, we considered the District’s internal control over financial reporting (internal control) to determine the audit procedures that are appropriate in the circumstances for
the purpose of expressing our opinions on the financial statements, but not for the purpose of expressing an opinion
on the effectiveness of the District’s internal control. Accordingly, we do not express an opinion on the effectiveness
of the District’s internal control.
A deficiency in internal control exists when the design or operation of a control does not allow management or employees, in the normal course of performing their assigned functions, to prevent or detect and correct misstatements on a
timely basis. A material weakness is a deficiency, or combination of deficiencies, in internal control such that there is a
DAVID W. MARTIN, CPA
AUDITOR GENERAL PHONE: 850-412-2722
FAX: 850-488-6975

142
reasonable possibility that a material misstatement of the District’s financial statements will not be prevented, or
detected and corrected on a timely basis. A significant deficiency is a deficiency, or a combination of deficiencies, in
internal control that is less severe than a material weakness, yet important enough to merit attention by those charged with governance.
Our consideration of internal control was for the limited purpose described in the first paragraph of this section and
was not designed to identify all deficiencies in internal control that might be material weaknesses or significant
deficiencies. Given these limitations, during our audit we did not identify any deficiencies in internal control that we
consider to be material weaknesses. However, material weaknesses may exist that have not been identified.
Compliance and Other Matters
As part of obtaining reasonable assurance about whether the District’s financial statements are free of material
misstatement, we performed tests of its compliance with certain provisions of laws, rules, regulations, contracts, and
grant agreements, noncompliance with which could have a direct and material effect on the determination of financial
statement amounts. However, providing an opinion on compliance with those provisions was not an objective of our
audit and, accordingly, we do not express such an opinion. The results of our tests disclosed no instances of noncompliance or other matters that are required to be reported under Government Auditing Standards.
We noted a certain additional matter that is discussed in the SCHEDULE OF FINDINGS AND QUESTIONED
COSTS section of this report. In addition, we noted certain matters that we reported to District management in our
operational audit report No. 2014-062, dated December 2013.
Management’s response to the finding described in the section of this report is included as Exhibit A. We did not audit management’s response and, accordingly, we express no opinion on it.
Purpose of this Report
The purpose of the INDEPENDENT AUDITOR’S REPORT ON INTERNAL CONTROL OVER
FINANCIAL REPORTING AND ON COMPLIANCE AND OTHER MATTERS BASED ON AN
AUDIT OF THE FINANCIAL STATEMENTS PERFORMED IN ACCORDANCE WITH
GOVERNMENT AUDITING STANDARDS is solely to describe the scope of our testing of internal control
and compliance and the results of that testing, and not to provide an opinion on the effectiveness of the District’s
internal control or on compliance. This report is an integral part of an audit performed in accordance with Government Auditing Standards in considering the District’s internal control and compliance. Accordingly, this report is not suitable
for any other purpose.
Respectfully submitted,
David W. Martin, CPA
Tallahassee, Florida
December 11, 2013
Audit Report No. 2014-059

143
AUDITOR GENERAL STATE OF FLORIDA
G74 Claude Pepper Building 111 West Madison Street
Tallahassee, Florida 32399-1450
The President of the Senate, the Speaker of the
House of Representatives, and the Legislative Auditing Committee
INDEPENDENT AUDITOR’S REPORT ON COMPLIANCE FOR EACH MAJOR
FEDERAL PROGRAM AND REPORT ON INTERNAL CONTROL OVER COMPLIANCE
Report on Compliance for Each Major Federal Program
We have audited the Martin County District School Board’s compliance with the types of compliance requirements
described in the OMB Circular A-133 Compliance Supplement that could have a direct and material effect on each of the District’s major Federal programs for the fiscal year ended June 30, 2013. The District’s major Federal programs are
identified in the SUMMARY OF AUDITOR’S RESULTS section of the SCHEDULE OF FINDINGS AND
QUESTIONED COSTS.
Management’s Responsibility
Management is responsible for compliance with the requirements of laws, regulations, contracts, and grants applicable to its Federal programs.
Auditor’s Responsibility
Our responsibility is to express an opinion on compliance for each of the District’s major Federal programs based on
our audit of the types of compliance requirements referred to above. We conducted our audit of compliance in
accordance with auditing standards generally accepted in the United States of America; the standards applicable to financial audits contained in Government Auditing Standards, issued by the Comptroller General of the United States; and
OMB Circular A-133, Audits of States, Local Governments, and Non-Profit Organizations. Those standards and OMB
Circular A-133 require that we plan and perform the audit to obtain reasonable assurance about whether
noncompliance with the types of compliance requirements referred to above that could have a direct and material
effect on a major Federal program occurred. An audit includes examining, on a test basis, evidence about the
District’s compliance with those requirements and performing such other procedures as we considered necessary in the circumstances.
We believe that our audit provides a reasonable basis for our opinion on compliance for each major Federal program.
However, our audit does not provide a legal determination of the District’s compliance.
DAVID W. MARTIN, CPA
AUDITOR GENERAL PHONE: 850-412-2722
FAX: 850-488-6975

144
Opinion on Each Major Federal Program
In our opinion, the District complied, in all material respects, with the types of compliance requirements referred to
above that could have a direct and material effect on each of its major Federal programs for the fiscal year ended June 30, 2013.
Report on Internal Control Over Compliance
District management is responsible for establishing and maintaining effective internal control over compliance with
the types of compliance requirements referred to above. In planning and performing our audit of compliance, we
considered the District’s internal control over compliance with the types of requirements that could have a direct and
material effect on each major Federal program to determine the auditing procedures that are appropriate in the circumstances for the purpose of expressing an opinion on compliance for each major Federal program and to test
and report on internal control over compliance in accordance with OMB Circular A-133, but not for the purpose of
expressing an opinion on the effectiveness of internal control over compliance. Accordingly, we do not express an
opinion on the effectiveness of the District’s internal control over compliance.
A deficiency in internal control over compliance exists when the design or operation of a control over compliance does not allow management or employees, in the normal course of performing their assigned functions, to prevent, or detect
and correct, noncompliance with a type of compliance requirement of a Federal program on a timely basis. A material
weakness in internal control over compliance is a deficiency, or combination of deficiencies, in internal control over
compliance, such that there is a reasonable possibility that material noncompliance with a type of compliance
requirement of a Federal program will not be prevented, or detected and corrected on a timely basis. A significant deficiency in internal control over compliance is a deficiency, or combination of deficiencies, in internal control over
compliance with a type of compliance requirement of a Federal program that is less severe than a material weakness in
internal control over compliance, yet important enough to merit attention by those charged with governance.
Our consideration of internal control over compliance was for the limited purpose described in the first paragraph of
this section and was not designed to identify all deficiencies in internal control over compliance that might be material
weaknesses or significant deficiencies. We did not identify any deficiencies in internal control over compliance that we consider to be material weaknesses. However, material weaknesses may exist that have not been identified.
Purpose of this Report
The purpose of this report on internal control over compliance is solely to describe the scope of our testing of
internal control over compliance and the results of that testing based on the requirements of OMB Circular A-133.
Accordingly, this report is not suitable for any other purpose.
Respectfully submitted,
David W. Martin, CPA
Tallahassee, Florida
December 11, 2013
Audit Report No. 2014-059

145
MARTIN COUNTY DISTRICT SCHOOL BOARD
SCHEDULE OF FINDINGS AND QUESTIONED COSTS FOR THE FISCAL YEAR ENDED JUNE 30, 2013
SUMMARY OF AUDITOR’S RESULTS
Financial Statements
Type of auditor’s report issued: Unmodified
Internal control over financial reporting:
Material weakness(es) identified? No
Significant deficiency(ies) identified? None reported
Noncompliance material to financial statements noted? No
Federal Awards
Internal control over major programs:
Material weakness(es) identified? No
Significant deficiency(ies) identified? None reported
Type of auditor’s report issued on compliance for major programs: Unmodified
Any audit findings disclosed that are required to be reported in accordance with Section 510(a) of OMB Circular A-133? No
Identification of major programs: CFDA Number(s): Name of Federal Program or Cluster: 81.041 ARRA – State Energy Program 84.027 and 84.173 Special Education Cluster 84.010 Title I Grants to Local Educational Agencies Dollar threshold used to distinguish between
Type A and Type B programs: $496,656
Auditee qualified as low-risk auditee? Yes

146
ADDITIONAL MATTER
Finding No. 1: Financial Reporting
Preparation of fund financial statements pursuant to generally accepted accounting principles (GAAP) requires an
analysis to determine the major governmental funds that require separate columnar presentation. The District must
report a governmental fund as major when the fund’s liabilities represent at least 10 percent of the total governmental fund liabilities.
Our review of the District’s 2012-13 fiscal year annual financial report, as submitted to the Florida Department of
Education and presented for audit, indicated improvements could be made in financial reporting procedures. Because
of an inadvertent account misclassification, total governmental fund liabilities was incorrect and District personnel did
not separately identify and report the Special Revenue - Other Fund as a major fund. Separately reporting major funds allows financial statement users to readily identify the District’s most significant funds and their account
balances and transactions, and ensures compliance with GAAP.
We extended our procedures to determine the adjustments necessary to properly report the Special Revenue - Other
Fund as a major fund on the financial statements, and District personnel accepted these adjustments. However, our
extended audit procedures cannot substitute for management’s responsibility to implement adequate controls over financial reporting.
Recommendation: The District should improve its financial reporting procedures to ensure that major funds are properly identified and reported on the financial statements.
PRIOR AUDIT FOLLOW-UP
Except as discussed in the SUMMARY SCHEDULE OF PRIOR AUDIT FINDINGS – FEDERAL
AWARDS, the District had taken corrective actions for findings included in our report No. 2013-046.
MANAGEMENT’S RESPONSE
Management’s response is included as Exhibit A.

147
SUMMARY SCHEDULE OF PRIOR AUDIT FINDINGS – FEDERAL AWARDS
MARTIN COUNTYDISTRICT SCHOOL BOARD
SUMMARY SCHEDULE OF PRIOR AUDIT FINDINGS - FEDERAL AWARDSFor the Fiscal Year Ended June 30, 2013
Audit Report No. Program/Area Brief Description Status Commentsand Federal
Awards Finding No.
2011-122(3)
Listed below is the District's summary of the status of prior audit findings on Federal programs:
Certain salary and benefit costs were inappropiately charged to the program, resulting in questioned costs of $6,369.03.
Head Start (CFDA No. 93.600) - Allowable Costs/Cost Principles - Compensation of Personnel Services
Partially Corrected The District revised its cost allocation plan in the 2010-11 school year. The District noted that the 2010 non-Federal share exceeded the required amount by $25,842.06 and will consult the grantor as to applying the overage to the questioned costs.

148
EXHIBIT A MANAGEMENT’S RESPONSE