Embed Size (px)
Citation preview
District of Lantzville
WATER SUPPLY &
DISTRIBUTION SYSTEM STUDY
July 2015
PARKSVILLE, BC
July 16, 2015 1420‐01 District of Lantzville 7192 Lantzville Rd PO Box 100 Lantzville, BC V0R 2H0 Attention: Mr. Fred Spears Director of Public Works Re: District of Lantzville
Water Supply & Distribution System Study
We are pleased to submit five bound and an electronic (pdf) copy of our District of Lantzville Water Supply & Distribution System Study. The report provides a comprehensive analysis of the District’s water supply and distribution system, and projects water supply requirements to service the properties within the District’s OCP Map 7 ‐ Water Service Area that are presently not serviced. A detailed computer network analysis of the water distribution system was carried out and improvements needed to meet pressure and flow, including fire flow, requirements under existing and future conditions have been identified, including: watermain looping; watermain upgrading; and reservoir storage expansion. The District’s current design water demand per lot is higher than the calculated usage over the past 19 years. A review of design standards for other mid‐Island municipalities revealed that the District’s design demand is in the middle range compared to the other municipalities and is similar to its closest neighbours (Nanaimo and Parksville). To date, the District’s water supply source has been able to meet the maximum day demand. This is due in part to the very low demands of the system users. The District’s average day and maximum day demands per capita are between 60% and 65% of those of its closest neighbor; the City of Nanaimo. It is essential that, though a review of current demands along with the estimated capacity of the wellfield suggests additional properties can be serviced, the District first carry out the wellfield upgrading works in an effort to increase the pumping capacity of the wells to that of the long‐term sustainable yield. Upon confirmation of the increased pumping rates and their sustainability, consideration should then be given to providing service to additional properties. The provincial government has recently enacted the Water Sustainability Act (Bill 18) which requires the registering and annual licensing of groundwater wells. The District should register the wells as soon as possible. …/2
July 16, 2015 2 1420‐01 District of Lantzille Mr. Fred Spears We have enjoyed working on this important study. We would be pleased to discuss implementation of the recommendations with staff and Council and look forward to assisting the District in the further development of its water system. Yours truly, KOERS & ASSOCIATES ENGINEERING LTD.
Chris Holmes, PEng Rob Hoffman, PEng Project Engineer Project Manager
i
District of Lantzville Water Supply & Distribution System Study July 16, 2015
District of Lantzville
WATER SUPPLY & DISTRIBUTION SYSTEM STUDY
TABLE OF CONTENTS Page Letter of Transmittal
1 INTRODUCTION 1 1.1 Authorization ........................................................................................................... 1 1.2 Background .............................................................................................................. 1 1.3 Previous Studies ....................................................................................................... 3 1.4 Regional Water System ............................................................................................ 3 1.5 Study Objectives ...................................................................................................... 5 1.6 Scope of Work .......................................................................................................... 5 1.7 Acknowledgements.................................................................................................. 7
2 WATER SYSTEM 8 2.1 Supply Source........................................................................................................... 8 2.2 Treatment ................................................................................................................ 8 2.3 Reservoirs ................................................................................................................ 9 2.4 Distribution System ................................................................................................ 10
2.4.1 Water Mains ............................................................................................ 10 2.4.2 Pressure Zones ......................................................................................... 10 2.4.3 City of Nanaimo Emergency Connection ................................................. 11
3 WELLFIELD CAPACITY 12 3.1 Aquifer ................................................................................................................... 12
3.1.1 Water Bearing Layer(s) Soils .................................................................... 12 3.1.2 Recharge .................................................................................................. 12
3.2 Wellfield Pumping Capacity ................................................................................... 12 3.2 Water Sustainability Act ........................................................................................ 13
4 POPULATION 15 4.1 Historic Population ................................................................................................ 15 4.2 Future Population .................................................................................................. 16
5 WATER DEMAND 18 5.1 Current Demands ................................................................................................... 18
5.1.1 Bulk Water Meter .................................................................................... 18 5.1.2 Individual Water Meters .......................................................................... 23
5.2 Future Demands .................................................................................................... 28 5.2.1 Service Area ............................................................................................. 28 5.2.2 Historical Demand Extrapolation ............................................................. 29 5.2.3 Design Standard Extrapolation ................................................................ 30
5.3 BC Living Water Smart Program ............................................................................. 33
ii
District of Lantzville Water Supply & Distribution System Study July 16, 2015
5.4 Climate Change ...................................................................................................... 33
6 WATER MODEL 35 6.1 Computer Program ................................................................................................ 35 6.2 Model Update ........................................................................................................ 35
6.2.1 Supply & Distribution System .................................................................. 35 6.2.2 Pipe Friction Factors ................................................................................ 35 6.2.3 Allocation of Demands ............................................................................ 36
6.3 Analysis Criteria ..................................................................................................... 36 6.3.1 Water Demands ....................................................................................... 36 6.3.2 Fire Flow Requirements ........................................................................... 37 6.3.3 Fire Hydrants ........................................................................................... 38 6.3.4 Reservoir Sizing ........................................................................................ 39 6.3.5 Distribution System ................................................................................. 39
7 SYSTEM ANALYSIS 40 7.1 Distribution system ................................................................................................ 40
7.1.1 Peak Hour Pressures ................................................................................ 40 7.1.2 Available Fire Flows ................................................................................. 42
7.2 Reservoir Storage ................................................................................................... 44 7.2.1 Upper Pressure Zone (Aulds Rd Reservoir) .............................................. 44 7.2.2 Lower Pressure Zone (Ware Rd Reservoir) .............................................. 46
7.3 Northwind/Southwind Area Servicing ................................................................... 49 7.4 Asbestos Cement Watermains ............................................................................... 49 7.5 City of Nanaimo Bulk Water Supply Agreement .................................................... 50
8 PROPOSED IMPROVEMENTS 51
9 CONCLUSIONS 57
10 RECOMMENDATIONS 64 TABLES Page
1 Previous Water Studies ...................................................................................................... 3
2 Water Storage Reservoir Characteristics .......................................................................... 10
3 Pipe Lengths by Material and Diameter ........................................................................... 10
4 PRV Characteristics ........................................................................................................... 11
5 Well Pump Characteristics and Yield ................................................................................ 13
6 Population Estimates, 2003 – 2014 .................................................................................. 15
7 Population Projections to Year 2065 (50 Years) ............................................................... 16
8 House Construction Projections to Year 2065 (50 Years) ................................................. 17
9 Wellfield vs Upper & Lower Pressure Zone Bulk Meter Annual Demands, 2011 – 2014 . 18
10 Monthly Demands, 2011 – 2015 ...................................................................................... 19
11 Annual, Average Day & Maximum Day Demand, 1996 – 2001 & 2011 – 2014 ................ 21
12 Average & Maximum Day Demand Per Capita, Vancouver Island Communities ............. 22
13 Annual Demand by Land‐Use, 2010 – 2014 ...................................................................... 25
14 2012 Water Demand by Land‐Use, Vancouver Island Communities ................................ 26
15 Five Highest Water Users by Land‐Use, Jan – Sept 2014 .................................................. 27
16 Single Family Residential Demands, Jan – Sept 2014 ....................................................... 28
iii
District of Lantzville Water Supply & Distribution System Study July 16, 2015
17 Demands per Service Connection, 2012 – 2014 ............................................................... 29
18 Service Area Water Demands based on 2014 Per Connection Demands ......................... 30
19 Per Capita Design Demands, Mid Vancouver Island Municipalities ................................. 31
20 Maximum Lots Serviced for Varying Design Demands and Wellfield Yields .................... 32
21 Pipe Friction Factors ......................................................................................................... 35
22 Modelled Water Demands ............................................................................................... 36
23 Fire Flow Demand by Land Use ........................................................................................ 37
24 Recommended Maximum Distance between Fire Hydrants by Land‐Use ....................... 38
25 Hydrants to be Replaced .................................................................................................. 38
26 Distribution System Design Criteria .................................................................................. 39
27 Areas with Available Fire Flows less than Recommended Minimum Standard ............... 43
28 Upper Pressure Zone Reservoir Volume Requirements ................................................... 46
29 Lower Pressure Zone Reservoir Storage Requirements ................................................... 48
30 AC Watermain Replacement, 2010 – 2015 ....................................................................... 50
31 Proposed Works ........................................................................................................ 51 ‐ 52 FIGURES (After Page)
1 Pressure Zones .................................................................................................................. 11
2 Historic and Projected Population .................................................................................... 16
3 Daily Demand (Upper +Lower Zone Bulk Meters) March 2011 – June 2015 .... (on page) 20
4 Wellfield Daily & 7 Day Average Production .................................................................... 21
5 Annual, Average Day and Maximum Day Demands ......................................................... 22
6 Total Individual vs Upper & Lower Bulk Metered Quarterly Demand .............................. 23
7 Unaccounted for Water .................................................................................... (on page) 24
8 Percentage of Water Demand by Land‐Use ..................................................... (on page) 26
9 Single Family Residential Individual Meter Demands ....................................................... 28
10 Areas to be Provided Municipal Water Service & Fire Protection .................................... 29
11 Extrapolated Average and Maximum Day Demand by Area ............................................ 30
12 Extrapolated Total Average Day, Maximum Day & Maximum Week Demand
for Water Service Area ............................................................................................... 30 13 Existing Conditions Peak Hour Pressures.......................................................................... 40 14 Existing Conditions Available Fire Flows ........................................................................... 42 15 Future Conditions Available Fire Flows ............................................................................ 44 DRAWINGS (Located in Pocket at Rear of Report)
1420‐01 Existing System & Proposed Works
iv
District of Lantzville Water Supply & Distribution System Study July 16, 2015
APPENDICES
A City of Nanaimo & District of Lantzville Water Supply Agreement B District of Lantzville Phase 1 of Stage 1 Wellfield Management Plan – Wellfield
Capacity Existing & Ultimate, Harby Road Wellfield, October 15, 2014, Lowen Hydrogeology Consulting Ltd.
C District of Lantzville Harby Road Wellfield, Estimation of Well Efficiencies, March 31,
2015, Lowen Hydrogeology Consulting Ltd. D OCP Map 7 ‐ Water Service Area
1
District of Lantzville Water Supply & Distribution System Study July 16, 2015
1 INTRODUCTION
1.1 AUTHORIZATION
In December 2014, the District of Lantzville authorized Koers & Associates to carry out a comprehensive water study. The study was to assess the present and future capacity of the District’s water supply source, analyze the water distribution system, and provide recommendations to maintain an adequate level of service both now and in the future.
1.2 BACKGROUND
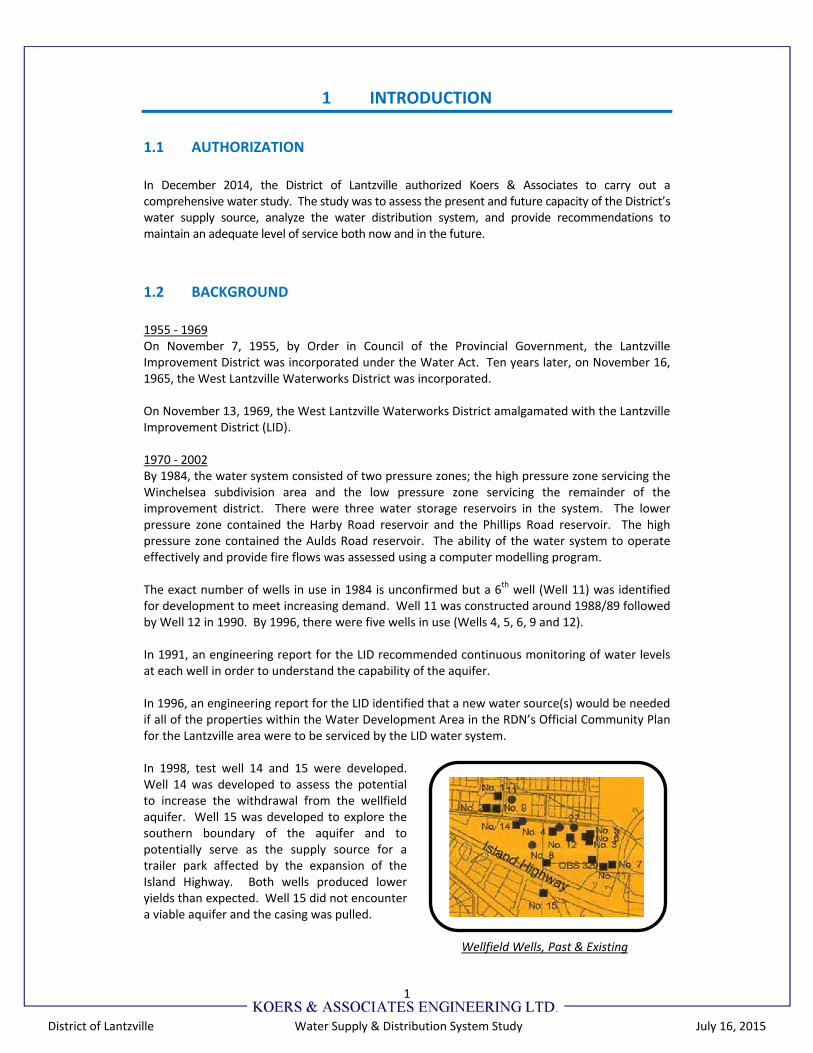
1955 ‐ 1969 On November 7, 1955, by Order in Council of the Provincial Government, the Lantzville Improvement District was incorporated under the Water Act. Ten years later, on November 16, 1965, the West Lantzville Waterworks District was incorporated. On November 13, 1969, the West Lantzville Waterworks District amalgamated with the Lantzville Improvement District (LID). 1970 ‐ 2002 By 1984, the water system consisted of two pressure zones; the high pressure zone servicing the Winchelsea subdivision area and the low pressure zone servicing the remainder of the improvement district. There were three water storage reservoirs in the system. The lower pressure zone contained the Harby Road reservoir and the Phillips Road reservoir. The high pressure zone contained the Aulds Road reservoir. The ability of the water system to operate effectively and provide fire flows was assessed using a computer modelling program. The exact number of wells in use in 1984 is unconfirmed but a 6th well (Well 11) was identified for development to meet increasing demand. Well 11 was constructed around 1988/89 followed by Well 12 in 1990. By 1996, there were five wells in use (Wells 4, 5, 6, 9 and 12). In 1991, an engineering report for the LID recommended continuous monitoring of water levels at each well in order to understand the capability of the aquifer. In 1996, an engineering report for the LID identified that a new water source(s) would be needed if all of the properties within the Water Development Area in the RDN’s Official Community Plan for the Lantzville area were to be serviced by the LID water system. In 1998, test well 14 and 15 were developed. Well 14 was developed to assess the potential to increase the withdrawal from the wellfield aquifer. Well 15 was developed to explore the southern boundary of the aquifer and to potentially serve as the supply source for a trailer park affected by the expansion of the Island Highway. Both wells produced lower yields than expected. Well 15 did not encounter a viable aquifer and the casing was pulled. Wellfield Wells, Past & Existing
2
District of Lantzville Water Supply & Distribution System Study July 16, 2015
In 2002, three water studies were completed for the LID as follows:
The Harby Road Wellfield Management study reviewed water quality, aquifer capacity, and current practices for the Harby Road aquifer. The study conclusions included a caution that under the then discharge rates, the aquifer depletion may be occurring. Further development of the aquifer was discouraged. Close monitoring of the response of the aquifer to water extraction and climatic conditions was recommended.
The Hardy Creek Feasibility Study evaluated the potential of development of a future groundwater supply in the Hardy Creek area with the drilling of a test well at the west end of Southwind Road. The yield was less than anticipated and it was concluded the well was not viable as a sustainable community water supply source.
The Water Quality Assessment Project report reviewed the performance of the water system including well supply, storage capacity, fire flow capability and maintenance procedures; evaluated planned improvements and identified alternatives; evaluated water treatment requirements and options, and assessed the effectiveness of proposed improvements under current and future conditions using a water distribution system computer modelling program.
In 2002/03 Well # 5 was abandoned. It is understood that its operation interfered with Well #6, such that there was little to no increase in overall water production with both wells were running. 2003 After a successful referendum, the Lantzville Improvement District ceased to exist and was replaced by the District of Lantzville, becoming the 155th municipality in BC on June 25, 2003. The population was estimated to be approximately 3,500. 2005 ‐ Present Since becoming a municipality, there has been a number of significant events within the District, including:
Development of an Official Community Plan
Implementation of Subdivision & Development Bylaw and Development Cost Charge Bylaw
Implementation of water source requirements for new lots
Construction of municipal sanitary sewer collection system, Phases 1 and 2 (2006‐2011)
Replacement of the Phillips Road reservoir with the Ware Road reservoir and construction of a dedicated supply main (2006)
Proposed multi‐phased Foothills development
Development of an emergency water service connection with the City of Nanaimo
Various watermain upgrades and available fire flow improvements
Signing of water supply agreement with the City of Nanaimo
3
District of Lantzville Water Supply & Distribution System Study July 16, 2015
1.3 PREVIOUS STUDIES
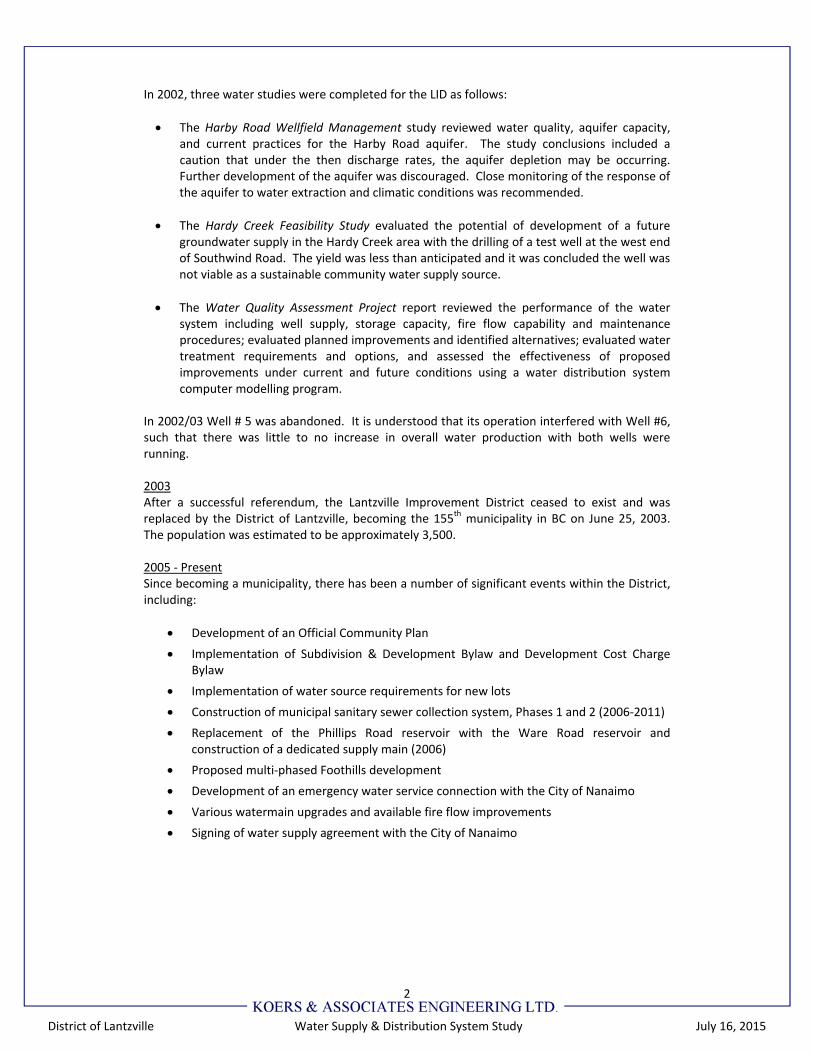
The ongoing need to understand the extent and yield of the District’s wellfield aquifer and how to manage it and the water system to meet current and future demands has resulted in a number of water supply and distribution system studies. This has included investigations into additional water supply source(s); both ground and surface. Table 1 presents a list of water supply and distribution system studies we are aware of that were completed for the District of Lantzville (and the former Lantzville Improvement District).
Table 1 Previous Water Studies
Date Study Author
1984 Water Study – Source & Supply Chatwin Engineering Ltd (CEL)
1984 Distribution System Analysis * CEL
1988 Water Supply Study CEL
1991 Reservoir Site Selection Study CEL
1996 Harby Road Well No. 11 Turner Groundwater Consultants
1996 Arrowsmith Water Service * CEL
1999 Well No. 14 and 15 Drilling & Testing Program * Agra Earth & Environmental
2001 Community Water System Report * unknown
2001 Water Quality & Reservoir Storage Review CEL
2002 Harby Road Wellfield Management * EBA Engineering Consultants Ltd (EBA)
2002 Hardy Creek Feasibility Study * EBA
2002 Water Quality Assessment Project * Koers & Associates Engineering Ltd
2012 Water Supply Integration Options Study * Koers & Associates Engineering Ltd.
2014 Technical Memorandum No 1 & 2 – City of Nanaimo & DoL Water Agreement *
Koers & Associates Engineering Ltd.
2014 Phase 1 of Stage 1 Wellfield Management Plan –Wellfield Capacity, Existing and Ultimate, Harby Road Wellfield *
Lowen Hydrogeology Consulting Ltd.
2015 Harby Road Wellfield – Estimation of Well Efficiencies *
Lowen Hydrogeology Consulting Ltd.
Note * Koers has a copy of the report.
1.4 REGIONAL WATER SYSTEM
The function of a regional water supply system naturally falls under the regional governing municipal authority; the Regional District of Nanaimo (RDN) which was incorporated in 1967. 1972 ‐ 1988 The first regional water study was undertaken in 1972. Three potential future surface water sources where identified with the one closest to the then LID being the Englishman River.
4
District of Lantzville Water Supply & Distribution System Study July 16, 2015
In 1988, after completion of an integrated regional water study focusing on the Englishman River and the Nanaimo River, South Fork – Jump Creek sources, it was decided it would be more feasible for the Greater Nanaimo Water District, which is now the City of Nanaimo, to proceed on its own. 1990 ‐ 1995 With the Greater Nanaimo Water District being developed to service the City of Nanaimo, a referendum was held and approved, in 1990, to carry out a pre‐design for a regional water supply system to service the area from Lantzville to Qualicum Beach, focusing on the Englishman River and Bonnel Creek as supply sources. The work, carried out between 1991 and 1993, culminated in a 1995 LID referendum for detailed design and construction of the regional water supply system. The referendum was not successful. 1996 – 2000 In 1996, the RDN, City of Parksville, and Town of Qualicum Beach formed the Arrowsmith Water Service (AWS) and oversaw construction of the Arrowsmith Lake Dam, the first stage of the development of the regional water supply system. 2001 ‐ 2011 Planning and implementation work continued on the AWS project including refinement of the water supply intake location and water treatment requirements. The Foothills development proposed within the municipal boundaries of the new District of Lantzville was required to develop a water supply source to meet the projected demands which were beyond the understood capacity of the District wellfield aquifer as per the conclusions of the 2002 Harby Road Wellfield Management Report. In 2011, the Englishman River Water Service (ERWS) venture was formed between the City of Parksville and the RDN as the Town of Qualicum Beach opted out of future capital works related to the regional water intake and treatment system. 2012 ‐ Present The continued growth of the City of Nanaimo has brought urban development and the City’s water distribution system to the eastern boundary of the District of Lantzville. On September 8, 2014, the District of Lantzville and the City of Nanaimo signed a bulk water sale/purchase agreement. The agreement is the fulfilment of more than 9 years of work since the District and the City signed a Memorandum of Understanding for the supplying of water. In order to obtain water from the City, the District must construct infrastructure to connect to the City’s water system. The agreement includes language on what areas of the District the water is to be used, how many connections per year are permitted and the costs payable to the City’s per connection along with an annual consumption fees. A copy of this agreement is presented in Appendix A.

5
District of Lantzville Water Supply & Distribution System Study July 16, 2015
1.5 STUDY OBJECTIVES
The objectives of this study are threefold: Water Distribution System
Update the computer model of the District’s water system and carry out an analysis to identify works necessary to provide peak hour and maximum day plus fire flow demands under current conditions.
Analyze the water system with respect to storage volume requirements under existing and future conditions, and in relation to the two pressure zones. Identify location options for additional storage.
Identify options to provide water supply and fire flows to residents in the Northwind/Southwind area.
Water Demands
Review current water use patterns and demands (annual vs seasonal vs monthly, average day vs maximum day).
Compare actual demands with other mid Vancouver Island municipalities.
Compare design demands with other mid Vancouver Island municipalities. Wellfield Capacity Investigation
Review previous reports and documents Review current production of each well and compare against historical (by Lowen
Hydrogeology Consulting Ltd, LHC) Review well draw down and recovery rates (by LHC) Assess sustainable yield for each well and for the wellfield. If ability to extract additional
water is identified, identify probable location, drill test well and carry‐out pumping test (by LHC)
Assess population that can be sustained by the District’s well field.
1.6 SCOPE OF WORK
To meet the study objective, the following work plan was adopted:
Project Start‐up Meeting, Data Collection & Review
Meet with District staff to review the project scope and work plan.
Obtain and review the following documents:
- Land‐use and OCP document and maps
- Wellfield daily water bulk metering records for the past three years
- Individual meter records for the past three years
- Proposed land development information (location, type of, phasing of developments, including year of construction start)
Model Development
Update in‐house model of the District’s system to reflect current conditions.
Re‐confirm PRV settings, reservoir control settings (top water level, control valve open and close), and booster pump settings. Enter information into water model.
6
District of Lantzville Water Supply & Distribution System Study July 16, 2015
Population and Demand Projections
Review population figures from the 2011 Census, BC Stats, anticipated growth rate from the District’s Planning Department
Obtain and review the District’s wellfield bulk water daily readings for the past three years.
Obtain and review the District’s individual water meter monthly readings for the past three years.
Develop existing average day, maximum day and peak hour demands for the entire system based on historical use.
Compare District’s demands with neighbouring municipalities.
Develop demands based on growth projections. Modelling Analysis Criteria
Establish modelling analysis criteria for distribution system (minimum system residual pressures during peak hour and fire flow demands, maximum static pressures, maximum velocities in mains, pipe friction factors) and reservoir storage requirements.
System Analysis Existing Conditions
Allocate water demands under existing conditions based on location of individual metered demands. Residential demands will be added in clusters consisting of approximately 10 locations per group. Commercial, Industrial and Institutional will be added based on meter location.
Run model for existing conditions for three demand conditions; average day; maximum day plus fire flow; and peak hour.
Check results of each against design criteria.
Identify system shortcomings (inadequate pressures or fire flows, velocities that exceed design guidelines, dead‐end mains) if any.
Adjust model, re‐run as needed to establish extent of required works. Investigate if other upgrading options are possible.
Using 24 hour extended time modelling feature, confirm system’s ability to refill the reservoirs.
Check reservoir storage capacity against design requirements.
Develop phasing plan of works.
Prepare cost estimate (Class D – order of magnitude) of proposed works. Servicing Northwind/Southwind Area
Allocate water demands for existing conditions and add watermains.
Run model under the three demand conditions to confirm watermain sizing.
Identify potential area for new water balancing storage reservoir to service this area and future development in the area. Run model to assess impact on watermain sizing.
Using 24 hour extended time modelling feature, confirm the system’s ability to refill the reservoirs.
Prepare cost estimate (Class D) for required works. Wellfield Sustainable Yield (Capacity) Review
Review past well drilling reports, wellfield aquifer reports, and other groundwater reports for the general areas.
Review current production of each well and compare against reported historical information on pumping rates and well yields.
Review current well draw down and recovery rates. The District has provided these records on file as part of their SCADA system; both historical and current readings.
7
District of Lantzville Water Supply & Distribution System Study July 16, 2015
Assess sustainable yield for each well and for the wellfield.
If ability to extract additional water is identified, identify probable location, drill test well and carry‐out pumping test.
The hydrogeological investigation work was carried out by Lowen Hydrogeology Consulting Ltd. directly for the DoL. Their findings are presented in the 2014 and 2015 reports listed in Table 1. An overview of their findings is presented in Section 3 Wellfield Capacity of this report. Draft Report
Present findings in a bound draft report, complete with plans, illustrations, graphs, tables, discussion, cost estimates, conclusions, and recommendations. A coloured plan drawing showing the District’s water system and proposed works will be included.
A digital (pdf) copy of the draft report will be submitted to the District for review. Upon review, a meeting will be arranged with staff to discuss the report, and agree on modifications or additions.
Final Report
Submit final report upon receipt of District comments. A digital (pdf) and four bound copies of the report will be provided.
1.7 ACKNOWLEDGEMENTS
Koers & Associates Engineering Ltd. acknowledges with thanks, the assistance provided by District staff, during data collection, analysis and report preparation.
8
District of Lantzville Water Supply & Distribution System Study July 16, 2015
2 WATER SYSTEM
The District of Lantzville obtains it water from four wells. The water from the wells is pumped to one of the District’s two reservoirs where it is chlorinated before entering the water distribution system. A brief discussion of the District’s water supply source, treatment, reservoirs and distribution system is presented below.
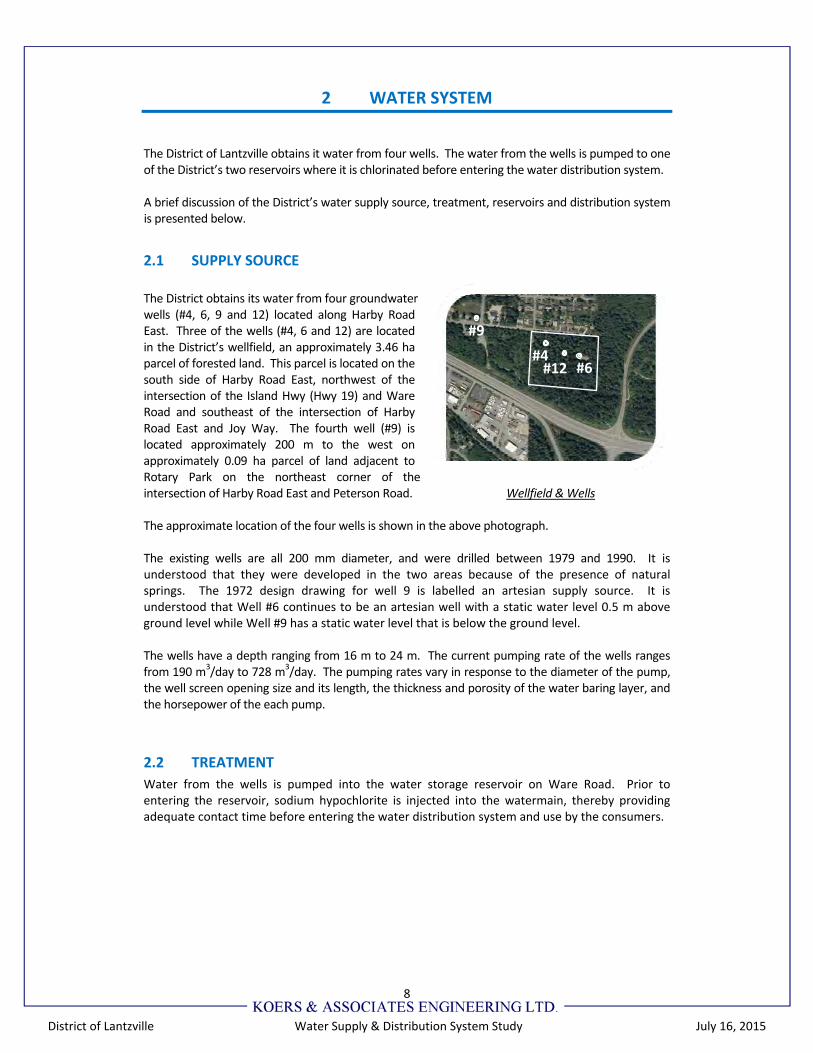
2.1 SUPPLY SOURCE
The District obtains its water from four groundwater wells (#4, 6, 9 and 12) located along Harby Road East. Three of the wells (#4, 6 and 12) are located in the District’s wellfield, an approximately 3.46 ha parcel of forested land. This parcel is located on the south side of Harby Road East, northwest of the intersection of the Island Hwy (Hwy 19) and Ware Road and southeast of the intersection of Harby Road East and Joy Way. The fourth well (#9) is located approximately 200 m to the west on approximately 0.09 ha parcel of land adjacent to Rotary Park on the northeast corner of the intersection of Harby Road East and Peterson Road. Wellfield & Wells The approximate location of the four wells is shown in the above photograph. The existing wells are all 200 mm diameter, and were drilled between 1979 and 1990. It is understood that they were developed in the two areas because of the presence of natural springs. The 1972 design drawing for well 9 is labelled an artesian supply source. It is understood that Well #6 continues to be an artesian well with a static water level 0.5 m above ground level while Well #9 has a static water level that is below the ground level. The wells have a depth ranging from 16 m to 24 m. The current pumping rate of the wells ranges from 190 m3/day to 728 m3/day. The pumping rates vary in response to the diameter of the pump, the well screen opening size and its length, the thickness and porosity of the water baring layer, and the horsepower of the each pump.
2.2 TREATMENT
Water from the wells is pumped into the water storage reservoir on Ware Road. Prior to entering the reservoir, sodium hypochlorite is injected into the watermain, thereby providing adequate contact time before entering the water distribution system and use by the consumers.
#9
#4#12 #6
9
District of Lantzville Water Supply & Distribution System Study July 16, 2015
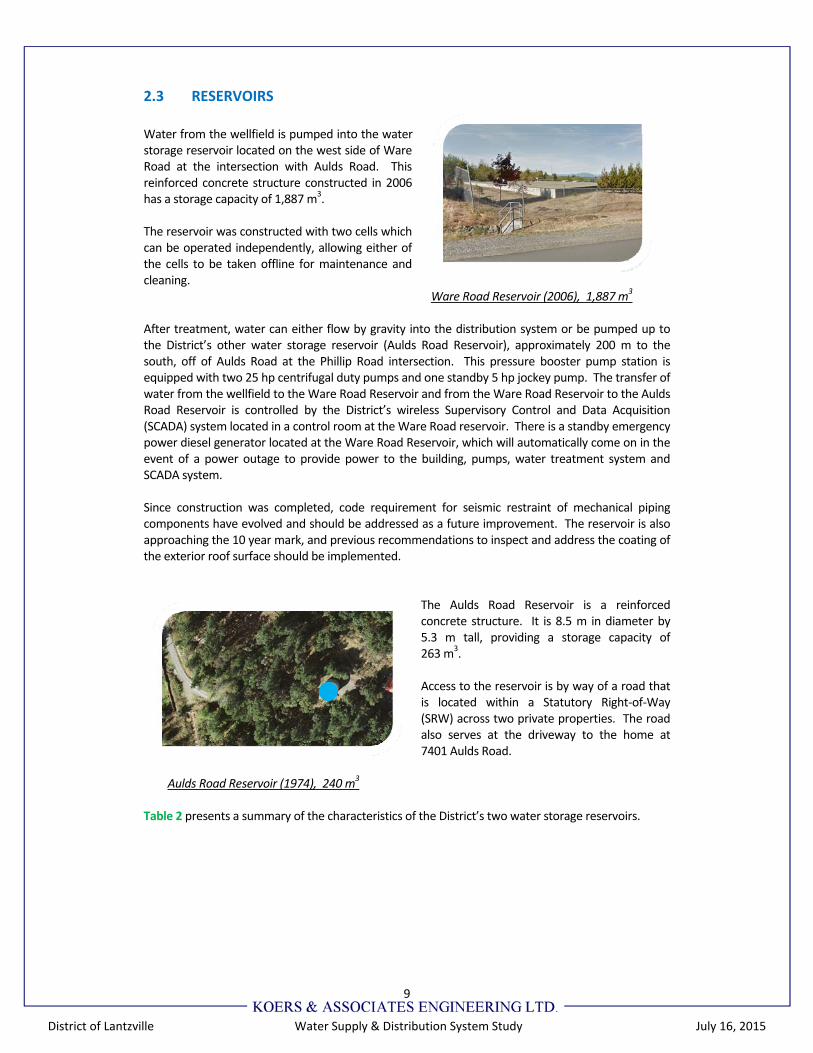
2.3 RESERVOIRS
Water from the wellfield is pumped into the water storage reservoir located on the west side of Ware Road at the intersection with Aulds Road. This reinforced concrete structure constructed in 2006 has a storage capacity of 1,887 m3. The reservoir was constructed with two cells which can be operated independently, allowing either of the cells to be taken offline for maintenance and cleaning. Ware Road Reservoir (2006), 1,887 m3 After treatment, water can either flow by gravity into the distribution system or be pumped up to the District’s other water storage reservoir (Aulds Road Reservoir), approximately 200 m to the south, off of Aulds Road at the Phillip Road intersection. This pressure booster pump station is equipped with two 25 hp centrifugal duty pumps and one standby 5 hp jockey pump. The transfer of water from the wellfield to the Ware Road Reservoir and from the Ware Road Reservoir to the Aulds Road Reservoir is controlled by the District’s wireless Supervisory Control and Data Acquisition (SCADA) system located in a control room at the Ware Road reservoir. There is a standby emergency power diesel generator located at the Ware Road Reservoir, which will automatically come on in the event of a power outage to provide power to the building, pumps, water treatment system and SCADA system. Since construction was completed, code requirement for seismic restraint of mechanical piping components have evolved and should be addressed as a future improvement. The reservoir is also approaching the 10 year mark, and previous recommendations to inspect and address the coating of the exterior roof surface should be implemented.
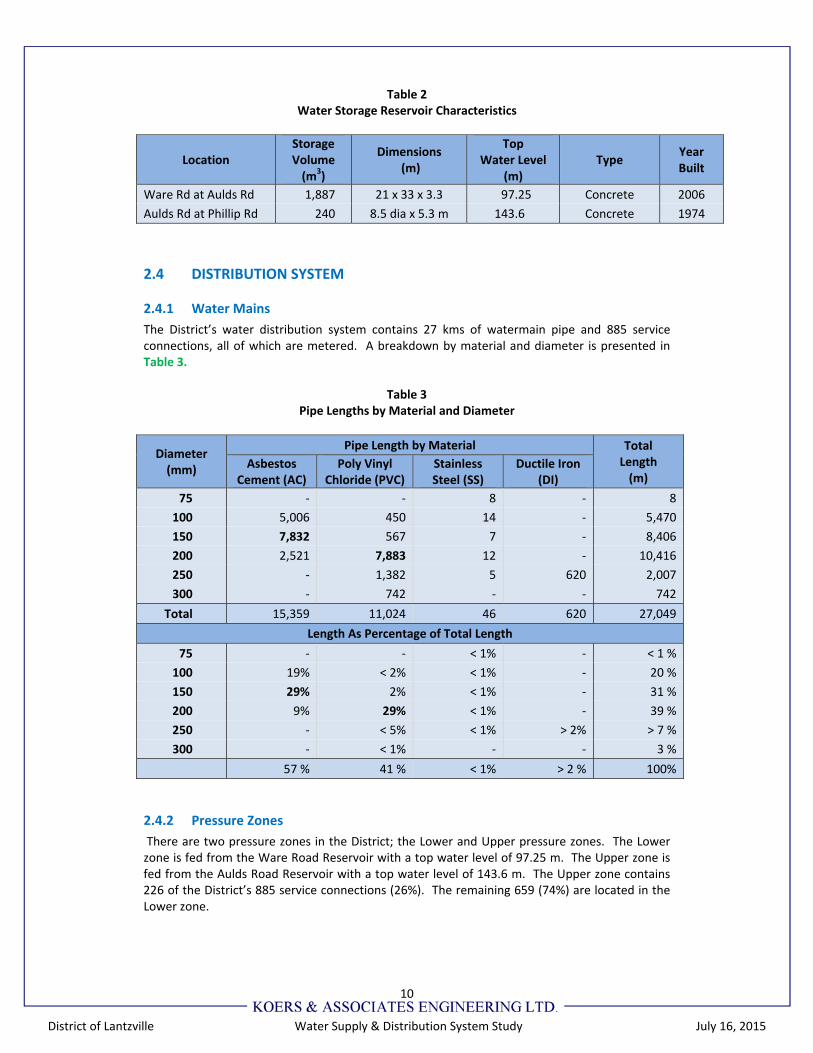
The Aulds Road Reservoir is a reinforced concrete structure. It is 8.5 m in diameter by 5.3 m tall, providing a storage capacity of 263 m3. Access to the reservoir is by way of a road that is located within a Statutory Right‐of‐Way (SRW) across two private properties. The road also serves at the driveway to the home at 7401 Aulds Road.
Aulds Road Reservoir (1974), 240 m3 Table 2 presents a summary of the characteristics of the District’s two water storage reservoirs.
10
District of Lantzville Water Supply & Distribution System Study July 16, 2015
Table 2 Water Storage Reservoir Characteristics
Location Storage Volume (m3)
Dimensions (m)
TopWater Level
(m) Type
Year Built
Ware Rd at Aulds Rd 1,887 21 x 33 x 3.3 97.25 Concrete 2006
Aulds Rd at Phillip Rd 240 8.5 dia x 5.3 m 143.6 Concrete 1974
2.4 DISTRIBUTION SYSTEM
2.4.1 Water Mains
The District’s water distribution system contains 27 kms of watermain pipe and 885 service connections, all of which are metered. A breakdown by material and diameter is presented in Table 3.
Table 3 Pipe Lengths by Material and Diameter
Diameter (mm)
Pipe Length by Material Total Length (m)
Asbestos Cement (AC)
Poly Vinyl Chloride (PVC)
Stainless Steel (SS)
Ductile Iron (DI)
75 ‐ ‐ 8 ‐ 8
100 5,006 450 14 ‐ 5,470
150 7,832 567 7 ‐ 8,406
200 2,521 7,883 12 ‐ 10,416
250 ‐ 1,382 5 620 2,007
300 ‐ 742 ‐ ‐ 742
Total 15,359 11,024 46 620 27,049
Length As Percentage of Total Length
75 ‐ ‐ < 1% ‐ < 1 %
100 19% < 2% < 1% ‐ 20 %
150 29% 2% < 1% ‐ 31 %
200 9% 29% < 1% ‐ 39 %
250 ‐ < 5% < 1% > 2% > 7 %
300 ‐ < 1% ‐ ‐ 3 %
57 % 41 % < 1% > 2 % 100%
2.4.2 Pressure Zones
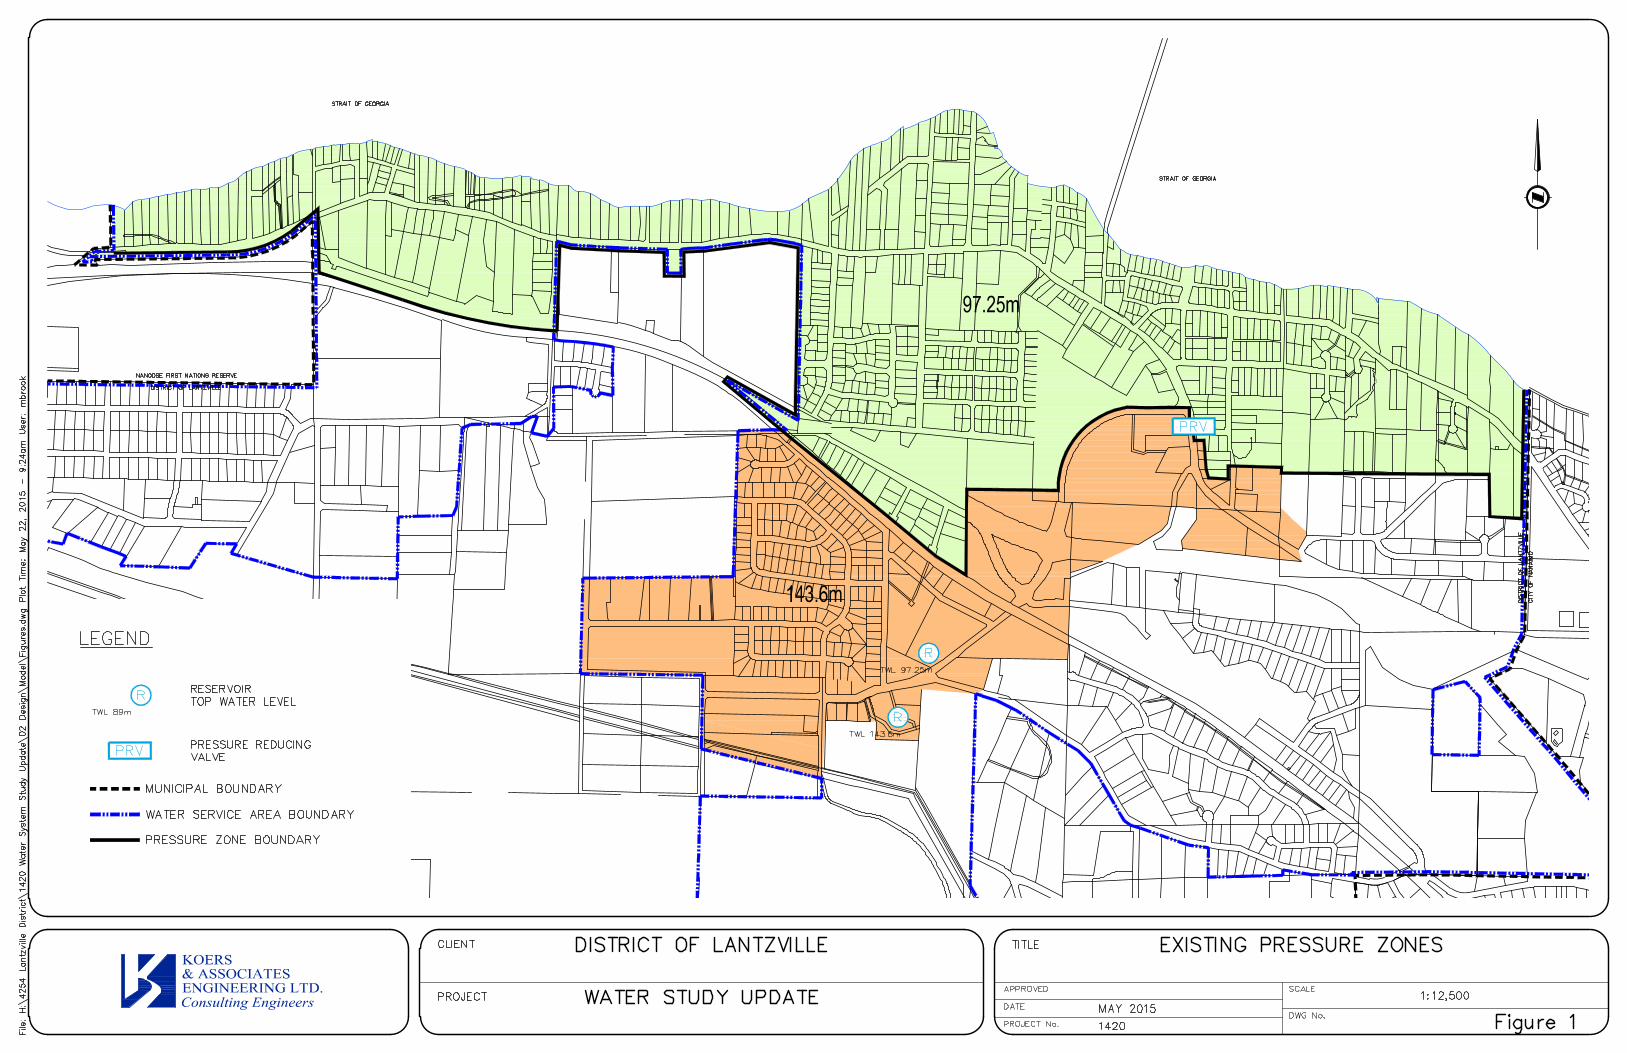
There are two pressure zones in the District; the Lower and Upper pressure zones. The Lower zone is fed from the Ware Road Reservoir with a top water level of 97.25 m. The Upper zone is fed from the Aulds Road Reservoir with a top water level of 143.6 m. The Upper zone contains 226 of the District’s 885 service connections (26%). The remaining 659 (74%) are located in the Lower zone.
11
District of Lantzville Water Supply & Distribution System Study July 16, 2015
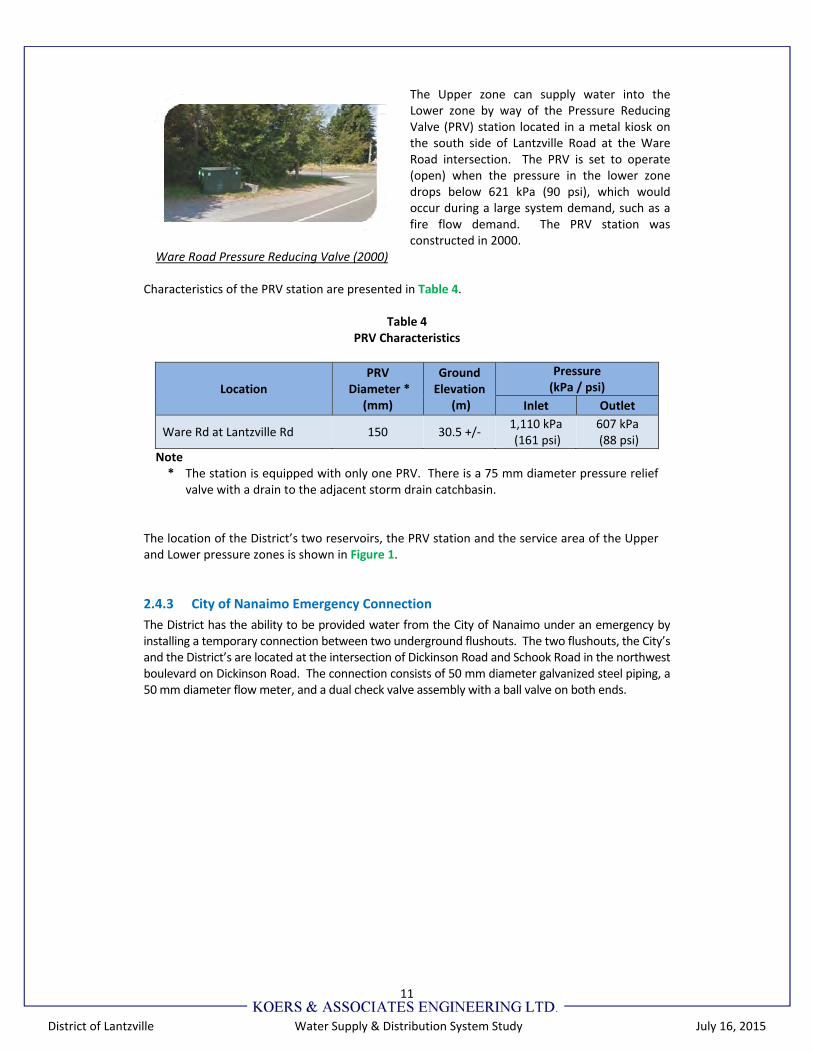
The Upper zone can supply water into the Lower zone by way of the Pressure Reducing Valve (PRV) station located in a metal kiosk on the south side of Lantzville Road at the Ware Road intersection. The PRV is set to operate (open) when the pressure in the lower zone drops below 621 kPa (90 psi), which would occur during a large system demand, such as a fire flow demand. The PRV station was constructed in 2000.
Ware Road Pressure Reducing Valve (2000) Characteristics of the PRV station are presented in Table 4.
Table 4 PRV Characteristics
Location PRV
Diameter * (mm)
Ground Elevation
(m)
Pressure (kPa / psi)
Inlet Outlet
Ware Rd at Lantzville Rd 150 30.5 +/‐ 1,110 kPa (161 psi)
607 kPa (88 psi)
Note * The station is equipped with only one PRV. There is a 75 mm diameter pressure relief
valve with a drain to the adjacent storm drain catchbasin.
The location of the District’s two reservoirs, the PRV station and the service area of the Upper and Lower pressure zones is shown in Figure 1.
2.4.3 City of Nanaimo Emergency Connection
The District has the ability to be provided water from the City of Nanaimo under an emergency by installing a temporary connection between two underground flushouts. The two flushouts, the City’s and the District’s are located at the intersection of Dickinson Road and Schook Road in the northwest boulevard on Dickinson Road. The connection consists of 50 mm diameter galvanized steel piping, a 50 mm diameter flow meter, and a dual check valve assembly with a ball valve on both ends.
12
District of Lantzville Water Supply & Distribution System Study July 16, 2015
3 WELLFIELD CAPACITY
The study of the capacity of the wellfield vs the pumping capabilities of the existing wells was recently undertaken for the DoL and the findings presented in the following two reports:
District of Lantzville, Phase 1 of Stage 1 Wellfield Management Plan – Wellfield Capacity, Existing and Ultimate, Harby Road Wellfield, Oct 15, 2014 by Lowen Hydrogeology Consulting Ltd.
District of Lantzville, Harby Road Wellfield – Estimation of Well Efficiencies, March 31, 2015 by Lowen Hydrogeology Consulting Ltd.
A summary of the findings of each is presented below and a copy of each report is located in Appendix B and Appendix C; respectively.
3.1 AQUIFER
3.1.1 Water Bearing Layer(s) Soils
The District’s four groundwater wells extract water from a sand and gravel aquifer located along Harby Road East. The aquifer is labelled #215 by the Ministry of Environment. The most productive water bearing layer consists of brown or white sand and gravels known as Quadra Sand. The Quadra Sand layer has a reported thickness of 2 m to 10 m; increasing from south to north and from west to east within the DoL wellfield. The well logs indicate it is covered by 5 m to 14 m of either: glacial till; till; sand and gravel; silty gravelly till; sand with till stringers; till with cobbles, sand and gravel, which in turn is covered by 0.3 m to 0.6 m of topsoil. The aquifer’s water table slopes northward towards the ocean. The groundwater level fluctuates throughout the year. Review of water levels revealed up to 3 m of change from the wet winter to dry summer months.
3.1.2 Recharge
For recharging, the aquifer is dependent on precipitation (snow and rainfall) in upland area that infiltrates into the ground and may also be recharged in part by groundwater flowing through the underlying bedrock. The LHC report noted that changes in the upstream land use within the aquifer recharge area could impact the recharge capability of the aquifer.
3.2 WELLFIELD PUMPING CAPACITY
Presently, there are ten drilled wells in and around the DoL wellfield. Seven (3, 4, 5, 6, 8, 9, 12) are located on lands owned by the DoL, including the four active wells (4, 6, 9, 12). Of the remaining three wells (7, 11, 14), two (11, 14) are located on land owned by the Ministry of Transportation and Infrastructure and the remainder (7) is located on private property. Well 11, is the Ministry of Environment monitoring well #232. The approximate location of the wells is shown in Appendix B, Figure 1A – Well field Location Plan. Both well 9 and 12 terminate in bedrock. A schematic cross section of each well is presented in Appendix B, Figure D1 – Well Construction Logs and is followed by a summary of the well log record for each.
13
District of Lantzville Water Supply & Distribution System Study July 16, 2015
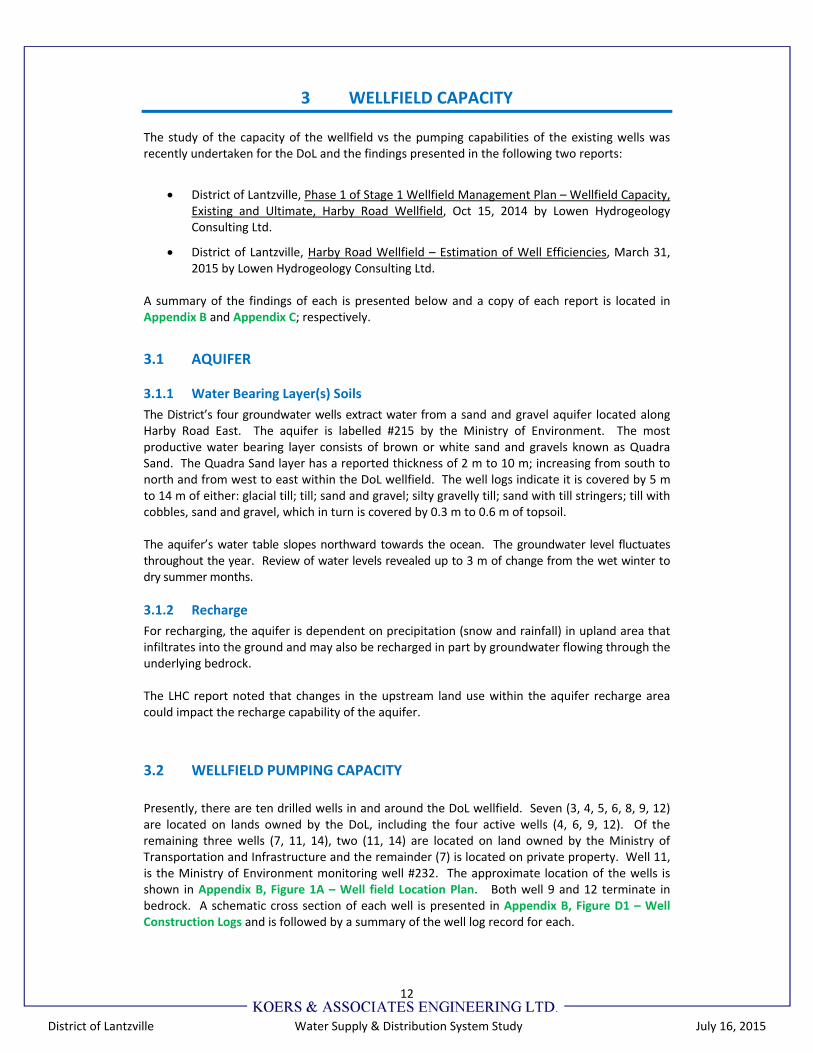
Pumping tests were carried out in July/August 2014 and again in February 2015. A brief overview and the findings of each pumping test are presented below. July/Aug 2014 Pumping Tests The July/Aug 2014 pumping tests served as a means to determine the sustainable yield of the wellfield (determine the safe pumping capacity of the wellfield) and to determine the interference of the operation of each well on the others. The wells were each operated individually and the drawdown of the water level on the other wells was recorded. All four wells were also operated simultaneously as part of the aquifer rating process. It was concluded that while the drilling of additional well(s) was not advisable as a means to increase the overall yield from the aquifer, the existing wells and pumps were not maximizing the wellfield production. The analysis indicated the sustainable yield of the wellfield with all pumps operating simultaneously was 2,424 m3/day compared to the current maximum simultaneous pumping capability of 2,027 m3/day. This is a potential increase of 20% (397 m3/day) from the current pumping capacity. February 2015 Pumping Tests The February 2015 pumping tests were carried out to assess the performance and efficiency of each well. The results were compared against data collected during past studies. The test results showed that yield of wells 4, 9 and 12 can be increased by re‐development work. It is proposed that well 6 be replaced with a new well because it is operating inefficiently and historical records indicate the rate of pumping has been reduced to stop sand from being pumped out with the water. The existing and ultimate pumping capacity of each well is presented in Table 5 below.
Table 5 Well Pump Characteristics and Yield
Well No.
Date Drilled
Well Dia‐ meter
Water Level Depth
Well Depth
Well Pump
Well Motor EstimatedCurrent Capacity
Estimated Safe Pumping Yield**
Individual Simultaneous
(mm) (m) (m) (type) (Hp/Phase/Volts) (m3/day) (m3/day) (m3/day) % of Total
4 Aug 1979 200 1.1 21 Berkley 20 / 3 / 230 728 1,019 901 37 %
6 April 1983 200 ‐ 0.5 * 16 Goulds 10 / 3 / 230 543 836 668 27 %
9 Oct 1986 200 3.3 24 Grundfos 5 / 3 / 230 190 352 281 12 %
12 Oct 1990 200 0.5 21 Grundfos 10 / 3 / 230 566 718 574 24 %
Wellfield Maximum Yield: 2,027 ‐ 2,424 100 %
2014 Maximum Day Demand: 1,421 1,421 59 %
Difference: 606 1,003 41 %
(7 L/s) (12 L/s)
Note: * Indicates well no. 6 is an artesian well with a static water level of 0.5 m above ground.
** Estimates of the safe well yield are based on information presented in the LHC reports referenced above.
3.2 WATER SUSTAINABILITY ACT
The Water Sustainability Act was given Royal Assent on May 29, 2014 and will replace the current Water Act which is over 100 years old. The Water Sustainability Act will manage surface and groundwater as one resource. The current Water Act remains in effect until the Water

14
District of Lantzville Water Supply & Distribution System Study July 16, 2015
Sustainability Act is brought into effect in 2016. Because of the complexity of the new Act and the number of proposed regulations associated with it, it is being implemented in phases starting with water use authorization; water fees and rentals; and regulations needed to authorize and manage groundwater use. The regulation of groundwater will result in groundwater users having the same rights and responsibilities, including priority rights. In return, the user will be required to obtain a water license which will require payment of an application fee and an annual water rental fee. The application and rental fees vary depending on how the water is being used and who the user (consumer) is. Domestic properties that use groundwater for household needs will be exempt from licensing and fees. Municipalities, like the DoL, will be required to obtain a license and pay the fees. A review of the application and annual water rental fees rates for 2016 indicate the estimated costs for the DoL for registration of their wells could consist of:
One Time Application Fee: $5,000 (for 100,000 m3/yr to < 5,000,000 m3/yr)
Annual Rental Fee: $565 ($2.25 per 1,000 m3) A copy of the Water Sustainability Act and Table of Fees can be found on the BC government web site.
15
District of Lantzville Water Supply & Distribution System Study July 16, 2015
4 POPULATION
4.1 HISTORIC POPULATION
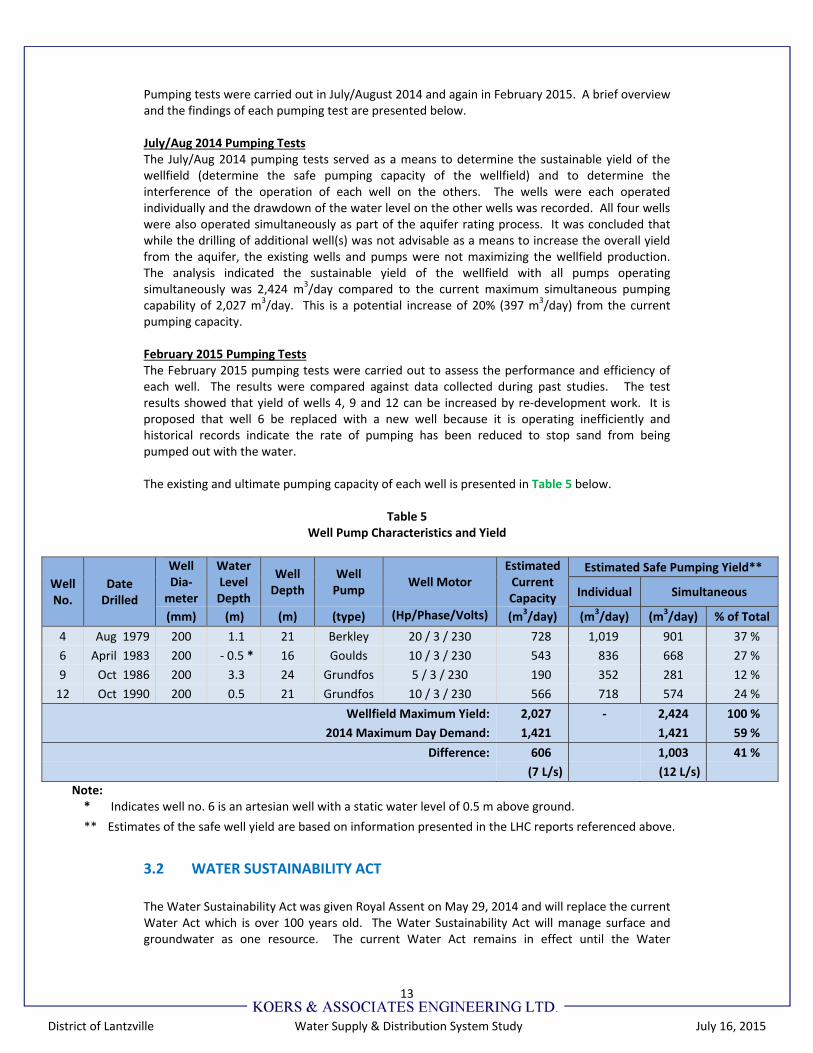
Since its formation as a District municipality in 2003, the District’s population has remained almost unchanged. Table 6 presents the District’s annual population estimates from 2003 to present as published by BCStats along with the population per dwelling unit as calculated during the last three federal censuses.
Table 6 Population Estimates, 2003 – 2014
Year Population Estimate (BCStats)
Population per Dwelling Unit
(Canada Census)
2001 ‐ 2.73
2002 ‐ ‐
2003 3,486 ‐
2004 3,687 ‐
2005 3,720 ‐
2006 3,685 2.58
2007 3,721 ‐
2008 3,745 ‐
2009 3,700 ‐
2010 3,687 ‐
2011 3,643 2.46
2012 3,659 ‐
2013 3,505 ‐
2014 3,496 ‐
The resulting stagnation of growth (0%) over the past 11 year is believed to be partly in response to the District’s policies and bylaws relating to the capacity concerns of the District’s groundwater supply as well as the limited service area of the municipal sanitary sewer collection system. As a comparison, the adjacent communities of City Nanaimo to the south and the City of Parksville to the north, both with community water and sanitary sewer collection systems that have capacity to accommodate growth have experienced significant growth. Nanaimo’s population grew by 11,870 (15%) while Parksville’s grew by 1,748 (17%) since 2003. The decline in population per dwelling unit is reflective of components such as: some new home construction; an aging population whereby children are growing up and moving out of the area; and fewer children being born per family. The decline in density is not unusual as it is also occurring in other Vancouver Island municipalities. The District’s 2011 population density of 2.46 capita/dwelling is higher its two neighbouring municipalities of the City of Nanaimo at 2.31 capita/dwelling and the City of Parksville at 2.11 capita/dwelling. With the ongoing aging of the Vancouver Island population being projected by BCStats, it can be expected that this will also apply to the DoL and result in a lowering of the population density per dwelling unit.
16
District of Lantzville Water Supply & Distribution System Study July 16, 2015
4.2 FUTURE POPULATION
While the OCP allows for growth, when growth will occur is unclear as it is subject to a number of variables beyond the District’s control, including market and developer influenced criteria. It is understood that the three largest local inhibitors are:
1) Limited extent of the municipal sewage collection system,
2) Limited capacity of the water supply source (the wellfield), and
3) Limited extent of the municipal water distribution system. Approximately 35% of the more than 1,330 homes do not have access to the municipal water system and rely on individual wells.
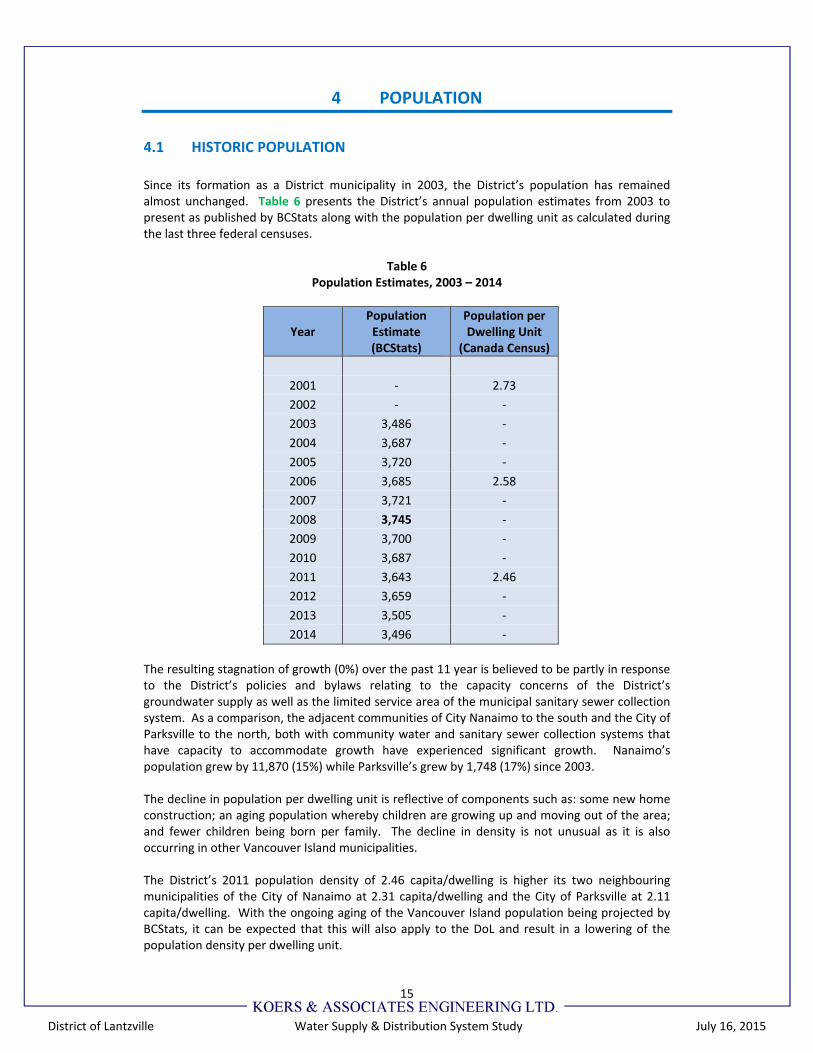
The District has taken steps towards addressing the water source issue with the signing of a water supply agreement with the City of Nanaimo dated September 8, 2014. A copy the agreement is located in Appendix A. The District’s OCP does not provide an estimate of the future population based on the projected land‐uses nor at what time in the future when the full land‐use potential may be realized. As there are many factors effecting population growth, three growth scenarios have been developed for this report: low; moderate; and high based on a review of historical growth rates in neighbouring municipalities and growth projection data by StatsBC. A time period of 50 years was applied to aide in assessing the ability of the District’s current water source to accommodate varying levels of long term growth. Table 7 presents the population projections in five year increments to Year 2065 for each growth rate. Figure 2 presents the District’s historic population from 2001 to 2014 as published by Stats BC and Census Canada along with the three population growth projection scenarios to year 2065.
Table 7 Population Projections to Year 2065 (50 years)
Year
Total Population
LowGrowth 0.5%
ModerateGrowth 1%
HighGrowth 1.5%
2014 3,496 3,496 3,496
2015 3,496 3,496 3,496
2020 3,584 3,674 3,766
2025 3,675 3,862 4,057
2030 3,768 4,059 4,371
2035 3,863 4,266 4,709
2040 3,960 4,483 5,073
2045 4,060 4,712 5,465
2050 4,163 4,952 5,887
2055 4,268 5,205 6,342
2060 4,376 5,471 6,832
2065 4,486 5,750 7,360
50 Yr Increase 990 2,254 3,864
(%) 28% 65% 110%
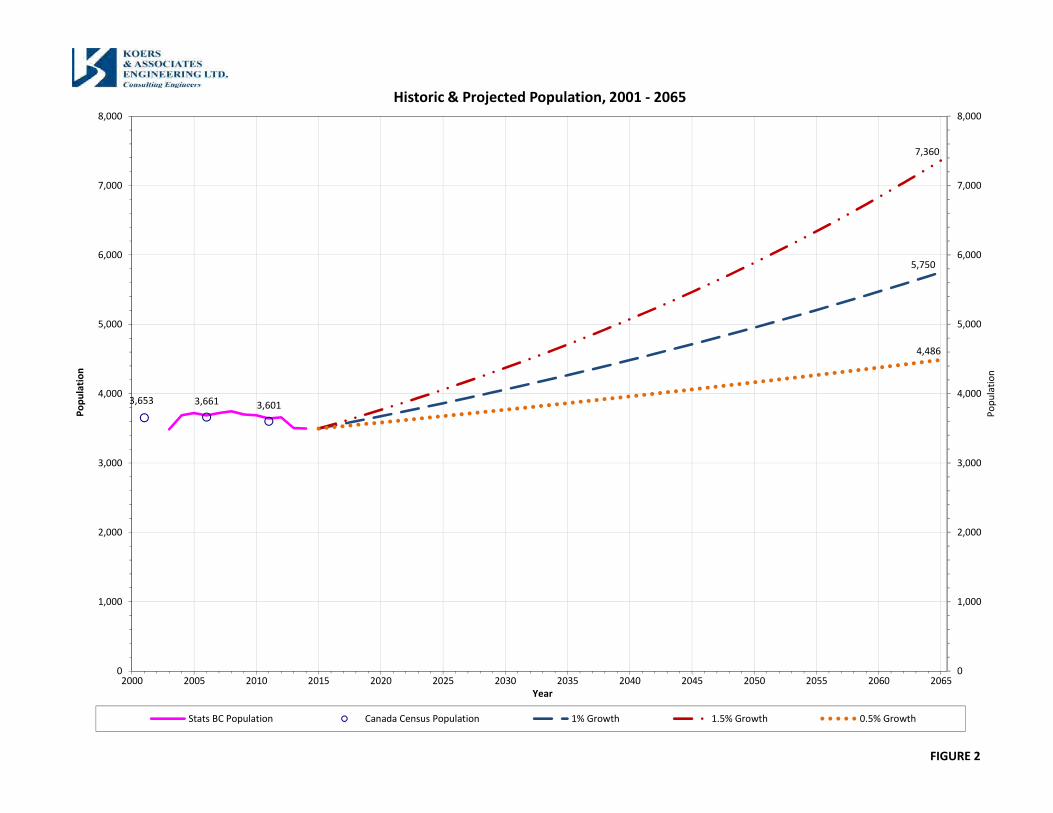
FIGURE 2
3,653 3,661 3,601
5,750
7,360
4,486
0
1,000
2,000
3,000
4,000
5,000
6,000
7,000
8,000
0
1,000
2,000
3,000
4,000
5,000
6,000
7,000
8,000
2000 2005 2010 2015 2020 2025 2030 2035 2040 2045 2050 2055 2060 2065
Population
Population
Year
Historic & Projected Population, 2001 ‐ 2065
Stats BC Population Canada Census Population 1% Growth 1.5% Growth 0.5% Growth
17
District of Lantzville Water Supply & Distribution System Study July 16, 2015
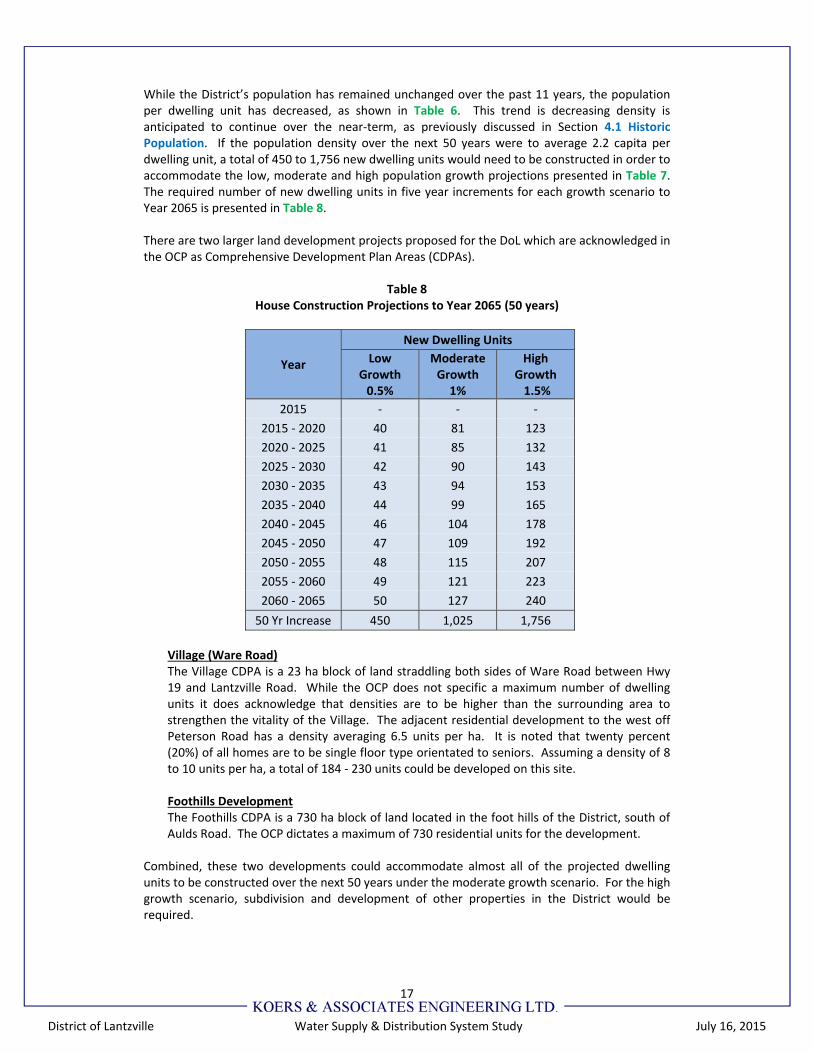
While the District’s population has remained unchanged over the past 11 years, the population per dwelling unit has decreased, as shown in Table 6. This trend is decreasing density is anticipated to continue over the near‐term, as previously discussed in Section 4.1 Historic Population. If the population density over the next 50 years were to average 2.2 capita per dwelling unit, a total of 450 to 1,756 new dwelling units would need to be constructed in order to accommodate the low, moderate and high population growth projections presented in Table 7. The required number of new dwelling units in five year increments for each growth scenario to Year 2065 is presented in Table 8. There are two larger land development projects proposed for the DoL which are acknowledged in the OCP as Comprehensive Development Plan Areas (CDPAs).
Table 8 House Construction Projections to Year 2065 (50 years)
Year
New Dwelling Units
Low Growth 0.5%
Moderate Growth 1%
High Growth 1.5%
2015 ‐ ‐ ‐
2015 ‐ 2020 40 81 123
2020 ‐ 2025 41 85 132
2025 ‐ 2030 42 90 143
2030 ‐ 2035 43 94 153
2035 ‐ 2040 44 99 165
2040 ‐ 2045 46 104 178
2045 ‐ 2050 47 109 192
2050 ‐ 2055 48 115 207
2055 ‐ 2060 49 121 223
2060 ‐ 2065 50 127 240
50 Yr Increase 450 1,025 1,756
Village (Ware Road) The Village CDPA is a 23 ha block of land straddling both sides of Ware Road between Hwy 19 and Lantzville Road. While the OCP does not specific a maximum number of dwelling units it does acknowledge that densities are to be higher than the surrounding area to strengthen the vitality of the Village. The adjacent residential development to the west off Peterson Road has a density averaging 6.5 units per ha. It is noted that twenty percent (20%) of all homes are to be single floor type orientated to seniors. Assuming a density of 8 to 10 units per ha, a total of 184 ‐ 230 units could be developed on this site. Foothills Development The Foothills CDPA is a 730 ha block of land located in the foot hills of the District, south of Aulds Road. The OCP dictates a maximum of 730 residential units for the development.
Combined, these two developments could accommodate almost all of the projected dwelling units to be constructed over the next 50 years under the moderate growth scenario. For the high growth scenario, subdivision and development of other properties in the District would be required.
18
District of Lantzville Water Supply & Distribution System Study July 16, 2015
5 WATER DEMAND
5.1 CURRENT DEMANDS
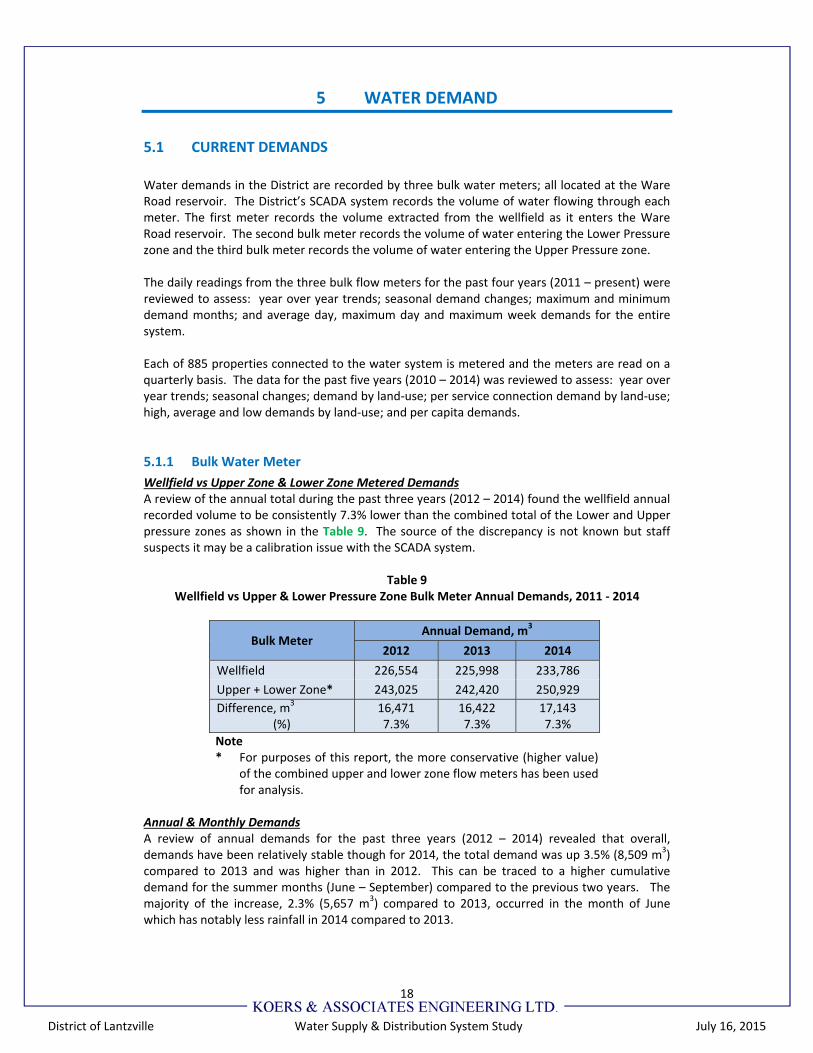
Water demands in the District are recorded by three bulk water meters; all located at the Ware Road reservoir. The District’s SCADA system records the volume of water flowing through each meter. The first meter records the volume extracted from the wellfield as it enters the Ware Road reservoir. The second bulk meter records the volume of water entering the Lower Pressure zone and the third bulk meter records the volume of water entering the Upper Pressure zone. The daily readings from the three bulk flow meters for the past four years (2011 – present) were reviewed to assess: year over year trends; seasonal demand changes; maximum and minimum demand months; and average day, maximum day and maximum week demands for the entire system. Each of 885 properties connected to the water system is metered and the meters are read on a quarterly basis. The data for the past five years (2010 – 2014) was reviewed to assess: year over year trends; seasonal changes; demand by land‐use; per service connection demand by land‐use; high, average and low demands by land‐use; and per capita demands.
5.1.1 Bulk Water Meter
Wellfield vs Upper Zone & Lower Zone Metered Demands A review of the annual total during the past three years (2012 – 2014) found the wellfield annual recorded volume to be consistently 7.3% lower than the combined total of the Lower and Upper pressure zones as shown in the Table 9. The source of the discrepancy is not known but staff suspects it may be a calibration issue with the SCADA system.
Table 9 Wellfield vs Upper & Lower Pressure Zone Bulk Meter Annual Demands, 2011 ‐ 2014
Bulk Meter Annual Demand, m3
2012 2013 2014
Wellfield 226,554 225,998 233,786
Upper + Lower Zone* 243,025 242,420 250,929
Difference, m3
(%) 16,4717.3%
16,4227.3%
17,143 7.3%
Note * For purposes of this report, the more conservative (higher value)
of the combined upper and lower zone flow meters has been used for analysis.
Annual & Monthly Demands A review of annual demands for the past three years (2012 – 2014) revealed that overall, demands have been relatively stable though for 2014, the total demand was up 3.5% (8,509 m3) compared to 2013 and was higher than in 2012. This can be traced to a higher cumulative demand for the summer months (June – September) compared to the previous two years. The majority of the increase, 2.3% (5,657 m3) compared to 2013, occurred in the month of June which has notably less rainfall in 2014 compared to 2013.
19
District of Lantzville Water Supply & Distribution System Study July 16, 2015
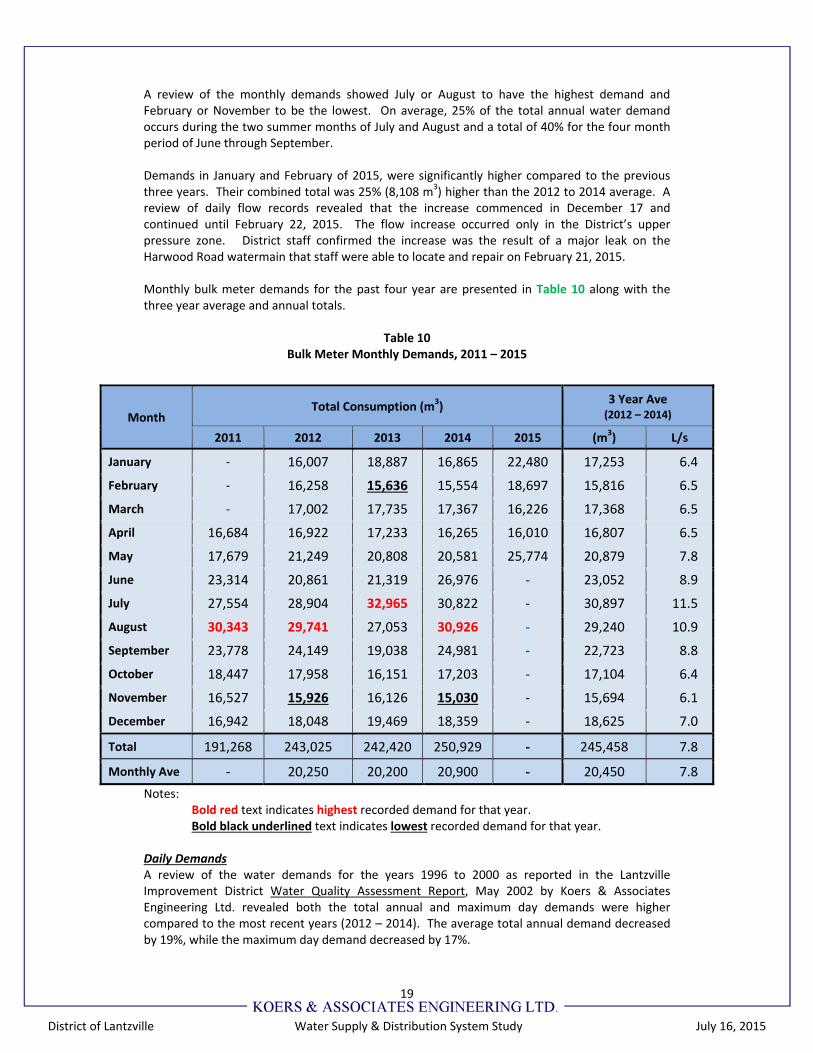
A review of the monthly demands showed July or August to have the highest demand and February or November to be the lowest. On average, 25% of the total annual water demand occurs during the two summer months of July and August and a total of 40% for the four month period of June through September. Demands in January and February of 2015, were significantly higher compared to the previous three years. Their combined total was 25% (8,108 m3) higher than the 2012 to 2014 average. A review of daily flow records revealed that the increase commenced in December 17 and continued until February 22, 2015. The flow increase occurred only in the District’s upper pressure zone. District staff confirmed the increase was the result of a major leak on the Harwood Road watermain that staff were able to locate and repair on February 21, 2015. Monthly bulk meter demands for the past four year are presented in Table 10 along with the three year average and annual totals.
Table 10 Bulk Meter Monthly Demands, 2011 – 2015
Notes: Bold red text indicates highest recorded demand for that year.
Bold black underlined text indicates lowest recorded demand for that year.
Daily Demands A review of the water demands for the years 1996 to 2000 as reported in the Lantzville Improvement District Water Quality Assessment Report, May 2002 by Koers & Associates Engineering Ltd. revealed both the total annual and maximum day demands were higher compared to the most recent years (2012 – 2014). The average total annual demand decreased by 19%, while the maximum day demand decreased by 17%.
Month Total Consumption (m3)
3 Year Ave (2012 – 2014)
2011 2012 2013 2014 2015 (m3) L/s
January ‐ 16,007 18,887 16,865 22,480 17,253 6.4
February ‐ 16,258 15,636 15,554 18,697 15,816 6.5
March ‐ 17,002 17,735 17,367 16,226 17,368 6.5
April 16,684 16,922 17,233 16,265 16,010 16,807 6.5
May 17,679 21,249 20,808 20,581 25,774 20,879 7.8
June 23,314 20,861 21,319 26,976 ‐ 23,052 8.9
July 27,554 28,904 32,965 30,822 ‐ 30,897 11.5
August 30,343 29,741 27,053 30,926 ‐ 29,240 10.9
September 23,778 24,149 19,038 24,981 ‐ 22,723 8.8
October 18,447 17,958 16,151 17,203 ‐ 17,104 6.4
November 16,527 15,926 16,126 15,030 ‐ 15,694 6.1
December 16,942 18,048 19,469 18,359 ‐ 18,625 7.0
Total 191,268 243,025 242,420 250,929 ‐ 245,458 7.8
Monthly Ave ‐ 20,250 20,200 20,900 ‐ 20,450 7.8
20
District of Lantzville Water Supply & Distribution System Study July 16, 2015
Koers has observed a downward trend in water use in other mid Vancouver Island municipalities over the past 5 to 8 years. The downward trend in these municipalities is believed to be in response to several factors, including:
public education on the need for water conservation via local programs;
indirectly through provincial, national and international news/events;
local water conservation programs; manufacture of lower water use appliances and fixtures; and
expansion of local water metering programs.
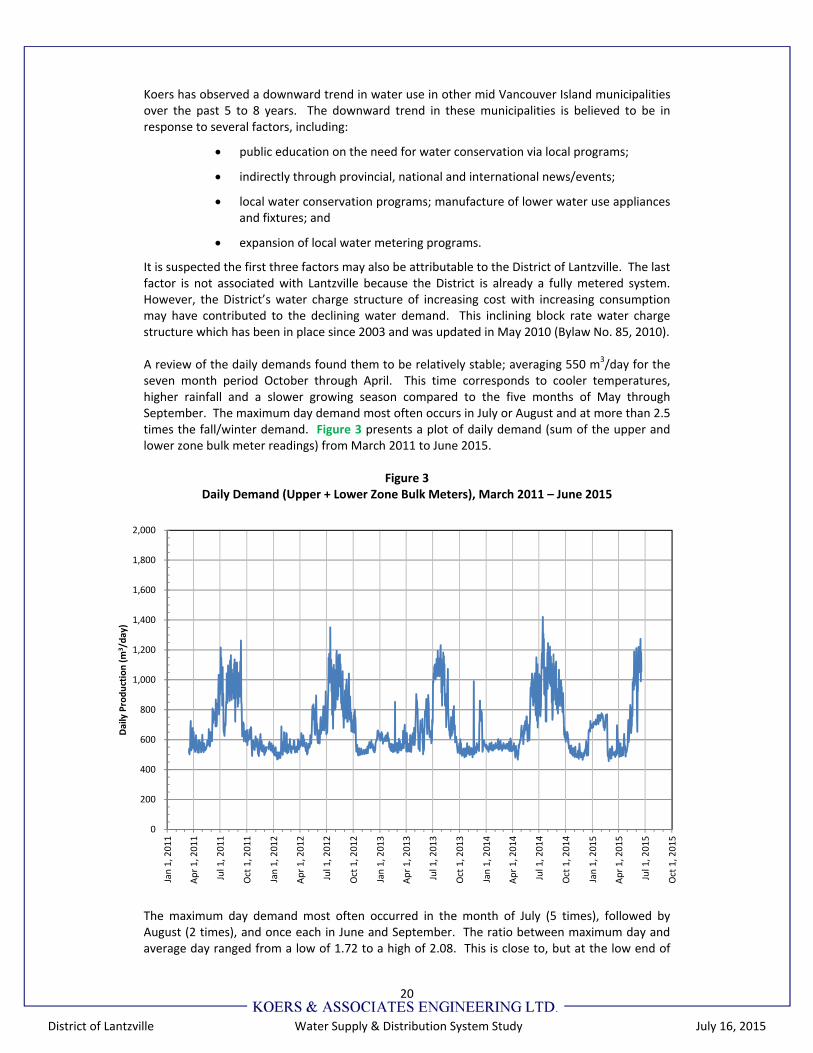
It is suspected the first three factors may also be attributable to the District of Lantzville. The last factor is not associated with Lantzville because the District is already a fully metered system. However, the District’s water charge structure of increasing cost with increasing consumption may have contributed to the declining water demand. This inclining block rate water charge structure which has been in place since 2003 and was updated in May 2010 (Bylaw No. 85, 2010). A review of the daily demands found them to be relatively stable; averaging 550 m3/day for the seven month period October through April. This time corresponds to cooler temperatures, higher rainfall and a slower growing season compared to the five months of May through September. The maximum day demand most often occurs in July or August and at more than 2.5 times the fall/winter demand. Figure 3 presents a plot of daily demand (sum of the upper and lower zone bulk meter readings) from March 2011 to June 2015.
Figure 3 Daily Demand (Upper + Lower Zone Bulk Meters), March 2011 – June 2015
0
200
400
600
800
1,000
1,200
1,400
1,600
1,800
2,000
Jan 1, 2011
Apr 1, 2011
Jul 1, 2011
Oct 1, 2011
Jan 1, 2012
Apr 1, 2012
Jul 1, 2012
Oct 1, 2012
Jan 1, 2013
Apr 1, 2013
Jul 1, 2013
Oct 1, 2013
Jan 1, 2014
Apr 1, 2014
Jul 1, 2014
Oct 1, 2014
Jan 1, 2015
Apr 1, 2015
Jul 1, 2015
Oct 1, 2015
Daily Production (m
3 /day)
The maximum day demand most often occurred in the month of July (5 times), followed by August (2 times), and once each in June and September. The ratio between maximum day and average day ranged from a low of 1.72 to a high of 2.08. This is close to, but at the low end of
21
District of Lantzville Water Supply & Distribution System Study July 16, 2015
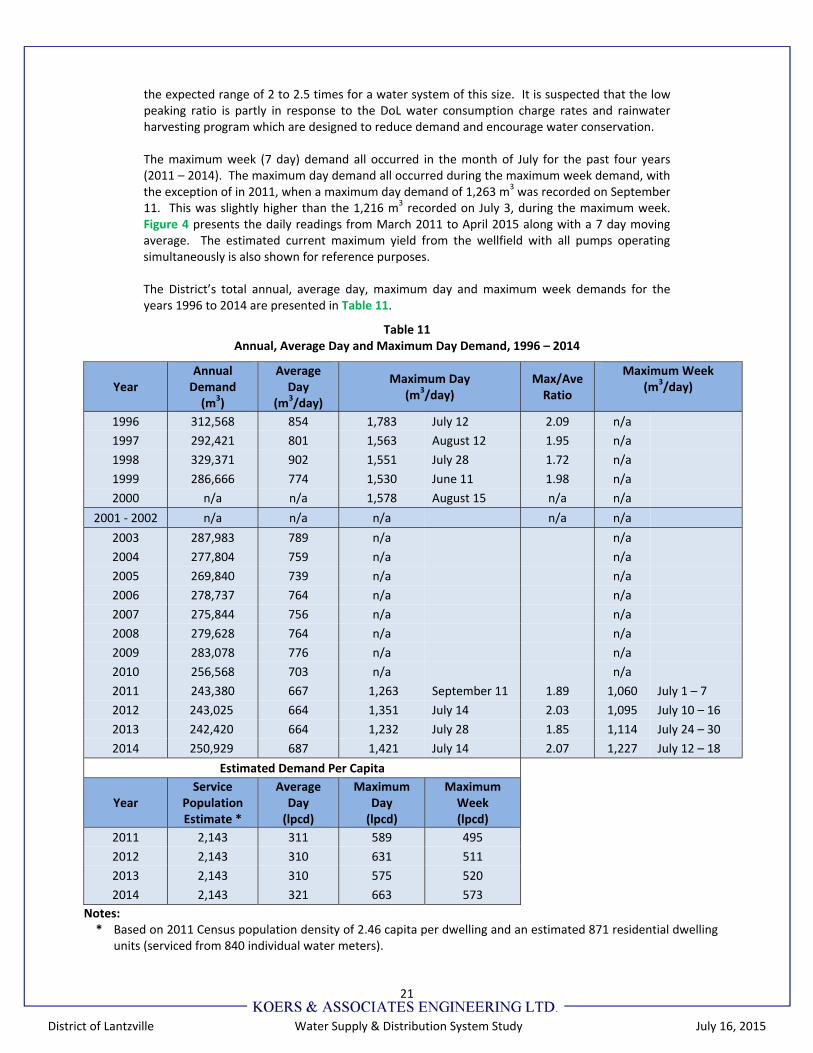
the expected range of 2 to 2.5 times for a water system of this size. It is suspected that the low peaking ratio is partly in response to the DoL water consumption charge rates and rainwater harvesting program which are designed to reduce demand and encourage water conservation. The maximum week (7 day) demand all occurred in the month of July for the past four years (2011 – 2014). The maximum day demand all occurred during the maximum week demand, with the exception of in 2011, when a maximum day demand of 1,263 m3 was recorded on September 11. This was slightly higher than the 1,216 m3 recorded on July 3, during the maximum week. Figure 4 presents the daily readings from March 2011 to April 2015 along with a 7 day moving average. The estimated current maximum yield from the wellfield with all pumps operating simultaneously is also shown for reference purposes. The District’s total annual, average day, maximum day and maximum week demands for the years 1996 to 2014 are presented in Table 11.
Table 11 Annual, Average Day and Maximum Day Demand, 1996 – 2014
Year Annual Demand (m3)
Average Day
(m3/day)
Maximum Day (m3/day)
Max/Ave Ratio
Maximum Week(m3/day)
1996 312,568 854 1,783 July 12 2.09 n/a
1997 292,421 801 1,563 August 12 1.95 n/a
1998 329,371 902 1,551 July 28 1.72 n/a
1999 286,666 774 1,530 June 11 1.98 n/a
2000 n/a n/a 1,578 August 15 n/a n/a
2001 ‐ 2002 n/a n/a n/a n/a n/a
2003 287,983 789 n/a n/a
2004 277,804 759 n/a n/a
2005 269,840 739 n/a n/a
2006 278,737 764 n/a n/a
2007 275,844 756 n/a n/a
2008 279,628 764 n/a n/a
2009 283,078 776 n/a n/a
2010 256,568 703 n/a n/a
2011 243,380 667 1,263 September 11 1.89 1,060 July 1 – 7
2012 243,025 664 1,351 July 14 2.03 1,095 July 10 – 16
2013 242,420 664 1,232 July 28 1.85 1,114 July 24 – 30
2014 250,929 687 1,421 July 14 2.07 1,227 July 12 – 18
Estimated Demand Per Capita
Year Service
Population Estimate *
Average Day (lpcd)
Maximum Day (lpcd)
Maximum Week (lpcd)
2011 2,143 311 589 495
2012 2,143 310 631 511
2013 2,143 310 575 520
2014 2,143 321 663 573
Notes: * Based on 2011 Census population density of 2.46 capita per dwelling and an estimated 871 residential dwelling
units (serviced from 840 individual water meters).
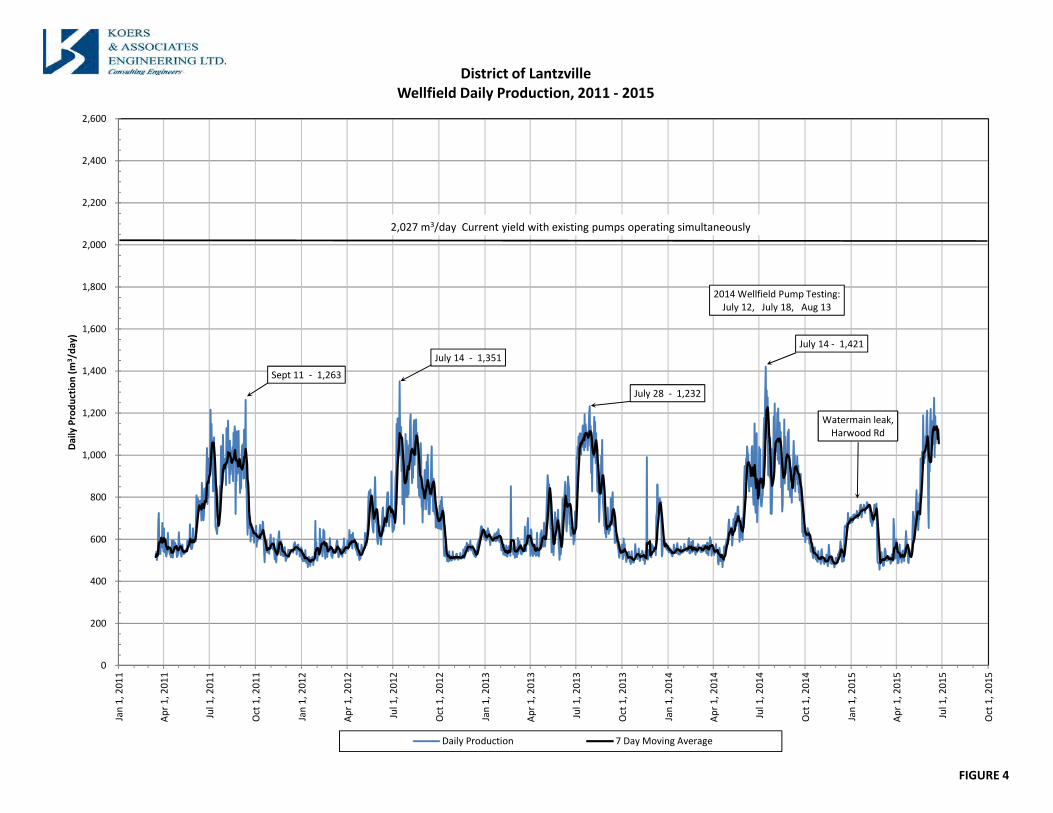
FIGURE 4
Sept 11 ‐ 1,263
July 14 ‐ 1,351
July 28 ‐ 1,232
2014 Wellfield Pump Testing:July 12, July 18, Aug 13
July 14 ‐ 1,421
Watermain leak,Harwood Rd
0
200
400
600
800
1,000
1,200
1,400
1,600
1,800
2,000
2,200
2,400
2,600Jan 1, 2011
Apr 1, 2011
Jul 1, 2011
Oct 1, 2011
Jan 1, 2012
Apr 1, 2012
Jul 1, 2012
Oct 1, 2012
Jan 1, 2013
Apr 1, 2013
Jul 1, 2013
Oct 1, 2013
Jan 1, 2014
Apr 1, 2014
Jul 1, 2014
Oct 1, 2014
Jan 1, 2015
Apr 1, 2015
Jul 1, 2015
Oct 1, 2015
Daily Producti on (m
3 /day)
District of LantzvilleWellfield Daily Production, 2011 ‐ 2015
Daily Production 7 Day Moving Average
2,027 m3/day Current yield with existing pumps operating simultaneously
22
District of Lantzville Water Supply & Distribution System Study July 16, 2015
Figure 5 graphically presents the total annual, average day, maximum day and maximum week demands from 1996 to 2014. The BCStats population estimate is included on Figure 5 for reference purposes.
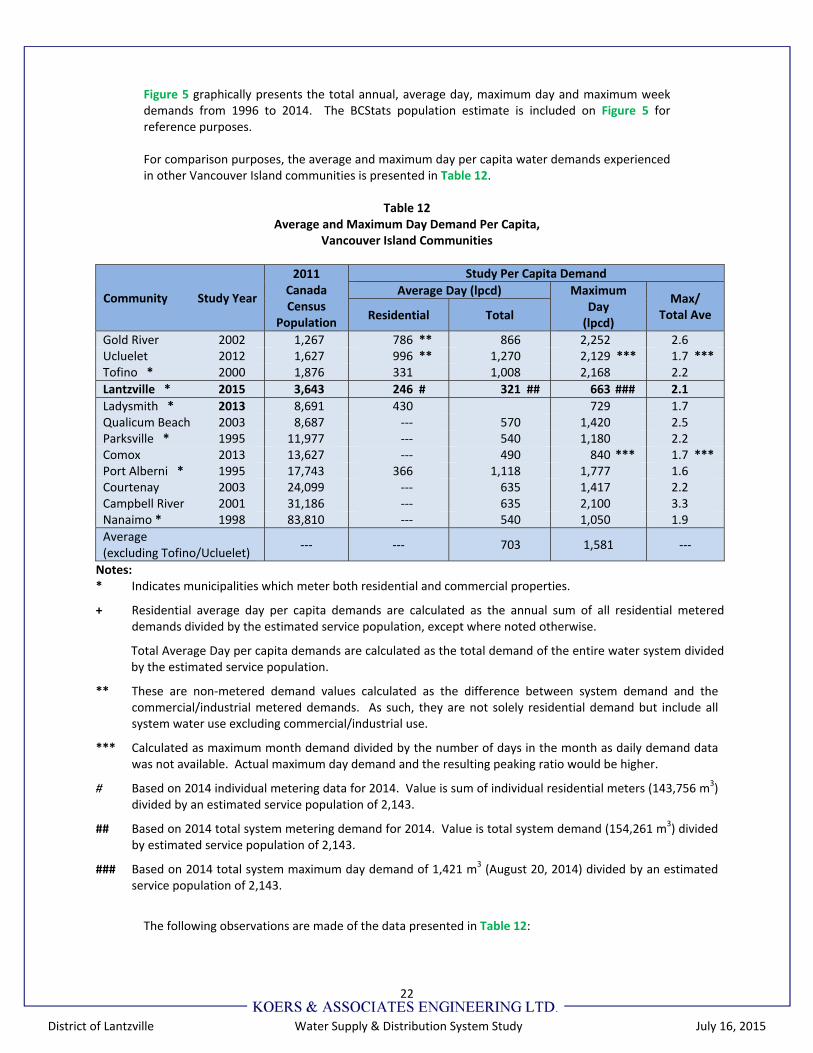
For comparison purposes, the average and maximum day per capita water demands experienced in other Vancouver Island communities is presented in Table 12.
Table 12 Average and Maximum Day Demand Per Capita,
Vancouver Island Communities
Community Study Year
2011 Canada Census
Population
Study Per Capita Demand
Average Day (lpcd) Maximum Day (lpcd)
Max/ Total Ave Residential Total
Gold River 2002 1,267 786 ** 866 2,252 2.6Ucluelet 2012 1,627 996 ** 1,270 2,129 *** 1.7 ***Tofino * 2000 1,876 331 1,008 2,168 2.2
Lantzville * 2015 3,643 246 # 321 ## 663 ### 2.1
Ladysmith * 2013 8,691 430 729 1.7Qualicum Beach 2003 8,687 ‐‐‐ 570 1,420 2.5Parksville * 1995 11,977 ‐‐‐ 540 1,180 2.2Comox 2013 13,627 ‐‐‐ 490 840 *** 1.7 ***Port Alberni * 1995 17,743 366 1,118 1,777 1.6Courtenay 2003 24,099 ‐‐‐ 635 1,417 2.2Campbell River 2001 31,186 ‐‐‐ 635 2,100 3.3Nanaimo * 1998 83,810 ‐‐‐ 540 1,050 1.9
Average (excluding Tofino/Ucluelet)
‐‐‐ ‐‐‐ 703 1,581 ‐‐‐
Notes: * Indicates municipalities which meter both residential and commercial properties.
+ Residential average day per capita demands are calculated as the annual sum of all residential metered demands divided by the estimated service population, except where noted otherwise.
Total Average Day per capita demands are calculated as the total demand of the entire water system divided by the estimated service population.
** These are non‐metered demand values calculated as the difference between system demand and the commercial/industrial metered demands. As such, they are not solely residential demand but include all system water use excluding commercial/industrial use.
*** Calculated as maximum month demand divided by the number of days in the month as daily demand data was not available. Actual maximum day demand and the resulting peaking ratio would be higher.
# Based on 2014 individual metering data for 2014. Value is sum of individual residential meters (143,756 m3) divided by an estimated service population of 2,143.
## Based on 2014 total system metering demand for 2014. Value is total system demand (154,261 m3) divided by estimated service population of 2,143.
### Based on 2014 total system maximum day demand of 1,421 m3 (August 20, 2014) divided by an estimated service population of 2,143.
The following observations are made of the data presented in Table 12:
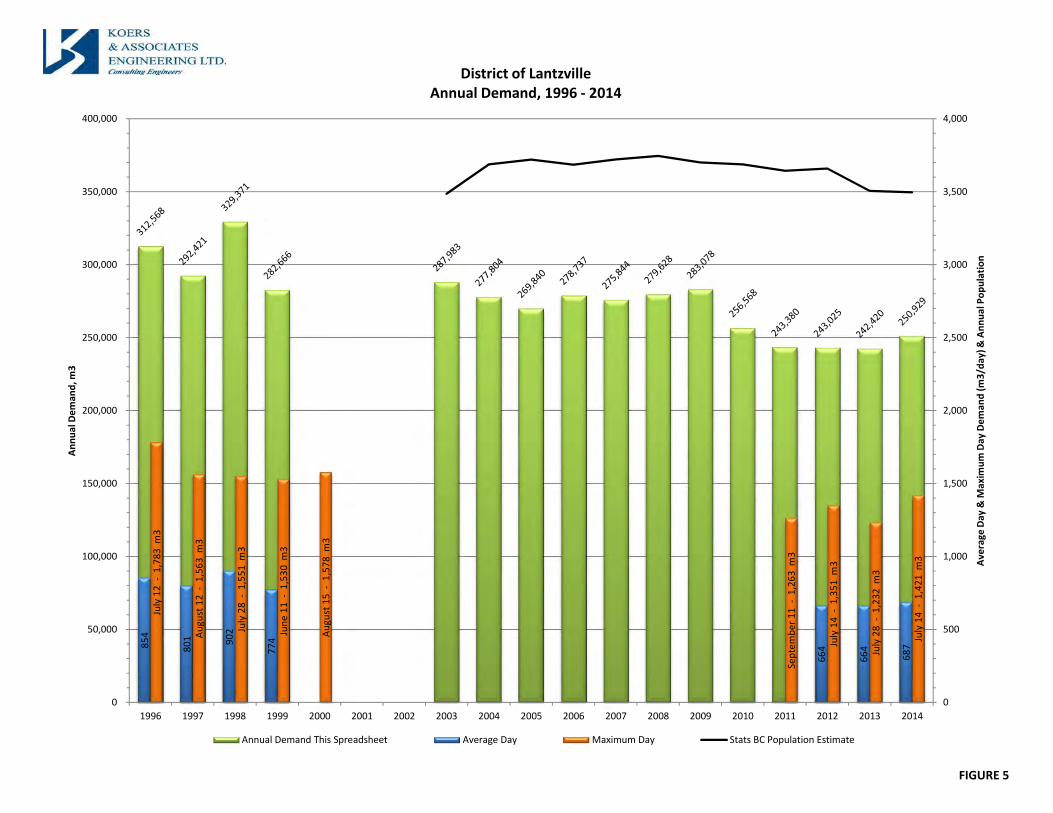
FIGURE 5
854
801
902
774
664
664
687
July 12 ‐
1,783 m
3
August 12 ‐
1,563 m
3
July 28 ‐
1,551 m
3
June 11 ‐
1,530 m
3
August 15 ‐
1,578 m
3
September 11 ‐
1,263 m
3
July 14 ‐
1,351 m
3
July 28 ‐
1,232 m
3
July 14 ‐
1,421 m
3
0
500
1,000
1,500
2,000
2,500
3,000
3,500
4,000
0
50,000
100,000
150,000
200,000
250,000
300,000
350,000
400,000
1996 1997 1998 1999 2000 2001 2002 2003 2004 2005 2006 2007 2008 2009 2010 2011 2012 2013 2014
Average
Day & M
axim
um Day Deman
d (m3/day) &
Annual Population
Annual Deman
d, m
3District of Lantzville
Annual Demand, 1996 ‐ 2014
Annual Demand This Spreadsheet Average Day Maximum Day Stats BC Population Estimate

23
District of Lantzville Water Supply & Distribution System Study July 16, 2015
In general, higher per capita demands are experienced with smaller populations compared to large ones.
Water demands in Tofino, Ucluelet and Parksville are affected by large tourist population increases in the summer months.
Ucluelet had three processing plants while Tofino has one, which is reflected in the total average and maximum day/month values.
Domestic water demand for the pulp mill in Port Alberni and Campbell River is supplied by the municipal system, with the exception of the processing water demand at each Mill.
Lantzville’s per capita demands are the lowest of the 12 municipalities reviewed. They are as much as 40% lower than the City of Nanaimo, with whom they share a municipal boundary. It is believed the community awareness of the limited capacity of the wellfield, requirement for new developments to secure their own water supply sources and the inclining block pricing (Bylaw No. 85) are factors contributing to the low per capita demands.
5.1.2 Individual Water Meters
Individual Meters vs Upper & Lower Zone Bulk Meters The quarterly total of individual meters for the past four years (2011 – 2014) was compared with the combined total of the Upper and Lower pressure zone meters and found to be lower by 16% to 24%. While the difference between the two remained relatively constant from year to year and within each quarter, the first two quarters (Jan – March & April – June) had an average difference of 25% and 28%, respectively, while the difference in the last two quarters (July – Sept & Oct – Dec) was 12% and 14%; respectively, less than ½ the first two quarters. The comparison of the quarterly demands is presented in Figure 6. The volume difference between the sum of the bulk meter totals and the individual metering totals is referred to as “non‐revenue” water.
Non‐Revenue Water = Upper & Lower Bulk Meters – Individual Meters.
Non‐revenue water encompasses unbilled authorized consumption and apparent and real system losses, which may consist of: Unbilled Authorized Consumption
Watermain flushing
Sewer main flushing
Fire department training and actual fire fighting
Public boulevard and playfield irrigation Apparent Losses
Water theft
Metering inaccuracies Real Losses
Leakage on transmission and/or distribution mains
Leakage on service connections up to the customer’s meter
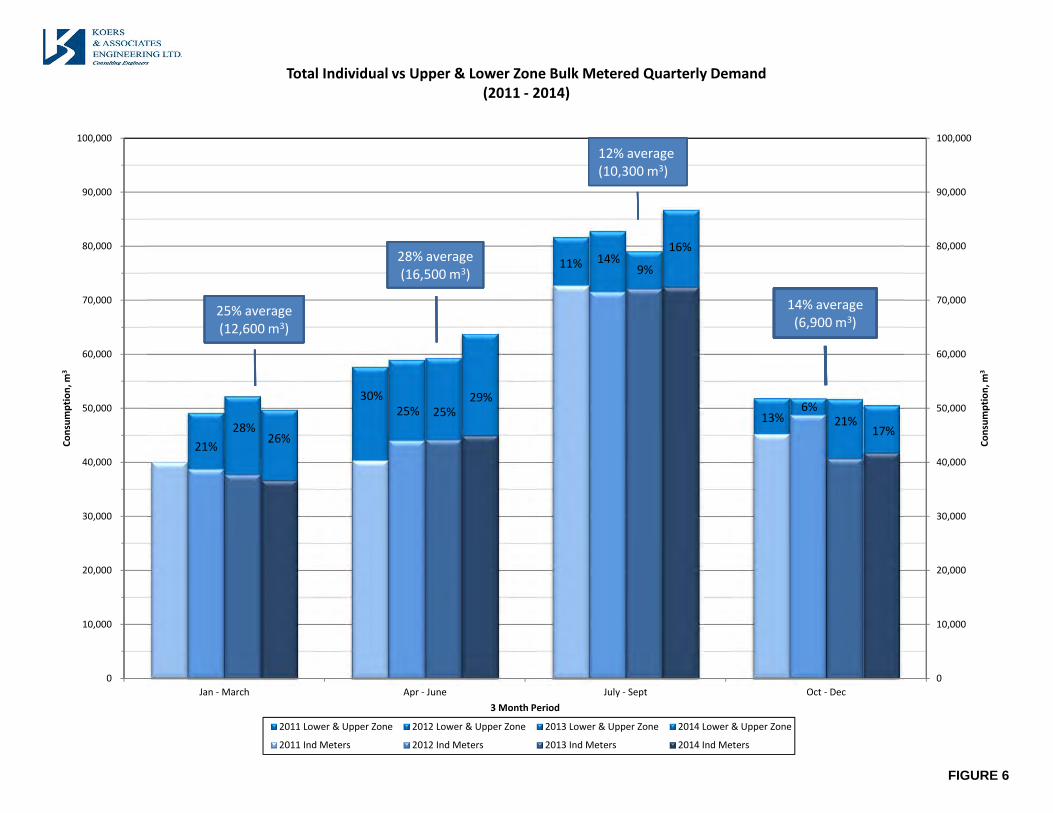
FIGURE 6
30%
11%
13%
21%
25%
14%
6%
28%25%
9%
21%
26%
29%
16%
17%
0
10,000
20,000
30,000
40,000
50,000
60,000
70,000
80,000
90,000
100,000
0
10,000
20,000
30,000
40,000
50,000
60,000
70,000
80,000
90,000
100,000
Jan ‐ March Apr ‐ June July ‐ Sept Oct ‐ Dec
Consumption, m
3
Consumption, m
3
3 Month Period
Total Individual vs Upper & Lower Zone Bulk Metered Quarterly Demand(2011 ‐ 2014)
2011 Lower & Upper Zone 2012 Lower & Upper Zone 2013 Lower & Upper Zone 2014 Lower & Upper Zone
2011 Ind Meters 2012 Ind Meters 2013 Ind Meters 2014 Ind Meters
25% average (12,600 m3)
28% average(16,500 m3)
12% average(10,300 m3)
13% average(6,900 m3)
25% average (12,600 m3)
28% average(16,500 m3)
12% average(10,300 m3)
13% average(6,900 m3)
25% average (12,600 m3)
28% average(16,500 m3)
12% average(10,300 m3)
13% average(6,900 m3)
25% average (12,600 m3)
28% average(16,500 m3)
12% average(10,300 m3)
14% average(6,900 m3)
24
District of Lantzville Water Supply & Distribution System Study July 16, 2015
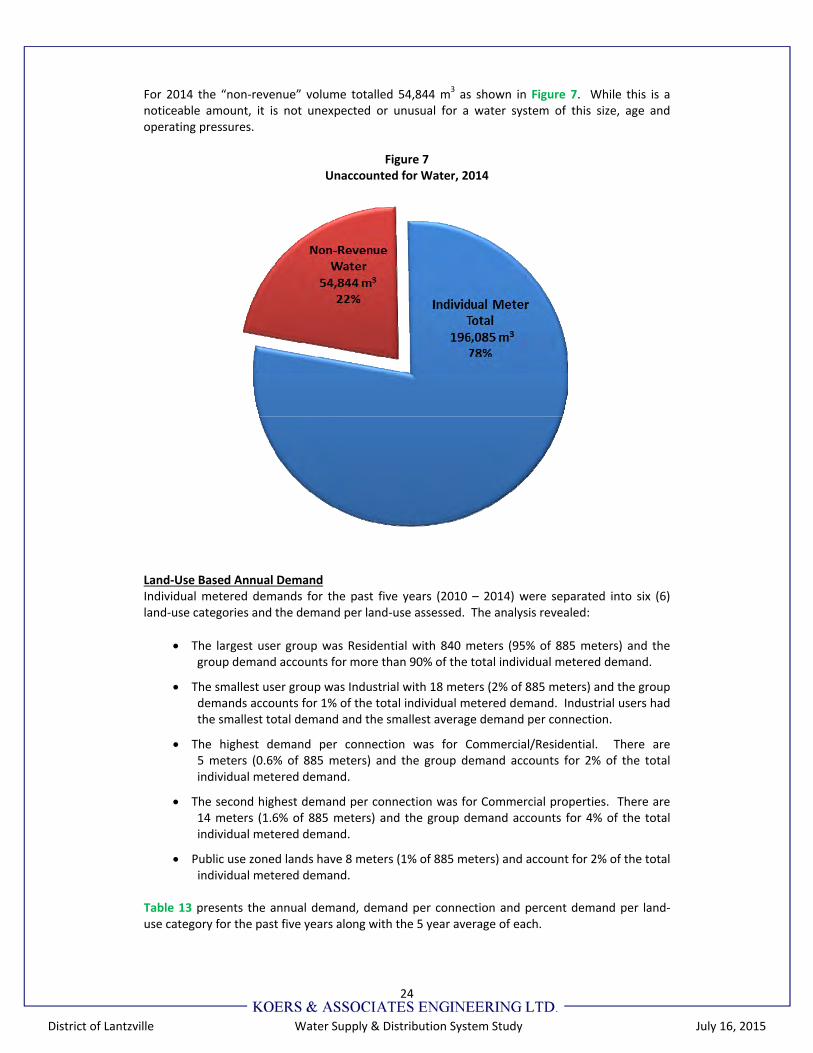
For 2014 the “non‐revenue” volume totalled 54,844 m3 as shown in Figure 7. While this is a noticeable amount, it is not unexpected or unusual for a water system of this size, age and operating pressures.
Figure 7 Unaccounted for Water, 2014
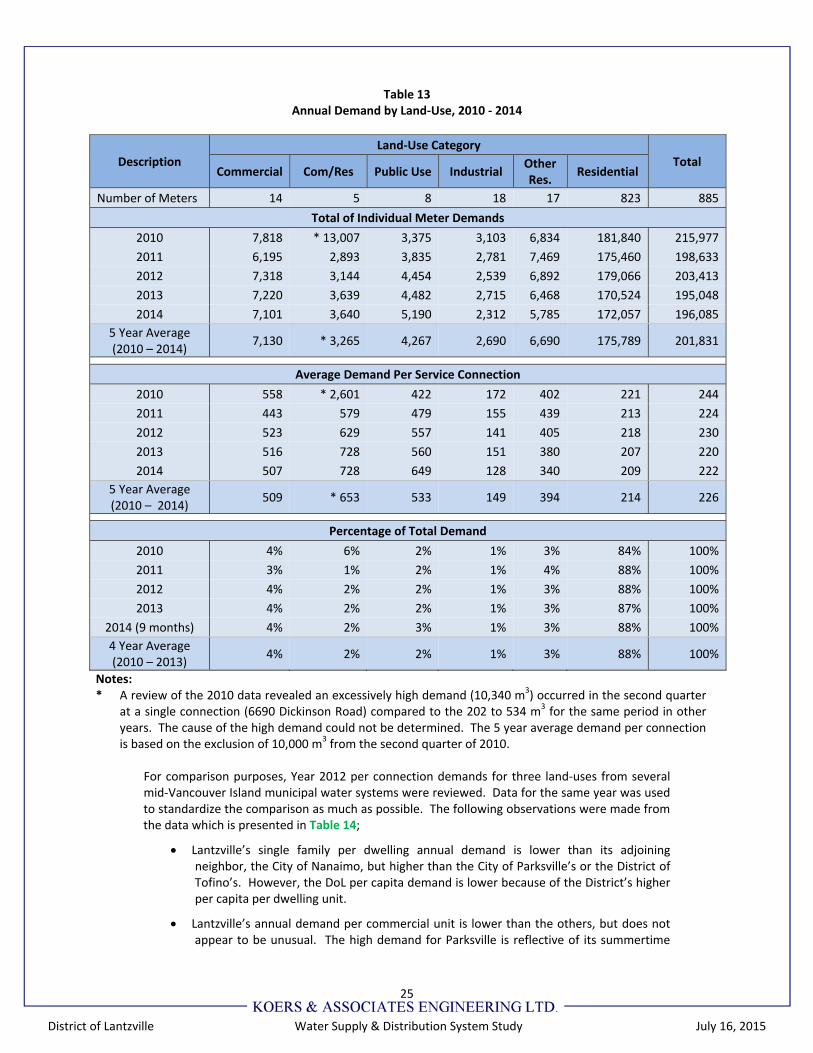
Land‐Use Based Annual Demand Individual metered demands for the past five years (2010 – 2014) were separated into six (6) land‐use categories and the demand per land‐use assessed. The analysis revealed:
The largest user group was Residential with 840 meters (95% of 885 meters) and the group demand accounts for more than 90% of the total individual metered demand.
The smallest user group was Industrial with 18 meters (2% of 885 meters) and the group demands accounts for 1% of the total individual metered demand. Industrial users had the smallest total demand and the smallest average demand per connection.
The highest demand per connection was for Commercial/Residential. There are 5 meters (0.6% of 885 meters) and the group demand accounts for 2% of the total individual metered demand.
The second highest demand per connection was for Commercial properties. There are 14 meters (1.6% of 885 meters) and the group demand accounts for 4% of the total individual metered demand.
Public use zoned lands have 8 meters (1% of 885 meters) and account for 2% of the total individual metered demand.
Table 13 presents the annual demand, demand per connection and percent demand per land‐use category for the past five years along with the 5 year average of each.
25
District of Lantzville Water Supply & Distribution System Study July 16, 2015
Table 13 Annual Demand by Land‐Use, 2010 ‐ 2014
Description Land‐Use Category
Total Commercial Com/Res Public Use Industrial
OtherRes.
Residential
Number of Meters 14 5 8 18 17 823 885
Total of Individual Meter Demands
2010 7,818 * 13,007 3,375 3,103 6,834 181,840 215,977
2011 6,195 2,893 3,835 2,781 7,469 175,460 198,633
2012 7,318 3,144 4,454 2,539 6,892 179,066 203,413
2013 7,220 3,639 4,482 2,715 6,468 170,524 195,048
2014 7,101 3,640 5,190 2,312 5,785 172,057 196,085
5 Year Average (2010 – 2014)
7,130 * 3,265 4,267 2,690 6,690 175,789 201,831
Average Demand Per Service Connection
2010 558 * 2,601 422 172 402 221 244
2011 443 579 479 155 439 213 224
2012 523 629 557 141 405 218 230
2013 516 728 560 151 380 207 220
2014 507 728 649 128 340 209 222
5 Year Average (2010 – 2014)
509 * 653 533 149 394 214 226
Percentage of Total Demand
2010 4% 6% 2% 1% 3% 84% 100%
2011 3% 1% 2% 1% 4% 88% 100%
2012 4% 2% 2% 1% 3% 88% 100%
2013 4% 2% 2% 1% 3% 87% 100%
2014 (9 months) 4% 2% 3% 1% 3% 88% 100%
4 Year Average (2010 – 2013)
4% 2% 2% 1% 3% 88% 100%
Notes: * A review of the 2010 data revealed an excessively high demand (10,340 m3) occurred in the second quarter
at a single connection (6690 Dickinson Road) compared to the 202 to 534 m3 for the same period in other years. The cause of the high demand could not be determined. The 5 year average demand per connection is based on the exclusion of 10,000 m3 from the second quarter of 2010.
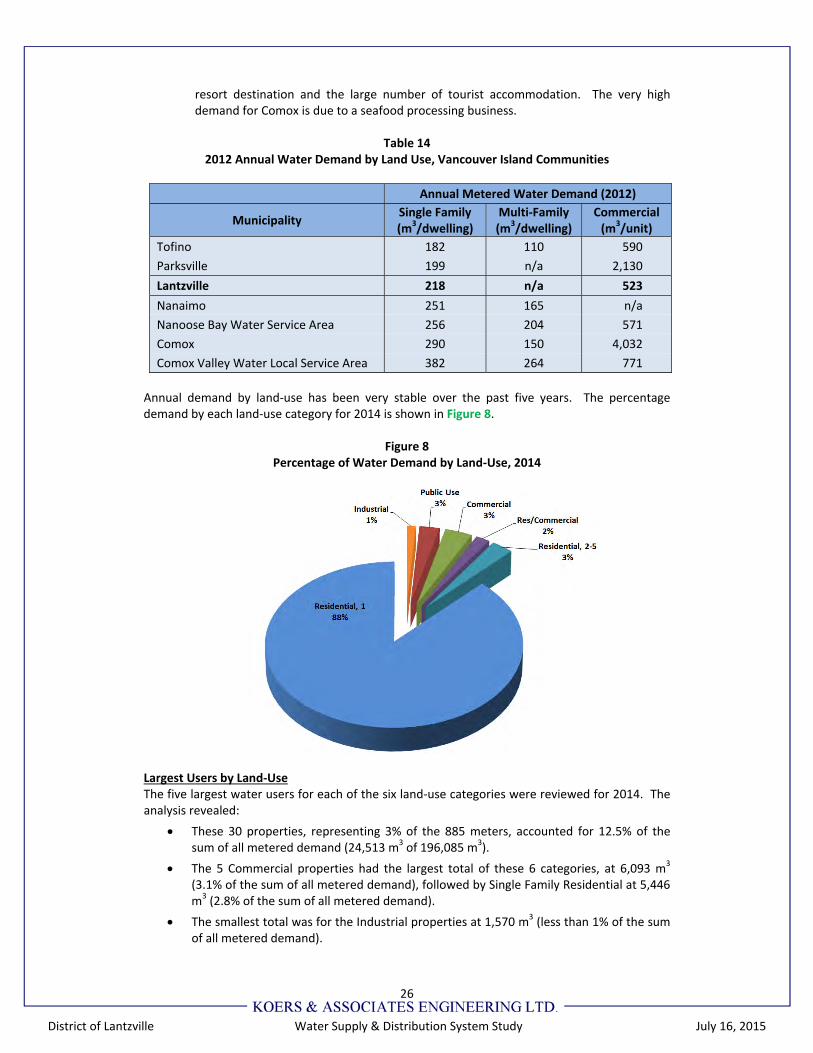
For comparison purposes, Year 2012 per connection demands for three land‐uses from several mid‐Vancouver Island municipal water systems were reviewed. Data for the same year was used to standardize the comparison as much as possible. The following observations were made from the data which is presented in Table 14;
Lantzville’s single family per dwelling annual demand is lower than its adjoining neighbor, the City of Nanaimo, but higher than the City of Parksville’s or the District of Tofino’s. However, the DoL per capita demand is lower because of the District’s higher per capita per dwelling unit.
Lantzville’s annual demand per commercial unit is lower than the others, but does not appear to be unusual. The high demand for Parksville is reflective of its summertime
26
District of Lantzville Water Supply & Distribution System Study July 16, 2015
resort destination and the large number of tourist accommodation. The very high demand for Comox is due to a seafood processing business.
Table 14
2012 Annual Water Demand by Land Use, Vancouver Island Communities
Annual Metered Water Demand (2012)
Municipality Single Family(m3/dwelling)
Multi‐Family(m3/dwelling)
Commercial(m3/unit)
Tofino 182 110 590
Parksville 199 n/a 2,130
Lantzville 218 n/a 523
Nanaimo 251 165 n/a
Nanoose Bay Water Service Area 256 204 571
Comox 290 150 4,032
Comox Valley Water Local Service Area 382 264 771
Annual demand by land‐use has been very stable over the past five years. The percentage demand by each land‐use category for 2014 is shown in Figure 8.
Figure 8 Percentage of Water Demand by Land‐Use, 2014
Largest Users by Land‐Use The five largest water users for each of the six land‐use categories were reviewed for 2014. The analysis revealed:
These 30 properties, representing 3% of the 885 meters, accounted for 12.5% of the sum of all metered demand (24,513 m3 of 196,085 m3).
The 5 Commercial properties had the largest total of these 6 categories, at 6,093 m3 (3.1% of the sum of all metered demand), followed by Single Family Residential at 5,446 m3 (2.8% of the sum of all metered demand).
The smallest total was for the Industrial properties at 1,570 m3 (less than 1% of the sum of all metered demand).
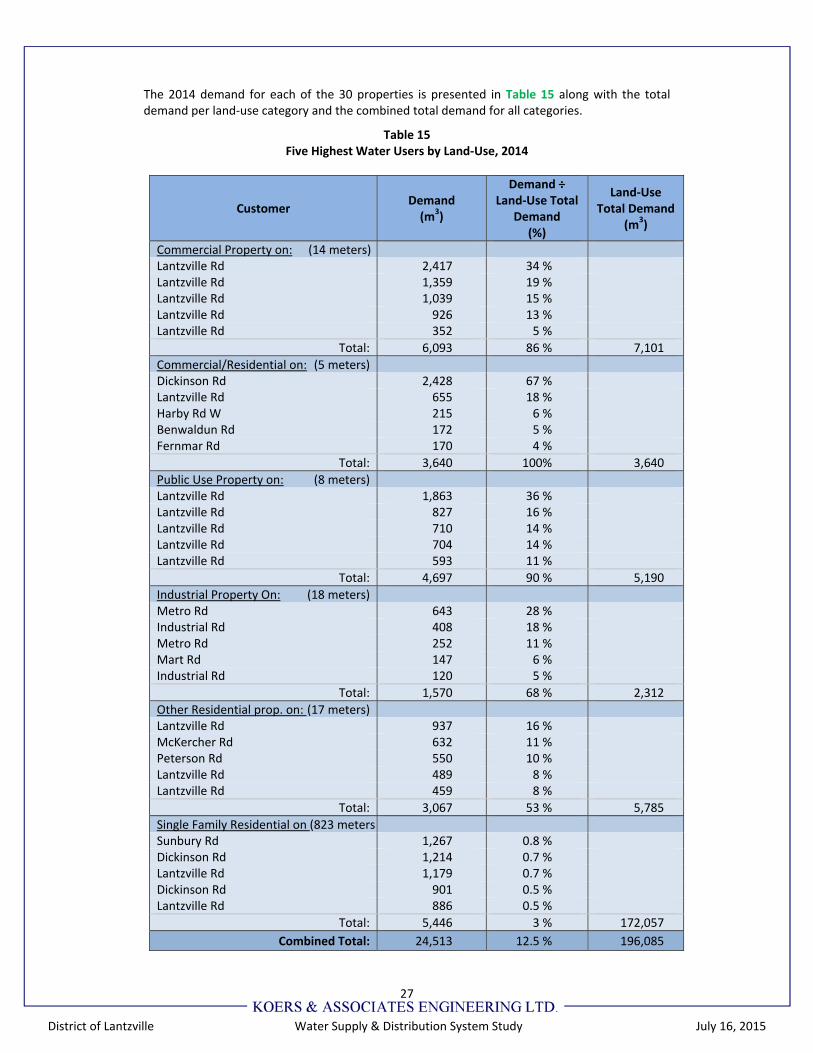
27
District of Lantzville Water Supply & Distribution System Study July 16, 2015
The 2014 demand for each of the 30 properties is presented in Table 15 along with the total demand per land‐use category and the combined total demand for all categories.
Table 15 Five Highest Water Users by Land‐Use, 2014
Customer Demand (m3)
Demand ÷ Land‐Use Total
Demand (%)
Land‐Use Total Demand
(m3)
Commercial Property on: (14 meters)Lantzville Rd 2,417 34 %Lantzville Rd 1,359 19 %Lantzville Rd 1,039 15 %Lantzville Rd 926 13 %Lantzville Rd 352 5 %
Total: 6,093 86 % 7,101
Commercial/Residential on: (5 meters)Dickinson Rd 2,428 67 %Lantzville Rd 655 18 %Harby Rd W 215 6 %Benwaldun Rd 172 5 %Fernmar Rd 170 4 %
Total: 3,640 100% 3,640
Public Use Property on: (8 meters)Lantzville Rd 1,863 36 %Lantzville Rd 827 16 %Lantzville Rd 710 14 %Lantzville Rd 704 14 %Lantzville Rd 593 11 %
Total: 4,697 90 % 5,190
Industrial Property On: (18 meters)Metro Rd 643 28 %Industrial Rd 408 18 %Metro Rd 252 11 %Mart Rd 147 6 %Industrial Rd 120 5 %
Total: 1,570 68 % 2,312
Other Residential prop. on: (17 meters)Lantzville Rd 937 16 %McKercher Rd 632 11 %Peterson Rd 550 10 %Lantzville Rd 489 8 %Lantzville Rd 459 8 %
Total: 3,067 53 % 5,785
Single Family Residential on (823 meters)Sunbury Rd 1,267 0.8 %Dickinson Rd 1,214 0.7 %Lantzville Rd 1,179 0.7 %Dickinson Rd 901 0.5 %Lantzville Rd 886 0.5 %
Total: 5,446 3 % 172,057
Combined Total: 24,513 12.5 % 196,085
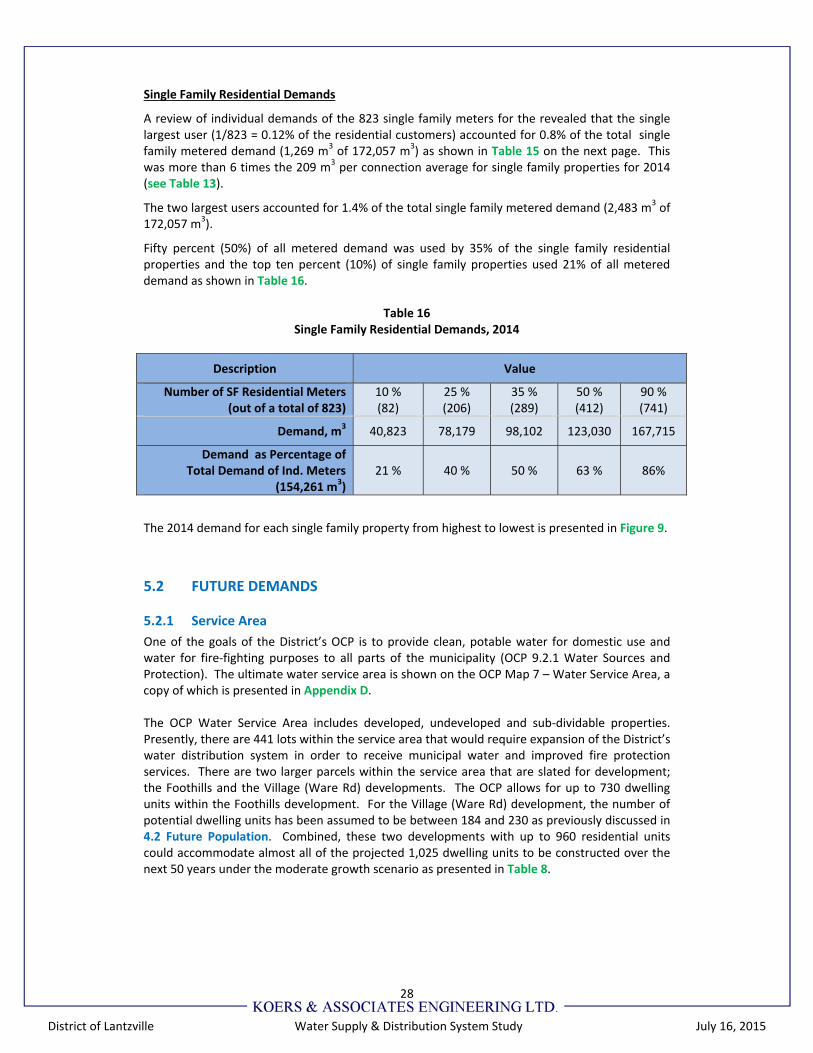
28
District of Lantzville Water Supply & Distribution System Study July 16, 2015
Single Family Residential Demands
A review of individual demands of the 823 single family meters for the revealed that the single largest user (1/823 = 0.12% of the residential customers) accounted for 0.8% of the total single family metered demand (1,269 m3 of 172,057 m3) as shown in Table 15 on the next page. This was more than 6 times the 209 m3 per connection average for single family properties for 2014 (see Table 13).
The two largest users accounted for 1.4% of the total single family metered demand (2,483 m3 of 172,057 m3).
Fifty percent (50%) of all metered demand was used by 35% of the single family residential properties and the top ten percent (10%) of single family properties used 21% of all metered demand as shown in Table 16.
Table 16 Single Family Residential Demands, 2014
Description Value
Number of SF Residential Meters(out of a total of 823)
10 %(82)
25 %(206)
35 %(289)
50 % (412)
90 %(741)
Demand, m3 40,823 78,179 98,102 123,030 167,715
Demand as Percentage ofTotal Demand of Ind. Meters
(154,261 m3) 21 % 40 % 50 % 63 % 86%
The 2014 demand for each single family property from highest to lowest is presented in Figure 9.
5.2 FUTURE DEMANDS
5.2.1 Service Area
One of the goals of the District’s OCP is to provide clean, potable water for domestic use and water for fire‐fighting purposes to all parts of the municipality (OCP 9.2.1 Water Sources and Protection). The ultimate water service area is shown on the OCP Map 7 – Water Service Area, a copy of which is presented in Appendix D. The OCP Water Service Area includes developed, undeveloped and sub‐dividable properties. Presently, there are 441 lots within the service area that would require expansion of the District’s water distribution system in order to receive municipal water and improved fire protection services. There are two larger parcels within the service area that are slated for development; the Foothills and the Village (Ware Rd) developments. The OCP allows for up to 730 dwelling units within the Foothills development. For the Village (Ware Rd) development, the number of potential dwelling units has been assumed to be between 184 and 230 as previously discussed in 4.2 Future Population. Combined, these two developments with up to 960 residential units could accommodate almost all of the projected 1,025 dwelling units to be constructed over the next 50 years under the moderate growth scenario as presented in Table 8.
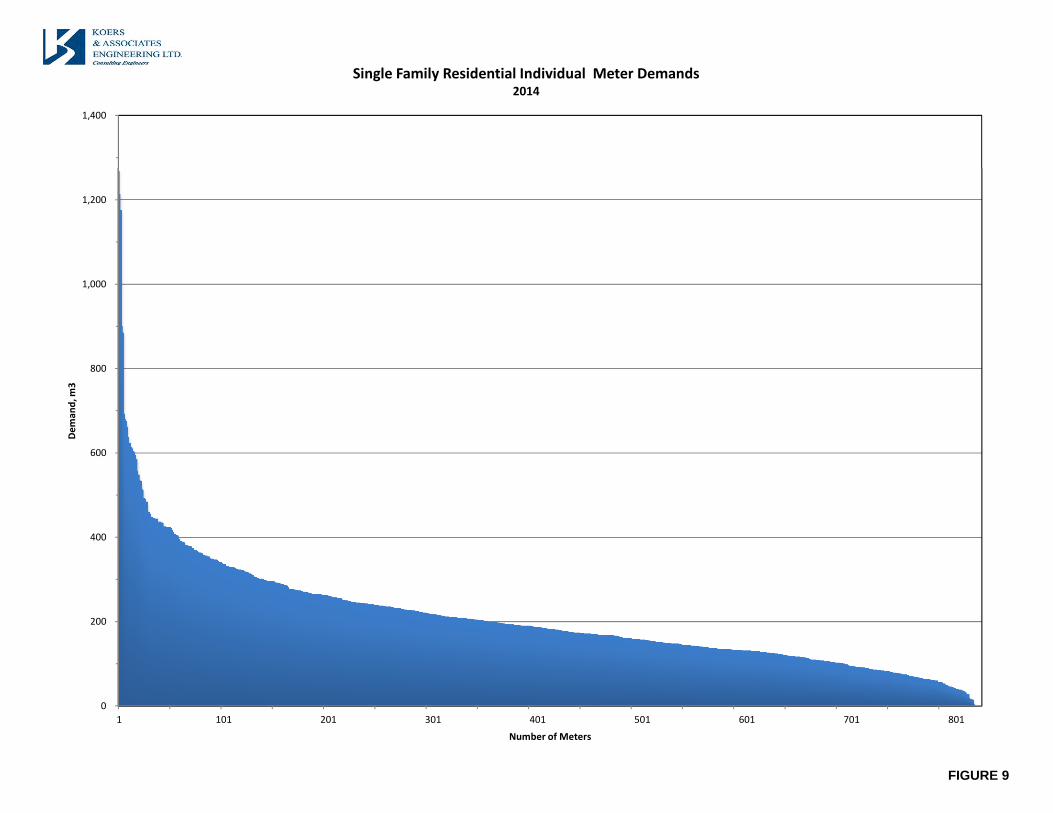
FIGURE 9
0
200
400
600
800
1,000
1,200
1,400
1 101 201 301 401 501 601 701 801
Deman
d, m
3
Number of Meters
Single Family Residential Individual Meter Demands2014
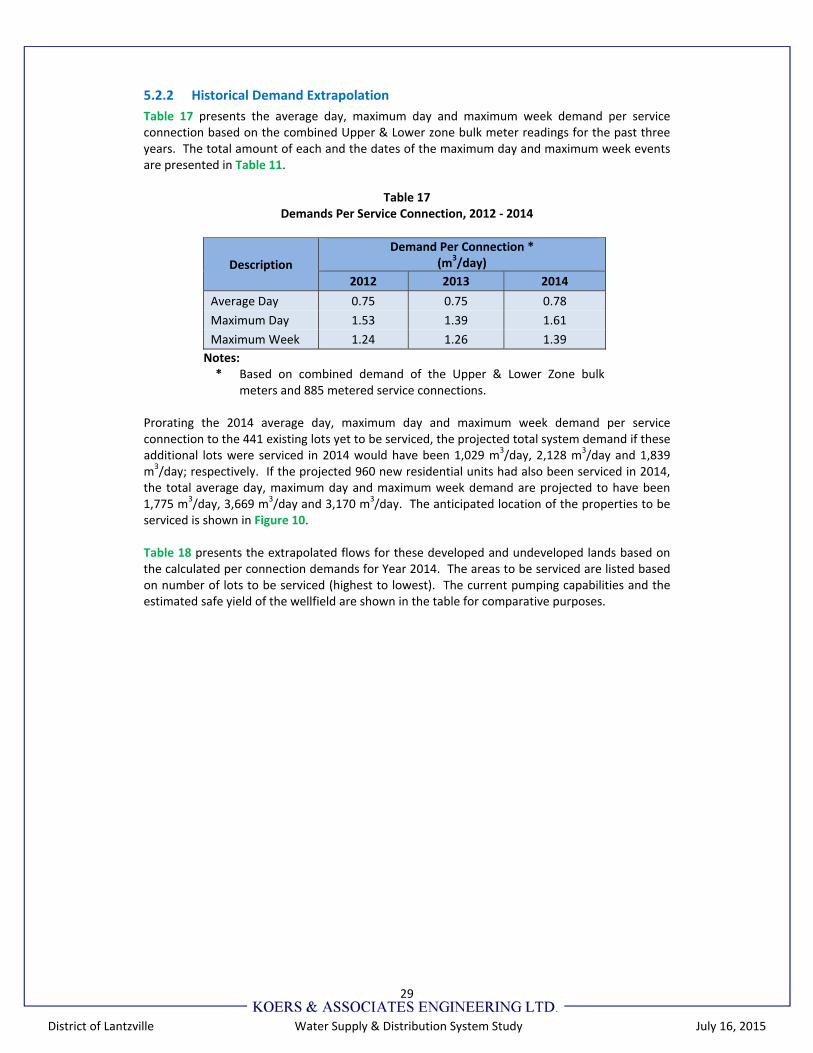
29
District of Lantzville Water Supply & Distribution System Study July 16, 2015
5.2.2 Historical Demand Extrapolation
Table 17 presents the average day, maximum day and maximum week demand per service connection based on the combined Upper & Lower zone bulk meter readings for the past three years. The total amount of each and the dates of the maximum day and maximum week events are presented in Table 11.
Table 17 Demands Per Service Connection, 2012 ‐ 2014
Description
Demand Per Connection *(m3/day)
2012 2013 2014
Average Day 0.75 0.75 0.78
Maximum Day 1.53 1.39 1.61
Maximum Week 1.24 1.26 1.39
Notes: * Based on combined demand of the Upper & Lower Zone bulk
meters and 885 metered service connections. Prorating the 2014 average day, maximum day and maximum week demand per service connection to the 441 existing lots yet to be serviced, the projected total system demand if these additional lots were serviced in 2014 would have been 1,029 m3/day, 2,128 m3/day and 1,839 m3/day; respectively. If the projected 960 new residential units had also been serviced in 2014, the total average day, maximum day and maximum week demand are projected to have been 1,775 m3/day, 3,669 m3/day and 3,170 m3/day. The anticipated location of the properties to be serviced is shown in Figure 10. Table 18 presents the extrapolated flows for these developed and undeveloped lands based on the calculated per connection demands for Year 2014. The areas to be serviced are listed based on number of lots to be serviced (highest to lowest). The current pumping capabilities and the estimated safe yield of the wellfield are shown in the table for comparative purposes.
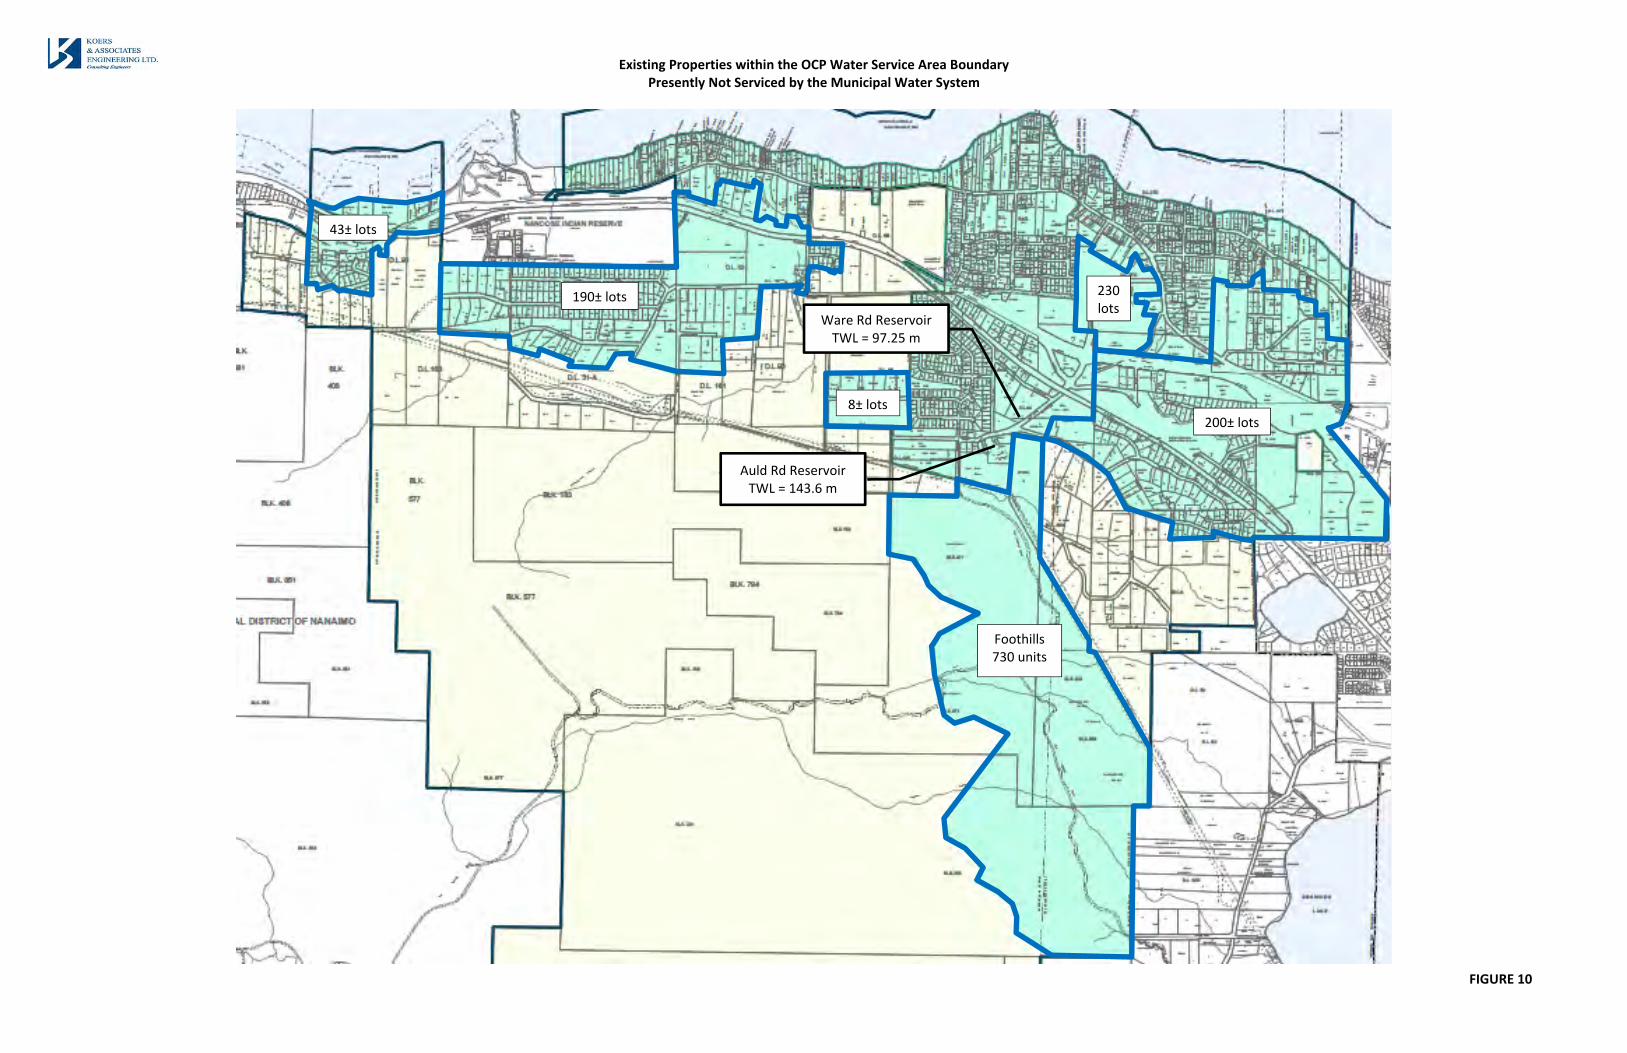
Existing Properties within the OCP Water Service Area Boundary Presently Not Serviced by the Municipal Water System
FIGURE 10
190± lots
43± lots
8± lots
Auld Rd Reservoir TWL = 143.6 m
Ware Rd Reservoir TWL = 97.25 m
Foothills 730 units
200± lots
230 lots
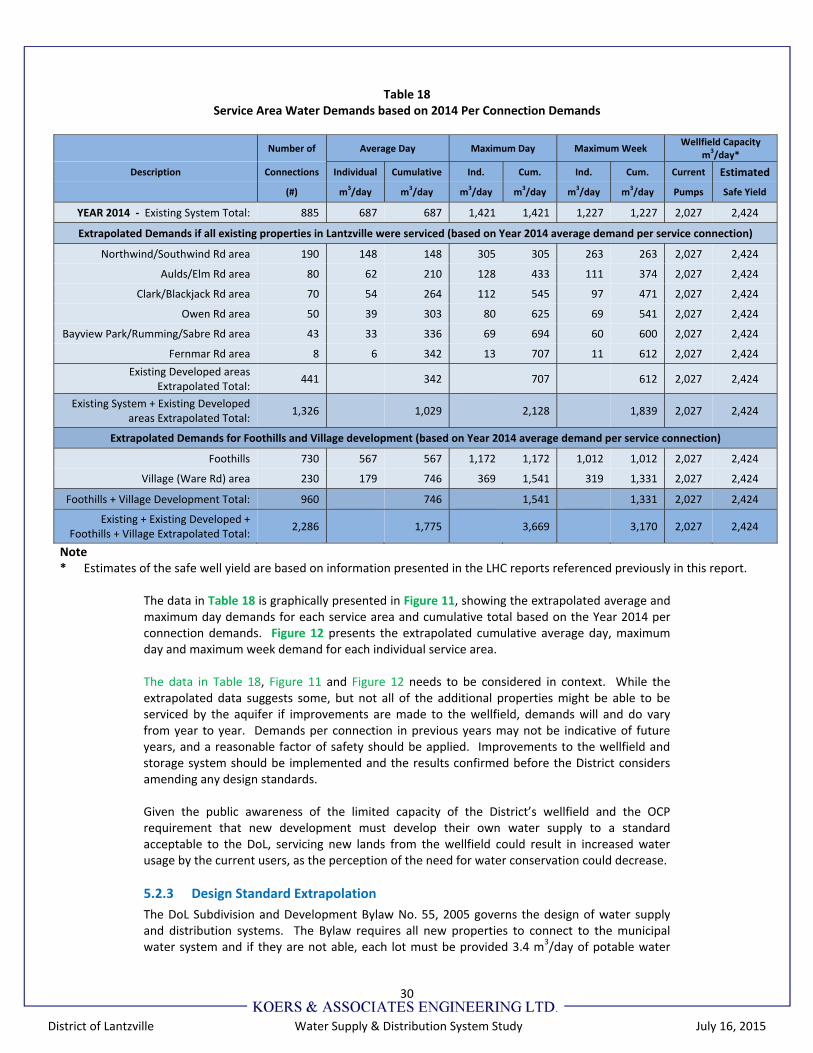
30
District of Lantzville Water Supply & Distribution System Study July 16, 2015
Table 18 Service Area Water Demands based on 2014 Per Connection Demands
Number of Average Day Maximum Day Maximum Week Wellfield Capacity
m3/day*
Description Connections Individual Cumulative Ind. Cum. Ind. Cum. Current Estimated
(#) m3/day m
3/day m
3/day m
3/day m
3/day m
3/day Pumps Safe Yield
YEAR 2014 ‐ Existing System Total: 885 687 687 1,421 1,421 1,227 1,227 2,027 2,424
Extrapolated Demands if all existing properties in Lantzville were serviced (based on Year 2014 average demand per service connection)
Northwind/Southwind Rd area 190 148 148 305 305 263 263 2,027 2,424
Aulds/Elm Rd area 80 62 210 128 433 111 374 2,027 2,424
Clark/Blackjack Rd area 70 54 264 112 545 97 471 2,027 2,424
Owen Rd area 50 39 303 80 625 69 541 2,027 2,424
Bayview Park/Rumming/Sabre Rd area 43 33 336 69 694 60 600 2,027 2,424
Fernmar Rd area 8 6 342 13 707 11 612 2,027 2,424
Existing Developed areas Extrapolated Total:
441
342
707
612 2,027 2,424
Existing System + Existing Developed areas Extrapolated Total:
1,326
1,029
2,128
1,839 2,027 2,424
Extrapolated Demands for Foothills and Village development (based on Year 2014 average demand per service connection)
Foothills 730 567 567 1,172 1,172 1,012 1,012 2,027 2,424
Village (Ware Rd) area 230 179 746 369 1,541 319 1,331 2,027 2,424
Foothills + Village Development Total: 960 746 1,541 1,331 2,027 2,424
Existing + Existing Developed + Foothills + Village Extrapolated Total:
2,286
1,775
3,669
3,170 2,027 2,424
Note * Estimates of the safe well yield are based on information presented in the LHC reports referenced previously in this report.
The data in Table 18 is graphically presented in Figure 11, showing the extrapolated average and maximum day demands for each service area and cumulative total based on the Year 2014 per connection demands. Figure 12 presents the extrapolated cumulative average day, maximum day and maximum week demand for each individual service area. The data in Table 18, Figure 11 and Figure 12 needs to be considered in context. While the extrapolated data suggests some, but not all of the additional properties might be able to be serviced by the aquifer if improvements are made to the wellfield, demands will and do vary from year to year. Demands per connection in previous years may not be indicative of future years, and a reasonable factor of safety should be applied. Improvements to the wellfield and storage system should be implemented and the results confirmed before the District considers amending any design standards. Given the public awareness of the limited capacity of the District’s wellfield and the OCP requirement that new development must develop their own water supply to a standard acceptable to the DoL, servicing new lands from the wellfield could result in increased water usage by the current users, as the perception of the need for water conservation could decrease.
5.2.3 Design Standard Extrapolation
The DoL Subdivision and Development Bylaw No. 55, 2005 governs the design of water supply and distribution systems. The Bylaw requires all new properties to connect to the municipal water system and if they are not able, each lot must be provided 3.4 m3/day of potable water
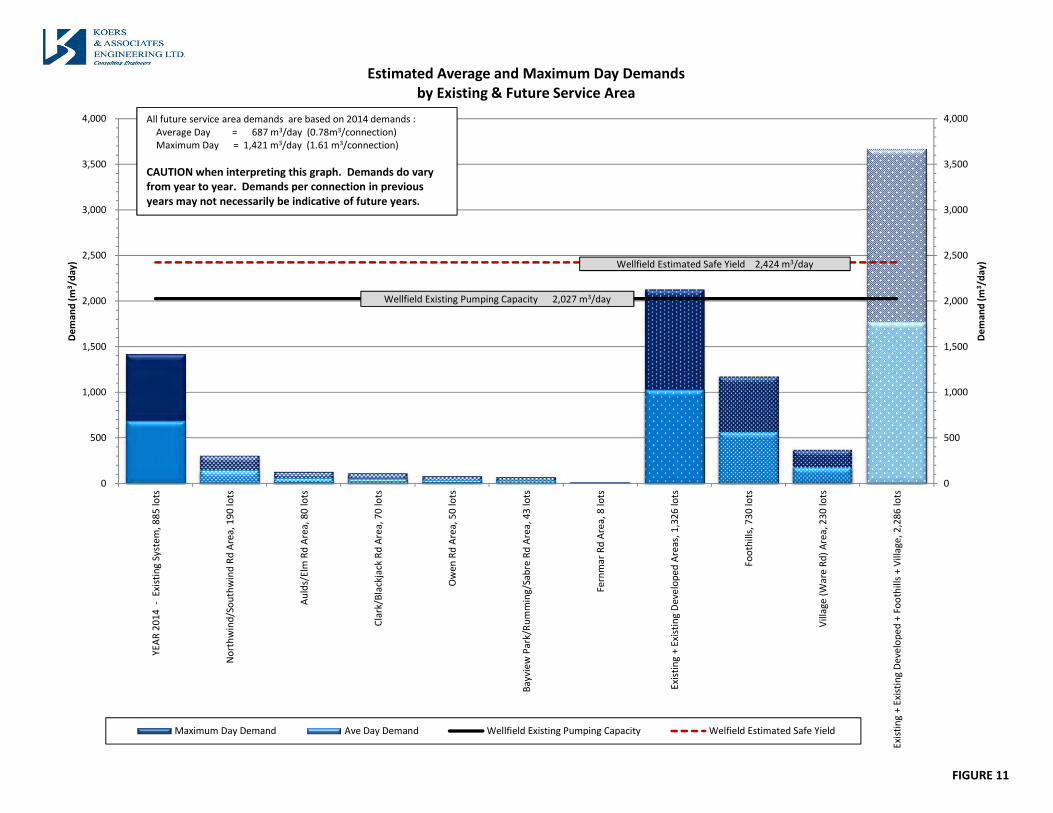
FIGURE 11
0
500
1,000
1,500
2,000
2,500
3,000
3,500
4,000
0
500
1,000
1,500
2,000
2,500
3,000
3,500
4,000
YEAR 2014
‐ Existing System
, 885 lots
Northwind/Southwind Rd Area, 190 lots
Aulds/Elm Rd Area, 80 lots
Clark/Blackjack Rd Area, 70 lots
Owen
Rd Area, 50 lots
Bayview
Park/Rumming/Sabre Rd Area, 43 lots
Fernmar Rd Area, 8 lots
Existing + Existing Developed
Areas, 1,326 lots
Foothills, 730 lots
Village (W
are Rd) Area, 230 lots
Existing + Existing Developed
+ Foothills + Village, 2,286 lots
Deman
d (m
3/day)
Deman
d (m
3/day)
Estimated Average and Maximum Day Demandsby Existing & Future Service Area
Maximum Day Demand Ave Day Demand Wellfield Existing Pumping Capacity Welfield Estimated Safe Yield
All future service area demands are based on 2014 demands :Average Day = 687 m3/day (0.78m3/connection)Maximum Day = 1,421 m3/day (1.61 m3/connection)
CAUTION when interpreting this graph. Demands do vary from year to year. Demands per connection in previous years may not necessarily be indicative of future years.
Wellfield Estimated Safe Yield 2,424 m3/day
Wellfield Existing Pumping Capacity 2,027 m3/day
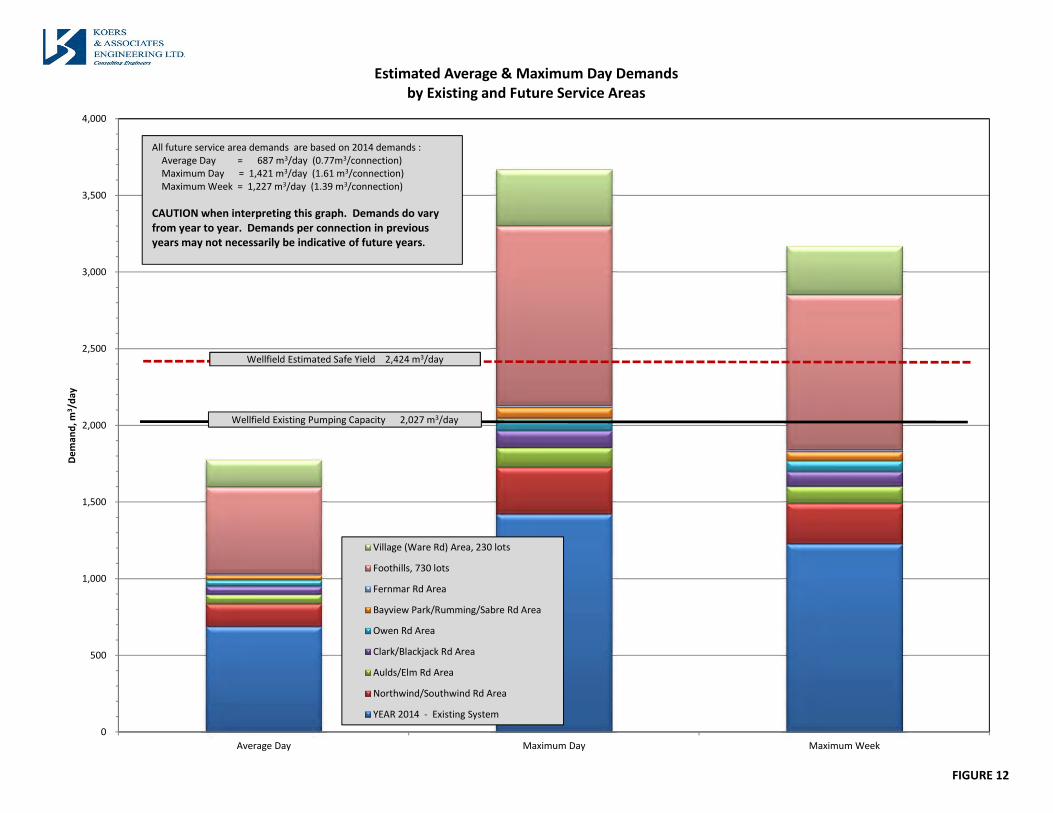
FIGURE 12
0
500
1,000
1,500
2,000
2,500
3,000
3,500
4,000
Average Day Maximum Day Maximum Week
Deman
d, m
3 /day
Estimated Average & Maximum Day Demandsby Existing and Future Service Areas
Village (Ware Rd) Area, 230 lots
Foothills, 730 lots
Fernmar Rd Area
Bayview Park/Rumming/Sabre Rd Area
Owen Rd Area
Clark/Blackjack Rd Area
Aulds/Elm Rd Area
Northwind/Southwind Rd Area
YEAR 2014 ‐ Existing System
Wellfield Existing Pumping Capacity 2,027 m3/day
Wellfield Estimated Safe Yield 2,424 m3/day
All future service area demands are based on 2014 demands :Average Day = 687 m3/day (0.77m3/connection)Maximum Day = 1,421 m3/day (1.61 m3/connection)Maximum Week = 1,227 m3/day (1.39 m3/connection)
CAUTION when interpreting this graph. Demands do vary from year to year. Demands per connection in previous years may not necessarily be indicative of future years.
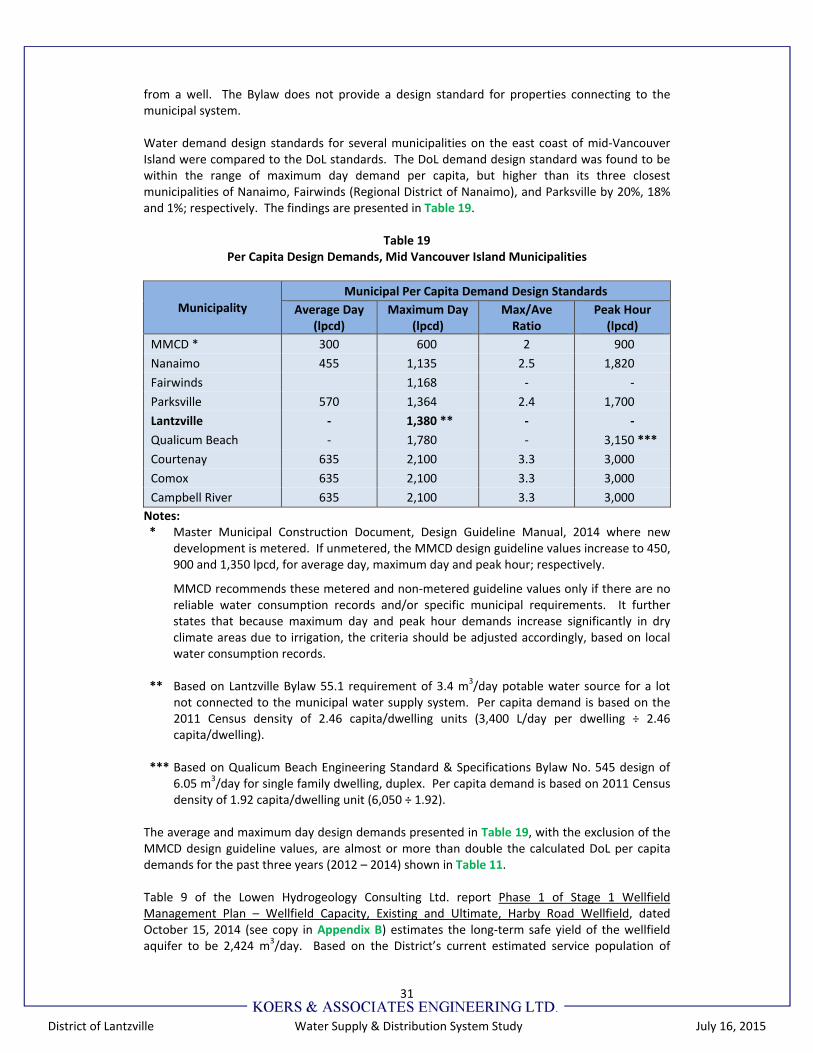
31
District of Lantzville Water Supply & Distribution System Study July 16, 2015
from a well. The Bylaw does not provide a design standard for properties connecting to the municipal system. Water demand design standards for several municipalities on the east coast of mid‐Vancouver Island were compared to the DoL standards. The DoL demand design standard was found to be within the range of maximum day demand per capita, but higher than its three closest municipalities of Nanaimo, Fairwinds (Regional District of Nanaimo), and Parksville by 20%, 18% and 1%; respectively. The findings are presented in Table 19.
Table 19 Per Capita Design Demands, Mid Vancouver Island Municipalities
Municipality Municipal Per Capita Demand Design Standards
Average Day(lpcd)
Maximum Day(lpcd)
Max/AveRatio
Peak Hour (lpcd)
MMCD * 300 600 2 900
Nanaimo 455 1,135 2.5 1,820
Fairwinds 1,168 ‐ ‐
Parksville 570 1,364 2.4 1,700
Lantzville ‐ 1,380 ** ‐ ‐
Qualicum Beach ‐ 1,780 ‐ 3,150 ***
Courtenay 635 2,100 3.3 3,000
Comox 635 2,100 3.3 3,000
Campbell River 635 2,100 3.3 3,000
Notes: * Master Municipal Construction Document, Design Guideline Manual, 2014 where new
development is metered. If unmetered, the MMCD design guideline values increase to 450, 900 and 1,350 lpcd, for average day, maximum day and peak hour; respectively.
MMCD recommends these metered and non‐metered guideline values only if there are no reliable water consumption records and/or specific municipal requirements. It further states that because maximum day and peak hour demands increase significantly in dry climate areas due to irrigation, the criteria should be adjusted accordingly, based on local water consumption records.
** Based on Lantzville Bylaw 55.1 requirement of 3.4 m3/day potable water source for a lot
not connected to the municipal water supply system. Per capita demand is based on the 2011 Census density of 2.46 capita/dwelling units (3,400 L/day per dwelling ÷ 2.46 capita/dwelling).
*** Based on Qualicum Beach Engineering Standard & Specifications Bylaw No. 545 design of
6.05 m3/day for single family dwelling, duplex. Per capita demand is based on 2011 Census density of 1.92 capita/dwelling unit (6,050 ÷ 1.92).
The average and maximum day design demands presented in Table 19, with the exclusion of the MMCD design guideline values, are almost or more than double the calculated DoL per capita demands for the past three years (2012 – 2014) shown in Table 11. Table 9 of the Lowen Hydrogeology Consulting Ltd. report Phase 1 of Stage 1 Wellfield Management Plan – Wellfield Capacity, Existing and Ultimate, Harby Road Wellfield, dated October 15, 2014 (see copy in Appendix B) estimates the long‐term safe yield of the wellfield aquifer to be 2,424 m3/day. Based on the District’s current estimated service population of
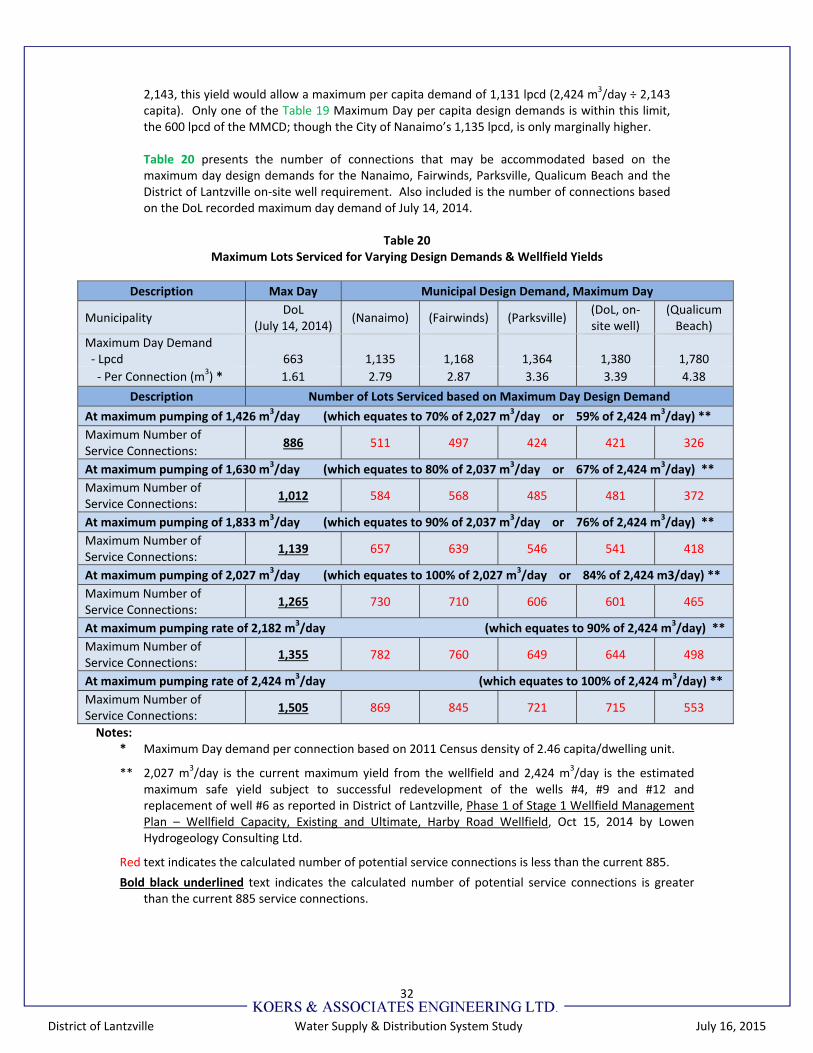
32
District of Lantzville Water Supply & Distribution System Study July 16, 2015
2,143, this yield would allow a maximum per capita demand of 1,131 lpcd (2,424 m3/day ÷ 2,143 capita). Only one of the Table 19 Maximum Day per capita design demands is within this limit, the 600 lpcd of the MMCD; though the City of Nanaimo’s 1,135 lpcd, is only marginally higher. Table 20 presents the number of connections that may be accommodated based on the maximum day design demands for the Nanaimo, Fairwinds, Parksville, Qualicum Beach and the District of Lantzville on‐site well requirement. Also included is the number of connections based on the DoL recorded maximum day demand of July 14, 2014.
Table 20 Maximum Lots Serviced for Varying Design Demands & Wellfield Yields
Description Max Day Municipal Design Demand, Maximum Day
Municipality DoL
(July 14, 2014) (Nanaimo) (Fairwinds) (Parksville)
(DoL, on‐site well)
(Qualicum Beach)
Maximum Day Demand ‐ Lpcd
663 1,135 1,168 1,364
1,380 1,780
‐ Per Connection (m3) * 1.61 2.79 2.87 3.36 3.39 4.38
Description Number of Lots Serviced based on Maximum Day Design Demand
At maximum pumping of 1,426 m3/day (which equates to 70% of 2,027 m3/day or 59% of 2,424 m3/day) **
Maximum Number of Service Connections:
886 511 497 424 421 326
At maximum pumping of 1,630 m3/day (which equates to 80% of 2,037 m3/day or 67% of 2,424 m3/day) **
Maximum Number of Service Connections:
1,012 584 568 485 481 372
At maximum pumping of 1,833 m3/day (which equates to 90% of 2,037 m3/day or 76% of 2,424 m3/day) **
Maximum Number of Service Connections:
1,139 657 639 546 541 418
At maximum pumping of 2,027 m3/day (which equates to 100% of 2,027 m3/day or 84% of 2,424 m3/day) **
Maximum Number of Service Connections:
1,265 730 710 606 601 465
At maximum pumping rate of 2,182 m3/day (which equates to 90% of 2,424 m3/day) **
Maximum Number of Service Connections:
1,355 782 760 649 644 498
At maximum pumping rate of 2,424 m3/day (which equates to 100% of 2,424 m3/day) **
Maximum Number of Service Connections:
1,505 869 845 721 715 553
Notes: * Maximum Day demand per connection based on 2011 Census density of 2.46 capita/dwelling unit.
** 2,027 m3/day is the current maximum yield from the wellfield and 2,424 m3/day is the estimated maximum safe yield subject to successful redevelopment of the wells #4, #9 and #12 and replacement of well #6 as reported in District of Lantzville, Phase 1 of Stage 1 Wellfield Management Plan – Wellfield Capacity, Existing and Ultimate, Harby Road Wellfield, Oct 15, 2014 by Lowen Hydrogeology Consulting Ltd.
Red text indicates the calculated number of potential service connections is less than the current 885.
Bold black underlined text indicates the calculated number of potential service connections is greater than the current 885 service connections.
33
District of Lantzville Water Supply & Distribution System Study July 16, 2015
5.3 BC LIVING WATER SMART PROGRAM
In 2008, the provincial government launched the Living Water Smart program emphasizing water conservation. This program requires 50% of new municipal water needs to be acquired through conservation by Year 2020. The District’s current per capita demands are low compared to other mid‐Vancouver Island municipalities as shown in Table 12. It is not known if this program will be applied to groundwater licensing and if so, what further reduction of DoL (already low) demands can be achieved. The future demand projections in this report have not made any allowances for potential demand reductions.
5.4 CLIMATE CHANGE
Climate change refers to a long‐term shift in weather conditions and is measured by changes in a variety of climate indicators (e.g. temperature, precipitation, wind) including both changes in average and extreme conditions. The following is taken from the Government of Canada climate change website (www.climatechange.gc.ca):
Over the period 1948 to 2010, the average annual temperature in Canada has warmed by 1.6 °C, a higher rate of warming than in most other regions of the world.
Future warming will be accompanied by other changes, including the amount and distribution of rain, snow, and ice and the risk of extreme weather events such as:
- heat waves, - heavy rainfalls and related flooding, - dry spells and/or droughts, and - forest fires.
The recent update to the City of Parksville’s Storm Drainage Master Plan, which focuses on winter time storm events, included an assessment of the potential impact of climate change on the City’s infrastructure. Some of the key findings were:
Climate models forecast change in total annual precipitation of between +2% to +11% by 2050s, which is within the historical variability in annual precipitation for the baseline period from 1961 to 1990.
Models forecast winters that are slightly wetter or about the same as the baseline period (‐6% to +14% by 2050s).
A visual review of the extreme data indicates that Pacific Decadal Oscillation (PDO) cycle could play a role in extreme precipitation in the Parksville Region with the three largest events occurring during cool PDO phase. However, additional records would be required to confirm the statistical significance of this observation.
The Pacific Decadal Oscillation (PDO) cycles between warm and cool phases about once in every 20 to 30 years. We may have recently shifted from a warm to cool PDO phase, which may have the effect of slowing warming trends in Southwestern BC for the next 20 to 30 years.
Based on analysis completed by Pacific Climate Impacts Consortium (PCIC), by the 2050s, extreme precipitation in the Parksville Region is forecast to increase by:
- 5% to 15% for daily maximum, and - 15% to 50% for hourly.

34
District of Lantzville Water Supply & Distribution System Study July 16, 2015
The potential impact climate change may have on either the District’s water supply source (Aquifer #215) or changes in water demands by the consumers, is not known. Generally, it is expected that the Vancouver Island region will experience drier summers and wetter winters.
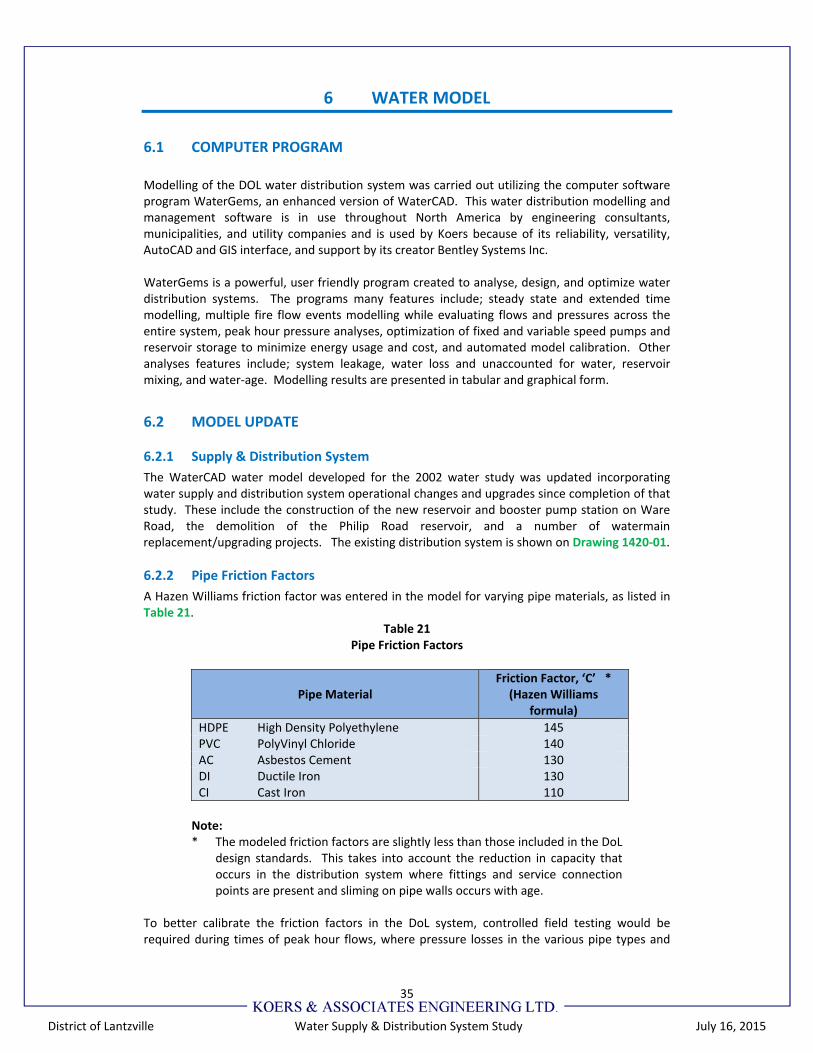
35
District of Lantzville Water Supply & Distribution System Study July 16, 2015
6 WATER MODEL
6.1 COMPUTER PROGRAM
Modelling of the DOL water distribution system was carried out utilizing the computer software program WaterGems, an enhanced version of WaterCAD. This water distribution modelling and management software is in use throughout North America by engineering consultants, municipalities, and utility companies and is used by Koers because of its reliability, versatility, AutoCAD and GIS interface, and support by its creator Bentley Systems Inc. WaterGems is a powerful, user friendly program created to analyse, design, and optimize water distribution systems. The programs many features include; steady state and extended time modelling, multiple fire flow events modelling while evaluating flows and pressures across the entire system, peak hour pressure analyses, optimization of fixed and variable speed pumps and reservoir storage to minimize energy usage and cost, and automated model calibration. Other analyses features include; system leakage, water loss and unaccounted for water, reservoir mixing, and water‐age. Modelling results are presented in tabular and graphical form.
6.2 MODEL UPDATE
6.2.1 Supply & Distribution System
The WaterCAD water model developed for the 2002 water study was updated incorporating water supply and distribution system operational changes and upgrades since completion of that study. These include the construction of the new reservoir and booster pump station on Ware Road, the demolition of the Philip Road reservoir, and a number of watermain replacement/upgrading projects. The existing distribution system is shown on Drawing 1420‐01.
6.2.2 Pipe Friction Factors
A Hazen Williams friction factor was entered in the model for varying pipe materials, as listed in Table 21.
Table 21 Pipe Friction Factors
Pipe Material Friction Factor, ‘C’ * (Hazen Williams
formula)
HDPE High Density Polyethylene 145PVC PolyVinyl Chloride 140AC Asbestos Cement 130DI Ductile Iron 130CI Cast Iron 110
Note: * The modeled friction factors are slightly less than those included in the DoL
design standards. This takes into account the reduction in capacity that occurs in the distribution system where fittings and service connection points are present and sliming on pipe walls occurs with age.
To better calibrate the friction factors in the DoL system, controlled field testing would be required during times of peak hour flows, where pressure losses in the various pipe types and
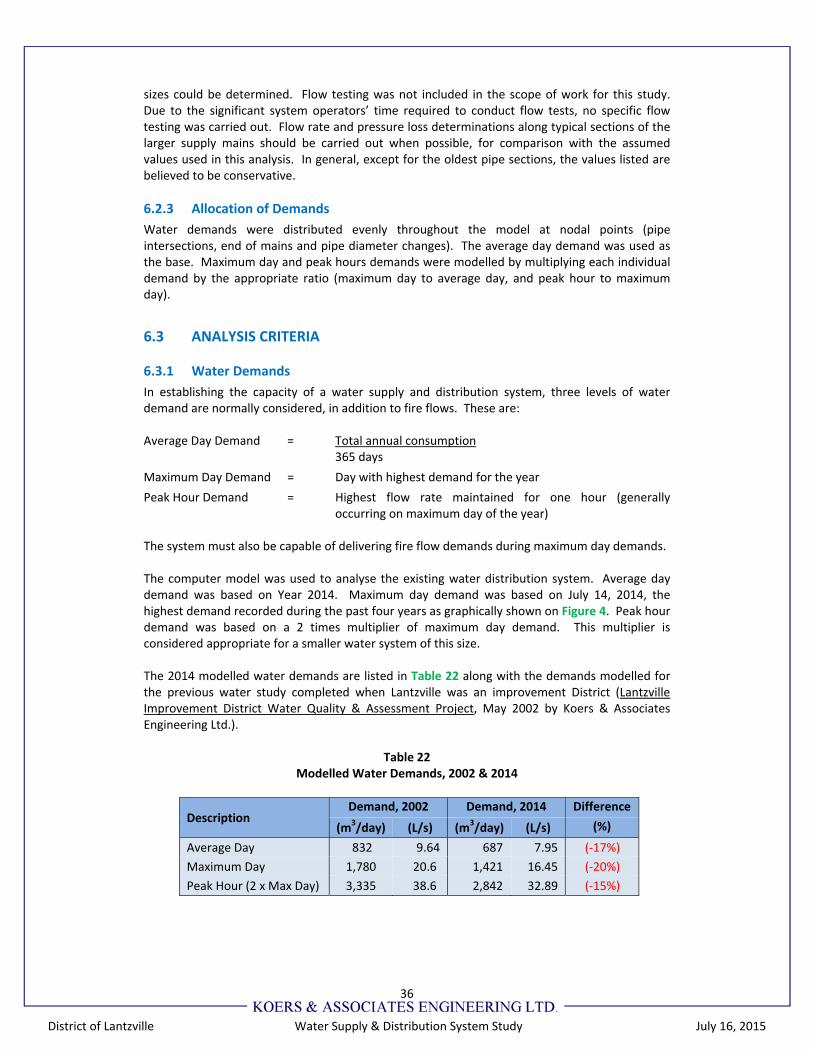
36
District of Lantzville Water Supply & Distribution System Study July 16, 2015
sizes could be determined. Flow testing was not included in the scope of work for this study. Due to the significant system operators’ time required to conduct flow tests, no specific flow testing was carried out. Flow rate and pressure loss determinations along typical sections of the larger supply mains should be carried out when possible, for comparison with the assumed values used in this analysis. In general, except for the oldest pipe sections, the values listed are believed to be conservative.
6.2.3 Allocation of Demands
Water demands were distributed evenly throughout the model at nodal points (pipe intersections, end of mains and pipe diameter changes). The average day demand was used as the base. Maximum day and peak hours demands were modelled by multiplying each individual demand by the appropriate ratio (maximum day to average day, and peak hour to maximum day).
6.3 ANALYSIS CRITERIA
6.3.1 Water Demands
In establishing the capacity of a water supply and distribution system, three levels of water demand are normally considered, in addition to fire flows. These are: Average Day Demand = Total annual consumption
365 days
Maximum Day Demand = Day with highest demand for the year
Peak Hour Demand = Highest flow rate maintained for one hour (generally occurring on maximum day of the year)
The system must also be capable of delivering fire flow demands during maximum day demands. The computer model was used to analyse the existing water distribution system. Average day demand was based on Year 2014. Maximum day demand was based on July 14, 2014, the highest demand recorded during the past four years as graphically shown on Figure 4. Peak hour demand was based on a 2 times multiplier of maximum day demand. This multiplier is considered appropriate for a smaller water system of this size. The 2014 modelled water demands are listed in Table 22 along with the demands modelled for the previous water study completed when Lantzville was an improvement District (Lantzville Improvement District Water Quality & Assessment Project, May 2002 by Koers & Associates Engineering Ltd.).
Table 22 Modelled Water Demands, 2002 & 2014
Description Demand, 2002 Demand, 2014 Difference
(m3/day) (L/s) (m3/day) (L/s) (%)
Average Day 832 9.64 687 7.95 (‐17%)
Maximum Day 1,780 20.6 1,421 16.45 (‐20%)
Peak Hour (2 x Max Day) 3,335 38.6 2,842 32.89 (‐15%)
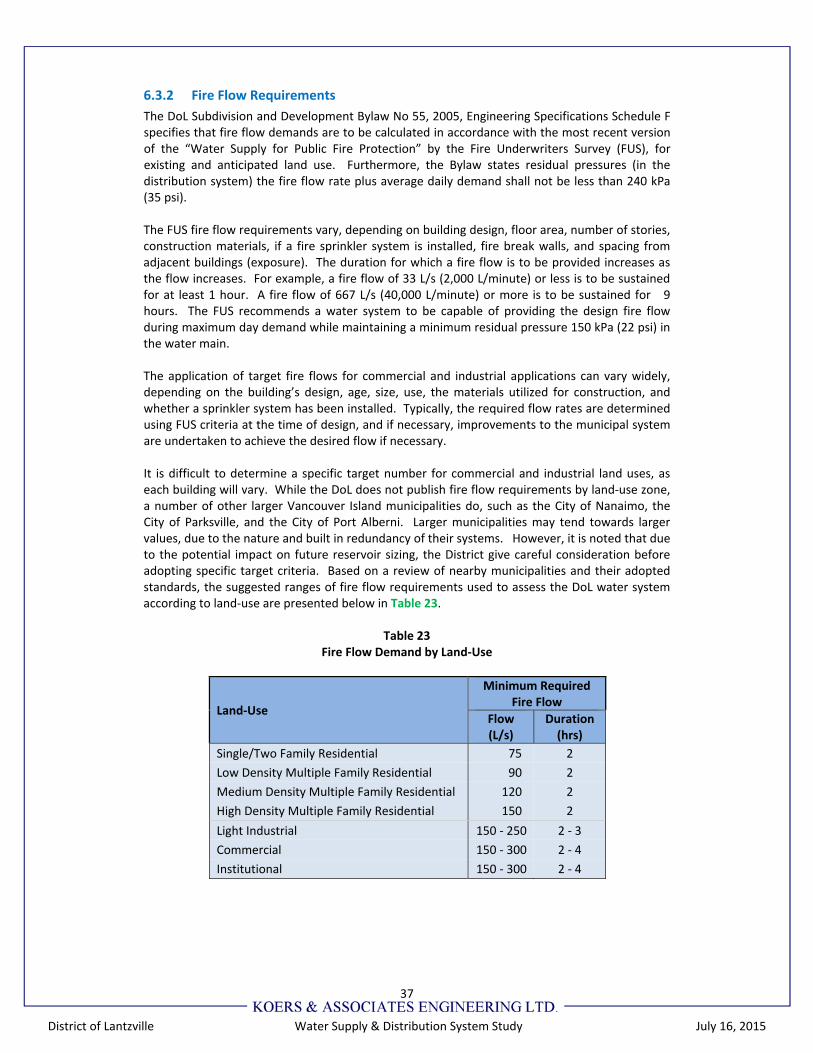
37
District of Lantzville Water Supply & Distribution System Study July 16, 2015
6.3.2 Fire Flow Requirements
The DoL Subdivision and Development Bylaw No 55, 2005, Engineering Specifications Schedule F specifies that fire flow demands are to be calculated in accordance with the most recent version of the “Water Supply for Public Fire Protection” by the Fire Underwriters Survey (FUS), for existing and anticipated land use. Furthermore, the Bylaw states residual pressures (in the distribution system) the fire flow rate plus average daily demand shall not be less than 240 kPa (35 psi). The FUS fire flow requirements vary, depending on building design, floor area, number of stories, construction materials, if a fire sprinkler system is installed, fire break walls, and spacing from adjacent buildings (exposure). The duration for which a fire flow is to be provided increases as the flow increases. For example, a fire flow of 33 L/s (2,000 L/minute) or less is to be sustained for at least 1 hour. A fire flow of 667 L/s (40,000 L/minute) or more is to be sustained for 9 hours. The FUS recommends a water system to be capable of providing the design fire flow during maximum day demand while maintaining a minimum residual pressure 150 kPa (22 psi) in the water main. The application of target fire flows for commercial and industrial applications can vary widely, depending on the building’s design, age, size, use, the materials utilized for construction, and whether a sprinkler system has been installed. Typically, the required flow rates are determined using FUS criteria at the time of design, and if necessary, improvements to the municipal system are undertaken to achieve the desired flow if necessary. It is difficult to determine a specific target number for commercial and industrial land uses, as each building will vary. While the DoL does not publish fire flow requirements by land‐use zone, a number of other larger Vancouver Island municipalities do, such as the City of Nanaimo, the City of Parksville, and the City of Port Alberni. Larger municipalities may tend towards larger values, due to the nature and built in redundancy of their systems. However, it is noted that due to the potential impact on future reservoir sizing, the District give careful consideration before adopting specific target criteria. Based on a review of nearby municipalities and their adopted standards, the suggested ranges of fire flow requirements used to assess the DoL water system according to land‐use are presented below in Table 23.
Table 23 Fire Flow Demand by Land‐Use
Land‐Use
Minimum Required Fire Flow
Flow(L/s)
Duration (hrs)
Single/Two Family Residential 75 2
Low Density Multiple Family Residential 90 2
Medium Density Multiple Family Residential 120 2
High Density Multiple Family Residential 150 2
Light Industrial 150 ‐ 250 2 ‐ 3
Commercial 150 ‐ 300 2 ‐ 4
Institutional 150 ‐ 300 2 ‐ 4
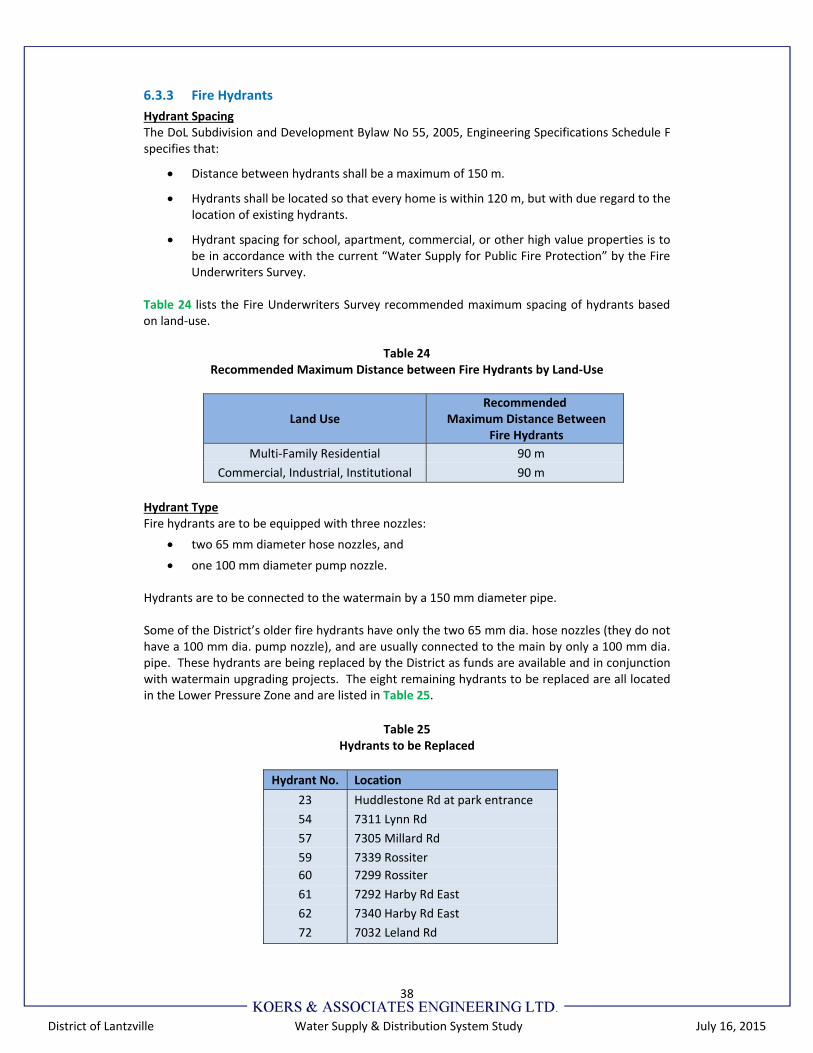
38
District of Lantzville Water Supply & Distribution System Study July 16, 2015
6.3.3 Fire Hydrants
Hydrant Spacing The DoL Subdivision and Development Bylaw No 55, 2005, Engineering Specifications Schedule F specifies that:
Distance between hydrants shall be a maximum of 150 m.
Hydrants shall be located so that every home is within 120 m, but with due regard to the location of existing hydrants.
Hydrant spacing for school, apartment, commercial, or other high value properties is to be in accordance with the current “Water Supply for Public Fire Protection” by the Fire Underwriters Survey.
Table 24 lists the Fire Underwriters Survey recommended maximum spacing of hydrants based on land‐use.
Table 24 Recommended Maximum Distance between Fire Hydrants by Land‐Use
Land Use Recommended
Maximum Distance Between Fire Hydrants
Multi‐Family Residential 90 m
Commercial, Industrial, Institutional 90 m
Hydrant Type Fire hydrants are to be equipped with three nozzles:
two 65 mm diameter hose nozzles, and
one 100 mm diameter pump nozzle.
Hydrants are to be connected to the watermain by a 150 mm diameter pipe. Some of the District’s older fire hydrants have only the two 65 mm dia. hose nozzles (they do not have a 100 mm dia. pump nozzle), and are usually connected to the main by only a 100 mm dia. pipe. These hydrants are being replaced by the District as funds are available and in conjunction with watermain upgrading projects. The eight remaining hydrants to be replaced are all located in the Lower Pressure Zone and are listed in Table 25.
Table 25
Hydrants to be Replaced
Hydrant No. Location
23 Huddlestone Rd at park entrance
54 7311 Lynn Rd
57 7305 Millard Rd
59 7339 Rossiter
60 7299 Rossiter
61 7292 Harby Rd East
62 7340 Harby Rd East
72 7032 Leland Rd
39
District of Lantzville Water Supply & Distribution System Study July 16, 2015
6.3.4 Reservoir Sizing
Water reservoirs perform three functions:
storage for fire fighting
storage for emergencies (such as a watermain break)
storage for equalization to manage hourly peaks in demand The storage volume requirements for the DoL were calculated using the following, generally accepted, formula from the “Design Guideline Manual, 2014” from the Master Municipal Contract Document (MMCD) Association: Storage Volume = A + B + C Where: A = Fire Storage (from Fire Underwriters Survey Guide) B = Equalization (Peaking) Storage (25% of Maximum Day Demands) C = Emergency Storage (25% of (A + B)) The requirement for Emergency Storage (C) can be reduced or eliminated based on several factors, including: water source dependability, reliability of the supply system (e.g. gravity vs pumped, duplication of mains and treatment, standby emergency power), multiple sources, more than one storage reservoir, and reservoir water circulation needs. As the DoL water supply is a groundwater source requiring pumps and there are only two water reservoirs in the distribution system, emergency storage volume requirements were included in the calculations. This storage volume calculation has been updated from the one used in the 2002 Water Study which served as the basis for the sizing of the Ware Road reservoir.
6.3.5 Distribution System
The adequacy of the distribution system for various demand conditions is judged by the residual pressure available throughout the system and by the maximum velocity in the mains. The criteria applied to assess the DoL distribution system are listed in Table 26 and are based on good engineering practise.
Table 26 Distribution System Design Criteria
Parameter Value
Under Peak Hour Demand Conditions
Minimum residual pressure at property line 275 kPa (40 psi)
Maximum velocity in mains 1.5 m/s (5 ft/s)
Under Fire Flow Demand Conditions(during Maximum Day Demands)
Minimum residual pressure at hydrant 138 kPa (20 psi)
Maximum velocity in mains 3.0 m/s (10 ft/s)
Minimum residual pressure at property line 35 kPa (5 psi)
Under Static Conditions
Maximum service pressure 1,035 kPa (150 psi)
The DoL Subdivision and Development Bylaw No 55, 2005, Engineering Specifications Schedule F specifies that watermain diameters are to be a minimum of 200 mm diameter, with the exception of the last 90 m of dead‐ended watermain in a cul‐de‐sac can be reduced to 150 mm diameter. Depending on the fire flow demand, and the velocities within the main, and the extent of looping in the system, 150 mm diameter may be sufficient, subject to approval.
40
District of Lantzville Water Supply & Distribution System Study July 16, 2015
7 SYSTEM ANALYSIS
7.1 DISTRIBUTION SYSTEM
The water system was evaluated under steady state conditions to determine the system pressures under peak hour conditions and during maximum day demands plus fire flows for existing and future conditions. The existing water system and pressure zones are shown on Drawing 1420‐01 located in the pocket at the end of this report. The modeling analyses are discussed below.
7.1.1 Peak Hour Pressures
The system pressures under peak hour demand under existing conditions are shown in Figure 13. Upper Pressure Zone i) Pressures Less than Minimum Design Standard Pressures below the acceptable design minimum of 275 kPa (40 psi) occur on properties at an elevation above 115 m geodetic in the upper pressure zone. These encompasses approximately 10 properties located and at the top (southeast) end of Aulds Road (west of Philip Road) and at the top end of Harwood Drive (south of Aulds Rd). The lowest pressure is estimated to be around 207 kPa (30 psi) at the home at 6671 Harewood Road. The highest ground elevation is also on this property at approximately 132 m in the southwest corner. To provide a minimum design pressure of 275 kPa (40 psi) at the 132 m ground elevation, the top water level of the Aulds Road reservoir could be increased to 160 m geodetic compared to the current 143.6 m. This 16.4 m increase (160 m – 143.6 m) would result in 160 kPa (23 psi) pressure increase throughout the entire Upper Pressure zone. As a result, properties below the 75 m geodetic elevation would experience a static pressure greater than the typical maximum design pressure of 827 kPa (120 psi) and those below 54 m geodetic would experience pressure greater than the recommended maximum design pressure of 1,035 kPa (150 psi). This would impact the following areas encompassing approximately 50 properties:
High pressure zone properties below 75 m geodetic (pressures greater than 827 kPA (120 psi) if Aulds Road reservoir elevation increased to 160 m geodetic
Philip Road properties, north of Ronald Road
Forest Turn properties,
Harby Road West properties,
All properties north of the E&N Railway including: ‐ Lantzville Road between Ware Road and Owen Road ‐ Stronge Road
Properties below 54 m geodetic (pressures greater than 1,035 kPA (150 psi) if Aulds Road reservoir elevation increased to 160 m geodetic
Ware Road, (from 110 m north of Hwy 19 to Lantzville Road)
Lantzville Road between Ware Rd and Maple Glen Mobile Home Park
Stronge Road South of the E&N railway, the highest pressures would be experienced on the properties along Forest Turn and Harby Road West where the ground elevation ranges from 68 to 60 m geodetic;
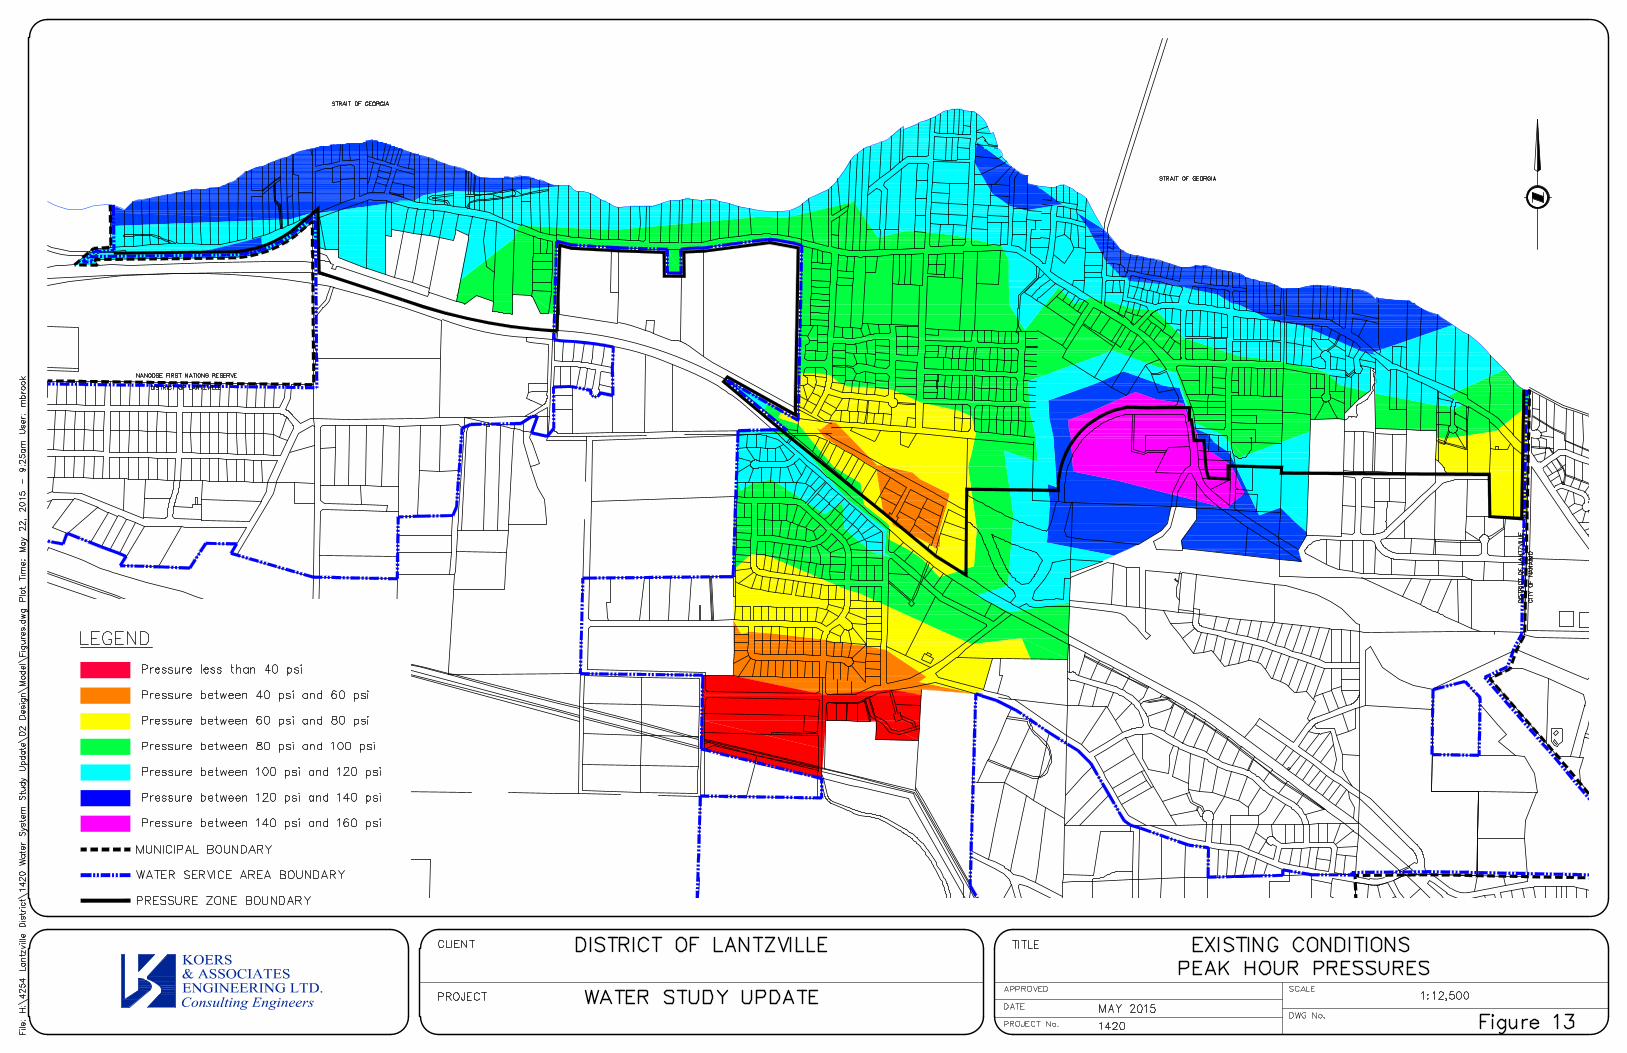
41
District of Lantzville Water Supply & Distribution System Study July 16, 2015
resulting the static pressure increasing from 738 kPa – 820 kPa (107 psi – 119 psi) to 896 kPa – 980 kPa (130 psi – 142 psi). North of the E&N Railway, the highest pressure would be experienced on Lantzville Road, around the PRV. The pressure at St Philips by the Sea Anglican Church (7113 Lantzville Road) would increase to 1,224 kPa (177 psi) from the current 1,064 kPa (154 psi). Relocation of the PRV on Lantzville Road to around the 54 m geodetic elevation on Ware Road, which is approximately 110 m north of Hwy 19, would address this issue as discussed in greater detail in the section below. Relocation of the PRV was recommended in the 2002 water study. An increase in operating pressure will result in an increase in system leakage, which follows a linear relationship, i.e., a 1% increase in system pressure results in a 1% increase in system leakage. It can be expected that a pressure increase would also result in an increase in the number of main breaks, especially on the aging AC mains. The pressure class rating of the AC mains is not known but it is assumed they would be the more common 1,035 kPa (150 psi) and not the less common 689 kPa (100 psi). ii) Pressures Greater than Maximum Design Standard Pressures above the recommended design standard of 1,035 kPa (150 psi) occur on properties below an elevation of 38 m geodetic. These encompass the majority of the proposed Village (Ware Rd) development properties. These lands, when developed, should be serviced from the Lower Pressure Zone, which is fed from the Ware Road reservoir. On this pressure zone, the maximum pressure on the property would range from 365 kPa (53 psi) at the Ware Road/Hwy 19 intersection to 659 kPa (96 psi) at Ware Road/Lantzville Road intersection. The highest static pressure occurs at the PRV station on Lantzville Rd just south of Ware Road intersection, where a pressure of approximately 1,107 kPa occurs (160 psi). If the top water level of the Aulds Road reservoir is raised 16.4 m to 160 m geodetic, in order to provide a minimum operating pressure of 207 kPa (40 psi) to all properties at the top end of Aulds and Harwood Road, the pressure at the PRV station will increase by 160 kPa (23 psi). This would create a maximum pressure of 183 psi at the PRV station, which is greater than the recommended maximum design pressure of 1,034 kPa (150 psi), but may be within the design tolerances of ductile iron. Further study would be needed to determine the phasing and design requirements to implement both improvements. Those properties along Lantzville Road south of Ware Road intersection are presently serviced by the Upper Pressure zone. Relocating the PRV station as noted above would result in these properties being switched over onto the Lower Pressure zone, which can provide the 275 kPa (40 psi) minimum acceptable design pressure to properties below the 69 m geodetic elevation. This covers all properties in the area except for the following properties above 69 m geodetic and which are presently not connected to the DoL water system because there are no watermains along these roads:
6 undeveloped properties along Lantzville Road southeast of Owen Road,
15 properties on Rosalyn Crescent and Wayne Place, and
2 properties on Schook Road.
If these properties are to be serviced by the DoL water system, they would either need to be serviced from the Upper Pressure Zone, possibly from the potential interconnection line from the Nanaimo system on Dover Road, or from a new localized pressure zone with the construction of a booster pump station fed from the Lower Pressure system.
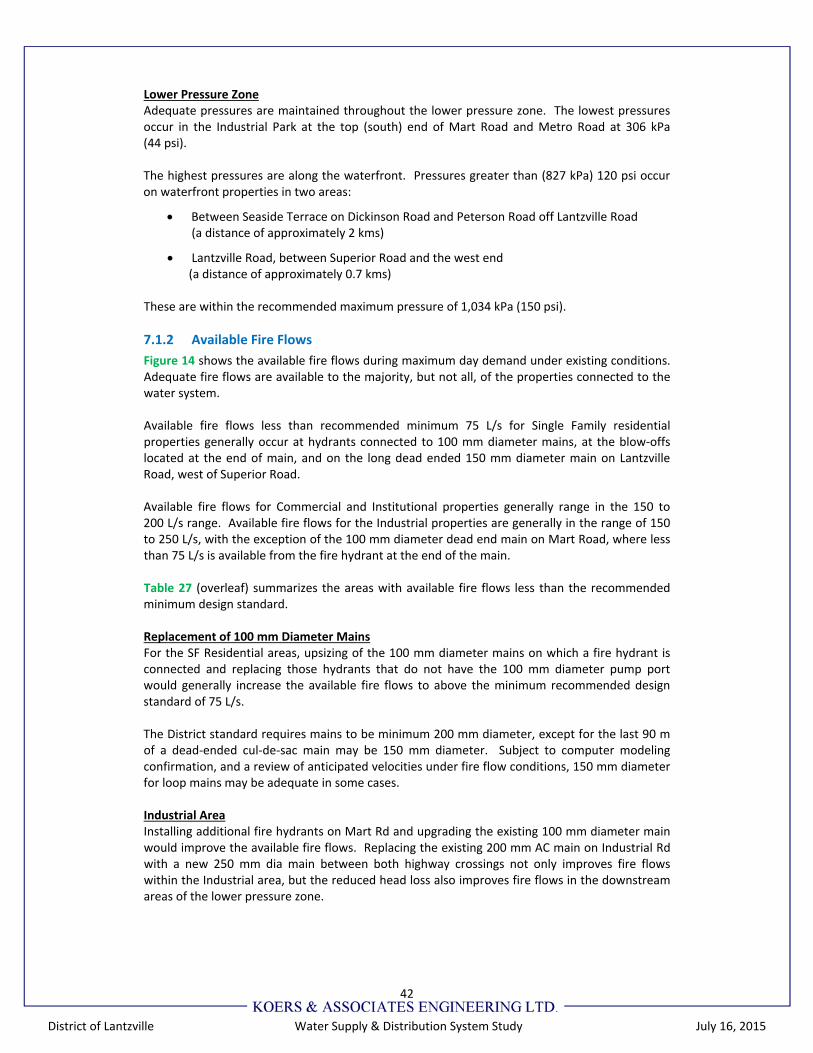
42
District of Lantzville Water Supply & Distribution System Study July 16, 2015
Lower Pressure Zone Adequate pressures are maintained throughout the lower pressure zone. The lowest pressures occur in the Industrial Park at the top (south) end of Mart Road and Metro Road at 306 kPa (44 psi). The highest pressures are along the waterfront. Pressures greater than (827 kPa) 120 psi occur on waterfront properties in two areas:
Between Seaside Terrace on Dickinson Road and Peterson Road off Lantzville Road (a distance of approximately 2 kms)
Lantzville Road, between Superior Road and the west end (a distance of approximately 0.7 kms)
These are within the recommended maximum pressure of 1,034 kPa (150 psi).
7.1.2 Available Fire Flows
Figure 14 shows the available fire flows during maximum day demand under existing conditions. Adequate fire flows are available to the majority, but not all, of the properties connected to the water system. Available fire flows less than recommended minimum 75 L/s for Single Family residential properties generally occur at hydrants connected to 100 mm diameter mains, at the blow‐offs located at the end of main, and on the long dead ended 150 mm diameter main on Lantzville Road, west of Superior Road. Available fire flows for Commercial and Institutional properties generally range in the 150 to 200 L/s range. Available fire flows for the Industrial properties are generally in the range of 150 to 250 L/s, with the exception of the 100 mm diameter dead end main on Mart Road, where less than 75 L/s is available from the fire hydrant at the end of the main. Table 27 (overleaf) summarizes the areas with available fire flows less than the recommended minimum design standard. Replacement of 100 mm Diameter Mains For the SF Residential areas, upsizing of the 100 mm diameter mains on which a fire hydrant is connected and replacing those hydrants that do not have the 100 mm diameter pump port would generally increase the available fire flows to above the minimum recommended design standard of 75 L/s. The District standard requires mains to be minimum 200 mm diameter, except for the last 90 m of a dead‐ended cul‐de‐sac main may be 150 mm diameter. Subject to computer modeling confirmation, and a review of anticipated velocities under fire flow conditions, 150 mm diameter for loop mains may be adequate in some cases. Industrial Area Installing additional fire hydrants on Mart Rd and upgrading the existing 100 mm diameter main would improve the available fire flows. Replacing the existing 200 mm AC main on Industrial Rd with a new 250 mm dia main between both highway crossings not only improves fire flows within the Industrial area, but the reduced head loss also improves fire flows in the downstream areas of the lower pressure zone.
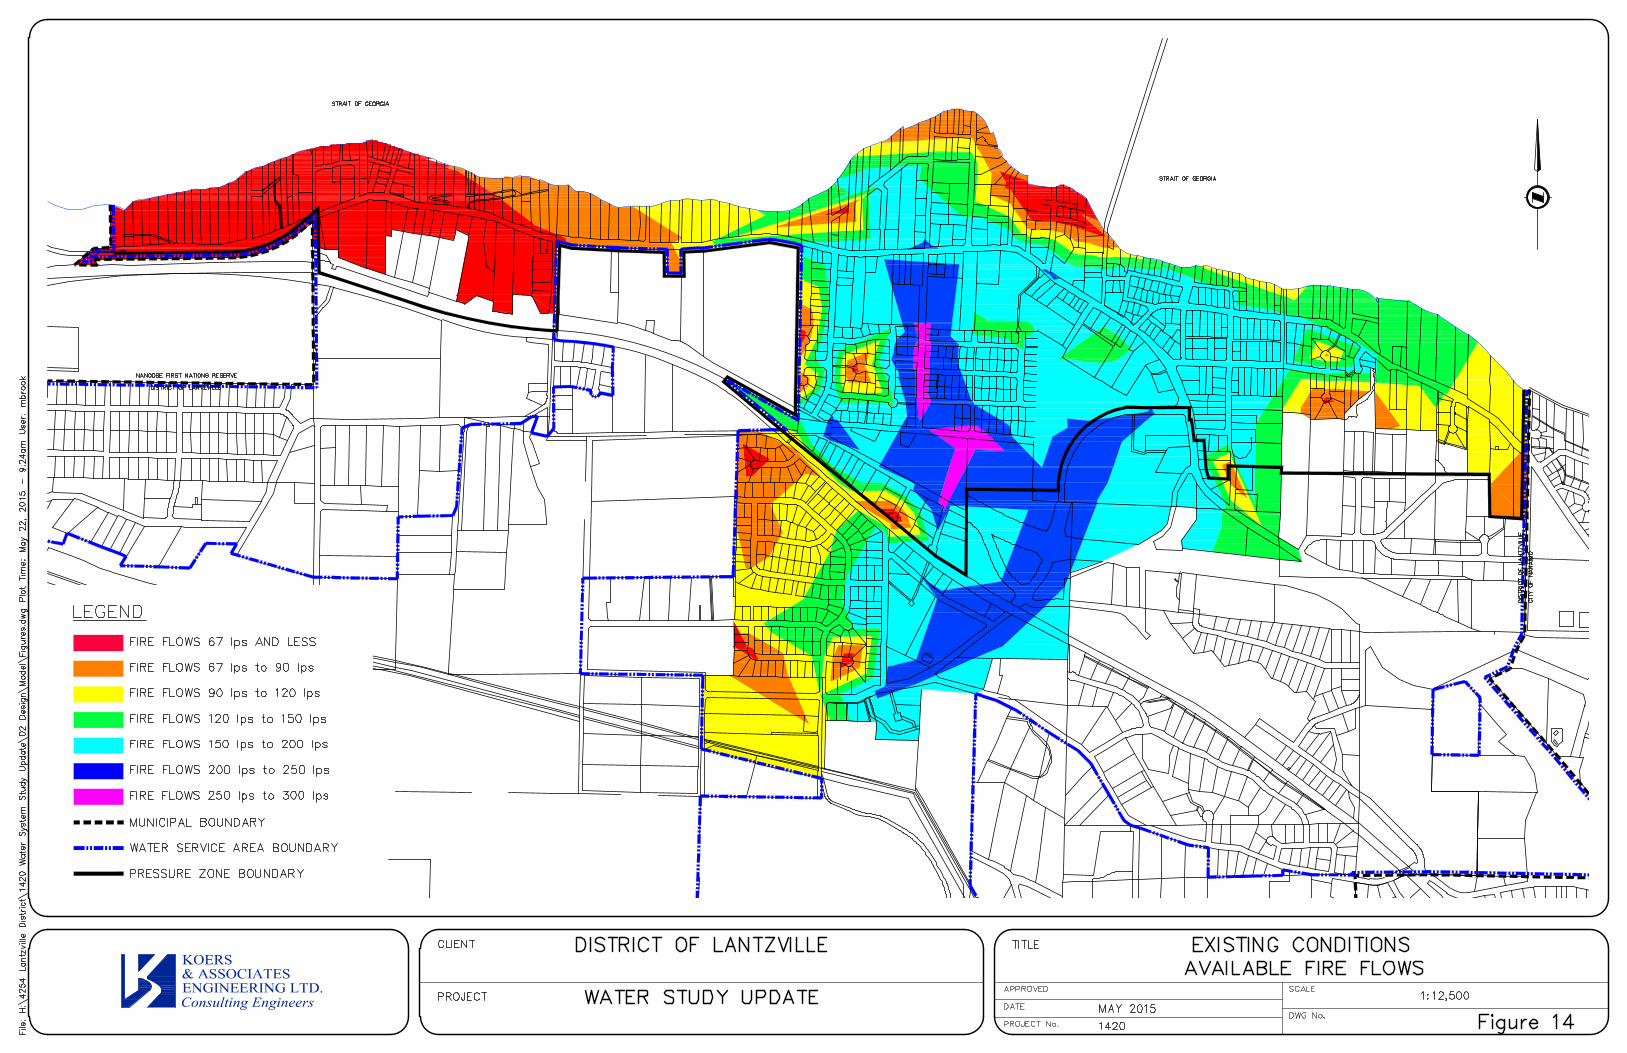
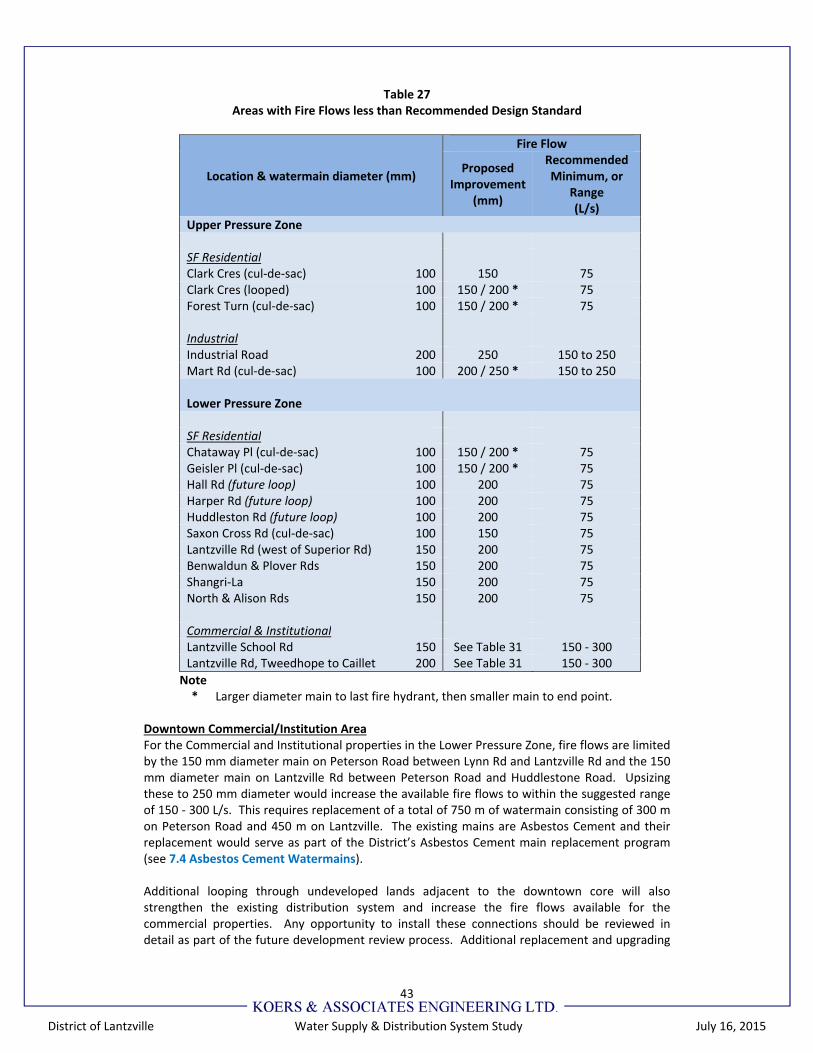
43
District of Lantzville Water Supply & Distribution System Study July 16, 2015
Table 27 Areas with Fire Flows less than Recommended Design Standard
Location & watermain diameter (mm)
Fire Flow
Proposed Improvement
(mm)
Recommended Minimum, or
Range (L/s)
Upper Pressure Zone SF Residential Clark Cres (cul‐de‐sac) 100 150 75 Clark Cres (looped) 100 150 / 200 * 75 Forest Turn (cul‐de‐sac) 100 150 / 200 * 75 Industrial
Industrial Road 200 250 150 to 250 Mart Rd (cul‐de‐sac) 100 200 / 250 * 150 to 250 Lower Pressure Zone SF Residential Chataway Pl (cul‐de‐sac) 100 150 / 200 * 75 Geisler Pl (cul‐de‐sac) 100 150 / 200 * 75 Hall Rd (future loop) 100 200 75 Harper Rd (future loop) 100 200 75 Huddleston Rd (future loop) 100 200 75 Saxon Cross Rd (cul‐de‐sac) 100 150 75 Lantzville Rd (west of Superior Rd) 150 200 75 Benwaldun & Plover Rds 150 200 75 Shangri‐La 150 200 75 North & Alison Rds 150 200 75 Commercial & Institutional Lantzville School Rd 150 See Table 31 150 ‐ 300 Lantzville Rd, Tweedhope to Caillet 200 See Table 31 150 ‐ 300
Note * Larger diameter main to last fire hydrant, then smaller main to end point.
Downtown Commercial/Institution Area For the Commercial and Institutional properties in the Lower Pressure Zone, fire flows are limited by the 150 mm diameter main on Peterson Road between Lynn Rd and Lantzville Rd and the 150 mm diameter main on Lantzville Rd between Peterson Road and Huddlestone Road. Upsizing these to 250 mm diameter would increase the available fire flows to within the suggested range of 150 ‐ 300 L/s. This requires replacement of a total of 750 m of watermain consisting of 300 m on Peterson Road and 450 m on Lantzville. The existing mains are Asbestos Cement and their replacement would serve as part of the District’s Asbestos Cement main replacement program (see 7.4 Asbestos Cement Watermains). Additional looping through undeveloped lands adjacent to the downtown core will also strengthen the existing distribution system and increase the fire flows available for the commercial properties. Any opportunity to install these connections should be reviewed in detail as part of the future development review process. Additional replacement and upgrading
44
District of Lantzville Water Supply & Distribution System Study July 16, 2015
of the existing Asbestos Cement watermains in the upstream areas of the Lower Pressure Zone on Industrial Road, Joy Way, Rossiter, Millard, Lynn and Lancewood Ave will also improve fire flows in the downtown area, especially if looping opportunities through undeveloped lands are not available in the near future. For Lantzville School Rd, the dead end 150 mm diameter main near Seaview Elementary should be upsized to minimum of 250 mm dia, if looping through adjacent lands to the east are not available in the near future. Lantzville Road west of Superior Road Fire flows along Lantzville Road, west of Superior Road are restricted by the 150 mm diameter (Asbestos Cement) main. To provide the recommended minimum of 67 L/s, approximately 1,400 m of main (550 m east of Superior Road and 950 m west of Superior Road) should be upgraded to 200 mm diameter. This project would also serve as part of the District’s Asbestos Cement main replacement program (see 7.4 Asbestos Cement Watermains). Figure 15 shows the available fire flows during maximum day demand after completion of the upgrading works noted in the previous paragraphs.
7.2 RESERVOIR STORAGE
The storage volume requirements for the DoL were calculated using formula presented in 6.3.4 Reservoir Sizing which is based on fire flow and maximum day demand. For smaller municipalities, such as the DoL, the largest factor governing the size of water storage reservoirs is fire storage which varies depending on the design fire flow rate and the duration for which it is applied (see Table 23). Storage requirements were therefore calculated separately for District’s two pressure zones to account for the differing fire demands and the portion of the maximum day demand within each. Storage requirements for existing conditions (2014) and in 25 years (2040). Allowance was made for system expansion to service existing developed properties within the OCP Water Service Area boundary along with allowances for new development.
7.2.1 Upper Pressure Zone (Aulds Rd Reservoir)
Existing Conditions A Fire Storage:
A fire flow of 75 L/s for 2 hours was used based on single family residential land use. This requires a storage volume of 540 m3.
B Peaking Storage:
Calculated at 25% of maximum day demand. The maximum day demand was estimated based on ratio of water service connections in the Upper Pressure Zone compared to the entire system, which equates to 26% (226 ÷ 885). Based on the 2014 maximum day demand of 1,421 m3 for the entire water system, the peaking storage volume requirement for the Aulds Road reservoir is 92 m3.
C Emergency Storage:
Calculated at 25% of (Fire Storage + Peaking Storage). This requires a volume of 158 m3.
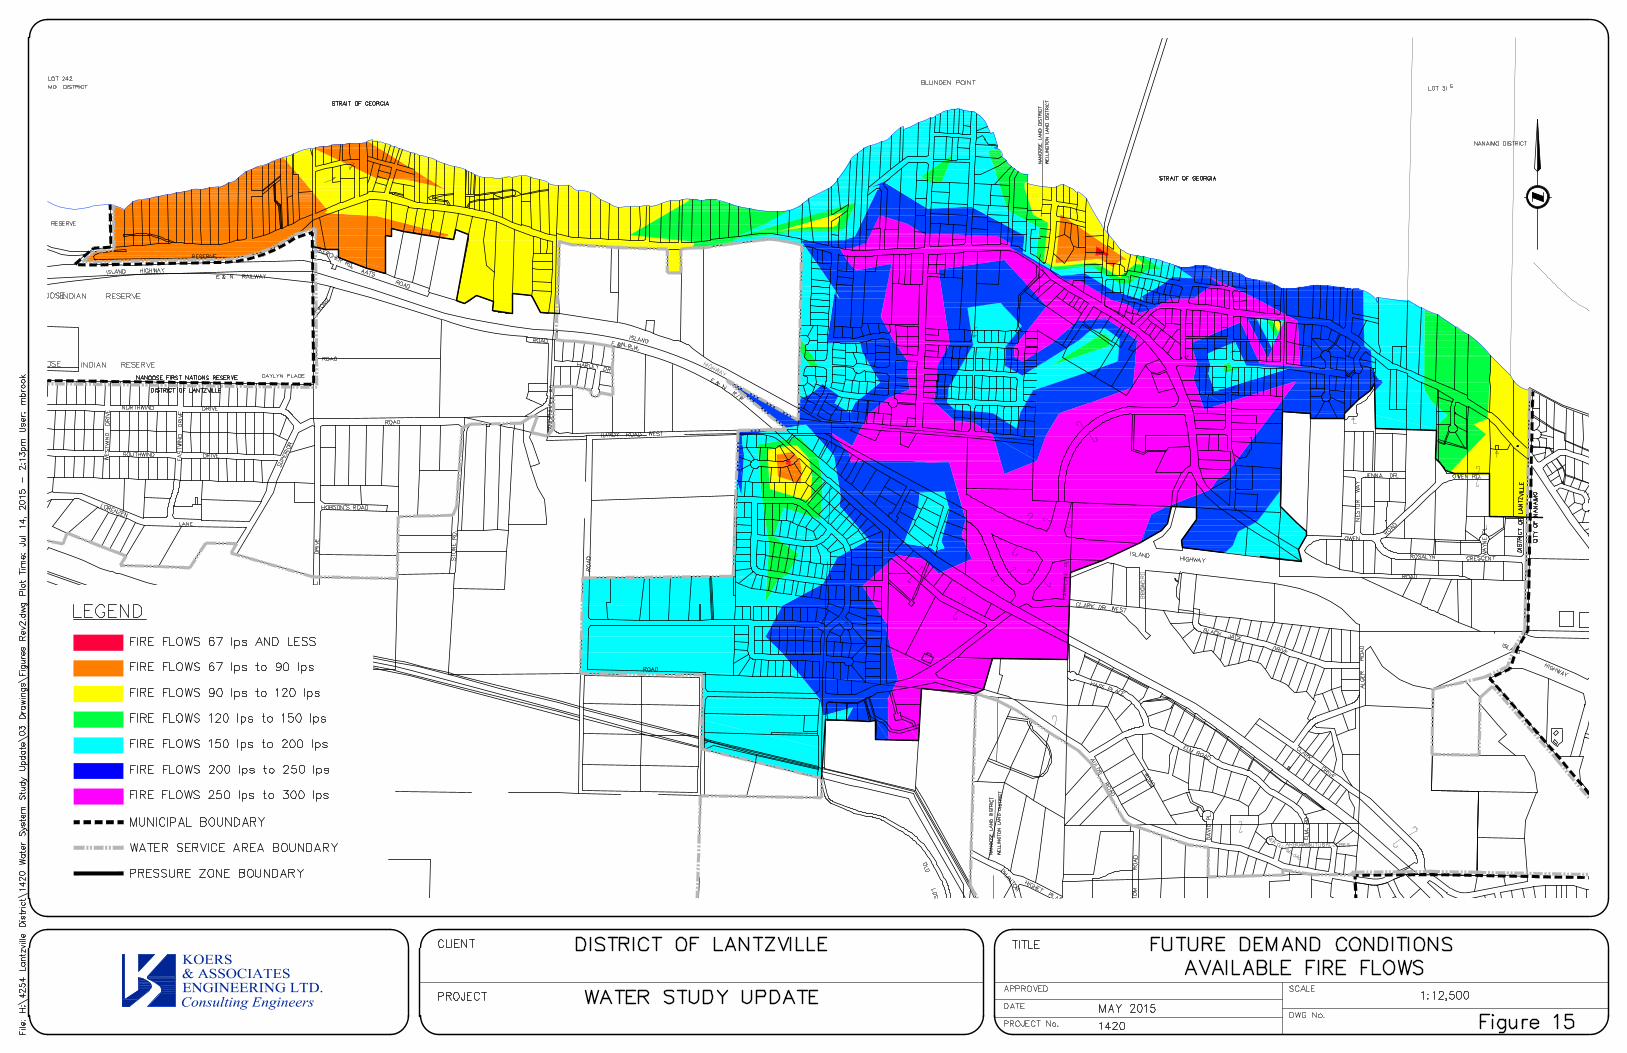
45
District of Lantzville Water Supply & Distribution System Study July 16, 2015
The current storage volume of the Aulds Road reservoir, 240 m3 (53,000 ig), is almost 1/3 the recommended volume of 790 m3 (175,000 ig) as summarized in Table 28. Future Conditions (Year 2040) A Fire Storage:
A fire flow of 75 L/s for 2 hours was used based on single family residential land use. This requires a storage volume of 540 m3.
B Peaking Storage:
Calculated at 25% of maximum day demand. Expansion of the Upper Pressure Zone system to service up to 350 lots over the next 25 years (by Year 2040) was assumed in developing a Year 2040 Maximum Day demand. This number of lots is equivalent to the servicing of those properties shown on Figure 10 that are within the District’s Water Service Area and that should be serviced from the Aulds Road reservoir. These are:
‐ Northwind/Southwind area 190 lots ‐ Aulds/Elm Rd area 80 lots ‐ Clark/Blackjack Rd area 70 lots ‐ Owen Road area 50 lots ‐ Fernmar area 8 lots Total 348 lots
No allowance was made for servicing the Foothills development from the District’s existing water system. It is understood this development (730 lots) will be responsible for development of its own water supply and distribution system. The elevation of the Foothills development will require a separate pressure zone with a reservoir top water level elevation above 200 m geodetic. For the Year 2040 maximum day demand, a low and a high value were used for comparative purposes. The low value was based on the DoL’s Year 2014 Maximum Day demand per lot of 1.61 m3/day (1,421 m3/day ÷ 885 serviced lots). The high value was based on the City of Nanaimo’s 1,135 lpcd and an assumed future DoL population density of 2.2 capita per dwelling, resulting in a maximum day demand of 2.50 m3/day per lot (1,135*2.2). When applied to the total number of existing and future lots (226 + 348 = 574) the resulting required peaking storage volume by Year 2040 is:
low range = 25% * (1.61 m3/day per lot * 574 lots) = 231 m3
high range = 25% * (2.50 m3/day per lot * 574 lots) = 359 m3
C Emergency Storage: Calculated at 25% of (Fire Storage + Peaking Storage).
low range = 25% * (540 m3 + 231 m3) = 193 m3
high range = 25% * (540 m3 + 309 m3) = 213 m3
By 2040, the required storage volume ranges from 964 m3 to 1112 m3 (213,000 ig to 245,000 ig) based on the range of projected maximum day demands. The volume calculations for Year 2014 and 2040 are shown in Table 28.
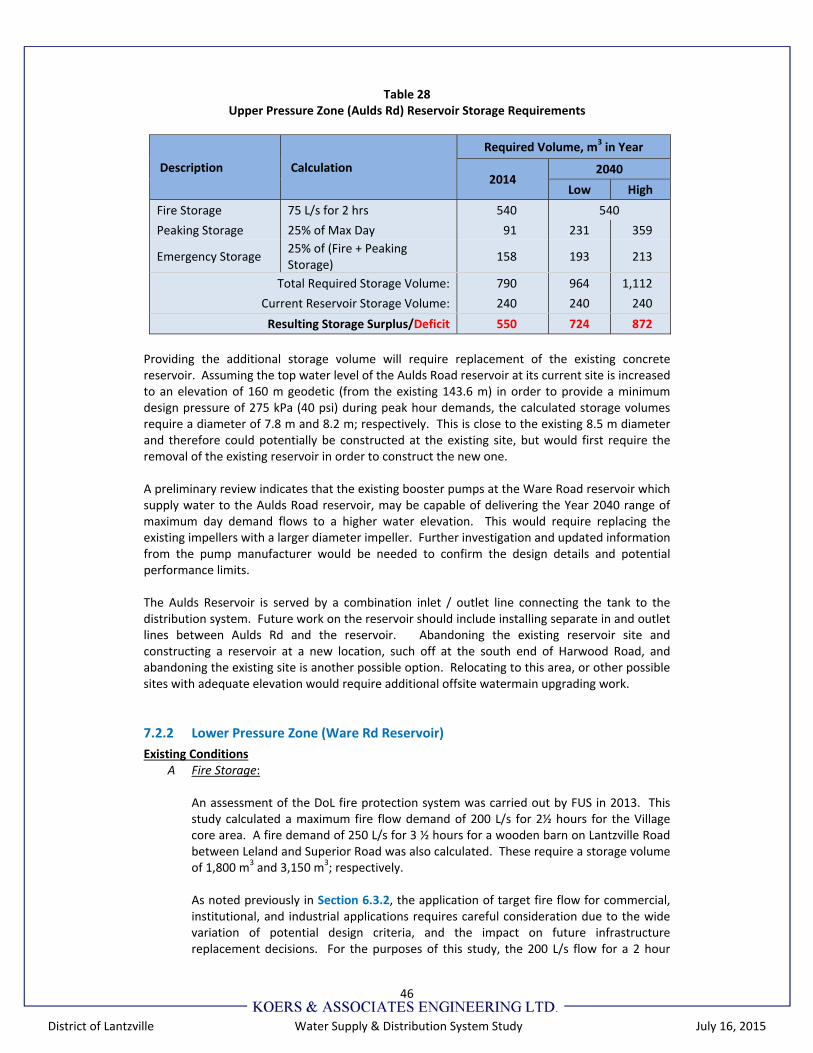
46
District of Lantzville Water Supply & Distribution System Study July 16, 2015
Table 28 Upper Pressure Zone (Aulds Rd) Reservoir Storage Requirements
Description Calculation
Required Volume, m3 in Year
2014 2040
Low High
Fire Storage 75 L/s for 2 hrs 540 540
Peaking Storage 25% of Max Day 91 231 359
Emergency Storage 25% of (Fire + Peaking Storage)
158 193 213
Total Required Storage Volume: 790 964 1,112
Current Reservoir Storage Volume: 240 240 240
Resulting Storage Surplus/Deficit 550 724 872
Providing the additional storage volume will require replacement of the existing concrete reservoir. Assuming the top water level of the Aulds Road reservoir at its current site is increased to an elevation of 160 m geodetic (from the existing 143.6 m) in order to provide a minimum design pressure of 275 kPa (40 psi) during peak hour demands, the calculated storage volumes require a diameter of 7.8 m and 8.2 m; respectively. This is close to the existing 8.5 m diameter and therefore could potentially be constructed at the existing site, but would first require the removal of the existing reservoir in order to construct the new one. A preliminary review indicates that the existing booster pumps at the Ware Road reservoir which supply water to the Aulds Road reservoir, may be capable of delivering the Year 2040 range of maximum day demand flows to a higher water elevation. This would require replacing the existing impellers with a larger diameter impeller. Further investigation and updated information from the pump manufacturer would be needed to confirm the design details and potential performance limits. The Aulds Reservoir is served by a combination inlet / outlet line connecting the tank to the distribution system. Future work on the reservoir should include installing separate in and outlet lines between Aulds Rd and the reservoir. Abandoning the existing reservoir site and constructing a reservoir at a new location, such off at the south end of Harwood Road, and abandoning the existing site is another possible option. Relocating to this area, or other possible sites with adequate elevation would require additional offsite watermain upgrading work.
7.2.2 Lower Pressure Zone (Ware Rd Reservoir)
Existing Conditions A Fire Storage:
An assessment of the DoL fire protection system was carried out by FUS in 2013. This study calculated a maximum fire flow demand of 200 L/s for 2½ hours for the Village core area. A fire demand of 250 L/s for 3 ½ hours for a wooden barn on Lantzville Road between Leland and Superior Road was also calculated. These require a storage volume of 1,800 m3 and 3,150 m3; respectively. As noted previously in Section 6.3.2, the application of target fire flow for commercial, institutional, and industrial applications requires careful consideration due to the wide variation of potential design criteria, and the impact on future infrastructure replacement decisions. For the purposes of this study, the 200 L/s flow for a 2 hour
47
District of Lantzville Water Supply & Distribution System Study July 16, 2015
duration was used as a lower threshold, while the larger 250 L/s flow for a 3 hour duration was used as a higher value, to highlight the range of potential storage requirements. In addition to reviewing its policies to consider the impact of new commercial, institutional and industrial developments on the existing and proposed water system infrastructure requirements, the District should evaluate the current status of these properties, and assess the appropriateness of the FUS design flow criteria. The two potential fire flow storage volumes are 1,440 m3 and 2,700 m3
respectively.
B Peaking Storage: Calculated at 25% of maximum day demand. The maximum day demand was estimated based on ratio of water service connections in the Lower Pressure Zone compared to the entire system, which equates to 74% (659 ÷ 885). Based on the 2014 maximum day demand of 1,421 m3 for the entire water system, the peaking storage volume requirement for the Ware Road reservoir is 264 m3.
C Emergency Storage:
Calculated at 25% of (Fire Storage + Peaking Storage).
low range = 25% * (1,440 m3 + 264 m3) = 426 m3
high range = 25% * (2,700 m3 + 264 m3) = 741 m3 The required storage for existing conditions in the Ware Road Reservoir ranges from 2,130 m3 to 3,705 m3, depending on the selected design criteria. This target range is higher than its current storage volume (1,887 m3), which was sized based on guidelines prevailing at the time. The PRV connection at Ware Road, permits storage in the Upper Zone reservoir to augment fire flows in the Lower Zone during a fire event. Thus capacity in the Upper Zone can be credited towards Lower Zone storage requirements. Consideration can be given to increasing the size of the Upper Zone Reservoir to offset or potentially delay future improvements to the Lower Zone Reservoir. Upgrading of the Upper Zone reservoir was recommended in the 2002 study.
Table 29 presents a summary of the reservoir storage requirements for Year 2014 based on various fire flow demand ranges Future Conditions (Year 2040)
A Fire Storage: A similar fire flow target range of 200 L/s for 2 hours and 250 L/s for 3 hours was used. This required a fire storage volume range from (1,440 m3 to 2,700 m3. Further discussion with the District is required to select appropriate targets for planning purposes.
B Peaking Storage:
Calculated at 25% of maximum day demand. Expansion of the Lower Pressure Zone system to service an additional 273 lots over the next 25 years (by Year 2040) was assumed in developing a Year 2040 Maximum Day demand. This allows for the servicing of the existing 43 properties in the Bayview Park/Rumming/Sabre Rd area, at the west end of the District, plus an additional 230 new lots corresponding to the number of lots that may be developed by the Village (Ware Rd) development. Both of these areas are within the District’s Water Service Area and are shown on Figure 10.
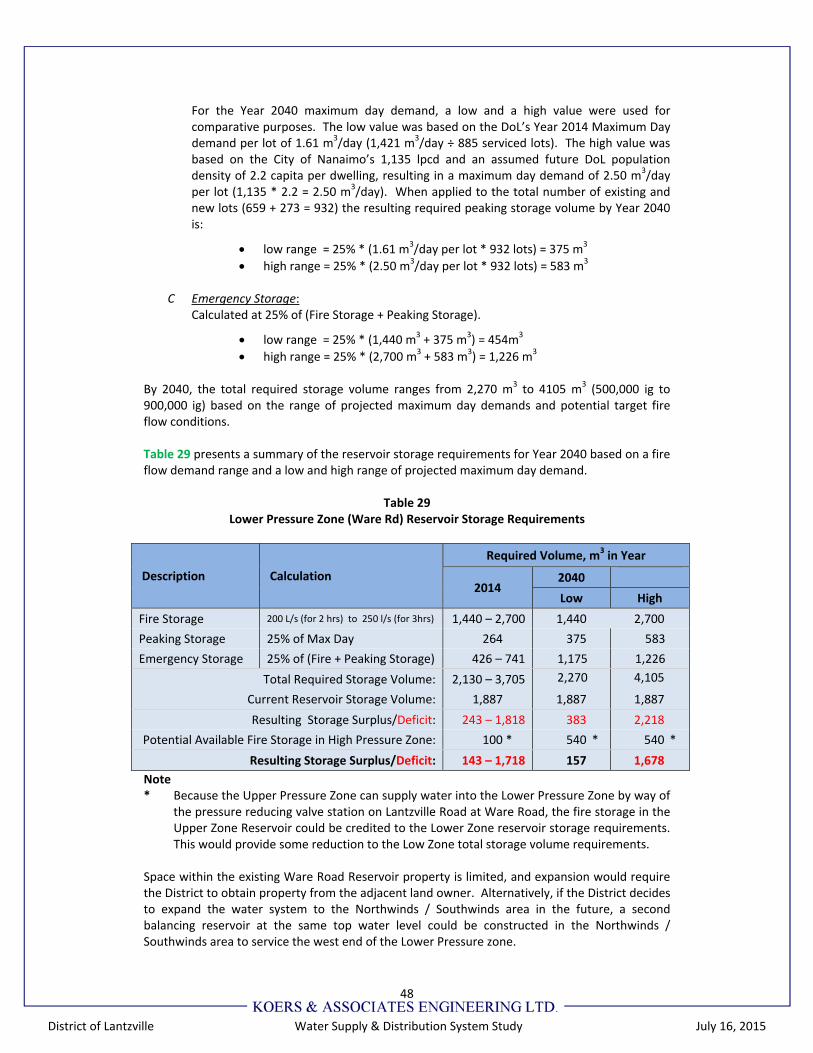
48
District of Lantzville Water Supply & Distribution System Study July 16, 2015
For the Year 2040 maximum day demand, a low and a high value were used for comparative purposes. The low value was based on the DoL’s Year 2014 Maximum Day demand per lot of 1.61 m3/day (1,421 m3/day ÷ 885 serviced lots). The high value was based on the City of Nanaimo’s 1,135 lpcd and an assumed future DoL population density of 2.2 capita per dwelling, resulting in a maximum day demand of 2.50 m3/day per lot (1,135 * 2.2 = 2.50 m3/day). When applied to the total number of existing and new lots (659 + 273 = 932) the resulting required peaking storage volume by Year 2040 is:
low range = 25% * (1.61 m3/day per lot * 932 lots) = 375 m3
high range = 25% * (2.50 m3/day per lot * 932 lots) = 583 m3 C Emergency Storage:
Calculated at 25% of (Fire Storage + Peaking Storage).
low range = 25% * (1,440 m3 + 375 m3) = 454m3
high range = 25% * (2,700 m3 + 583 m3) = 1,226 m3 By 2040, the total required storage volume ranges from 2,270 m3 to 4105 m3 (500,000 ig to 900,000 ig) based on the range of projected maximum day demands and potential target fire flow conditions. Table 29 presents a summary of the reservoir storage requirements for Year 2040 based on a fire flow demand range and a low and high range of projected maximum day demand.
Table 29 Lower Pressure Zone (Ware Rd) Reservoir Storage Requirements
Description Calculation
Required Volume, m3 in Year
2014 2040
Low High
Fire Storage 200 L/s (for 2 hrs) to 250 l/s (for 3hrs) 1,440 – 2,700 1,440 2,700
Peaking Storage 25% of Max Day 264 375 583
Emergency Storage 25% of (Fire + Peaking Storage) 426 – 741 1,175 1,226
Total Required Storage Volume: 2,130 – 3,705 2,270 4,105
Current Reservoir Storage Volume: 1,887 1,887 1,887
Resulting Storage Surplus/Deficit: 243 – 1,818 383 2,218
Potential Available Fire Storage in High Pressure Zone: 100 * 540 * 540 *
Resulting Storage Surplus/Deficit: 143 – 1,718 157 1,678
Note * Because the Upper Pressure Zone can supply water into the Lower Pressure Zone by way of
the pressure reducing valve station on Lantzville Road at Ware Road, the fire storage in the Upper Zone Reservoir could be credited to the Lower Zone reservoir storage requirements. This would provide some reduction to the Low Zone total storage volume requirements.
Space within the existing Ware Road Reservoir property is limited, and expansion would require the District to obtain property from the adjacent land owner. Alternatively, if the District decides to expand the water system to the Northwinds / Southwinds area in the future, a second balancing reservoir at the same top water level could be constructed in the Northwinds / Southwinds area to service the west end of the Lower Pressure zone.
49
District of Lantzville Water Supply & Distribution System Study July 16, 2015
7.3 NORTHWIND/SOUTHWIND AREA SERVICING
The ground elevation of the properties in the Northwind/Southwind roads area are such that the area cannot be serviced from the Lower Pressure Zone but can be serviced from the Upper Pressure Zone. This can be achieved by installing a new main on Harby Road West, Vandenhoek Road and Superior Road along with mains on Northwind Road and Southwind Road with cross ties on Eastwind Road and Westwind Road. Based on the single family residential land‐use of the area, a design fire flow of 75 L/s is anticipated. Providing this flow will require upgrading to a minimum 300 mm diameter, the 120 m of 200 mm diameter main from the Aulds Road Reservoir to Aulds Road and the upgrading of 1,100 m of 150 mm diameter main along Phillip Road and Harby Road West. This is in addition to the installation of 1,700 m of 300 mm of new main along Harby Road West, Vandenhoek Road, and Superior Road, and the installation of 200 mm diameter mains along Northwind, Southwind, Eastwind and Westwind drives. The storage capacity of the Aulds Road reservoir must also be increased, along with offsite improvements to separate the inlet and outlet mains at the reservoir. The extension of the mains to this area can also serve to strengthen the Lower Pressure zone distribution system and improve fire flows on Superior Road and on Lantzville Road west of Superior Road by connecting the two zones together along Superior Road. A Pressure Reducing Valve station (PRV) would be installed at the connecting point. The valve would be set as per the existing PRV valve, on Lantzville Road at Ware Road, to open only during a large flow demand. If demands in the Northwind/Southwind area are low and water quality is an issue, a small diameter PRV could also be installed in the station to permit a portion of the daily demands in the Lower Pressure Zone to be met. The proposed works are shown on drawing no. 1420‐01 Existing System and Proposed Works.
7.4 ASBESTOS CEMENT WATERMAINS
As noted in Table 3, there are 27 kilometers of watermain in the DoL, of which more than 15 kilometers (57%) are Asbestos Cement (AC) piping. The use of AC for watermain construction ceased in the 1970’s, indicating these mains are more than 40 years old. The life span of AC mains ranges from 30 to 90 years, depending on many factors, such as: water quality; type of soils; groundwater levels; pipe manufacturer; quality of installation; bedding material; depth of bury; and traffic loading. The major problem experienced with AC pipe, other than wall fractures, is the leaching of the cement mortar binder out of the pipe. This can occur on the internal and the external surfaces, severely weakening the pipe strength. The rate of leaching depends on the aggressiveness of the groundwater and potable water in contact with the AC pipe. Leaching can be highly localized, and vary from pipe to pipe. The remaining service life in an AC main can be estimated by a series of laboratory tests. This requires the removal of a section of the watermain. The test results along with records of main and service connection repairs should be used in identifying the most problematic areas and prioritizing the work. During the past six years, the DoL has replaced more than 2,000 metres of AC main, as part of an AC main replacement and fire flow improvement program. The sections of watermain that have been replaced since 2010 are listed in Table 30.
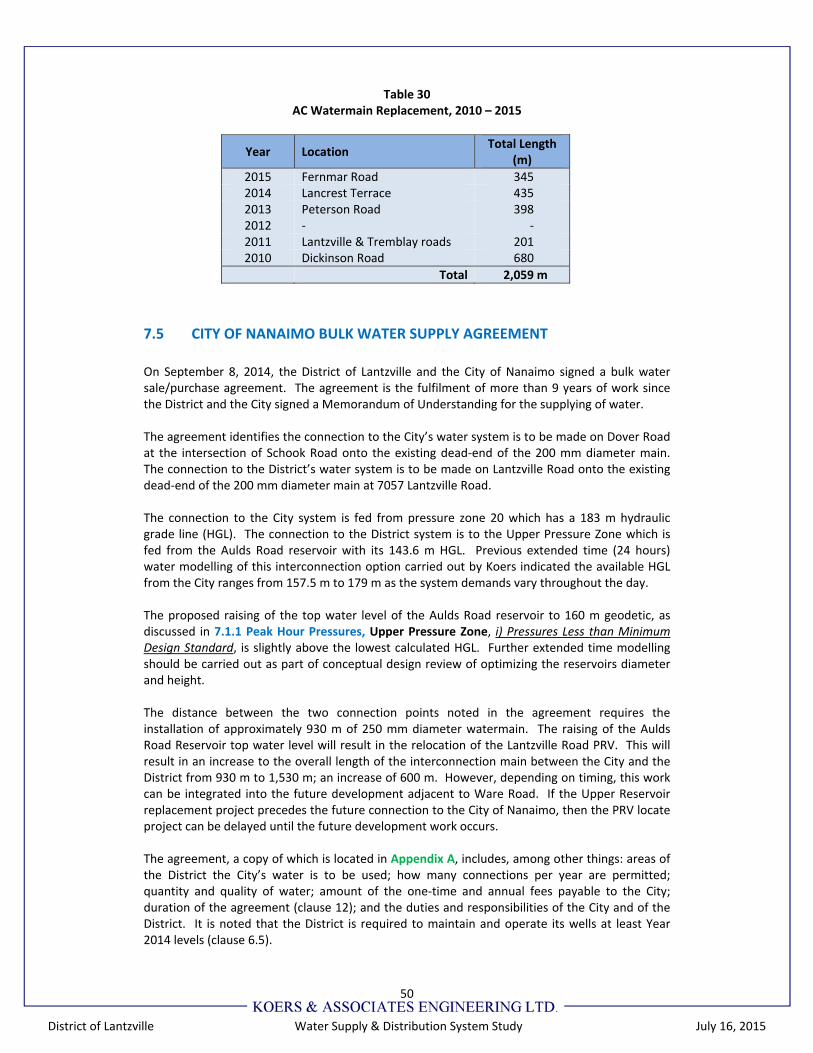
50
District of Lantzville Water Supply & Distribution System Study July 16, 2015
Table 30 AC Watermain Replacement, 2010 – 2015
Year Location Total Length
(m)
2015 Fernmar Road 3452014 Lancrest Terrace 4352013 Peterson Road 3982012 ‐ ‐2011 Lantzville & Tremblay roads 2012010 Dickinson Road 680
Total 2,059 m
7.5 CITY OF NANAIMO BULK WATER SUPPLY AGREEMENT
On September 8, 2014, the District of Lantzville and the City of Nanaimo signed a bulk water sale/purchase agreement. The agreement is the fulfilment of more than 9 years of work since the District and the City signed a Memorandum of Understanding for the supplying of water. The agreement identifies the connection to the City’s water system is to be made on Dover Road at the intersection of Schook Road onto the existing dead‐end of the 200 mm diameter main. The connection to the District’s water system is to be made on Lantzville Road onto the existing dead‐end of the 200 mm diameter main at 7057 Lantzville Road. The connection to the City system is fed from pressure zone 20 which has a 183 m hydraulic grade line (HGL). The connection to the District system is to the Upper Pressure Zone which is fed from the Aulds Road reservoir with its 143.6 m HGL. Previous extended time (24 hours) water modelling of this interconnection option carried out by Koers indicated the available HGL from the City ranges from 157.5 m to 179 m as the system demands vary throughout the day. The proposed raising of the top water level of the Aulds Road reservoir to 160 m geodetic, as discussed in 7.1.1 Peak Hour Pressures, Upper Pressure Zone, i) Pressures Less than Minimum Design Standard, is slightly above the lowest calculated HGL. Further extended time modelling should be carried out as part of conceptual design review of optimizing the reservoirs diameter and height. The distance between the two connection points noted in the agreement requires the installation of approximately 930 m of 250 mm diameter watermain. The raising of the Aulds Road Reservoir top water level will result in the relocation of the Lantzville Road PRV. This will result in an increase to the overall length of the interconnection main between the City and the District from 930 m to 1,530 m; an increase of 600 m. However, depending on timing, this work can be integrated into the future development adjacent to Ware Road. If the Upper Reservoir replacement project precedes the future connection to the City of Nanaimo, then the PRV locate project can be delayed until the future development work occurs. The agreement, a copy of which is located in Appendix A, includes, among other things: areas of the District the City’s water is to be used; how many connections per year are permitted; quantity and quality of water; amount of the one‐time and annual fees payable to the City; duration of the agreement (clause 12); and the duties and responsibilities of the City and of the District. It is noted that the District is required to maintain and operate its wells at least Year 2014 levels (clause 6.5).
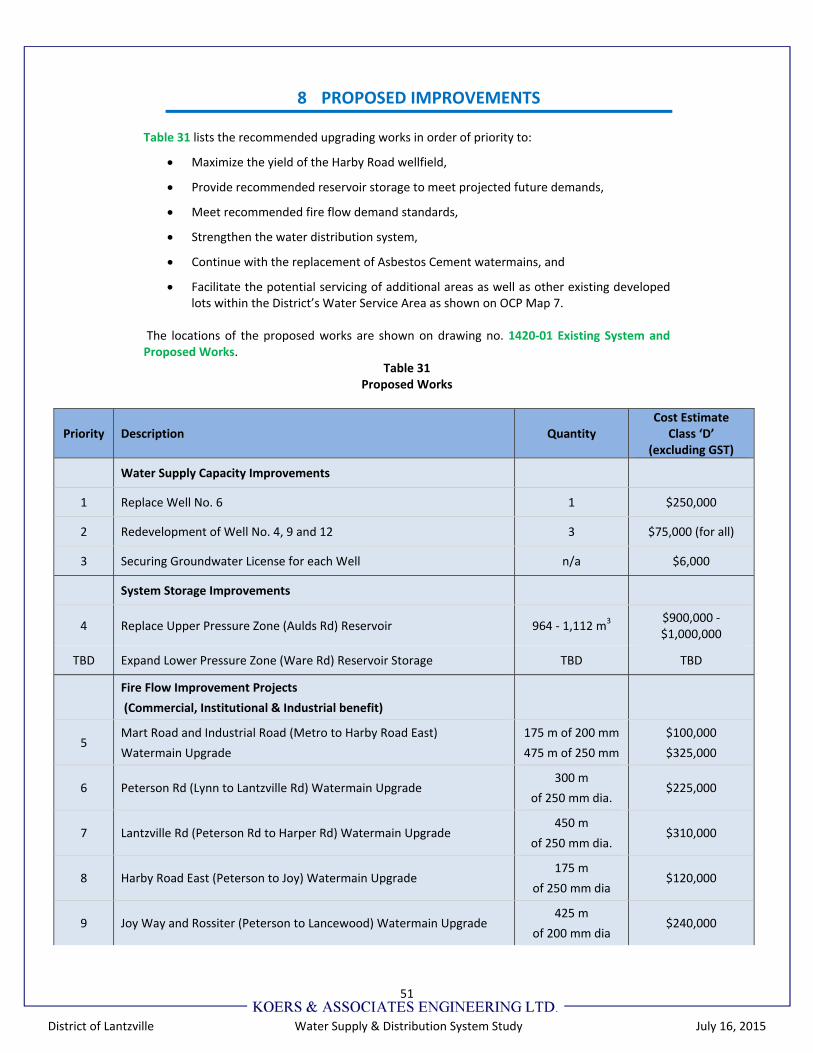
51
District of Lantzville Water Supply & Distribution System Study July 16, 2015
8 PROPOSED IMPROVEMENTS
Table 31 lists the recommended upgrading works in order of priority to:
Maximize the yield of the Harby Road wellfield,
Provide recommended reservoir storage to meet projected future demands,
Meet recommended fire flow demand standards,
Strengthen the water distribution system,
Continue with the replacement of Asbestos Cement watermains, and
Facilitate the potential servicing of additional areas as well as other existing developed lots within the District’s Water Service Area as shown on OCP Map 7.
The locations of the proposed works are shown on drawing no. 1420‐01 Existing System and Proposed Works.
Table 31 Proposed Works
Priority Description Quantity Cost Estimate
Class ‘D’ (excluding GST)
Water Supply Capacity Improvements
1 Replace Well No. 6 1 $250,000
2 Redevelopment of Well No. 4, 9 and 12 3 $75,000 (for all)
3 Securing Groundwater License for each Well n/a $6,000
System Storage Improvements
4 Replace Upper Pressure Zone (Aulds Rd) Reservoir 964 ‐ 1,112 m3 $900,000 ‐ $1,000,000
TBD Expand Lower Pressure Zone (Ware Rd) Reservoir Storage TBD TBD
Fire Flow Improvement Projects
(Commercial, Institutional & Industrial benefit)
5 Mart Road and Industrial Road (Metro to Harby Road East)
Watermain Upgrade
175 m of 200 mm
475 m of 250 mm
$100,000
$325,000
6 Peterson Rd (Lynn to Lantzville Rd) Watermain Upgrade 300 m
of 250 mm dia. $225,000
7 Lantzville Rd (Peterson Rd to Harper Rd) Watermain Upgrade 450 m
of 250 mm dia. $310,000
8 Harby Road East (Peterson to Joy) Watermain Upgrade 175 m
of 250 mm dia $120,000
9 Joy Way and Rossiter (Peterson to Lancewood) Watermain Upgrade 425 m
of 200 mm dia $240,000
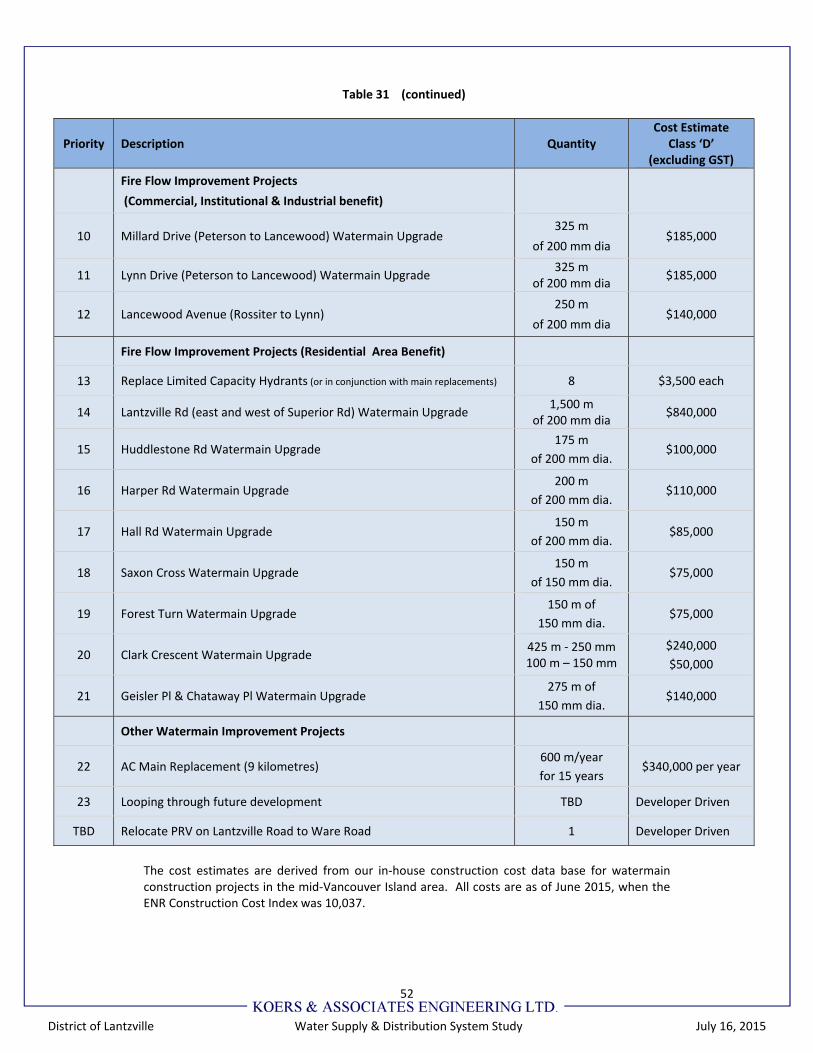
52
District of Lantzville Water Supply & Distribution System Study July 16, 2015
Table 31 (continued)
Priority Description Quantity Cost Estimate
Class ‘D’ (excluding GST)
Fire Flow Improvement Projects
(Commercial, Institutional & Industrial benefit)
10 Millard Drive (Peterson to Lancewood) Watermain Upgrade 325 m
of 200 mm dia $185,000
11 Lynn Drive (Peterson to Lancewood) Watermain Upgrade 325 m
of 200 mm dia $185,000
12 Lancewood Avenue (Rossiter to Lynn) 250 m
of 200 mm dia $140,000
Fire Flow Improvement Projects (Residential Area Benefit)
13 Replace Limited Capacity Hydrants (or in conjunction with main replacements) 8 $3,500 each
14 Lantzville Rd (east and west of Superior Rd) Watermain Upgrade 1,500 m
of 200 mm dia $840,000
15 Huddlestone Rd Watermain Upgrade 175 m
of 200 mm dia. $100,000
16 Harper Rd Watermain Upgrade 200 m
of 200 mm dia. $110,000
17 Hall Rd Watermain Upgrade 150 m
of 200 mm dia. $85,000
18 Saxon Cross Watermain Upgrade 150 m
of 150 mm dia. $75,000
19 Forest Turn Watermain Upgrade 150 m of
150 mm dia. $75,000
20 Clark Crescent Watermain Upgrade 425 m ‐ 250 mm 100 m – 150 mm
$240,000
$50,000
21 Geisler Pl & Chataway Pl Watermain Upgrade 275 m of
150 mm dia. $140,000
Other Watermain Improvement Projects
22 AC Main Replacement (9 kilometres) 600 m/year
for 15 years $340,000 per year
23 Looping through future development TBD Developer Driven
TBD Relocate PRV on Lantzville Road to Ware Road 1 Developer Driven
The cost estimates are derived from our in‐house construction cost data base for watermain construction projects in the mid‐Vancouver Island area. All costs are as of June 2015, when the ENR Construction Cost Index was 10,037.
53
District of Lantzville Water Supply & Distribution System Study July 16, 2015
The cost estimates are based on Class ‘D’ (feasibility study) estimates, made without preliminary design input. The cost estimates include a 25% allowance for legal, construction, financial, administration and engineering costs, with the following exceptions:
Priority 3, Securing Groundwater License for each Well – Only the estimated costs of the provincial government fees are listed with no contingency allowances.
Priority 4 Reservoir Storage Costs – Cost estimates include a contingency allowance of 40%.
A discussion of each project is presented below.
1 Replace Well No. 6 It is proposed that well 6 be replaced with a new well because Lowen Hydrogeology Consulting Ltd. (LHC) have determined the existing well is operating inefficiently and that historical records indicate its pumping rate has been reduced to stop sand from being pumped out with the water.
Its current pumping rate is estimated at 543 m3/day when operating simultaneously with the other pumps. LHC projects the combined pumping rate can be increased to 668 m3/day; an increase of 125 m3/day (23%).
When operated by itself it is expected its pumping rate could be 836 m3/day. 2 Redevelopment of Wells No. 4, 9 and 12 LHC have estimated that the capacity of these well can be increased by re‐development. Presently their simultaneous combined pumping capacity totals 1,484 m3/day. After redevelopment, LHC projects the wells will be able to product a combined total of 1,756 m3/day when operating simultaneously; an increase of 272 m3/day (18%).
Upon completion of redevelopment of Well No. 6 and redevelopment of Wells No, 4, 9 and 12, LHC estimates the production of the wellfield could increase from the current 2,027 m3/day to 2,424 m3/day; an increase of 397 m3/day (397 m3/day).
A budgetary allowance of $25,000 per well has been made for the redevelopment. In general the anticipated work consists of:
removal of the existing pump, motor and piping,
surging of the well to loosen sediment that have migrated into the voids in the gravels and sands around the well screen resulting in a decline in the well pumping capacity,
bailing of the well to remove the sediments loosened by the surging,
re‐instatement of the well pump, motor, and piping, and
testing wells to confirm new individual and simultaneous pumping rates. 3 Securing Groundwater License for each Well The DoL is required to obtain a licence from the provincial government for the extraction of water from the ground as per the Water Sustainability Act that was passed in May 2014.
The DoL will be required to pay a one‐time application fee of $5,000, in addition to an annual rental fee estimated to cost $565 ($2.25 per 1,000 m3). 4 Replace Upper Pressure Zone (Aulds Rd) Reservoir The existing reservoir is undersized to meet existing and Year 2040 storage volume requirements which includes allowances for servicing an additional 348 lots.
54
District of Lantzville Water Supply & Distribution System Study July 16, 2015
The total required storage volume for Year 2040 is estimated to be 741 m3 based on a maximum day demand of 1.61 m3/day per connection and 889 m3 based on a maximum day demand of 2.50 m3/day per connection.
The reservoir site is very limited and cannot accommodate a larger diameter tank.
The current top water level of the reservoir, 143.6 m geodetic, results in a static operating pressure for below the acceptable design minimum of 275 kPa (40 psi) on the approximately 10 properties located at the top (southeast) end of Aulds Road (west of Philip Road) and at the top end of Harwood Drive (south of Aulds Rd).
The cost estimate is based on removal of the existing 8.5 m diameter concrete reservoir (with a top water elevation of 143.6 m) and constructing a new similar diameter reservoir with a top water elevation of 160 m geodetic. Allowances to upgrade the inlet and outlet piping between the reservoir and Aulds Road have also been identified.
5 Mart Road and Industrial Road (Metro to Harby Road East) Watermain Upgrade
Replace 475 m of 200 mm diameter AC main with 250 mm dia and 175 m of AC main with 200 mm dia. This project is proposed in order to improve firefighting capabilities in and around the Village Core area, and along other downstream areas of the lower pressure zone. It will also result in the replacement of 4% of the District’s 15 kilometres m of AC mains. 6 Peterson Rd (Lynn to Lantzville Rd Watermain Upgrade Replace 325 m of 150 mm diameter AC main with 250 mm dia. This project is proposed in order to improve firefighting capabilities in and around the Village Core area, and along Peterson Road and Lantzville Road (east and west of Peterson). It will also result in the replacement of almost 2% of the District’s 15 kilometres m of AC mains. 7 Lantzville Road (Peterson to Harper) Watermain Upgrade Replace 450 m of 150 mm diameter AC main with 250 mm dia. This project is proposed in order to improve firefighting capabilities in and around the Village Core area, and along Lantzville Road (east and west of Peterson). It will also result in the replacement of 3% of the District’s 15 km of AC mains. 8 ‐ 12 Various Watermain Upgrades within the Peterson / Lancewood Area Replace 1,500 m of 100 & 150 mm diameter AC main with 200 / 250 mm dia. These projects are proposed in order to improve downstream firefighting capabilities in and around the Village Core area, and along Lantzville Road (east and west of Peterson). It will also result in the replacement of 10% of the District’s 15 kilometres m of AC mains. 13 Replace Limited Capacity Fire Hydrants It is recommended the District continue with its replacement program of the older fire hydrants that have limited firefighting capabilities. These hydrants have the two 65 mm dia. hose nozzles but are missing the 100 mm dia pumper port nozzle, and generally have only a 100 mm diameter service pipe lead, compared to a 150 mm diameter. The eight hydrants to be replaced are located in the Lower Pressure Zone and are listed in Table 25. Most of the hydrants are in areas identified for improvements elsewhere. If those watermain upgrades are not scheduled in the
55
District of Lantzville Water Supply & Distribution System Study July 16, 2015
near future, then the District should give consideration to replacing these hydrants in advance of the future watermain upgrade project. 14 Lantzville Rd Watermain Upgrade (east and west of Superior Rd) Replace 1,400 m of 150 mm diameter AC main with 200 mm dia. This project is proposed in order to improve firefighting capabilities. It will also result in the replacement of more than 9% of the District’s 15 kilometres of AC mains. 15 ‐ 17 Huddlestone, Hall and Harper Road Watermain Upgrades Replace 525 m of various sections of small diameter AC main with 200 mm dia. These projects are proposed to improve firefighting capabilities to the properties along Huddlestone, Ellesmere, Bayview, Harper, and Hall Road areas. It will also result in the replacement of more than 3% of the District’s AC mains. 18 – 21 Saxon Cross, Forest Turn, Clark, Geisler, and Chataway Pl Watermain Upgrade Replace 1,100 m of small diameter AC main with 150 / 200 mm dia. These projects are proposed to improve firefighting capabilities in various cul‐de‐sac and dead‐end road areas. They will also result in the replacement of 7% of the District’s AC mains. 22 AC Main Replacement It is recommended the District continue with its AC main renewal/replacement program, preferably in advance of any proposed road rehabilitation requirements within the area. With the completion of priorities noted above, there will be approximately 9 kilometres of AC main remaining in the District. A budget of $340,000per year would allow for replacement of all remaining AC pipe over 15 years.
The cost estimate includes allowances for the installation of a new main; tees; valves; hydrants; reconnecting service connections; abandonment of the existing AC main; removal of tees, valves and fittings; backfilling with imported trench backfill; repaving of the trench surface with 50 mm thickness of asphalt; and a 25% allowance for engineering costs and construction contingency allowances. 23 Looping through Future Development There are several locations where future development will offer the ability to construct additional looping within the water system which will serve to strengthen the distribution system and improve fire flows throughout the water service area. The specifics of each potential future improvement should be reviewed in detail by the District during the development review process. (To Be Determined) Relocate PRV on Lantzville Road to Ware Road Relocation of the PRV is required in order to facilitate the development of the lands in the Ware Road – Lantzville Road area. The PRV should be located onto Ware Road at a ground elevation of approximately 54 m geodetic, creating a maximum inlet pressure of 1,035 kPa (150 psi). It is estimated that this ground elevation is located approximately 110 m north of the Hwy 19A intersection.
The PRV outlet to be set at 380 kPa (55 psi) based on a 54 m geodetic ground elevation.

56
District of Lantzville Water Supply & Distribution System Study July 16, 2015
Relocating the PRV will increase the length of the main required for the District of Lantzville to obtain water from the City of Nanaimo. An additional 600 m will be required, increasing the total length from 930 m to 1,530 m. The relocation of the PRV and the extension to the City of Nanaimo supply system should be the developer’s responsibility.
Relocation of the PRV was recommended in the 2002 water study. (TBD) Expand Lower Pressure Zone (Ware Rd) Reservoir Storage Depending on the location and nature of future growth, and the target fire flows selected by the District, additional storage volume in the Lower Pressure Zone will likely be needed.
The total required storage volume for Year 2040 is estimated to be in the 2,300 to 4,100 m3 range, depending on maximum day demand criteria and target commercial flows adopted by the District. Opportunities to expand the existing Ware Road reservoir are limited, and would likely require the District to obtain land from the adjacent owner. Or alternative locations can be reviewed in conjunction with a system expansion review.
57
District of Lantzville Water Supply & Distribution System Study July 16, 2015
9 CONCLUSIONS
Based on the findings of this study, the following conclusions are made: Water Conservation measures adopted by the District in the past are working, and have been successful in managing system demands. Water Supply 1. The District obtains its water from four groundwater wells located off of Harby Road East.
The current pumping rates range from a low of 190 m3/day to a maximum of 728 m3/day. The total capacity of wellfield with all pumps operating simultaneously is 2,027 m3/day.
2. There are presently 10 wells drilled in and around the wellfield area. One is the Ministry of Environment monitoring well #232.
3. The aquifer from which the District obtains its water is labelled #125 by the Ministry of
Environment. 4. Lowen Hydrogeology Consulting Ltd. has estimated the long‐term sustainable yield of the
aquifer at 2,424 m3/day, subject to land use changes in the upstream recharge areas of the aquifer. Accessing this will require redevelopment of wells No. 4, 9 and 12 and replacement of well no 6. The pumping rate of well no. 6 has reportedly been lowered to stop sand from being pumped out with the water.
5. The provincial government’s Water Sustainability Act (Bill 18) was given Royal Assent on May
29, 2014 and will formally replace the current Water Act in 2016. The new act is being implemented in stages because of its complexity. The new act requires the licensing of groundwater wells. Municipalities that have groundwater sources, as Lantzville does, are now required to obtain a water license which includes paying an application fee. There is also an annual water rental fee that the District is required to pay year. The fee is based on the volume of water used.
Water Treatment 6. Water from the wellfield is pumped directly into the Lower Pressure Zone reservoir on Ware
Road. As the water enters the reservoir, it is treated by the addition of sodium hypochlorite. The reservoir provides the required minimum contact time before the treated water enters the water distribution system.
Water Storage & Pressure Zones 7. Water from the Ware Road (Lower Pressure Zone) reservoir is pumped to the Aulds Road
(Upper Pressure Zone) reservoir.
8. The Ware Rd (Lower Zone) reservoir is a rectangular concrete structure with a storage capacity of 1,877 m3 (415,000 ig). The reservoir was built in 2006.
9. The Aulds Road (Upper Zone) reservoir is a circular concrete tank with a storage capacity of
240 m3. The reservoir was built in 1974.
58
District of Lantzville Water Supply & Distribution System Study July 16, 2015
10. A Pressure Reducing Valve station located on Lantzville Rd at Ware Road links the two pressure zones together. The valve is set to open only when there is large demand, such as during a fire, in the Lower Pressure zone.
11. The water distribution system contains more than 27 kilometers of watermain and
885 metered service connections. Over 15 kms of the watermains are Asbestos Cement material and more than 90% of the service connections are for residential properties.
Population Projections 12. The District’s population has remained almost unchanged since its establishment as a
municipality in 2003; 12 years ago. Its 2014 population was estimated by BC Stats to be 3,496. During this same time period, the City of Nanaimo and the City of Parksville populations grew by 15% and 17%; respectively. The District’s lack of growth is believed to be partly in response to the District’s policies and bylaws relating to the capacity concerns of the District’s groundwater supply as well as the limited service area of the municipal sanitary sewer collection system.
13. The OCP allows for growth, but when it will occur is unclear, as it will generally be driven by
market demands. Based on low moderate and high rates of growth (0.5%, 1.0% and 1.5%), the population of the DoL over the next 50 years would increase by 38%, 65% and 110% (990, 2,254, and 3,864 capita); respectively (Figure 2). This would require a total of 450, 1,025 and 1,756 new dwelling units, based on a population density of 2.2 capita per unit (Table 8).
14. There are two large proposed developments in the DoL: the 23 ha Village (Ware Rd)
development and the 730 ha Foothills development. Combined they could accommodate almost all of the projected dwelling units to be constructed over the next 50 years under the moderate growth scenario (960 units vs 1,025 units).
Water Demands – Annual & Monthly 15. The daily volume of water pumped from the wellfield is recorded as it flows into the Ware
Road Reservoir. As the water leaves the reservoir for use in either the Upper and Lower pressure zones is recorded by two meters. A review of the wellfield data compared to the total of the Lower Zone meter plus the Upper Zone meter revealed the wellfield annual volume to be consistently 7.3% lower that the two combined meters. While the discrepancy source is not known, staff suspects it may be a calibration issue with the SCADA system.
16. July and August are the highest demand months. On average, 25% of the total annual
demand occurs during the two summer months of July and August and 40% for the four month period of June through September.
Water Demands – Average Day, Maximum Day & Maximum Week 17. The maximum day demand most often occurs in July or August and is approximately 2 times
the average day demand. 18. In 2014, the average day demand was 687 m3/day. The maximum day demand was
recorded on July 14 and totaled 1,421 m3. The demand over the maximum week (7 days)
59
District of Lantzville Water Supply & Distribution System Study July 16, 2015
averaged 1,227 m3/day for the period July 12 – 18. All of these demands were slightly higher than the demands recorded in 2012 and in 2013.
Water Demands – Per Capita (Per Person) 19. Based on a service population of 2,143 people, the measured DoL per capita demands for
2014 were:
Average day = 321 litres per capita per day (lpcd)
Maximum day = 663 lpcd
Maximum week = 573 lpcd
These demands are lower than 12 other mid Vancouver Island municipalities including its nearest neighbours of the City of Nanaimo and the City of Parksville (Table 11 and 12). Their average and maximum day per capita demands were 540 lpcd and 1,050 lpcd, and 540 lpcd and 1,180 lpcd; respectively.
20. The DoL low per capita demands are suspected to be reflective of the general public’s understanding of the limited capacity of the District’s water supply source and the DoL policy that an additional water supply source(s) is/are required before any new connections can be supplied; including the Foothills and Ware Road developments.
Water Demands – Unaccounted For Water 21. All water services in the DoL are metered. The annual volume of unaccounted for water
ranged from 16% to 24% for the past four years. This unaccounted for water volume is the difference between the sum of the individual meters subtracted from the sum of the upper and lower pressure zone bulk meters, with the bulk meter total being larger than the individual meter total.
22. A review of the unaccounted for water volume on a quarterly basis for the past four years
(Figure 6) revealed that during the first two quarters of the year (Jan – March and April – June), the difference averages around 26%, while for the last two quarters (July –Sept and Oct – Dec), the difference averaged 12%.
Water Demands – By Land‐Use 23. Residential is the largest user group, accounting for more than 90% of the total individual
metered demands. This group also has the largest number of water meters at 840 of the 885 in the system. The average annual demand per connection for the past five years (2010 – 2014) was 214 m3/connection (Table 13).
24. Industrial is the smallest user group, accounting for 1% of the total. There are 18 industrial water meters. The demand per connection for the past four years (2010 – 2013) was 155 m3/connection (Table 13).
25. The highest demand per connection is for Commercial/Residential property at
634 m3/connection. The second highest per connection demand is for Commercial properties at 510 m3/connection. These two user groups account for a total of 2% and 4% of the total individual metered demand (Table 13).
60
District of Lantzville Water Supply & Distribution System Study July 16, 2015
Water Demands – Single Family Largest Users 26. In 2014, the largest Single Family residential land user demand accounted for 0.8% of the
total of individual metered demand. This is more than 6 times the per connection average annual demand. The demand by the two highest residential land users, accounted for 1.4% of the total individual metered demand.
27. Ten percent (10 % or 82 properties) of Single Family residential properties used 21% of the
total individual metered demand (Table 16).
28. Thirty‐five percent (35% or 289 properties) of Single Family residential properties used 50% of the total individual metered demand (Table 16).
Water Demands ‐ Water Service Area 29. The OCP Map 7 – Water Service Area, identifies the ultimate service of the municipal water
system. The purpose of extending the water system to service these properties is to provide potable water for domestic use and water for firefighting. There are presently 441 developed lots yet to be serviced in addition to the Village (Ware Rd) development and the Foothills development which are included in the Water Service Area.
30. The DoL Subdivision and Development Bylaw No. 55, 2005 requires all new properties not
able to connect to the municipal water system to be provided with a water source capable of providing 3.4 m3/day. Based on the DoL population density of 2.46 capita per dwelling, this equates to a per capita demand of 1,380 lpcd. This is very similar to City of Parksville’s per capita maximum day of 1,364 lpcd and slightly higher than the City of Nanaimo’s 1,135 lpcd. In 2014, the DoL maximum day per capita demand was notably lower at 663 lpcd.
31. Dividing the existing rated pumping capacity of the DoL wellfield of 2,037 m3/day by the
capita maximum day demand of 663 lpcd (July 14, 2014) vs 1,380 lpcd (DoL design standard for on‐site wells) and a population density of 2.46 capita per dwelling unit, results in the maximum number of properties that the wellfield may be able to support ranging from a few as 601 properties to a high as 1,265 properties. Presently, there are 885 properties serviced by the wellfield.
32. If the capacity of the wellfield was able to be increased to the estimated long‐term safe yield
of 2,424 m3/day projected by Lowen Hydrogeology Consulting Ltd., the number of lots the wellfield may be able to support ranges from 721 properties to 1,505 properties. While the extrapolated data suggests some, but not all of the additional properties might be able to be serviced by the aquifer if improvements are made to the wellfield, demands will and do vary from year to year. Demands per connection in previous years may not be indicative of future years. Implementing improvements to the wellfield and storage system and testing with a reasonable factor of safety to confirm the results would be prudent before the District considers amending any design standards.
Given the public awareness of the limited capacity of the District’s wellfield and the OCP requirement that new development must develop their own water supply to a standard acceptable to the DoL, servicing new lands from the wellfield could result in increased water usage by the current users, as the perception of the need for water conservation could decrease.
61
District of Lantzville Water Supply & Distribution System Study July 16, 2015
Design Fire Flows 33. The DoL requires fire flows demand calculations to be done in accordance with the Fire
Underwriters Survey (FUS). The demand requirements will vary, depending on the building design, the floor area, the number of stories, the construction materials, the permitted distance from adjacent buildings (existing and future), and whether a fire sprinkler system is installed.
34. For single family residential properties, a minimum design fire flow of 75 L/s is consistent with other nearby local jurisdictions with similar housing styles. For Commercial, Industrial and Institutional uses, the range of design fire flows can vary greatly depending on a variety of factors.
Fire Hydrants 35. Fire hydrants should be equipped with three nozzles, including one 100 mm diameter pump
nozzle. The District has been replacing the old fire hydrants that have only two hose nozzles, both 65 mm diameter. There are eight hydrants yet to be replaced; all in the Lower Pressure zone.
36. The DoL maximum spacing for fire hydrants is 150 m, with every home to be located within 120 m of a hydrant. The FUS recommends differing spacing based on land‐use. For Multi‐Family, Commercial, Industrial and Institutional, a maximum of 90 m is recommended, and subject to building code requirements regulating the distance between the building’s sprinkler system connection point and the closet hydrant.
Reservoir Storage Volume 37. Reservoirs should be sized to include storage for:
Firefighting,
Emergencies (such as watermain break), and
Equalization to manage hourly peaks. 38. The Upper Zone reservoir (Aulds Rd) with its storage capacity of 240 m3 (53,000 ig) is
undersized to meet existing conditions design criteria. To meet projected demands over the next 25 years (to Year 2040), a total storage volume between 964m3 and 1,112 m3 will be needed. This includes a storage allowance for a fire flow of 75 L/s for 2 hours and the servicing of 348 additional lots. Increasing the size of this reservoir may offset and potentially delay storage improvements needed in the Lower Zone.
39. The Lower Zone reservoir (Ware Rd) has a storage capacity of 1,887 m3 (415,000 ig). The
expanded storage will be driven by the target fire flows the District adopts for its commercial, industrial, and institutional properties. Accommodating future expansion at the existing site will be difficult, but opportunities to increase storage at the higher elevation reservoir, or at future balancing reservoirs within the District can be explored in further detail.
62
District of Lantzville Water Supply & Distribution System Study July 16, 2015
Pressures during Peak Hour Demands
40. During peak hour demands, pressures throughout the system meet the minimum design standard of 275 kPa (40 psi) with the exception of 10 properties at the top end of Aulds and Harwood roads. The lowest pressure is estimated to be 207 kPa (30 psi) or less at the home at 6671 Harwood Rd.
41. Raising the top water level of the Upper Pressure Zone (Aulds Road) reservoir by 16.4 m, to
160 m geodetic, would provide the 275 kPa (40 psi) minimum design standard pressure. As a result of the increase in pressure, the PRV station on Lantzville Road just south of Ware Rd, would need to be reviewed.
42. If Lantzville Projects proceeds with the Village development on Ware Road, then the PRV will
need to be re‐located (or replaced) at the 54 m geodetic elevation, approximately 110 m north of Hwy 19, in order to not exceed the recommended maximum design pressure of 1,035 kPa (150 psi) for this development.
43. Relocating the Lantzville Road PRV to Ware Road will result in the increasing the length of
the watermain required to connect the District of Lantzville to the City of Nanaimo as part of the water supply agreement. The length of the 250 mm diameter main will increase by approximately 600 m, from 930 m to 1,530 m, and should be included in the developer’s scope of work.
44. Properties in the Lower Pressure Zone are provided the minimum design standard pressure
of 275 kPa (40 psi) during maximum day demands. The existing maximum pressure is approximately 952 kPa (138 psi) at sea level.
Available Fire Flows 45. Fire flows less than the recommended 75 L/s for single family residential occurs in a few
areas of the Upper Pressure Zone. Replacement of the small diameter mains with larger diameter mains would resolve this.
46. Fire flows less than the recommended 75 L/s for single family residential occurs along Lantzville Road, west of Superior Road. Replacement of the existing smaller diameter mains larger diameter mains would resolve this.
47. Available Fire flows within the range of 150 L/s to200 L/s for the Commercial and
Institutional properties occur in the downtown core area of the Lower Pressure Zone. Various upgrade and looping projects within the Lower Pressure Zone are expected to improve firefighting capability and eventually provide flows in the 250 L/s to300 L/s range.
48. Upgrading of the 100 mm diameter dead‐ended main on Mart Road to 200 mm diameter
would increase the available fire flows to the recommended minimum of 200 L/s for Industrial properties. A fire hydrant should be installed mid‐block.
49. Servicing of the properties in the Northwind/Southwind area requires extension of the High
Pressure Zone distribution system and expansion of the storage capacity of the Aulds Road reservoir. To provide adequate fire flows, a 300 mm diameter main would be required from the proposed reservoir to Southwind Road. This improvement would include replacement of 1,800 m of existing mains on Phillip Road and Harby Road West.

63
District of Lantzville Water Supply & Distribution System Study July 16, 2015
50. Almost 60% of the District’s watermains are made of Asbestos Cement. The majority are over 40 years old. The life span of AC mains ranges from 30 to 90 years. The District has for each of the past several years replaced sections of the AC mains as funds become available.
General 51. Prevailing science on climate change indicates that the local Vancouver Island region will
experience drier summers and wetter winters in the foreseeable future, and other local municipal governments are taking these factors into consideration when developing their long range infrastructure improvement plans.
64
District of Lantzville Water Supply & Distribution System Study July 16, 2015
10 RECOMMENDATIONS
Based on the conclusions listed in this report, it is recommended that the District: 1. Apply for and secure a groundwater licence from the provincial government.
2. Adopt the system improvement projects listed in Table 31. 3. Upgrade the wellfield to improve the yield from the aquifer, and target the long‐term safe
yield of 2,424 m3/day calculated by Lowen Hydrogeology Consulting Ltd. by redeveloping well nos, 4, 9 and 12 and carrying out detailed design and construction of a replacement for well no 6.
4. Monitor, test and evaluate the effectiveness of the wellfield improvements to confirm if the
target safe water yield is being delivered to the system.
5. Monitor, test and evaluate the impacts of the new wellfield improvement on the aquifer to determine if aquifer levels are being maintained in a sustainable fashion.
6. Review land use activities within the aquifer recharge zone to mitigate potential impacts.
Require that a professional hydrogeologist assess the impacts of any proposed development within this area. Maintain and update the low‐impact development standards where warranted.
7. Increase the storage capacity of the Upper Pressure Zone reservoir. Raise the top water level of the Upper Pressure Zone reservoir to 160 m from the current 143.6 m and evaluate the impact on the existing PRV station location on Lantzville Road just south of Ware Road.
8. Implement well field improvements and storage upgrades and confirm their effectiveness before considering any changes to the current system design standards.
9. Require the developer to relocate the Ware Road PRV, as part of the Village development on
Ware Road. The new location should be approximately 110 m north of the Hwy 19 intersection at around the 54 m geodetic elevation so that the maximum design pressure of 150 psi is not exceeded in the Lower Zone. The work should also include a dedicated supply line that will be needed to connect the Upper Pressure to the potential feed from the City of Nanaimo.
10. Review and adopt appropriate target fire flow criteria for existing and future commercial,
industrial, and institutional requirements, prior to finalizing the reservoir storage requirements in the Lower Zone. Review and implement requirements for building sprinkler systems where warranted.
11. Improve available fire flows in the Upper and Lower Pressure Zones by upgrading of mains
and replacement of older fire hydrants.
12. Continue with the annual Asbestos Cement watermain replacement program. Laboratory testing of mains should be carried out to assist in determining the remaining service life mains and in prioritizing and budgeting of the work.
13. Obtain looping of the watermain system in conjunction with future development wherever
possible.

65
District of Lantzville Water Supply & Distribution System Study July 16, 2015
14. Review and resolve the readings discrepancies between the bulk water meters at the Ware
Road Reservoir.
15. Conduct an inspection on the exterior roof surface of the Ware Road Reservoir and review coating options if warranted. Review code requirements and implement seismic restraint improvements for the mechanical piping at the pump station.
16. Update the water study every 5 years, subject to the rate of growth, to review capital project needs based on changes in water demands (per capita, maximum day, peak hour) resulting from population growth.
17. Update the water Development Cost Charge (DCC) for the various land use categories in the
DCC Bylaw based on the proposed system improvement projects presented in this report.
18. Keep abreast of ongoing climate change research and its potential impact on aquifer recharge rates, especially when making infrastructure policy decisions.
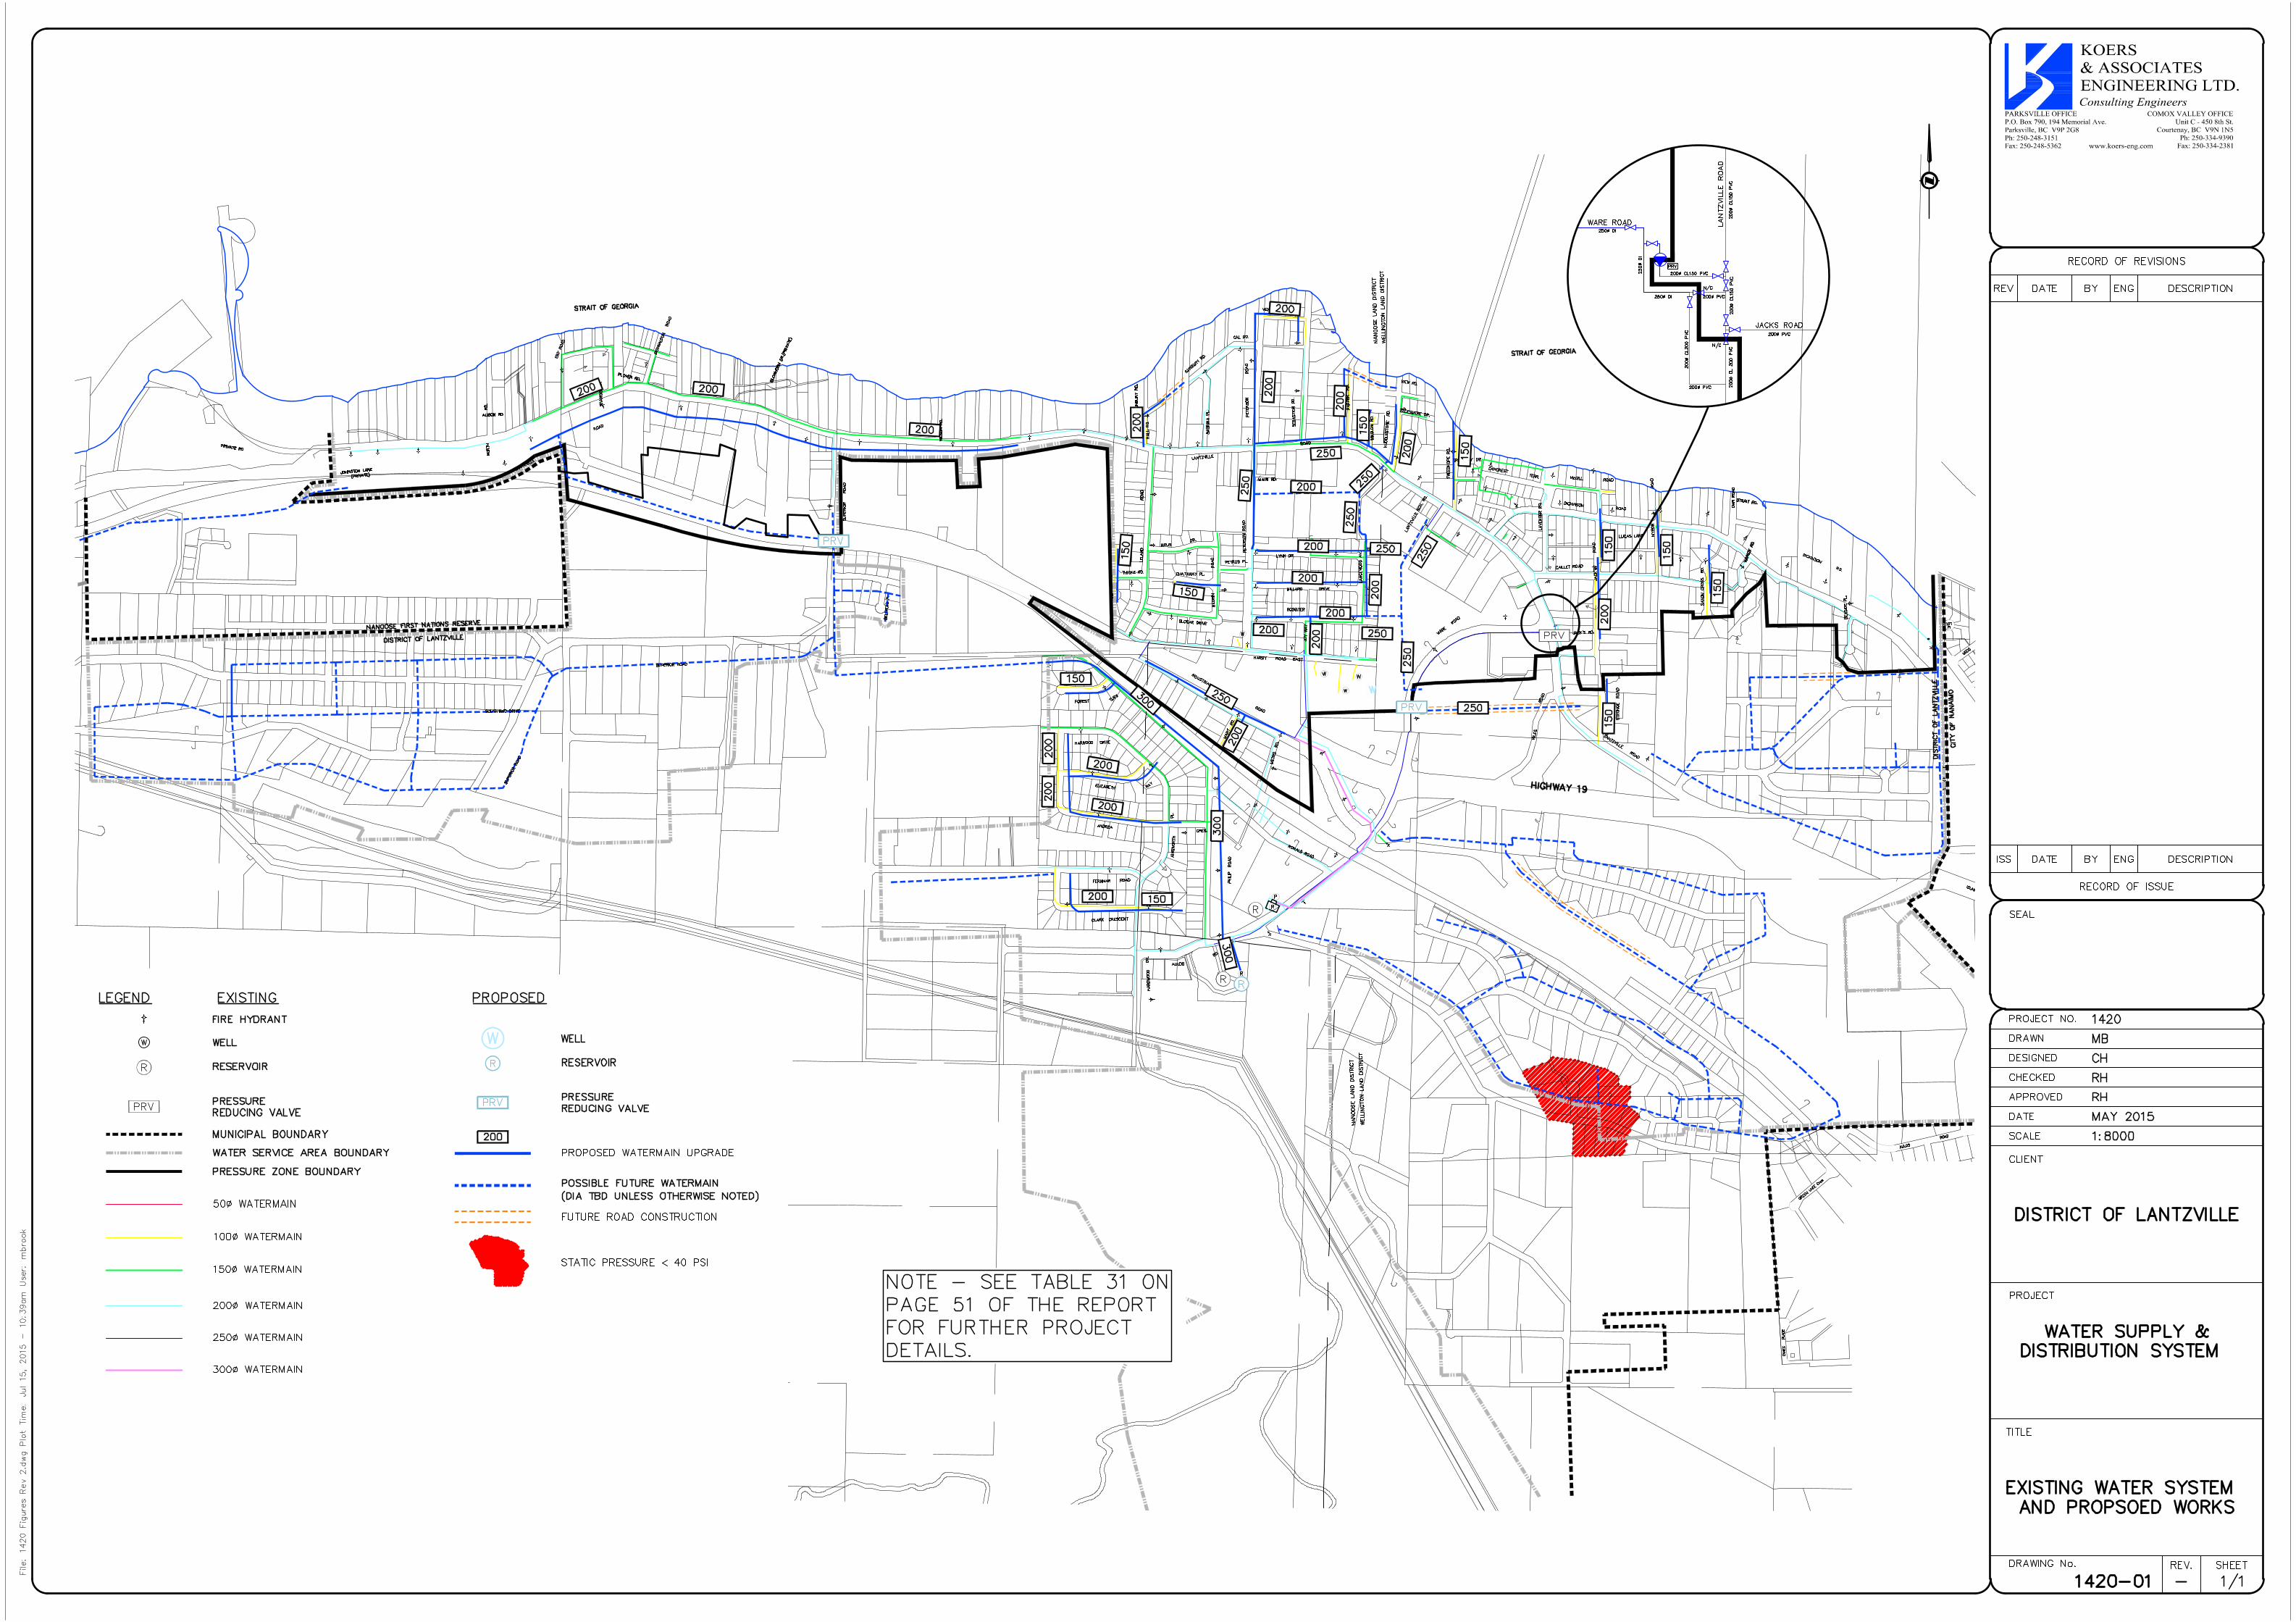

Appendix A
City of Nanaimo & District of Lantzville Water Supply Agreement, September 8, 2014
LANTZVILLE/NANAIMO WATER AGREEMENT
tkTHIS AGREEMENT dated for reference this day of
BETWEEN:
AND:
WHEREAS:
CITY OF NANAIMO
455 Wallace Street
Nanaimo, BC V9R 5J6
(hereinafter called "Nanaimo")
DISTRICT OF LANTZVILLE
PC Box 100
7192 Lantzville Road
Lantzville, BC V0R2H0
(hereinafter called "Lantzville")
2014.
OF THE FIRST PART
OF THE SECOND PART
A. Nanaimo operates a water supply system within its boundaries;
B. Lantzville has established facilities for the purposes of constructing, operating andmaintaining a water system for the supply and distribution of water within its boundariesand wishes to secure a supply ofwater in bulk;
C. Under section 23 of the Community Charter, S.B.C. 2003, c. 26, a municipal council hasthe authority to enter into agreements with other public authorities respecting activities andservices within the power of a party to the agreement, including agreements respecting theundertaking, provision and operation ofactivities and services;
D. Lantzville and Nanaimo wish to work together to provide water in bulk from the NanaimoWater System to serve Lantzville and to strengthen this cooperative relationship throughLantzville's participation in the cost of other services provided through the RegionalDistrict ofNanaimo on the terms and conditions set out in this Agreement;
E. Lantzville has consented to Nanaimo providing a supply ofwater under this Agreement;
NOW THEREFORE in consideration of the premises and the mutual covenants and agreementscontained herein, the parties hereby covenant and agree each with the other as follows:
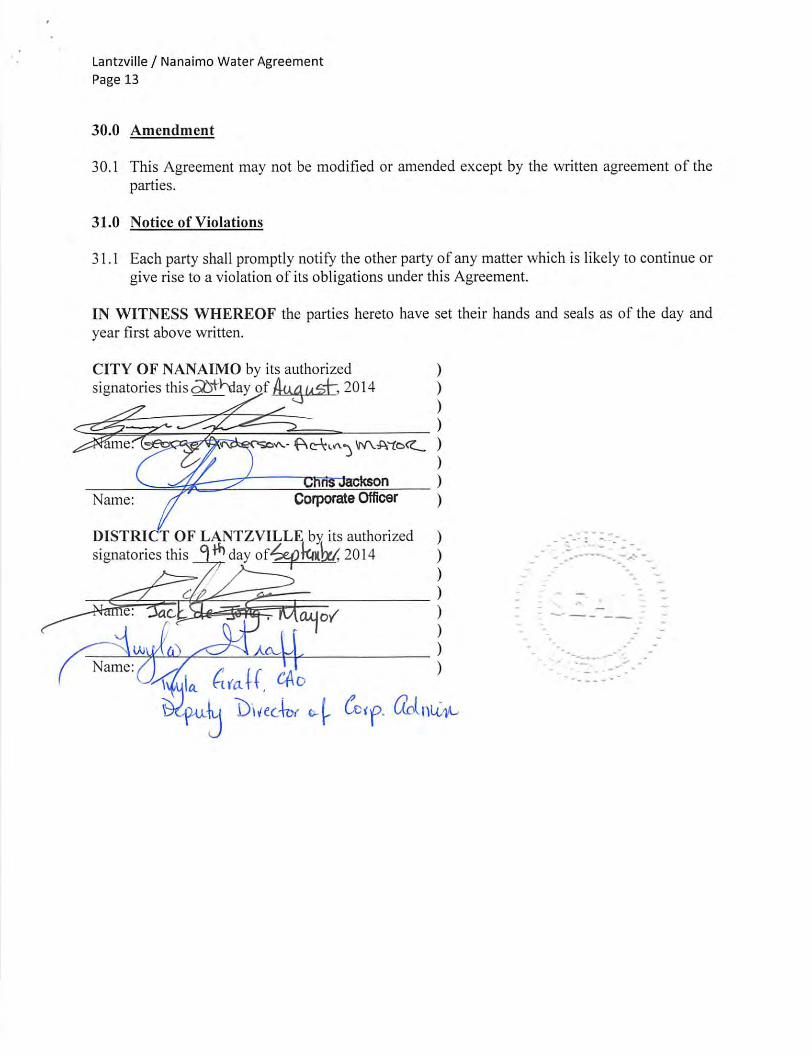
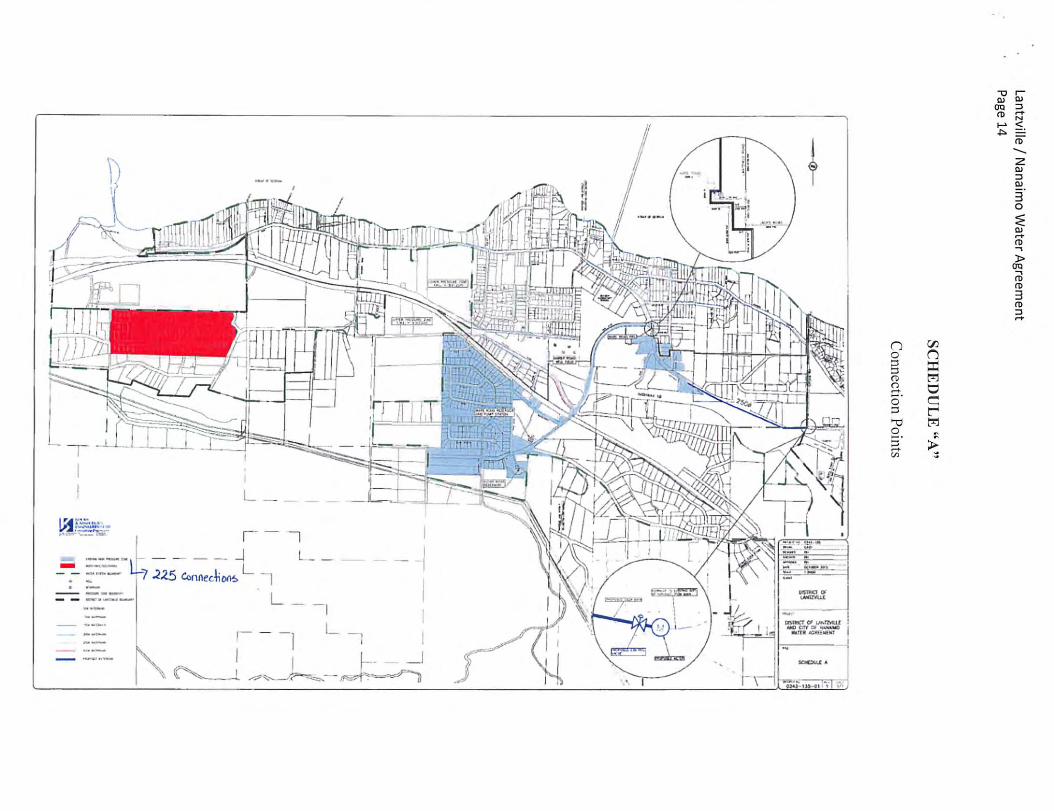
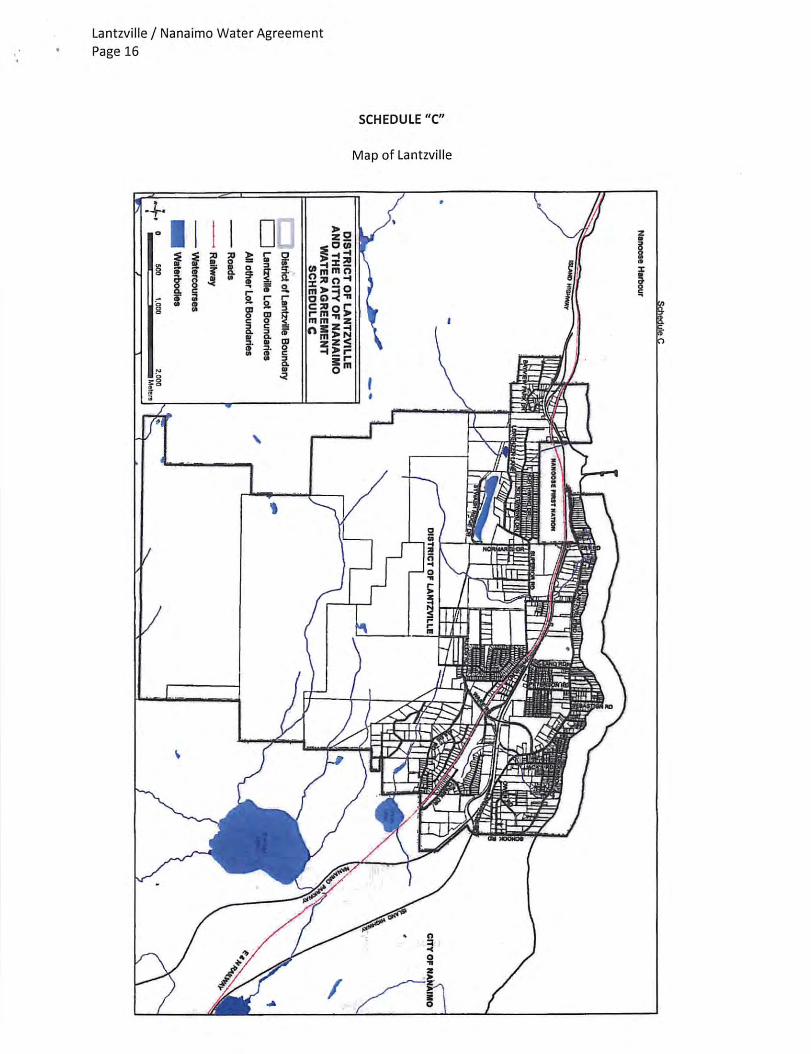
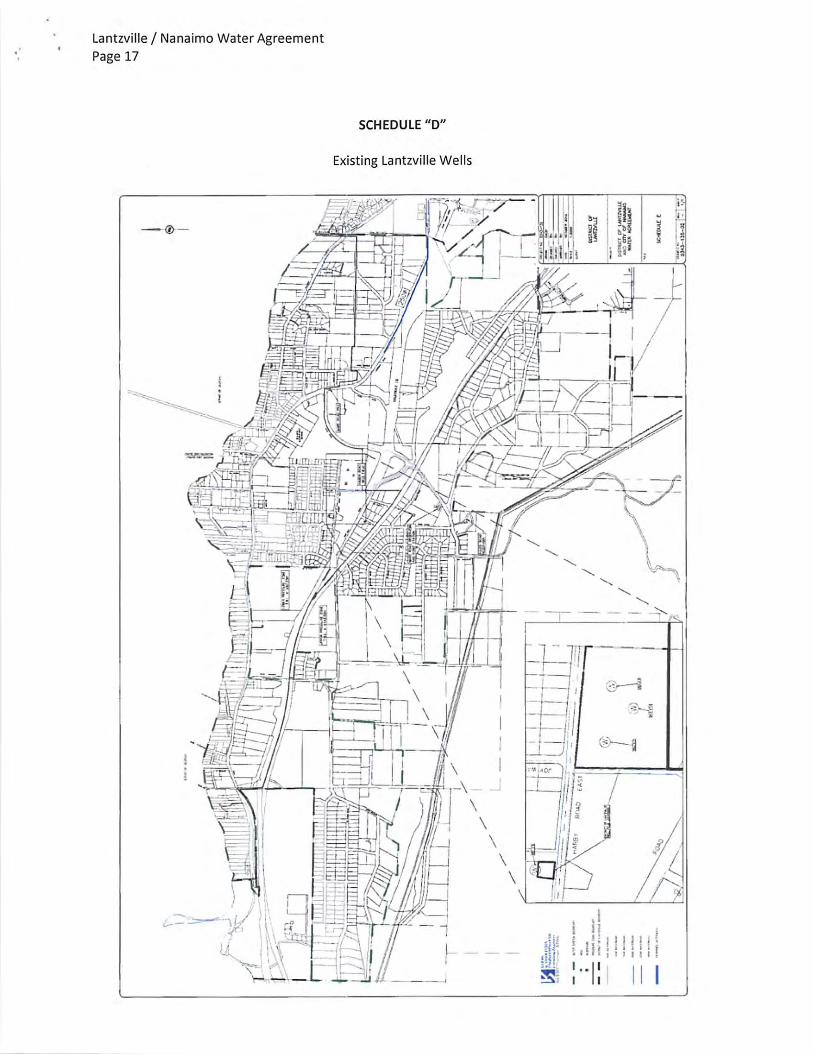

Appendix B
District of Lantzville Phase 1 of Stage 1 Wellfield Management Plan – Wellfield Capacity Existing & Ultimate,
Harby Road Wellfield October 15, 2014, Lowen Hydrogeology Consulting Ltd.
District of Lantzville, BC
Phase 1 of Stage 1 Wellfield Management Plan
Wellfield Capacity Existing and Ultimate
Harby Road Wellfield, District of Lantzville, BC
Date: October 15, 2014
LHC Project File: 1412
Lowen Hydrogeology Consulting Ltd.
PO Box 45024 Victoria, B.C. V9A-0C3 Phone: 250 -595-0624 Fax: 1-855 -286-8001 Website: www.lowenhc.ca
Re
po
rt
i
SUMMARY
In 2014, the District of Lantzville retained Lowen Hydrogeology Consulting Ltd. (LHC) to conduct a series of
pumping tests on the 4 producing wells serving the district. These 4 groundwater sources are located in a
wellfield off Harby Road in Lantzville. This Wellfield consists of 4 active wells and 10 inactive test wells
completed during previous exploration programs.
The scope of work included a thorough review of previous reports and general work completed on the wells.
A large database containing water levels and pumping flows was compiled to establish baseline historical
conditions. Staff from the District of Lantzville performed 4 single-well pumping tests using the non-pumping
wells as observation points, and one pumping test using the 4 wells simultaneously. LHC processed and
analysed the data to assess the well field capacity.
The interference between wells were assessed and taken into account for the final yield calculations. The
combined capacity of the wells #4, #6, #9 and #12 is 2,424 m3/day; 2,424,000 L/d or 28.1 L/s. Considering
the combined water level drawdown during simultaneous pumping (all 4 production wells pumping), it is
concluded that drilling at additional well sites in the Harby Road well field is not advisable. The well field
aquifer is bounded to the south and is not likely to offer a satisfying site for a new production well.
The existing wells and pumping equipment should be reviewed with the objective of maximizing the well field
production capacity. The existing wells and pumps cannot produce the ultimate potential yield available.
Recommendations are made for: well re-development, well replacement, pump replacement and modifying
pump settings.
ii
TABLE OF CONTENTS
SUMMARY .............................................................................................................................................................. i
1.0 INTRODUCTION................................................................................................................................................... 1
1.1 Background and Project Implementation ............................................................................................ 1
1.2 Scope of Work ......................................................................................................................................... 1
2.0 LOCAL GEOLOGY AND HYDROGEOLOGY ....................................................................................................... 1
2.1 Aquifer Description ................................................................................................................................. 1
2.2 Aquifer Thickness ................................................................................................................................... 2
2.3 Recharge / Discharge ............................................................................................................................ 2
3.0 WELLFIELD ON HARBY ROAD ........................................................................................................................... 2
3.1 Well Field Features ................................................................................................................................ 2
3.2 Historical Data ......................................................................................................................................... 3
4.0 PUMPING TESTS ................................................................................................................................................. 3
4.1 Pumping Test Setting and Schedule ................................................................................................... 3
4.2 Aquifer Parameters Calculation ............................................................................................................ 3
4.3 Well Drawdown Interference ................................................................................................................. 5
4.4 Pumping Test Analysis and Well Rating ............................................................................................. 5
4.5 Well Efficiencies ...................................................................................................................................... 8
5.0 WATER QUALITY ................................................................................................................................................. 9
6.0 CONCLUSIONS AND RECOMMENDATIONS ................................................................................................... 10
CLOSURE / DISCLAIMER ............................................................................................................................................. 10
REFERENCES
iii
LIST OF TABLES
Table 1 Well Information .............................................................................................................................. 2
Table 2 Pumping Test Information............................................................................................................... 3
Table 3 Summary of Calculated Aquifer Parameters ................................................................................... 4
Table 4 100-day Drawdown Interference ..................................................................................................... 5
Table 5 Determination of the Total Available Drawdown ............................................................................. 5
Table 6a Well Long-term Yield Assessment without Interference Effects (single pumping well) ................... 5
Table 6b Well Long-term Yield Assessment with Interference effects (all wells pumping) ............................ 5
Table 6c Comparison of Well Rating Results with Previous Studies ............................................................. 5
Table 7 Well long-term Yield Assessment for Different Pumping Configurations ........................................ 6
Table 8 Key Water Parameters ................................................................................................................... 9
Table 9 New Well Yields and Proposed Actions to Reach Production Goals ............................................ 10
LIST OF GRAPHS
Graph 1 Distance Drawdown Graph at 100-day ........................................................................................... 7
LIST OF APPENDICES
APPENDIX A: Figures
Figure A1 Well field location plan
Figure A2 Bedrock map
Figure A3 Aquifer thickness
Figure A4 Water table elevation
Figure A5 Well yield
Figure A6 Yield per meter of aquifer
APPENDIX B: Historical Data
Graph B1 Water Level and Pumping Rate at Well #4
Graph B2 Water Level and Pumping Rate at Well #6
Graph B3 Water Level and Pumping Rate at Well #9
Graph B4 Water Level and Pumping Rate at Well #12
Graph B5 Water Levels – BC MOE Observation Well #232
APPENDIX C: Pumping Tests Graphs
Graph C1 Pumping Test at Well #4: Drawdown Curve
Graph C2 Pumping Test at Well #4: Recovery Curve
Graph C3 Pumping Test at Well #6: Drawdown Curve
Graph C4 Pumping Test at Well #9: Drawdown Curve
Graph C5 Pumping Test at Well #9: Recovery Curve
Graph C6 Pumping Test at Well #12: Drawdown Curve
Graph C7 Simultaneous Pumping Test: Drawdown Curves
Figure C1 – Drawdown at the Well Field during Simultaneous Pumping
APPENDIX D: Well Log Records
Figure D1 Well Construction Logs
Well Log Record LID 4
Well Log Record LID 6
Well Log Record LID 9
Well Log Record LID 12
APPENDIX E: Well #9 & 12 – Water Quality
Phase 1 of Stage 1
Wellfield Management Plan – Wellfield Capacity
Harby Road Wellfield, District of Lantzville, BC
www.lowenhc.ca Page 1 NewOffice/Projects/2014/1412-LantsvilleWellfied/Reports/LantsvilleReport-October2014
1.0 INTRODUCTION
1.1 Background and Project Implementation
The District of Lantzville relies on 4 groundwater sources, producing an estimated combined flow of 20 L/s.
These 4 wells are located in the Harby Road well field (Appendix A – Figure A1). Groundwater levels are
subject to seasonal effects and can oscillate up to 3 meters between low and high seasons. Low water levels
occur during summer months and are combined with an increase in water demand. The District of Lantzville
has estimated in 2013 a water consumption doubling during summer months. Stress on groundwater
resources has led to water restrictions in the dry season. Demand growth is projected and an additional water
source(s) will be required.
1.2 Scope of Work
In June 2014, LHC was hired by the District of Lantzville to undertake a study of the well field at Harby Road.
The tasks were as follows:
Review all the previous reports on well drilling and testing at the well field since 1996;
Compute all the flow and water level data collected by the SCADA system at the well field;
Design large scale pumping tests of the 4 in-use wells, using monitoring wells;
Rate the well field capacity including well interference effects.
2.0 LOCAL GEOLOGY AND HYDROGEOLOGY
2.1 Aquifer Description
The local sand and gravel aquifer is the aquifer #215, mapped by the BC Ministry of Environment (MOE).
The productive layers are mostly composed of brown or white sand and gravel corresponding to the Quadra
Sand Formation. The unit is characterized by well sorted sand with silt and gravel (Clague, 1975). This
formation is overlain by till, glacio-fluvial sediments and glacio-lacustrine sediments of the Vashon Drift. The
underlying unit is the Cowichan Head Formation, composed of a unit of marine clay, silt and sand and a unit
of plant-bearing silt, sand and gravel. (Clague, 1975).
The well log records in the region display two types of water-bearing formations; the white or brown sand
identified as Quadra Sand, and a grey sand and gravel formation that may belong to the Cowichan Head
Formation, or an older unit. These two units are sometimes separated with confining layers of till or clay, but
are sometimes juxtaposed.
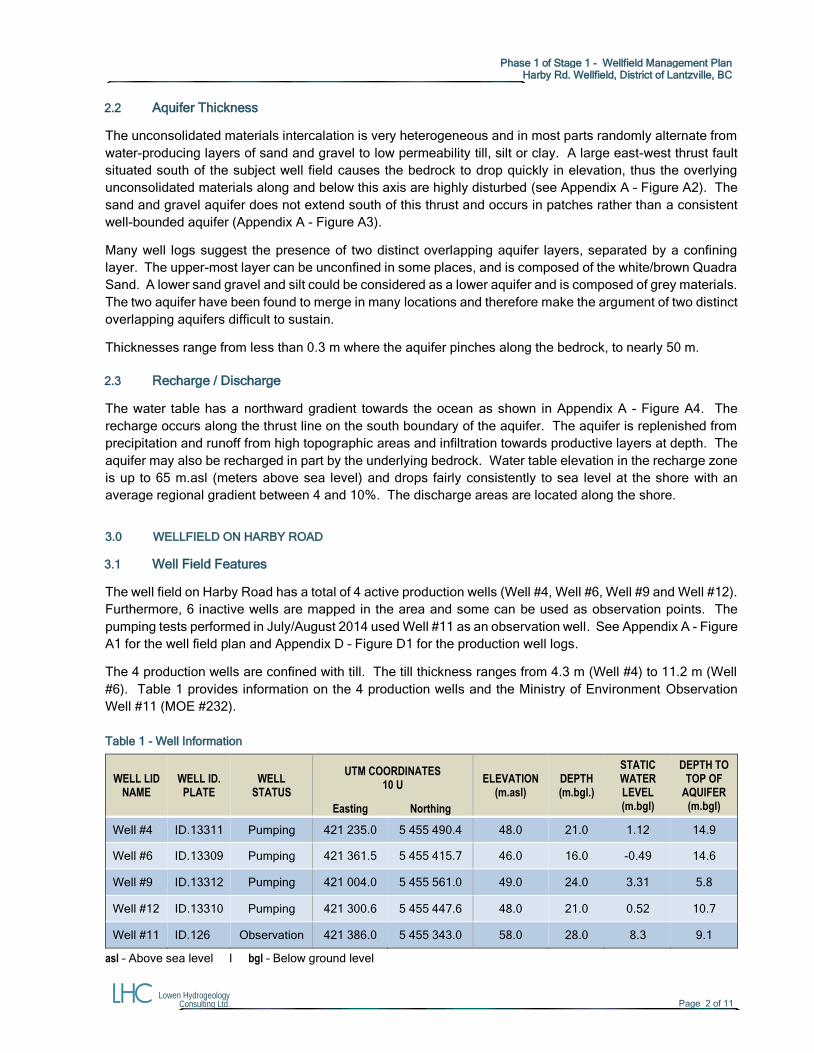
Phase 1 of Stage 1 - Wellfield Management Plan
Harby Rd. Wellfield, District of Lantzville, BC
Lowen Hydrogeology Consulting Ltd. Page 2 of 11
2.2 Aquifer Thickness
The unconsolidated materials intercalation is very heterogeneous and in most parts randomly alternate from
water-producing layers of sand and gravel to low permeability till, silt or clay. A large east-west thrust fault
situated south of the subject well field causes the bedrock to drop quickly in elevation, thus the overlying
unconsolidated materials along and below this axis are highly disturbed (see Appendix A – Figure A2). The
sand and gravel aquifer does not extend south of this thrust and occurs in patches rather than a consistent
well-bounded aquifer (Appendix A - Figure A3).
Many well logs suggest the presence of two distinct overlapping aquifer layers, separated by a confining
layer. The upper-most layer can be unconfined in some places, and is composed of the white/brown Quadra
Sand. A lower sand gravel and silt could be considered as a lower aquifer and is composed of grey materials.
The two aquifer have been found to merge in many locations and therefore make the argument of two distinct
overlapping aquifers difficult to sustain.
Thicknesses range from less than 0.3 m where the aquifer pinches along the bedrock, to nearly 50 m.
2.3 Recharge / Discharge
The water table has a northward gradient towards the ocean as shown in Appendix A - Figure A4. The
recharge occurs along the thrust line on the south boundary of the aquifer. The aquifer is replenished from
precipitation and runoff from high topographic areas and infiltration towards productive layers at depth. The
aquifer may also be recharged in part by the underlying bedrock. Water table elevation in the recharge zone
is up to 65 m.asl (meters above sea level) and drops fairly consistently to sea level at the shore with an
average regional gradient between 4 and 10%. The discharge areas are located along the shore.
3.0 WELLFIELD ON HARBY ROAD
3.1 Well Field Features
The well field on Harby Road has a total of 4 active production wells (Well #4, Well #6, Well #9 and Well #12).
Furthermore, 6 inactive wells are mapped in the area and some can be used as observation points. The
pumping tests performed in July/August 2014 used Well #11 as an observation well. See Appendix A - Figure
A1 for the well field plan and Appendix D – Figure D1 for the production well logs.
The 4 production wells are confined with till. The till thickness ranges from 4.3 m (Well #4) to 11.2 m (Well
#6). Table 1 provides information on the 4 production wells and the Ministry of Environment Observation
Well #11 (MOE #232).
Table 1 - Well Information
WELL LID NAME
WELL ID. PLATE
WELL STATUS
UTM COORDINATES 10 U
ELEVATION (m.asl)
DEPTH (m.bgl.)
STATIC WATER LEVEL (m.bgl)
DEPTH TO TOP OF
AQUIFER (m.bgl) Easting Northing
Well #4 ID.13311 Pumping 421 235.0 5 455 490.4 48.0 21.0 1.12 14.9
Well #6 ID.13309 Pumping 421 361.5 5 455 415.7 46.0 16.0 -0.49 14.6
Well #9 ID.13312 Pumping 421 004.0 5 455 561.0 49.0 24.0 3.31 5.8
Well #12 ID.13310 Pumping 421 300.6 5 455 447.6 48.0 21.0 0.52 10.7
Well #11 ID.126 Observation 421 386.0 5 455 343.0 58.0 28.0 8.3 9.1
asl – Above sea level I bgl – Below ground level
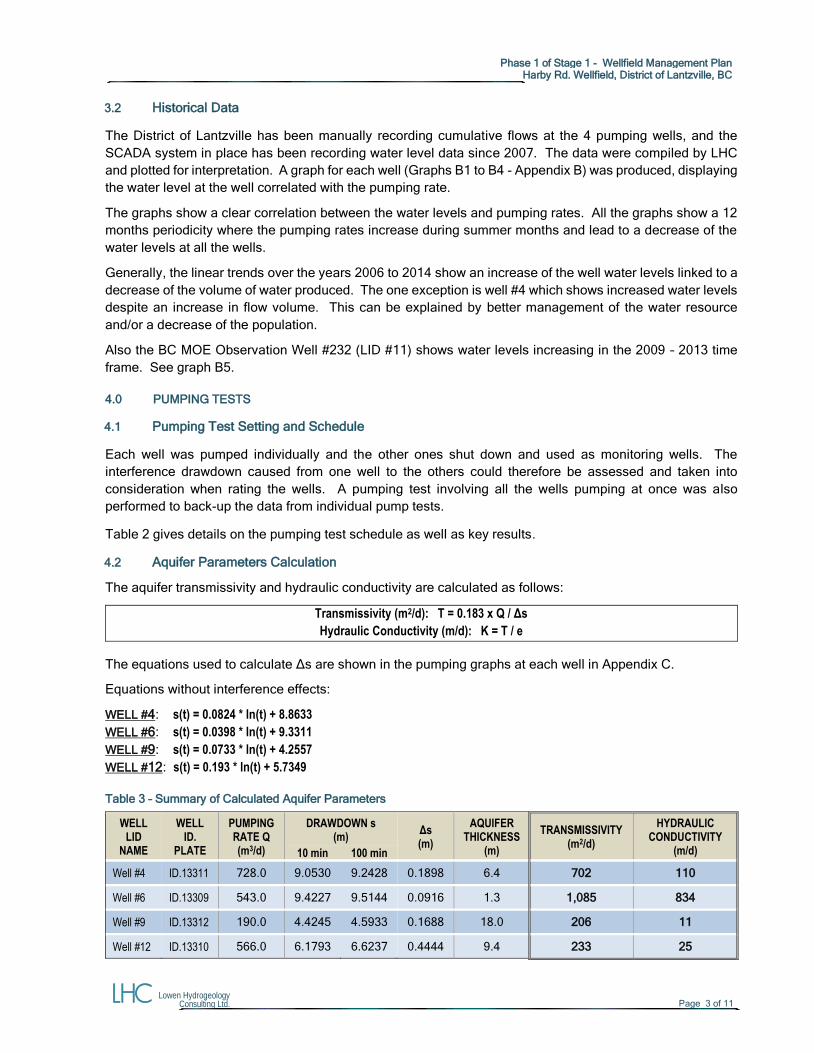
Phase 1 of Stage 1 - Wellfield Management Plan
Harby Rd. Wellfield, District of Lantzville, BC
Lowen Hydrogeology Consulting Ltd. Page 3 of 11
3.2 Historical Data
The District of Lantzville has been manually recording cumulative flows at the 4 pumping wells, and the
SCADA system in place has been recording water level data since 2007. The data were compiled by LHC
and plotted for interpretation. A graph for each well (Graphs B1 to B4 - Appendix B) was produced, displaying
the water level at the well correlated with the pumping rate.
The graphs show a clear correlation between the water levels and pumping rates. All the graphs show a 12
months periodicity where the pumping rates increase during summer months and lead to a decrease of the
water levels at all the wells.
Generally, the linear trends over the years 2006 to 2014 show an increase of the well water levels linked to a
decrease of the volume of water produced. The one exception is well #4 which shows increased water levels
despite an increase in flow volume. This can be explained by better management of the water resource
and/or a decrease of the population.
Also the BC MOE Observation Well #232 (LID #11) shows water levels increasing in the 2009 – 2013 time
frame. See graph B5.
4.0 PUMPING TESTS
4.1 Pumping Test Setting and Schedule
Each well was pumped individually and the other ones shut down and used as monitoring wells. The
interference drawdown caused from one well to the others could therefore be assessed and taken into
consideration when rating the wells. A pumping test involving all the wells pumping at once was also
performed to back-up the data from individual pump tests.
Table 2 gives details on the pumping test schedule as well as key results.
4.2 Aquifer Parameters Calculation
The aquifer transmissivity and hydraulic conductivity are calculated as follows:
Transmissivity (m2/d): T = 0.183 x Q / Δs
Hydraulic Conductivity (m/d): K = T / e
The equations used to calculate Δs are shown in the pumping graphs at each well in Appendix C. Equations without interference effects:
WELL #4: s(t) = 0.0824 * ln(t) + 8.8633
WELL #6: s(t) = 0.0398 * ln(t) + 9.3311
WELL #9: s(t) = 0.0733 * ln(t) + 4.2557
WELL #12: s(t) = 0.193 * ln(t) + 5.7349
Table 3 – Summary of Calculated Aquifer Parameters
WELL LID
NAME
WELL ID.
PLATE
PUMPING RATE Q (m3/d)
DRAWDOWN s (m)
Δs (m)
AQUIFER THICKNESS
(m)
TRANSMISSIVITY (m2/d)
HYDRAULIC CONDUCTIVITY
(m/d) 10 min 100 min
Well #4 ID.13311 728.0 9.0530 9.2428 0.1898 6.4 702 110
Well #6 ID.13309 543.0 9.4227 9.5144 0.0916 1.3 1,085 834
Well #9 ID.13312 190.0 4.4245 4.5933 0.1688 18.0 206 11
Well #12 ID.13310 566.0 6.1793 6.6237 0.4444 9.4 233 25
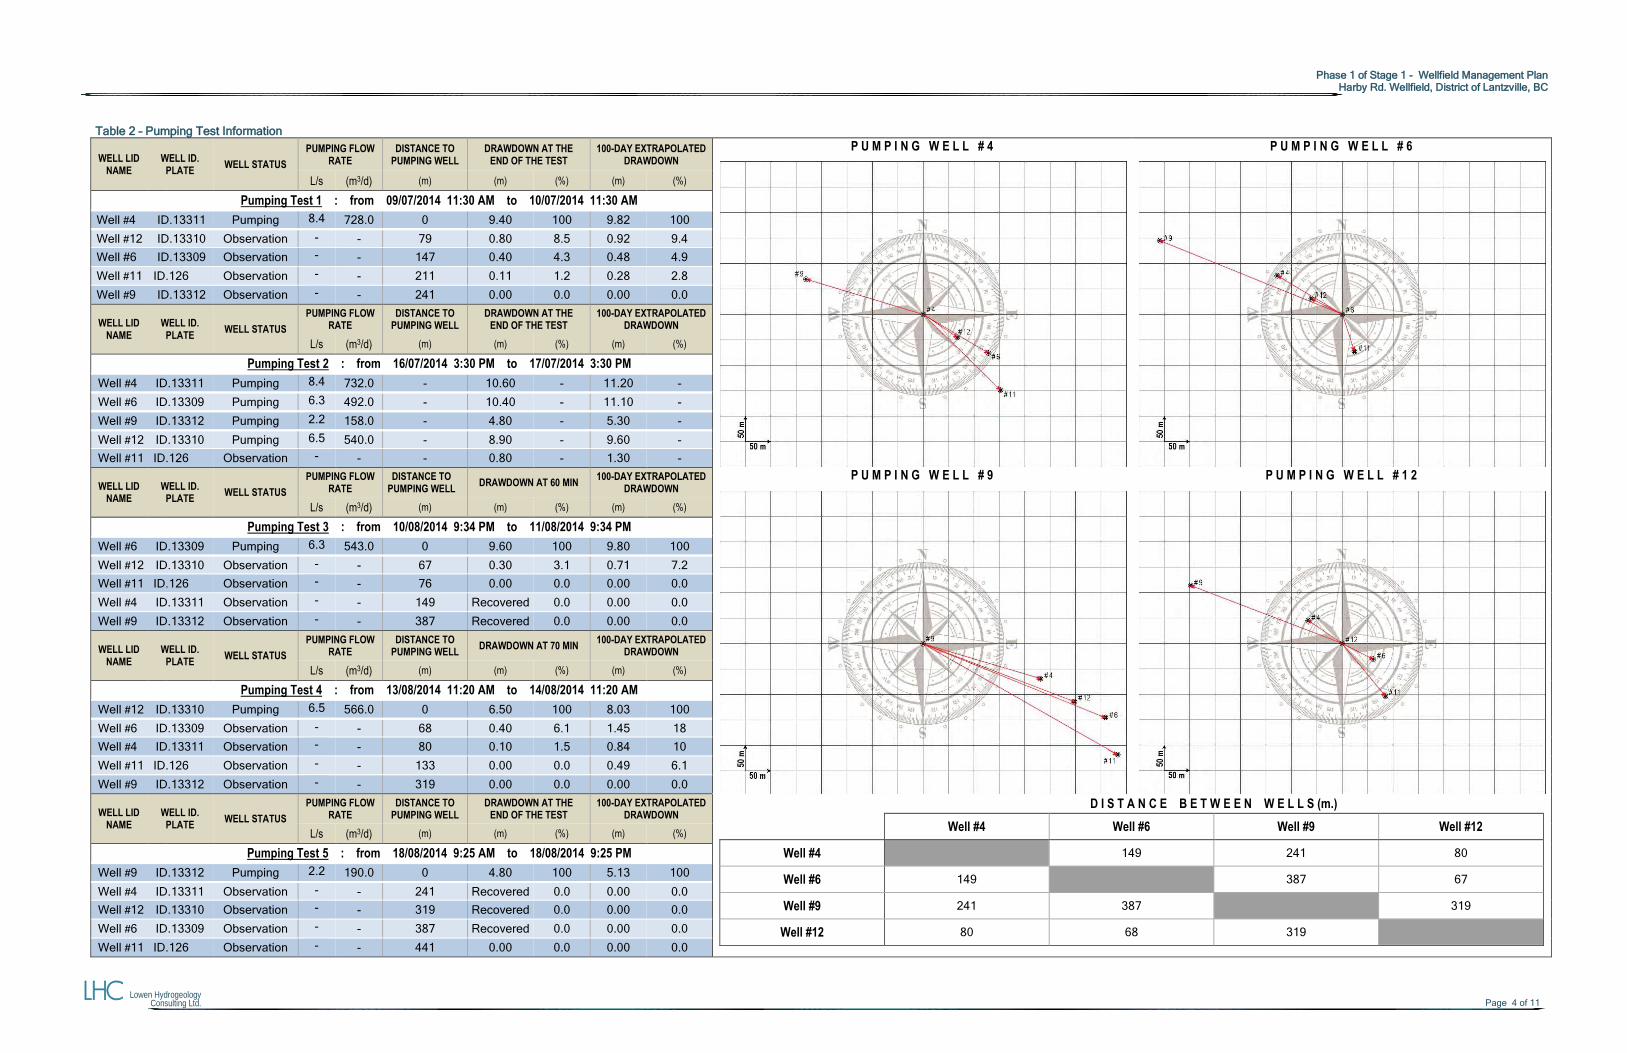
Phase 1 of Stage 1 - Wellfield Management Plan Harby Rd. Wellfield, District of Lantzville, BC
Lowen Hydrogeology Consulting Ltd. Page 4 of 11
Table 2 – Pumping Test Information
WELL LID NAME
WELL ID. PLATE
WELL STATUS
PUMPING FLOW RATE
DISTANCE TO PUMPING WELL
DRAWDOWN AT THE END OF THE TEST
100-DAY EXTRAPOLATED DRAWDOWN
P U M P I N G W E L L # 4
P U M P I N G W E L L # 9
P U M P I N G W E L L # 6
P U M P I N G W E L L # 1 2
L/s (m3/d) (m) (m) (%) (m) (%)
Pumping Test 1 : from 09/07/2014 11:30 AM to 10/07/2014 11:30 AM
Well #4 ID.13311 Pumping 8.4 728.0 0 9.40 100 9.82 100
Well #12 ID.13310 Observation - - 79 0.80 8.5 0.92 9.4
Well #6 ID.13309 Observation - - 147 0.40 4.3 0.48 4.9
Well #11 ID.126 Observation - - 211 0.11 1.2 0.28 2.8
Well #9 ID.13312 Observation - - 241 0.00 0.0 0.00 0.0
WELL LID NAME
WELL ID. PLATE
WELL STATUS
PUMPING FLOW RATE
DISTANCE TO PUMPING WELL
DRAWDOWN AT THE END OF THE TEST
100-DAY EXTRAPOLATED DRAWDOWN
L/s (m3/d) (m) (m) (%) (m) (%)
Pumping Test 2 : from 16/07/2014 3:30 PM to 17/07/2014 3:30 PM
Well #4 ID.13311 Pumping 8.4 732.0 - 10.60 - 11.20 -
Well #6 ID.13309 Pumping 6.3 492.0 - 10.40 - 11.10 -
Well #9 ID.13312 Pumping 2.2 158.0 - 4.80 - 5.30 -
Well #12 ID.13310 Pumping 6.5 540.0 - 8.90 - 9.60 -
Well #11 ID.126 Observation - - - 0.80 - 1.30 -
WELL LID NAME
WELL ID. PLATE
WELL STATUS
PUMPING FLOW RATE
DISTANCE TO PUMPING WELL
DRAWDOWN AT 60 MIN 100-DAY EXTRAPOLATED
DRAWDOWN
L/s (m3/d) (m) (m) (%) (m) (%)
Pumping Test 3 : from 10/08/2014 9:34 PM to 11/08/2014 9:34 PM
Well #6 ID.13309 Pumping 6.3 543.0 0 9.60 100 9.80 100
Well #12 ID.13310 Observation - - 67 0.30 3.1 0.71 7.2
Well #11 ID.126 Observation - - 76 0.00 0.0 0.00 0.0
Well #4 ID.13311 Observation - - 149 Recovered 0.0 0.00 0.0
Well #9 ID.13312 Observation - - 387 Recovered 0.0 0.00 0.0
WELL LID NAME
WELL ID. PLATE
WELL STATUS
PUMPING FLOW RATE
DISTANCE TO PUMPING WELL
DRAWDOWN AT 70 MIN 100-DAY EXTRAPOLATED
DRAWDOWN
L/s (m3/d) (m) (m) (%) (m) (%)
Pumping Test 4 : from 13/08/2014 11:20 AM to 14/08/2014 11:20 AM
Well #12 ID.13310 Pumping 6.5 566.0 0 6.50 100 8.03 100
Well #6 ID.13309 Observation - - 68 0.40 6.1 1.45 18
Well #4 ID.13311 Observation - - 80 0.10 1.5 0.84 10
Well #11 ID.126 Observation - - 133 0.00 0.0 0.49 6.1
Well #9 ID.13312 Observation - - 319 0.00 0.0 0.00 0.0
WELL LID NAME
WELL ID. PLATE
WELL STATUS
PUMPING FLOW RATE
DISTANCE TO PUMPING WELL
DRAWDOWN AT THE END OF THE TEST
100-DAY EXTRAPOLATED DRAWDOWN
D I S T A N C E B E T W E E N W E L L S (m.)
Well #4 Well #6 Well #9 Well #12
Well #4 149 241 80
Well #6 149 387 67
Well #9 241 387 319
Well #12 80 68 319
L/s (m3/d) (m) (m) (%) (m) (%)
Pumping Test 5 : from 18/08/2014 9:25 AM to 18/08/2014 9:25 PM
Well #9 ID.13312 Pumping 2.2 190.0 0 4.80 100 5.13 100
Well #4 ID.13311 Observation - - 241 Recovered 0.0 0.00 0.0
Well #12 ID.13310 Observation - - 319 Recovered 0.0 0.00 0.0
Well #6 ID.13309 Observation - - 387 Recovered 0.0 0.00 0.0
Well #11 ID.126 Observation - - 441 0.00 0.0 0.00 0.0
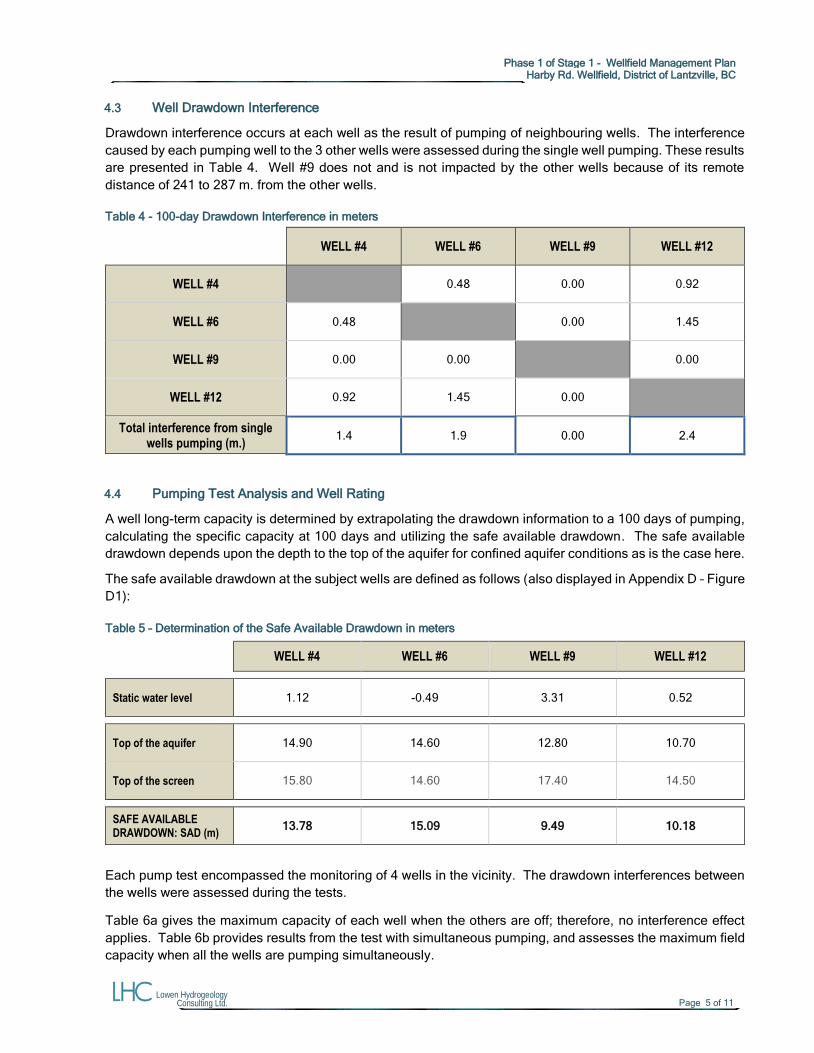
Phase 1 of Stage 1 - Wellfield Management Plan
Harby Rd. Wellfield, District of Lantzville, BC
Lowen Hydrogeology Consulting Ltd. Page 5 of 11
4.3 Well Drawdown Interference
Drawdown interference occurs at each well as the result of pumping of neighbouring wells. The interference
caused by each pumping well to the 3 other wells were assessed during the single well pumping. These results
are presented in Table 4. Well #9 does not and is not impacted by the other wells because of its remote
distance of 241 to 287 m. from the other wells.
Table 4 - 100-day Drawdown Interference in meters
WELL #4 WELL #6 WELL #9 WELL #12
WELL #4 0.48 0.00 0.92
WELL #6 0.48 0.00 1.45
WELL #9 0.00 0.00 0.00
WELL #12 0.92 1.45 0.00
Total interference from single wells pumping (m.)
1.4 1.9 0.00 2.4
4.4 Pumping Test Analysis and Well Rating
A well long-term capacity is determined by extrapolating the drawdown information to a 100 days of pumping,
calculating the specific capacity at 100 days and utilizing the safe available drawdown. The safe available
drawdown depends upon the depth to the top of the aquifer for confined aquifer conditions as is the case here.
The safe available drawdown at the subject wells are defined as follows (also displayed in Appendix D – Figure
D1):
Table 5 – Determination of the Safe Available Drawdown in meters
WELL #4 WELL #6 WELL #9 WELL #12
Static water level 1.12 -0.49 3.31 0.52
Top of the aquifer 14.90 14.60 12.80 10.70
Top of the screen 15.80 14.60 17.40 14.50
SAFE AVAILABLE DRAWDOWN: SAD (m)
13.78 15.09 9.49 10.18
Each pump test encompassed the monitoring of 4 wells in the vicinity. The drawdown interferences between
the wells were assessed during the tests.
Table 6a gives the maximum capacity of each well when the others are off; therefore, no interference effect
applies. Table 6b provides results from the test with simultaneous pumping, and assesses the maximum field
capacity when all the wells are pumping simultaneously.
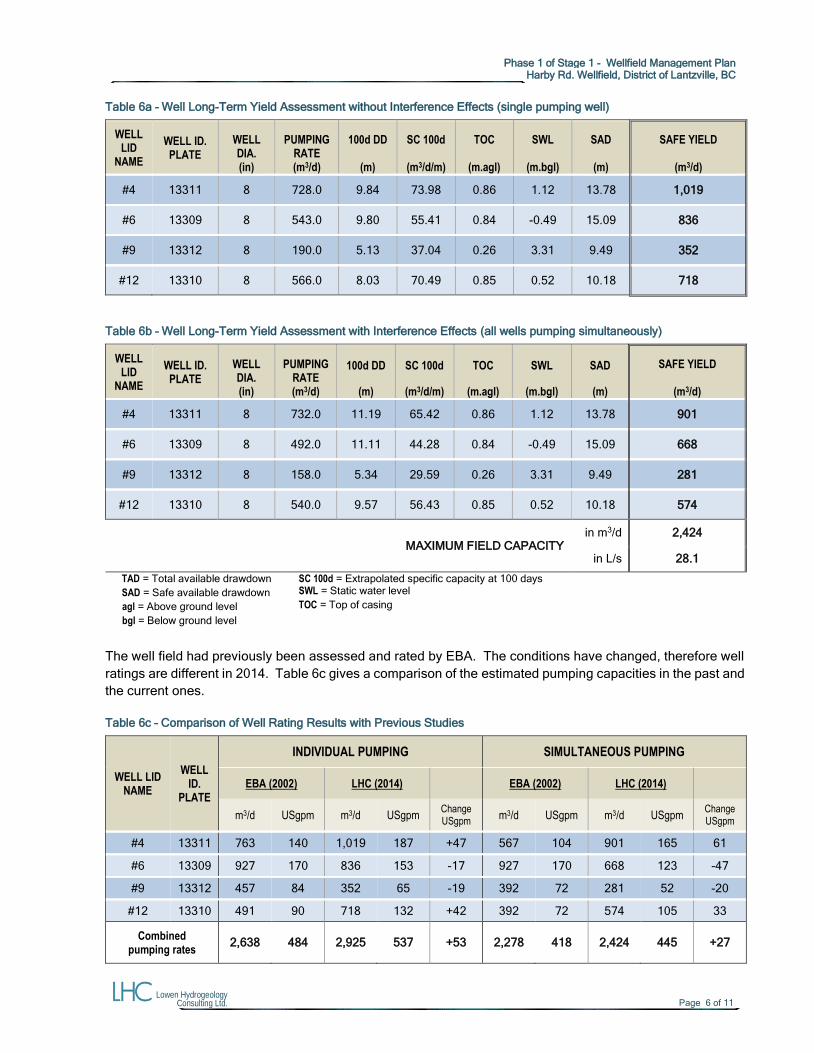
Phase 1 of Stage 1 - Wellfield Management Plan
Harby Rd. Wellfield, District of Lantzville, BC
Lowen Hydrogeology Consulting Ltd. Page 6 of 11
Table 6a – Well Long-Term Yield Assessment without Interference Effects (single pumping well)
WELL LID
NAME
WELL ID. PLATE
WELL DIA. (in)
PUMPING RATE (m3/d)
100d DD
(m)
SC 100d
(m3/d/m)
TOC
(m.agl)
SWL
(m.bgl)
SAD
(m)
SAFE YIELD
(m3/d)
#4 13311 8 728.0 9.84 73.98 0.86 1.12 13.78 1,019
#6 13309 8 543.0 9.80 55.41 0.84 -0.49 15.09 836
#9 13312 8 190.0 5.13 37.04 0.26 3.31 9.49 352
#12 13310 8 566.0 8.03 70.49 0.85 0.52 10.18 718
Table 6b – Well Long-Term Yield Assessment with Interference Effects (all wells pumping simultaneously)
WELL LID
NAME
WELL ID. PLATE
WELL DIA. (in)
PUMPING RATE (m3/d)
100d DD
(m)
SC 100d
(m3/d/m)
TOC
(m.agl)
SWL
(m.bgl)
SAD
(m)
SAFE YIELD
(m3/d)
#4 13311 8 732.0 11.19 65.42 0.86 1.12 13.78 901
#6 13309 8 492.0 11.11 44.28 0.84 -0.49 15.09 668
#9 13312 8 158.0 5.34 29.59 0.26 3.31 9.49 281
#12 13310 8 540.0 9.57 56.43 0.85 0.52 10.18 574
MAXIMUM FIELD CAPACITY
in m3/d 2,424
100d DD = Extrapolated drawdown at 100 days in L/s 28.1
TAD = Total available drawdown
SAD = Safe available drawdown
agl = Above ground level
bgl = Below ground level
SC 100d = Extrapolated specific capacity at 100 days SWL = Static water level
TOC = Top of casing
The well field had previously been assessed and rated by EBA. The conditions have changed, therefore well
ratings are different in 2014. Table 6c gives a comparison of the estimated pumping capacities in the past and
the current ones.
Table 6c – Comparison of Well Rating Results with Previous Studies
WELL LID NAME
WELL ID.
PLATE
INDIVIDUAL PUMPING SIMULTANEOUS PUMPING
EBA (2002) LHC (2014) EBA (2002) LHC (2014)
m3/d USgpm m3/d USgpm Change USgpm
m3/d USgpm m3/d USgpm Change USgpm
#4 13311 763 140 1,019 187 +47 567 104 901 165 61
#6 13309 927 170 836 153 -17 927 170 668 123 -47
#9 13312 457 84 352 65 -19 392 72 281 52 -20
#12 13310 491 90 718 132 +42 392 72 574 105 33
Combined pumping rates
2,638 484 2,925 537 +53 2,278 418 2,424 445 +27
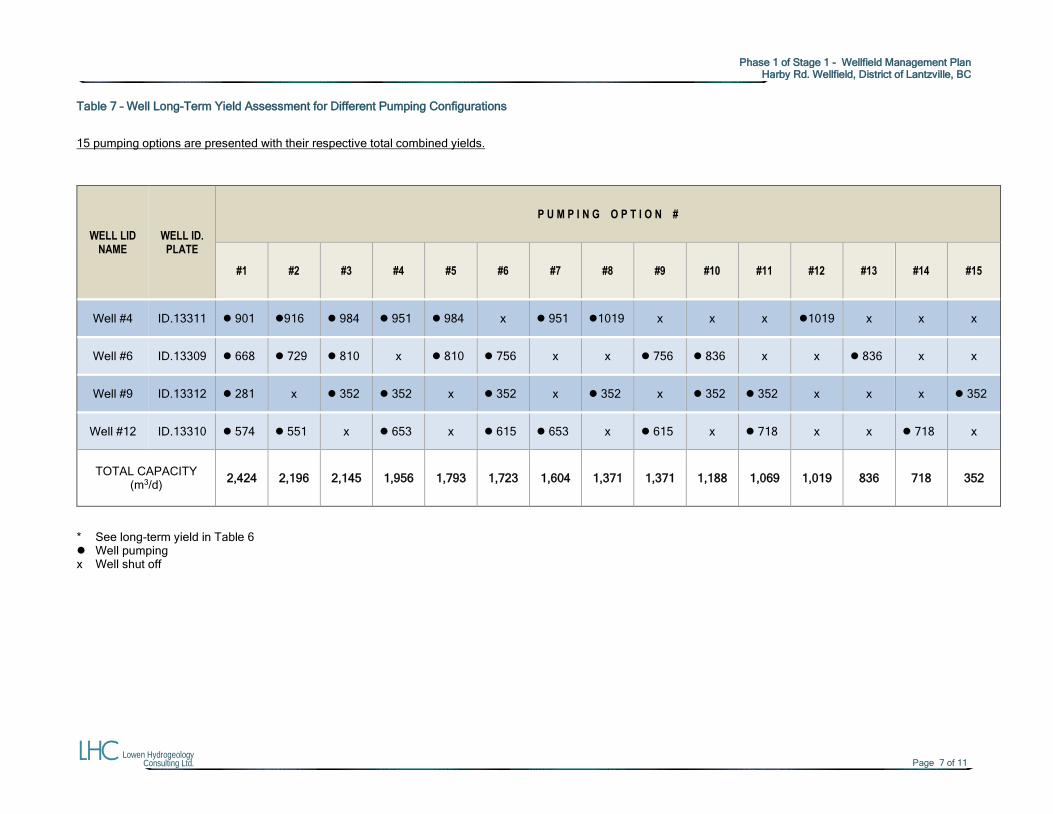
Phase 1 of Stage 1 - Wellfield Management Plan
Harby Rd. Wellfield, District of Lantzville, BC
Lowen Hydrogeology Consulting Ltd. Page 7 of 11
Table 7 – Well Long-Term Yield Assessment for Different Pumping Configurations
15 pumping options are presented with their respective total combined yields.
WELL LID NAME
WELL ID. PLATE
P U M P I N G O P T I O N #
#1 #2 #3 #4 #5 #6 #7 #8 #9 #10 #11 #12 #13 #14 #15
Well #4 ID.13311 901 916 984 951 984 x 951 1019 x x x 1019 x x x
Well #6 ID.13309 668 729 810 x 810 756 x x 756 836 x x 836 x x
Well #9 ID.13312 281 x 352 352 x 352 x 352 x 352 352 x x x 352
Well #12 ID.13310 574 551 x 653 x 615 653 x 615 x 718 x x 718 x
TOTAL CAPACITY (m3/d)
2,424 2,196 2,145 1,956 1,793 1,723 1,604 1,371 1,371 1,188 1,069 1,019 836 718 352
* See long-term yield in Table 6 Well pumping x Well shut off
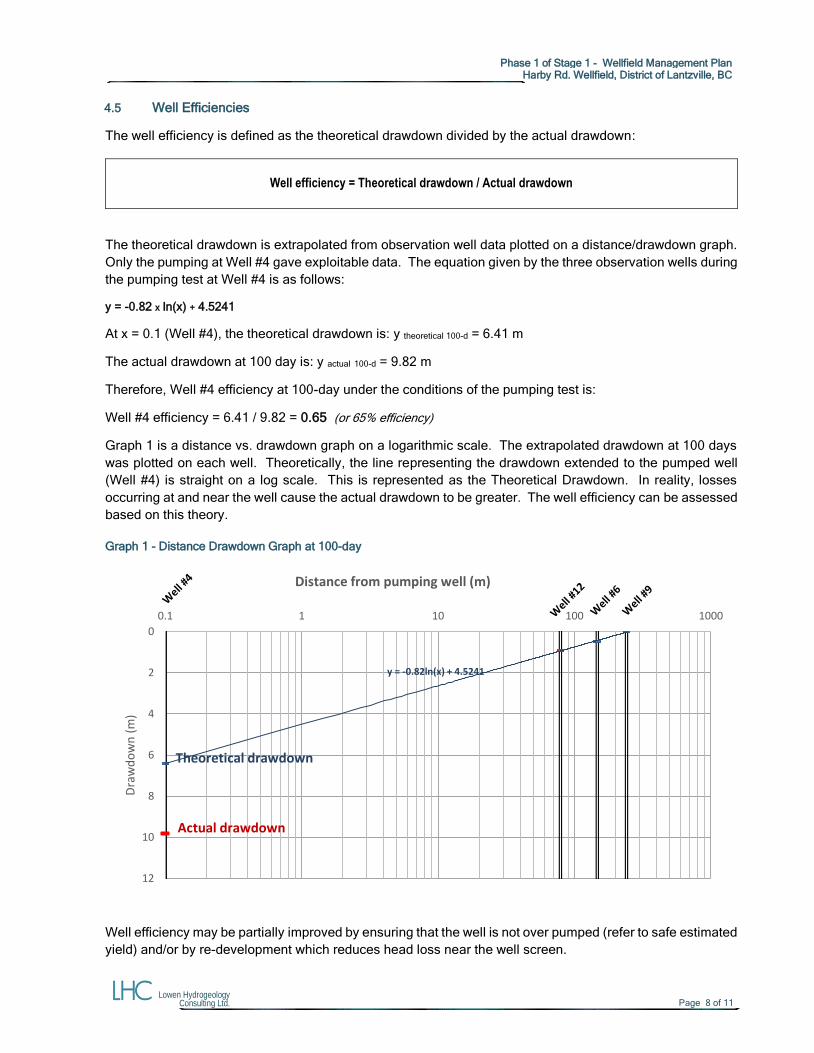
Phase 1 of Stage 1 - Wellfield Management Plan
Harby Rd. Wellfield, District of Lantzville, BC
Lowen Hydrogeology Consulting Ltd. Page 8 of 11
4.5 Well Efficiencies
The well efficiency is defined as the theoretical drawdown divided by the actual drawdown:
Well efficiency = Theoretical drawdown / Actual drawdown
The theoretical drawdown is extrapolated from observation well data plotted on a distance/drawdown graph.
Only the pumping at Well #4 gave exploitable data. The equation given by the three observation wells during
the pumping test at Well #4 is as follows:
y = -0.82 x ln(x) + 4.5241
At x = 0.1 (Well #4), the theoretical drawdown is: y theoretical 100-d = 6.41 m
The actual drawdown at 100 day is: y actual 100-d = 9.82 m
Therefore, Well #4 efficiency at 100-day under the conditions of the pumping test is:
Well #4 efficiency = 6.41 / 9.82 = 0.65 (or 65% efficiency)
Graph 1 is a distance vs. drawdown graph on a logarithmic scale. The extrapolated drawdown at 100 days
was plotted on each well. Theoretically, the line representing the drawdown extended to the pumped well
(Well #4) is straight on a log scale. This is represented as the Theoretical Drawdown. In reality, losses
occurring at and near the well cause the actual drawdown to be greater. The well efficiency can be assessed
based on this theory.
Graph 1 - Distance Drawdown Graph at 100-day
Well efficiency may be partially improved by ensuring that the well is not over pumped (refer to safe estimated
yield) and/or by re-development which reduces head loss near the well screen.
y = -0.82ln(x) + 4.5241
0
2
4
6
8
10
12
0.1 1 10 100 1000
Dra
wd
ow
n (
m)
Distance from pumping well (m)
Actual drawdown
Theoretical drawdown
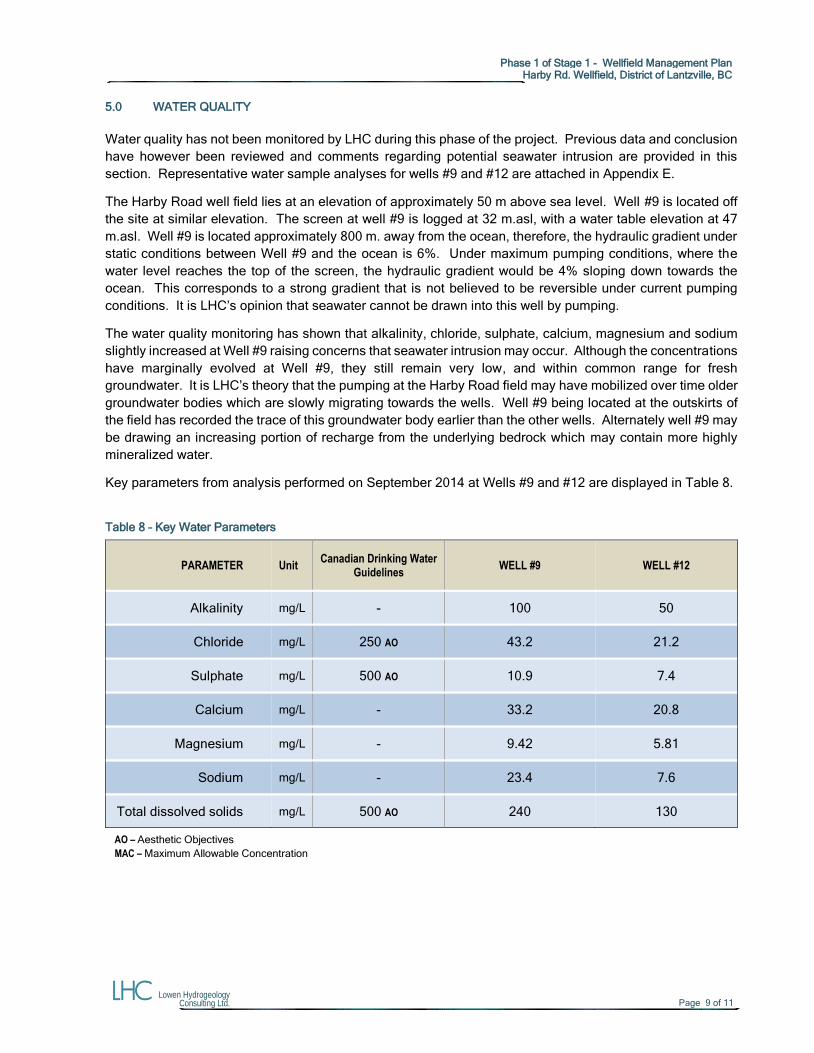
Phase 1 of Stage 1 - Wellfield Management Plan
Harby Rd. Wellfield, District of Lantzville, BC
Lowen Hydrogeology Consulting Ltd. Page 9 of 11
5.0 WATER QUALITY
Water quality has not been monitored by LHC during this phase of the project. Previous data and conclusion
have however been reviewed and comments regarding potential seawater intrusion are provided in this
section. Representative water sample analyses for wells #9 and #12 are attached in Appendix E.
The Harby Road well field lies at an elevation of approximately 50 m above sea level. Well #9 is located off
the site at similar elevation. The screen at well #9 is logged at 32 m.asl, with a water table elevation at 47
m.asl. Well #9 is located approximately 800 m. away from the ocean, therefore, the hydraulic gradient under
static conditions between Well #9 and the ocean is 6%. Under maximum pumping conditions, where the
water level reaches the top of the screen, the hydraulic gradient would be 4% sloping down towards the
ocean. This corresponds to a strong gradient that is not believed to be reversible under current pumping
conditions. It is LHC’s opinion that seawater cannot be drawn into this well by pumping.
The water quality monitoring has shown that alkalinity, chloride, sulphate, calcium, magnesium and sodium
slightly increased at Well #9 raising concerns that seawater intrusion may occur. Although the concentrations
have marginally evolved at Well #9, they still remain very low, and within common range for fresh
groundwater. It is LHC’s theory that the pumping at the Harby Road field may have mobilized over time older
groundwater bodies which are slowly migrating towards the wells. Well #9 being located at the outskirts of
the field has recorded the trace of this groundwater body earlier than the other wells. Alternately well #9 may
be drawing an increasing portion of recharge from the underlying bedrock which may contain more highly
mineralized water.
Key parameters from analysis performed on September 2014 at Wells #9 and #12 are displayed in Table 8.
Table 8 – Key Water Parameters
PARAMETER Unit Canadian Drinking Water
Guidelines WELL #9 WELL #12
Alkalinity mg/L - 100 50
Chloride mg/L 250 AO 43.2 21.2
Sulphate mg/L 500 AO 10.9 7.4
Calcium mg/L - 33.2 20.8
Magnesium mg/L - 9.42 5.81
Sodium mg/L - 23.4 7.6
Total dissolved solids mg/L 500 AO 240 130
AO – Aesthetic Objectives MAC – Maximum Allowable Concentration
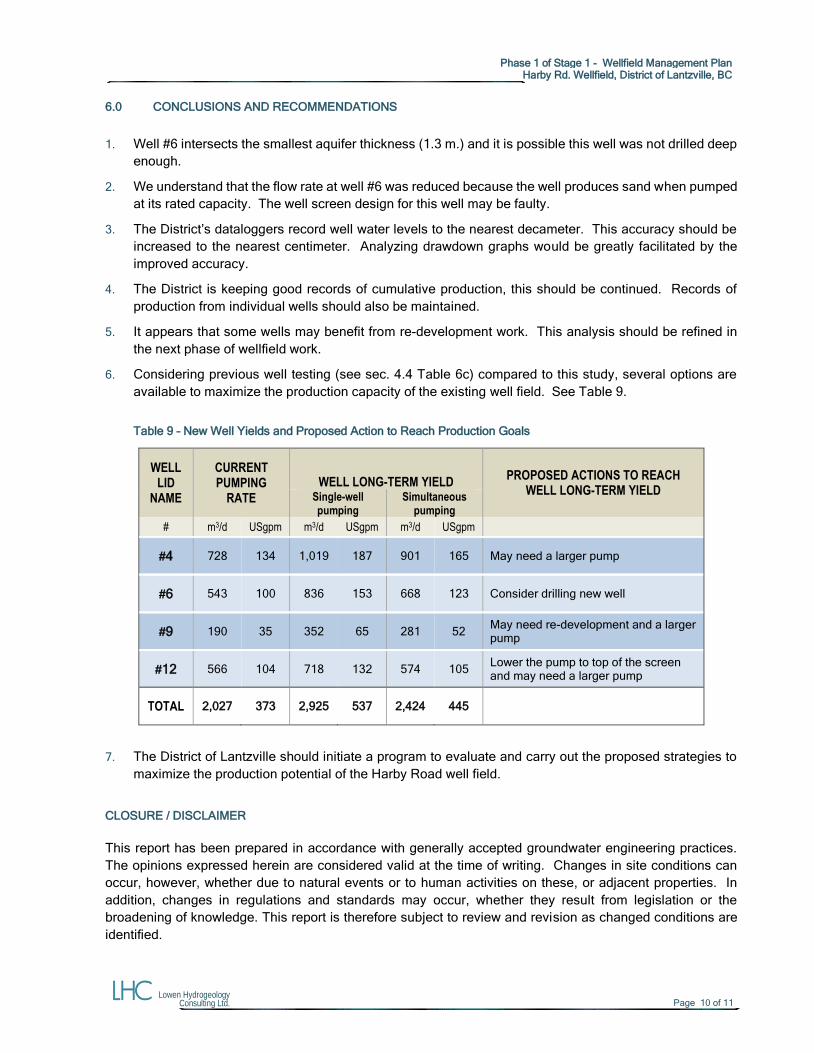
Phase 1 of Stage 1 - Wellfield Management Plan
Harby Rd. Wellfield, District of Lantzville, BC
Lowen Hydrogeology Consulting Ltd. Page 10 of 11
6.0 CONCLUSIONS AND RECOMMENDATIONS
1. Well #6 intersects the smallest aquifer thickness (1.3 m.) and it is possible this well was not drilled deep
enough.
2. We understand that the flow rate at well #6 was reduced because the well produces sand when pumped
at its rated capacity. The well screen design for this well may be faulty.
3. The District’s dataloggers record well water levels to the nearest decameter. This accuracy should be
increased to the nearest centimeter. Analyzing drawdown graphs would be greatly facilitated by the
improved accuracy.
4. The District is keeping good records of cumulative production, this should be continued. Records of
production from individual wells should also be maintained.
5. It appears that some wells may benefit from re-development work. This analysis should be refined in
the next phase of wellfield work.
6. Considering previous well testing (see sec. 4.4 Table 6c) compared to this study, several options are
available to maximize the production capacity of the existing well field. See Table 9.
Table 9 – New Well Yields and Proposed Action to Reach Production Goals
WELL LID
NAME
CURRENT PUMPING
RATE
WELL LONG-TERM YIELD PROPOSED ACTIONS TO REACH
WELL LONG-TERM YIELD Single-well pumping
Simultaneous pumping
# m3/d USgpm m3/d USgpm m3/d USgpm
#4 728 134 1,019 187 901 165 May need a larger pump
#6 543 100 836 153 668 123 Consider drilling new well
#9 190 35 352 65 281 52 May need re-development and a larger pump
#12 566 104 718 132 574 105 Lower the pump to top of the screen and may need a larger pump
TOTAL 2,027 373 2,925 537 2,424 445
7. The District of Lantzville should initiate a program to evaluate and carry out the proposed strategies to
maximize the production potential of the Harby Road well field.
CLOSURE / DISCLAIMER
This report has been prepared in accordance with generally accepted groundwater engineering practices.
The opinions expressed herein are considered valid at the time of writing. Changes in site conditions can
occur, however, whether due to natural events or to human activities on these, or adjacent properties. In
addition, changes in regulations and standards may occur, whether they result from legislation or the
broadening of knowledge. This report is therefore subject to review and revision as changed conditions are
identified.
Phase 1 of Stage 1 - Wellfield Management Plan
Harby Rd. Wellfield, District of Lantzville, BC
Lowen Hydrogeology Consulting Ltd. Page 11 of 11
Well yields and water quality can vary over time due to climate change, recharge area modification, or earth
movements (earthquakes and blasting). Water quality standards also evolve over time and future revisions
of the standards may necessitate changes to the recommendations for water treatment or testing.
In formulating our analyses, conclusions and recommendations we have relied on information supplied by
others; well drilling contractors, pumping test contractors and a certified water testing laboratory. The
information provided by others is believed to be accurate but cannot be guaranteed. If the recommendations
in this report are not implemented, we assume no responsibility for any adverse consequences that may
result.
If you have any questions or require any further information, please contact the undersigned.
Respectfully Submitted,
LOWEN HYDROGEOLOGY CONSULTING LTD.
Dennis A. Lowen, P. Eng., P.Geo.
Senior Hydrogeologist
Marion Dardare, M.Sc.
Hydrogeologist
Phase 1 of Stage 1 - Wellfield Management Plan
Harby Rd. Wellfield, District of Lantzville, BC
Lowen Hydrogeology Consulting Ltd. References - Page 1 of 1
REFERENCES
Reports
Chatwin Engineering Ltd. (1996), Lantzville Improvement District – Arrowsmith Water Service
AGRA Earth & Environmental Ltd. (1999), Well #14 and Well #15 Drilling and Testing Program, District of Lantzville, BC
Lantzville Improvement District (2001), Community Water System Report
EBA Engineering Consultants Ltd. (2002), Harby Road Well Field Management Phase 1 – Final Report Lantzville, BC
District of Lantzville (2013), Annual Water Report
J.J. Clague (1975), Quadra Sand and its relation to the late Wisconsin glaciation of southwest British Columbia
RDN Water Budget Project Report, Water Region #5, Waterline Resources, 2012
Evaluating Long-term Well Capacity for Certification of Public Convenience and Necessity, BC, MOE, 1999
Websites
Imap BC: http://maps.gov.bc.ca/ess/sv/imapbc/
Climate Canada: http://climate.weather.gc.ca/
Statistics Canada: http://www12.statcan.gc.ca/

APPENDIX A
Figures
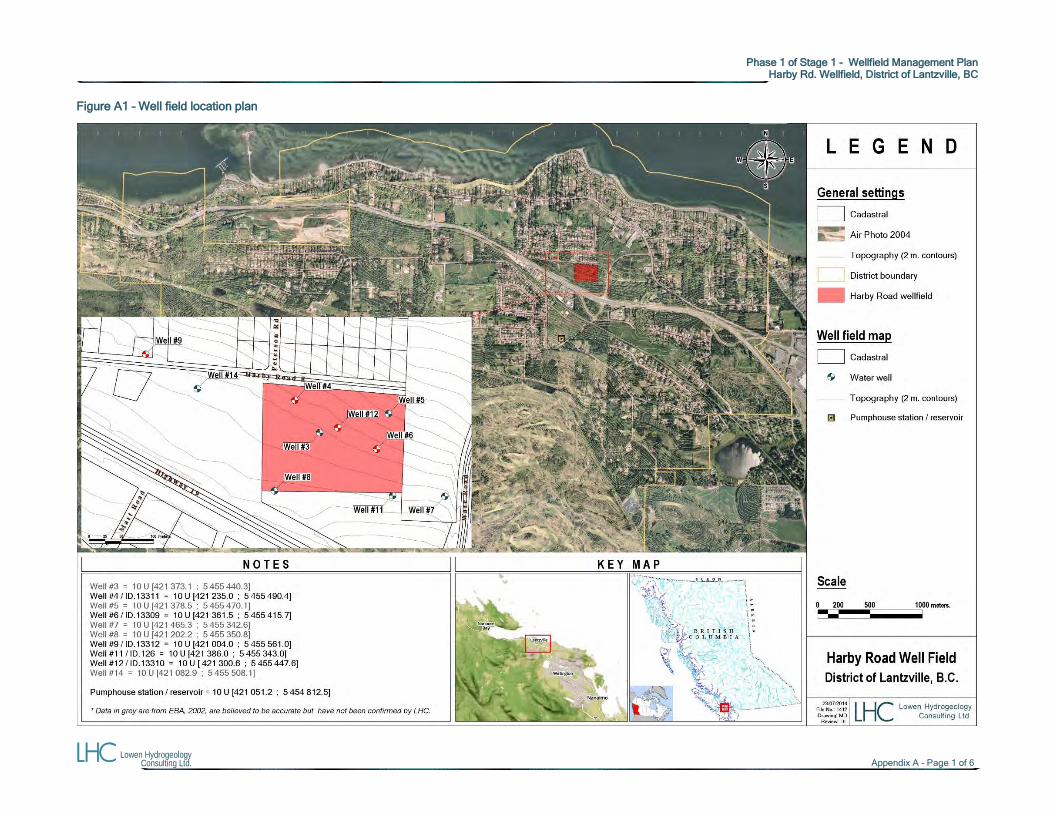
Phase 1 of Stage 1 - Wellfield Management Plan
Harby Rd. Wellfield, District of Lantzville, BC
Lowen Hydrogeology Consulting Ltd. Appendix A - Page 1 of 6
Figure A1 – Well field location plan
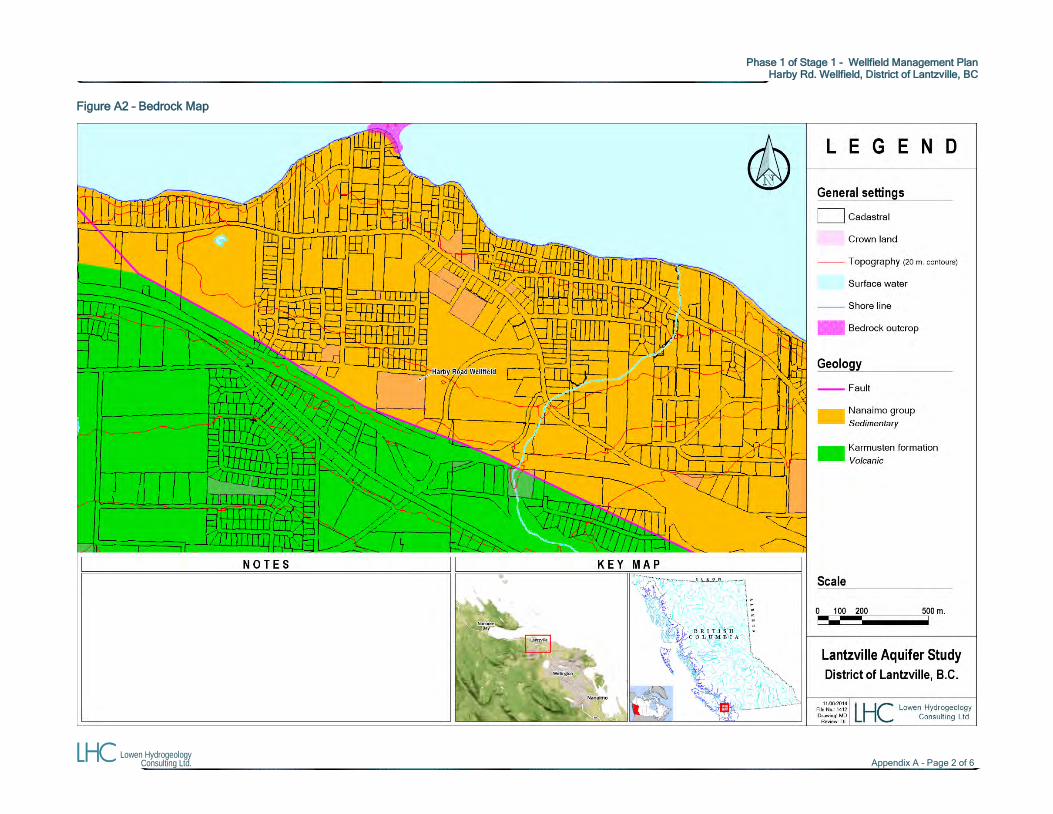
Phase 1 of Stage 1 - Wellfield Management Plan
Harby Rd. Wellfield, District of Lantzville, BC
Lowen Hydrogeology Consulting Ltd. Appendix A - Page 2 of 6
Figure A2 – Bedrock Map
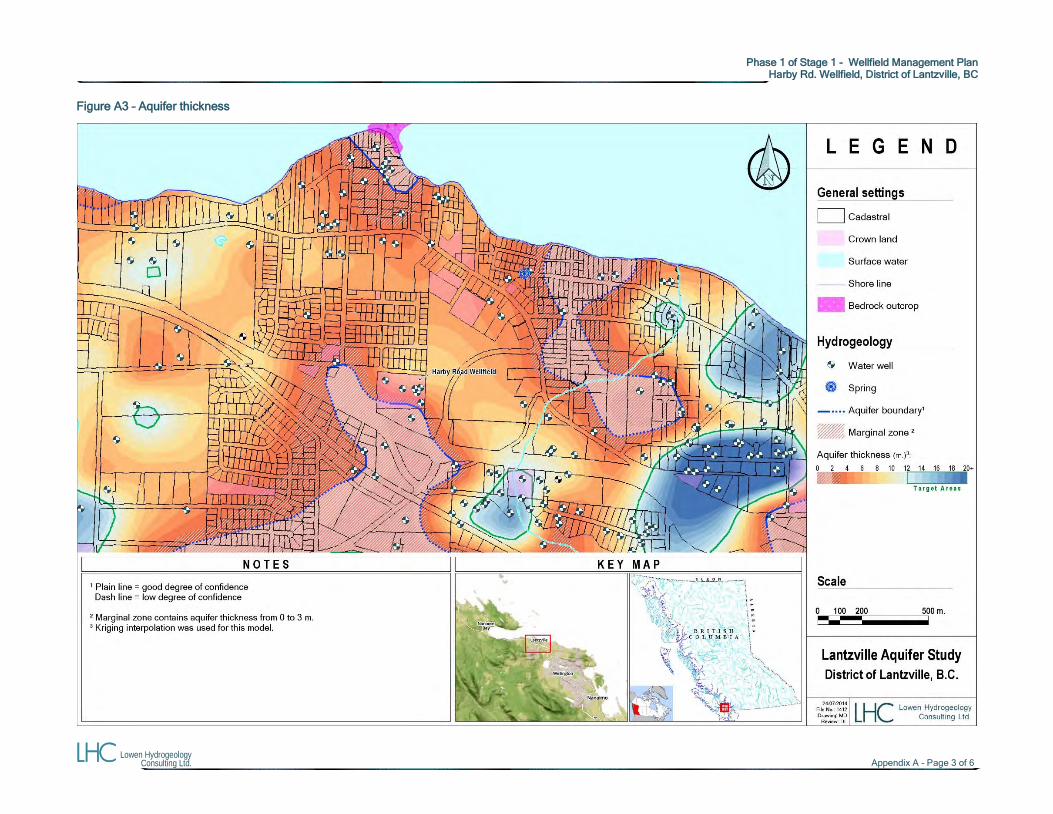
Phase 1 of Stage 1 - Wellfield Management Plan
Harby Rd. Wellfield, District of Lantzville, BC
Lowen Hydrogeology Consulting Ltd. Appendix A - Page 3 of 6
Figure A3 – Aquifer thickness
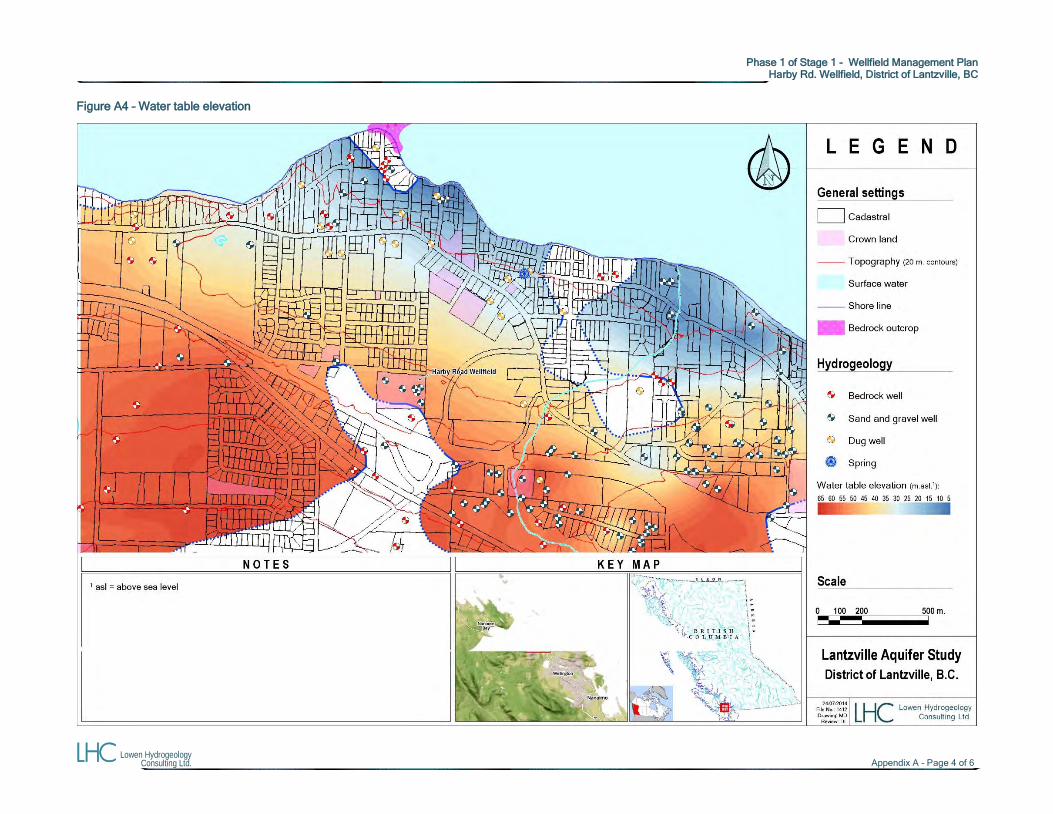
Phase 1 of Stage 1 - Wellfield Management Plan
Harby Rd. Wellfield, District of Lantzville, BC
Lowen Hydrogeology Consulting Ltd. Appendix A - Page 4 of 6
Figure A4 – Water table elevation
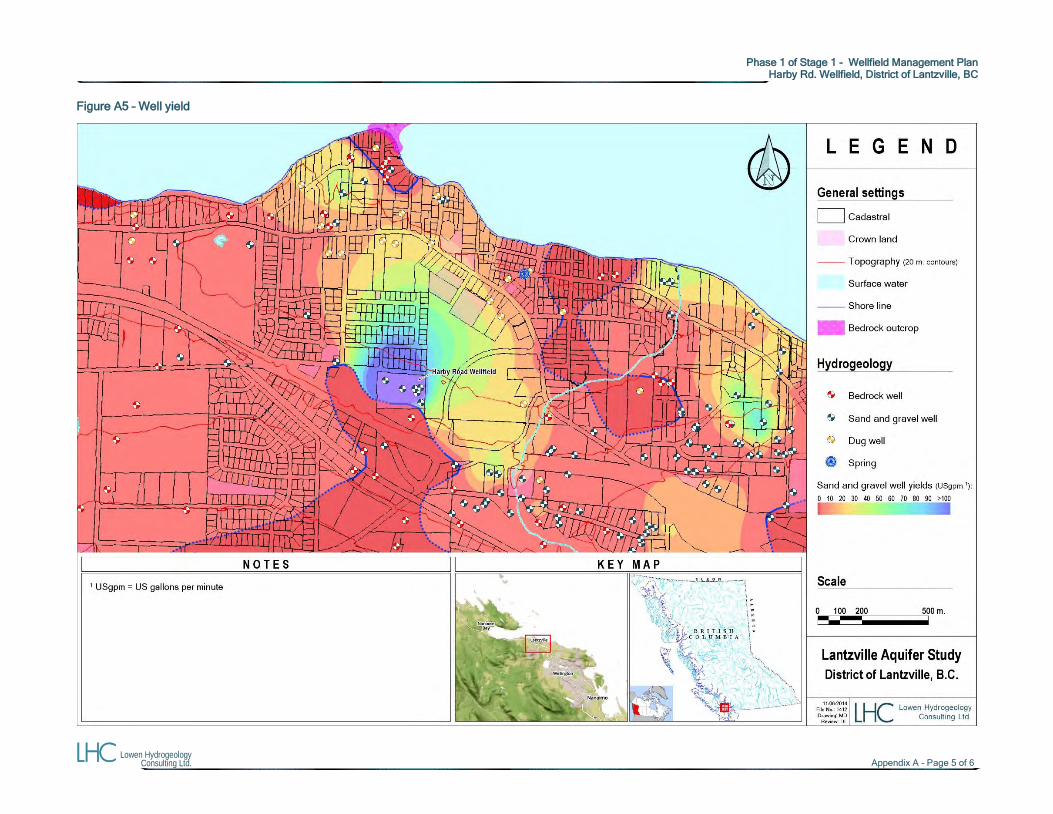
Phase 1 of Stage 1 - Wellfield Management Plan
Harby Rd. Wellfield, District of Lantzville, BC
Lowen Hydrogeology Consulting Ltd. Appendix A - Page 5 of 6
Figure A5 – Well yield
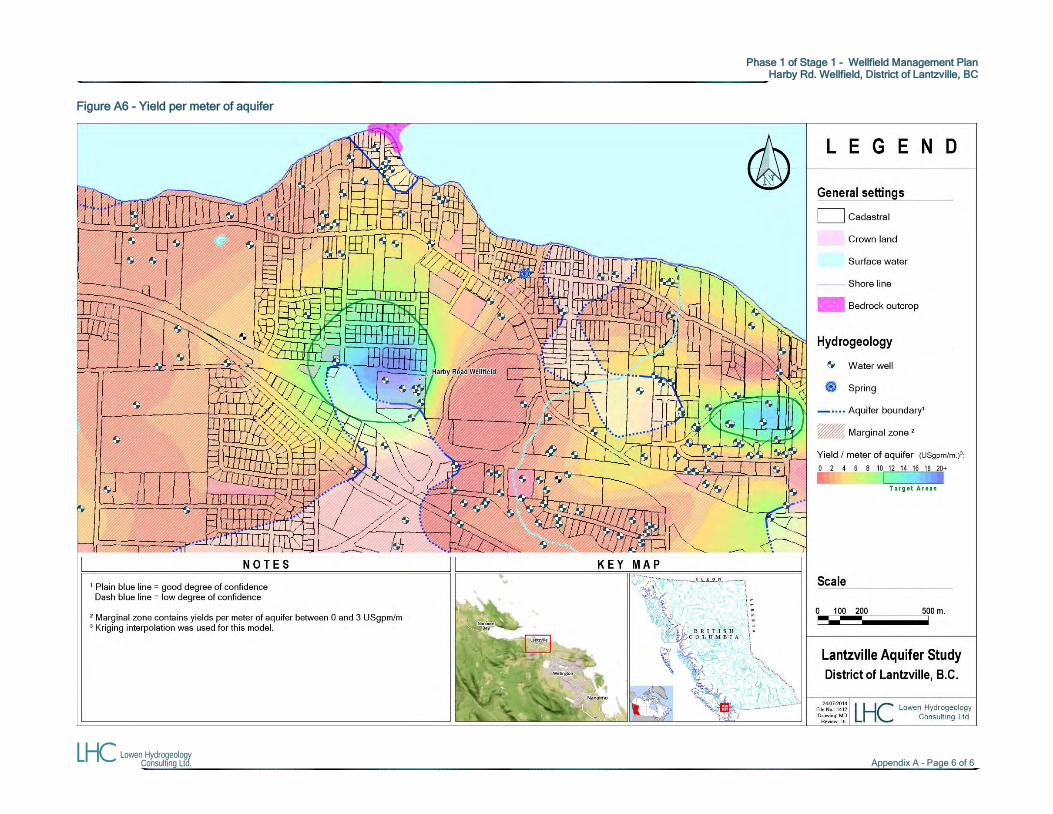
Phase 1 of Stage 1 - Wellfield Management Plan
Harby Rd. Wellfield, District of Lantzville, BC
Lowen Hydrogeology Consulting Ltd. Appendix A - Page 6 of 6
Figure A6 - Yield per meter of aquifer

APPENDIX B
Historical Data
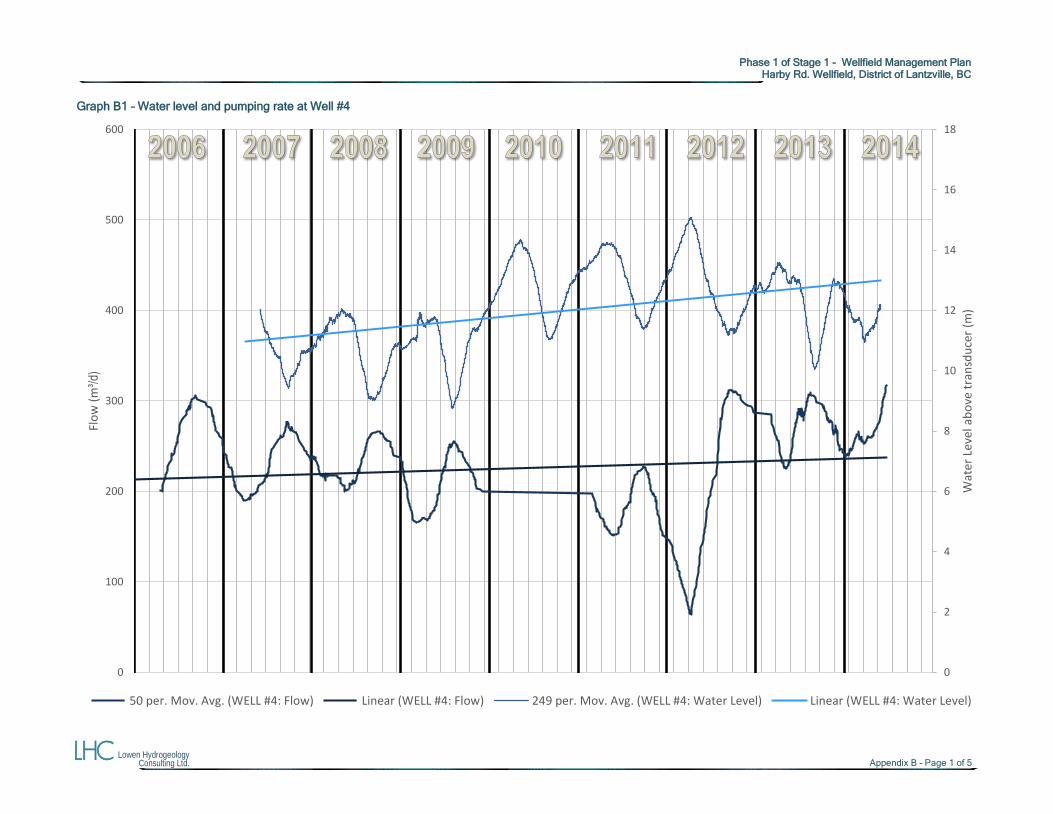
Phase 1 of Stage 1 - Wellfield Management Plan
Harby Rd. Wellfield, District of Lantzville, BC
Lowen Hydrogeology Consulting Ltd. Appendix B – Page 1 of 5
Graph B1 – Water level and pumping rate at Well #4
0
2
4
6
8
10
12
14
16
18
0
100
200
300
400
500
600
Wat
er L
evel
ab
ove
tra
nsd
uce
r (m
)
Flo
w (
m³/
d)
50 per. Mov. Avg. (WELL #4: Flow) Linear (WELL #4: Flow) 249 per. Mov. Avg. (WELL #4: Water Level) Linear (WELL #4: Water Level)
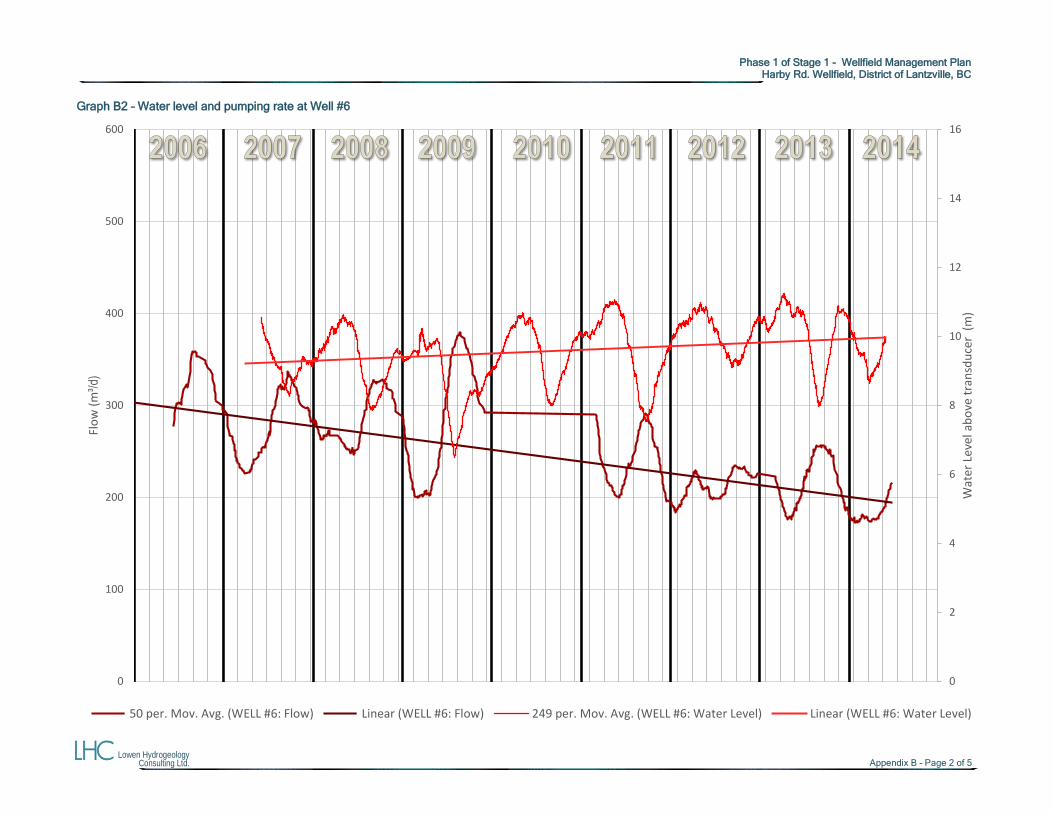
Phase 1 of Stage 1 - Wellfield Management Plan
Harby Rd. Wellfield, District of Lantzville, BC
Lowen Hydrogeology Consulting Ltd. Appendix B – Page 2 of 5
Graph B2 – Water level and pumping rate at Well #6
0
2
4
6
8
10
12
14
16
0
100
200
300
400
500
600
Wat
er L
evel
ab
ove
tra
nsd
uce
r (
m)
Flo
w (
m³/
d)
50 per. Mov. Avg. (WELL #6: Flow) Linear (WELL #6: Flow) 249 per. Mov. Avg. (WELL #6: Water Level) Linear (WELL #6: Water Level)
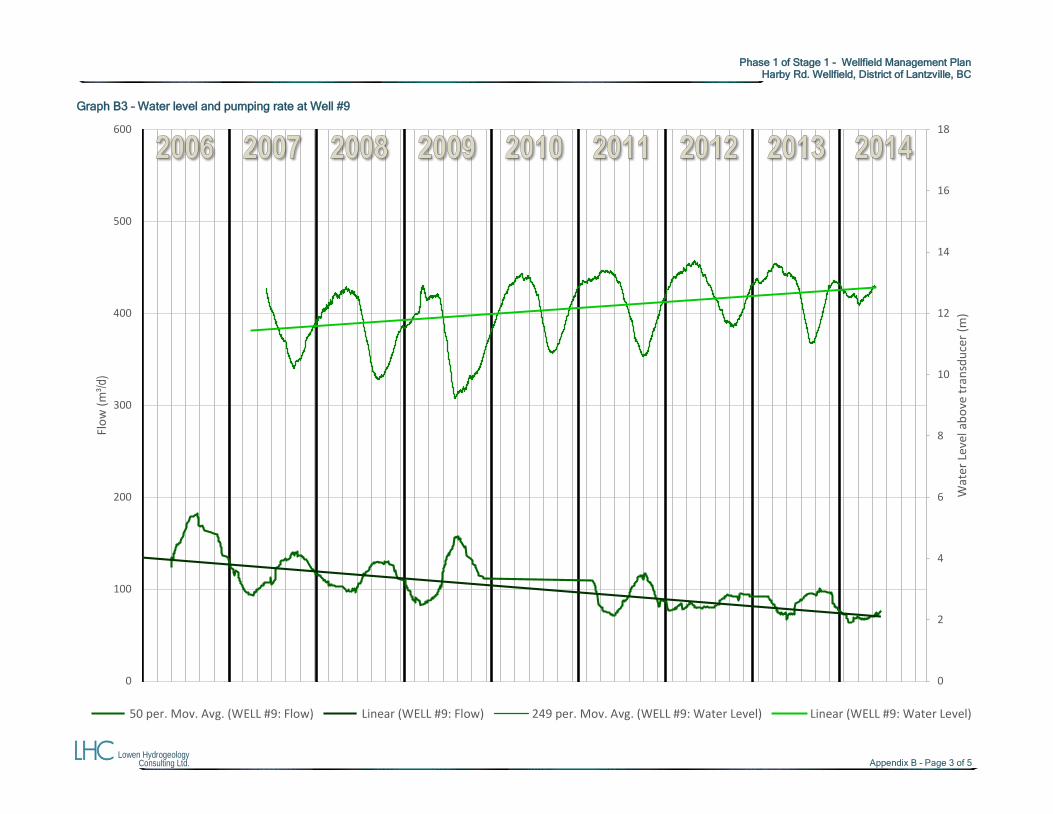
Phase 1 of Stage 1 - Wellfield Management Plan
Harby Rd. Wellfield, District of Lantzville, BC
Lowen Hydrogeology Consulting Ltd. Appendix B – Page 3 of 5
Graph B3 – Water level and pumping rate at Well #9
0
2
4
6
8
10
12
14
16
18
0
100
200
300
400
500
600
Wat
er L
evel
ab
ove
tra
nsd
uce
r (m
)
Flo
w (
m³/
d)
50 per. Mov. Avg. (WELL #9: Flow) Linear (WELL #9: Flow) 249 per. Mov. Avg. (WELL #9: Water Level) Linear (WELL #9: Water Level)
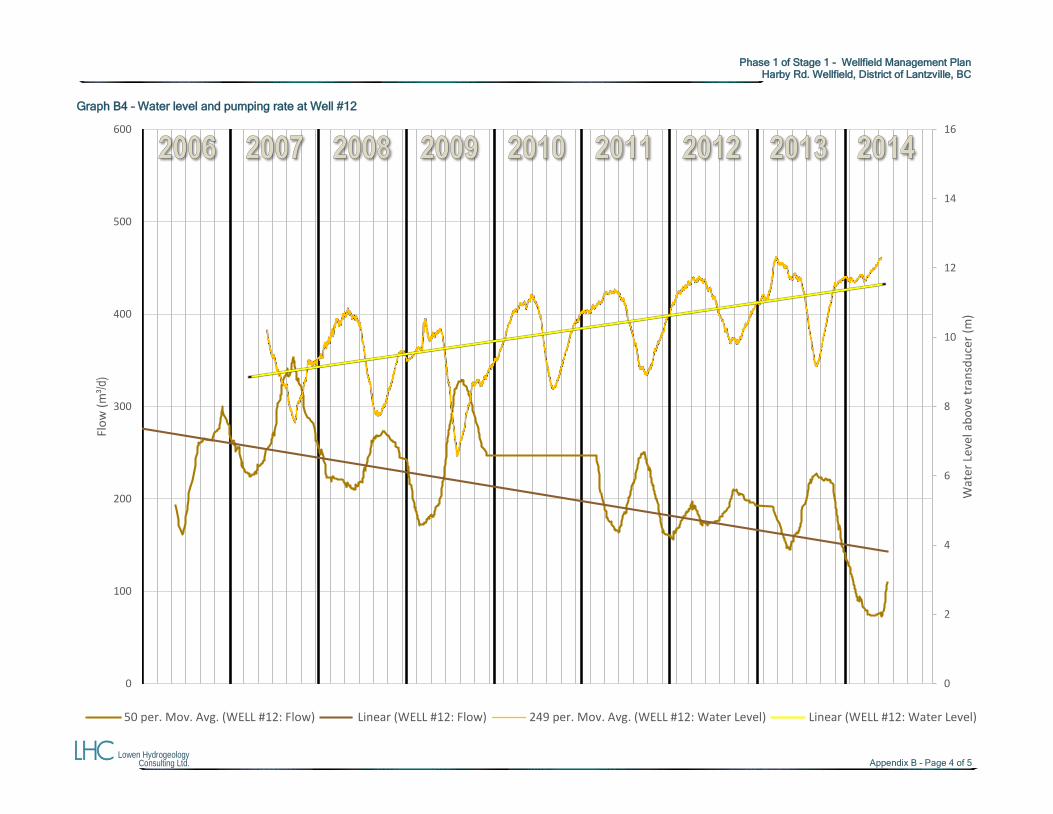
Phase 1 of Stage 1 - Wellfield Management Plan
Harby Rd. Wellfield, District of Lantzville, BC
Lowen Hydrogeology Consulting Ltd. Appendix B – Page 4 of 5
Graph B4 – Water level and pumping rate at Well #12
0
2
4
6
8
10
12
14
16
0
100
200
300
400
500
600
Wat
er L
evel
ab
ove
tra
nsd
uce
r (m
)
Flo
w (
m³/
d)
50 per. Mov. Avg. (WELL #12: Flow) Linear (WELL #12: Flow) 249 per. Mov. Avg. (WELL #12: Water Level) Linear (WELL #12: Water Level)
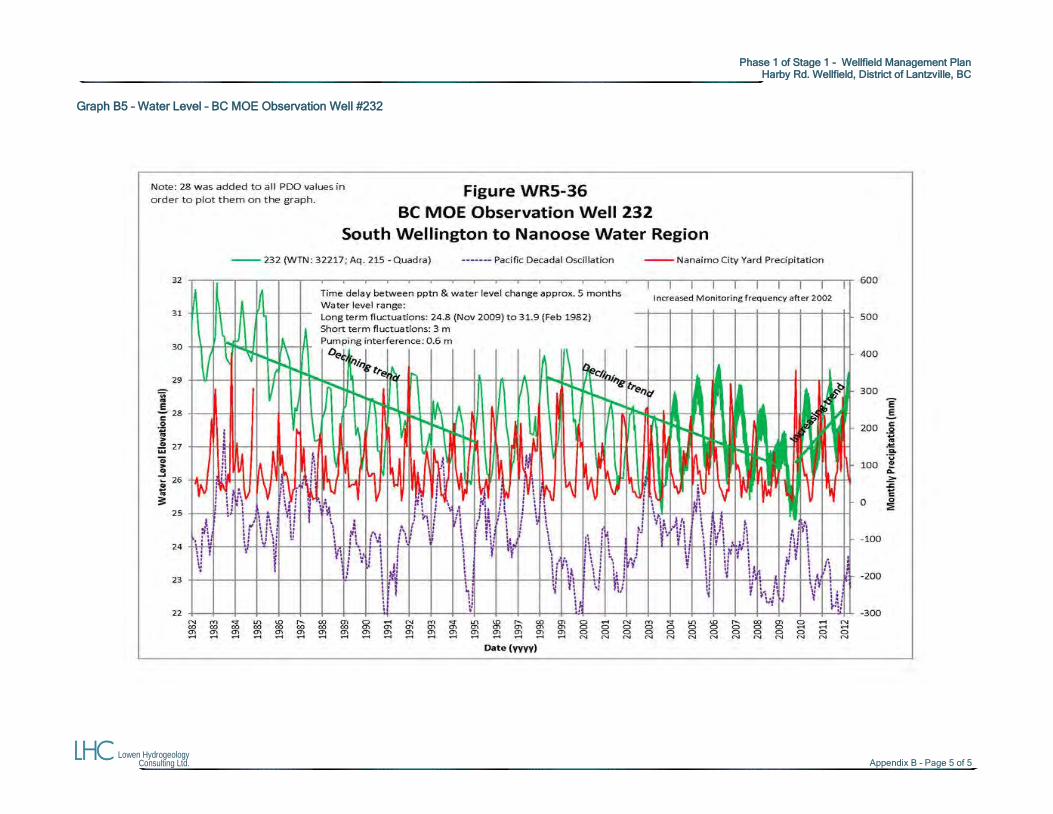
Phase 1 of Stage 1 - Wellfield Management Plan
Harby Rd. Wellfield, District of Lantzville, BC
Lowen Hydrogeology Consulting Ltd. Appendix B – Page 5 of 5
Graph B5 – Water Level – BC MOE Observation Well #232

APPENDIX C
Pumping Test Graphs
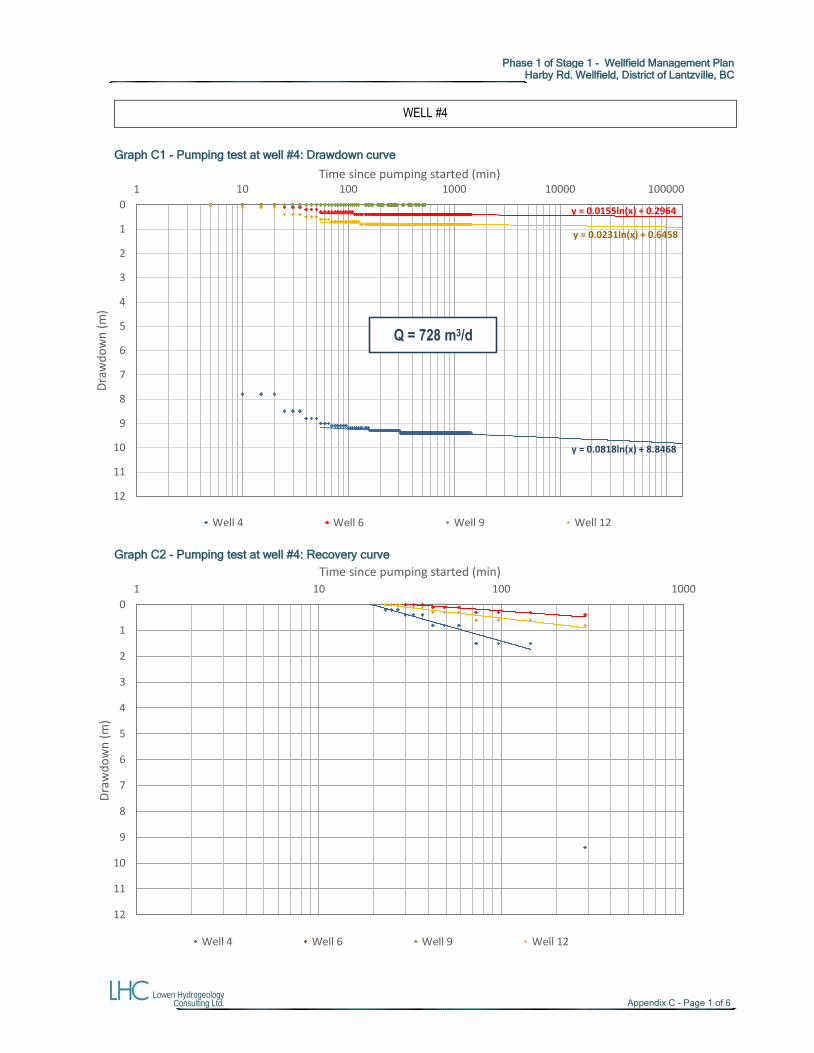
Phase 1 of Stage 1 - Wellfield Management Plan
Harby Rd. Wellfield, District of Lantzville, BC
Lowen Hydrogeology Consulting Ltd. Appendix C - Page 1 of 6
WELL #4
Graph C1 - Pumping test at well #4: Drawdown curve
Graph C2 - Pumping test at well #4: Recovery curve
y = 0.0818ln(x) + 8.8468
y = 0.0155ln(x) + 0.2964
y = 0.0231ln(x) + 0.6458
0
1
2
3
4
5
6
7
8
9
10
11
12
1 10 100 1000 10000 100000
Dra
wd
ow
n (
m)
Time since pumping started (min)
Well 4 Well 6 Well 9 Well 12
0
1
2
3
4
5
6
7
8
9
10
11
12
1 10 100 1000
Dra
wd
ow
n (
m)
Time since pumping started (min)
Well 4 Well 6 Well 9 Well 12
Q = 728 m3/d
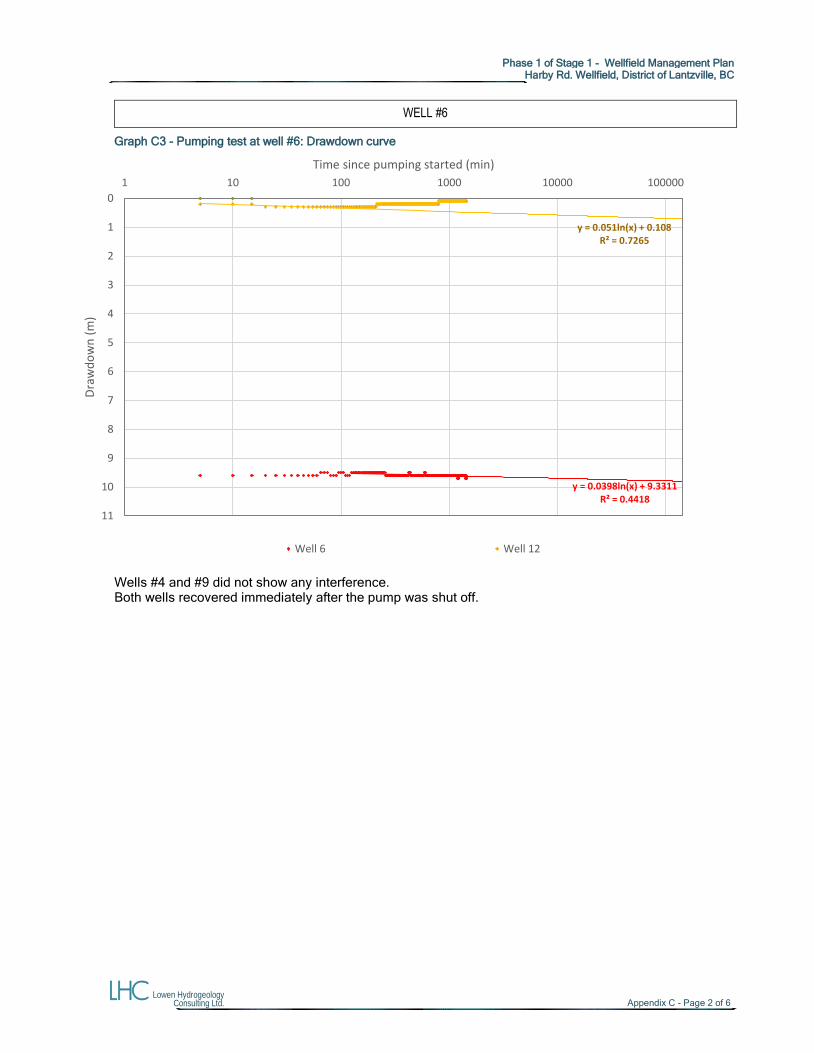
Phase 1 of Stage 1 - Wellfield Management Plan
Harby Rd. Wellfield, District of Lantzville, BC
Lowen Hydrogeology Consulting Ltd. Appendix C - Page 2 of 6
WELL #6
Graph C3 - Pumping test at well #6: Drawdown curve
Wells #4 and #9 did not show any interference. Both wells recovered immediately after the pump was shut off.
y = 0.0398ln(x) + 9.3311R² = 0.4418
y = 0.051ln(x) + 0.108R² = 0.7265
0
1
2
3
4
5
6
7
8
9
10
11
1 10 100 1000 10000 100000
Dra
wd
ow
n (
m)
Time since pumping started (min)
Well 6 Well 12
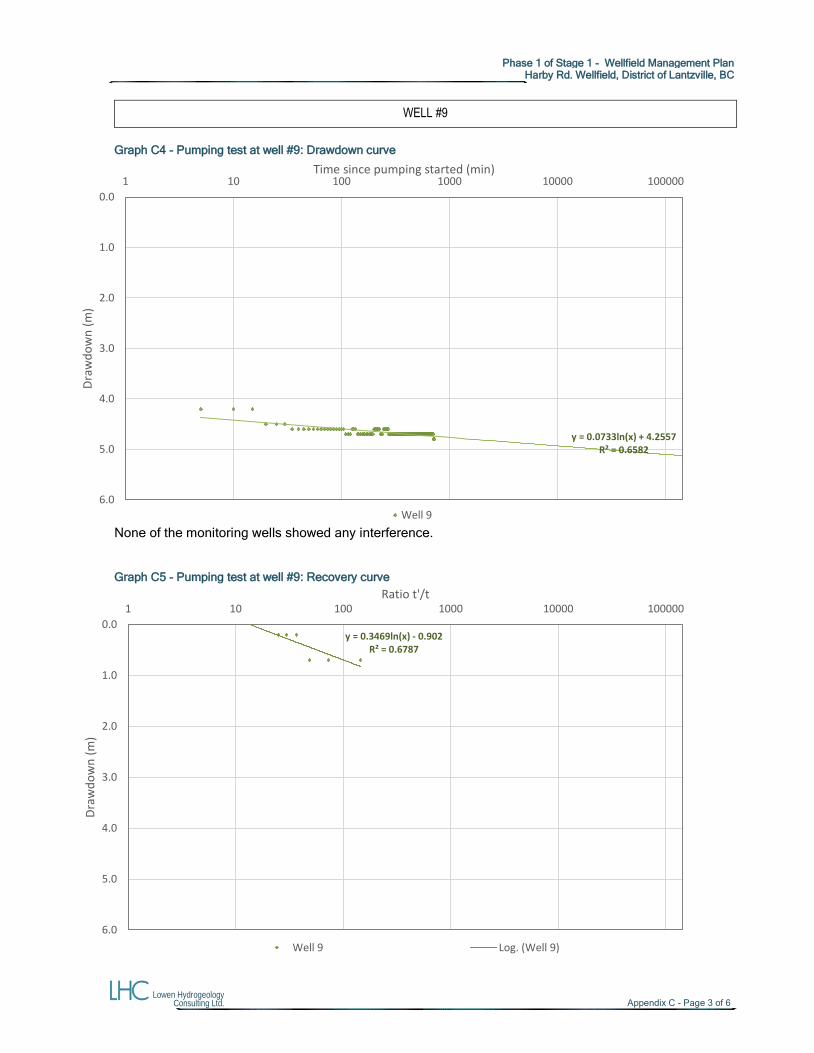
Phase 1 of Stage 1 - Wellfield Management Plan
Harby Rd. Wellfield, District of Lantzville, BC
Lowen Hydrogeology Consulting Ltd. Appendix C - Page 3 of 6
WELL #9
Graph C4 - Pumping test at well #9: Drawdown curve
None of the monitoring wells showed any interference. Graph C5 - Pumping test at well #9: Recovery curve
y = 0.0733ln(x) + 4.2557R² = 0.6582
0.0
1.0
2.0
3.0
4.0
5.0
6.0
1 10 100 1000 10000 100000
Dra
wd
ow
n (
m)
Time since pumping started (min)
Well 9
y = 0.3469ln(x) - 0.902R² = 0.6787
0.0
1.0
2.0
3.0
4.0
5.0
6.0
1 10 100 1000 10000 100000
Dra
wd
ow
n (
m)
Ratio t'/t
Well 9 Log. (Well 9)
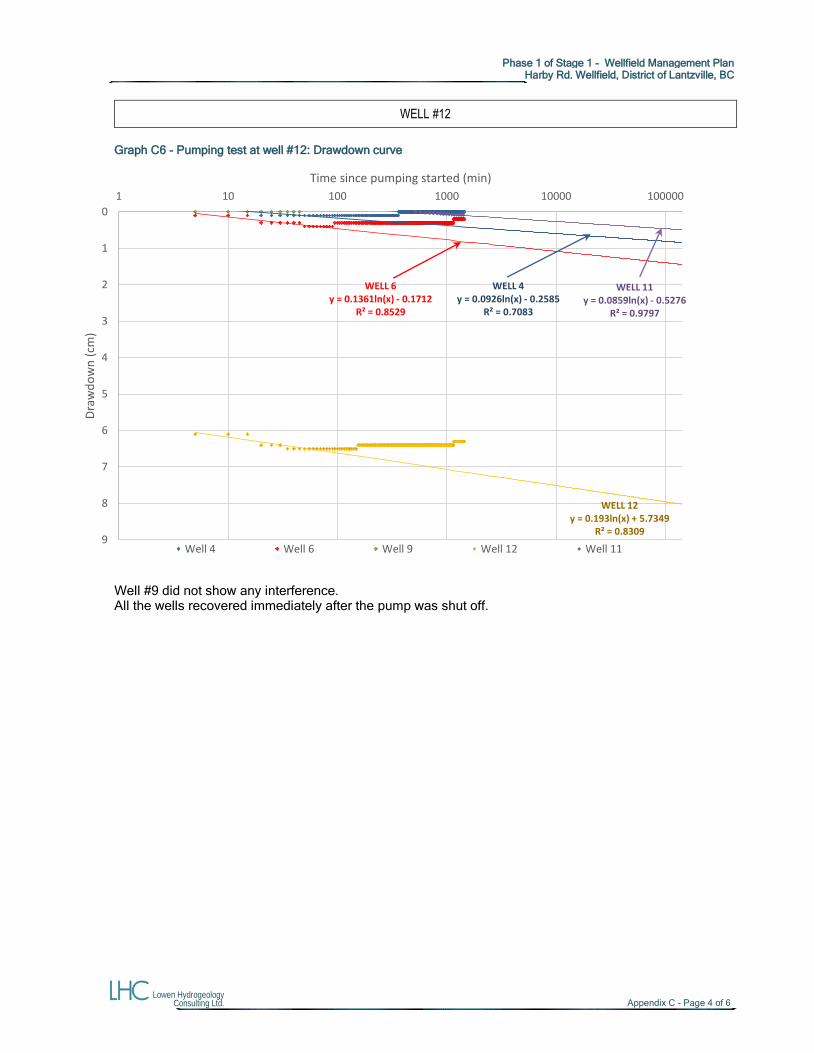
Phase 1 of Stage 1 - Wellfield Management Plan
Harby Rd. Wellfield, District of Lantzville, BC
Lowen Hydrogeology Consulting Ltd. Appendix C - Page 4 of 6
WELL #12
Graph C6 - Pumping test at well #12: Drawdown curve
Well #9 did not show any interference. All the wells recovered immediately after the pump was shut off.
WELL 4y = 0.0926ln(x) - 0.2585
R² = 0.7083
WELL 6y = 0.1361ln(x) - 0.1712
R² = 0.8529
WELL 12y = 0.193ln(x) + 5.7349
R² = 0.8309
WELL 11y = 0.0859ln(x) - 0.5276
R² = 0.9797
0
1
2
3
4
5
6
7
8
9
1 10 100 1000 10000 100000
Dra
wd
ow
n (
cm)
Time since pumping started (min)
Well 4 Well 6 Well 9 Well 12 Well 11
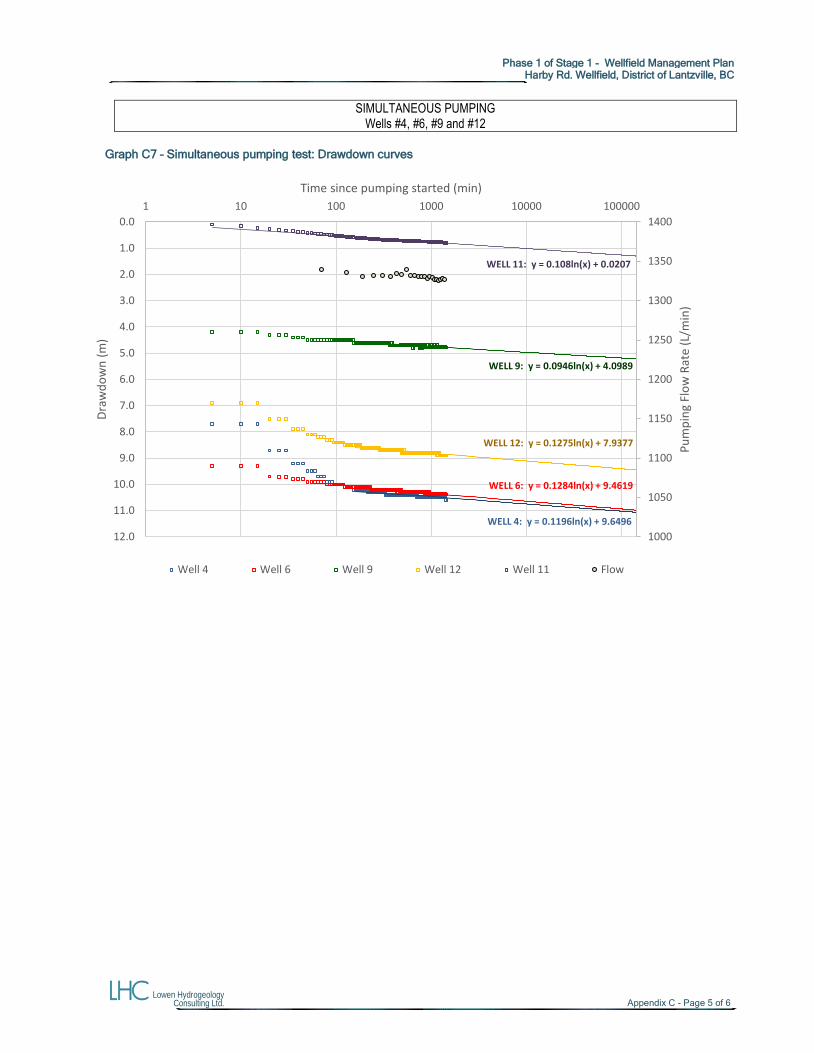
Phase 1 of Stage 1 - Wellfield Management Plan
Harby Rd. Wellfield, District of Lantzville, BC
Lowen Hydrogeology Consulting Ltd. Appendix C - Page 5 of 6
SIMULTANEOUS PUMPING Wells #4, #6, #9 and #12
Graph C7 – Simultaneous pumping test: Drawdown curves
WELL 4: y = 0.1196ln(x) + 9.6496
WELL 6: y = 0.1284ln(x) + 9.4619
WELL 9: y = 0.0946ln(x) + 4.0989
WELL 12: y = 0.1275ln(x) + 7.9377
WELL 11: y = 0.108ln(x) + 0.0207
1000
1050
1100
1150
1200
1250
1300
1350
14000.0
1.0
2.0
3.0
4.0
5.0
6.0
7.0
8.0
9.0
10.0
11.0
12.0
1 10 100 1000 10000 100000
Pu
mp
ing
Flo
w R
ate
(L/m
in)
Dra
wd
ow
n (
m)
Time since pumping started (min)
Well 4 Well 6 Well 9 Well 12 Well 11 Flow
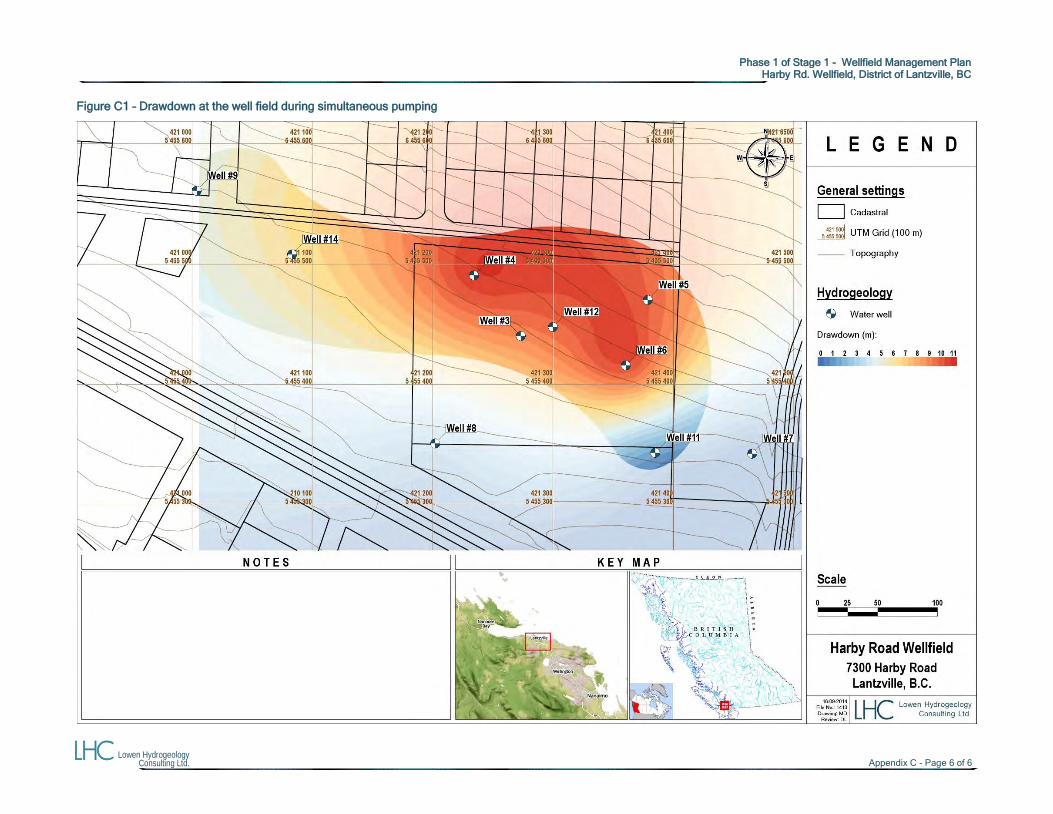
Phase 1 of Stage 1 - Wellfield Management Plan
Harby Rd. Wellfield, District of Lantzville, BC
Lowen Hydrogeology Consulting Ltd. Appendix C - Page 6 of 6
Figure C1 – Drawdown at the well field during simultaneous pumping

APPENDIX D
Well Log Records
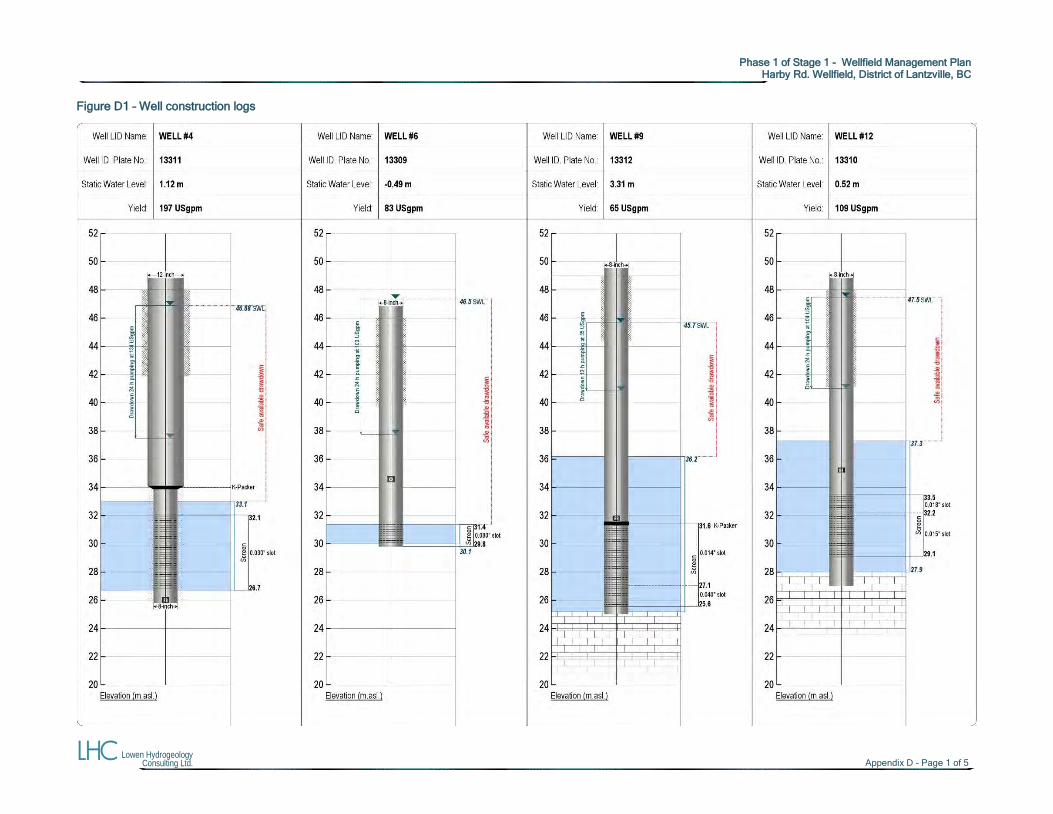
Phase 1 of Stage 1 - Wellfield Management Plan
Harby Rd. Wellfield, District of Lantzville, BC
Lowen Hydrogeology Consulting Ltd. Appendix D - Page 1 of 5
Figure D1 – Well construction logs
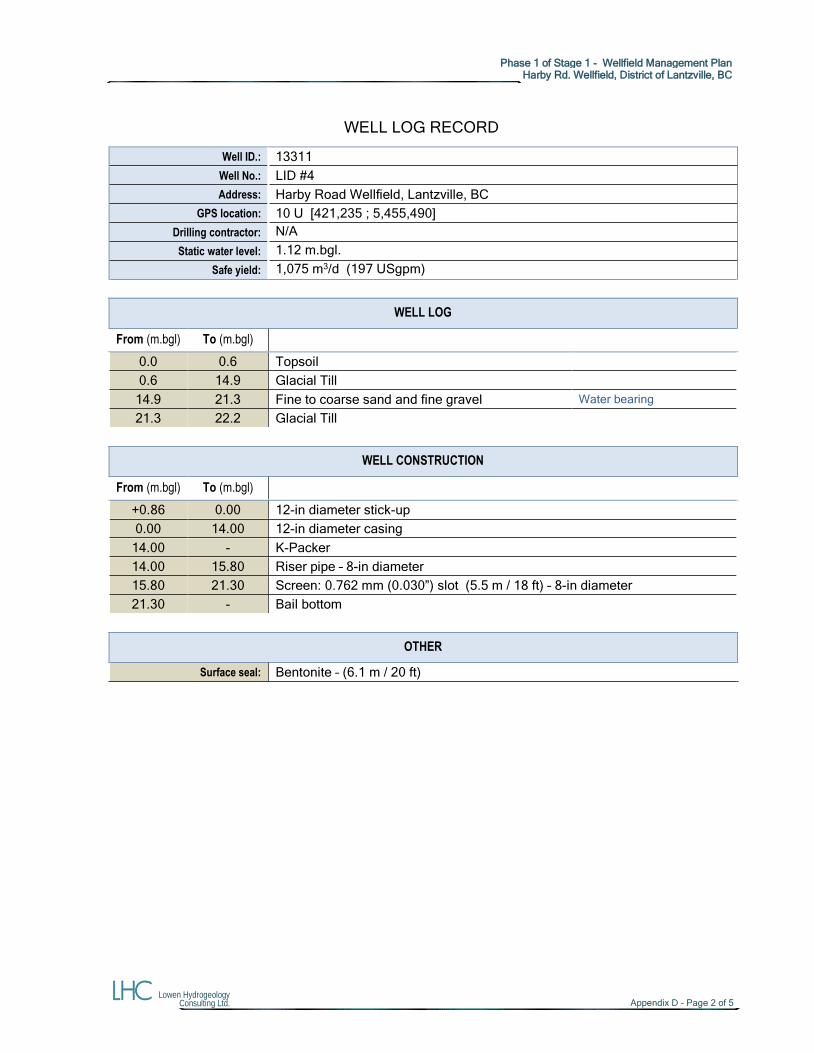
Phase 1 of Stage 1 - Wellfield Management Plan
Harby Rd. Wellfield, District of Lantzville, BC
Lowen Hydrogeology Consulting Ltd. Appendix D - Page 2 of 5
WELL LOG RECORD
Well ID.: 13311
Well No.: LID #4
Address: Harby Road Wellfield, Lantzville, BC
GPS location: 10 U [421,235 ; 5,455,490]
Drilling contractor: N/A
Static water level: 1.12 m.bgl.
Safe yield: 1,075 m3/d (197 USgpm)
WELL LOG
From (m.bgl) To (m.bgl)
0.0 0.6 Topsoil
0.6 14.9 Glacial Till
14.9 21.3 Fine to coarse sand and fine gravel Water bearing
21.3 22.2 Glacial Till
WELL CONSTRUCTION
From (m.bgl) To (m.bgl)
+0.86 0.00 12-in diameter stick-up
0.00 14.00 12-in diameter casing
14.00 - K-Packer
14.00 15.80 Riser pipe – 8-in diameter
15.80 21.30 Screen: 0.762 mm (0.030”) slot (5.5 m / 18 ft) – 8-in diameter
21.30 - Bail bottom
OTHER
Surface seal: Bentonite – (6.1 m / 20 ft)
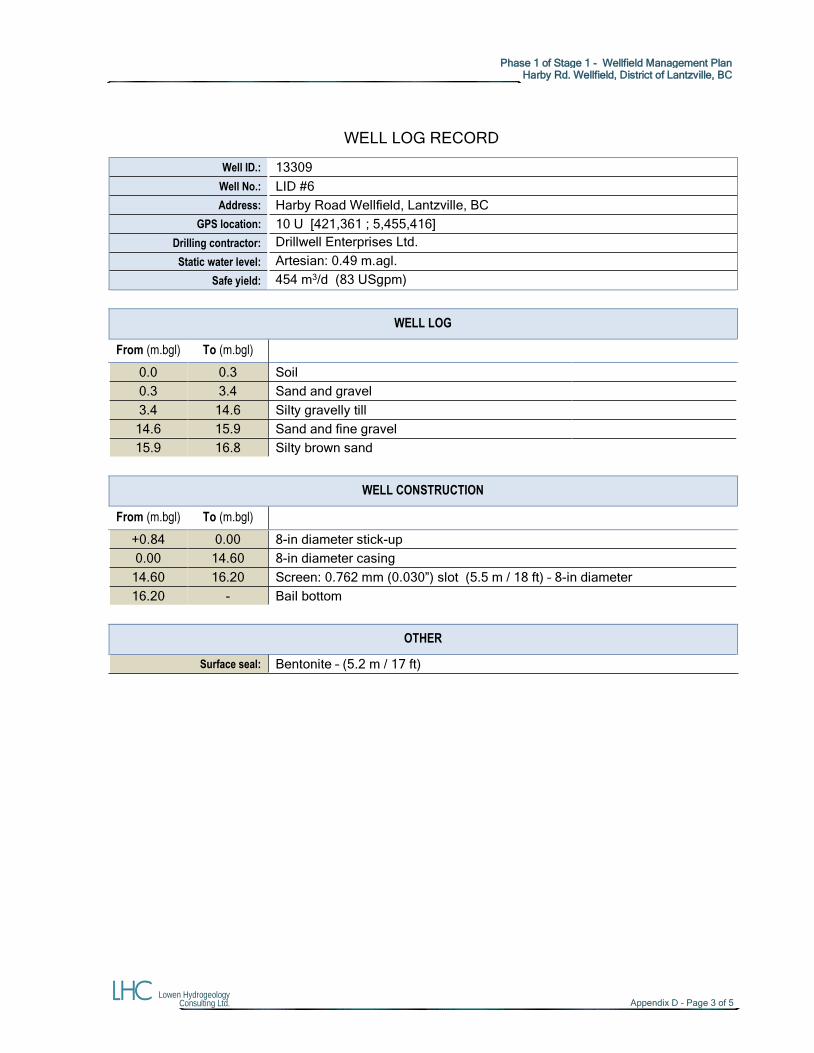
Phase 1 of Stage 1 - Wellfield Management Plan
Harby Rd. Wellfield, District of Lantzville, BC
Lowen Hydrogeology Consulting Ltd. Appendix D - Page 3 of 5
WELL LOG RECORD
Well ID.: 13309
Well No.: LID #6
Address: Harby Road Wellfield, Lantzville, BC
GPS location: 10 U [421,361 ; 5,455,416]
Drilling contractor: Drillwell Enterprises Ltd.
Static water level: Artesian: 0.49 m.agl.
Safe yield: 454 m3/d (83 USgpm)
WELL LOG
From (m.bgl) To (m.bgl)
0.0 0.3 Soil
0.3 3.4 Sand and gravel
3.4 14.6 Silty gravelly till
14.6 15.9 Sand and fine gravel
15.9 16.8 Silty brown sand
WELL CONSTRUCTION
From (m.bgl) To (m.bgl)
+0.84 0.00 8-in diameter stick-up
0.00 14.60 8-in diameter casing
14.60 16.20 Screen: 0.762 mm (0.030”) slot (5.5 m / 18 ft) – 8-in diameter
16.20 - Bail bottom
OTHER
Surface seal: Bentonite – (5.2 m / 17 ft)
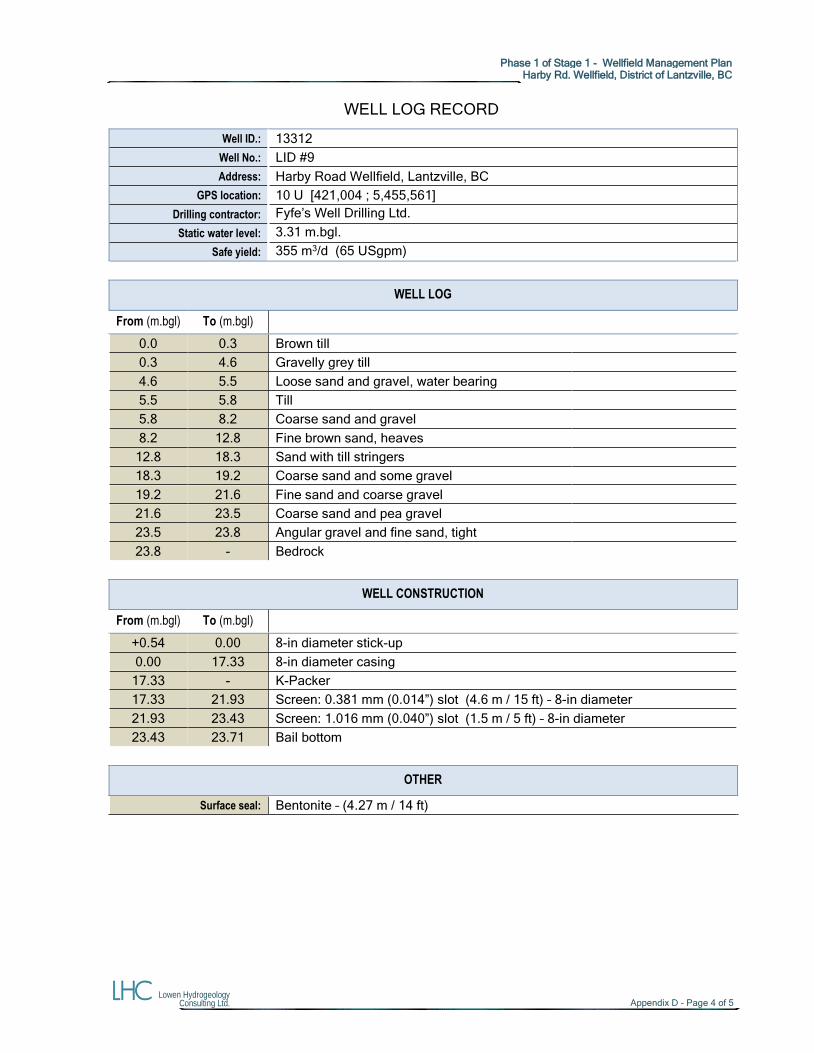
Phase 1 of Stage 1 - Wellfield Management Plan
Harby Rd. Wellfield, District of Lantzville, BC
Lowen Hydrogeology Consulting Ltd. Appendix D - Page 4 of 5
WELL LOG RECORD
Well ID.: 13312
Well No.: LID #9
Address: Harby Road Wellfield, Lantzville, BC
GPS location: 10 U [421,004 ; 5,455,561]
Drilling contractor: Fyfe’s Well Drilling Ltd.
Static water level: 3.31 m.bgl.
Safe yield: 355 m3/d (65 USgpm)
WELL LOG
From (m.bgl) To (m.bgl)
0.0 0.3 Brown till
0.3 4.6 Gravelly grey till
4.6 5.5 Loose sand and gravel, water bearing
5.5 5.8 Till
5.8 8.2 Coarse sand and gravel
8.2 12.8 Fine brown sand, heaves
12.8 18.3 Sand with till stringers
18.3 19.2 Coarse sand and some gravel
19.2 21.6 Fine sand and coarse gravel
21.6 23.5 Coarse sand and pea gravel
23.5 23.8 Angular gravel and fine sand, tight
23.8 - Bedrock
WELL CONSTRUCTION
From (m.bgl) To (m.bgl)
+0.54 0.00 8-in diameter stick-up
0.00 17.33 8-in diameter casing
17.33 - K-Packer
17.33 21.93 Screen: 0.381 mm (0.014”) slot (4.6 m / 15 ft) – 8-in diameter
21.93 23.43 Screen: 1.016 mm (0.040”) slot (1.5 m / 5 ft) – 8-in diameter
23.43 23.71 Bail bottom
OTHER
Surface seal: Bentonite – (4.27 m / 14 ft)
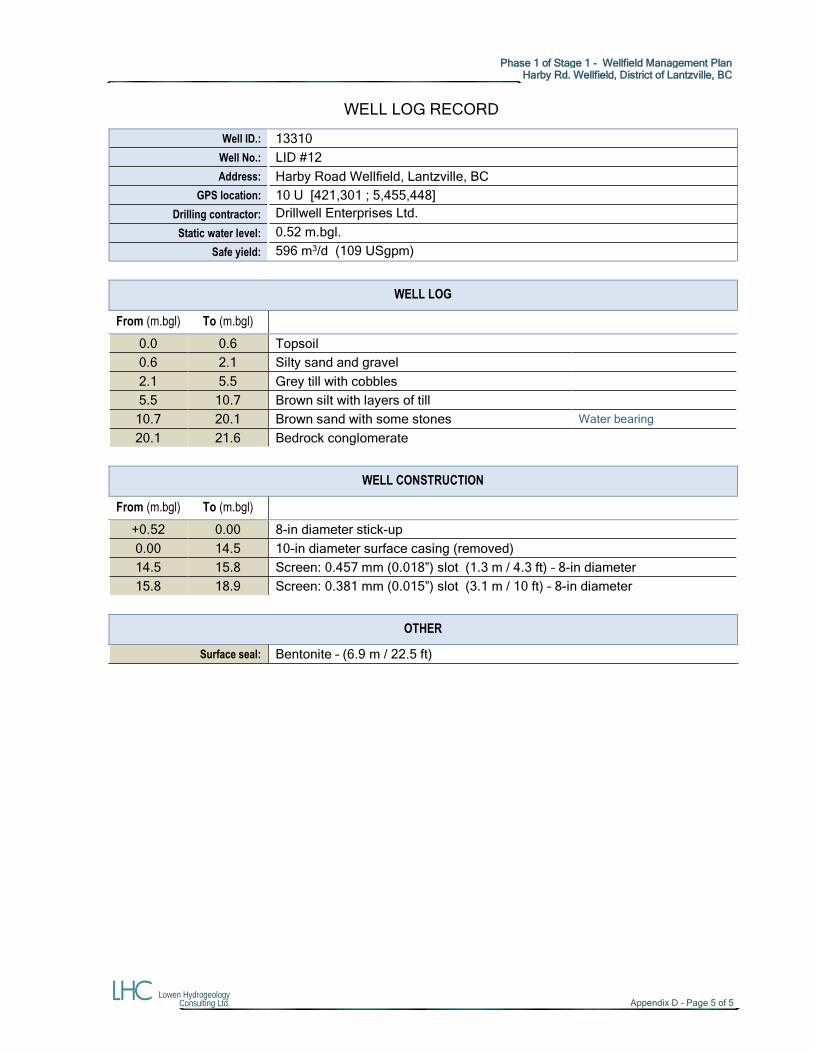
Phase 1 of Stage 1 - Wellfield Management Plan
Harby Rd. Wellfield, District of Lantzville, BC
Lowen Hydrogeology Consulting Ltd. Appendix D - Page 5 of 5
WELL LOG RECORD
Well ID.: 13310
Well No.: LID #12
Address: Harby Road Wellfield, Lantzville, BC
GPS location: 10 U [421,301 ; 5,455,448]
Drilling contractor: Drillwell Enterprises Ltd.
Static water level: 0.52 m.bgl.
Safe yield: 596 m3/d (109 USgpm)
WELL LOG
From (m.bgl) To (m.bgl)
0.0 0.6 Topsoil
0.6 2.1 Silty sand and gravel
2.1 5.5 Grey till with cobbles
5.5 10.7 Brown silt with layers of till
10.7 20.1 Brown sand with some stones Water bearing
20.1 21.6 Bedrock conglomerate
WELL CONSTRUCTION
From (m.bgl) To (m.bgl)
+0.52 0.00 8-in diameter stick-up
0.00 14.5 10-in diameter surface casing (removed)
14.5 15.8 Screen: 0.457 mm (0.018”) slot (1.3 m / 4.3 ft) – 8-in diameter
15.8 18.9 Screen: 0.381 mm (0.015”) slot (3.1 m / 10 ft) – 8-in diameter
OTHER
Surface seal: Bentonite – (6.9 m / 22.5 ft)

APPENDIX E
Wells #9 & #12 – Water Quality
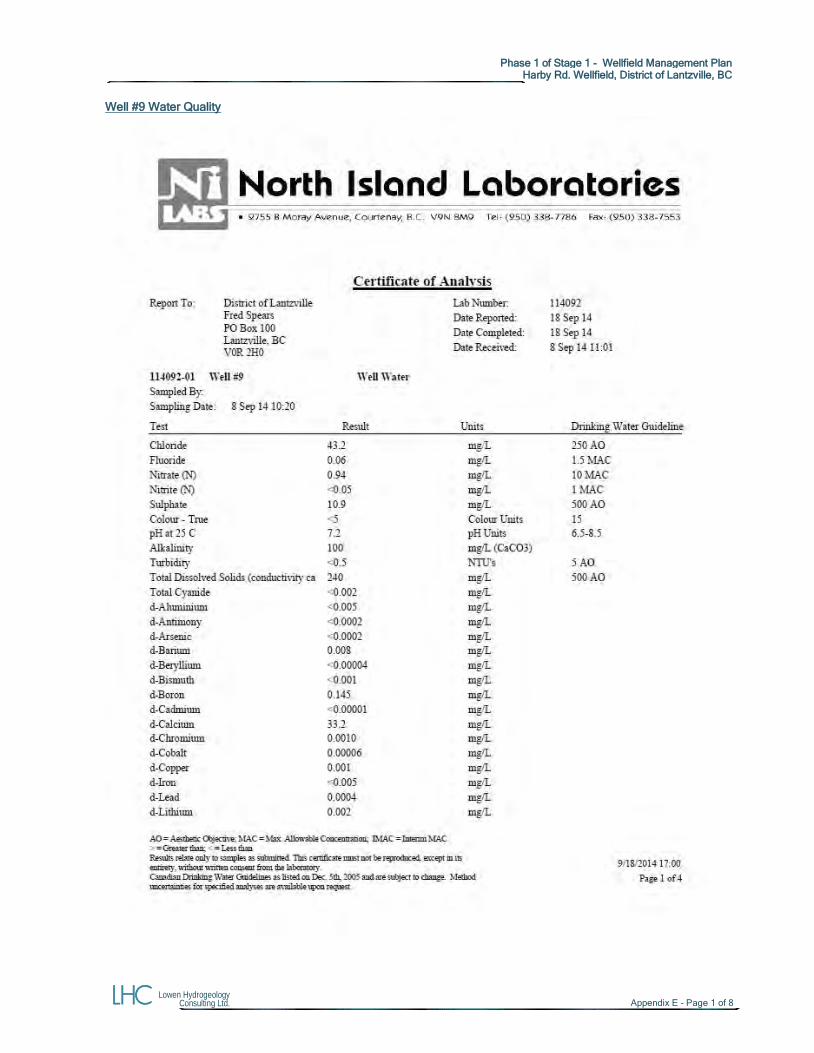
Phase 1 of Stage 1 - Wellfield Management Plan
Harby Rd. Wellfield, District of Lantzville, BC
Lowen Hydrogeology Consulting Ltd. Appendix E - Page 1 of 8
Well #9 Water Quality
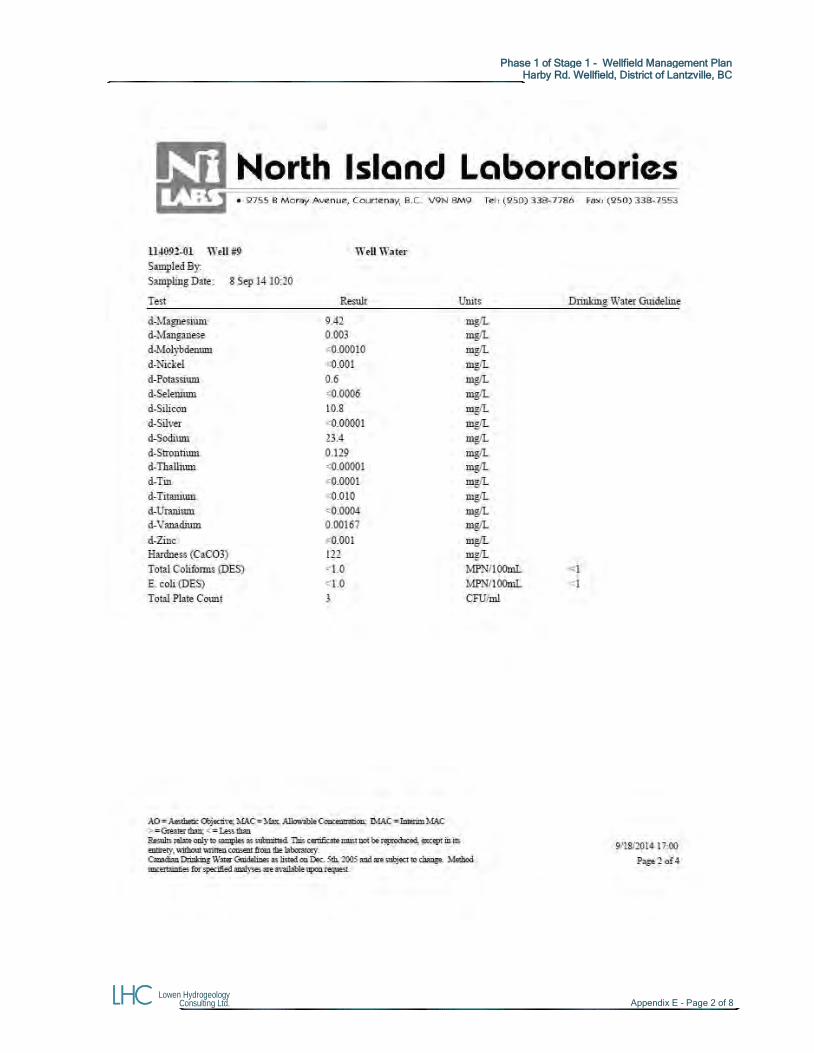
Phase 1 of Stage 1 - Wellfield Management Plan
Harby Rd. Wellfield, District of Lantzville, BC
Lowen Hydrogeology Consulting Ltd. Appendix E - Page 2 of 8
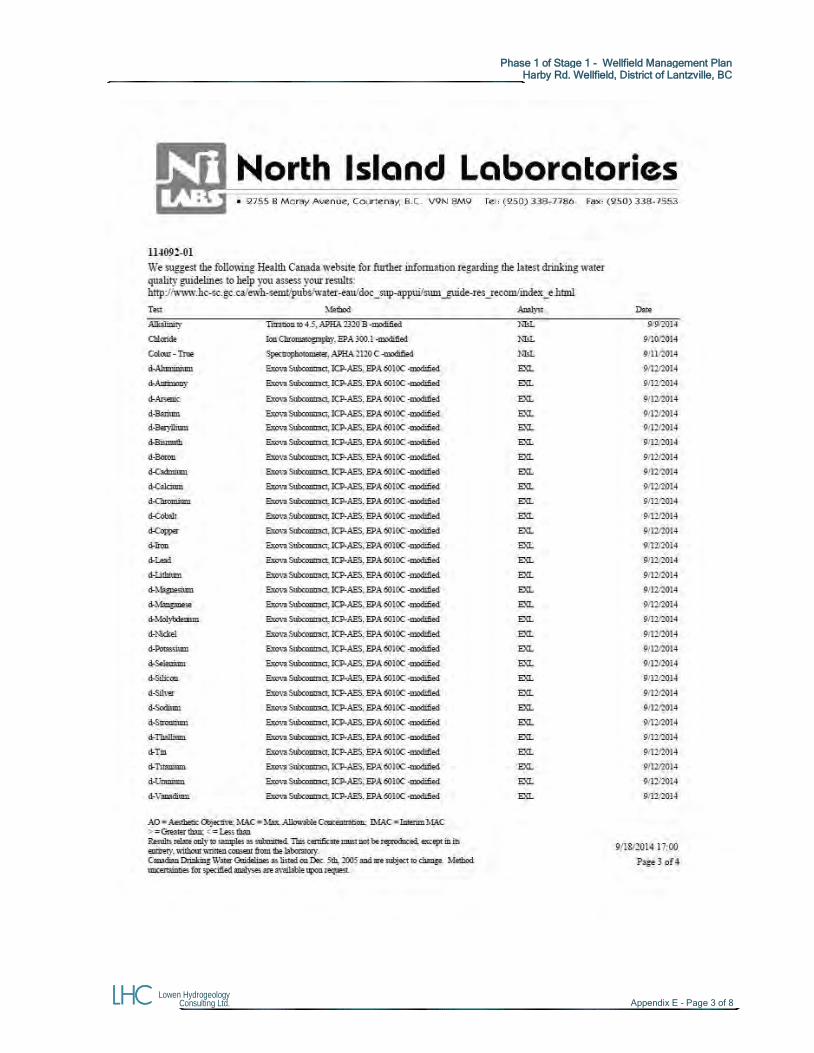
Phase 1 of Stage 1 - Wellfield Management Plan
Harby Rd. Wellfield, District of Lantzville, BC
Lowen Hydrogeology Consulting Ltd. Appendix E - Page 3 of 8
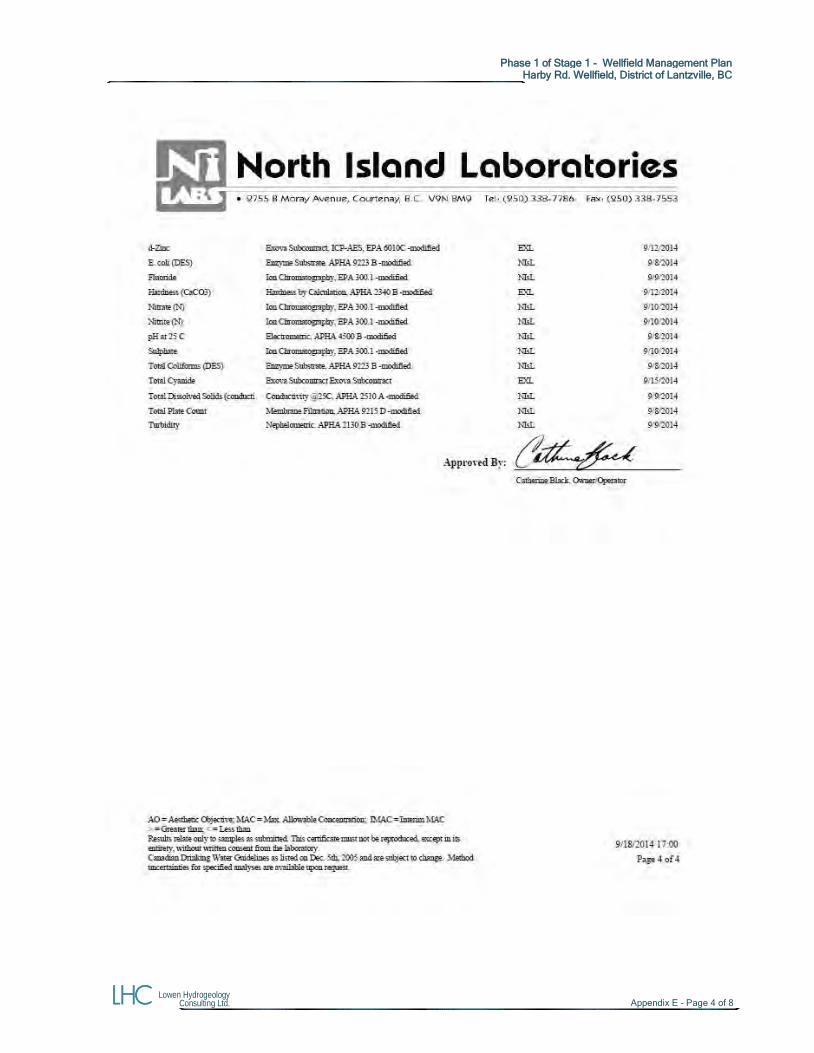
Phase 1 of Stage 1 - Wellfield Management Plan
Harby Rd. Wellfield, District of Lantzville, BC
Lowen Hydrogeology Consulting Ltd. Appendix E - Page 4 of 8
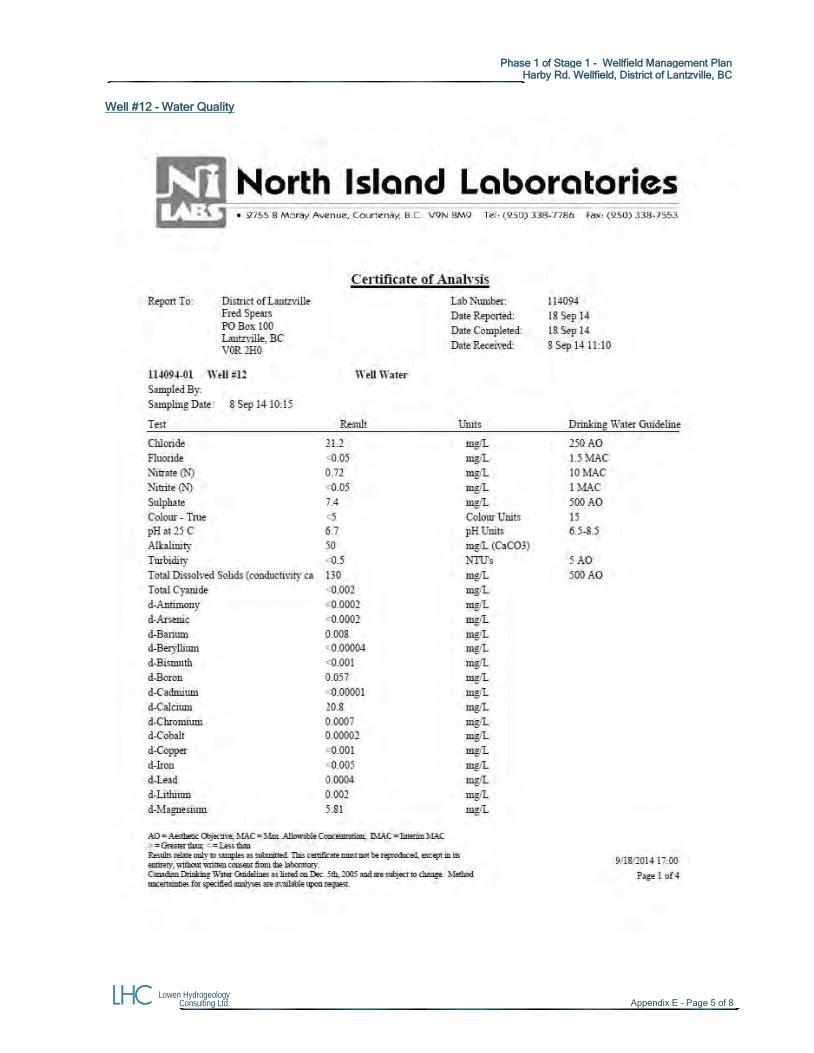
Phase 1 of Stage 1 - Wellfield Management Plan
Harby Rd. Wellfield, District of Lantzville, BC
Lowen Hydrogeology Consulting Ltd. Appendix E - Page 5 of 8
Well #12 – Water Quality
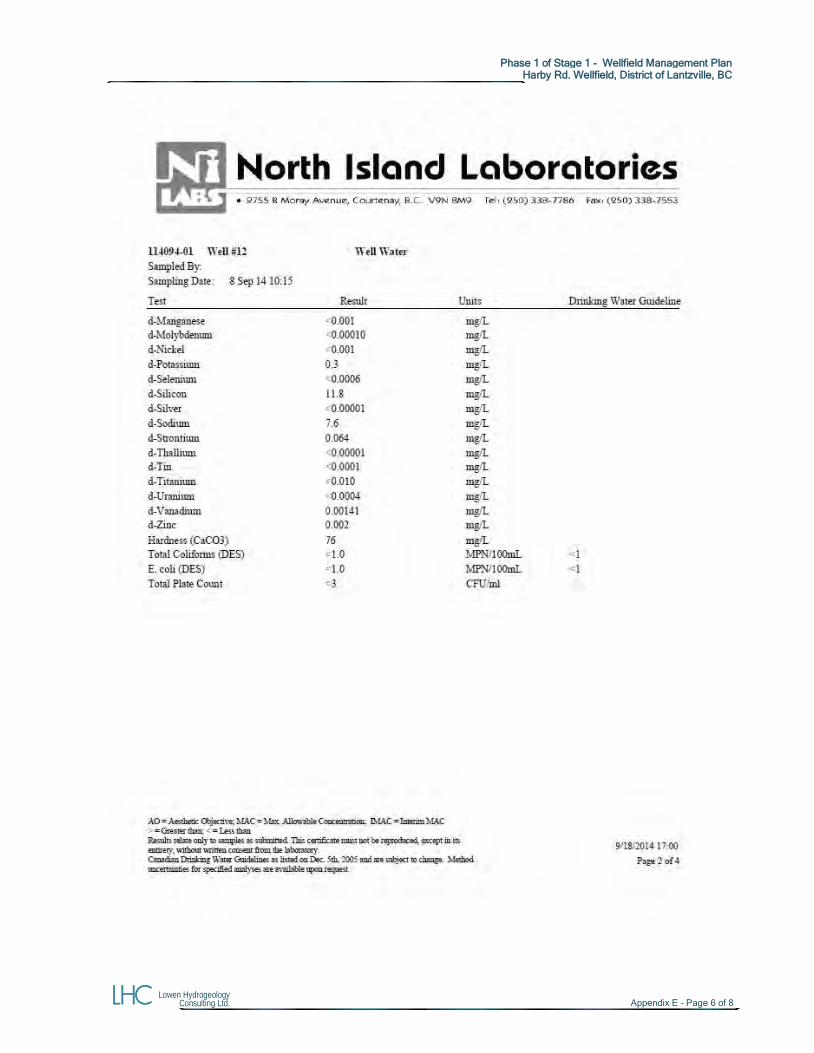
Phase 1 of Stage 1 - Wellfield Management Plan
Harby Rd. Wellfield, District of Lantzville, BC
Lowen Hydrogeology Consulting Ltd. Appendix E - Page 6 of 8
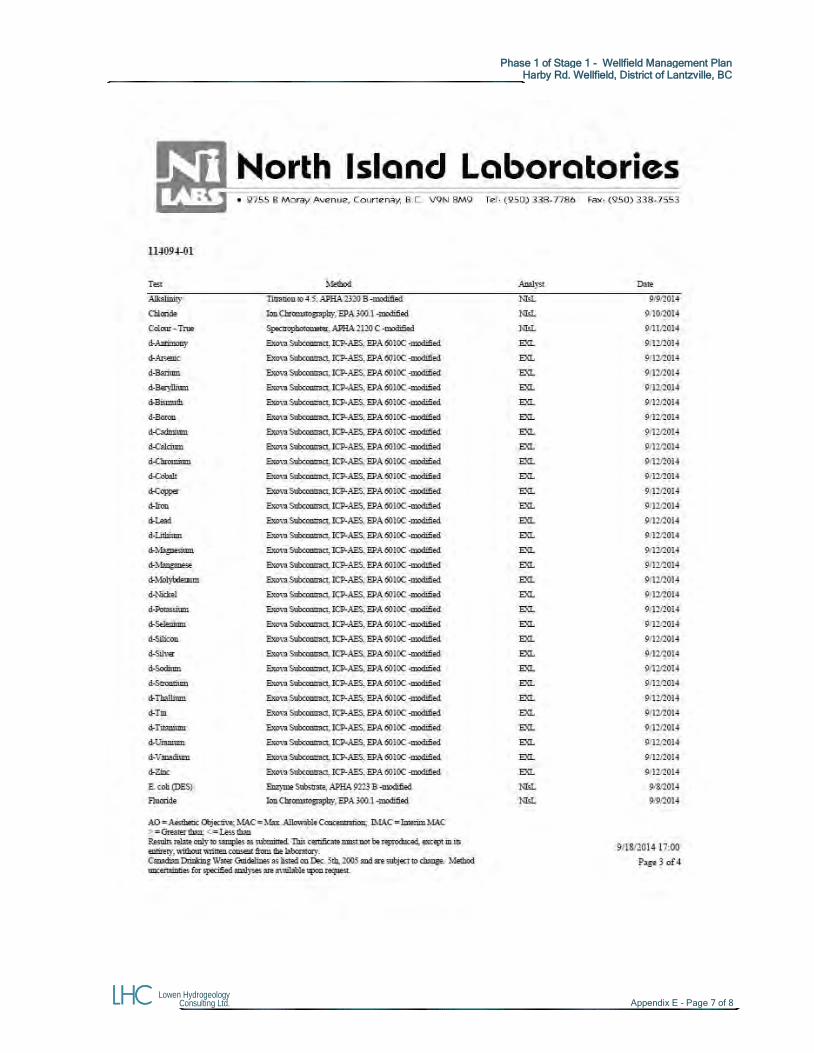
Phase 1 of Stage 1 - Wellfield Management Plan
Harby Rd. Wellfield, District of Lantzville, BC
Lowen Hydrogeology Consulting Ltd. Appendix E - Page 7 of 8
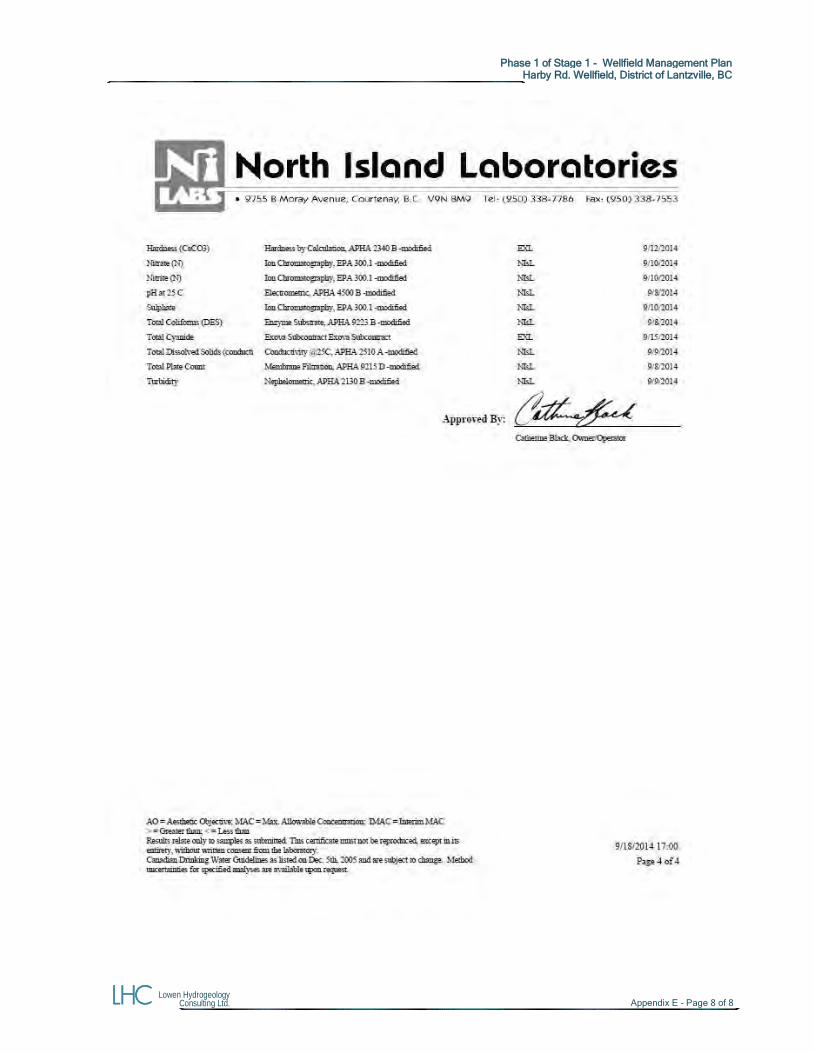
Phase 1 of Stage 1 - Wellfield Management Plan
Harby Rd. Wellfield, District of Lantzville, BC
Lowen Hydrogeology Consulting Ltd. Appendix E - Page 8 of 8

Appendix C
District of Lantzville Harby Road Wellfield, Estimation of Well Efficiencies March 31, 2015 Lowen Hydrogeology Consulting Ltd.
District of Lantzville, BC
Harby Road Well Field
Estimation of Well Efficiencies
Date: March 31, 2015
LHC Project File: 1501
Lowen Hydrogeology Consulting Ltd.
PO Box 45024 Victoria, B.C. V9A-0C3 Phone: 250 -595-0624 Fax: 1-855 -286-8001 Website: www.lowenhc.ca
RE
PO
RT
i
SUMMARY
Four pumping tests have been carried out on the District of Lantzville’s production wells
#4, 6, 9 and 12. The tests were performed to better assess well performance and
efficiency. The test results were also compared to historical test data to determine if
performance / efficiency is stable or diminished. Estimated well efficiencies for the four
wells range from 28 to 73%. Specific capacities have also diminished in wells #6 and #9
significantly. All of the wells could benefit from re-developing work and this is
recommended for wells #4, 9 and 12. A new well should be constructed at the Well LID
#6 site as the existing well is inefficient plus historical records indicate the pumping rate
was reduced at this well due to sand pumping. Well #6 has a design or construction fault
that precludes maximum production at this site.
ii
TABLE OF CONTENTS
SUMMARY………………………. .............................................................................................................................................................. i 1.0 INTRODUCTION .......................................................................................................................................................... 1 2.0 SUBJECT WELLS ........................................................................................................................................................ 1 3.0 PUMPING TESTS ........................................................................................................................................................ 2 4.0 DERIVATIVE ANALYSIS .............................................................................................................................................. 2
4.1 Methods ................................................................................................................................................................. 2 4.2 Flow Regimes Identification .................................................................................................................................... 3
5.0 ESTIMATION OF THE AQUIFER PARAMETERS ........................................................................................................ 3 5.1 Determination from the Walton Method................................................................................................................... 3 5.2 Application of the De Glee Method ......................................................................................................................... 4 5.3 Parameters Analysis............................................................................................................................................... 5 5.4 Discussion on Well Efficiencies .............................................................................................................................. 6
6.0 STUDY OF THE SPECIFIC CAPACITY ........................................................................................................................ 6 6.1 Evolution of Specific Capacity ................................................................................................................................ 6 6.2 Comparison of Actual and Theoretical Specific Capacity and Well Efficiency.......................................................... 6
7.0 CONCLUSIONS ........................................................................................................................................................... 7 8.0 RECOMMENDATIONS................................................................................................................................................. 8
CLOSURE / DISCLAIMER ............................................................................................................................................ 8
Appendix A
Well Field Plan and Well Locations
Appendix B
Well Log Record
Appendix C
Estimation of the Aquifer Parameters
Appendix D
Drawdown and Recovery Graphs
LIST OF TABLES
Table 1 - Distance between Pumping and Observation Wells ………………………..…………………………….…………….…………………………………. 1
Table 2 - Pumped Well Characteristics ………………………………………………………………………....………………………………………… …….……………………... 2
Table 3 - Pumping Schedule …………………………………………………………………………………………………………….…………………………………...…….….…………… 2
Table 4 - Aquifer Parameters from the Walton Method …….……………………………………….……………………………………………….........……………. 3
Table 5 - Aquifer Parameters from the De Glee Method …….……………………………………….…………………………………………………………….………. 4
Table 6 - Leakage Factors and Lateral Recharge ………………………………………………………….…………………………………………………….….……………. 5
Table 7 - Summary of Calculated Transmissivities ……………………………………………………………………………………..……….……….…………….….…….5
Table 8 - Evolution of the Specific Capacities at Wells #4, 6, 9 and 12 ……………..……………………………………….…… ….……..……….…… 6
Table 9 - Well Efficiencies from Specific Capacity Method ……………………………………………….…………………………..….………….……….………….7
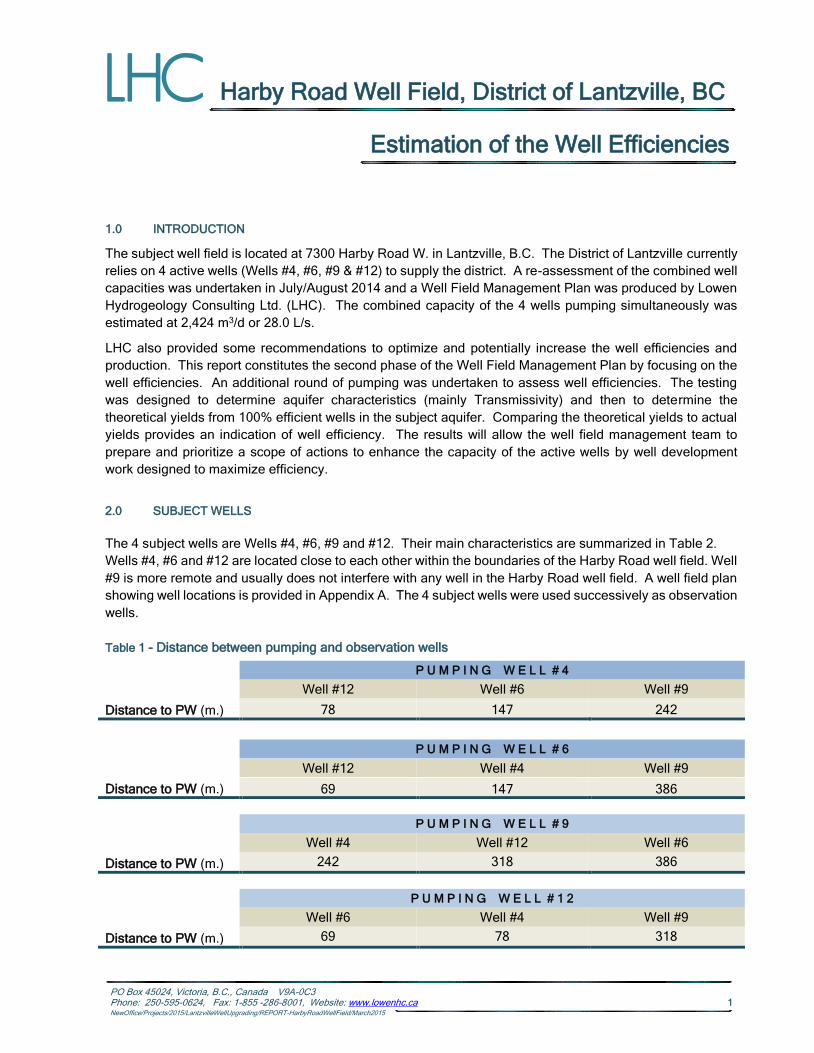
Harby Road Well Field, District of Lantzville, BC
Estimation of the Well Efficiencies
PO Box 45024, Victoria, B.C., Canada V9A-0C3 Phone: 250-595-0624, Fax: 1-855 -286-8001, Website: www.lowenhc.ca 1 NewOffice/Projects/2015/LantzvilleWellUpgrading/REPORT-HarbyRoadWellField/March2015
1.0 INTRODUCTION
The subject well field is located at 7300 Harby Road W. in Lantzville, B.C. The District of Lantzville currently
relies on 4 active wells (Wells #4, #6, #9 & #12) to supply the district. A re-assessment of the combined well
capacities was undertaken in July/August 2014 and a Well Field Management Plan was produced by Lowen
Hydrogeology Consulting Ltd. (LHC). The combined capacity of the 4 wells pumping simultaneously was
estimated at 2,424 m3/d or 28.0 L/s.
LHC also provided some recommendations to optimize and potentially increase the well efficiencies and
production. This report constitutes the second phase of the Well Field Management Plan by focusing on the
well efficiencies. An additional round of pumping was undertaken to assess well efficiencies. The testing
was designed to determine aquifer characteristics (mainly Transmissivity) and then to determine the
theoretical yields from 100% efficient wells in the subject aquifer. Comparing the theoretical yields to actual
yields provides an indication of well efficiency. The results will allow the well field management team to
prepare and prioritize a scope of actions to enhance the capacity of the active wells by well development
work designed to maximize efficiency.
2.0 SUBJECT WELLS
The 4 subject wells are Wells #4, #6, #9 and #12. Their main characteristics are summarized in Table 2.
Wells #4, #6 and #12 are located close to each other within the boundaries of the Harby Road well field. Well
#9 is more remote and usually does not interfere with any well in the Harby Road well field. A well field plan
showing well locations is provided in Appendix A. The 4 subject wells were used successively as observation
wells.
Table 1 - Distance between pumping and observation wells
P U M P I N G W E L L # 4
Distance to PW (m.)
Well #12 Well #6 Well #9
78 147 242
P U M P I N G W E L L # 6
Distance to PW (m.)
Well #12 Well #4 Well #9
69 147 386
P U M P I N G W E L L # 9
Distance to PW (m.)
Well #4 Well #12 Well #6
242 318 386
P U M P I N G W E L L # 1 2
Distance to PW (m.)
Well #6 Well #4 Well #9
69 78 318
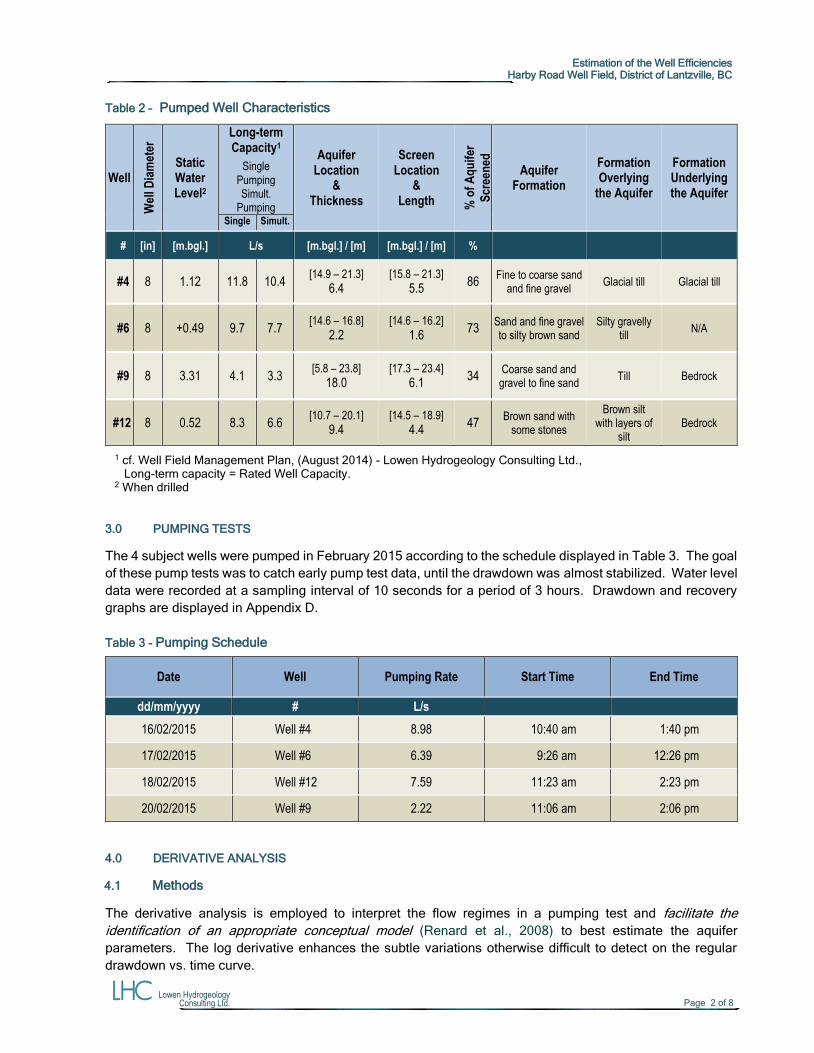
Estimation of the Well Efficiencies
Harby Road Well Field, District of Lantzville, BC
Lowen Hydrogeology Consulting Ltd. Page 2 of 8
Table 2 – Pumped Well Characteristics
Well
Wel
l Dia
met
er
Static Water Level2
Long-term Capacity1
Single Pumping Simult.
Pumping
Aquifer Location
& Thickness
Screen Location
& Length %
of
Aq
uif
er
Scr
een
ed
Aquifer Formation
Formation Overlying
the Aquifer
Formation Underlying the Aquifer
Single Simult.
# [in] [m.bgl.] L/s [m.bgl.] / [m] [m.bgl.] / [m] %
#4 8 1.12 11.8 10.4 [14.9 – 21.3]
6.4 [15.8 – 21.3]
5.5 86
Fine to coarse sand and fine gravel
Glacial till Glacial till
#6 8 +0.49 9.7 7.7 [14.6 – 16.8]
2.2 [14.6 – 16.2]
1.6 73
Sand and fine gravel to silty brown sand
Silty gravelly till
N/A
#9 8 3.31 4.1 3.3 [5.8 – 23.8]
18.0 [17.3 – 23.4]
6.1 34
Coarse sand and gravel to fine sand
Till Bedrock
#12 8 0.52 8.3 6.6 [10.7 – 20.1]
9.4 [14.5 – 18.9]
4.4 47
Brown sand with some stones
Brown silt with layers of
silt Bedrock
1 cf. Well Field Management Plan, (August 2014) - Lowen Hydrogeology Consulting Ltd.,
Long-term capacity = Rated Well Capacity. 2 When drilled
3.0 PUMPING TESTS
The 4 subject wells were pumped in February 2015 according to the schedule displayed in Table 3. The goal
of these pump tests was to catch early pump test data, until the drawdown was almost stabilized. Water level
data were recorded at a sampling interval of 10 seconds for a period of 3 hours. Drawdown and recovery
graphs are displayed in Appendix D.
Table 3 - Pumping Schedule
Date Well Pumping Rate Start Time End Time
dd/mm/yyyy # L/s
16/02/2015 Well #4 8.98 10:40 am 1:40 pm
17/02/2015 Well #6 6.39 9:26 am 12:26 pm
18/02/2015 Well #12 7.59 11:23 am 2:23 pm
20/02/2015 Well #9 2.22 11:06 am 2:06 pm
4.0 DERIVATIVE ANALYSIS
4.1 Methods
The derivative analysis is employed to interpret the flow regimes in a pumping test and facilitate the
identification of an appropriate conceptual model (Renard et al., 2008) to best estimate the aquifer
parameters. The log derivative enhances the subtle variations otherwise difficult to detect on the regular
drawdown vs. time curve.
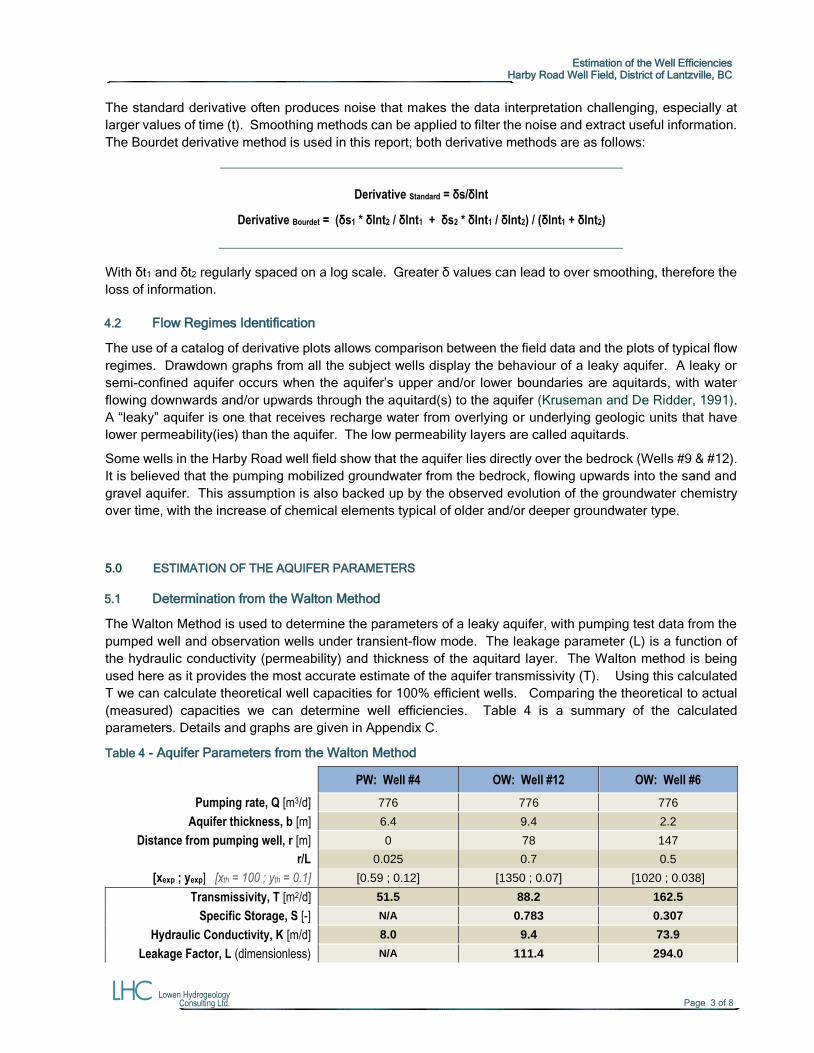
Estimation of the Well Efficiencies
Harby Road Well Field, District of Lantzville, BC
Lowen Hydrogeology Consulting Ltd. Page 3 of 8
The standard derivative often produces noise that makes the data interpretation challenging, especially at
larger values of time (t). Smoothing methods can be applied to filter the noise and extract useful information.
The Bourdet derivative method is used in this report; both derivative methods are as follows:
Derivative Standard = δs/δlnt
Derivative Bourdet = (δs1 * δlnt2 / δlnt1 + δs2 * δlnt1 / δlnt2) / (δlnt1 + δlnt2)
With δt1 and δt2 regularly spaced on a log scale. Greater δ values can lead to over smoothing, therefore the
loss of information.
4.2 Flow Regimes Identification
The use of a catalog of derivative plots allows comparison between the field data and the plots of typical flow
regimes. Drawdown graphs from all the subject wells display the behaviour of a leaky aquifer. A leaky or
semi-confined aquifer occurs when the aquifer’s upper and/or lower boundaries are aquitards, with water
flowing downwards and/or upwards through the aquitard(s) to the aquifer (Kruseman and De Ridder, 1991).
A “leaky” aquifer is one that receives recharge water from overlying or underlying geologic units that have
lower permeability(ies) than the aquifer. The low permeability layers are called aquitards.
Some wells in the Harby Road well field show that the aquifer lies directly over the bedrock (Wells #9 & #12).
It is believed that the pumping mobilized groundwater from the bedrock, flowing upwards into the sand and
gravel aquifer. This assumption is also backed up by the observed evolution of the groundwater chemistry
over time, with the increase of chemical elements typical of older and/or deeper groundwater type.
5.0 ESTIMATION OF THE AQUIFER PARAMETERS
5.1 Determination from the Walton Method
The Walton Method is used to determine the parameters of a leaky aquifer, with pumping test data from the
pumped well and observation wells under transient-flow mode. The leakage parameter (L) is a function of
the hydraulic conductivity (permeability) and thickness of the aquitard layer. The Walton method is being
used here as it provides the most accurate estimate of the aquifer transmissivity (T). Using this calculated
T we can calculate theoretical well capacities for 100% efficient wells. Comparing the theoretical to actual
(measured) capacities we can determine well efficiencies. Table 4 is a summary of the calculated
parameters. Details and graphs are given in Appendix C. Table 4 - Aquifer Parameters from the Walton Method
PW: Well #4 OW: Well #12 OW: Well #6
Pumping rate, Q [m3/d] 776 776 776
Aquifer thickness, b [m] 6.4 9.4 2.2
Distance from pumping well, r [m] 0 78 147
r/L 0.025 0.7 0.5
[xexp ; yexp] [xth = 100 ; yth = 0.1] [0.59 ; 0.12] [1350 ; 0.07] [1020 ; 0.038]
Transmissivity, T [m2/d] 51.5 88.2 162.5
Specific Storage, S [-] N/A 0.783 0.307
Hydraulic Conductivity, K [m/d] 8.0 9.4 73.9
Leakage Factor, L (dimensionless) N/A 111.4 294.0
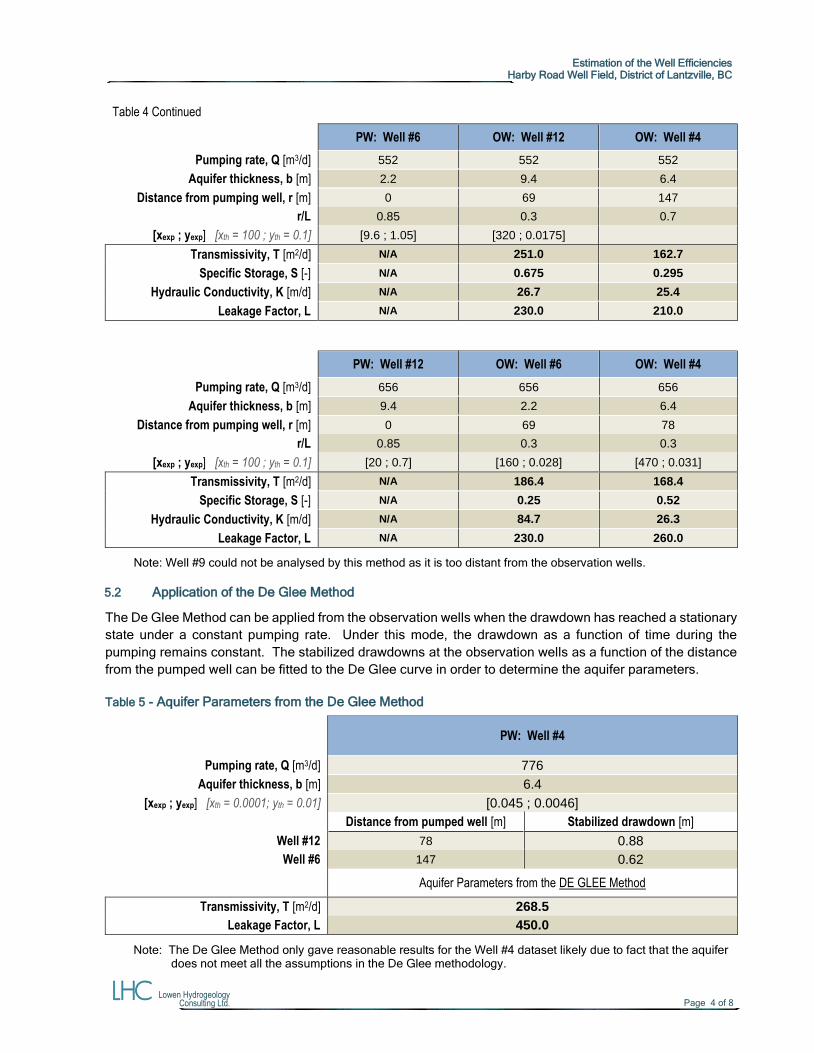
Estimation of the Well Efficiencies
Harby Road Well Field, District of Lantzville, BC
Lowen Hydrogeology Consulting Ltd. Page 4 of 8
Table 4 Continued
PW: Well #6 OW: Well #12 OW: Well #4
Pumping rate, Q [m3/d] 552 552 552
Aquifer thickness, b [m] 2.2 9.4 6.4
Distance from pumping well, r [m] 0 69 147
r/L 0.85 0.3 0.7
[xexp ; yexp] [xth = 100 ; yth = 0.1] [9.6 ; 1.05] [320 ; 0.0175]
Transmissivity, T [m2/d] N/A 251.0 162.7
Specific Storage, S [-] N/A 0.675 0.295
Hydraulic Conductivity, K [m/d] N/A 26.7 25.4
Leakage Factor, L N/A 230.0 210.0
PW: Well #12 OW: Well #6 OW: Well #4
Pumping rate, Q [m3/d] 656 656 656
Aquifer thickness, b [m] 9.4 2.2 6.4
Distance from pumping well, r [m] 0 69 78
r/L 0.85 0.3 0.3
[xexp ; yexp] [xth = 100 ; yth = 0.1] [20 ; 0.7] [160 ; 0.028] [470 ; 0.031]
Transmissivity, T [m2/d] N/A 186.4 168.4
Specific Storage, S [-] N/A 0.25 0.52
Hydraulic Conductivity, K [m/d] N/A 84.7 26.3
Leakage Factor, L N/A 230.0 260.0
Note: Well #9 could not be analysed by this method as it is too distant from the observation wells.
5.2 Application of the De Glee Method
The De Glee Method can be applied from the observation wells when the drawdown has reached a stationary
state under a constant pumping rate. Under this mode, the drawdown as a function of time during the
pumping remains constant. The stabilized drawdowns at the observation wells as a function of the distance
from the pumped well can be fitted to the De Glee curve in order to determine the aquifer parameters.
Table 5 - Aquifer Parameters from the De Glee Method
PW: Well #4
Pumping rate, Q [m3/d] 776
Aquifer thickness, b [m] 6.4
[xexp ; yexp] [xth = 0.0001; yth = 0.01] [0.045 ; 0.0046]
Distance from pumped well [m] Stabilized drawdown [m]
Well #12 78 0.88
Well #6 147 0.62
Aquifer Parameters from the DE GLEE Method
Transmissivity, T [m2/d] 268.5
Leakage Factor, L 450.0
Note: The De Glee Method only gave reasonable results for the Well #4 dataset likely due to fact that the aquifer does not meet all the assumptions in the De Glee methodology.
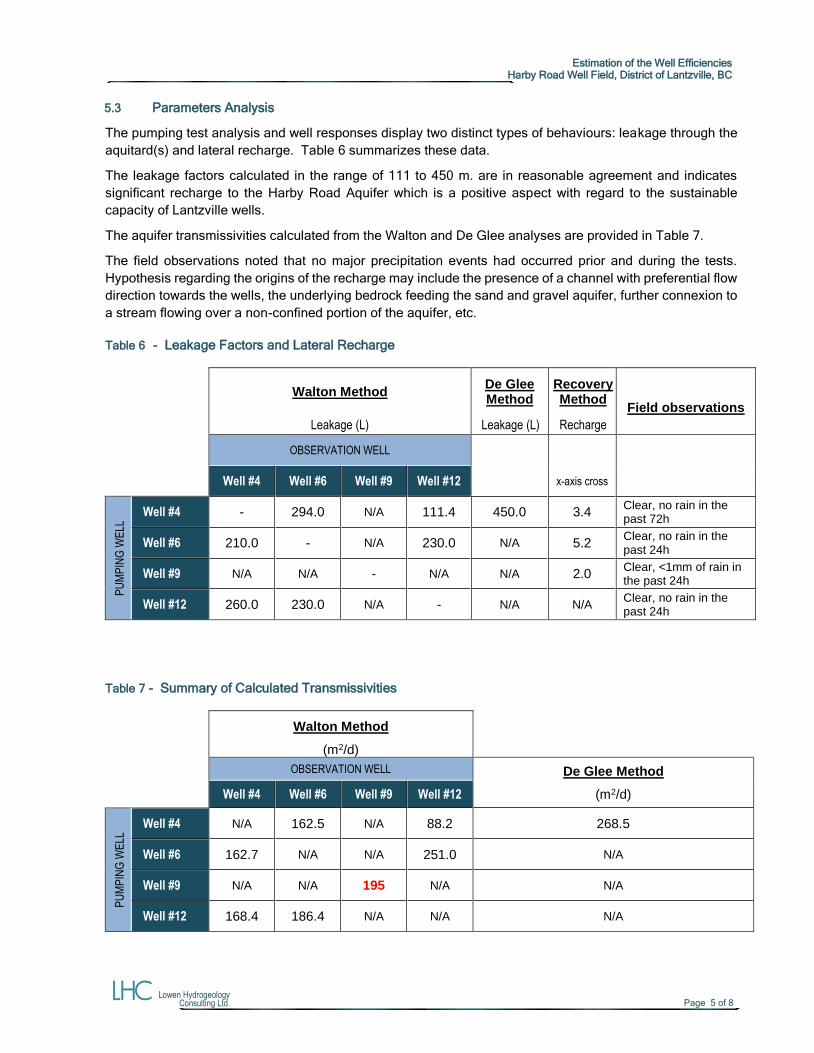
Estimation of the Well Efficiencies
Harby Road Well Field, District of Lantzville, BC
Lowen Hydrogeology Consulting Ltd. Page 5 of 8
5.3 Parameters Analysis
The pumping test analysis and well responses display two distinct types of behaviours: leakage through the
aquitard(s) and lateral recharge. Table 6 summarizes these data.
The leakage factors calculated in the range of 111 to 450 m. are in reasonable agreement and indicates
significant recharge to the Harby Road Aquifer which is a positive aspect with regard to the sustainable
capacity of Lantzville wells.
The aquifer transmissivities calculated from the Walton and De Glee analyses are provided in Table 7.
The field observations noted that no major precipitation events had occurred prior and during the tests.
Hypothesis regarding the origins of the recharge may include the presence of a channel with preferential flow
direction towards the wells, the underlying bedrock feeding the sand and gravel aquifer, further connexion to
a stream flowing over a non-confined portion of the aquifer, etc.
Table 6 - Leakage Factors and Lateral Recharge
Walton Method De Glee Method
Recovery Method
Field observations
Leakage (L) Leakage (L) Recharge
OBSERVATION WELL
Well #4 Well #6 Well #9 Well #12 x-axis cross
PU
MP
ING
WE
LL Well #4 - 294.0 N/A 111.4 450.0 3.4
Clear, no rain in the past 72h
Well #6 210.0 - N/A 230.0 N/A 5.2 Clear, no rain in the past 24h
Well #9 N/A N/A - N/A N/A 2.0 Clear, <1mm of rain in the past 24h
Well #12 260.0 230.0 N/A - N/A N/A Clear, no rain in the past 24h
Table 7 - Summary of Calculated Transmissivities
Walton Method
(m2/d)
OBSERVATION WELL De Glee Method
(m2/d) Well #4 Well #6 Well #9 Well #12
PU
MP
ING
WE
LL Well #4 N/A 162.5 N/A 88.2 268.5
Well #6 162.7 N/A N/A 251.0 N/A
Well #9 N/A N/A 195 N/A N/A
Well #12 168.4 186.4 N/A N/A N/A
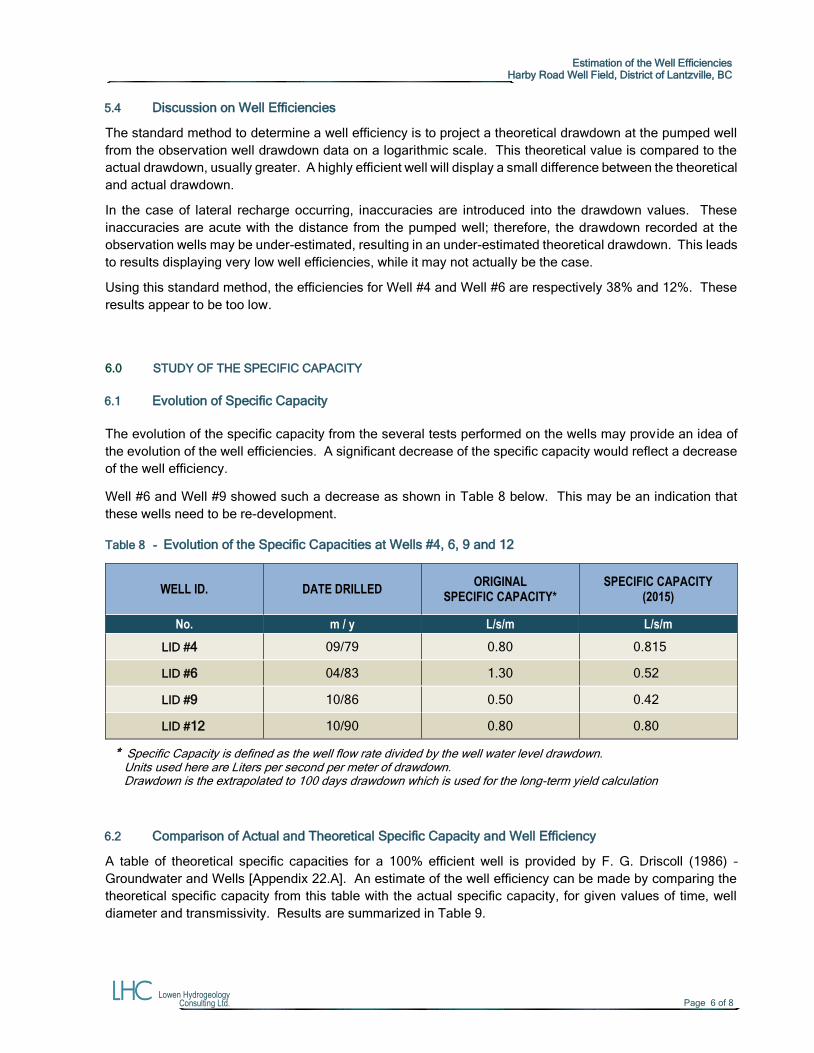
Estimation of the Well Efficiencies
Harby Road Well Field, District of Lantzville, BC
Lowen Hydrogeology Consulting Ltd. Page 6 of 8
5.4 Discussion on Well Efficiencies
The standard method to determine a well efficiency is to project a theoretical drawdown at the pumped well
from the observation well drawdown data on a logarithmic scale. This theoretical value is compared to the
actual drawdown, usually greater. A highly efficient well will display a small difference between the theoretical
and actual drawdown.
In the case of lateral recharge occurring, inaccuracies are introduced into the drawdown values. These
inaccuracies are acute with the distance from the pumped well; therefore, the drawdown recorded at the
observation wells may be under-estimated, resulting in an under-estimated theoretical drawdown. This leads
to results displaying very low well efficiencies, while it may not actually be the case.
Using this standard method, the efficiencies for Well #4 and Well #6 are respectively 38% and 12%. These
results appear to be too low.
6.0 STUDY OF THE SPECIFIC CAPACITY
6.1 Evolution of Specific Capacity
The evolution of the specific capacity from the several tests performed on the wells may provide an idea of
the evolution of the well efficiencies. A significant decrease of the specific capacity would reflect a decrease
of the well efficiency.
Well #6 and Well #9 showed such a decrease as shown in Table 8 below. This may be an indication that
these wells need to be re-development.
Table 8 - Evolution of the Specific Capacities at Wells #4, 6, 9 and 12
WELL ID. DATE DRILLED ORIGINAL
SPECIFIC CAPACITY* SPECIFIC CAPACITY
(2015)
No. m / y L/s/m L/s/m
LID #4 09/79 0.80 0.815
LID #6 04/83 1.30 0.52
LID #9 10/86 0.50 0.42
LID #12 10/90 0.80 0.80
* Specific Capacity is defined as the well flow rate divided by the well water level drawdown. Units used here are Liters per second per meter of drawdown. Drawdown is the extrapolated to 100 days drawdown which is used for the long-term yield calculation
6.2 Comparison of Actual and Theoretical Specific Capacity and Well Efficiency
A table of theoretical specific capacities for a 100% efficient well is provided by F. G. Driscoll (1986) –
Groundwater and Wells [Appendix 22.A]. An estimate of the well efficiency can be made by comparing the
theoretical specific capacity from this table with the actual specific capacity, for given values of time, well
diameter and transmissivity. Results are summarized in Table 9.

Estimation of the Well Efficiencies
Harby Road Well Field, District of Lantzville, BC
Lowen Hydrogeology Consulting Ltd. Page 7 of 8
Table 9 - Well Efficiencies from Specific Capacity Method
Well #4 Well #6 Well #9 Well #12
Pumping rate, Q [L/s] 8.98 6.39 2.22 7.59
Transmissivity*, T [m2/d] 125.4 206.9 195 177.4
Time, t [day] 1 1 1 1
Drawdown at t, s(t) [m] 9.15 11.15 4.74 7.24
Well diameter [mm] 203.2 203.2 203.2 203.2
Aquifer type Semi-confined Semi-confined Semi-confined Semi-confined
Theoretical specific capacity [L/s/m] 1.35 1.76 1.6 1.86
Actual specific capacity [L/s/m] 0.98 0.57 0.44 1.05
Well efficiency 73% 33% 28% 56%
* The transmissivity is the average of the transmissivities reported in Table 7 from the observation wells.
Well #9 T is estimated from the observed specific capacity
7.0 CONCLUSIONS
7.1 Optimizing well efficiency will benefit the District of Lantzville in two ways:
1) Reduce electrical energy usage and operating cost for pumping water.
2) Maximize the yield potential from the existing wells.
7.2 Wells can be inefficient because of design flaws and due to deposition of fine grained
material (usually silt) around the well screens. Other less common causes do occur such as
bio-fouling.
7.3 Transmissivity values in the Harby Road Aquifer generally range between 50 and 250 m2/d.
Globally or world-wide aquifer transmissivities range between 12.4 to 12,400 m2/d. For wells
to be suitable for municipal water supply transmissivity values greater than 124 m2/d are
generally required.
7.4 Well efficiencies for the four production wells range from 28% to 73%. At these efficiency
levels all the wells are due for re-development work. Well efficiencies close to 90% are
achievable and desirable. Re-development may significantly increase well capacities, up to
doubling capacities in the least efficient wells.
7.5 Wells #6 and #9 show a significant decrease in specific capacity since they were drilled and
also have the lower efficiency estimates; 33% and 28% respectively.
7.6 Well LID #6 geology log indicates an aquifer thickness of only 2.2 m. but pumping analysis
indicates a higher transmissivity at LID #6 compared with the other wells. All other wells
indicate aquifer thickness of 6 to 10 m. We conclude that the well LID #6 may not penetrate
the full aquifer thickness. If this is correct a deeper well with longer screen length could be
installed to increase water supply capacity at this site. Also the pumping rate at this well was
reduced because it produced sand at the higher rate. Considering this and the poor
efficiency Well #6 should be replaced.
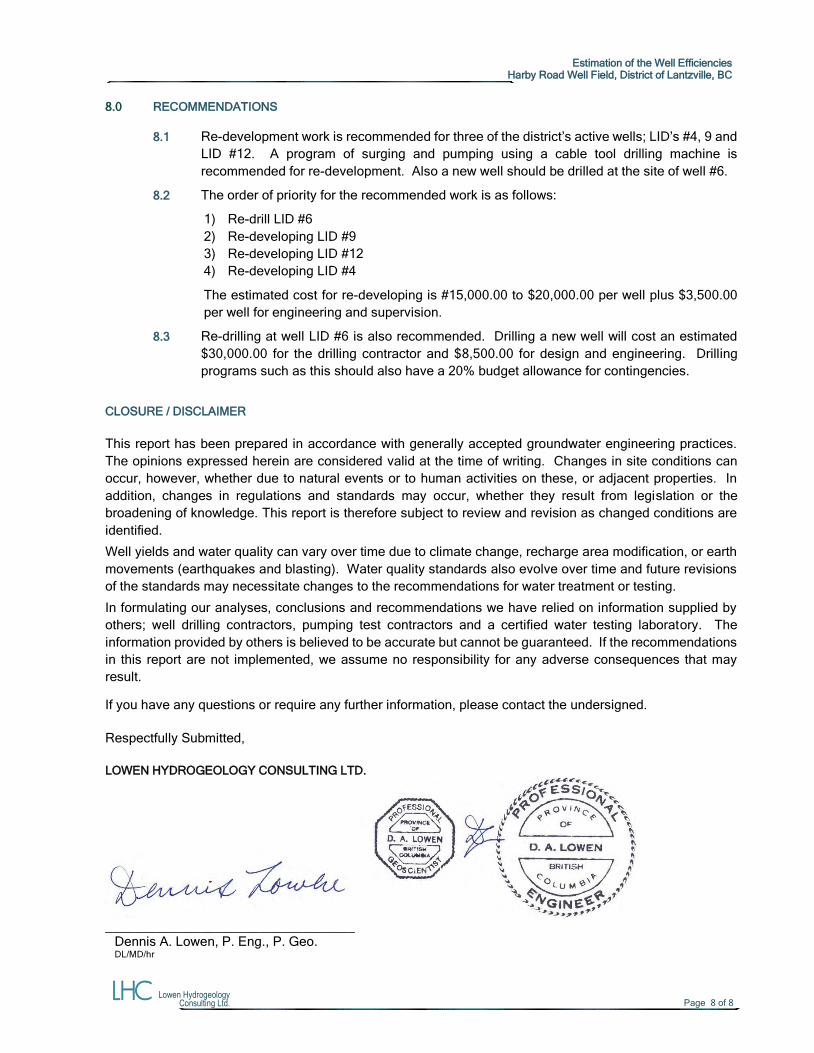
Estimation of the Well Efficiencies
Harby Road Well Field, District of Lantzville, BC
Lowen Hydrogeology Consulting Ltd. Page 8 of 8
8.0 RECOMMENDATIONS
8.1 Re-development work is recommended for three of the district’s active wells; LID’s #4, 9 and
LID #12. A program of surging and pumping using a cable tool drilling machine is
recommended for re-development. Also a new well should be drilled at the site of well #6.
8.2 The order of priority for the recommended work is as follows:
1) Re-drill LID #6
2) Re-developing LID #9
3) Re-developing LID #12
4) Re-developing LID #4
The estimated cost for re-developing is #15,000.00 to $20,000.00 per well plus $3,500.00
per well for engineering and supervision.
8.3 Re-drilling at well LID #6 is also recommended. Drilling a new well will cost an estimated
$30,000.00 for the drilling contractor and $8,500.00 for design and engineering. Drilling
programs such as this should also have a 20% budget allowance for contingencies.
CLOSURE / DISCLAIMER
This report has been prepared in accordance with generally accepted groundwater engineering practices.
The opinions expressed herein are considered valid at the time of writing. Changes in site conditions can
occur, however, whether due to natural events or to human activities on these, or adjacent properties. In
addition, changes in regulations and standards may occur, whether they result from legislation or the
broadening of knowledge. This report is therefore subject to review and revision as changed conditions are
identified.
Well yields and water quality can vary over time due to climate change, recharge area modification, or earth
movements (earthquakes and blasting). Water quality standards also evolve over time and future revisions
of the standards may necessitate changes to the recommendations for water treatment or testing.
In formulating our analyses, conclusions and recommendations we have relied on information supplied by
others; well drilling contractors, pumping test contractors and a certified water testing laboratory. The
information provided by others is believed to be accurate but cannot be guaranteed. If the recommendations
in this report are not implemented, we assume no responsibility for any adverse consequences that may
result.
If you have any questions or require any further information, please contact the undersigned.
Respectfully Submitted,
LOWEN HYDROGEOLOGY CONSULTING LTD.
__________________________________
Dennis A. Lowen, P. Eng., P. Geo. DL/MD/hr

Well Field Plan and Well Locations
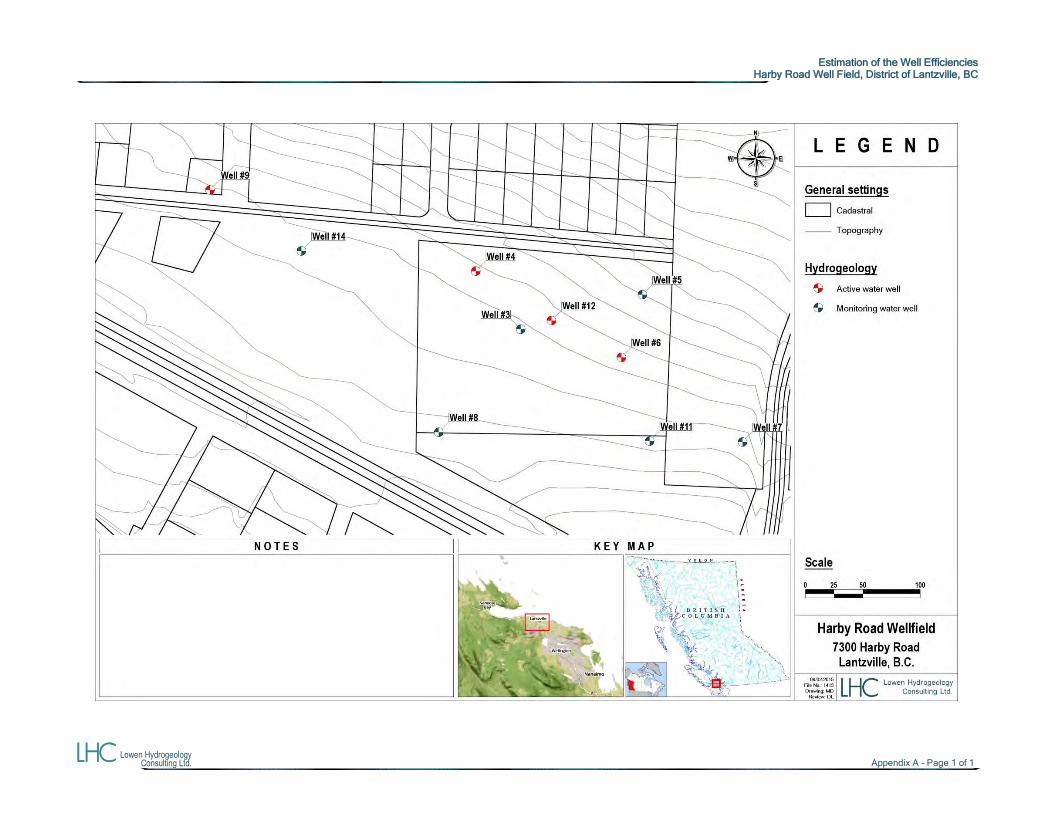
Estimation of the Well Efficiencies
Harby Road Well Field, District of Lantzville, BC
Lowen Hydrogeology Consulting Ltd. Appendix A - Page 1 of 1

Well Log Record
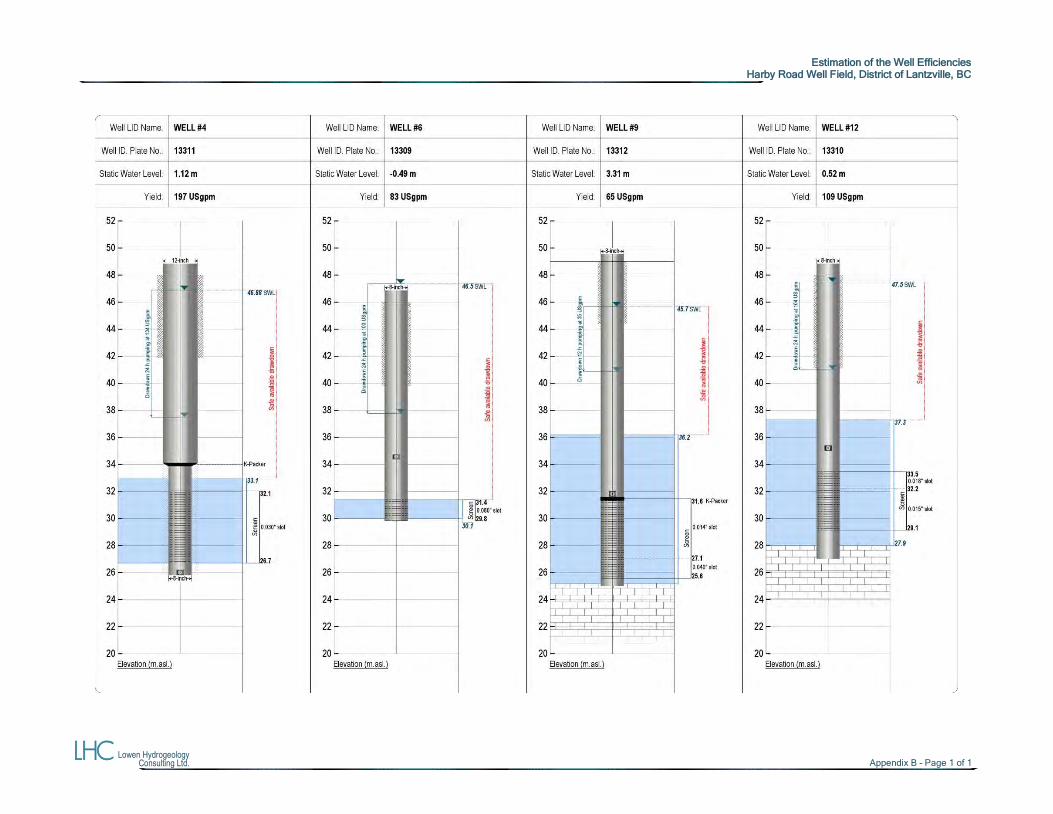
Estimation of the Well Efficiencies
Harby Road Well Field, District of Lantzville, BC
Lowen Hydrogeology Consulting Ltd. Appendix B – Page 1 of 1

Estimation of the Aquifer Parameters
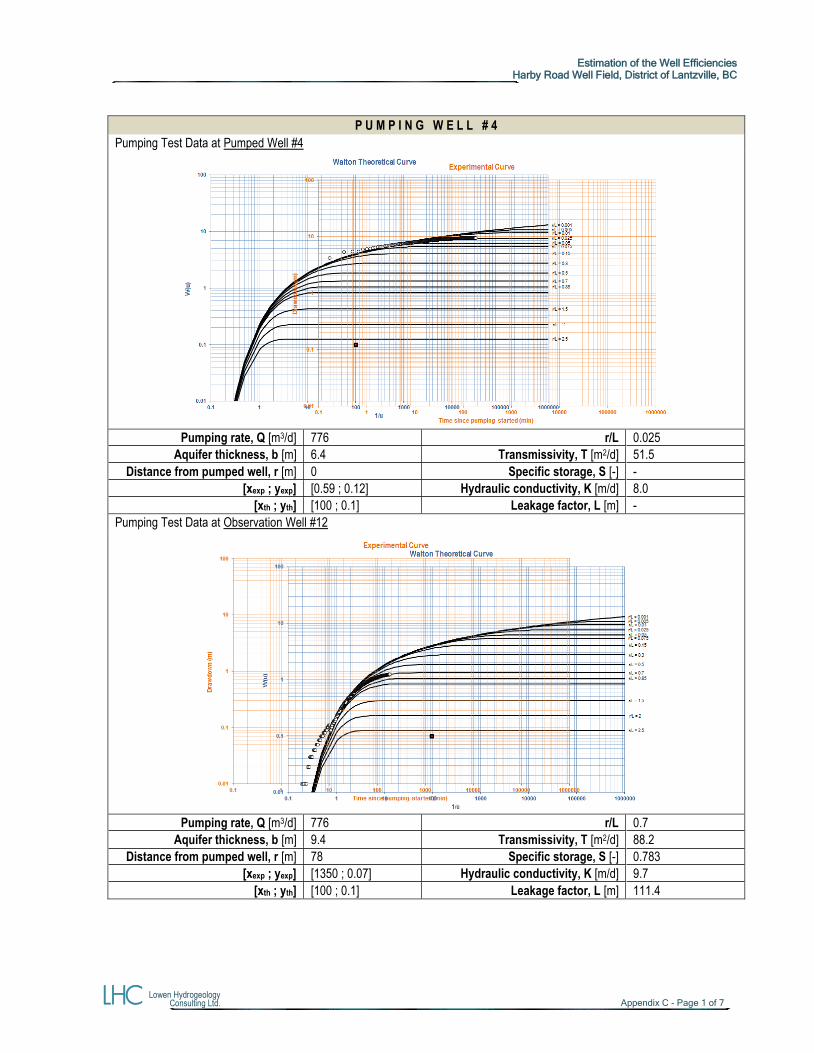
Estimation of the Well Efficiencies
Harby Road Well Field, District of Lantzville, BC
Lowen Hydrogeology Consulting Ltd. Appendix C - Page 1 of 7
P U M P I N G W E L L # 4
Pumping Test Data at Pumped Well #4
Pumping rate, Q [m3/d] 776 r/L 0.025
Aquifer thickness, b [m] 6.4 Transmissivity, T [m2/d] 51.5
Distance from pumped well, r [m] 0 Specific storage, S [-] -
[xexp ; yexp] [0.59 ; 0.12] Hydraulic conductivity, K [m/d] 8.0
[xth ; yth] [100 ; 0.1] Leakage factor, L [m] -
Pumping Test Data at Observation Well #12
Pumping rate, Q [m3/d] 776 r/L 0.7
Aquifer thickness, b [m] 9.4 Transmissivity, T [m2/d] 88.2
Distance from pumped well, r [m] 78 Specific storage, S [-] 0.783
[xexp ; yexp] [1350 ; 0.07] Hydraulic conductivity, K [m/d] 9.7
[xth ; yth] [100 ; 0.1] Leakage factor, L [m] 111.4
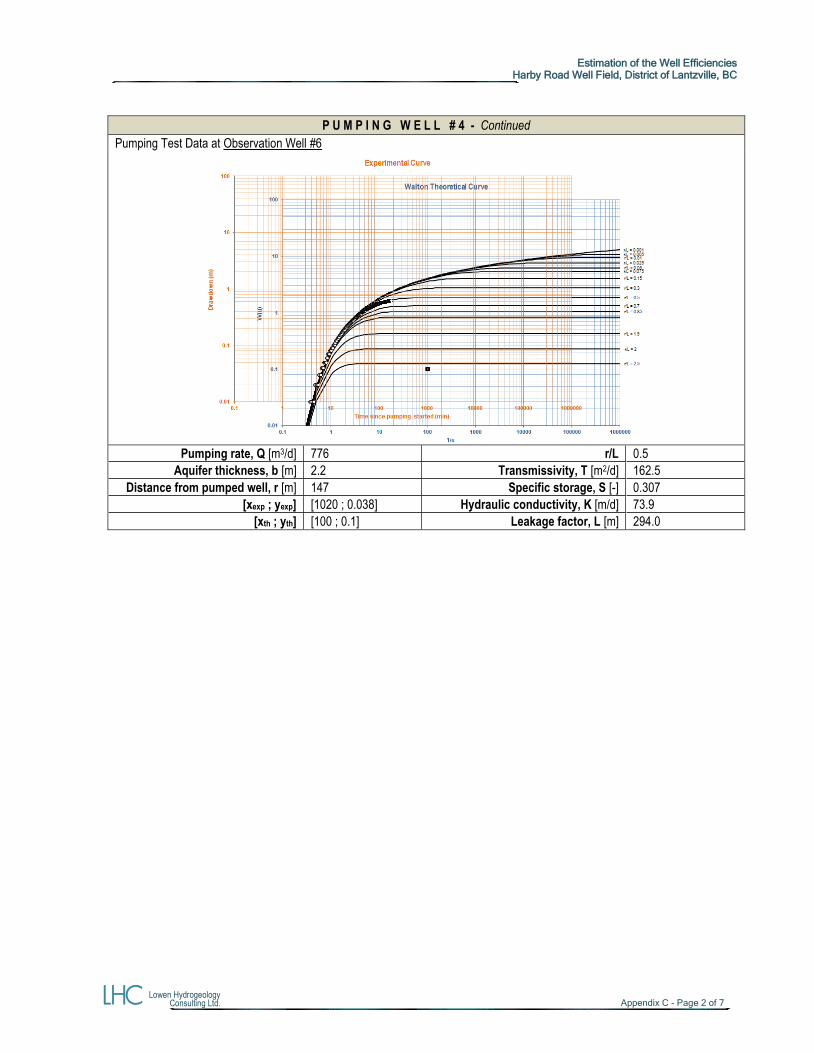
Estimation of the Well Efficiencies
Harby Road Well Field, District of Lantzville, BC
Lowen Hydrogeology Consulting Ltd. Appendix C - Page 2 of 7
P U M P I N G W E L L # 4 - Continued
Pumping Test Data at Observation Well #6
Pumping rate, Q [m3/d] 776 r/L 0.5
Aquifer thickness, b [m] 2.2 Transmissivity, T [m2/d] 162.5
Distance from pumped well, r [m] 147 Specific storage, S [-] 0.307
[xexp ; yexp] [1020 ; 0.038] Hydraulic conductivity, K [m/d] 73.9
[xth ; yth] [100 ; 0.1] Leakage factor, L [m] 294.0
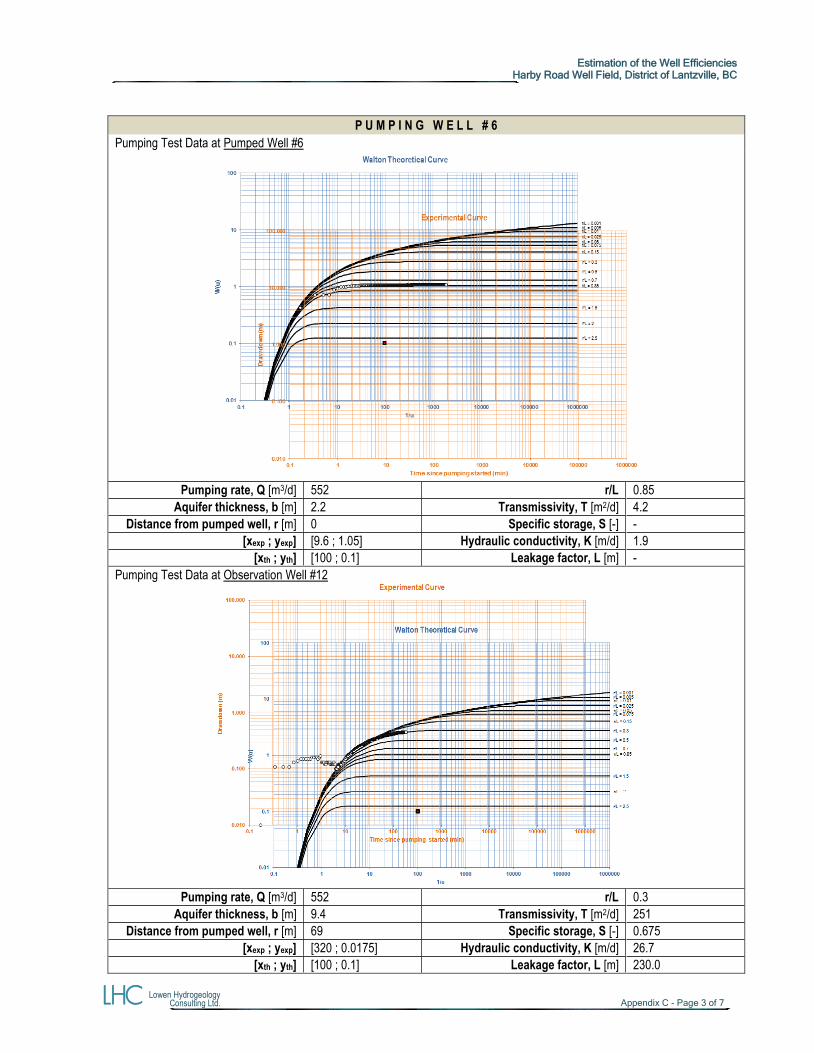
Estimation of the Well Efficiencies
Harby Road Well Field, District of Lantzville, BC
Lowen Hydrogeology Consulting Ltd. Appendix C - Page 3 of 7
P U M P I N G W E L L # 6
Pumping Test Data at Pumped Well #6
Pumping rate, Q [m3/d] 552 r/L 0.85
Aquifer thickness, b [m] 2.2 Transmissivity, T [m2/d] 4.2
Distance from pumped well, r [m] 0 Specific storage, S [-] -
[xexp ; yexp] [9.6 ; 1.05] Hydraulic conductivity, K [m/d] 1.9
[xth ; yth] [100 ; 0.1] Leakage factor, L [m] -
Pumping Test Data at Observation Well #12
Pumping rate, Q [m3/d] 552 r/L 0.3
Aquifer thickness, b [m] 9.4 Transmissivity, T [m2/d] 251
Distance from pumped well, r [m] 69 Specific storage, S [-] 0.675
[xexp ; yexp] [320 ; 0.0175] Hydraulic conductivity, K [m/d] 26.7
[xth ; yth] [100 ; 0.1] Leakage factor, L [m] 230.0
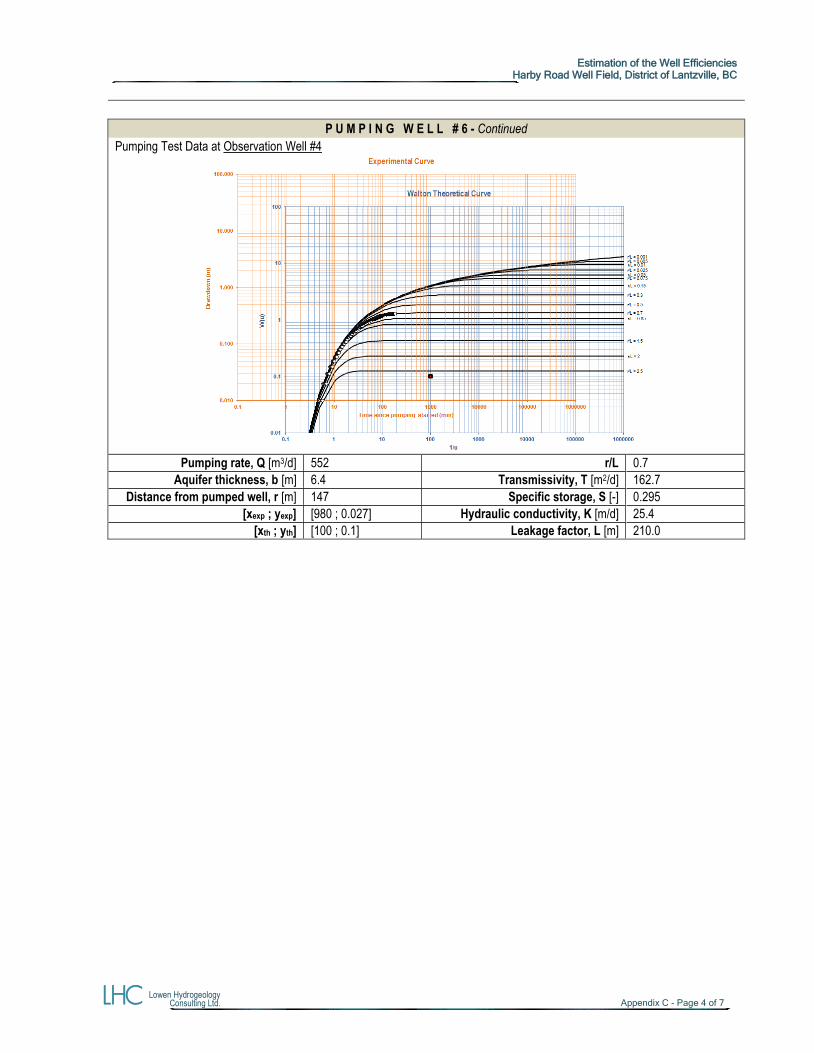
Estimation of the Well Efficiencies
Harby Road Well Field, District of Lantzville, BC
Lowen Hydrogeology Consulting Ltd. Appendix C - Page 4 of 7
P U M P I N G W E L L # 6 - Continued
Pumping Test Data at Observation Well #4
Pumping rate, Q [m3/d] 552 r/L 0.7
Aquifer thickness, b [m] 6.4 Transmissivity, T [m2/d] 162.7
Distance from pumped well, r [m] 147 Specific storage, S [-] 0.295
[xexp ; yexp] [980 ; 0.027] Hydraulic conductivity, K [m/d] 25.4
[xth ; yth] [100 ; 0.1] Leakage factor, L [m] 210.0
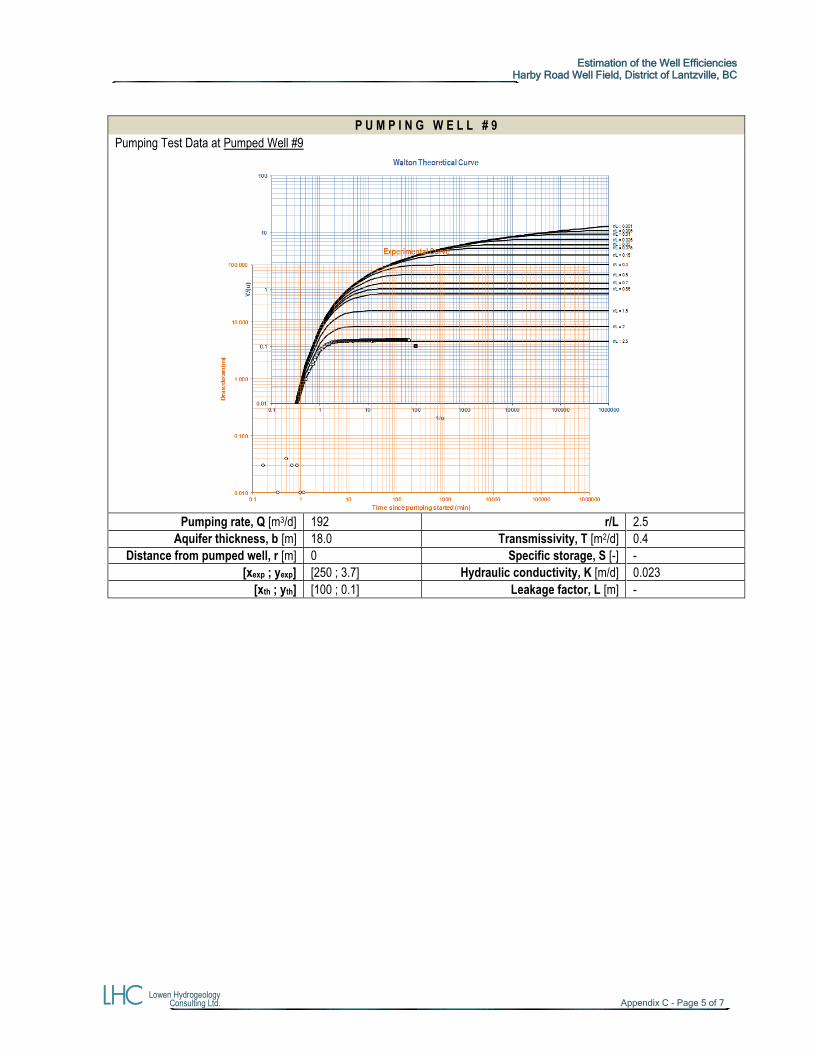
Estimation of the Well Efficiencies
Harby Road Well Field, District of Lantzville, BC
Lowen Hydrogeology Consulting Ltd. Appendix C - Page 5 of 7
P U M P I N G W E L L # 9
Pumping Test Data at Pumped Well #9
Pumping rate, Q [m3/d] 192 r/L 2.5
Aquifer thickness, b [m] 18.0 Transmissivity, T [m2/d] 0.4
Distance from pumped well, r [m] 0 Specific storage, S [-] -
[xexp ; yexp] [250 ; 3.7] Hydraulic conductivity, K [m/d] 0.023
[xth ; yth] [100 ; 0.1] Leakage factor, L [m] -
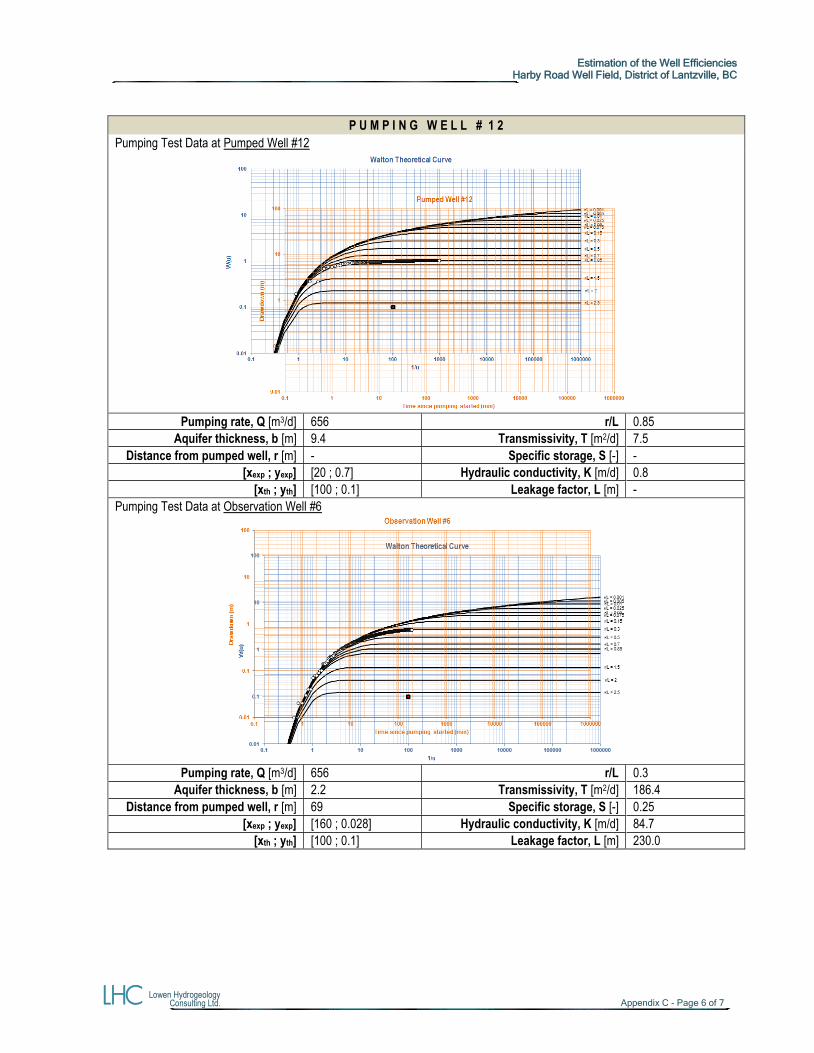
Estimation of the Well Efficiencies
Harby Road Well Field, District of Lantzville, BC
Lowen Hydrogeology Consulting Ltd. Appendix C - Page 6 of 7
P U M P I N G W E L L # 1 2
Pumping Test Data at Pumped Well #12
Pumping rate, Q [m3/d] 656 r/L 0.85
Aquifer thickness, b [m] 9.4 Transmissivity, T [m2/d] 7.5
Distance from pumped well, r [m] - Specific storage, S [-] -
[xexp ; yexp] [20 ; 0.7] Hydraulic conductivity, K [m/d] 0.8
[xth ; yth] [100 ; 0.1] Leakage factor, L [m] -
Pumping Test Data at Observation Well #6
Pumping rate, Q [m3/d] 656 r/L 0.3
Aquifer thickness, b [m] 2.2 Transmissivity, T [m2/d] 186.4
Distance from pumped well, r [m] 69 Specific storage, S [-] 0.25
[xexp ; yexp] [160 ; 0.028] Hydraulic conductivity, K [m/d] 84.7
[xth ; yth] [100 ; 0.1] Leakage factor, L [m] 230.0
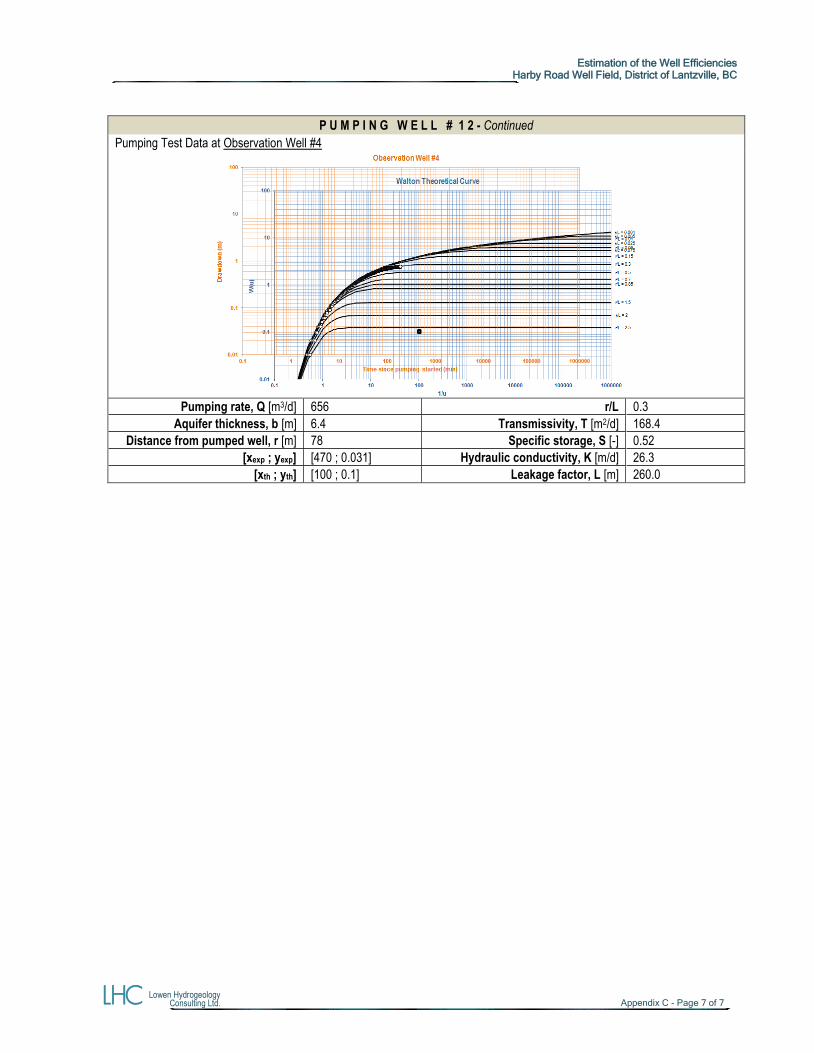
Estimation of the Well Efficiencies
Harby Road Well Field, District of Lantzville, BC
Lowen Hydrogeology Consulting Ltd. Appendix C - Page 7 of 7
P U M P I N G W E L L # 1 2 - Continued
Pumping Test Data at Observation Well #4
Pumping rate, Q [m3/d] 656 r/L 0.3
Aquifer thickness, b [m] 6.4 Transmissivity, T [m2/d] 168.4
Distance from pumped well, r [m] 78 Specific storage, S [-] 0.52
[xexp ; yexp] [470 ; 0.031] Hydraulic conductivity, K [m/d] 26.3
[xth ; yth] [100 ; 0.1] Leakage factor, L [m] 260.0

Drawdown and Recovery Graphs
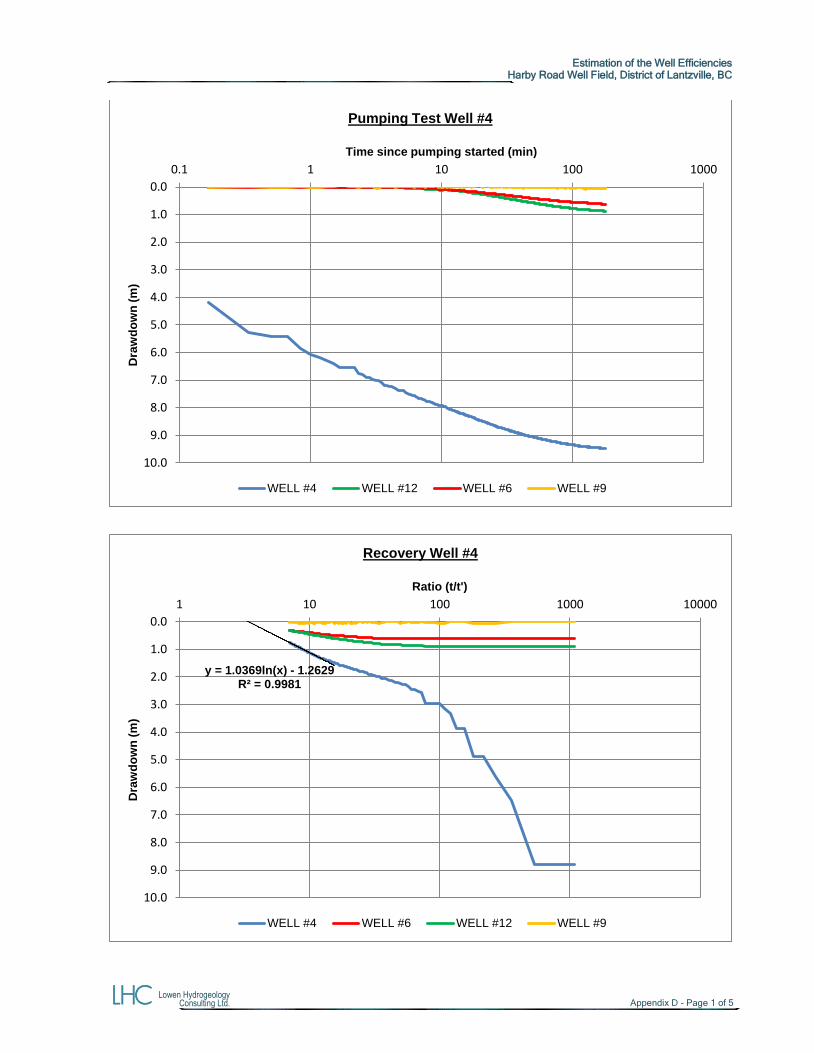
Estimation of the Well Efficiencies
Harby Road Well Field, District of Lantzville, BC
Lowen Hydrogeology Consulting Ltd. Appendix D - Page 1 of 5
0.0
1.0
2.0
3.0
4.0
5.0
6.0
7.0
8.0
9.0
10.0
0.1 1 10 100 1000
Dra
wd
ow
n (
m)
Time since pumping started (min)
Pumping Test Well #4
WELL #4 WELL #12 WELL #6 WELL #9
y = 1.0369ln(x) - 1.2629R² = 0.9981
0.0
1.0
2.0
3.0
4.0
5.0
6.0
7.0
8.0
9.0
10.0
1 10 100 1000 10000
Dra
wd
ow
n (
m)
Ratio (t/t')
Recovery Well #4
WELL #4 WELL #6 WELL #12 WELL #9
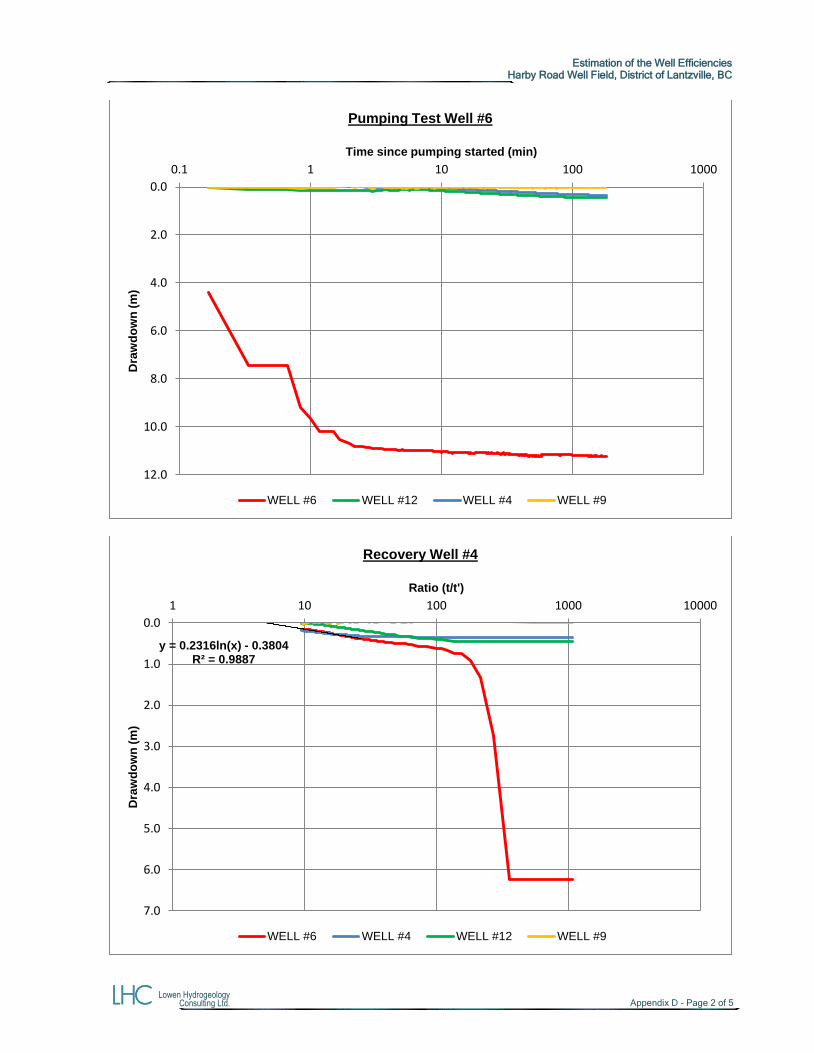
Estimation of the Well Efficiencies
Harby Road Well Field, District of Lantzville, BC
Lowen Hydrogeology Consulting Ltd. Appendix D - Page 2 of 5
0.0
2.0
4.0
6.0
8.0
10.0
12.0
0.1 1 10 100 1000
Dra
wd
ow
n (
m)
Time since pumping started (min)
Pumping Test Well #6
WELL #6 WELL #12 WELL #4 WELL #9
y = 0.2316ln(x) - 0.3804R² = 0.9887
0.0
1.0
2.0
3.0
4.0
5.0
6.0
7.0
1 10 100 1000 10000
Dra
wd
ow
n (
m)
Ratio (t/t')
Recovery Well #4
WELL #6 WELL #4 WELL #12 WELL #9
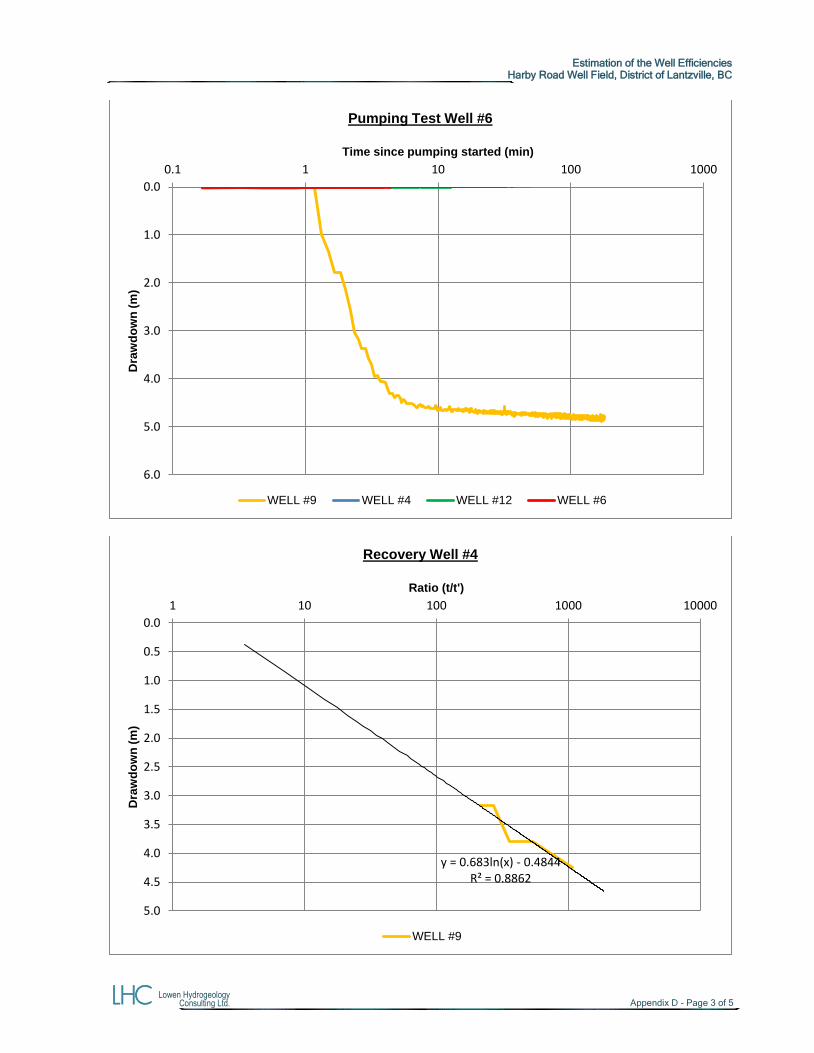
Estimation of the Well Efficiencies
Harby Road Well Field, District of Lantzville, BC
Lowen Hydrogeology Consulting Ltd. Appendix D - Page 3 of 5
0.0
1.0
2.0
3.0
4.0
5.0
6.0
0.1 1 10 100 1000
Dra
wd
ow
n (
m)
Time since pumping started (min)
Pumping Test Well #6
WELL #9 WELL #4 WELL #12 WELL #6
y = 0.683ln(x) - 0.4844R² = 0.8862
0.0
0.5
1.0
1.5
2.0
2.5
3.0
3.5
4.0
4.5
5.0
1 10 100 1000 10000
Dra
wd
ow
n (
m)
Ratio (t/t')
Recovery Well #4
WELL #9

Estimation of the Well Efficiencies
Harby Road Well Field, District of Lantzville, BC
Lowen Hydrogeology Consulting Ltd. Appendix D - Page 4 of 5
0.0
0.1
0.2
0.3
0.4
0.5
0.6
0.7
0.8
0.1 1 10 100 1000
Dra
wd
ow
n (
m)
Time since pumping started (min)
Pumping Test Well #6
WELL #12 WELL #6 WELL #4 WELL #9
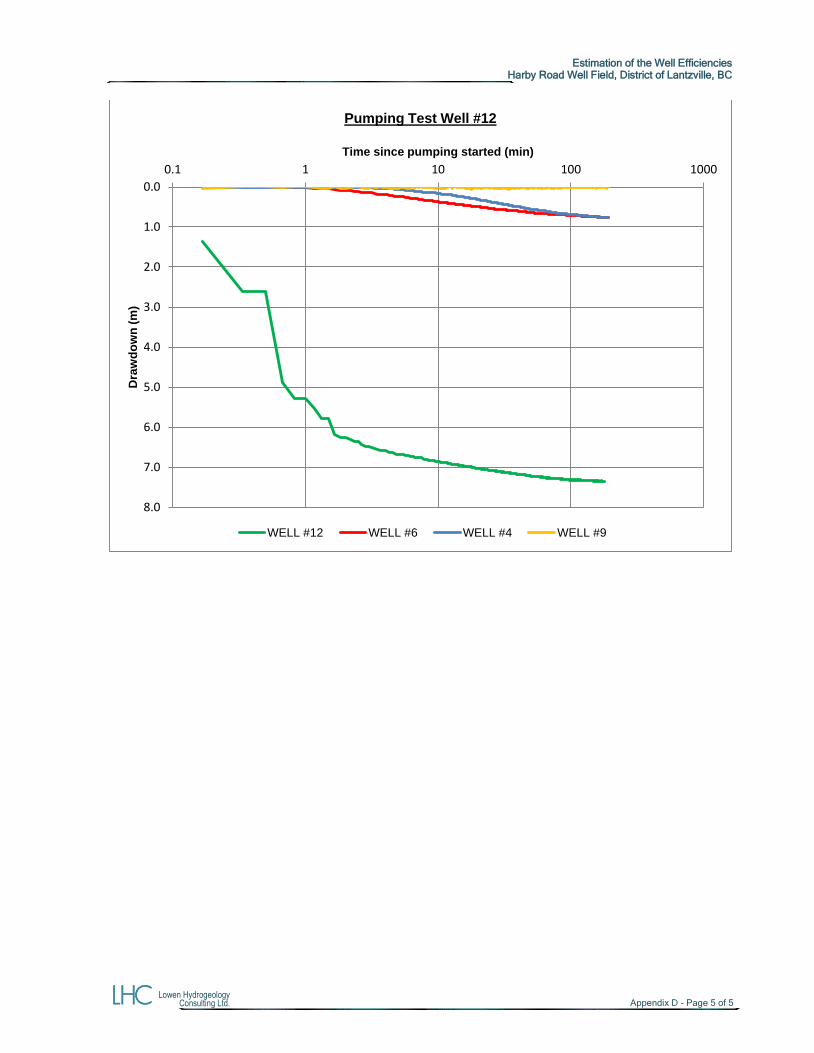
Estimation of the Well Efficiencies
Harby Road Well Field, District of Lantzville, BC
Lowen Hydrogeology Consulting Ltd. Appendix D - Page 5 of 5
0.0
1.0
2.0
3.0
4.0
5.0
6.0
7.0
8.0
0.1 1 10 100 1000
Dra
wd
ow
n (
m)
Time since pumping started (min)
Pumping Test Well #12
WELL #12 WELL #6 WELL #4 WELL #9

Appendix D
OCP Map 7 – Water Service Area
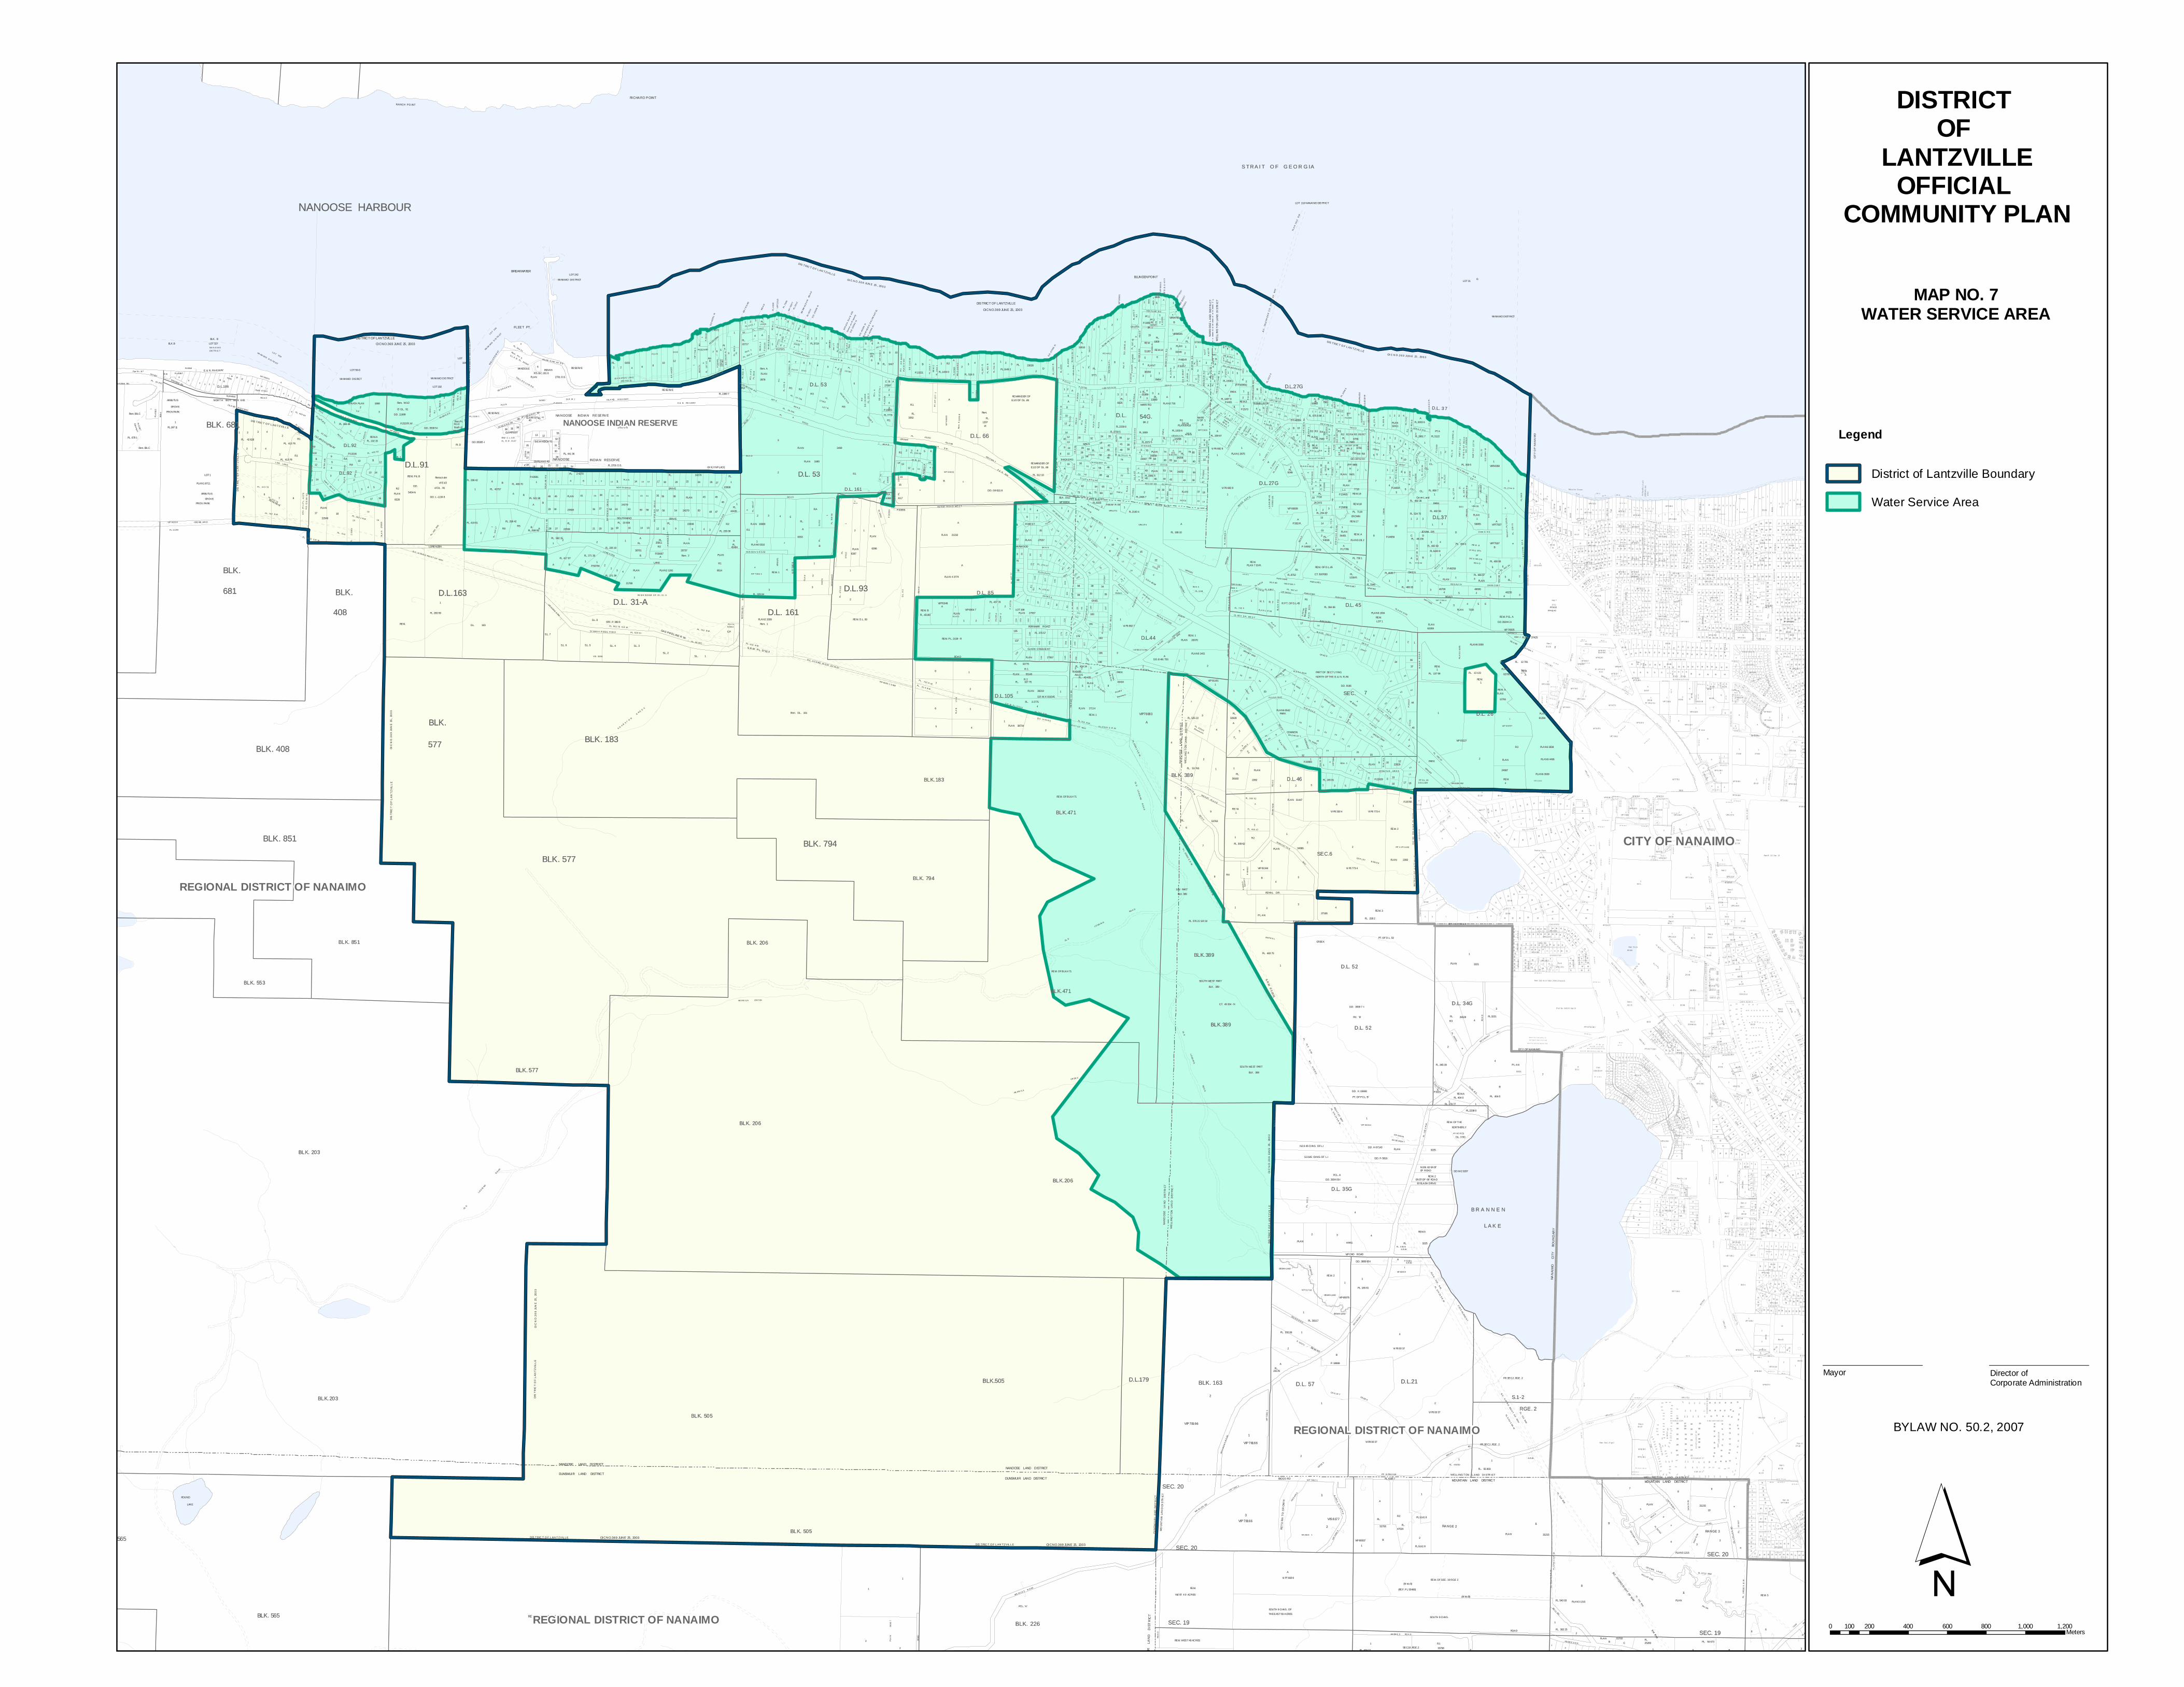
1
1
PCL. 'A'
2
2
REMAINDER BLOCK 463
1
LOT 1
Part D.L.117R.10
148 13
166 15
3 12
1
1211
109
87
43
2
1
PK
56
PAR
K
CRO WN LAN D
Rem. Blk.C
4 A
Rem. Blk.C
13 3
5 2211
SOUTH 9 CHNS.
SEC.18 ,RGE.2
REM. OF SEC. 19 RGE 2
11REM.
WEST 4 0 ACRES
SOUTH 9 CHNS. OF
THE EAST 60 ACRES
REM. WEST 40 ACRES
7 98
10
11
243
11
1 1
11
N.2.6 45 CHNS. OF L.I
S.2.645 CHNS. OF L.I
PCL. A
3
4
1 2 3 4
1
1
2
B
1
2
A
A
1
3
4R.3
2
4
17
B
PT. OF PCL. 'B'
1
Pcl. 'B'
REM. OF THE
NORTHERLY
45 AC R ES
D.L. 3 5G
6 REM. 2
1
27
8 3
4
341 2
REM. 3
PT. OF D.L. 52
1
1
1
121091
17 16321
7
23
LOT A REM.
REM.2
1
LOT 1
REM.A
REM. 1
36
37R. 1
8 1 PART OF SEC.7 LYING
39NORTH OF THE E. & N. R./W.
417
243
4456
46 3
REM. 1 55
3
59
5 4 454
1
3
2
11
5
1
1
1
1
R E M.
REM. 1
'A'
6
R.1
A
4
PT.A
10
8
1
BK.4BK.3
7
R.1R.2 R.3 R.4 R.R.7R.6R.5R.4R.3R R.2
R.13P10 R.9 R.8
AA
BK.2
45
7 6 53
R.1
7 3 2
1412
A10861 2 4 Rem. A
R.1
6
R.1.R.5
Rem.
R'A
'
B C
A
S.L. 6 S.L. 5 S.L. 4 S.L. 3
S.L. 2S.L. 1
S.L. 7
S.L. 8
Rem. W 1/2
Of D.L. 91
2
32 41
R.1
R.1
Rema in der
11of E 1/2
of D.L . 91
R.A
2 3 4 5
A1
1AR.1 2 1
1
B
Rem. 2
R.1 1
2
33
Rem. 1
R.1
2
A
3
2
94 6 81 10 142 1711 15 16 222018 24 26 27
38 312939 33 3534 36 3846 45 43 45
46
37 64 63 6130 3629 59 58 57 56 54 50 4748
13141618 12 112027 928 21 6 4 3
BK.1
REM.3
A
SOUTH WEST PART
BLK. 389
18
19
456
41
1
REM.
1
A
BK.2
1
REM. D.L. 93
D.L. 163
REM. OF BLK.4 71
REM. OF BLK.4 71
SOUTH WEST PART
BLK. 389
C.P.
1
2
B
1
1 R.1
(Ar ea A)
(Ar ea B) REM. 5
A
B
A
B
FR.SEC.2 ,RGE. 2
FR.SEC.1 ,RGE. 2
RA NG E 1
A
R.2
2B
N.159 .62 EASTOF ROAD
REM. 2EAST OF 66' ROAD
REM.A
1 R.2
18
1920
22
23
31
32
2921
78
9
10
11
12
13
14
15
16
24
2526
27
28
PARK
33
1654
1716
14
19
2 1
PARK
18
612
52
4
3
2 A
B
35
1 4
R. PT. OF D.L.45
12
123
62202
273
1
12
5 45
A'A'
7
8 9
1014
11 15
2212
17
21
18
2
14
34 351211 36 137 2 1 3 51341 38 942
14 3943 40 1074 77 79158 44
69 68 1274 66 65 64 62 60267 16
4655 5
49 5324 52 49 77
48 46 44
4
3 2 3
A
1 2 A31 43 2 1B15 A B
PL.1A
2
21
1
PA
RT
OF
D
.L.5
4
PT
.A
A
'A'
4
17
N.2
57
'
3 6 11 23
4
2Pc
l.'A
'
1
12
1
1A
A
8 9 10
5
A
11 2 3
A2
4
B1 3
1 243
62 1 2 A
151115
4
PARK
1
2
76
74
A
78
10
9
80
98 39 34
112
119
12
0
83
85
87
89
90
2 921
95
94
18
4
18
7
LOT 199121 183
122
13
3
13
4
13
2
13
0
12
7
12
5
181123
177135
17917
5
17
4
193
16
0
16
5
16
3
16
7
15
9
15
7
196
15
314
4
14
9
198
1
REM.
REM.
REM. A
3 41 2A
R.1
21 12 23
314
5 215 4 P
AR
T O
F
LO
T C
PC
L.'
B'
PC
L.'
A'
PA
RT
OF
L
OT
B
LYIN
G N
. O
F R
OA
D
8 10
B
1
C1
1
1
D
B
E.2
CH
NS
. O
F A
1
R.3
4
A
1 29
37
4
6C.L.5
Cro wn L and
PARK
321
21
43
16
2 2515432
3
2
1
11 1012
131
A
A5
7 B
1
A2
2 F
13
3
9
REM.18
1
REM. OF D.L.45
A
2
14
15
2
1
1
20
L.1
REM.19
1
CROWN
REM.17
B8
C D
10 9 2 3 4 6518 B E20
F
1
PAR KRE M . 1
32PT.
5 6
8 9
PT.
4R
EM
.
6
A B
PCL.A
R.21
Pc
l.A
1 2 132
A4
Rem . 1
35
Re
m.
2
Am
L.5
RE
M.L
.3
Pc
l .A
of
2
45
1
1
8
1
2 3 4 5 6
13
11
215
1
16
9
A R.17
RE
M.L
.2
AC B
AB
1
1
2
12 1
3 R.1
1
2R.24321 1
REM.A
R.93
R.106
115
12124
3
21413 A B
1 115
A B165 7 8
BA
1917 185
TH
. P
T.1
PL
. 4
13
78
1
18
R.2R.51 B AR.6
21
A121
R.2
B A
1BA
1
1
2
REM. Pcl. B
20
R.2
6
A
15
16
17
18
A
543
21
12
13
15
14
R.A
R.9
10
1617
12
23 4
1
2
A
PARK
AB
1
A
B
CR
OW
N L
AN
D
S.W. PART
BLK 389
COMMONPR O PE RT Y
5
6
2
A
2 B
1
B
4
10
13
2
PT
. O
F L
OT
1
A
A
Co
mm
on
Pr
op
ert
y
Pt.
1
A
PA
RK
Rem. D.L . 161
C.L.
C.L.
A1
D.L
. 9
3
Am
1
4
A B
Am
.6
1
R.1 R.2
R.3
LO T B.
1
RE
M.C
10
2
3
4
A
R.1
A
R.4
PL. 2248
Rem. 5
1
A
1
3
9
A
A
1
RE M . B
LY IN G STH
OF
DIC K INS O N
RO A D
5
C.L.
3
REM. A
2
139
137
R. 2
29 30 31
28 27
37 18
20 19
54 59
43 40 3817
70 69 67PAR K
3
61
53
59
4
2
1
5
REM.5
1
1
1
1
CR O WN LA N D
C
21
2325
27
3234
46
810
12
42
58
50
48
46
A
A
1
A
2
1
Rem . Pc l . A
8
R.S.B.C.161 6
Pt. D
1
13 12
8
'A' OF 1 7
6
A
R.9R.11 R.10
8
10
12
1
12
4
STH.
PLO V E R RD .
1
3
1
2
3
2
PC
L.A
of
1
R. 1
RE M A IN D ER O F D L 31- A
1
3
7
C.P.
6
REM.
R. 1 R. 2
43
2
7
12
4
REMAINDER OF
E.1/2 OF D.L .66
E.1/2 OF D.L .66
1
A
1
2
3
1 2
30
C.P.
6
75 64
2
A
5150
49
46
44
42
1 2 3
9 7
1513
57
58
59
60
62
64
66
67
68
100
10
7
10
5
10
3
38 35
A
R.7
R.8
A
12
3
4
5
34
35
36
37
1
1 3 5
14
15
20
54
6
A
45
1
1 2 3432
'D'
A
2
33
2
R.2
BA
1A
5
4
REM.14
15
1
2
A1 5
AM
D.
4
1
2
A
B
13
2
1
1
3
3
2
A
REM. B
A
A BC
D
1 2
27
8
1
1
R.12
'A'O
F1
R1
8
6
23
'A'
'A'
14R.
R.6
S.1
10
'
'A'
PT.
7P
T.7
3
12
3A
14 6
16
B
2
1 2
1
2
AM
D.
2
W E1/21/2
PT.2
REM.
S.100'
9
10 30 32
58
28
27
29
5645
3 70 A
2
321
Am
.7
A
R.A
Rem.Pt.Pcl.DSouth ofH'way
RE
M.
D
R.1
14
10
48
54
64 65
5
A
66
21
26
67
8
80
4
11
17
21
22
19
24
26
28
30
69
75
111
96
A
16
8
176
155
3
BA
DC
C
D9
8
6
C
A
B
17
A
28
19
11
2
1
PT.1
2
5
3
A
15
0
PT. D.L. 26
7
101
A
B
4
PC
L.
A
A
1
A
H J L
1
7
8
A
PL
AN
36
08
7
PLAN 1 8711
VIP 66601
PL.187 11
VIP 66310
P.47432
PL. 41378
PL.48557
PLAN
PL.
43
915
PL. 57042 S.R .W.
PL. 678 1
PL.4
391
7
PL. 40 252
P.48558
PLAN 47433
31215
PL. 56 673
PL
. 4
86
66
S.R
.W.
PL. 474 17PL. 261 70
PLAN 3 1215
PLANPLAN 3 1215
31215
PL
. 76
3 R
/W
PL. 55 803
PL. 516 R/W
PLAN 31215
PL. 28117
PLAN
25008
PLAN 3225
D.D. 3934 03-I
PL
. 3
22
5
PLANPL.
D.D. 3880 90-I
D.D. 3559 7 -I
PL.322126528
PL. 404 0
3221
P L A N
PL
. 49
95
6
VIP 66044
VIP 66046
34985PLAN
37166P L A N
PL. 228 2
PL. 483 75
PLAN 3221
C.T. 49 304 - N
P.4
90
13
PLAN
2282
PL. 353 52
PL.
VIS 3586
PL. 137 99
D.D. 9186
P.2
64
47
PLAN
27223
27
22
3
PL . 52523
PLAN 6 1401
PL
AN
PLAN 6 1904
PL. 364 66
PLA N
26447
PLAN 64229
PLAN 63626
PLAN 64493 PLAN 63627
PLAN 63671
PL. 63739
PL. 64726
PLAN 64229
PL. 732 5
PL. 23 561
PLAN 6 3358
PLAN
63359
PLA N 6 3706
P.24659
PL. 13 123
PL
.30
05
PL
AN
18
89
8
Ea
se
m't
. P
L 5
35
23
PL.5122
P. P.46804
PL.25937PL.7960
D.D
.19
87
1-W
PL.7960
D.D
.A-
59
24
8
P P 64291
P.302-R.
PL.6756
D.D
.42
232
-W
D.D
.F-2
097
9
PL
.
119
22
PL
.
CT.381583
D.D.6
3467N
PL.3
6051PL.1533 6
PL.1909
PLAN 55418
VIP
65
91
3
VIS 4421
P.P
. 6
41
32
PL
AN
9
44
2
PL.
3352
VIP
60
60
3
PL
.50
12
PL
.50
12
D.D
.15
03
8-N
D.D
.25
09
3-N
D.D
.46
48
9-N
D.D
.46
49
0-N
PL.PLA N 6402 10796
PLAN
2878
PL
. 2
31
9
PL
. 3
71
9
P. 42884 Eas em t
P.P
. 6
43
93
PLA N9155
PL
. 8
02
4
PL. 9155
34980
PLA N
D.D. 11689
PL. 40 252
PL. 413 78
PL. 2 4270
PLA N
PLAN
24270
23508
PL. 23 508PL.
23508
8226
PLAN
PL. 413 78
VIP 66615
PL. 24270 PL.
23508
PLAN
24270
PL. 23508
PLAN
20737
PLAN
PLAN 2 1281 8514PLAN
21788
PL. 40250
PLAN 2490
PLAN 2490
PL.PLAN 16980
31
23
2
PLAN 21232PLAN8353
PL
.
6396PLAN
PL
.
6397
37
91
3
PL
AN
24
67
6
PL. 329 04
PLAN 2 1509
VIP 60603
PL. 283 59
VIS 3898
PL. 60 392
PLA N 6 4494
PLA N 6 4772
PL. 762 R.W .
PL. 516 R.W .
PLAN 27557
PLAN 27114
PL
AN
17
46
S.R .W. P L.57513
PL.806 R.W.
27395
PL.8193
VIP64773
VIP64774
PL. 188 10
PLAN 7 33-R.
VIP65052VI P6 570 2
P.4828
7
PL.52645
D.D. H -89284
PL.
211
5 R
.W.
PLAN
61294
VIP 65097
PL.27393
PL. 40 250
D.D
.19
10
8-N
PL
AN
51
6 R
.W.
PL
AN
1
91
3
R.W
.
7234
P L A
N
PL. 382 25
PLAN
33796
PL. 763 R/W
PL
.57
62
2 S
.R.W
.
PL
. 5
04
70
S.R
.W.
PL. 540 93
PL.3712 R/W
34
04
R/W
34
04
R/W
PL.
PL.
47024
PL
.57
62
5 S
R.W
.
PL
AN
5
16
RW
24178
PL
. 57
62
5 S
.R.W
.
P. 52371
D.D. H-57143
D.D. F- 5816
D.D.M-2 0207
PL
. 76
3 R
/W
D.D. K-15658
PL. 404 0
PL. 279 77
PL.2238 0
PL
. 1
38
4 R
.W.
PL
. 57
62
4 S
.R.W
.PL. 309 62
PL. 576 21 S.R.W.
PL
. 50
86
2
PL.
41124
22829
PL. 245 81
PL. 455 47
PLA N 6 0542
PLAN 6 0542
PLA N 6 0544
PLA N 1 4738
PL
AN
80
76
1238-R.
PLAN
12781
PLAN
62700
PL
AN
64
49
5
PL. 300 5PL. 482 59
PL. 466 06
PLAN
4679046235
PLAN 37425
PL. 12 781
P.48259
PL.4636 7
PL.
PL.20524
PLA N D.D
.15
69
2-N
18898
P.1
33
90
P.2
63
56
D.D
.38
84
-W
PL. 300 5
PLAN 9421
PL
.51
22
PL
. 1
00
4-R
.
P.24659PL. 858 7
PL
. 3
00
5
PL
. 1
27
09
PL
. 5
35
21
D.D.33712 8-I
D.D
. K
-10
05
29
P.38557(P.P. 989)
PL
. 4
74
38
P.
42
00
0
PL. 482 36
PL. 482 59PL. 524 75 PLAN
PL.5933 6PLAN
PL
.37
6-
R.
32411
PL. PLAN PL 6756
6757 PL. 67566756
P.3
84
87
PL.5046
PL
AN
36
63
3
PL.7718
D.D.H
44419
28
10
3
P.1
76
50
P.9
42
1
P.1
28
57
P.2
01
02
P. 54592
PL.44636
PLAN
7718
PL
.10
58
5
PLA N PL.PL. 796015960
1 8 4 3 4
P.1
92
86
P.25280
44
01
PL.1509 1
PL
.15
12
9
P.2913 10
35
1
P.1
19
00
PL.1407 0P.4401
PL.11922
PL.
5104
PL.2675
8
PLA N 9 671
PL. 209 67
PLAN 1 2675
(P.P.40991)
PLAN29424
PL
.
D.D
.19
54
5-N
P.6
37
-R.
P.13835
PL
.3
10
67
38250
PL
.31
79
0
P.2
71
97
P.26791P.23758
PL.13980
6625 PLAN 2 733
26
02
0
PL.2239 6PL
AN
7
62
2
PL
AN
PL.2739 5PL
AN
21
47
4
PL. 24258PL.2072 5
D.D
.67
08
6-N
PL
.85
29
PL
.49
29
PL
.13
32
-R.
P.1
23
69
PL.1434 0
P.4
33
88
3447
D.D
.11
40
-W
PL
.19
15
7
27097
P.2
25
48
Re
m.
P.1
20
5-R
PL
.75
86
PL.19105
24987PL.
PL.PL.371922717
367 R /W
PL.P.27371
PL. 352 9
P.3160 R .W
PL
.2
73
93
PL
.40
99
PL
. 1
15
91
P.1
07
21
PL
.53
98
2
D.D
49
29
1-N
PL
. 1
87
42
P.5
03
09
PLAN 2701 O.S.
1868STRATA PLAN
P.2537R.WPL.11539 D.D. 3530 5-I
P2
53
73
PL. 42 628 PL. 132 15 D.D.35305 -I
PL. 402 52PL. 441 36
PL
.
22
54
9
P.42681PL. 298 42
PL. 469 70
D.D. L -1134 8 PL. 521 98
PLAND.D
. E
E 2
87
62
PL . 762 R.W .PL. 282 1 R.W .
PL. 298 42PL. 419 81
PL. 508 93PL. 516
PL
AN
25
99
3
PL
. 4
44
17
PL. 582 15
D.D.
5454-N
PL
.16
02
2
PL
.36
58
0
PL . 493 84
P.13216
52
43
6P
L
PL. 413 79
PL. 4
80 R
/W
PL. 40 456
PL. 235 08
PL.25811PL.
PL. 226 1939701
PL. 271 39PL. 417 97
PL.45484
P.50667
P.5
06
68
E'm
't
P.50756
PL. 271 39
62664
PLA N
PLAN61472
22
89
9
PL
.
23
06
9
PL
.
PL
.85
92
PL
. 4
05
66
PLAN 4 3774
PL
. 4
79
68
PL
. 5
32
65
P.33555
P.3
35
55
P.4068
STR. P. 389 8
PL. 626 61
PLAN
24258
PLAN
27
39
5
PL. 312 10 PL.3381 5
P.2
07
25
P.2
73
95
PL
AN
P.1
90
93
PL.2406 7
PL.2160 4
PL.
15245
PL. 275 57
PL. 275 57
PLAN 27557
PL. 502 79 S.R .W .
PL. 275 57
PL. 32775
43434PLAN
PLAN 39219
PL. 3 2775
PL.762 R.W .
PL.763 R.W .PLAN 38734
PL
. 4
37
77
PL. 434 34
PLAN 55145
P. 4
47
33
PLAN 6
0308
PL.
24258
24258
P.2
42
58
D.D.A
15621
PLA N
P.2
75
57
PL
.27
55
7
PL.8752
24
25
8P
L.
22549
PLAN 6 3508
PLAN
24687
PLAN 6 3509
PLAN 6 4496
PL. 10 796
PL.
59333
PL
. 2
31
9
(REF. PL 55468)
REM. PL. 2139 - R
P.L
. 50
86
2 S
.R.W
.
PL
.57
62
1 S
.R.W
.
PL 2701 O.S.
P.5204
2SRW
P.5
788
2
P.1
91
05
ST
RA
TA
PL
AN
43
6
PL
.13
22
1
P.13221PL. 516 3
P.19861
PL.7779
3333
P.4
86
52
VIP
65
052
P.50155
PL
VIP
64
26
4
27
19
34451
PL. 462 47PL. 63657
PLAN 63648
64122
PLAN
PLAN 31447
VIP65800
PLA
N 6
05
45
P.49792
P.4
97
86
PL.7948VIP65448
PL 476 56
PL.5420 9
PL. 462 36
56855
VIS4291
VIP
65
295
VIP
65
296
VIP
65
297
P.3
85
56
PL. 254 07
PL
. 7
71
8
PLAN 3 211 2
PL. 730 1
PL.2770
P.28
38 R
.W.
P.44
969
PL. 41483P.44970
PL. 327 75
S.R.W. K101545
PL. 51 6 R.W .
PL. 762 R .W.
PL. 437 78
P.
43
77
9
P.4
47
34
PLAN
24258
PL.
27395 S-101703D.D.
PL.
1207
-R
PL.
PL. 265 28
PL. 57625
P 50431
3225
VIP 63004
PL. 165 81
VIP
66
41
5
PL. 332 06
P. 18999
PL.
PL 48756
PL.4166 7
52706
PL.5141 8
PL
.
44
63
7
22702 PL.25260
PL
.
PL. 48922
VIP66248
PLA N 5 9344
PLAN 20070
VIP
66
864
VIP68209
VIP
66
816
VI P6 682 8
VIP66828
PLAN 2282
VIP 68032
VIP66834
VIP68299 R
W
VIP68298 RW
VIP68208 RW
PP VI P66 646
PL
.14
30
1
P.29352
PL
.14
30
1
PL
.56
67
0
P.1
40
70
P.46243
C.L.S .R . PL. 50304
PL. 454 51
2701 O.S.PLAN
PL.2106 1
PL.
42435
P.54558
P. 15129
D.D
.J6
35
50
P.
29
94
2
P.2573
PP
VIP
64
702
P.2
14
74
P.2
48
02
P.2
82
60
D.D
.52
61
3-W
PL
. 1
13
21
P.21172
VIP62662 S
RW
VIP64358
VI P6 682 8
VIP
66
08
1
PL. 413 78
PLA N26532
PL.1380 7
PL
.63
9-
R
PL
.39
18
PL
.
2
59
93
PL. 40757
VIP 6585 1 S RW
VIP
65
298
PL.5141 8
44451
13
86
7
13
86
7
PL
AN
VIP6030
8
PLAN
PL. 466 07
46606PL. 486 95
PLAN 7330
PL.2744 9
PL. 7118
PLAN 28792
DD. G9 021 8
VI P6 982 7
VIP
69
90
6
VIP6904 7
VIP60546 S
RW
VIP
60
543
SR
W
VIP60547 SRW
VIP60547 SRW
VIP60547 SRW
P.25290
D.D.EH91 753
27557PLAN
PL.57621 S .R .W.
PL.
32628
PL
.
PL.5080
4
13867
P.20883
P.25766
PL.
28183
53763
PL. 23628
PL.1645 2
PL
.80
7-
R.
PL
.45
5-
R.
PL
.70
1-
R.
59
23
7P
L.
PL.
19510
PL.
3771
PL
.18
72
5P
L.
58
74
8P.
54
89
8P.
51
52
6 PLAN 7
PL.
1909
P.1
08
1-R
.
P.1909
S.9
0'D
.D.
C-
47
77
57321
VIP68545
VIP64750
PLAN
31546
P. 11317
D.D
.B-
89
46
7
P.489-R
VIP
70
20
1
PL. 45180
VIP70248
P.23139
PL
.48
39
3
PLA N 3 6633
PL
.93
8-
R.
PL
.71
92
PL.1861 7
PL. 675 6 BK.1
P.11 922
PL
. 1
81
29
P.1
85
00
PL.
4835PLAN
P.2
33
58
P.1
87
25
21
36
7
24067
3447
D.D
.30
10
4-N
P.3
94
82
PL.4672
D.D
. 3
53
05
-I
PL. 366 48
Pt.lPL.8010
PL. 228 99
PL.
P.50641
P.
43
77
5
P.43435
15245
PL. 48 236
PLAN
P.25856
P.23493
P.1
92
85
P.22829
PL. 60543
646 52
PL .
PLAN 6 0310
PL
. 4
85
37
PL
. 2
59
93
P.3221
PLAN
P.10147
P.17795
PL. 43 435
PLAN
D.D. 11329
PL.
VIP
71
58
3
PL . 40950
PL. 53 763
PL. 525 22
DD
37
57
79
-I
VIP
72
31
6
PL .2271 7
VIP72900
VIP
72
83
4
VIP 7082 1
VIP7082 1
VIP
70
82
1
VIP
73
53
7
PP V IP71095
VIP 7392 4
VIP74536
RO
AD
WE IG LE S R O AD
OLD
LOG
GI NG
RO
AD
RUM MING RD.SKYVIEW RD.
RUM MING
AN DR E S R D .
BELL RD
.
A N DR E S R D .
DOU
MO
NT
RO
AD
DOU
MO
NT
DO
UM
ON
T R
OA
D
WAY
SY WAS H R IDG E R OA D
CRES.
RO A D
IND U ST RIA L
RO A D
HARWOOD
AN DR E A
FERNMAR ROAD
CLARK CRESCENT
ELIZA B ETH
TU RN
BLA CK J AC K
LISA LAN E
GAYLYN PLACE
PARK
DRIV
ENO R TH WIN D DRIVE
RO A D
SOUTHWIND DRIVE
WE
ST
WIN
D
DR
IVE
EA
ST
WIN
D
DR
IVE
SU
PE
RIO
R
ST
ON
E R
D.
BA
YV
IEW
LORENZENLAN E
NO
RM
AR
EL
DR
IVE
BL
OW
HO
RN
DR
.(P
RIV
AT
E)
(PR IVAT E)JO H N STO N LAN E
RO
AD
EB
Y R
OA
D
BE
NW
AL
DU
N
RO
AD
RO A D
RO A D
LAN TZV ILLE
DIC K INS O NRO A D
PE
TE
RS
ON
RO
AD
CA ILLE T R OA D
NO
RT
HR
D.
OWEN
LANTZV
ILLE R
OAD
JACK'SHA RB Y RO A D EA ST
JING
LE
POT
RD
.
CR ES .
GIL
LF
ILL
AN
RD
.
RD .
BIGG S
JE N KIN S RO A D
DR IV E
RD
.
LANE
LO RE N ZEN
BEL
IVEA
U P
.
RO A D
LO GG IN G
OL D
OL
D
LO
GG
ING
RO
AD
RO
AD
OL
D
LO
GG
IN
G R
OA
D
ROA
D
RU
M MIN
G
D.D
.20
70
3N 21369
PL.
ROAD
RO
AD
EYELASH DRIVE
HIG H ET PLA C E
JERSEY RD.
DR .
VA
LM
AR
RD
.
MA
RT
R
D.
ME
TR
O
RD
.
PL
.
ROAD
RO
AD
HA SE PLA C E
ELM R O A D
RO
MA
C R
D.
HO B SO N ' S R O AD
RD .
N.1
28
' JA
CK
'S
LE
LA
ND
DR .MRUS
RO
AD
SH
AN
GR
I-L
A
SU
NB
UR
Y R
D.
TW
EE
DH
OP
E R
D.
AAT S
TER R .
LA
VE
ND
ER
RD
.
RO
AD
LY N N D R .
NE
GR
IN
M ILLAR D D R IVE
HU
DD
LE
ST
ON
E
RD
.
WIL
SO
N R
D.
M c KE RC H ER R D .
RO
AD
RO
AD
STR A IT R D.OA
R R
OA
D
MY
RO
N
DIC K INS O N R D.
JENNA DR.
RO A D
SA
XO
N C
RO
SS
R
D.
ROA
D
RO
AD
LAN C RE ST
RO A D
ALISO N RD
RO A D
RO A D
ROYAL DR.
LA
NT
ZV
ILL
E S
CH
. R
D.
ST
RO
NG
E
RO
AD
AIN
SW
OR
TH
JOY
WA
Y
S LO G A R D R IVE
CH ATA WAY PL.
TREMBLAY
HA RL EY
TUCK
RD.
CA
M
PB EL L RD .
PLAN
6
LAND
MAR
K
AN DR E S RO A D
RO
AD
AL
GE
R
RO
AD
CLAR
K DR
IVE
WA
RE
RO
A D
MA
NL
Y R
OA
D
M c GI LL
BAY VIE W R D .
DA
WN
RD
.
SA BR E RD .
STEVEN S PL.
WA
RIC
K R
D.
GE
ISL
ER
P
L.
THICKE RD.
LE
LA
ND
MAIRI RD.
RO
AD
LA
NC
EW
OO
D A
V.
SU
PE
RIO
R
R
OA
D
ROAD
LAN TZV ILLE
VA
ND
EN
HO
EK
RD
.
M ILN E R R D .
VIPOND ROAD
CL AR K D R. WE S T
ROAD
CR ES C EN T
WA
YN
E P
L.
ROA
D
NE
ST
OR
W
AY
O WE N R D .
RO S ALY N
RD .
PH
ILIP
R
OA
D
FOREST
WAY
AU
LD
S R
OA
D
RO
AD
DA
VID
PL
.
EL
M.
RD
.
PH
AN
TO
MR
OA
D
P HAN
T OM
ROA
D
SUNB
URY R
D.
SA
BR
INA
PL
.
CAL RD.
RO
AD
HA
RP
ER
R
D.
WIN
SL
OW
RD
.
PE
TE
RS
ON
DR
HA
LL
RD
.
AULDS
FAW N D R .
RD .
HA
RW
OO
D
DR
.
SEA
SI D
E T
ER
R.
AR BU TU S CR E S.
YE W C U L - D E - SA C
VEN TU RE R D
LU CAS LA NE
PA
RK
LA
ND
S P
L
BL
IGH
RD
WE IGLES RD
BIGGS RD
BI G
GS
PI T
RO
AD
HA R BY R O A D WE S T
DR IV E
WAR
E
RO
AD
RO N AL D R O AD
PE TR U S PL.
SE
BA
ST
ION
RD
.
ELL ES M E R E D R .
RO S SIT ER AV EN U E
DU
NS
MU
IR
L
AN
D
D
IST
RIC
T
NANOOSE LAND DISTRICT
DUNSMUIR LAND DISTRICT
NANOOSE LAND DISTRICT
DUNSMUIR LAND DISTRICTMOUNTAIN LAND DISTRICT
WELL ING TON L AND DI STR ICTWELL ING TON L AND DI STR ICT
MOUNTAIN LAND DISTRICT
MO
UN
TA
IN L
AN
D D
I STR
ICT
DU
NS
MU
I R L
AN
D D
IST
RI C
T
BLK. 565
BLK. 565
BLK. 226
D.L.186
BLK. 681
BLK.
681 BLK.
408
BLK. 408
BLK. 851
BLK. 851
BLK. 553
BLK. 203
BLK. 851
BLK.203
RANGE 2
RANGE 3
D.L. 53 D.L.27G
D.L. 54G.
D.L. 66
D.L.91D.L. 53
D.L.37
D.L.93D.L. 85
D.L. 31-A D.L. 45
D.L. 161
D.L. 26
BLK.
BLK. 183577
BLK. 389D.L.46BLK.183
BLK.471
BLK. 794
BLK. 577
BLK. 794
BLK.471
BLK. 206
BLK.206
D.L.179BLK.505 D.L.21BLK. 163 D.L. 57
BLK. 505
SEC. 19
SEC. 20
D.L.163
BLK. 206
D.L.44
SEC. 20
SEC. 19
BLK.389
D.L. 35G
S.1-2
RGE. 2
D.L. 34G
D.L
.54
G
SEC.6
D.L.27G
D.L.105 SEC. 7
D.L. 3 7
D.L.92
D.L.92
D.L. 161
BLK. 505
SEC. 20
BLK. 577
D.L. 52
D.L. 52
BLK.389
REMAINDER OF
F
ROUND
LAKE
CO P LEY B RO O K
M ETR A L
CREEK
K N A
R S
T O
N
G R
E E
K
CR EE K
HE IKK ILA
B R A N N E N
M ILLST O NE
RIV ER
L A K E
CREE
K
CA ILLE T
CR EE K
HOS
KIN
S
CR EE K
BLOO
DS
S T R A I T O F G E O R G I A
NANOOSE HARBOUR
BL
OO
DS
CR
.
NA
NA
IMO
CIT
Y
B
OU
ND
AR
Y
CIT
Y O
F N
AN
AIM
O
CITY OF NANAIMO
E. & N. RAILWAY
E.& N. RA ILWAY
E.& N. R A ILWAY
R.W .
E.& N.
E.& N. R/W
ISLA ND H IG H WAY
ISLA ND
HIG H WA Y
ISLA ND H IG H WAY
ISLA ND HIG H WA Y
ISLA ND HIG H WA Y
IS LAN D H IGHW AY
B.C
. HY
DR
O R
IGH
T O
F W
AY
B.C
. HY
DR
O
RIG
HT
OF
W
AY
Eas em ent
Ea se m't
S.R.W.
B.C . H YD R O RIG H T O F WAY
B.C . H YD R O
RIG H T O F WAY
GAS PIPEL INE R .W.
S. R.W PL. 57 51 3
Ea se me nt
S. R.W
. P. 529
51
Ea
se
m't
EA SE M EN T
51
6 R
/W
PL
.50
86
2 S
R.W
.
S. R
. W.
Eas
m'n
t
EA
SE
ME
NT
Ease
m't
R W
Eas ement
S.R.W.
S.R.W.
2-2
0 E
AS
EM
EN
T
S.R.W.
B.C. H
YD
RO
RI G
HT O
F W
AY
S.R .W.
B.C . H Y D RO RI G HT O F W AY
EA
SE
ME
NT
3
1
ARBUTUS
GROVE
PROV.PARK
ARBUTUS
GROVE
PROV. PARK
Eas
em
en
t
RICHARD POINT
RANCH PO INT
BLK. B
BLK.B LOT 327
LO T 309
NA NA IM O D IS TR ICT
NA N AI M O
DIS TR IC T
LOT 242
LOT 1
96
LOT 56-G
LOT 192
NANAIMO DISTRICT
NANA
IMO
DIS
TRIC
T
NANAIMO DISTRICTNANAIMO DISRICT
LOT
194
NORTH BDY. BL K 6 81
RESERVE
NANOOSE
NANOOSE INDIAN RESERVE
RESERVE
RESERVENANOOSE INDIAN
INDIAN RESERVE
6
(S.R .W. )
BREAKWATER
FLEET PT.
R.A.
KNAR
STO
N
CREE
K
HWAY R /W
HW AY R /WBLK. 1512
NW85'
BLUNDEN POINT
LOT 110 NANAI MO DISTRICT
B.C
. T
EL
EP
HO
NE
C
O.
RIG
HT
O
F
WA
Y
WE
LLIN
GT
ON
LA
ND
DI S
TRIC
T
NA
NO
OS
E L
AN
D D
IST
RI C
T
NANAIMO DISTRICT
GLOT 31
WIL
ES
C.T. B87660 PL.
R.I.
R.I.
C.P.
HE IKK ILA CR E EK
8
51
6 R
/W
VIP74748 SRW
DIS TRIC T O F L AN TZVIL L E OIC NO.369 JUNE 25, 2003
DIS TRIC T O F L AN TZVIL L E OIC NO.369 JUNE 25, 2003
DIS
TR
ICT
OF
LA
NT
ZV
ILL
EO
IC N
O.3
69
JUN
E 2
5,
200
3
DIS
TR
ICT
OF
LA
NT
ZV
ILL
EO
IC N
O.3
69
JUN
E 2
5,
200
3
DIS
TR
ICT
OF
LA
NT
ZV
ILL
EO
IC N
O.3
69
JUN
E 2
5,
200
3
OIC
NO
.36
9 J
UN
E 2
5,
20
03
DIS
TR
ICT
OF
LA
NT
ZV
ILL
E
DIS TRIC T O F L AN TZVIL L EOI C N O .3 6 9 JUN E 25 , 20 0 3
DIS TRIC T O F L AN TZVIL L E
OI C N O .3 6 9 JUN E 25 , 20 0 3
DISTRICT OF LANTZVILLE
OIC NO.369 JUNE 25, 2003
DISTRICT OF LANTZVILLE
OIC NO.369 JUNE 25, 2003
DIS TRIC T O F L AN TZVIL L E
DIS
TR
ICT
OF
LA
NT
ZV
ILL
E
REM. 1
VIP
65
475
A
VIP7
585
9
VIP
75
846
A
REM . 3
33
29
19 20 23 24
CAPILANO RD
SI-EM HEIGHTSPL. R .R . 3147
R/W C .L.S.R .
343536
CLSR7435321 22
CLSR75107
CL
SR
75
10
632
31
30
39 4041 42CLSR77277
VI P7 660 0
A
1V
IP7
70
85
VIP77507
PAR
K
A
B
VIP77507
VIP 7796 6VIP77965 A
D.D.39244 2-I
REM. PCL. A
VIP76905
WE
LLIN
GT
ON
LA
ND
D
IST
RIC
T
NA
NO
OS
E
LA
ND
D
IST
RI C
T
WE
LLIN
GT
ON
LA
ND
D
IST
RIC
T
NA
NO
OS
E
LA
ND
D
I STR
ICT
SN AW -N AW- AS R D
TSU L-S IL-LU M R D
GE O R G E R D
MA
LL
AR
D W
AY
CA PILA N O RD
QI L-XE M IN ET RD
1
2
3
VIP78166
VIP78166
VIP78166
A
VIP
78
97
7
A
VIP78883
A
VIP
80
22
7
VIP79537 S RW
3
2
1
VI P8 00 37
VI P8 00 37
VI P8 00 37
VIP80037
1
VIP81161
1
VIP81344
A
B
VIP78672
REM . 1
1
2
VIS6177
RE
TU
RN
TO
CR
OW
N
PL
AN
22
54
9
M AN H AT TA N
2
1
PARK
VIP83227
VI P6 773 4
2
1
VI P6 773 4
A
VI P8 330 4
CROWN LAND
CROWN LAND
1
VIP65575
VIP 61733
REM. 2
CROWN LAND
1
1
PCL. 'A'
2
2
REMAINDER BLOCK 463
1
LOT 1
Part D.L.117R.10
148 13
166 15
3 12
1
1211
109
87
43
2
1
PK
56
PAR
K
CRO WN LAN D
Rem. Blk.C
4 A
Rem. Blk.C
13 3
5 2211
SOUTH 9 CHNS.
SEC.18 ,RGE.2
REM. OF SEC. 19 RGE 2
11REM.
WEST 4 0 ACRES
SOUTH 9 CHNS. OF
THE EAST 60 ACRES
REM. WEST 40 ACRES
7 98
10
11
243
11
1 1
11
N.2.6 45 CHNS. OF L.I
S.2.645 CHNS. OF L.I
PCL. A
3
4
1 2 3 4
1
1
2
B
1
2
A
A
1
3
4R.3
2
4
17
B
PT. OF PCL. 'B'
1
Pcl. 'B'
REM. OF THE
NORTHERLY
45 AC R ES
D.L. 3 5G
6 REM. 2
1
27
8 3
4
341 2
REM. 3
PT. OF D.L. 52
1
1
1
121091
17 16321
7
23
LOT A REM.
REM.2
1
LOT 1
REM.A
REM. 1
36
37R. 1
8 1 PART OF SEC.7 LYING
39NORTH OF THE E. & N. R./W.
417
243
4456
46 3
REM. 1 55
3
59
5 4 454
1
3
2
11
5
1
1
1
1
R E M.
REM. 1
'A'
6
R.1
A
4
PT.A
10
8
1
BK.4BK.3
7
R.1R.2 R.3 R.4 R.R.7R.6R.5R.4R.3R R.2
R.13P10 R.9 R.8
AA
BK.2
45
7 6 53
R.1
7 3 2
1412
A10861 2 4 Rem. A
R.1
6
R.1.R.5
Rem.
R'A
'
B C
A
S.L. 6 S.L. 5 S.L. 4 S.L. 3
S.L. 2S.L. 1
S.L. 7
S.L. 8
Rem. W 1/2
Of D.L. 91
2
32 41
R.1
R.1
Rema in der
11of E 1/2
of D.L . 91
R.A
2 3 4 5
A1
1AR.1 2 1
1
B
Rem. 2
R.1 1
2
33
Rem. 1
R.1
2
A
3
2
94 6 81 10 142 1711 15 16 222018 24 26 27
38 312939 33 3534 36 3846 45 43 45
46
37 64 63 6130 3629 59 58 57 56 54 50 4748
13141618 12 112027 928 21 6 4 3
BK.1
REM.3
A
SOUTH WEST PART
BLK. 389
18
19
456
41
1
REM.
1
A
BK.2
1
REM. D.L. 93
D.L. 163
REM. OF BLK.4 71
REM. OF BLK.4 71
SOUTH WEST PART
BLK. 389
C.P.
1
2
B
1
1 R.1
(Ar ea A)
(Ar ea B) REM. 5
A
B
A
B
FR.SEC.2 ,RGE. 2
FR.SEC.1 ,RGE. 2
RA NG E 1
A
R.2
2B
N.159 .62 EASTOF ROAD
REM. 2EAST OF 66' ROAD
REM.A
1 R.2
18
1920
22
23
31
32
2921
78
9
10
11
12
13
14
15
16
24
2526
27
28
PARK
33
1654
1716
14
19
2 1
PARK
18
612
52
4
3
2 A
B
35
1 4
R. PT. OF D.L.45
12
123
62202
273
1
12
5 45
A'A'
7
8 9
1014
11 15
2212
17
21
18
2
14
34 351211 36 137 2 1 3 51341 38 942
14 3943 40 1074 77 79158 44
69 68 1274 66 65 64 62 60267 16
4655 5
49 5324 52 49 77
48 46 44
4
3 2 3
A
1 2 A31 43 2 1B15 A B
PL.1A
2
21
1
PA
RT
OF
D
.L.5
4
PT
.A
A
'A'
4
17
N.2
57
'
3 6 11 23
4
2Pc
l.'A
'
1
12
1
1A
A
8 9 10
5
A
11 2 3
A2
4
B1 3
1 243
62 1 2 A
151115
4
PARK
1
2
76
74
A
78
10
9
80
98 39 34
112
119
12
0
83
85
87
89
90
2 921
95
94
18
4
18
7
LOT 199121 183
122
13
3
13
4
13
2
13
0
12
7
12
5
181123
177135
17917
5
17
4
193
16
0
16
5
16
3
16
7
15
9
15
7
196
15
314
4
14
9
198
1
REM.
REM.
REM. A
3 41 2A
R.1
21 12 23
314
5 215 4 P
AR
T O
F
LO
T C
PC
L.'
B'
PC
L.'
A'
PA
RT
OF
L
OT
B
LYIN
G N
. O
F R
OA
D
8 10
B
1
C1
1
1
D
B
E.2
CH
NS
. O
F A
1
R.3
4
A
1 29
37
4
6C.L.5
Cro wn L and
PARK
321
21
43
16
2 2515432
3
2
1
11 1012
131
A
A5
7 B
1
A2
2 F
13
3
9
REM.18
1
REM. OF D.L.45
A
2
14
15
2
1
1
20
L.1
REM.19
1
CROWN
REM.17
B8
C D
10 9 2 3 4 6518 B E20
F
1
PAR KRE M . 1
32PT.
5 6
8 9
PT.
4R
EM
.
6
A B
PCL.A
R.21
Pc
l.A
1 2 132
A4
Rem . 1
35
Re
m.
2
Am
L.5
RE
M.L
.3
Pc
l .A
of
2
45
1
1
8
1
2 3 4 5 6
13
11
215
1
16
9
A R.17
RE
M.L
.2
AC B
AB
1
1
2
12 1
3 R.1
1
2R.24321 1
REM.A
R.93
R.106
115
12124
3
21413 A B
1 115
A B165 7 8
BA
1917 185
TH
. P
T.1
PL
. 4
13
78
1
18
R.2R.51 B AR.6
21
A121
R.2
B A
1BA
1
1
2
REM. Pcl. B
20
R.2
6
A
15
16
17
18
A
543
21
12
13
15
14
R.A
R.9
10
1617
12
23 4
1
2
A
PARK
AB
1
A
B
CR
OW
N L
AN
D
S.W. PART
BLK 389
COMMONPR O PE RT Y
5
6
2
A
2 B
1
B
4
10
13
2
PT
. O
F L
OT
1
A
A
Co
mm
on
Pr
op
ert
y
Pt.
1
A
PA
RK
Rem. D.L . 161
C.L.
C.L.
A1
D.L
. 9
3
Am
1
4
A B
Am
.6
1
R.1 R.2
R.3
LO T B.
1
RE
M.C
10
2
3
4
A
R.1
A
R.4
PL. 2248
Rem. 5
1
A
1
3
9
A
A
1
RE M . B
LY IN G STH
OF
DIC K INS O N
RO A D
5
C.L.
3
REM. A
2
139
137
R. 2
29 30 31
28 27
37 18
20 19
54 59
43 40 3817
70 69 67PAR K
3
61
53
59
4
2
1
5
REM.5
1
1
1
1
CR O WN LA N D
C
21
2325
27
3234
46
810
12
42
58
50
48
46
A
A
1
A
2
1
Rem . Pc l . A
8
R.S.B.C.161 6
Pt. D
1
13 12
8
'A' OF 1 7
6
A
R.9R.11 R.10
8
10
12
1
12
4
STH.
PLO V E R RD .
1
3
1
2
3
2
PC
L.A
of
1
R. 1
RE M A IN D ER O F D L 31- A
1
3
7
C.P.
6
REM.
R. 1 R. 2
43
2
7
12
4
REMAINDER OF
E.1/2 OF D.L .66
E.1/2 OF D.L .66
1
A
1
2
3
1 2
30
C.P.
6
75 64
2
A
5150
49
46
44
42
1 2 3
9 7
1513
57
58
59
60
62
64
66
67
68
100
10
7
10
5
10
3
38 35
A
R.7
R.8
A
12
3
4
5
34
35
36
37
1
1 3 5
14
15
20
54
6
A
45
1
1 2 3432
'D'
A
2
33
2
R.2
BA
1A
5
4
REM.14
15
1
2
A1 5
AM
D.
4
1
2
A
B
13
2
1
1
3
3
2
A
REM. B
A
A BC
D
1 2
27
8
1
1
R.12
'A'O
F1
R1
8
6
23
'A'
'A'
14R.
R.6
S.1
10
'
'A'
PT.
7P
T.7
3
12
3A
14 6
16
B
2
1 2
1
2
AM
D.
2
W E1/21/2
PT.2
REM.
S.100'
9
10 30 32
58
28
27
29
5645
3 70 A
2
321
Am
.7
A
R.A
Rem.Pt.Pcl.DSouth ofH'way
RE
M.
D
R.1
14
10
48
54
64 65
5
A
66
21
26
67
8
80
4
11
17
21
22
19
24
26
28
30
69
75
111
96
A
16
8
176
155
3
BA
DC
C
D9
8
6
C
A
B
17
A
28
19
11
2
1
PT.1
2
5
3
A
15
0
PT. D.L. 26
7
101
A
B
4
PC
L.
A
A
1
A
H J L
1
7
8
A
PL
AN
36
08
7
PLAN 1 8711
VIP 66601
PL.187 11
VIP 66310
P.47432
PL. 41378
PL.48557
PLAN
PL.
43
915
PL. 57042 S.R .W.
PL. 678 1
PL.4
391
7
PL. 40 252
P.48558
PLAN 47433
31215
PL. 56 673
PL
. 4
86
66
S.R
.W.
PL. 474 17PL. 261 70
PLAN 3 1215
PLANPLAN 3 1215
31215
PL
. 76
3 R
/W
PL. 55 803
PL. 516 R/W
PLAN 31215
PL. 28117
PLAN
25008
PLAN 3225
D.D. 3934 03-I
PL
. 3
22
5
PLANPL.
D.D. 3880 90-I
D.D. 3559 7 -I
PL.322126528
PL. 404 0
3221
P L A N
PL
. 49
95
6
VIP 66044
VIP 66046
34985PLAN
37166P L A N
PL. 228 2
PL. 483 75
PLAN 3221
C.T. 49 304 - N
P.4
90
13
PLAN
2282
PL. 353 52
PL.
VIS 3586
PL. 137 99
D.D. 9186
P.2
64
47
PLAN
27223
27
22
3
PL . 52523
PLAN 6 1401
PL
AN
PLAN 6 1904
PL. 364 66
PLA N
26447
PLAN 64229
PLAN 63626
PLAN 64493 PLAN 63627
PLAN 63671
PL. 63739
PL. 64726
PLAN 64229
PL. 732 5
PL. 23 561
PLAN 6 3358
PLAN
63359
PLA N 6 3706
P.24659
PL. 13 123
PL
.30
05
PL
AN
18
89
8
Ea
se
m't
. P
L 5
35
23
PL.5122
P. P.46804
PL.25937PL.7960
D.D
.19
87
1-W
PL.7960
D.D
.A-
59
24
8
P P 64291
P.302-R.
PL.6756
D.D
.42
232
-W
D.D
.F-2
097
9
PL
.
119
22
PL
.
CT.381583
D.D.6
3467N
PL.3
6051PL.1533 6
PL.1909
PLAN 55418
VIP
65
91
3
VIS 4421
P.P
. 6
41
32
PL
AN
9
44
2
PL.
3352
VIP
60
60
3
PL
.50
12
PL
.50
12
D.D
.15
03
8-N
D.D
.25
09
3-N
D.D
.46
48
9-N
D.D
.46
49
0-N
PL.PLA N 6402 10796
PLAN
2878
PL
. 2
31
9
PL
. 3
71
9
P. 42884 Eas em t
P.P
. 6
43
93
PLA N9155
PL
. 8
02
4
PL. 9155
34980
PLA N
D.D. 11689
PL. 40 252
PL. 413 78
PL. 2 4270
PLA N
PLAN
24270
23508
PL. 23 508PL.
23508
8226
PLAN
PL. 413 78
VIP 66615
PL. 24270 PL.
23508
PLAN
24270
PL. 23508
PLAN
20737
PLAN
PLAN 2 1281 8514PLAN
21788
PL. 40250
PLAN 2490
PLAN 2490
PL.PLAN 16980
31
23
2
PLAN 21232PLAN8353
PL
.
6396PLAN
PL
.
6397
37
91
3
PL
AN
24
67
6
PL. 329 04
PLAN 2 1509
VIP 60603
PL. 283 59
VIS 3898
PL. 60 392
PLA N 6 4494
PLA N 6 4772
PL. 762 R.W .
PL. 516 R.W .
PLAN 27557
PLAN 27114
PL
AN
17
46
S.R .W. P L.57513
PL.806 R.W.
27395
PL.8193
VIP64773
VIP64774
PL. 188 10
PLAN 7 33-R.
VIP65052VI P6 570 2
P.4828
7
PL.52645
D.D. H -89284
PL.
211
5 R
.W.
PLAN
61294
VIP 65097
PL.27393
PL. 40 250
D.D
.19
10
8-N
PL
AN
51
6 R
.W.
PL
AN
1
91
3
R.W
.
7234
P L A
N
PL. 382 25
PLAN
33796
PL. 763 R/W
PL
.57
62
2 S
.R.W
.
PL
. 5
04
70
S.R
.W.
PL. 540 93
PL.3712 R/W
34
04
R/W
34
04
R/W
PL.
PL.
47024
PL
.57
62
5 S
R.W
.
PL
AN
5
16
RW
24178
PL
. 57
62
5 S
.R.W
.
P. 52371
D.D. H-57143
D.D. F- 5816
D.D.M-2 0207
PL
. 76
3 R
/W
D.D. K-15658
PL. 404 0
PL. 279 77
PL.2238 0
PL
. 1
38
4 R
.W.
PL
. 57
62
4 S
.R.W
.PL. 309 62
PL. 576 21 S.R.W.
PL
. 50
86
2
PL.
41124
22829
PL. 245 81
PL. 455 47
PLA N 6 0542
PLAN 6 0542
PLA N 6 0544
PLA N 1 4738
PL
AN
80
76
1238-R.
PLAN
12781
PLAN
62700
PL
AN
64
49
5
PL. 300 5PL. 482 59
PL. 466 06
PLAN
4679046235
PLAN 37425
PL. 12 781
P.48259
PL.4636 7
PL.
PL.20524
PLA N D.D
.15
69
2-N
18898
P.1
33
90
P.2
63
56
D.D
.38
84
-W
PL. 300 5
PLAN 9421
PL
.51
22
PL
. 1
00
4-R
.
P.24659PL. 858 7
PL
. 3
00
5
PL
. 1
27
09
PL
. 5
35
21
D.D.33712 8-I
D.D
. K
-10
05
29
P.38557(P.P. 989)
PL
. 4
74
38
P.
42
00
0
PL. 482 36
PL. 482 59PL. 524 75 PLAN
PL.5933 6PLAN
PL
.37
6-
R.
32411
PL. PLAN PL 6756
6757 PL. 67566756
P.3
84
87
PL.5046
PL
AN
36
63
3
PL.7718
D.D.H
44419
28
10
3
P.1
76
50
P.9
42
1
P.1
28
57
P.2
01
02
P. 54592
PL.44636
PLAN
7718
PL
.10
58
5
PLA N PL.PL. 796015960
1 8 4 3 4
P.1
92
86
P.25280
44
01
PL.1509 1
PL
.15
12
9
P.2913 10
35
1
P.1
19
00
PL.1407 0P.4401
PL.11922
PL.
5104
PL.2675
8
PLA N 9 671
PL. 209 67
PLAN 1 2675
(P.P.40991)
PLAN29424
PL
.
D.D
.19
54
5-N
P.6
37
-R.
P.13835
PL
.3
10
67
38250
PL
.31
79
0
P.2
71
97
P.26791P.23758
PL.13980
6625 PLAN 2 733
26
02
0
PL.2239 6PL
AN
7
62
2
PL
AN
PL.2739 5PL
AN
21
47
4
PL. 24258PL.2072 5
D.D
.67
08
6-N
PL
.85
29
PL
.49
29
PL
.13
32
-R.
P.1
23
69
PL.1434 0
P.4
33
88
3447
D.D
.11
40
-W
PL
.19
15
7
27097
P.2
25
48
Re
m.
P.1
20
5-R
PL
.75
86
PL.19105
24987PL.
PL.PL.371922717
367 R /W
PL.P.27371
PL. 352 9
P.3160 R .W
PL
.2
73
93
PL
.40
99
PL
. 1
15
91
P.1
07
21
PL
.53
98
2
D.D
49
29
1-N
PL
. 1
87
42
P.5
03
09
PLAN 2701 O.S.
1868STRATA PLAN
P.2537R.WPL.11539 D.D. 3530 5-I
P2
53
73
PL. 42 628 PL. 132 15 D.D.35305 -I
PL. 402 52PL. 441 36
PL
.
22
54
9
P.42681PL. 298 42
PL. 469 70
D.D. L -1134 8 PL. 521 98
PLAND.D
. E
E 2
87
62
PL . 762 R.W .PL. 282 1 R.W .
PL. 298 42PL. 419 81
PL. 508 93PL. 516
PL
AN
25
99
3
PL
. 4
44
17
PL. 582 15
D.D.
5454-N
PL
.16
02
2
PL
.36
58
0
PL . 493 84
P.13216
52
43
6P
L
PL. 413 79
PL. 4
80 R
/W
PL. 40 456
PL. 235 08
PL.25811PL.
PL. 226 1939701
PL. 271 39PL. 417 97
PL.45484
P.50667
P.5
06
68
E'm
't
P.50756
PL. 271 39
62664
PLA N
PLAN61472
22
89
9
PL
.
23
06
9
PL
.
PL
.85
92
PL
. 4
05
66
PLAN 4 3774
PL
. 4
79
68
PL
. 5
32
65
P.33555
P.3
35
55
P.4068
STR. P. 389 8
PL. 626 61
PLAN
24258
PLAN
27
39
5
PL. 312 10 PL.3381 5
P.2
07
25
P.2
73
95
PL
AN
P.1
90
93
PL.2406 7
PL.2160 4
PL.
15245
PL. 275 57
PL. 275 57
PLAN 27557
PL. 502 79 S.R .W .
PL. 275 57
PL. 32775
43434PLAN
PLAN 39219
PL. 3 2775
PL.762 R.W .
PL.763 R.W .PLAN 38734
PL
. 4
37
77
PL. 434 34
PLAN 55145
P. 4
47
33
PLAN 6
0308
PL.
24258
24258
P.2
42
58
D.D.A
15621
PLA N
P.2
75
57
PL
.27
55
7
PL.8752
24
25
8P
L.
22549
PLAN 6 3508
PLAN
24687
PLAN 6 3509
PLAN 6 4496
PL. 10 796
PL.
59333
PL
. 2
31
9
(REF. PL 55468)
REM. PL. 2139 - R
P.L
. 50
86
2 S
.R.W
.
PL
.57
62
1 S
.R.W
.
PL 2701 O.S.
P.5204
2SRW
P.5
788
2
P.1
91
05
ST
RA
TA
PL
AN
43
6
PL
.13
22
1
P.13221PL. 516 3
P.19861
PL.7779
3333
P.4
86
52
VIP
65
052
P.50155
PL
VIP
64
26
4
27
19
34451
PL. 462 47PL. 63657
PLAN 63648
64122
PLAN
PLAN 31447
VIP65800
PLA
N 6
05
45
P.49792
P.4
97
86
PL.7948VIP65448
PL 476 56
PL.5420 9
PL. 462 36
56855
VIS4291
VIP
65
295
VIP
65
296
VIP
65
297
P.3
85
56
PL. 254 07
PL
. 7
71
8
PLAN 3 211 2
PL. 730 1
PL.2770
P.28
38 R
.W.
P.44
969
PL. 41483P.44970
PL. 327 75
S.R.W. K101545
PL. 51 6 R.W .
PL. 762 R .W.
PL. 437 78
P.
43
77
9
P.4
47
34
PLAN
24258
PL.
27395 S-101703D.D.
PL.
1207
-R
PL.
PL. 265 28
PL. 57625
P 50431
3225
VIP 63004
PL. 165 81
VIP
66
41
5
PL. 332 06
P. 18999
PL.
PL 48756
PL.4166 7
52706
PL.5141 8
PL
.
44
63
7
22702 PL.25260
PL
.
PL. 48922
VIP66248
PLA N 5 9344
PLAN 20070
VIP
66
864
VIP68209
VIP
66
816
VI P6 682 8
VIP66828
PLAN 2282
VIP 68032
VIP66834
VIP68299 R
W
VIP68298 RW
VIP68208 RW
PP VI P66 646
PL
.14
30
1
P.29352
PL
.14
30
1
PL
.56
67
0
P.1
40
70
P.46243
C.L.S .R . PL. 50304
PL. 454 51
2701 O.S.PLAN
PL.2106 1
PL.
42435
P.54558
P. 15129
D.D
.J6
35
50
P.
29
94
2
P.2573
PP
VIP
64
702
P.2
14
74
P.2
48
02
P.2
82
60
D.D
.52
61
3-W
PL
. 1
13
21
P.21172
VIP62662 S
RW
VIP64358
VI P6 682 8
VIP
66
08
1
PL. 413 78
PLA N26532
PL.1380 7
PL
.63
9-
R
PL
.39
18
PL
.
2
59
93
PL. 40757
VIP 6585 1 S RW
VIP
65
298
PL.5141 8
44451
13
86
7
13
86
7
PL
AN
VIP6030
8
PLAN
PL. 466 07
46606PL. 486 95
PLAN 7330
PL.2744 9
PL. 7118
PLAN 28792
DD. G9 021 8
VI P6 982 7
VIP
69
90
6
VIP6904 7
VIP60546 S
RW
VIP
60
543
SR
W
VIP60547 SRW
VIP60547 SRW
VIP60547 SRW
P.25290
D.D.EH91 753
27557PLAN
PL.57621 S .R .W.
PL.
32628
PL
.
PL.5080
4
13867
P.20883
P.25766
PL.
28183
53763
PL. 23628
PL.1645 2
PL
.80
7-
R.
PL
.45
5-
R.
PL
.70
1-
R.
59
23
7P
L.
PL.
19510
PL.
3771
PL
.18
72
5P
L.
58
74
8P.
54
89
8P.
51
52
6 PLAN 7
PL.
1909
P.1
08
1-R
.
P.1909
S.9
0'D
.D.
C-
47
77
57321
VIP68545
VIP64750
PLAN
31546
P. 11317
D.D
.B-
89
46
7
P.489-R
VIP
70
20
1
PL. 45180
VIP70248
P.23139
PL
.48
39
3
PLA N 3 6633
PL
.93
8-
R.
PL
.71
92
PL.1861 7
PL. 675 6 BK.1
P.11 922
PL
. 1
81
29
P.1
85
00
PL.
4835PLAN
P.2
33
58
P.1
87
25
21
36
7
24067
3447
D.D
.30
10
4-N
P.3
94
82
PL.4672
D.D
. 3
53
05
-I
PL. 366 48
Pt.lPL.8010
PL. 228 99
PL.
P.50641
P.
43
77
5
P.43435
15245
PL. 48 236
PLAN
P.25856
P.23493
P.1
92
85
P.22829
PL. 60543
646 52
PL .
PLAN 6 0310
PL
. 4
85
37
PL
. 2
59
93
P.3221
PLAN
P.10147
P.17795
PL. 43 435
PLAN
D.D. 11329
PL.
VIP
71
58
3
PL . 40950
PL. 53 763
PL. 525 22
DD
37
57
79
-I
VIP
72
31
6
PL .2271 7
VIP72900
VIP
72
83
4
VIP 7082 1
VIP7082 1
VIP
70
82
1
VIP
73
53
7
PP V IP71095
VIP 7392 4
VIP74536
RO
AD
WE IG LE S R O AD
OLD
LOG
GI NG
RO
AD
RUM MING RD.SKYVIEW RD.
RUM MING
AN DR E S R D .
BELL RD
.
A N DR E S R D .
DOU
MO
NT
RO
AD
DOU
MO
NT
DO
UM
ON
T R
OA
D
WAY
SY WAS H R IDG E R OA D
CRES.
RO A D
IND U ST RIA L
RO A D
HARWOOD
AN DR E A
FERNMAR ROAD
CLARK CRESCENT
ELIZA B ETH
TU RN
BLA CK J AC K
LISA LAN E
GAYLYN PLACE
PARK
DRIV
ENO R TH WIN D DRIVE
RO A D
SOUTHWIND DRIVE
WE
ST
WIN
D
DR
IVE
EA
ST
WIN
D
DR
IVE
SU
PE
RIO
R
ST
ON
E R
D.
BA
YV
IEW
LORENZENLAN E
NO
RM
AR
EL
DR
IVE
BL
OW
HO
RN
DR
.(P
RIV
AT
E)
(PR IVAT E)JO H N STO N LAN E
RO
AD
EB
Y R
OA
D
BE
NW
AL
DU
N
RO
AD
RO A D
RO A D
LAN TZV ILLE
DIC K INS O NRO A D
PE
TE
RS
ON
RO
AD
CA ILLE T R OA D
NO
RT
HR
D.
OWEN
LANTZV
ILLE R
OAD
JACK'SHA RB Y RO A D EA ST
JING
LE
POT
RD
.
CR ES .
GIL
LF
ILL
AN
RD
.
RD .
BIGG S
JE N KIN S RO A D
DR IV E
RD
.
LANE
LO RE N ZEN
BEL
IVEA
U P
.
RO A D
LO GG IN G
OL D
OL
D
LO
GG
ING
RO
AD
RO
AD
OL
D
LO
GG
IN
G R
OA
D
ROA
D
RU
M MIN
G
D.D
.20
70
3N 21369
PL.
ROAD
RO
AD
EYELASH DRIVE
HIG H ET PLA C E
JERSEY RD.
DR .
VA
LM
AR
RD
.
MA
RT
R
D.
ME
TR
O
RD
.
PL
.
ROAD
RO
AD
HA SE PLA C E
ELM R O A D
RO
MA
C R
D.
HO B SO N ' S R O AD
RD .
N.1
28
' JA
CK
'S
LE
LA
ND
DR .MRUS
RO
AD
SH
AN
GR
I-L
A
SU
NB
UR
Y R
D.
TW
EE
DH
OP
E R
D.
AAT S
TER R .
LA
VE
ND
ER
RD
.
RO
AD
LY N N D R .
NE
GR
IN
M ILLAR D D R IVE
HU
DD
LE
ST
ON
E
RD
.
WIL
SO
N R
D.
M c KE RC H ER R D .
RO
AD
RO
AD
STR A IT R D.OA
R R
OA
D
MY
RO
N
DIC K INS O N R D.
JENNA DR.
RO A D
SA
XO
N C
RO
SS
R
D.
ROA
D
RO
AD
LAN C RE ST
RO A D
ALISO N RD
RO A D
RO A D
ROYAL DR.
LA
NT
ZV
ILL
E S
CH
. R
D.
ST
RO
NG
E
RO
AD
AIN
SW
OR
TH
JOY
WA
Y
S LO G A R D R IVE
CH ATA WAY PL.
TREMBLAY
HA RL EY
TUCK
RD.
CA
M
PB EL L RD .
PLAN
6
LAND
MAR
K
AN DR E S RO A D
RO
AD
AL
GE
R
RO
AD
CLAR
K DR
IVE
WA
RE
RO
A D
MA
NL
Y R
OA
D
M c GI LL
BAY VIE W R D .
DA
WN
RD
.
SA BR E RD .
STEVEN S PL.
WA
RIC
K R
D.
GE
ISL
ER
P
L.
THICKE RD.
LE
LA
ND
MAIRI RD.
RO
AD
LA
NC
EW
OO
D A
V.
SU
PE
RIO
R
R
OA
D
ROAD
LAN TZV ILLE
VA
ND
EN
HO
EK
RD
.
M ILN E R R D .
VIPOND ROAD
CL AR K D R. WE S T
ROAD
CR ES C EN T
WA
YN
E P
L.
ROA
D
NE
ST
OR
W
AY
O WE N R D .
RO S ALY N
RD .
PH
ILIP
R
OA
D
FOREST
WAY
AU
LD
S R
OA
D
RO
AD
DA
VID
PL
.
EL
M.
RD
.
PH
AN
TO
MR
OA
D
P HAN
T OM
ROA
D
SUNB
URY R
D.
SA
BR
INA
PL
.
CAL RD.
RO
AD
HA
RP
ER
R
D.
WIN
SL
OW
RD
.
PE
TE
RS
ON
DR
HA
LL
RD
.
AULDS
FAW N D R .
RD .
HA
RW
OO
D
DR
.
SEA
SI D
E T
ER
R.
AR BU TU S CR E S.
YE W C U L - D E - SA C
VEN TU RE R D
LU CAS LA NE
PA
RK
LA
ND
S P
L
BL
IGH
RD
WE IGLES RD
BIGGS RD
BI G
GS
PI T
RO
AD
HA R BY R O A D WE S T
DR IV E
WAR
E
RO
AD
RO N AL D R O AD
PE TR U S PL.
SE
BA
ST
ION
RD
.
ELL ES M E R E D R .
RO S SIT ER AV EN U E
DU
NS
MU
IR
L
AN
D
D
IST
RIC
T
NANOOSE LAND DISTRICT
DUNSMUIR LAND DISTRICT
NANOOSE LAND DISTRICT
DUNSMUIR LAND DISTRICTMOUNTAIN LAND DISTRICT
WELL ING TON L AND DI STR ICTWELL ING TON L AND DI STR ICT
MOUNTAIN LAND DISTRICT
MO
UN
TA
IN L
AN
D D
I STR
ICT
DU
NS
MU
I R L
AN
D D
IST
RI C
T
BLK. 565
BLK. 565
BLK. 226
D.L.186
BLK. 681
BLK.
681 BLK.
408
BLK. 408
BLK. 851
BLK. 851
BLK. 553
BLK. 203
BLK. 851
BLK.203
RANGE 2
RANGE 3
D.L. 53 D.L.27G
D.L. 54G.
D.L. 66
D.L.91D.L. 53
D.L.37
D.L.93D.L. 85
D.L. 31-A D.L. 45
D.L. 161
D.L. 26
BLK.
BLK. 183577
BLK. 389D.L.46BLK.183
BLK.471
BLK. 794
BLK. 577
BLK. 794
BLK.471
BLK. 206
BLK.206
D.L.179BLK.505 D.L.21BLK. 163 D.L. 57
BLK. 505
SEC. 19
SEC. 20
D.L.163
BLK. 206
D.L.44
SEC. 20
SEC. 19
BLK.389
D.L. 35G
S.1-2
RGE. 2
D.L. 34G
D.L
.54
G
SEC.6
D.L.27G
D.L.105 SEC. 7
D.L. 3 7
D.L.92
D.L.92
D.L. 161
BLK. 505
SEC. 20
BLK. 577
D.L. 52
D.L. 52
BLK.389
REMAINDER OF
F
ROUND
LAKE
CO P LEY B RO O K
M ETR A L
CREEK
K N A
R S
T O
N
G R
E E
K
CR EE K
HE IKK ILA
B R A N N E N
M ILLST O NE
RIV ER
L A K E
CREE
K
CA ILLE T
CR EE K
HOS
KIN
S
CR EE K
BLOO
DS
S T R A I T O F G E O R G I A
NANOOSE HARBOUR
BL
OO
DS
CR
.
NA
NA
IMO
CIT
Y
B
OU
ND
AR
Y
CIT
Y O
F N
AN
AIM
O
CITY OF NANAIMO
E. & N. RAILWAY
E.& N. RA ILWAY
E.& N. R A ILWAY
R.W .
E.& N.
E.& N. R/W
ISLA ND H IG H WAY
ISLA ND
HIG H WA Y
ISLA ND H IG H WAY
ISLA ND HIG H WA Y
ISLA ND HIG H WA Y
IS LAN D H IGHW AY
B.C
. HY
DR
O R
IGH
T O
F W
AY
B.C
. HY
DR
O
RIG
HT
OF
W
AY
Eas em ent
Ea se m't
S.R.W.
B.C . H YD R O RIG H T O F WAY
B.C . H YD R O
RIG H T O F WAY
GAS PIPEL INE R .W.
S. R.W PL. 57 51 3
Ea se me nt
S. R.W
. P. 529
51
Ea
se
m't
EA SE M EN T
51
6 R
/W
PL
.50
86
2 S
R.W
.
S. R
. W.
Eas
m'n
t
EA
SE
ME
NT
Ease
m't
R W
Eas ement
S.R.W.
S.R.W.
2-2
0 E
AS
EM
EN
T
S.R.W.
B.C. H
YD
RO
RI G
HT O
F W
AY
S.R .W.
B.C . H Y D RO RI G HT O F W AY
EA
SE
ME
NT
3
1
ARBUTUS
GROVE
PROV.PARK
ARBUTUS
GROVE
PROV. PARK
Eas
em
en
t
RICHARD POINT
RANCH PO INT
BLK. B
BLK.B LOT 327
LO T 309
NA NA IM O D IS TR ICT
NA N AI M O
DIS TR IC T
LOT 242
LOT 1
96
LOT 56-G
LOT 192
NANAIMO DISTRICT
NANA
IMO
DIS
TRIC
T
NANAIMO DISTRICTNANAIMO DISRICT
LOT
194
NORTH BDY. BL K 6 81
RESERVE
NANOOSE
NANOOSE INDIAN RESERVE
RESERVE
RESERVENANOOSE INDIAN
INDIAN RESERVE
6
(S.R .W. )
BREAKWATER
FLEET PT.
R.A.
KNAR
STO
N
CREE
K
HWAY R /W
HW AY R /WBLK. 1512
NW85'
BLUNDEN POINT
LOT 110 NANAI MO DISTRICT
B.C
. T
EL
EP
HO
NE
C
O.
RIG
HT
O
F
WA
Y
WE
LLIN
GT
ON
LA
ND
DI S
TRIC
T
NA
NO
OS
E L
AN
D D
IST
RI C
T
NANAIMO DISTRICT
GLOT 31
WIL
ES
C.T. B87660 PL.
R.I.
R.I.
C.P.
HE IKK ILA CR E EK
8
51
6 R
/W
VIP74748 SRW
DIS TRIC T O F L AN TZVIL L E OIC NO.369 JUNE 25, 2003
DIS TRIC T O F L AN TZVIL L E OIC NO.369 JUNE 25, 2003
DIS
TR
ICT
OF
LA
NT
ZV
ILL
EO
IC N
O.3
69
JUN
E 2
5,
200
3
DIS
TR
ICT
OF
LA
NT
ZV
ILL
EO
IC N
O.3
69
JUN
E 2
5,
200
3
DIS
TR
ICT
OF
LA
NT
ZV
ILL
EO
IC N
O.3
69
JUN
E 2
5,
200
3
OIC
NO
.36
9 J
UN
E 2
5,
20
03
DIS
TR
ICT
OF
LA
NT
ZV
ILL
E
DIS TRIC T O F L AN TZVIL L EOI C N O .3 6 9 JUN E 25 , 20 0 3
DIS TRIC T O F L AN TZVIL L E
OI C N O .3 6 9 JUN E 25 , 20 0 3
DISTRICT OF LANTZVILLE
OIC NO.369 JUNE 25, 2003
DISTRICT OF LANTZVILLE
OIC NO.369 JUNE 25, 2003
DIS TRIC T O F L AN TZVIL L E
DIS
TR
ICT
OF
LA
NT
ZV
ILL
E
REM. 1
VIP
65
475
A
VIP7
585
9
VIP
75
846
A
REM . 3
33
29
19 20 23 24
CAPILANO RD
SI-EM HEIGHTSPL. R .R . 3147
R/W C .L.S.R .
343536
CLSR7435321 22
CLSR75107
CL
SR
75
10
632
31
30
39 4041 42CLSR77277
VI P7 660 0
A
1V
IP7
70
85
VIP77507
PAR
K
A
B
VIP77507
VIP 7796 6VIP77965 A
D.D.39244 2-I
REM. PCL. A
VIP76905
WE
LLIN
GT
ON
LA
ND
D
IST
RIC
T
NA
NO
OS
E
LA
ND
D
IST
RI C
T
WE
LLIN
GT
ON
LA
ND
D
IST
RIC
T
NA
NO
OS
E
LA
ND
D
I STR
ICT
SN AW -N AW- AS R D
TSU L-S IL-LU M R D
GE O R G E R D
MA
LL
AR
D W
AY
CA PILA N O RD
QI L-XE M IN ET RD
1
2
3
VIP78166
VIP78166
VIP78166
A
VIP
78
97
7
A
VIP78883
A
VIP
80
22
7
VIP79537 S RW
3
2
1
VI P8 00 37
VI P8 00 37
VI P8 00 37
VIP80037
1
VIP81161
1
VIP81344
A
B
VIP78672
REM . 1
1
2
VIS6177
RE
TU
RN
TO
CR
OW
N
PL
AN
22
54
9
M AN H AT TA N
2
1
PARK
VIP83227
VI P6 773 4
2
1
VI P6 773 4
A
VI P8 330 4
CROWN LAND
CROWN LAND
1
VIP65575
VIP 61733
REM. 2
CROWN LAND
KE
STR
EL
CR
ES
K E S T R E L C R E S
A M S TE R DA M C RE S
AM S
TE RD AM
C RE S
P E R E GR I N E R D
M ETR
AL D
R
WA T E R B U R Y R D
BO B A N D R
C OL IN WO OD D R
R ED W
I NG
C R ES
CH
RIS
T INA
CRE
S
P LEA SA
N T RI DG
E PL
NAB
O R ST
G ILF
I LLAN
RD
MA
RY
E LL E
N D
R
EL LE N P L
A L B AT R OS S WA Y
C A L I N D A S T
CA
L IND
A S
T
SEDON A
P L
S E D ON A P L
PI N EWOOD LN
RH
OD
O W
AY
RH
OD
O W
AY
M I L DM
AY
RD
MIL
DM
AY
RD
GO
DF
RE
Y R
D
GO
DF
RE Y
RD
WA
RB
UR
N D
R
C O R F U D R
CO
RFU
DR
G A RS ID E
RD
MIM
OS
A D
R
SC
HO
OK
RD
SC
HO
OK
RD
MA
GN
OL
IA D
R
M A GN OL I A D R
CA
STLE
ROC
K D
R
SEN
TIN
AL D
R
S
ENT IN A L D R
SA
TU R
NA
AVE
MA
URE
EN
WA
Y
MA U R EE N W AY
KIA
RA
PL
ME
TRA
L D
R
MET
RA
L D
R
JI N G LE P O T R
D
R E D O N D A PL
S OU T H A M P TON R D
PO R TS M OU T H R D
V AL L E Y V I E W D R
QU AR R Y C
R E S
R AV E N R D
PI NE
RI DG
E C
RE
S
BR
AN
NEN L AK E R D
GR E EN
LA KE
CRE
S
LA N E
ME D D R D
N OY E R D
E MP O R E R R D
BI G B
EAR
RI DG
E
MA
PL
EW
OO
D D
R
HO
NE
Y L
OC
US
T D
R
LA
K E V
IE W C
RE
SD OV E R R D
FARB E
R WA Y
HI LLS I DE TE R R
GO LD E N E A GL E WA Y
MA
RL
IN W
AY
MA LP A S S R D
RI C H RD
LA K
E
H E IGH T S P L
P E L I C AN W AY
E N T E R P R I S E S T
K IN GF IS H E R P L
N E W D A LE P L
S E A L I ON P L
B E L LE V I E W P L
A V R O WA Y
D EN N
IE LN
C E D A R G R OV E D R
W E D GE W OO D P L
D O R E E N PL
TAU
NTO
N
PL
S A V A R Y S T
J E N K I N S R D
C A R OL P L
L A K E P L
M ER LI N S T
DIN
ES
PL
N A T H A N R D
S HER
BOU
RNE
P L
DE
NV
ER
WA
Y
R H E A N N A P L
B I GGS R D
A U LD S R D
TA L U S WO OD P L
TH O R N W OOD P L
C A MB R I D GE P L
PA CH E NA PL
TU L
IP PL
EL
DO
RA
DO
PL
D U N B A R R DE V E R E S T D R
S A V A N N A H PL
GR OV E L A N D D R
P T A R MI GA N W AY
ZA
NT
E P
L
N I D R I P L
S C A R S D A LE R D
G E R K E P L
P I N E PA R K P L
BUR NH
A M CR
E S
K I ON I PL
DE
ER
WO
OD
BL
VD
VA Q U ER O PL
RUX
T ON
RD
D OU M ON T R D
FERNA
N DEZ
PL
GREE
N A
CR E
S W
A Y
S PA R T A N R D
CA
PR
ICE
LN
SE
AB
OL
D R
D
I S LE V I EW P L
W E S T V I E W PL
T H U R L O W P L
K I N G A R T H U R D R
E X C A LI B U R S T
AP
PLE
CR
OS
S R
D
MY
ER
S R
D
BLU
EB
AC
K R
D
D IC KIN
SON
RD
RE DON DA PL
C H E Y E N N E P L
MT
. VIE
W R
D
LA
SAL
LE
RD
M C R OB B A V E
D U N S T E R R D
LE
WIS
RD
PL
EA
SA
NT
VA
LLE
Y W
AY
DE N
VER
WAY
VIP77640
VI P 77 39 1
VI P 77 15 9
VIS5544
VIP78452
VIP76733
VIP
7677
3
VI P 76 51 0
VIP76367
VIP76367
VIP
7609
5VI P 76 21 0
VI P 76 21 0
VIP76095
VIP75893
33929
VIP75893
395 52
356
51
33929
33929
VIP
56
411
VIP56826
3392933929
33929
33929
33929
33929
VIS
2640
Ph 2
VIP55848
VI P 52 54 7
Ph 3
VIP55588
VIP56411
VIP56411
VIP56411
VIP56794
VI S48
95
VI S48
69
VIS48
09
VI S47
91
VIP
55
588
VIP
55
588
VIP59105
VIP
56
692
452
50
VIP56794
VIP56794
SP 1 773
VI S 24 55
Ph 1
VIP60953
VI P 52 54 7
VIP52547
VIP52547
VIP59002
VIS5833
VIP60180
VIS3995
43761
361 05
297
06
VIS3536
37838
VIP55187
VIP55829
42656
46593
27659
VIP58168
VIP
52
037
VIP51800
25547
27660
12124
VIP53276
VI P 55 58 8
VIP61502
27922
30739
41275
179
2(D
D5
401
-W)
297
94
268
57
1957134129
297
94
VIP75051
VIP57612
VIP57431
VIP74649
VIP75172
435
89
490
59
VIS
2189
507
18
VIP
75
159
VI P 70 27 4VI P 66 43 9
VIS4541
474 22
40265
VIP
61
329
VI S 38 74
VI P74
646
268
57
47477
VI P 64 99 1
268
57
294
23
33092
VIP57431
429 03
VIP66439
34129
294
23
34135
37425
1792
VIP57431
VIP57431
VIS1983
VI P 73 02 2
26689
466
15
379
85
28889
16647VI P 60 24 3
VIP60318
7151
VIP75289VIP75288
VIP73832
VIP71644
VI P60
134
VIP
63
640
VIP63639
12781
VIP61489
VIP
61
677
VIP63509
VIP
70
172
268
57
VIP
57
434
37857
VIP72820
48496
14865
26689
VIP74649
VIP74649
VIP74649
VIP74649
VIP57612
VIP57612
VIP57612
VI P 62 29 1
VIP79506
PP VIP76206
PP V
IP76
205
PP V
IP78
168
PP 3622
PP 86 4
PP 35 29
PP 41145
PP V IP 51 76 8
PP 33 28
VI P 77 64 1
13
12 11 10 9 8
7
654321
VIP77551
VIP77492
VIP
7749
3
VIP77395
13 12 11 109 8
7
654321
VI P 77 39 3
VIP
7739
2
6 54 3
2 1
VIP
7702
4
VI P77
024
VIP
7673
4
VI P 76 73 4
21
2019 18 17 16 15 14
13
12
11
10
9
87654321
10
VIP
7677
5
VI P 76 77 4
16 15
141312
11
9
8
7
65
4
3
2
1
VIP76550
10 9 8 7 6
54321
29 28 27 25 24 23 22 20
191817161514
13 12 11 10 9 8
7654321
VIP
7636
8
VIP
7636
8
VIP76368VIP76368
VIP
7609
6
17 16 15
14
13
12111098
7
6
5 4 3 2 1
PP VIP76206
PP V
IP76
205
VIP
7617
2
VIP
7611
1
VIP
7609
6
VIP
7609
6
VIP
7609
6
19181716151413
12 11 10 98 7
654321
22
5
4321
VI P75
894
VIP75896
VIP
7589
5
64
1 2 3A
165 1VI P 55 58 9
14 A
D E F G HA B C
163
12
24
61
29 28
4342
47
Park74
VI P 57 39 2
340
35
17
18
35 32
21
57
39
141
140
149
150
159
158
138
68
69 71
131
130
133
41- 44
75
9192
105 106
8887
122
109110
5 68
VI P 54 34 2 VIP
5434
1
VIP
5739
3
481 74
VIP
5362
3
VIP
6095
4
34034
48174
48
47
46
45444342
80
81
116
98
99
117
113
102
95
78
84
1 31214
126
128
1
-32
BLK 2 BLK
1
5- 8 1- 4
A13- 16
1- 4
29- 32
21- 24
37- 40
2
16 17 10
VI P 55 85 4
1817
65
8
1012
14
16
24
26
28 29
22
20 19
41
1719
21
23
29
31
33
30
32
56
54
63
53 51
66
27 2656
VI P 56 92 4
VI P 56 89 8
10 86
11 1315
35
39
43
45
47
49
Par
k
57 59 61
59 57 55
51 53
37
VIP60
678
VI P 62 54 8
VI P 62 67 9
VIP
5585
3 1
9-12
Lots
34
36
38
40
42
52
50
48
46
43
E 1
49
47
45
43
16
18
26
28
38 41
42
7068
1
23 4 5
6 7CP
8 9 10 11
12 13 1421
22
20
VI P 57 21 5
97
53
1
10 12 14
20
22
24
32
3436
6461
60
28 26
14 16 18
3032
12
30
66
24
144
136
146
153
162
155
135
Lot s 3 3- 64
9- 12
5- 8
25- 28
17- 20
45- 48
33- 35
15
28
3353
5165
55
30
89
88
86
8784 85
82
83
80
78
7981
76
77
68
69
70
71
72
73
74
75
67
66
65
545556
53
52
51
50
49
3839
3736 1618
20
22
24
31
61
59
13
4
2663
57
VIP72760
2
VIP
6018
1
VI P 67 17 2
VIP
6018
2
Rem C
1
1
1
VI P 71 66 3
437
62
VIP
6229
2
507
08
63
62
61
60
59
58 57
41
34
26272829
333230 31
24
25
22 23
21
20
19
18
Rem B
63
64
3 A B
B
D
A
6
VI P 59 95 0
VIP
5583
0
50708
56
68
1
1 2A
C
58 60
66
Lts 1-
45
AB B
4
B
54
A
A
VI P53
511
VI P 53 36 4VI P 58 16 5
1
1
2
3
45
VIP74
855
VIP
5689
7
38058
VI P51
8017 8
A
B
C
B
VI P 54 07 6
VI P 51 80 2
64
40
35
Rem E. 1/2 Sec . 12
VIP5
992
1
VI P53
277
VI P57
955
Rem 1
1
J1172
45
33807
PP V
IP7
517
9
PP 40936
VI P 56 82 7
Rem A
A
Rem 1
VI P 75 05 3
32132
Pt.
Re
mP
cl .
A o
f 3
1
395 66391 96391 96
VI P 57 61 5
393 10
1 3 42
Par
k3
A
VI P 74 65 1
391 96
Return to Crown
2
579
3
B
391 96
341 30
13
Par
k
A
A
46
VIP57432
12345VIP75173
VI P 75 05 2
VI P 75 05 2
VI P 75 05 2
222324
18 17 16
212019
11 10
151413
987
6 5 4
VIP
7465
0
22
17 16
2120
11 10
1514
98
5 4
VIP
7435
2
687 6 5
22
6
3130
26
23
1918
1514
1110
7
VI P 74 77 7
24
18
19
12
13
7
6
VI P 57 61 3
VI P 57 61 4
VI P57 614
VI P 57 61 3
VI P 59 98 7
VI P62
415
5 8
9 12
13 16
17 20
21 24
25 28
18
19
34
35
57
56
16
2123
31
3739
53
59
29 32
67
Ph. 2
73
Ph. 12
3 45
75 23VIP58692
1211109
A 1
A
212
343638
68 10
40
4
7
12
11
104
3
2
1
VI P60
851
EasementVIP59206
B
A
PHAS
E 1
SL1-2
8
1 2
8
43
2123
Bl k. B
Rem
A
10
Ph. 311
12
Lot s 4 4- 8 6
9
8
9
VIP74647
34151
341 51
VI P 59 98 7
VI P 5 99 87
VI P 59 98 8
VI P 57 43 3
4290 4
1
5
7
1
A
12
1110
2729
414345
47A 51
26
B
2
4
12
10
3
9
AA
67
7168
66
1
R.65
1112
34130
341 30
A
8
9
1
13
15
16
1
17
10
13
C
D
Bl k. ALot s 1 - 43
Ph. 417
1819
1415
16
Rem 2
Rem 7
69 20
VI P 59 98 7
14
13
61
VI P74
855
VIP74576
502
75
50
A
1 1
2 1
4852
72
45 46A
A
Rem
74
VIP
7516
0
VI P74
575
VIP74576
VIP
5999
2
A
B
375 35
44
VI P 62 35 1
Pt. o f R em 5VIP60647
76
VI P71
646
1
VIP
7485
5
VI P 71 93 9
VIP74565
Co vn .A r e as
VIP59207
VIP
7026
6
VIP
7164
6
375 35
VIP
7164
5
2
VIP59087
VIP
7108
5
VIP
7108
4
A
Rem A
111 6R W
VI P74
855
VIP74575
VIP59205
PP VIP75180
417 57
VI P56
416
VIP51
803
VI P 70 42 3
VI P 70 42 2
PP V
IP78
168
36
CP
Co vn .A r e as
VIP59207
2 21
21
1
2
PP 3622
PP 86 4
PP 35 29
PP 41145
PP V IP 51 76 8
VI P 52 35 7
VIP
7150
0
VI P 52 37 0
2
5
7
14
2468
2
4
1315
17
2022
2425
6
8
11
28 30 32 33
3638404244
46
4852 54 55
5860
62
64
70
72
74
73756567
626159575553514947
3 5 79 11 13 15 17 19
2325272931333537394142
27
164
9
12
7
14
5
3 2
18
16
20
22
24
2528
30
3234
44
46
42
48 41
4050 38
5552
36
54
7 15
139
25 23
2127
11
161 160
157156
154
152 151
148147
145
143 142
139137
6564626058
58 56 54 52
50
48
46
44
31
33
35
37
38
41
11 13 15
171921
23 25 27
2931
33
35 37 39 40
24
68
63 65 67 6962
55
53
51
49
47
45
44
132
129
127
5 7
16 15 14 13
19 20 22 23
30313334
37 38 40 41
484950515253
5655 58 59 6054
67 66 6465 63
737270
79 77 76
82 83 85 86
93949697
100101 103
104
114 112111
123121120119118
115
2 4
9
1113
1517
1921
23
25
27
29
32
3452
56
5860
62 64
29
31
VIP
7817
8
304
2RW
2
8 7
10 9
Ph3
Ph2
Ph1
1112
1314
1817
1615
Ph4
Ph5
PP 33 28
33807
5-6
3-4
7- 89- 10
11- 1213- 14
16- 1815- 17
20- 2219- 21 24- 26
23- 25
27- 2928- 30
35- 3
7
31- 33
32- 34
39-4
1
36- 3
8
44-4
6
40- 4
243
- 45
47- 4
948
- 50
55- 5
751
- 53
52- 5
457
- 5860- 62
59- 61
64- 6
6
63- 6
5
67- 69
71- 73
68- 70
72- 74
76- 7875- 7780- 8279- 81
83- 8588- 90
84- 86
87- 89
91- 93
92- 94
VIP
7966
0
VIP79659
VI P 53 80 7
SL 2
SL 1
12
34
5 6
7 8
VI S58
67
VI P 79 86 9
VI P 79 87 0
VI P 79 87 0
VI P 79 87 0
VI P 79 87 1
VI P 79 87 6
VI P 79 87 5
VI P 79 87 4
VI P 79 87 3
VI P 79 87 2
1
2
3
4
5
6
7
8
9
10
11
12
13
14
15
16
33
32
31
30
29
1718
19
20
21
22
28 27
2324
25
26
34
Rem 35VIP79868
VI P 80 04 5
1 2 3
45
6
7
8
9
10
1112
13 14 15
16
17
18
19
20
21
22
VIP
8031
0
VI P80 311
VI P80 312
VIP
80
309
VIP80523
VIP
6643
8
VI P 77 65 4
VIP
7765
4
15
16
13149
1011 12
VIP
8075
6
VIP80896
VIP
8116
0
VI P 81 90 2
VIP81898
1 2 3 4
56789
10 11 12 13 14 15 16
17
2526272829303132333435
VI P 81 90 2
VI P 81 90 1
VI P 81 89 9
VI P 81 90 4VI P 81 90 5
VI P 81 90 6
VI P 81 90 7
PP VIP82093
PP VIP82094
VIP
8190
8
PP V
IP82
378
PP V IP 82 37 9
1
2
3
45
6
7
8
910
1617
VIP82918
486 66
414 85 Pr i va te
VI P 82 91 9
VI P 82 92 0
VI P 82 92 1
VI P 82 92 2
VI P69
267
VI P72
327
VI P72
328
VIP62901
VI P 72 53 1
VI P 73 28 2
VIP55967
6421
VIP82418
VIP59327
VIP73819
24603
VIP
7221
8
VIP79219
PP V
IP7
680
6
30 28
2420
18
15
13
11
9
4644
4942
5153
403836
5759
3432
7 8 10
121416182022
78
64
66
71
69
74
296
94
9289
85
82
25
29
27
63
61
59
56
54
5250
34
48
46
44
32
29
2725
23
86
4
2
101416
VI P76
389
68RW
Pt. Sec 8
A
142
141
140
139
138
137136
135
134
VI P62
363
133
132
13113
0129128
127
126
125
124
123
122
121
120
119
118117
116
115
114
113112
111
110
109
108
107
106
105
104
103
102
101
100
99
98
97
96
9594
9392
91
90
89
88
VI P 64 71 7
1315
12
Re m S ec 8
11
345 5R W
2
93 92
78
76
74
72
70
68
66
65
64
62
60
58
56
55
51 49 47 46
45444240
32 30 28 26
24
22
20
18
16
14
12
10
8
6
4
VIP53732
VIP
5862
2
128
156
154
152
150
148
146
144 169
167
165
163
161
159
157 182
180
178
176
174
172
170
225224
222
220
218
216
214
212
211
208
206
204
203
202
200
198
196
192
189
187
185
183
143
142
140
138
136 99
91
90
88
86
84
82
8079
53
54
36
97
38
34
109
107
114
106105103
21
124
135
133
131
129
122
121
119
117
115
113
111
101100
1
VIP
5373
2
401
22
461 16
2
1
B
A
A
13
14
Rem 4
1
2
Rem 5
2
VI P 74 72 9
A
VI P 65 63 7
VIP
6389
0
VI P 73 28 3
VIP73
283
2
Rem
1
I
G
E
C
A
J
1
2
4
68
5
Park
Rem D.L. 16
Par
k
5
VI P55021
9
10
39
53
63 65
75
79
81
342 8R W
VI P 67 02 2
VI P 55 02 1
VIP
5502
1
8
8
15 13
7
5
4
13
15
17
19
33 35 37
5759
61
77
78
1
3
17
57
9
11
13
2325
27
29 31
21
12
55
19
3897 6
VI P 60 13 7499 07
3988 4
B
A
20
7
Rem 21
1 3
2
1
3
1
2
3687
RW
3966 6
396 66
1
2
95
6
1
40
1
75
39
345
5RW
3
7
Park
4
313
321
322
323
364
365
356
346
345
344
343
340
337
332
326
324
158
81
8889
51
190
VIP
7725
4
VI P 78 79 7
134567 VI P 79 22 0
VI P79
074
VI P 79 07 5
VI P79 036
A 1
1
24 3
VI P 53 88 2
VIP
5805
0
VIP
6881
6
VIP
6556
4
VI P 66 22 1
VI P 64 53 9
VI P 64 53 8
21
3
Re m 4
VI P 65 56 5
1
Rem 75
2
1
2
A
Rem Pcl B
35
Rem
33
79
41
43
74
Rem 40
Rem 78
31
7
45
73
5553
3
28A
47
5
Dunbar Park
1
26
49
E & NRW
65
64
57
58
Rem Pc
l D
NE o
f E & NRW
62
60
4347
48
50
22
41
52
11
45
6162
13
9
VI P58
433
VI P 61 72 1 VIP
6404
7
VI P 6 17 21
VIP61
492
56
VIP
6096
8
3464R
W
126
1
Rem 4
Pt . Sec. 10
Show
n on Plan
68RW
Ret u
r n t
o C
r ow
n
11
17
23
1
Pa r k
7
10
11
13
22 25
262830
45 47
49
50
52
20
32
34
41
43
53
54
37
VI P61
492
Re t ur n t o C r ow n
39
376
0RW
VIP
5899
8
VI P 58 99 8
1
1
6
3
97
3
1
15
18
20
124
9
14
11
376
0RW
VIP
6362
3
340 67
340
67
34067
355
354
353
352
351
350
349
348
333331
330
329
328 334
327 325
320
319
318
317
316
366
363
362
361
360359
358
357
314
311
309 308
306
305
303
301
Park
Rem A
1
VIP
5373
2
VIP53731
VI P 68 06 3
VI P62
904
A
Rem Sec 1, R ge3
VI P 62 90 2
VI P 62 90 3
347
341
339
338
336(R e le as e Ar e a)
VIP62905
VI P 53 73 1
3712R
W
VI P 68 41 9
2123
17
19
25
51
27
16
31
33 35 37
565860
23
2119 17 15
6777980
29
30
28
24
26
26
39
54
342
2
VI P64
082
VIP
6408
2
VI P64
617
VIP6
820
7VI P68 297
1
1
Rem 1
E & N RAILWAY
VIP
6298
7 17
1519
36
18
VI P 62 36 2
VIP
6767
0
85
83
81
58
60
62
7271
79
77
75
73
64
66
68
70
Re m 1
Pcl A
87
63
65
67
72
70
68
73
75
761
Park
VI P 64 04 9
A
387
88
91
9395
C
90D
B
81
83
84
VIP
6172
1
Pt o f the SW1/4 Sec 10
Rem S10 Ac of N1/2 of W1/2 Sec10
8
PA R T O F T H E S W 1 / 4
O F S EC T I O N 1 0 LY I N G
SO U T H O F D O U M O N T R DPT SW 1/ 4
& S E O F BR A N N E N L A KE R D
O F S EC 1 0 LY I N GG AZ F E B 5 193 1
ST H O F D O U M O N T R D
18
22
19A
24
Rem 21
2
1
3
7
31
10
12
87
4
3
5
4
6
5 6
1
2
VIP
6172
1
VIP
6172
2
14
86
VIP
5388
29 Rem
37
17
VI P 68 20 8
AB
VI P 83 39 8
VI P 60 96 7
2
VI P 82 99 1A
12
34
1 2
2 1
12
1 2 3
12
12
12
1
2
21
Rem Pt DL 23- G
12
3
4
VI P 66 55 0VIP
6679
2
VI P 66 79 2
VIP
6393
5
VIP62438
VIP
6230
0
VI P 62 29 8
VI P62
437
VI P 51 42 6
VIP62299
RE C
HA LL
16
14
122423
21
272931
33
35
74
76
78
69
67
65
61
59
57
80
82
84
38
40
42
44 46
48
9
8
2
4
5
10
12
13
2
5
6
8 10
16
14
13
1921
22
30
26
24
22 20
34 36 38 40
545658
6062 64
12
14 16
18
86 4 2
80
76
141618
11
2 3 5 6
2 4 6 7
34
3 2
2
2 4
2
4
6
8
16
18
19
2123
24
7
5
4
42
40
23
47 46
40
23 2220
26
28
30
33
35
377
9
11
13
15
17
22490
4
58
2
2
4
6
8
9 48
46
41
38
4
87
85
74
73
71
69
67
65
63
55
57
5961
Rem 2
235
7
23
111213
21
1716
19
13
11
9
7
3
5
VIP61
218
VIP
64
048
VIP
64
046
VIP
64
048
24916
389
53
VIP76852
43684
268
77
VI P 73 35 4
VIP69
755
VIP
57
391
VIP76850
VI P 72 22 0
VIP69755
17325
17325
7469
7469
24844
15012
25914
VIP54029
2298215012
24321
82356576
VIP72065
228
17
221
85
VI S 33 12
221
85
18903
465
56
VIP
64
510
22837
15154
485 30
30801
15012
DD52152
26355
15012
43497
VIS2919
22934
32084
421 14
487
67
VI S 21 19
322 60
VIS6251
47361
VIP59328
VIP60991
19319
17968
34240
259
59DD9963N 20327
339
80
PAR K
PAR K
2
PAR K
VIP
7673
8
VI P 76 73 5
VI P76
736
VIP
6298
6
CP
VI P76
737
33181
37846
VIP66260
20005
391
88
VIS3641
15154
23079
390
33
382
27
21691
21691
327
84
2691
1
VI 58 38 0
21691
21691
44982
32595
22490
33180
VI P 67 95 9
VIP60
991
VI P65
051
VI P 65 56 1
4165
VIP
7479
1
2007
VIP
7427
6
VIP
7409
3
351
41
38019
342 37
323 5746115
2007
SP 1120
SP 1119
SP 1055
SP 1056
VIS2544
VIP
63
891
VIP
6556
2
2007
BL 26 02
VIP
74
728
VIP
6301
4
VIP
64
852
VIP
63
889
VI P 63 88 8
VIP
6463
5
17844
SP 1057
VI S 24 51
VI S 24 78
28102
VIP53844
VIP53844
49723
49723
VI S 31 13
VIP58579
VIP60136
VI P 74 97 7
38953
VIP76852
VIP61423
VIP
61
422
VIP68062
VIP68156
VI S25
84
VIP59388
VIP61
422
VIS5320
VIP64716VIP62964
VI P 64 63 3VI P 62 95 9
VI P 62 94 5
VI P 62 86 4
SP
104
6
VI P 62 91 8
VIP628634841732197
21560
21560
VIP62297
VIS4813
VIS4991
VIP
7063
7
VIP72899
VIP
6287
4VI
P62
873
VIP
6285
0VI
P64
906
VI P 62 86 7
VI P 62 86 3
VIP62297
VIP62426
9906N
VIP
6289
2
VIP
6301
2
VIP
6287
1
VIP
6286
9
VIP
6422
1
VIP
6301
1VI
P62
870
VIP
6286
8
6421
VIP
6287
2
249
16
VI P62
865
VI P62
849
VI P64
631
VIP64
632
VI P64
632
24916
408
18
VIP66247
24916
VIP61720
VIP61720
VIP64046
VIP62
848
42101
VIP64
771
VI P63
312
VI P64
771
23170
VI P60
991
VIP61442
127 77
VI P 63 41 7
VIS3925
VIP63
312
VIP
64
046
VIP
64
048
VIP64877
VIP
64
048
VIP61720
3221
PP 41 05 4
VI P 62 70 1
VIP62
846
DD9259N
VI P 63 31 2
VIP64048
DD27597I43
216
22450
21559
21559
21559
VIP
6984
1
VIP
6229
6
VIP
6286
6
VI P64
634
VIP62360
199
88
VI P 57 53 5
VIP58997
200
7
368
7RW
VIP
6806
1
VIP
6806
1
41427
45
37
42
A
B
C
9
1
18
1
49
16
47
3
1
449
83
27
17
41
6
1
2
340 5R W
366
6RW 35
28
37
2
1
A
B
1
20
22
25
48
29
3
A
B
32
30
43 36
5
41
7
A B
39
3405R
W
93
413
24
434
77
3464R
W
1 5
1912
4
1
7
3
2
3
21
8
10
14
24
251
6
31
34
36
27
6
3464
RW
VI P62363
VI P62 362
346 4R W
3484
RW
32
1
3
6
RemA
3464R
W
29
1 A
VIP7
409
4
1
VI P 63 89 4
VIP
6389
3
VIP
6389
2
380 47
VI P 67 44 4
VI P 57 55 3
3605 RW
VI P 75 85 4
2
VIP61218
VI P73
352
1
Rem 2
VIP58
050
VIP72219
VI P 73 35 5
VIP73
353
1
2
2
1
A
VI P 74 77 9
VI P 52 98 2
4
A1
B B
A
1
2
21
1
A
Rem 2
46
1
Rem 31
344 1R W
VIP73
356
A
1 Rem A
1
VIP73
356
C
3442R
W
69 70 71 72 73 748690
91
92575859606162
53 54 55 56
97
14
1012
A
Rem 1
15
22
8
18
20
12
346 1R W
3
80
88
2
B
Rem 3
2
3
132131
1816
34
19
20
21
22
23
24
25
26
27282930 75
76
77
78
79
80
81
8283
848589
88
60
64
84
86
70
58
66 A
12
68
1
54
56
2
62
Rem 1
87
109
107
105
103
43
44
45
46
47
48102
104
106
10866 67 68
636465
49 50 51 52
101 100 99 98
109
6
8
2
A
14
16
18
34
1
1
B
344 1R W
3441RW
433 30
347 5R W
2
29
7
28
12
4
43
41
37
42
3Pcl C
1
A
VIP
7381
4
32
22
48124
342 88
473
62
6
7
124
123
122
121
120
119
118
117
116
115
113
126
127
129128
1412
114
112
4011041
37 36
3233
13
1
3 A
1
2
2
A
14
A
Re m C
4
1
A
346 4R W
342 88
41324
3632R
W
346 4R W
8
Pk
6
Pt DL2
4G A
1
Pt DL24G
Pt . Sec. 10
Show
n on Plan
68RW
11142
3450R
W
5
125
130
15
35
31
52
B
5
4
VI P82 204
VI P82204
VI P82204
VI P82 198
VIP82198
VI P82198
153
154152
151
150
149
148
147
146
145
144
143
157
156
155
PP VIP82092
VI P 67 67 2
VI P 67 67 0
VI P 80 51 4
302
304
307
310
312
VIP
6393
4
VIP
6740
4VI
P79
189
1110
98
65
32
1
1314 15 17
1920
21
2324
2726 25
303133
3536
38394044
45
46
47
48
49
VI S63
51
12
34
56
78
9
Park101112
1314
1516
1718
19
VIP83543
Par k
VI P83544
VI P83545
VI P83546
VI P83547
VIP8
354
8
VIP8
355
0
VI P83551
DISTRICT OF
LANTZVILLEOFFICIAL
COMMUNITY PLAN
MAP NO. 7WATER SERVICE AREA
Legend
District of Lantzville Boundary
´0 200 400 600 800 1,000 1,200100
Meters
CITY OF NANAIMO
REGIONAL DISTRICT OF NANAIMO
REGIONAL DISTRICT OF NANAIMO
REGIONAL DISTRICT OF NANAIMO
NANOOSE INDIAN RESERVE
Water Service Area
BYLAW NO. 50.2, 2007
Mayor Director of Corporate Administration