Embed Size (px)
Citation preview
LOAN DOCUMENTPHOTOGRAPH THIS SHEET
IEVEL INVENTORY
DOCUMENT IDENTIFCATION, HA
DISTRIBUTION STATEMENT A, NApproved for public release;
Distribution Unlimited D
DISTRIBUION STATEMENT L
GRAM EUNANNOUNCED ElJUSTIFICATION
DY IBYDISTRIBUTION/ TAVAILABIDATY CODESD W I"T UB U T IO N A V A .U AB IL ]T Y A N / O , PEK• H
_C
DJSTRIBIION STAMPA
RE
DATE RETURNED
,19980731 120DATE RECEIVED IN DTIC REGISTERED OR CERTIFIED NUMBER
PHOTOGRAPH THIS SHEET AND RETURN TO DTIC-FDAC
DTIC 70A DOCUMEU PROCESSING SHIET n UHGM MAY Z USED WTSTOWC I0 I•BAUI1D.
LOAN DOCUMENT
197- 1995
NBL-331MARCH 1995
THE QUANTITATIVE ION EXCHANGESEPARATION OF URANIUM FROM
IMPURITIES
Usha 1. Narayanan, Peter B. Mason, Jeffrey P. Zebrowski,Matthew Rocca, Iris W. Frank, Marianne M. Smith,
Kimberly D. Johnson, Glennda J. Orlowiczand Eric Dallmann
U.S. DEPARTMENT OF ENERGY *CHICAGO OPERATIONS OFFICE *ARGONNE, ILLINOIS
Form ApprovedREPORT DOCUMENTATION PAGE 0 OMB No. 074-0188
Public reporting burden for this collection of information is estimated to average 1 hour per response, including the time for reviewing instructions, searching existing data sources, gathering andmaintaining the data needed, and completing and reviewing this collection of information. Send comments regarding this burden estimate or any other aspect of this collection of information, includingsuggestions for reducing this burden to Washington Headquarters Services, Directorate for Information Operations and Reports, 1215 Jefferson Davis Highway, Suite 1204, Arlington, VA 22202-4302,and to the Office of Management and Budget, Paperwork Reduction Proiect (0704-0188), Washington, DC 20503
1. AGENCY USE ONLY (Leave blank) 2. REPORT DATE 3. REPORT TYPE AND DATES COVERED
March 1995 Research and Development Report, March 19954. TITLE AND SUBTITLE 5. FUNDING NUMBERSThe Quantitative Ion Exchange Separation of Uranium From Impurities N/A
6. AUTHOR(S)Usha I. Narayanan, Peter B. Mason, Jeffrey P. Zebrowski, Matthew Rocca, Iris W.Frank, Marianne M. Smith, Kimberly D. Johnson, Glennda J. Orlowcz and EricDallmann
7. PERFORMING ORGANIZATION NAME(S) AND ADDRESS(ES) 8. PERFORMING ORGANIZATIONREPORT NUMBER
New Brunswick Laboratory NBL-331Argonne, Illinois
9. SPONSORING / MONITORING AGENCY NAMEIS) AND ADDRESS(ES) 10. SPONSORING / MONITORINGSERDP AGENCY REPORT NUMBER901 North Stuart St. Suite 303 N/A
Arlington, VA 22203
11. SUPPLEMENTARY NOTESPrepared for the U.S. Department of Energy. This work was supported in part by SERDP. The United States Government has aroyalty-free license throughout the world in all copyrightable material contained herein. All other rights are reserved by the copyrightowner.
12a. DISTRIBUTION / AVAILABILITY STATEMENT 12b. DISTRIBUTION CODE
Approved for public release: distribution is unlimited A
13. ABSTRACT (Maximum 200 Words)
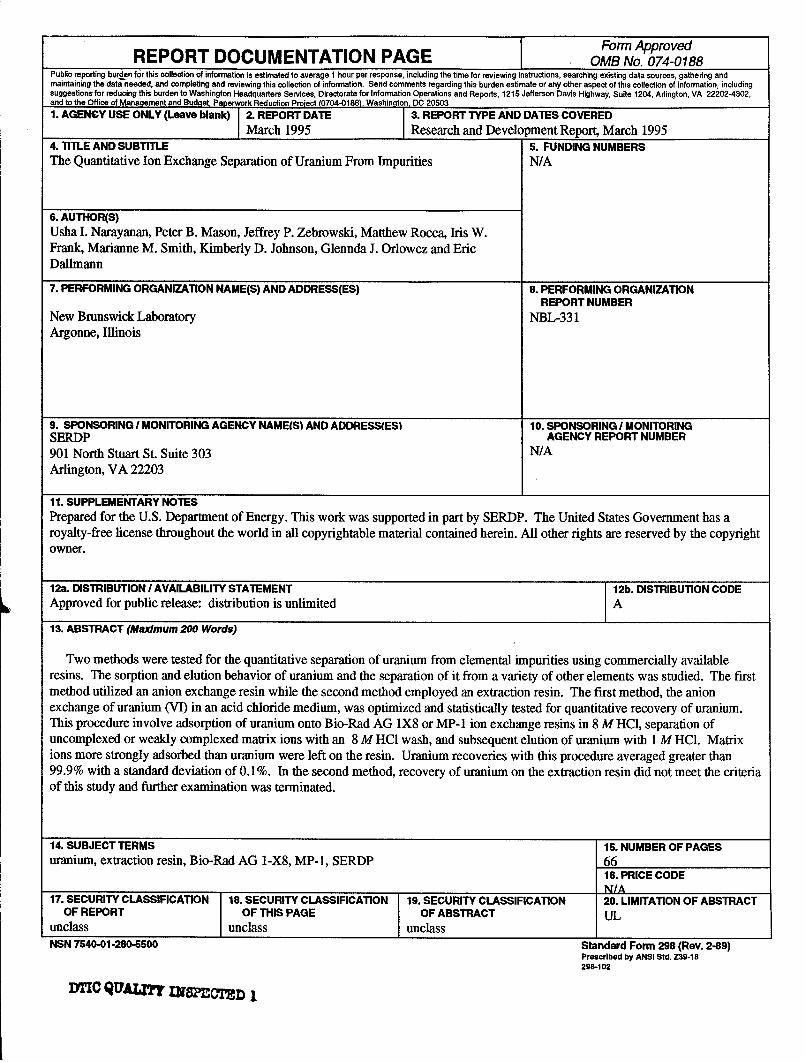
Two methods were tested for the quantitative separation of uranium from elemental impurities using commercially availableresins. The sorption and elution behavior of uranium and the separation of it from a variety of other elements was studied. The firstmethod utilized an anion exchange resin while the second method employed an extraction resin. The first method, the anionexchange of uranium (VI) in an acid chloride medium, was optimized and statistically tested for quantitative recovery of uranium.This procedure involve adsorption of uranium onto Bio-Rad AG 1X8 or MP-1 ion exchange resins in 8 M HCI, separation ofuncomplexed or weakly complexed matrix ions with an 8 M HCl wash, and subsequent elution of uranium with 1 M HCI. Matrixions more strongly adsorbed than uranium were left on the resin. Uranium recoveries with this procedure averaged greater than99.9% with a standard deviation of 0.1%. In the second method, recovery of uranium on the extraction resin did not meet the criteriaof this study and further examination was terminated.
14. SUBJECT TERMS 15. NUMBER OF PAGESuranium, extraction resin, Bio-Rad AG l-X8, MP-1, SERDP 66
16. PRICE CODEN/A
17. SECURITY CLASSIFICATION 18. SECURITY CLASSIFICATION 19. SECURITY CLASSIFICATION 20. LIMITATION OF ABSTRACTOF REPORT OF THIS PAGE OF ABSTRACT UL
unclass unclass unclassNSN 754001-280-5500 Standard Form 298 (Rev. 2-89)
Prescribed by ANSI Std. Z39-18298-102
lyric QUALiTY IN8PIM'r 1
NBL-331
U.S. DEPARTMENT OF ENERGY
THE QUANTITATIVE ION EXCHANGESEPARATION OF URANIUM FROM
IMPURITIES
Usha I. Narayanan, Peter B. Mason, Jeffrey P. Zebrowski,
Matthew Rocca, Iris W. Frank, Marianne M. Smith,Kimberly D. Johnson, Glennda J. Orlowicz and Eric Dallmann
Research and Development Report
NEW BRUNSWICK LABORATORY
Argonne, Illinois
March, 1995
H. Rodney Martin, Acting Director
NOTICE
REFERENCE TO A PARTICULAR BRAND OR MANUFACTURER OF EQUIPMENT DOES NOT
CONSTITUTE AN ENDORSEMENT BY THE NEW BRUNSWICK LABORATORY OR THE DEPARTMENT
OF ENERGY.
TABLE OF CONTENTS
ACKNOW LEDGMENTS .......................................................... v
ABSTRACT ................................................................... vii
INTRO DUCTIO N ............................................................... 1
EXPERIM ENTAL ............................................................... 2
Apparatus, Materials and Reagents ........................................... 2
PRO C EDURE ................................................................. 2
Test Sam ples ........................................................... 2
Colum n Capacities ....................................................... 3
Colum n Preparation ...................................................... 3
Sam ple Preparation ...................................................... 4
Sam ple Loading ......................................................... 4
Colum n W ash ........................................................... 4
Uranium Elution ......................................................... 5
Uranium and Impurity Analysis .............................................. 5
RESULTS AND DISCUSSION ..................................................... 6
Sorption and Elution Profiles of Pure Uranium Solutions with U/TEVA .................. 7
Table I - Elution Pattern of Uranium on U/TEVA Column ........................... 8
Table II - Sorption and Elution Profile of U/TEVA resin
with 0.01 M Ammonium Bioxalate Eluant ................................ 9
Sorption and Elution Profiles of Pure Uranium Solutions with Bio-Rad Resins ........... 10
Recovery of Pure Uranium with Bio-Rad Resins ................................. 10
Table III - Adsorption and Elution Behavior of Uranium on Bio-Rad Resins .............. 11
Table IV - Uranium Recovery with Bio-Rad Resins ............................... 12
Table V - Optimized Uranium Recovery with Bio-Rad 1-X8 and MP-1 Resins ............ 13
Ion Exchange of the Matrix Blank ............................................ 13
Ion-Exchange of Spiked Uranium Samples ..................................... 14
Table VI - Sorption and Elution Pattern of 22 Impurities on Bio-Rad MP-1 Resin .......... 15
Table VII - Uranium Recovery of Spiked Samples ................................ 17
Uranium Breakthrough and Recovery ........................................ 18
Statistical Testing ....................................................... 18
Table VIII - Uranium Breakthrough Study on Blo-Rad AG 1-X8 and MP-1 Resins ......... 19
Table IX - Summary Table of Resin Statistics for Uranium Recovery ................... 20
CO NCLUSIO NS .............................................................. 21
REFERENCES ............................................................... 21
APPENDIX A: Procedure for the Purification of Uranium by Anion Exchange .................. 23
APPENDIX B: Statistical Plan of Analysis ............................................ 37
APPENDIX C: Statistical Analysis of Uranium Purification Project .......................... 43
DISTRIBUTION LIST ............................................................ 55
iii
ACKNOWLEDGMENTS
This work was performed under the auspices of the Office of Safeguards and Security In the Office of Non-
Proliferation and National Security. Funding for this work was provided by the Strategic Environmental
Research and Development Program (SERDP) under the Pollution Prevention thrust area.
The authors express their appreciation to R. D. Oldham for providing technical guidance, to M. I. Spaletto
for technical discussions, to P. V. Croatto for-providing assistance during KPA analyses, to D. T. Baran,
G. A. Sowell, L. D. Preston and A. V. Stiffin for X-ray analyses, to W. G. Mitchell and M. I. Spaletto for
reviewing this report, and to M. Ficner for secretarial support.
v
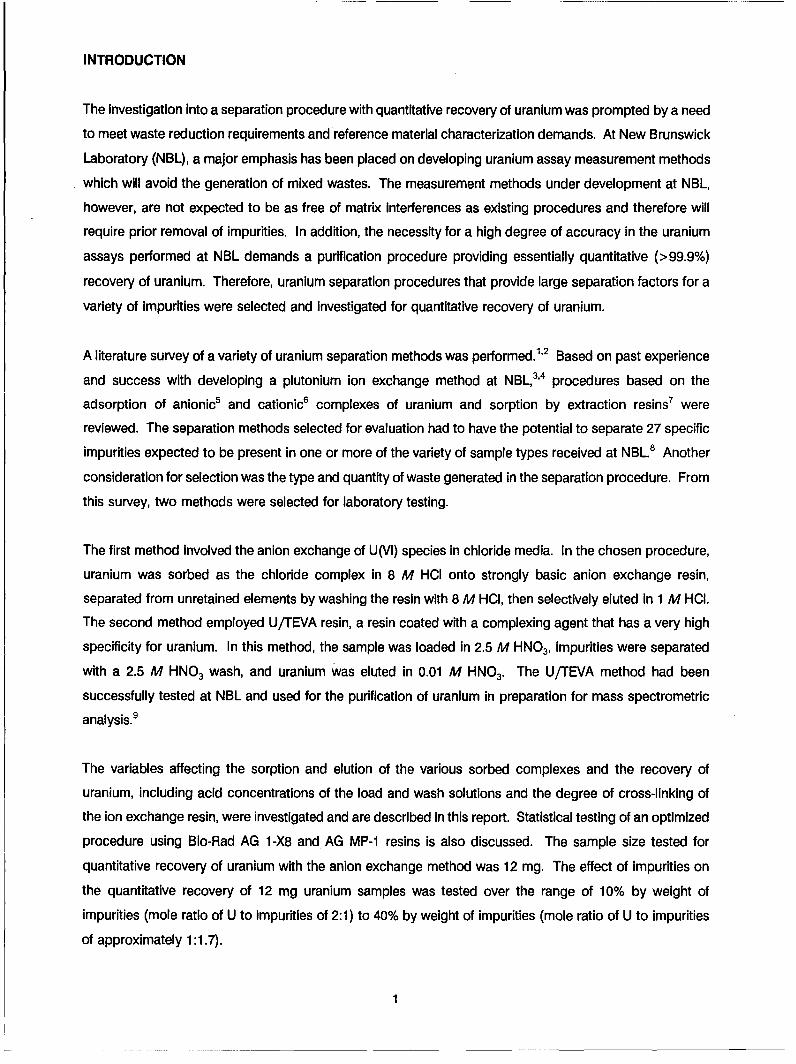
ABSTRACT
Two methods were tested for the quantitative separation of uranium from elemental Impurities using
commercially available resins. The sorption and elution behavior of uranium and the separation of it from
a variety of other elements was studied. The first method utilized an anion exchange resin while the second
method employed an extraction resin. The first method, the anion exchange of uranium (VI) in an acid
chloride medium, was optimized and statistically tested for quantitative recovery of uranium. This procedure
Involved adsorption of uranium onto Bio-Rad AG 1 -X8 or MP-1 ion exchange resins In 8 M HCI, separation
of uncomplexed or weakly complexed matrix ions with an 8 M HCI wash, and subsequent elution of uranium
with 1 M HCI. Matrix ions more strongly adsorbed than uranium were left on the resin. Uranium recoveries
with this procedure averaged greater than 99.9% with a standard deviation of 0.1%. In the second method,
recovery of uranium on the extraction resin did not meet the criteria of this study and further examination
was terminated.
vii
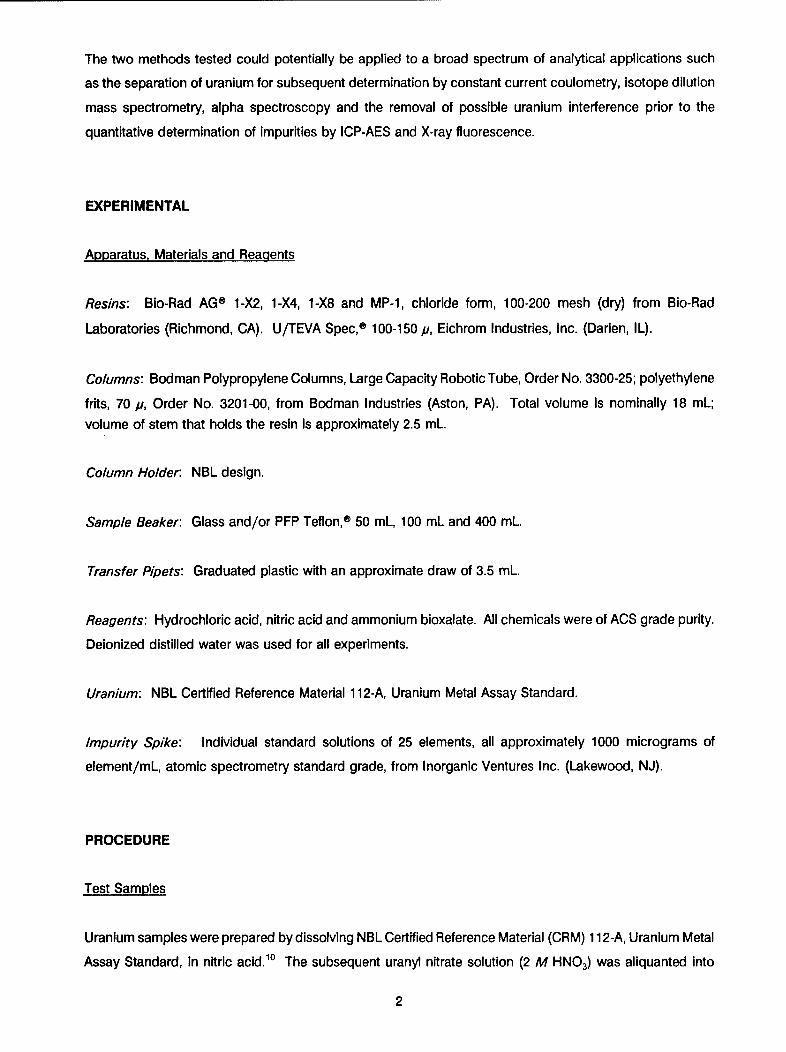
INTRODUCTION
The investigation into a separation procedure with quantitative recovery of uranium was prompted by a need
to meet waste reduction requirements and reference material characterization demands. At New Brunswick
Laboratory (NBL), a major emphasis has been placed on developing uranium assay measurement methods
which will avoid the generation of mixed wastes. The measurement methods under development at NBL,
however, are not expected to be as free of matrix interferences as existing procedures and therefore will
require prior removal of impurities. In addition, the necessity for a high degree of accuracy in the uranium
assays performed at NBL demands a purification procedure providing essentially quantitative (>99.9%)
recovery of uranium. Therefore, uranium separation procedures that provide large separation factors for a
variety of impurities were selected and investigated for quantitative recovery of uranium.
A literature survey of a variety of uranium separation methods was performed.1 '2 Based on past experience
and success with developing a plutonium ion exchange method at NBL, 3'4 procedures based on the
adsorption of anionic 5 and cationic6 complexes of uranium and sorption by extraction resins7 were
reviewed. The separation methods selected for evaluation had to have the potential to separate 27 specific
impurities expected to be present in one or more of the variety of sample types received at NBL.8 Another
consideration for selection was the type and quantity of waste generated in the separation procedure. From
this survey, two methods were selected for laboratory testing.
The first method involved the anion exchange of U(VI) species in chloride media. In the chosen procedure,
uranium was sorbed as the chloride complex in 8 M HCI onto strongly basic anion exchange resin,
separated from unretained elements by washing the resin with 8 M HCI, then selectively eluted in 1 M HCI.
The second method employed U/TEVA resin, a resin coated with a complexing agent that has a very high
specificity for uranium. In this method, the sample was loaded in 2.5 M HNO 3, impurities were separated
with a 2.5 M HNO 3 wash, and uranium was eluted in 0.01 M HNO 3. The U/TEVA method had been
successfully tested at NBL and used for the purification of uranium in preparation for mass spectrometric
analysis.9
The variables affecting the sorption and elution of the various sorbed complexes and the recovery of
uranium, including acid concentrations of the load and wash solutions and the degree of cross-linking of
the ion exchange resin, were investigated and are described in this report. Statistical testing of an optimized
procedure using Bio-Rad AG 1-X8 and AG MP-1 resins is also discussed. The sample size tested for
quantitative recovery of uranium with the anion exchange method was 12 mg. The effect of impurities on
the quantitative recovery of 12 mg uranium samples was tested over the range of 10% by weight of
impurities (mole ratio of U to impurities of 2:1) to 40% by weight of impurities (mole ratio of U to impurities
of approximately 1:1.7).
1
The two methods tested could potentially be applied to a broad spectrum of analytical applications such
as the separation of uranium for subsequent determination by constant current coulometry, isotope dilution
mass spectrometry, alpha spectroscopy and the removal of possible uranium interference prior to the
quantitative determination of impurities by ICP-AES and X-ray fluorescence.
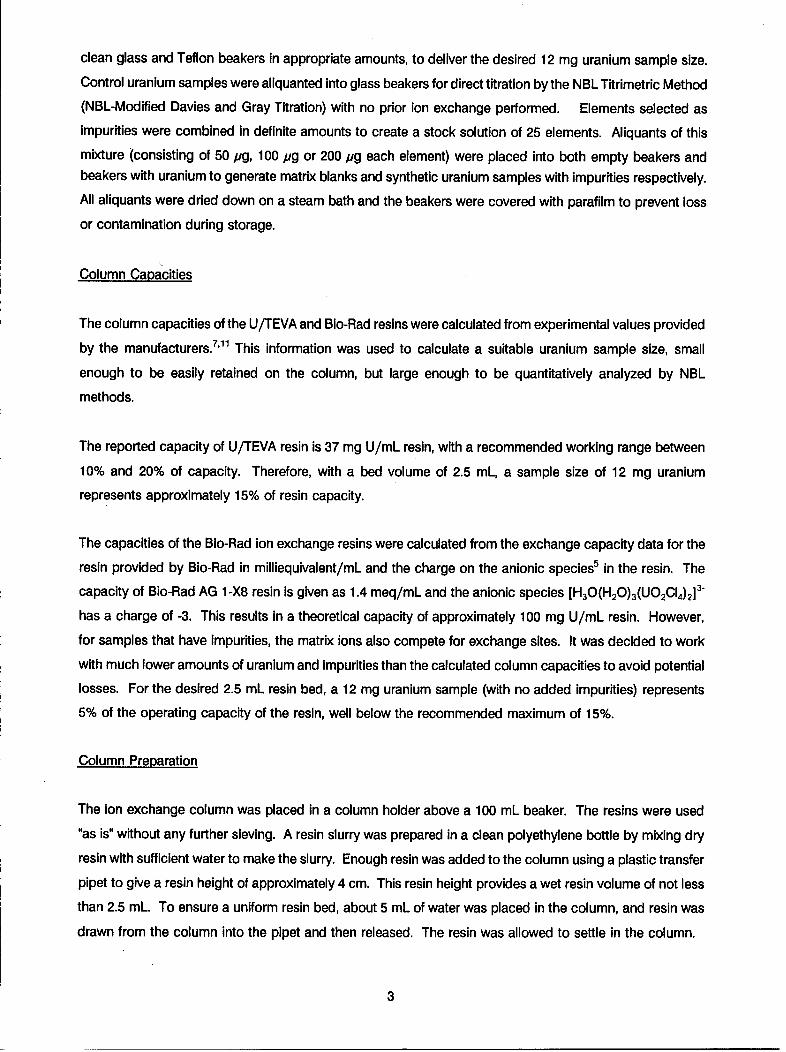
EXPERIMENTAL
Apparatus, Materials and Reagents
Resins: Bio-Rad AGO 1-X2, 1-X4, 1-X8 and MP-1, chloride form, 100-200 mesh (dry) from Bio-Rad
Laboratories (Richmond, CA). U/TEVA Spec,O 100-150 p, Eichrom Industries, Inc. (Darien, IL).
Columns: Bodman Polypropylene Columns, Large Capacity Robotic Tube, Order No. 3300-25; polyethylene
frits, 70 p, Order No. 3201-00, from Bodman Industries (Aston, PA). Total volume Is nominally 18 mL;
volume of stem that holds the resin is approximately 2.5 mL.
Column Holder: NBL design.
Sample Beaker: Glass and/or PFP Teflon,O 50 mL, 100 mL and 400 mL.
Transfer Pipets: Graduated plastic with an approximate draw of 3.5 mL.
Reagents: Hydrochloric acid, nitric acid and ammonium bioxalate. All chemicals were of ACS grade purity.
Deionized distilled water was used for all experiments.
Uranium: NBL Certified Reference Material 112-A, Uranium Metal Assay Standard.
Impurity Spike: Individual standard solutions of 25 elements, all approximately 1000 micrograms of
element/mL, atomic spectrometry standard grade, from Inorganic Ventures Inc. (Lakewood, NJ).
PROCEDURE
Test Samples
Uranium samples were prepared by dissolving NBL Certified Reference Material (CRM) 112-A, Uranium Metal
Assay Standard, in nitric acid.1 ° The subsequent uranyl nitrate solution (2 M HNO 3) was aliquanted into
2
clean glass and Teflon beakers in appropriate amounts, to deliver the desired 12 mg uranium sample size.
Control uranium samples were aliquanted into glass beakers for direct titration by the NBL Titrimetric Method
(NBL-Modified Davies and Gray Titration) with no prior ion exchange performed. Elements selected as
impurities were combined in definite amounts to create a stock solution of 25 elements. Aliquants of this
mixture (consisting of 50 pg, 100 pg or 200 pg each element) were placed into both empty beakers andbeakers with uranium to generate matrix blanks and synthetic uranium samples with impurities respectively.
All aliquants were dried down on a steam bath and the beakers were covered with parafilm to prevent loss
or contamination during storage.
Column Capacities
The column capacities of the U/TEVA and Bio-Rad resins were calculated from experimental values provided
by the manufacturers. 7.11 This information was used to calculate a suitable uranium sample size, small
enough to be easily retained on the column, but large enough to be quantitatively analyzed by NBL
methods.
The reported capacity of U/TEVA resin is 37 mg U/mL resin, with a recommended working range between
10% and 20% of capacity. Therefore, with a bed volume of 2.5 mL, a sample size of 12 mg uranium
represents approximately 15% of resin capacity.
The capacities of the Bio-Rad ion exchange resins were calculated from the exchange capacity data for the
resin provided by Bio-Rad in milliequivalent/mL and the charge on the anionic species5 in the resin. The
capacity of Bio-Rad AG 1-X8 resin is given as 1.4 meq/mL and the anionic species [H30(H20) 3(UO2CI4)2]3
has a charge of -3. This results in a theoretical capacity of approximately 100 mg U/mL resin. However,
for samples that have impurities, the matrix ions also compete for exchange sites. It was decided to work
with much lower amounts of uranium and impurities than the calculated column capacities to avoid potential
losses. For the desired 2.5 mL resin bed, a 12 mg uranium sample (with no added impurities) represents
5% of the operating capacity of the resin, well below the recommended maximum of 15%.
Column Preparation
The ion exchange column was placed in a column holder above a 100 mL beaker. The resins were used"as is" without any further sieving. A resin slurry was prepared in a clean polyethylene bottle by mixing dry
resin with sufficient water to make the slurry. Enough resin was added to the column using a plastic transfer
pipet to give a resin height of approximately 4 cm. This resin height provides a wet resin volume of not less
than 2.5 mL. To ensure a uniform resin bed, about 5 mL of water was placed in the column, and resin was
drawn from the column into the pipet and then released. The resin was allowed to settle in the column.
3
This helped to remove any air bubbles formed when loading the column, and allowed the resin beads to
settle uniformly in the column. The resin bed was conditioned by adding 30 mL of the appropriate acid
(8 M HCI reagent for the anion exchange and 2.5 M HNO3 reagent for the U/TEVA extraction
chromatography) to the column with a transfer pipet. For the Bio-Rad AG MP-1 and U/TEVA resins, glass
wool was placed at the top of the resin bed to prevent the resin from being disturbed during the addition
of reagents. The column beds prepared from other resins remained intact and thus no glass wool was
needed for these resins. The flow rate for the U/TEVA column was uniform at 1 mL/min. The average flow
rate measured for all of the Bio-Rad resins was 0.6 mL/min. With the AG MP-1 (macroporous) resin, resin
fines were observed In the collection beaker during the column preparation step. No visible resin fines were
observed in the collection beaker during sample loading or during later steps of the procedure.
Sample Preparation
The Parafllm cover and walls of the sample beaker were rinsed with 12 to 14 mL of the appropriate acid
(8 M HCI or 2.5 M HNO 3) and the sample was allowed to dissolve completely.
Sample Loading
The sample solution was slowly and carefully poured, without loss, onto the resin bed. When pouring
samples from glass beakers, a small drop of solution tends to adhere to the lip of the beaker. The analyst
must be very careful to avoid losing sample at this point. Note that for a 12 mg sample, a loss of just 12
micrograms of uranium represents 0.1% of the sample, thus making recovery of greater than 99.9%
Impossible. Teflon beakers were also tested to see if their use reduced sample loss during loading since
the aqueous solution does not cling to hydrophobic Teflon. A disposable plastic pipet was used to rinse
the walls of the sample beaker with 2 mL of acid. The rinse solution was then transferred onto the column.
This rinse was repeated four times. The outside of the beaker spout was then rinsed into the column with
a few drops of acid. The column effluent from the sample loading was discarded or analyzed for trace
uranium or Impurities, as appropriate.
Column Wash
Aliquots of 5 mL of acid wash were added to the column and allowed to drain to the top of the resin bed.
A total volume of 20 mL wash was utilized In the final anion exchange procedure. The effluent (washings)
was discarded or set aside for appropriate analysis (uranium and/or impurities).
4
Uranium Elution
Uranium was eluted into a clean labeled beaker by adding the first 5 mL of the appropriate eluting solution
(0.01 M HNO 3 or 1 M HCI) to the column dropwise. The dropwise additions were used to wash the sides
of the reservoir. Eluting solution was then added in aliquots of 5 mL, allowing the column to drain between
increments, until a total of 40 mL was added. Small fractions of the eluate were collected and analyzed to
determine elution curves. The final volume of eluant for the ion exchange procedure was determined to be
40 mL based upon analysis of the elution curves.
Uranium and Impurity Analysis
The eluate was evaporated on a hot plate and fumed twice with 2 mL of concentrated HNO 3. The
collections from sample loadings and washes were also evaporated and fumed as described above. The
sample loadings, washes, and eluate fractions were analyzed for uranium and impurities, as appropriate.
For these experiments, three analytical methods were used for the assay of uranium and impurities.
A laser kinetic phosphorimetry method was used to analyze samples containing uranium in the concentration
range of 1 x 10⁻⁴ pg U/g of solution to 5.0 pg U/g of solution. A Kinetic Phosphorimetry Analyzer KPA-1 1
(KPA) from Chemchek Instruments Inc. (Richland, WA) was employed for these analyses. 12 Uranium
samples for analysis were prepared by dissolving (and diluting if necessary) the sample in a known amount
by weight of 1 M HNO3. The samples were then analyzed according to the procedure specified in the KPA
manual. 13 Two calibration curves were utilized to cover the range of 1 x 10⁻⁴ pg U/g solution to 5.0 pg
U/g solution. The low curve ranged from 1 x 10⁻⁴ pg U/g solution to 1 x 10⁻² pg U/g solution and the high
curve ranged from 1 x 10⁻² pg U/g of solution to 5.0 pg U/g of solution. The accuracy and precision of
uranium knowns analyzed using this method was found to be ± 5%. This accuracy for the method wassufficient to determine elution curves and to estimate uranium losses at various stages in the ion exchange
process.
The NBL Titrimetric Method1 4 was used to evaluate the quantitative recovery of uranium. The accuracy
and precision of this method estimated from the results of 18 uranium control samples analyzed with the
test samples was found to be + 0.013% with a standard deviation of ± 0.047%.
X-ray fluorescence spectrometry was used for impurity analyses.1 5 Standards for the calibration of the
x-ray instrument were prepared from the 25 different atomic spectrometry standard solutions. The 25
elements were combined into three stock solutions (containing 10, 10 and 5 elements, respectively) with a
final concentration of approximately 100 pg of each element/g solution. Each stock solution was thendiluted successively by a 10:1 weight ratio to yield solutions containing metal ion concentrations of 10 pgelement/g solution and 1 pg element/g solution. The separation into 3 different stock solutions was
5
necessitated by a desire to group elements with similar matrices together to ensure solution stability. The
standards were then prepared for x-ray analysis by transferring known quantities of the mixtures onto filter
paper and evaporating prior to analysis. These standards, ranging from 0.1 to 80 pg, were used to
determine the detection limits of the instrument, and to prepare calibration curves. Known samples prepared
and tested against the calibration standards resulted in errors as high as 25% for some elements. The
results were used to provide a semi-quantitative picture of the presence of impurities at various stages of
the ion exchange process. (In the future, ICP-AES will be used to determine the quantities of impurities
separated by the ion exchange in the statistical testing of the method, and the results from that study will
be reported separately).
RESULTS AND DISCUSSION
In the initial planning for this project, the following 27 elements were identified as commonly found impurities
that could potentially interfere with uranium analysis if present in the sample: Ba, V, Ni, Na, Al, Fe, Ag, Bi,
Cu, Co, Mg, Gd, Pr, Cd, Mn, Zn, Ca, Sb, Ti, Cr, Pb, P, Zr, Si, Ta, Sn, and Mo. Procedures capable of
separating a majority of these elements from uranium needed to be identified.
The U/TEVA resin was tested because it is very selective for uranium, even in a complex sample matrix.
The scheme involves loading and washing the column with 2.5 M nitric acid and eluting with 0.01 M nitric
acid. Recoveries in the 95% range for pg sample sizes have been reported in the literature,7 with complete
separation from some 30 elemental impurities. The elements separated were Li, Na, Mg, Al, K, Ca, Cr, Mn,
Fe, Co, Ni, Cu, Zn, Rb, Sr, Y, Zr, Ru, Rh, Ag, Cd, Cs, Ba, La, Ce, Pr, Nd, Sm, Eu, and Pb. Some variation
to this basic procedure and/or sequential treatments can separate V, W, Mo, Bi, Sb, Th(IV) and other
actinides.
The Investigation into anion exchange resins was prompted by the success of several reported separation
methods using them. Based on reported distribution coefficients of uranium and other elements In different
media on strongly basic anion resin, the hydrochloric acid media appeared to have the best chance of
meeting the requirements of good separation and high uranium recovery. There are several studies related
to the adsorption/desorption of uranium and other elements at different HCI molarities. 16
The choice of 8 M HCI to adsorb uranium and 1 M HCI to desorb it was primarily based on achieving
maximum separation from most of the impurities and desorbing all of the uranium. The lanthanides, alkali
and alkaline earth metals, Al, Ni, P and Si are not retained on the resin at any acid concentration. Pb(Il) is
not adsorbed above 6 M HCI, while Mn(ll) is only adsorbed at or above 9 M HCI; therefore these elements
are not retained in an 8 M HCI wash. While Zn, Cd, Sn(ll), Sn(IV), Ta, Bi and Ag are retained in 8 M HCI,
they are also largely retained in 1 M HCI and therefore should remain on the column during uranium elution.
6
The ions of Ti, Zr, Hf, Mo(VI), Cu(ll), and V(V) are potential separation problems. Since they have low
distribution coefficients at 8 M HCI acid concentration, it is difficult to predict their actual behavior and the
ease of separation of these ions from uranium. This scheme will not separate Fe(lll), Mo(VI), Sb(V), or Co(ll)
from uranium as they are retained under the conditions specified and will be eluted with uranium. As an
added benefit, this scheme should readily separate (though it was beyond the scope of this report) a
number of actinides from uranium, including Th(IV), Ac(lll), Pu(lll), and Np(lll).
The primary objective of this study was the quantitative recovery of uranium. Thus, it was important to
investigate the effects of varying the conditions so as to optimize uranium recovery. Sorption and elution
profiles for both the U/TEVA and Blo-Rad anion exchange resins were determined for pure uranium samples.
For the Bio-Rad resins only, the methods were optimized and uranium recovery determined with and without
the presence of varying levels of impurities.
Sorption and Elution Profiles of Pure Uranium Solutions with U/TEVA
The retention and elution behavior of uranium on U/TEVA resin under four different loading acid
concentrations (acid concentrations of 2.5 M HNO 3, 2 M HNO 3, 1.5 M HNO 3 and 1 M HNO 3) was tested.
Elution was performed with 0.01 M HNO 3. Samples consisting of 12 mg aliquants of pure uranium were
dissolved in 15 mL of acid and the solutions were transferred to preconditioned columns. An additional
10 mL of acid was used to rinse the beaker and was transferred to the column. After passing through the
column, the 25 mL loading solution was collected and evaporated. The columns were washed successively
with 20 mL and 10 mL aliquots of loading acid. These washings were collected separately. Uranium was
then eluted with varying (2 mL to 10 mL) portions of 0.01 M HNO 3 and the eluates were collected to
establish elution curves. All the collected fractions were evaporated, fumed twice with concentrated nitric
acid, and assayed for uranium using the KPA technique.
The results for sorption and elution of uranium at the various acid concentrations are presented in Table I.
Uranium was fully sorbed and strongly retained on the resin in 2.5 M HNO 3. Uranium losses from the
sample loading (25 mL volume) and column washings (30 mL volume) totaled less than 1 pg. As the acidconcentration of the loading solution was lowered, there was a trend of increased loss of uranium during
sample loading and column washes. In 2 M HNO 3, the loss increased to 0.4%, which was unacceptable
for our goal of achieving greater than 99.9% recovery. In 1.5 M HNO 3, the loss increased significantly to
6%. In 1 M HNO 3, over 26% of the uranium was lost in the load and washes (55 mL). These results clearly
indicated that acid concentrations of 2.0 M or less were unfavorable and were not further evaluated.
7
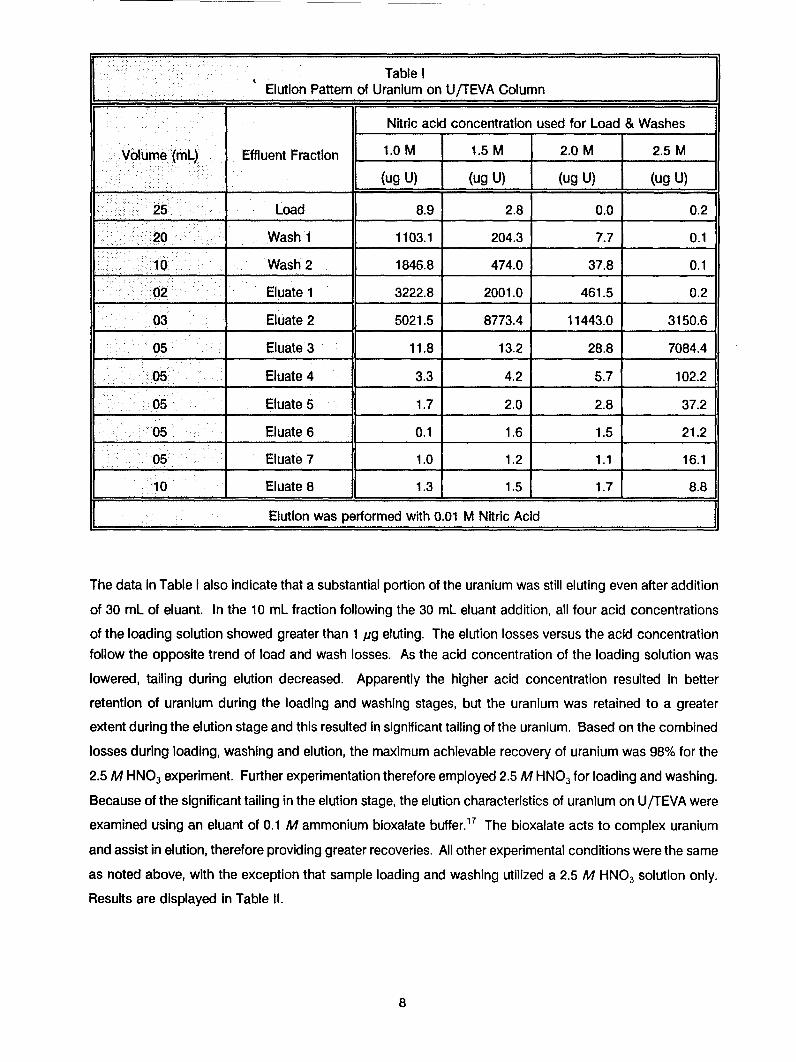
Table IF _ _ _Elution Pattern of Uranium on U/TEVA Column
Nitric acid concentration used for Load & Washes
Volume (mL) Effluent Fraction 1.0 M 1.5 M 2.0 M 2.5 M
(ug U) (ug U) (ug U) (ug U)
25, Load 8.9 2.8 0.0 0.2
20 Wash 1 1103.1 204.3 7.7 0.1
10 Wash 2 1846.8 474.0 37.8 0.1
02- Eluate 1 3222.8 2001.0 461.5 0.2
03 Eluate 2 5021.5 8773.4 11443.0 3150.6
05 Eluate 3 11.8 13.2 28.8 7084.4
05 Eluate 4 3.3 4.2 5.7 102.2
05 Eluate 5 1.7 2.0 2.8 37.2
•05 Eluate 6 0.1 1.6 1.5 21.2
05 Eluate 7 1.0 1.2 1.1 16.1
10 Eluate 8 1.3 1.5 1.7 8.8
Elution was performed with 0.01 M Nitric Acid
The data in Table I also indicate that a substantial portion of the uranium was still eluting even after addition
of 30 mL of eluant. In the 10 mL fraction following the 30 mL eluant addition, all four acid concentrations
of the loading solution showed greater than 1 pg eluting. The elution losses versus the acid concentrationfollow the opposite trend of load and wash losses. As the acid concentration of the loading solution was
lowered, tailing during elution decreased. Apparently the higher acid concentration resulted in better
retention of uranium during the loading and washing stages, but the uranium was retained to a greater
extent during the elution stage and this resulted in significant tailing of the uranium. Based on the combined
losses during loading, washing and elution, the maximum achievable recovery of uranium was 98% for the
2.5 M HNO 3 experiment. Further experimentation therefore employed 2.5 M HNO 3 for loading and washing.
Because of the significant tailing in the elution stage, the elution characteristics of uranium on U/TEVA were
examined using an eluant of 0.1 M ammonium bioxalate buffer.17 The bioxalate acts to complex uranium
and assist in elution, therefore providing greater recoveries. All other experimental conditions were the same
as noted above, with the exception that sample loading and washing utilized a 2.5 M HNO 3 solution only.
Results are displayed In Table II.
8
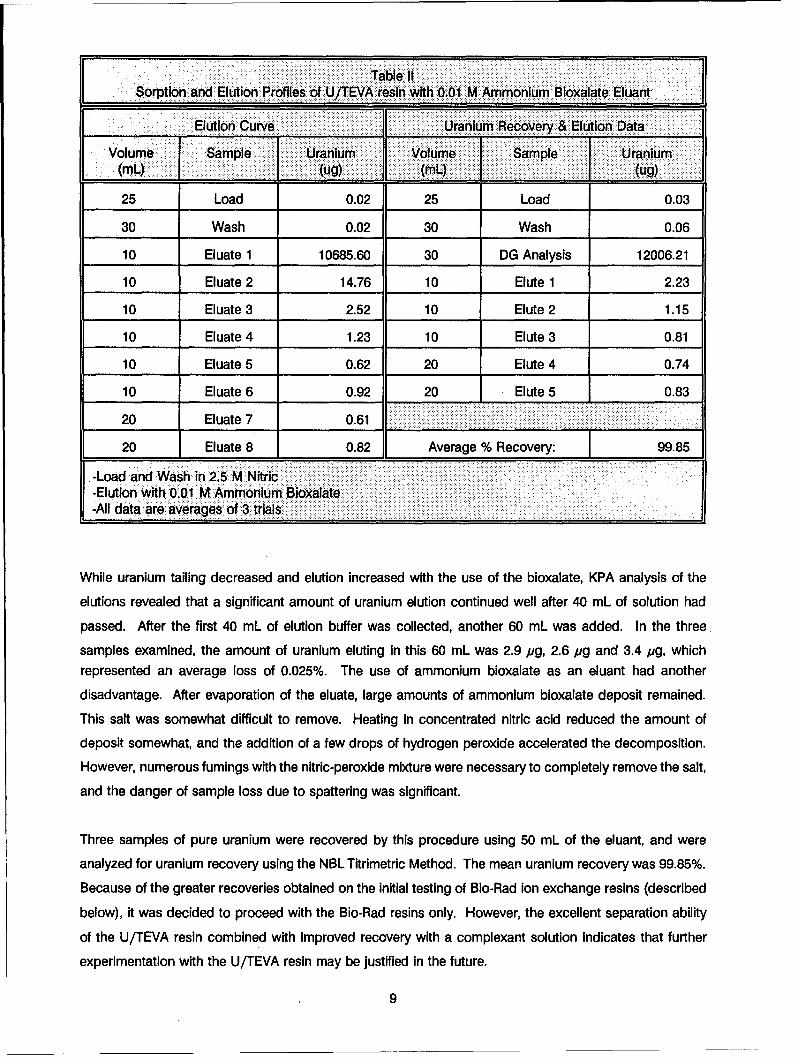
Table 11
Sorption and Elution Profiles of U/TEVA resin with 0.01 M Ammonium Bioxalate EluantElution Curve Uranium Recovery & Elution Data]
Volume Sample { Uranium Volume Sample Uranium__ __ __ _ (4g)__ __ _ __ _ __ _ (mL.) _ _ _ _ _ __(ug)
25 Load 0.02 25 Load 0.03
30 Wash 0.02 30 Wash 0.06
10 Eluate 1 10685.60 30 DG Analysis 12006.21
10 Eluate 2 14.76 10 Elute 1 2.23
10 Eluate 3 2.52 10 Elute 2 1.15
10 Eluate 4 1.23 10 Elute 3 0.81
10 Eluate 5 0.62 20 Elute 4 0.74
10 Eluate 6 0.92 20 Elute 5 0.83
20 Eluate 7 0.61
20 Eluate 8 0.82 Average % Recovery: 99.85
-Load and Wash in 2.5 M Nitric-Elution with 0.01 M Ammonium Bioxalate-All data are averages of 3 trials
While uranium tailing decreased and elution increased with the use of the bioxalate, KPA analysis of the
elutions revealed that a significant amount of uranium elution continued well after 40 mL of solution had
passed. After the first 40 mL of elution buffer was collected, another 60 mL was added. In the three
samples examined, the amount of uranium eluting in this 60 mL was 2.9 pg, 2.6 pg and 3.4 jig, whichrepresented an average loss of 0.025%. The use of ammonium bioxalate as an eluant had another
disadvantage. After evaporation of the eluate, large amounts of ammonium bioxalate deposit remained.
This salt was somewhat difficult to remove. Heating in concentrated nitric acid reduced the amount of
deposit somewhat, and the addition of a few drops of hydrogen peroxide accelerated the decomposition.
However, numerous fumings with the nitric-peroxide mixture were necessary to completely remove the salt,
and the danger of sample loss due to spattering was significant.
Three samples of pure uranium were recovered by this procedure using 50 mL of the eluant, and were
analyzed for uranium recovery using the NBL Titrimetric Method. The mean uranium recovery was 99.85%.
Because of the greater recoveries obtained on the initial testing of Bio-Rad ion exchange resins (described
below), it was decided to proceed with the Bio-Rad resins only. However, the excellent separation ability
of the U/TEVA resin combined with improved recovery with a complexant solution indicates that further
experimentation with the U/TEVA resin may be justified in the future.
9
Sorption and Elutlon Profiles of Pure Uranium Solutions with Bio-Rad Resins
The performances of four Bio-Rad resins, AG 1-X2, 1-X4, 1-X8 and MP-1, were tested with pure uranium.
This allowed an initial comparison of the capabilities of the resins prior to method optimization. Experiments
were done in triplicate and repeated to confirm the results. Samples containing 12 mg of uranium were
dissolved in 15 mL of 8 M HCl, and the solutions were transferred to preconditioned columns. An additional
10 mL of acid was used to rinse the beaker, and the wash solutions were transferred to the column. The
25 mL of solution used to load the sample was collected. The columns were successively washed three
times (20 mL, 10 mL, and 10 mL aliquots) with 8 M HCI and the wash fractions were collected separately.
Uranium was then eluted with varying portions (initially with 2 mL and 3 mL aliquots, then five 5 mL aliquots,
and finally two 5 mL allquots were combined to give a 10 mL portion and thus a total of 40 mL of eluant)
of 1 M HCI. These eluate fractions were individually collected. All the collected load, wash and eluate
fractions were evaporated, fumed twice in concentrated nitric acid, and assayed for uranium using the KPA
technique.
Table III gives the sorption and elution behavior of the four resins. When the sample was transferred onto
the resin, a pale yellow-colored region was observed at the top of the resin bed. With the AG 1 -X2 resin,
the KPA data Indicated that uranium was lost in both the load and the wash fractions. This was visually
observable as the broad, pale yellow band became diffuse and moved down the column. An average of
over 30% of the uranium was lost In the load and wash solutions for this resin. The other three resins
performed significantly better, with cumulative losses during the 25 mL load and 40 mL wash being less than
5 pg U. While the majority of the uranium was desorbed in the first 20 mL of eluant, there was some tailing
evident in later eluate fractions. Based on these results, the AG 1-X2 resin was eliminated from the study.
Recovery of Pure Uranium with Bio-Rad Resins
Testing was performed on the recovery of uranium on Bio-Rad AG 1 -X4, 1 -X8 and MP-1 resins using the NBL
Titrimetric Method to quantify the recovery of the uranium in the eluate. The method described above, using
8 M HCI with minor modifications (described below), was tested on all four resins. An additional wash step
with 5 M HCI was also Introduced for testing on each resin. The purpose of this step was to remove several
metal ions (Zr, Hf, Cu, Co for example) that have low, yet measurable, distribution ratios In 8 M HCl. It was
not certain whether separation of these impurities from uranium would be possible using only 8 M HCI
washes. Using 5 M HCI washes, these elements should be readily removed from the resin. However, there
was also the possibility of losing uranium, since Uranium has a distribution ratio in 5 M HCI of about 300
compared to approximately 800 in 8 M HCl.
10
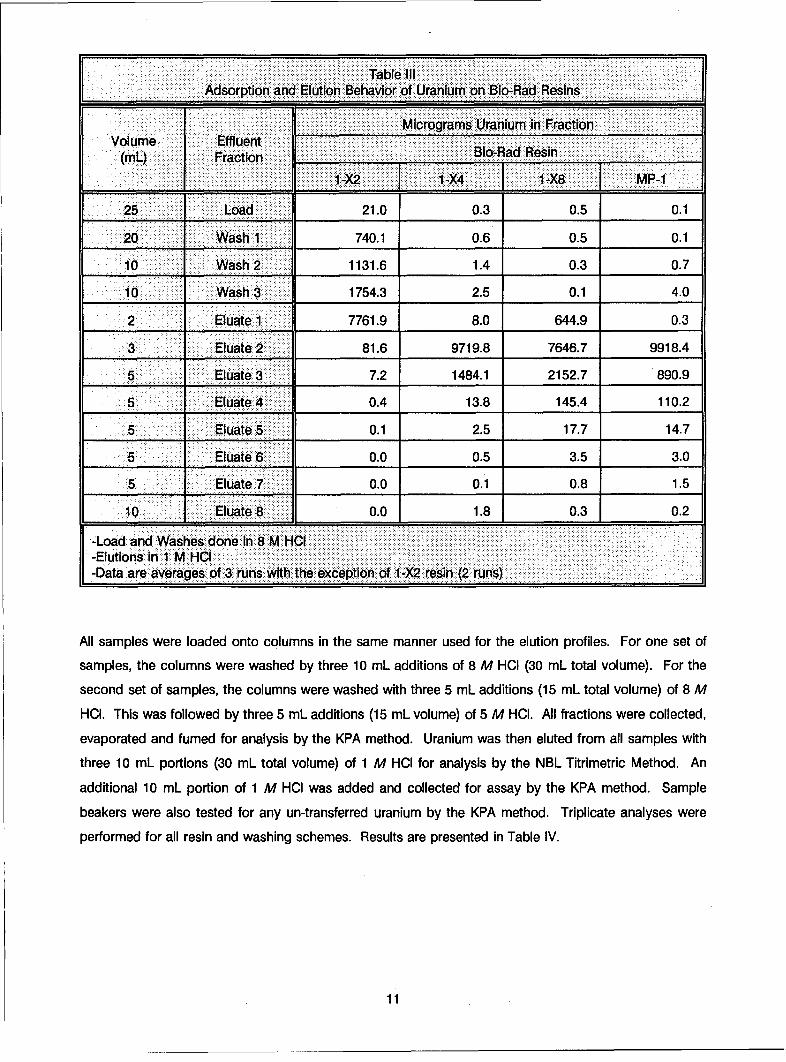
Table IIlAdsorption and Elution Behavior of Uranium on Blo-Rad ResinsI
Micrograms Uranium in FractionVolume Effluent
(ML) Fraction Blo-Rad Resin
.1-X2 IT1-X4 1-X8 _F MP-1
25 Load 21.0 0.3 0.5 0.1
20 Wash 1 740.1 0.6 0.5 0.1
10 Wash 2 1131.6 1.4 0.3 0.7
10 Wash 3 1754.3 2.5 0.1 4.0
2 Eluate 1 7761.9 8.0 644.9 0.3
3 Eluate 2 81.6 9719.8 7646.7 9918.4
5 Eliuate 3 7.2 1484.1 2152.7 890.9
5 Eluate 4 0.4 13.8 145.4 110.2
5 Eluate 5 0.1 2.5 17.7 14.7
5 Eluate 6 0.0 0.5 3.5 3.0
5 Eluate 7 0.0 0.1 0.8 1.5
10 Eluate 8 0.0 11.8 0.3 0.2
-Load and Washes done In 8 M HCl-Elutions in 1 M HCI-Data are averages of 3 runs with the exception of I -X2 resin (2 runs)
All samples were loaded onto columns in the same manner used for the elution profiles. For one set of
samples, the columns were washed by three 10 mL additions of 8 M HCI (30 mL total volume). For the
second set of samples, the columns were washed with three 5 mL additions (15 mL total volume) of 8 M
HCI. This was followed by three 5 mL additions (15 mL volume) of 5 M HCI. All fractions were collected,
evaporated and fumed for analysis by the KPA method. Uranium was then eluted from all samples with
three 10 mL portions (30 mL total volume) of 1 M HCI for analysis by the NBL Titrimetric Method. An
additional 10 mL portion of 1 M HCI was added and collected for assay by the KPA method. Sample
beakers were also tested for any un-transferred uranium by the KPA method. Triplicate analyses were
performed for all resin and washing schemes. Results are presented in Table IV.
11
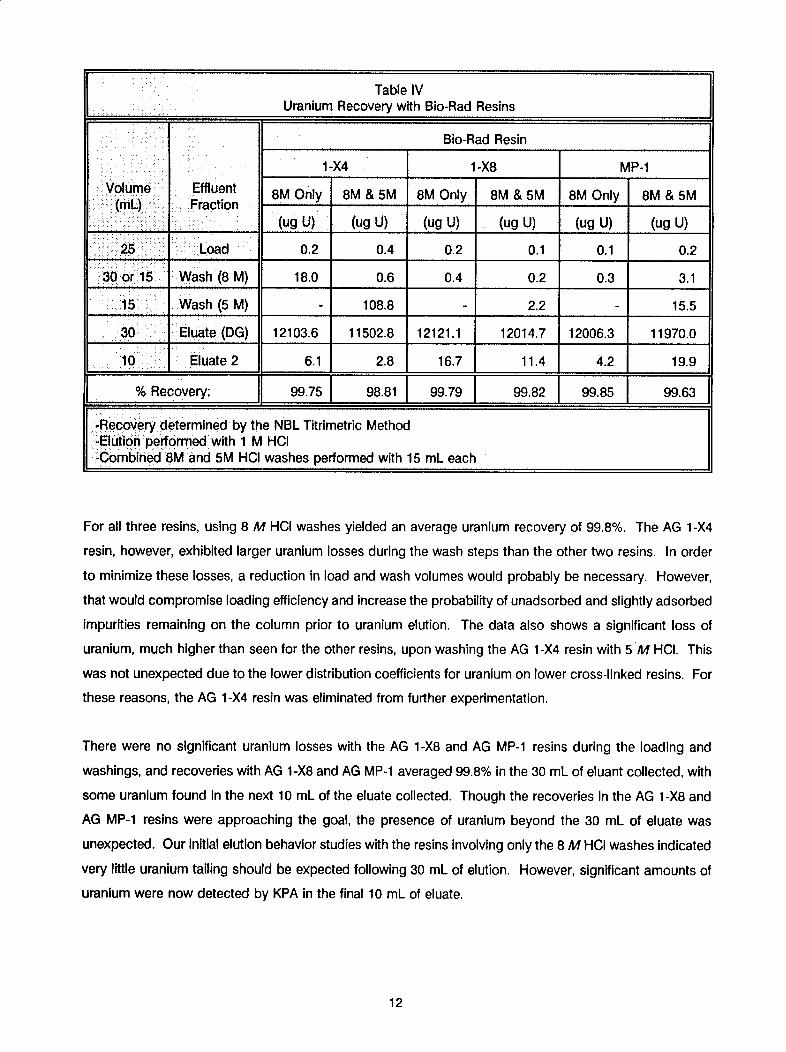
Table IVUranium Recovery with Bio-Rad Resins
Bio-Rad Resin
1... A_1-X4 1-X8 MP-1
Volume Effluent(ml) Fraction 8M Only 8M & 5M 8M Only 8M & 5M 8M Only 8M & 5M• L . ... actuiU)n____________ (ug U) (ug U) (ug U) (ug U) (ug U) (ug U)
25 Load 0.2 0.4 0.2 0.1 0.1 0.2
30 or 15 Wash (8 M) 18.0 0.6 0.4 0.2 0.3 3.1
15 Wash (5 M) - 108.8 2.2 15.5
30 Eluate (DG) 12103.6 11502.8 12121.1 12014.7 12006.3 11970.0
10 Eluate 2 6.1 2.8 16.7 11.4 4.2 19.9
% Recovery: 99.75 98.81 99.79 99.82 99.85 99.63
S-Recovery determined by the NBL Titrimetric Method-Elution performed with 1 M HCI-Combined 8M and 5M HCI washes performed with 15 mL each
For all three resins, using 8 M HCt washes yielded an average uranium recovery of 99.8%. The AG 1-X4
resin, however, exhibited larger uranium losses during the wash steps than the other two resins. In order
to minimize these losses, a reduction in load and wash volumes would probably be necessary. However,
that would compromise loading efficiency and increase the probability of unadsorbed and slightly adsorbed
impurities remaining on the column prior to uranium elution. The data also shows a significant loss of
uranium, much higher than seen for the other resins, upon washing the AG 1 -X4 resin with 5 M HCl. This
was not unexpected due to the lower distribution coefficients for uranium on lower cross-linked resins. For
these reasons, the AG 1-X4 resin was eliminated from further experimentation.
There were no significant uranium losses with the AG 1-X8 and AG MP-1 resins during the loading and
washings, and recoveries with AG 1 -X8 and AG MP-1 averaged 99.8% in the 30 mL of eluant collected, with
some uranium found In the next 10 mL of the eluate collected. Though the recoveries In the AG 1-X8 and
AG MP-1 resins were approaching the goal, the presence of uranium beyond the 30 mL of eluate was
unexpected. Our initial elution behavior studies with the resins involving only the 8 M HCI washes Indicated
very little uranium tailing should be expected following 30 mL of elution. However, significant amounts of
uranium were now detected by KPA in the final 10 mL of eluate.
12
One significant difference in the elution behavior studies and the uranium recovery experiments involved the
addition of the eluant. During elution behavior studies, eluant was added in 5 mL portions or less. For the
uranium recovery test, eluant was added in 10 mL portions. While the total amount of eluant used was the
same, it was speculated that adding more aliquots of smaller volumes improved the overall exchange
kinetics, thus minimizing tailing of the uranium.
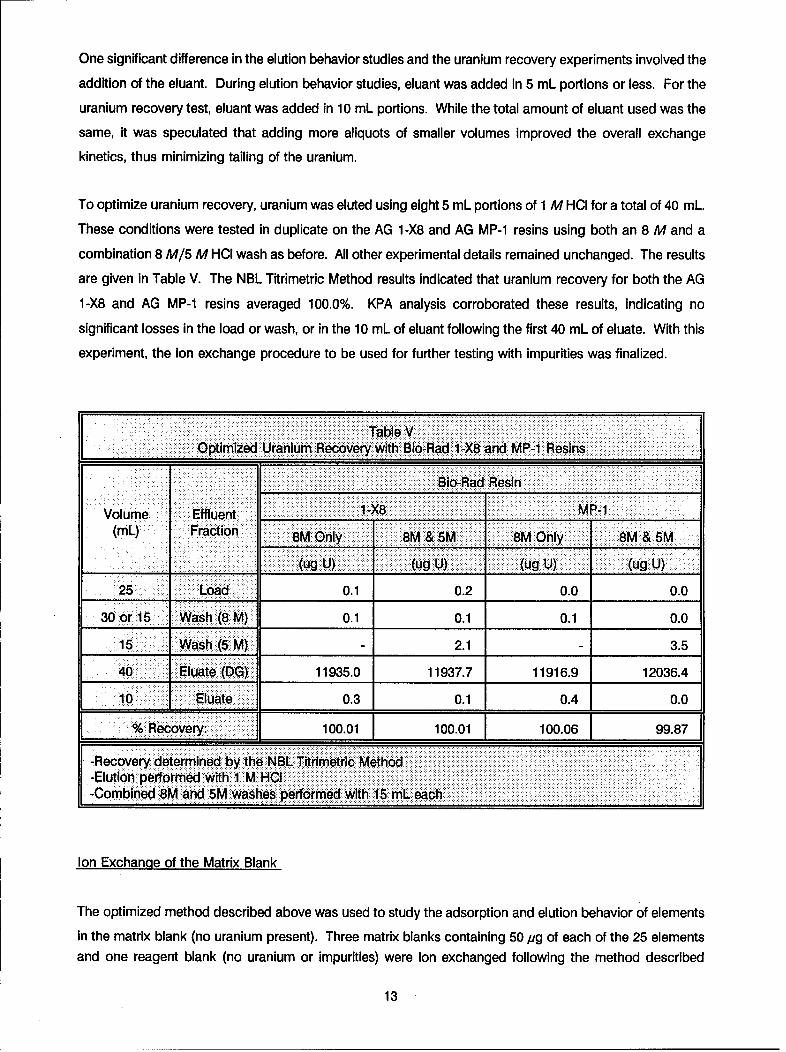
To optimize uranium recovery, uranium was eluted using eight 5 mL portions of 1 M HCI for a total of 40 mL.
These conditions were tested in duplicate on the AG 1-X8 and AG MP-1 resins using both an 8 M and a
combination 8 M15 M HCI wash as before. All other experimental details remained unchanged. The results
are given in Table V. The NBL Titrimetric Method results indicated that uranium recovery for both the AG
1-X8 and AG MP-1 resins averaged 100.0%. KPA analysis corroborated these results, indicating no
significant losses in the load or wash, or in the 10 mL of eluant following the first 40 mL of eluate. With this
experiment, the ion exchange procedure to be used for further testing with impurities was finalized.
Table VI Optimized Uranium Recovery with Blo-Rad I-X8 and MP-1 Resi
Blo-Rad Resin
Volume Effluent 1 X8 MP-1
(ML) Fraction 8M Only 8M & SM 8M Only 8M & 5M
(ug U) (ug U) (ug U) (ug U)
25 Load 0.1 0.2 0.0 0.0
30 or 15 Wash (8 M) 0.1 0.1 0.1 0.0
15 Wash (S M) 2.1 -3.5
40 Eluate (DG) 11935.0 11937.7 11916.9 12036.4
10 Eluate 0.3 0.1 0.4 0.0
% Recovery: 100.01 100.01 100.06 99.87
S-Recovery determined by the NBL Titrimetric Metho-Elution performed with 1 M HC.-Combined 8M and.5M washes performed with 15 mL each
Ion Exchange of the Matrix Blank
The optimized method described above was used to study the adsorption and elution behavior of elements
in the matrix blank (no uranium present). Three matrix blanks containing 50 pg of each of the 25 elementsand one reagent blank (no uranium or impurities) were ion exchanged following the method described
13
above. The Ag and Mo Impurities were removed from the original list of 27 elements due to the
incompatibility of their standard solutions with the other impurities. A reagent blank was run with the matrix
blanks to take Into account any contributions from the reagents and/or any contamination. From each
procedure, five portions were collected: the load, the 8 M HCI wash, the 5 M HCI wash, the 1 M HCI eluate
and a 1 M HCI wash of the empty sample beaker. The first four portions were analyzed by x-ray
fluorescence spectrometry. The 1 M HCI wash of each empty sample beaker was analyzed for trace
uranium by the KPA method.
Results obtained on the ion exchange of matrix blanks are given in Table VI. The results of only 22 elements
are given In this table. Sb, Sn and Cd are not included for reasons explained below. All of the theoretically
predicted non-complexing metal ions (alkali, alkaline earth, Ni, Pb, Mn) were eluted in the load solutions.
Though the results were difficult to interpret, it appears that aluminum was also removed in the loading step
as expected. It was uncertain whether elements with low but appreciable distribution coefficients, such as
Cu(ii), Ti, Zr, Co and V(V), would be removed from the resin with 8 M HCI. However, from the 8 M HCI load
results, it appears that Ti, Zr, V(V), and most of the Cu were removed in the 8 M HCI washes, and only Co
eluted in the 5 M HCI wash step.
The 1 M HCI eluate contained predominately Fe, as expected. While Sb was also expected to elute with
uranium, it was difficult to measure Sb (as well as Sn and Cd) with any certainty due to the proximity of their
primary lines with the Re lines resulting from the Re filament of the instrument's x-ray tube. The elements
Bi, Zn, Cd, Ta and Sn that were expected to adhere strongly to the resin at 1 M HCI did not appear In any
effluent and therefore are assumed to remain adsorbed to the resin bed. It became clear with these results
that 5 M HCI washes were not necessary since most of the metal impurities, with the exception of Co, can
be separated from uranium with 8 M HCI sample adsorption solution and 1 M HCI elution solution.
Ion Exchan-ge of Spiked Uranium Samples
The optimized method was tested on 12 mg uranium samples spiked with approximately 50 pg of each of
the 25 elements in order to determine how the method performed on impure samples. Both the AG 1-X8
and MP-1 resins were tested in duplicate with 8 M HCI washes only and sequential 8 M HCI and 5 M HCI
washes. The load and washes were analyzed by x-ray fluorescence for the impurities to confirm the
behavior of these elements in the presence of uranium, and the eluate was tested for uranium recovery by
the NBL Titrimetric Method. A 1 M HCI wash of each empty sample beaker was analyzed for trace uranium
by the KPA method.
14
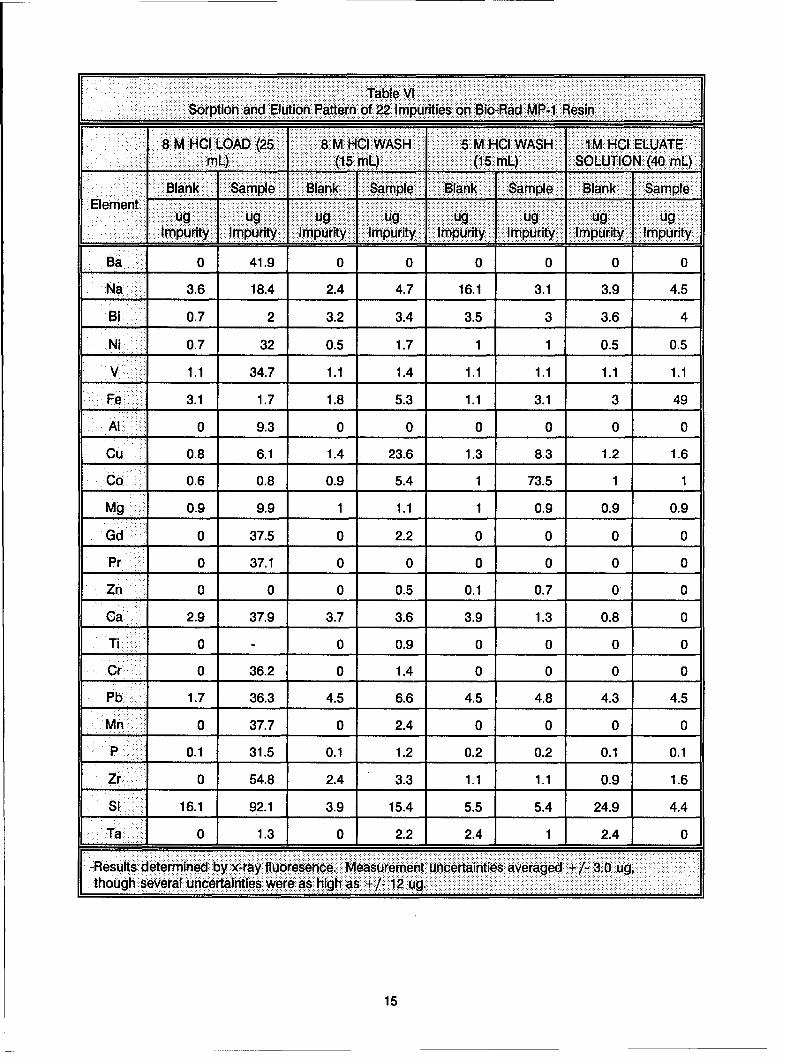
Table VI_______Sorption and Elution Pattern of 22 Impurities on Bio-Rad MR-i Resin
8___ BMHCI LOAD (25 8 M HCI WASH 5 M HCI WASH 1M HCI ELUATEmL) (15 mL) (15 mL) SOLUTION (40 mL)
Bln _ _pl _ _ank Sample Blank ISample Blank ISampleElement111I
=g j ug ug ug ug ug ugImpurity Impurity Impurity Impurity Impurity Impurity Impurity Impurity
Ba 0 41.9 0 0 0 0 0 0
Na 3.6 18.4 2.4 4.7 16.1 3.1 3.9 4.5
'Bi__ 0.7 2 3.2 3.4 3.5 3 3.6 4
Ni 0.7 32 0.5 1.7 1 1 0.5 0.5
V 1.1 34.7 1.1 1.4 1.1 1.1 1.1 1.1
Fe 3.1 1.7 1.8 5.3 1.1 3.1 3 49
'Al 0 9.3 0 0 0 0 0 0
Cu 0.8 6.1 1.4 23.6 1.3 8.3 1.2 1.6
Co 0.6 0.8 0.9 5.4 1 73.5 1 1
Mg 0.9 9.9 1 1.1 1 0.9 0.9 0.9
Gd 0 37.5 0 2.2 0 0 0 0
Pr 0 37.1 0 0 0 0 0 0
Zn 0 0 0 0.5 0.1 0.7 0 0
Ca 2.9 37.9 3.7 3.6 3.9 1.3 0.8 0
Ti 0 - 0 0.9 0 0 0 0
Cr 0 36.2 0 1.4 0 0 0 0
Pb 1.7 36.3 4.5 6.6 4.5 4.8 4.3 4.5
Mn 0 37.7 0 2.4 0 0 0 0
P 0.1 31.5 0.1 1.2 0.2 0.2 0.1 0.1
Zr 0 54.8 2.4 3.3 1.1 1.1 0.9 1.6
Si16.1 92.1 3.9 15.4 5.5 5.4 24.9 4.4
Ta0 1.3 0 1 2.2 1 2.4 1 2.4 1 0F-Results determined by x-ray fluoresence. Measurement uncertainties averaged + ~-3.0 ug,
though several uncertainties were as high as + /- 12 ug.
15
The results from the analysis of the impurities showed no changes from those obtained with the matrix
blank. The elements were eluted or retained, as before. However, uranium recoveries were found to vary
from 99.5% to 99.9%, with an average recovery of 99.8%. To investigate this loss of uranium, the load and
wash solutions were checked qualitatively for uranium by x-ray fluorescence spectrometry. In some cases
uranium was detected in load fractions and/or the corresponding wash fractions. Two possible causes for
the loss were Identified: an overload of the capacity of the column, or the presence of an Interfering matrix
element or elements. Since the total amount of sample loaded, uranium and impurities, does not exceed
10% of the column capacity, it appeared that one or more of the Impurities present was causing the
breakthrough of uranium.
The role of the Impurities on the uranium loss was Investigated. The elements that are known to form
complexes or interfere with uranium were identified. These elements Included P, Si, and F. The F was not
specifically added to the uranium spike solutions, but some of the metal impurities were stabilized in solution
as fluoride complexes. In addition, Sb, Fe, and Co were tested for interference with uranium recovery.
Antimony was selected because it was added as a tartrate solution, and tartrate may complex uranium. Iron
and Co (among others) are adsorbed onto the resin along with uranium and thus reduce the number of resin
sites available for uranium adsorption.
The method was tested for recovery on samples containing 12 mg uranium mixed with selected impurities,
each at the 50 pg level (unless impurity level is stated otherwise). All tests were done in duplicate.Description of samples ion exchanged and tested for uranium recovery are as follows: uranium and added
P; uranium and added Si; uranium and added Na; uranium and added Sb (with tartrate); uranium and all
impurities except P; uranium and all impurities except P and Si; uranium and all impurities except P, Si, Ti,
Sn, Ta, Zr (no F present); uranium and Sb (with tartrate); uranium and all impurities but Sb (and tartrate);
uranium and all impurities but Co and Sb (and tartrate); uranium and all added impurities at the 15 pg leveleach; and finally uranium and all added impurities at the 30 pg level each. The results of these experimentsare found in Table VII.
Uranium recoveries from samples with P and Si individually show 100.0% recovery. The results of samples
with uranium and all impurities except for P, Si, Ti, Sn, Ta, Zr (no F present) was 99.8%. Therefore P, Si and
F were ruled out as the cause of uranium losses.
The results of uranium with impurities minus Sb (with tartrate), and uranium with impurities minus Sb (and
tartrate), Fe and Co resulted in 100.0% recovery. Based on this result, Sb (with tartrate) was initially
suspected to cause uranium losses. However, uranium recovery with uranium plus Sb (with tartrate) was
100.0%. Samples of uranium with all impurities (including Sb with tartrate) at the 15 pg and 30 pg levels eachresulted in 100.0% recoveries. While it was not shown that Sb (with tartrate) was the cause of the uranium
loss, It was removed from the study due to the uncertainty of the effect of tartrate on the ion exchange
16
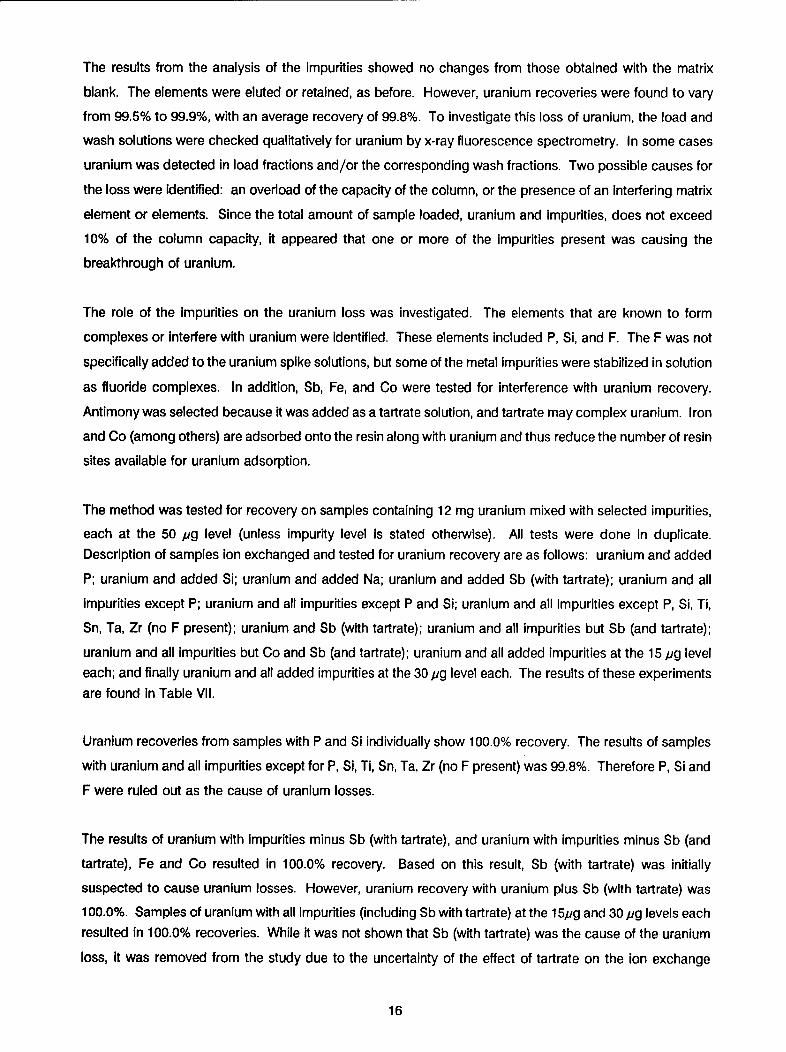
behavior of both uranium and antimony. In order to test the method's ability to handle greater impurity
levels, spiked 12 mg uranium samples were tested in triplicate at the 50 pg, 100 pg and 200 pg level eachwith 24 impurities (no Sb with tartrate). The results, shown in Table VII, indicate 99.98% uranium recoveries.
Table VI I. ...
_Uranium Recovery..f Spiked Samples
Sample Description Resin % U Recovery
U + Imp Group A 1-X8 99.85
U + Imp Group A; 8M & 5M HCI Wash 1-X8 99.70
U + Imp Group A MP-1 99.88
U + Imp Group A; 8M & 5M HCI Wash MP-1 99.82
U + P 1-X8 100.02
U + Si 1-X8 100.09
U + Imp Group A - P 1-X8 99.88
U + Imp Group A - P - Si 1-X8 99.85
U + Imp Group B - P - Si - F 1-X8 99.82
U + Sb 1-X8 99.98
U + Imp Group A - Sb 1-X8 99.99
U + Imp Group A - Sb - Co - Fe 1-X8 100.02
U + Imp Group A (15 ug each) 1-X8 100.01
U + Imp Group A (30 ug each) 1-X8 100.02
Optimized Method (no Sb)
U + Imp Group A - Sb (50 ug each) 1-X8 99.98
U + Imp Group A - Sb (100 ug each) 1-X8 99.98
U + Imp Group A - Sb (200 ug each) 1-X8 99.97
-..U + Imp" is uranium with all impurities added- Recoveries determined by the NBL Modif ied Titrimetric Method- Imp Group A is Ba, Na, 81, NI, V, Fe, Al, Cu, Co, Mg, Gd. Pr, Zn,
Ca, Ti, Cr, Pb, Mn, P, Zr, Si, Ta, Sn, Sb, Gd.Imp Group B is Imp Group A minus Ti, $ri, Ta and Zr (no F present)
17
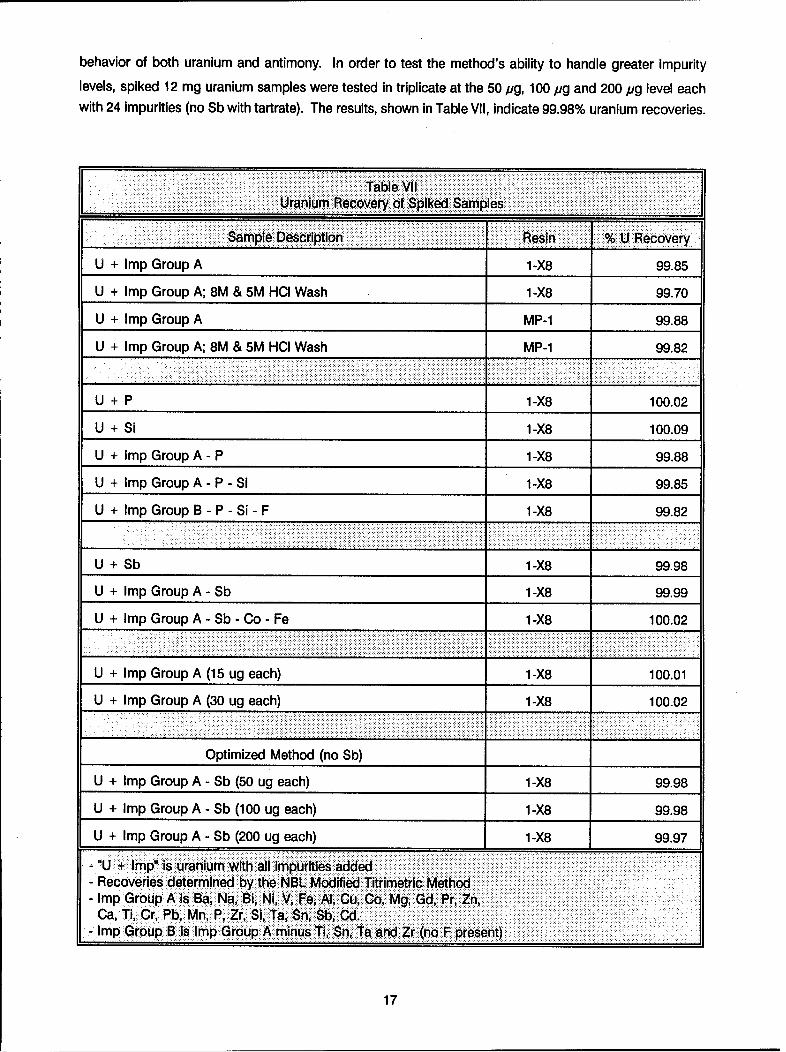
Uranium Breakthrough and Recovery
The Bio-Rad AG 1-X8 and AG MP-1 resins were tested for uranium breakthrough and uranium recovery on
5 mg, 10 mg, 15 mg, 20 mg and 25 mg size uranium samples. The method involving the 5 M HCI washes
was eliminated from further testing since it added little additional selectivity.
For uranium breakthrough tests, samples were transferred with 25 mL of 8 M HCI and successively washed
with 20 mL of 8 M HCI until at least 160 mL of the acid was added to the column. The fractions were
collected, dried, fumed twice with concentrated nitric acid and then the uranium analyzed by KPA.
For uranium recovery tests, samples were transferred with 25 mL of 8 M HCI, washed with four 5 mL
portions of 8 M HCI, and eluted with eight 5 mL portions of 1 M HCI. The three effluents were evaporated
and fumed twice with concentrated nitric acid. The load and wash samples were analyzed by KPA to check
for uranium losses and the eluate was analyzed by the NBL Titrimetric Method for uranium recoveries.
The results, shown In Table VIII, for similar sample sizes indicate that there is more uranium breakthrough
with the AG MP-1 resin than the AG 1-X8 resin for similar size samples. The total amount of all uranium In
the 160 mL washes was found to be as high as 15 pg on the 5 mg and 10 mg samples. In comparison theactual losses with higher size samples did not exceed 5 pg uranium. How the difference in sample sizesaffects uranium breakthrough is not clear; however, the differences In AG 1 -X8 and AG MP-1 behavior can
be explained on the basis of resin fines present in AG MP-1, which may be responsible for uranium
breakthrough. The overall results indicate that the losses (< 0.02%) are minimal for the amounts of acid
(< 50 mL) used for the ion exchange of actual samples.
Statistical Testing
In order to obtain a more valid determination of the total uranium recovery from the ion exchange method
described in this report and to validate this method, a statistical plan was designed. Two resins, Bio-Rad
AG 1 -X8 and AG MP-1, were tested using the 8 M HCI wash only. The U/TEVA method was not tested at
this time since the initial recovery data did not achieve our goal of greater than 99.9% uranium recovery.
Samples were loaded with 25 mL of 8 M HCI, washed with 20 mL of 8 M HCl, and eluted with 40 mL of
1 M HCI. Samples were aliquanted into glass and Teflon beakers. The samples Ion exchanged were:
reagent blanks, 50 pg each of 24 impurity elements as matrix blanks, 12 mg uranium, and 12 mg uraniumspiked with 50 pg each of 24 impurity elements.
The 24 Impurity elements used in this statistical plan were Ba, Na, Bi, Ni, V, Fe, Al, Cu, Co, Mg, Gd, Pr, Zn,
Ca, Ti, Cr, Pb, Mn, P, Zr, Si, Ta, Sn, and Cd.
18
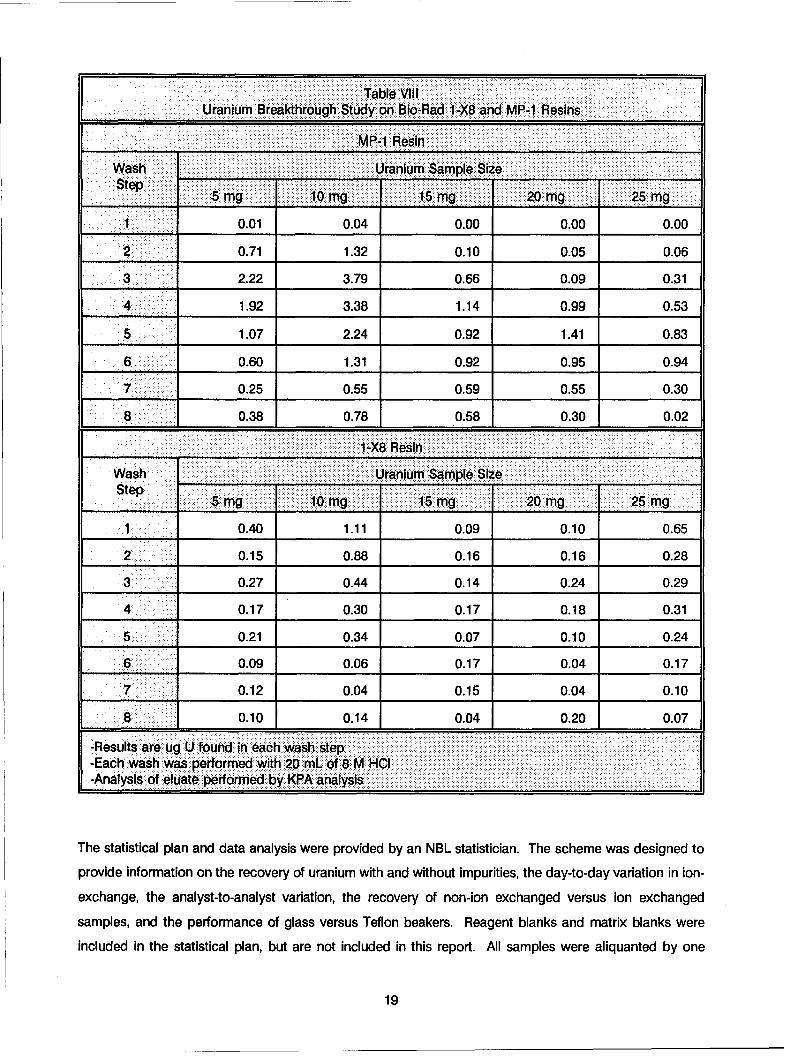
Table VillUranium Breakthrough Study on Bio-Raci 1-X8 and MP-1 Resins
F == MP-1 Resin
Wash ______Uranium Sample SizeStp5mg 10 mg 15 mg 20 mg 25 mg
1 0.01 0.04 0.00 0.00 0.00
2 0.71 1.32 0.10 0.05 0.06
3 2.22 3.79 0.66 0.09 0.31
4 1.92 3.38 1.14 0.99 0.53
5 1.07 2.24 0.92 1.41 0.83
6 0.60 1.31 0.92 0.95 0.94
70.25 0.55 0.59 0.55 0.30
8 0.38 0.78 0.58 0.30 0.02
1 -X8 Resin_________ _____
Wash ... . .......... Uranium Sample Size ,..Step 5 mg: :::: mg:15 m:g :=========:==.....20 mig 25 mg
1 0.40 1.11 0.09 0.10 0.65
2 0.15 0.88 0.16 0.16 0.28
3 0.27 0.44 0.14 0.24 0.29
4 0.17 0.30 0.17 0.18 0.31
5 0.21 0.34 0.07 0.10 0.24
6 0.09 0.06 0.17 0.04 0.17
7 0.12 0.04 0.15 0.04 0.10
8 0.10 0.14 0.04 0.20 0.07
-Results are ug U found in each wash step-Each wash was performed with 20 mL of 8 M HCI-Analysis of eluate performed by KPA analysis
The statistical plan and data analysis were provided by an NBL statistician. The scheme was designed to
provide information on the recovery of uranium with and without impurities, the day-to-day variation in ion-
exchange, the analyst-to-analyst variation, the recovery of non-ion exchanged versus ion exchanged
samples, and the performance of glass versus Teflon beakers. Reagent blanks and matrix blanks wereincluded in the statistical plan, but are not included in this report. All samples were aliquanted by one
19
analyst, and all NBL Titrimetric Method titrations were performed by one analyst. The ion exchange
procedure was performed by two analysts, each processing 10 samples each day for 4 days.
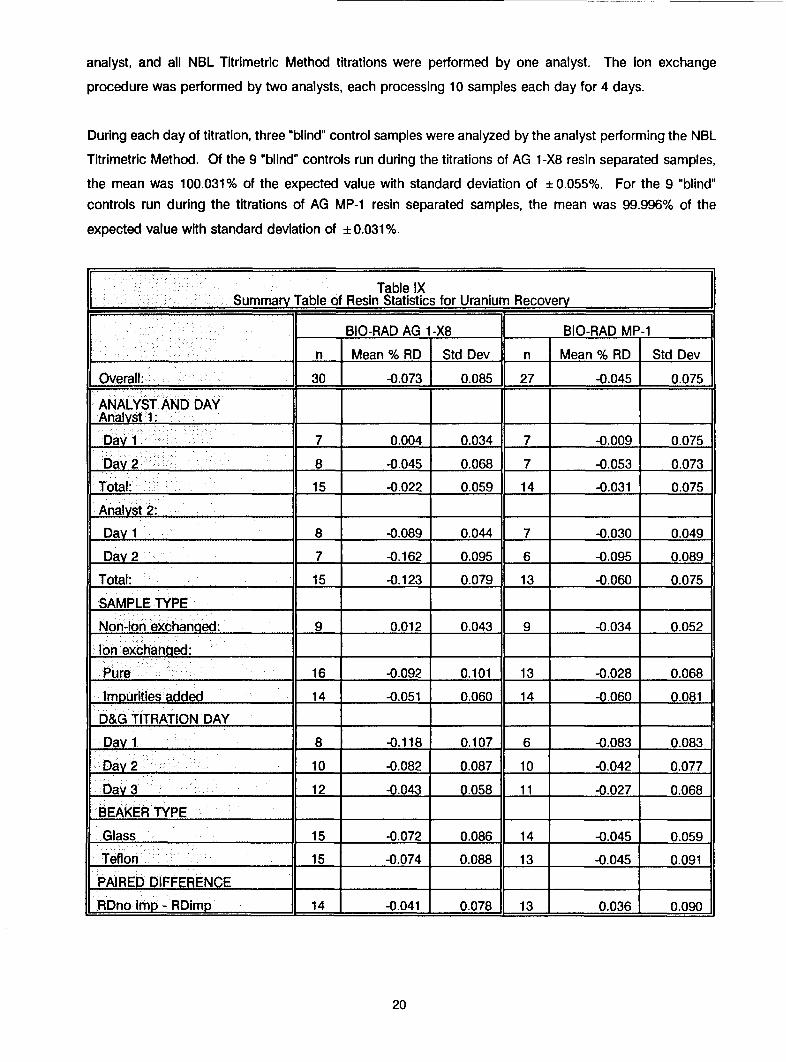
During each day of titration, three "blind" control samples were analyzed by the analyst performing the NBL
Titrimetric Method. Of the 9 "blind" controls run during the titrations of AG 1-X8 resin separated samples,
the mean was 100.031% of the expected value with standard deviation of ± 0.055%. For the 9 "blind"
controls run during the titrations of AG MP-1 resin separated samples, the mean was 99.996% of the
expected value with standard deviation of + 0.031%.
Table IXSummary Table of Resin Statistics for Uranium Recovery
BIO-RAD AG 1-X8 BIO-RAD MP-1
_ "______. ______ n Mean % RD Std Dev n Mean % RD Std Dev
Overall: 30 -0.0731 0.085 27 -0.045 0.075
ANALYST AND DAYAnalyst 1: 1
Day 1 7 0.004 0.034 7 -0.009 0.075
Day 2 8 -0.045 0.068 7 -0.053 0.073
Total: 15 -0.022 0.059 14 -0.031 0.075
Analyst 2: ,, _
Day 1 8 -0.089 0.044 7 -0.030 0.049
Day 2 7 -0.162 0.095 6 -0.095 0.089
Total: 15 -0.123 0.079 13 -0.060 0.075
SAMPLE TYPE
Non-Ion exchanged: 9 0.012 0.043 9 -0.034 0.052
Ion exchanged: :
Pure 16 -0.092 0.101 13 -0.028 0.068
Impurities added 14 -0.051 0.060 14 -0.060 0.081
D&G TITRATION DAY
Day 1 8 -0.118 0.107 6 -0.083 0.083
Day 2 10 -0.082 0.087 10 -0.042 0.077
Day 3 12 -0.043 0.058 11 -0.027 0.068
BEAKER TYPE
Glass 15 -0.072 0.086 14 -0.045 0.059
Teflon 15 -0.074 0.088 13 -0.045 0.091
PAIRED D IFFERENCERDno imp - RDimp 14 -0.041 0.078 13 0.036 0.090
20
Results from the statistical analysis of the data are summarized in Table IX. Both resins exhibited similar
recoveries and standard deviations for samples spiked with impurities. The mean recovery for samples
separated by the AG 1 -X8 resin was 99.95%, and for samples separated by the AG MP-1 resin it was 99.94%.
Standard deviations for the two were ± 0.060% and ± 0.081%, respectively. There were some differences
in the recoveries of the samples containing only pure uranium. The mean recovery of samples separated
by the AG 1 -X8 resin was 99.91%, and for samples separated by the AG MP-1 resin it was 99.97%. The
standard deviations also differed somewhat and were ± 0.101% and ± 0.068%, respectively. The meanrecovery of uranium samples (not ion exchanged) assayed with the AG 1-X8 ion exchanged samples was
100.01%, and for uranium samples (not ion exchanged) assayed with the AG MP-1 ion exchanged samples
it was 99.97%. The standard deviations for these samples were very similar and were ± 0.043% and± 0.052%, respectively.
There was no significant day-to-day titration variation observed, and no difference was observed between
samples ion exchanged using glass or teflon beakers. However, there were analyst-to-analyst and ion-
exchange day-to-day differences observed. Considering the overall statistical outcome it can be stated that
the separation method utilizing either AG 1 -X8 or AG MP-1 resin will yield in greater than 99.9% recovery
with standard deviations of less than ± 0.1%.
CONCLUSIONS
This study has shown that quantitative recovery (>99.9%+) of uranium in the presence of numerous
impurities can be achieved using the anion exchange procedure outlined above. Both Bio-Rad AG 1 -X8 and
AG MP-1 resins are capable of achieving the desired recovery while providing separation from the impurities.
Future work will concentrate on further improving the recovery and precision of the method, along with
determining the uranium sample size range applicable to the method. In addition, quantification of the
impurities present in the loads and washes, along with any trace impurities present in the uranium eluate
fraction, will be performed using an ICP-AES method.
REFERENCES
1. J. Korkisch, "Handbook of Ion Exchange Resins: Their Application to Inorganic AnalyticalChemistry," Volume I and II, CRC Press, Boca Raton, FL, 1989.
2. I. M. Kolthoff, and P. J. Elving, 'Treatise on Analytical Chemistry," Part II, Vol. 9, New York,Interscience, 1962.
3. C. E. Pietri, B. P. Freeman, and J. R. Weiss, 'The Quantitative Ion Exchange Separation ofPlutonium from Impurities," NBL-298 (September 1981).
21
4. W. G. Mitchell, M. I. Spaletto, K. Lewis, M. D. Soriano, and M. M. Smith, "The Effect of IonExchange Purification on the Determination of Plutonium at the New Brunswick Laboratory,"NBL-323 (July 1990).
5. H. 0. Haug, "Gmelin Handbook of Inorganic Chemistry, Uranium Supplement, D3, AnionExchange," Springer-Verlag, Berlin, 1982.
6. F. W. E. Strelow and C. H. S. W. Weinert, "Selective Separation of Uranium from Other Elementsby Cation Exchange Chromatography in Hydrobromic Acid and Hydrochloric Acid-AcetoneMixtures," Talanta Vol. 20, (1973) pp. 1127-1137.
7. E. P. Horowitz, M. L. Dietz, R. Chlarizia, H. Diamond, A. M. Essling, and D. Graczyk, "Separationand Preconcentration of Uranium from Acidic Media by Extraction Chromatography," AnalyticaChimica Acta, 266 (1992) pp. 25-37.
8. P. M. Santoliquido, "Preparation and Provisional Certification of NBL Spectrographic ImpurityStandards CRM 123 (1-7) and CRM 124 (1-7)," NBL-310, September 1983.
9. "Purification of Uranium for Mass Spectrometric Analysis using U/TEVA SPEC Columns," NBL-
SP-U(I)-4, NBL Procedures Manual.
10. "Preparation of Uranium Standard Solution," NBL-CAL-U(E)-2, NBL Procedures Manual.
11. "Guide to Ion Exchange," BIO-RAD, Catalog Number 140-9997.
12. R. Brina and A. G. Miller, "Direct Detection of Trace Levels of Uranium by Laser-Induced KineticPhosphorimetry," Anal. Chem., Vol. 64, No. 13, 1992, pp. 1413-1418.
13. KPA-1 1 Operation and Service Manual, Kinetic Phosphorescence Analyzer, ChemchekInstruments, Inc., Richland, WA, June, 1992.
14. "Determination of Uranium by Ferrous Reduction in Phosphoric Acid and Titration withDichromate (NBL Titrimetric Method)," NBL-SA-U(E)-1, NBL Procedures Manual.
15. Instruction Manual, Sequential X-ray Spectrometer Systems, Rigaku Industrial Corporation,Osaka, Japan.
16. T. N. van der Walt, F. W. E. Strelow and R. Verheij, "The Influence of Crosslinkge on theDistribution Coefficients and Anion Exchange Behaviour of Some Elements in HydrochloricAcid," Solvent Extraction and Ion Exchange, 3(5), (1985) pp. 723-740.
17. ElChroM Industries Inc., SpecNews Volume 1, Issue 1, June 1992.
22
APPENDIX A
PROCEDURE FOR THE PURIFICATION OF URANIUM BY ANION EXCHANGE
23
PURIFICATION OF URANIUM BY ANION EXCHANGE SEPARATION
(MINI COLUMN)
I. INTRODUCTION
A. Aoplicability
The anion exchange purification of uranium removes various impurities in order to permit
reliable determinations of uranium content by various techniques, such as coulometry and
titrimetric methods. This procedure may also be used to separate impurities for impurity
analysis by removing all the uranium from the sample. In order to achieve the stated
quantitative recovery, uranium sample sizes of 12 mg and impurities not to exceed 10% of
total sample weight are optimal.
B. Summary of Method
Uranium, in sample aliquants previously evaporated, is dissolved in 8 M HCI. The U(VI)-
chloro anionic complex formed in 8 M HCI is sorbed on Bio-Rad AG 1 -X8 or Bio-Rad AG
MP-1 anion exchange resin. Impurities are separated by washing the resin with 8 M HCI.
Uranium is desorbed from the resin with 1 M HCI. The eluted uranium samples are then
dried down. Concentrated nitric acid, and if needed, sulfuric acid, are added and the
sample is fumed to dryness.
C. Method Performance
A study was undertaken by Narayanan, et. al.1 to develop an ion exchange method for
removing major impurities and achieving complete uranium recovery. The study included
evaluation of the quantity of uranium lost during the ion exchange process. High-purity
uranium samples were analyzed with and without prior ion exchange. Also, uranium
samples were ion exchanged with and without added impurities. The mean difference in
uranium concentration between ion exchanged and non-ion exchanged aliquants of pure
uranium samples was found to be -0.104% for Bio-Rad AG 1 -X8 resin and + 0.006% for Bio-
Rad AG MP-1 resin. The mean difference in uranium concentration between pure uranium
and uranium with impurities samples was found to be -0.041%,for Bio-Rad AG 1 -X8 resin
and +0.032% for Bio-Rad AG MP-1 resin.
25
D. Interferences/Limitations
Each batch of anion exchange resin must be tested prior to use to verify that it will provide
the stated quantitative recovery.
The choice of 8 M HCI to adsorb uranium and 1 M HCI to desorb was based on achieving
maximum separation from most of the impurities while desorbing all of the uranium. The
lanthanides, alkali and alkaline earth metals, Al, Ni, P and Si are not retained on the resin
at any acid concentration. Pb(ll) is not adsorbed above 6 M HCI, while Mn(ll) is only
adsorbed at or above 9 M HCI; therefore these elements are not retained on the column
after an 8 M HCl wash. While Zn, Cd, Sn(ll), Sn(IV), Ta, Bi and Ag are retained In 8 M HCI,
they are also largely retained in 1 M HCI and therefore should remain on the column during
uranium elution. The ions of Ti, Zr, Hf, Mo(VI), Cu(lI), and V(V) have low distribution
coefficients at 8 M HCl acid concentration. It is therefore difficult to predict their actual
behavior and the ease of separation of these ions from uranium. This scheme will not
separate Fe(lll), Mo(VI), Sb(V), or Co(ll) from uranium, as they are retained under the
conditions specified and will be eluted with uranium. As an added benefit, this scheme
should readily separate a number of actinides from uranium, including Th(IV), Ac(lIl), Pu(lll),
and Np(lll).
E. Traceability to Primary Standards
This ion exchange method is a purification performed prior to quantitative determination of
elemental concentration, isotopic analysis or impurity analysis; traceability to primary
standards Is described in the analytical procedure used following purification.
To ensure that the ion-exchange separation is performed quantitatively, "blind" standards are
ion exchanged and analyzed with each group of samples on which the uranium
concentration is being determined. These "blind" standards are aliquants of solutions
prepared from CRM 112-A, Uranium Metal Assay Standard, or other appropriate uranium
standards, which contain amounts of uranium unknown to the analyst. Results obtained on
the blinds are entered into the NBL computer-based quality control program. Poor ion-
exchange recoveries will lead to out-of-control conditions.
F. Safety Procedures
Review Material Safety Data Sheets (MSDS) for corrosive acids prior to performing the
procedure.
26
All handling of uranium solutions and uranium aliquants is performed In approved
laboratories. Fuming of uranium materials is done on steam baths or on hot plates in a
filtered hood. The requirements for working with radioactive materials, such as uranium,
may be found in the NBL Radiological Control (RadCon) Manual.
Nitric, sulfuric, and hydrochloric acids are extremely corrosive; gloves should be used when
preparing solutions of these acids. Polyethylene or Teflon bottles used to store 8 M HCI
should be regularly inspected for hairline cracks before refilling.
II. INSTRUMENTS, APPARATUS, AND REAGENTS
A. Instruments
Not applicable
B. Apparatus
1. Pipets, as needed. One piece disposable plastic transfer pipets, approximate draw
of 3.5 mL
2. Columns, Bodman Polypropylene Columns, Large Capacity Robotic Tube, Order No.
3300-25; polyethylene 70 p frits, Order No. 3201-00, from Bodman Industries, P. 0.
Box 2421, Aston, PA 19014.
3. Rod, glass or plastic.
4. Column Holder, NBL design,2 preferably painted to avoid corrosion from HCI.
5. Hot Plate.
6. Bottles, polyethylene or TeflonTM, 250 mL and 1 L.
7. Tray, enamel-coated metal.
8. Parafilm,8 Grade M.
27
9. Glass Wool.
10. Beakers, glass or TeflonTM, 50 mL and 100 mL.
NOTE: If new glassware is used, clean by heating for 2 hours In approximately 8 M
nitric acid, then rinse with deionized distilled water and finally allow to air dry. To
clean used glassware, soak first in approximately 8 M nitric acid, then rinse with
deionized distilled water. Rinse the inside of the beakers twice with approximately 8
M nitric acid followed by rinsing three times with deionized distilled water.
11. Marker pen.
C. Reagents
Reagents are ACS reagent grade unless otherwise specified. Solutions may be prepared
in multiples or fractions as required to minimize waste.
1. Water, deionized distilled.
2. Resin, Bio-Rad AGO 1-X8 or Bio-Rad AGO MP-1, 100-200 mesh (dry) from Bio-Rad.
3. Hydrochloric acid, 8 M HCL. Add 660 mL of concentrated HCI to about 300 mL of
deionized distilled water; dilute to 1 L. Store the solution in a polyethylene or Teflon
bottle.
4. Hydrochloric acid, 5 M HCI. Add 413 mL of concentrated HCI to about 550 mL of
deionized distilled water; dilute to 1 L. Store the solution in a polyethylene or Teflon
bottle.
5. Hydrochloric acid, 1 M HCI. Add 82 mL of concentrated HCI to about 900 mL of
delonized distilled water; dilute to 1 L. Store the solution in a polyethylene or Teflon
bottle.
6. Nitric acid, concentrated.
7. Nitric acid, 8 M. Add 500 mL concentrated HNO 3 to about 400 mL of deionized
distilled water; dilute to 1 L. Store the solution in a Teflon bottle.
28
8. Sulfuric acid, 3 M. Add 168 mL of concentrated sulfuric acid (Baker Instra-
AnalyzedO or equivalent) to about 800 mL of deionized distilled water, and dilute to
1 L. Store the solution in a polyethylene or Teflon bottle.
Ill. PROCEDURE
A. Column Preparation
NOTE: The uranium Ion exchange is described for a single aliquant. However, standard
practice is to perform ion-exchange separations in groups of ten. Follow the same
procedure for each aliquant.
1. Clean the bench top inside the hood. Clean the column holder with a wet paper
towel. Place the column holder on a clean sheet of paper towel. Place a clean paper
towel on the column holder base.
2. Place the frit firmly inside an empty column by gently pushing it to the end of the
column with a glass or plastic rod.
3. Place the ion-exchange column in the column holder. Center a 1 00-mL beaker under
the column. The column tip should not touch the sides of the beaker or the liquid
which will be collected in it (about 60 mL),
4. Add about 3 mL of deionized distilled water into the column. If no flow is observed
in 30 seconds, apply pressure by covering the column opening with the palm of your
hand and pressing downward. This will wet the glass frit and start the flow.
5. Prepare the resin in a clean 250-mL polyethylene bottle by mixing dry resin with
enough deionized distilled water to make a slurry.
6. Add enough resin to the column by using a disposable pipet to give a resin height
(after the water has stopped dripping) of 4 cm measured from the top of the frit in the
bottom of the column to the top of the resin. This equals not less than 2.5 mL of wet
resin volume. Retain pipet for use in steps III.A.7 and III.A.9.
29
7. Using the same disposable pipet from step 6 above, add about 5 mL of deionized
distilled water to the column. Gently draw some resin from the column into the
disposable pipet. Release the resin from the pipet and allow it to settle back into the
column. This will help to eliminate air bubbles In the resin and prepare a uniform
resin bed.
8. Use a marker pen to mark 2-mL and 1-mL solution heights on a new disposable
pipet. This pipet will be used for 8 M HCI reagent additions to the column.
9. Add 10 mL of 8 M HCl to the column using the marked disposable pipet. Using the
disposable pipet from step 7, again draw some resin from the column into the pipet
and release it to gently loosen the resin bed. Allow the bed to settle. Allow solution
to drain to top of resin bed.
NOTE: When the upper liquid level drains to the top of the resin, the column will stop
dripping but the resin bed will not go dry. Therefore it is not necessary to add more
solution to the column before it stops flowing.
10. For only the columns filled with the Bio-Rad AG MP-1 resin, position a piece
(approximately 2 cm in diameter) of glass wool at the top of the resin bed using the
plastic or glass rod.
11. Add 10 mL of 8 M HCI to the column using the marked disposable pipet. Repeat.
B. Sample Preparation
NOTE: Use the same marked disposable pipet used in steps 8 and 9 for reagent additions
to the sample.
1. Remove the Parafilm beaker cover from the U sample beaker and Invert the Parafilm
over the sample beaker.
2. Rinse the surface of the Parafilm into the beaker containing the sample with 2 mL of
8 M HCI. Wash down the beaker walls with an additional 12 to 14 mL of 8 M HCl.
Swirl gently until the sample dissolves.
30
NOTE: Gentle warming of the solution on a hot plate for 5-10 minutes may hasten
dissolution of difficult-to-dissolve samples. Cool samples to room temperature before
proceeding.
C. Sample Loading
NOTE: If impurities are to be collected for analysis, place a clean 50-mL beaker under the
column before beginning sample loading. However, even if not collecting impurities it is a
good practice to collect and examine the sample load and rinse solutions for uranium
losses.
1. Using the marked pipet, add 2 mL of 8 M HCI to the reservoir and let it drain to the
top of bed.
2. Wet the sample beaker spout by adding a drop of 8 M HCI with the disposable pipet.
3. Slowly pour the sample solution from step III.B.2, all at once, onto the resin bed.
4. Without touching the inside walls of the beaker, use the marked pipet to rinse down
the walls of the sample beaker with 2 mL of 8 M HCI. Pour this rinse solution into
the column. Repeat four more times for a total of five rinses.
5. Rinse the outside of the beaker spout into the column with a few drops of 8 M HCI.
6. Use the column effluent for appropriate analysis or discard if not needed.
D. Washing
1. Using the marked pipet, wash down the sides of the column reservoir with 5 mL of
8 M HCI. Allow the column to drain to the level of the resin bed.
2. Continue adding 8 M HNO 3 in 5 mL increments, allowing column to drain between
additions, until 20 mL of wash have been added.
NOTE: If Cu and Co are present as impurities, Cu may not be separated completely
with 8 M HNO 3 washes and Co will be separated only with 5 M HNO 3. If Cu and Co
31
are to be removed, wash the column with 15 mL of 8 M HNO 3, added In 5-mL
Increments, followed by 15 mL of 5 M HNO 3.
NOTE: Excess washing can result in loss of uranium.
3. Use the column effluent for appropriate analysis or discard if not needed.
E. Eluting
1. Place a clean, labeled 100-mL beaker under the column. The tip of the column
should be approximately centered with respect to the beaker. If necessary, adjust
the column holder to minimize distance between column tip and beaker rim.
2. Using the marked pipet, add 1 M HCI eluting solution to the column dropwlse,
washing the sides of the reservoir. Add no more than 5 mL at a time. Allow the
liquid level to drain to the top of the resin.
NOTE: Addition of less than 5-mL volumes of the eluting solutions at a time to the
reservoir can result in better exchange kinetics and therefore better recoveries.
3. Continue adding 1 M HCI eluting solution in increments of 5 mL, allowing the column
to drain between Increments, until 40 mL of the eluant have been added. Allow the
column to drain until the solution stops dripping.
4. Rinse the tip of the column into the beaker with a few drops of eluting solution.
5. Discard the resin and column (see section VII.B).
6. Carefully place the beakers into an enamel-coated tray, move them and place on a
hot plate.
F. Fuming
NOTE: The hot plate settings given below are usual values, but heating efficiency may vary.
It is the analyst's responsibility to observe the heating process and adjust the settings as
appropriate.
32
1. Set the hot plate to the "2" setting.
2. Place the sample beaker on the hot plate and allow the sample to dry down. Do not
boil or bake the sample. This initial evaporation step should take about four hours.
Remove the sample and allow it to cool.
3. Using a new disposable pipet, rinse down the walls of the beaker with 2 mL of
concentrated HNO 3.
NOTE: If the sample does not contain aluminum, also add 2 mL of 3 M H2SO 4.
4. Place sample beaker back on the hot plate and allow the sample to fume dry. This
fuming step should take less than an hour if only HNO 3 is present. The fuming time
will be longer if H2SO 4 is used.
NOTE: Turning the heat up too soon or too high may cause the sample to "pop" with
a resultant loss of sample of up to several tenths of a percent. Be aware that based
on their location on the hot plate, individual samples may fume at different rates.
5. Cool the sample until it can be comfortably handled (approximately 5 minutes) by
reducing the setting to "LOW" or "OFF". Remove samples from the hot plate.
6. Reset the hot plate to the "2" setting.
7. Using the same disposable pipet as in step III.F.3, again rinse down the walls of the
beaker with 2 mL of concentrated HNO 3.
8. Repeat steps Ill.F.4 and III.F.5.
9. After the sample cools to room temperature, cover the sample with Parafilm and store
in a safe place.
NOTE: Do not stretch the Parafilm over the beaker since it may fail now or at a later
time. Instead, fold the Parafilm over the rim and gently press it in place.
33
G. Documentation
Enter the date and the LIMS numbers of all the samples ion exchanged In the ion-exchange
log notebook kept In the laboratory. Initial and date the entry. Record In the analyst's
notebook that the ion exchange was performed; include procedure number and Issue date,
the resin lot used, and sample LIMS numbers. Note unusual conditions observed during
Ion exchange.
IV. CALCULATIONS
Not applicable
V. QUALITY ASSURANCE
To ensure quantitative recovery of uranium (and/or impurities) prior to analysis, known or blind
standards, as appropriate, are ion exchanged concurrently with unknown samples. At least two
knowns or blinds must be included with every set of unknown samples purified by this procedure.
Analytical results may not be used if knowns or blinds are out of control. See applicable analysis
procedure for details. The analyst should determine if the problem lies with the analysis or with
the Ion exchange; if the problem lies with the ion exchange, the set of samples must be discarded
and the purification repeated with a new set of knowns/blinds and samples.
VI. TRAINING
A. Training Plan
The trainee observes a qualified analyst perform the ion exchange procedure. The trainee
should practice the procedure until comfortable with the operations. The trainee must then
demonstrate the procedure to a qualified analyst with sufficient technique to obtain
quantitative recovery.
34
B. Qualification Plan
The trainee must perform the ion exchange procedure on sets of 6 known uranium samples
on each of 2 days (total 12 samples). The ion exchange samples are analyzed by a
qualified analyst using the appropriate procedure. Results (%RD) must be acceptable based
on the capabilities of the analytical procedure.
C. Requalification Requirements
An analyst must purify at least one set (6 samples) of known uranium samples each year
to maintain qualification. Results of analysis must be acceptable, as described in section
VI.B. An analyst whose qualification has lapsed may requalify by meeting the same
requirements.
VII. SAMPLE STORAGE AND DISPOSAL
A. Sample Storage
Always store the samples in a radioactive materials area.
B. Disposal
The effluent collected before loading the uranium fraction can be discarded into the sink
with water. The effluent collected after sample loading and before eluting the uranium
fraction, if not collected for impurity analysis, may contain toxic or radioactive elements. This
effluent should be collected in 2-L (or smaller) polyethylene bottles and marked "LL-LRW"
(low level liquid radioactive waste), listing all possible radioactive elements that may be
present. These bottles are transferred into 55-gallon waste drums which will be disposed
of as per NBL Standard Operating Procedures.
Collect the resin In a 2 L polyethylene container and dispose of it as Low-Level Radioactive
Waste. All solid objects, including plastic pipets and ion exchange columns, should be
disposed of in the suspect Solid Radioactive Waste (SRW, or "red-top") container placed
Inside the laboratory. Glass beakers should be cleaned and re-used. Broken glass should
be disposed of into appropriately labeled containers placed in the lab.
35
Waste and scrap treatment is more fully described in the NBL ESH Manual and In NBL
Standard Operating Procedures.3
VIII. REFERENCES
A. General References
1. U. I. Narayanan, P. M. Mason, J. P. Zebrowski, M. Rocca, I. W. Frank, M. M. Smith,
K. D. Johnson, G. J. Orlowicz, and E. Dallmann, "The Quantitalve Ion Exchange
Separation of Uranium from Impurities," NBL-331 (March 1995).
2. ANL Parts List CMT-D1 198 and Engineering Drawings CMT-C 198-3,-6, and -16; CMT-
D1198,-2,-4, and -5; and CMT-E1198-1.
3. NBL-SOP-ESH-04, "Waste Disposal Requisition Process."
B. Suggested Reading
1. "Dowex: Ion-Exchange," The Dow Chemical Company, Midland, Michigan, 1959.
2. H.O. Haug, "Gmelin Handbook of Inorganic Chemistry, Uranium Supplement, D3,
Anion Exchange," Springer-Vedag, Berlin, 1982.
3. "Guide to Ion-Exchange," Bio-Rad, Catalog Number 140-9997.
4. "Sorbent Extraction Technology Handbook," N. Simpson, K.C. Van Home, eds.,
Varian Sample Preparation Products, Harbor City, CA, 1993.
5. J. Korkisch, "Handbook of Ion Exchange Resins: Their Application to Inorganic
Analytical Chemistry," Volume I and II, CRC Press, Boca Raton, FL, 1989.
6. I.M. Kolthoff and P.J. Elving, "Treatise on Analytical Chemistry," Part II, Vol. 9,.
36
APPENDIX B
STATISTICAL PLAN OF ANALYSIS
37
STATISTICAL PLAN OF ANALYSIS
Introduction
This project will test two ion exchange resins (Bio-Rad AG 1 -X8 and MP-1) to determine which one will most
closely achieve quantitative recovery of uranium. Two analysts will be involved in the project, each
performing identical experiments, to test for analyst to analyst variation. Samples will consist of
approximately 12 mg uranium. Glass and Teflon sample beakers will be used to determine the effect of
sample beaker type on recovery. Half of the uranium samples will be contained in Teflon beakers and half
will be in glass. The ion exchange method to be used will include an 8 M HCI load, an 8 M HCI wash and
a 1 M HCl eluant. Eluted samples will be titrated using the low-level modified Davies and Gray procedure.
Uranium Samples
Uranium samples will be prepared from a single uranium solution made from New Brunswick Laboratory
CRM 112-A. The solution will be aliquanted into both glass and Teflon 50 mL beakers. Note: the uranium
solution aliquanted into the glass beakers (94NU0094-001-xxx) is from a different bottle (of the same
solution) than that aliquanted into the Teflon beakers (94NU0094-008-xxx): the assumption is made that
these solutions are identical. One analyst will aliquant all samples. Half of these samples will be spiked with
a previously developed combination of impurities. All impurity spiking will be completed by one analyst.
Samples will be identified as an numbered aliquant from either bottle 1 or bottle 8. For example, aliquant
number 53 from bottle 1 will be assigned the identification number 001-053 (or just 1-53).
A total of seventy-four uranium samples will be aliquanted into glass beakers and seventy-two will be
aliquanted into Teflon beakers. Some of these aliquants will be used for additional resin testing and direct
titration without ion exchange. Thirty-six of the remaining aliquants will be randomly selected from each
beaker type for ion exchange in the statistical plan. Half of the thirty-six in each type of beaker will be
randomly selected to be spiked with the mixture of impurities. At this point four classifications of samples
will be present, with 18 aliquants of each: uranium samples in glass beakers, uranium samples in Teflon
beakers, uranium samples with impurities in glass beakers, and uranium samples with impurities in Teflon
beakers. The individual samples in each of these four classifications will be randomly assigned to the two
resins (nine samples of each classification to each resin). One sample from each of the nine will be
designated as a spare; the remaining eight were randomly assigned to one of the two ion exchange
analysts. Thus, each analyst will perform ion exchange on four samples from each of the four classifications
described above.
39
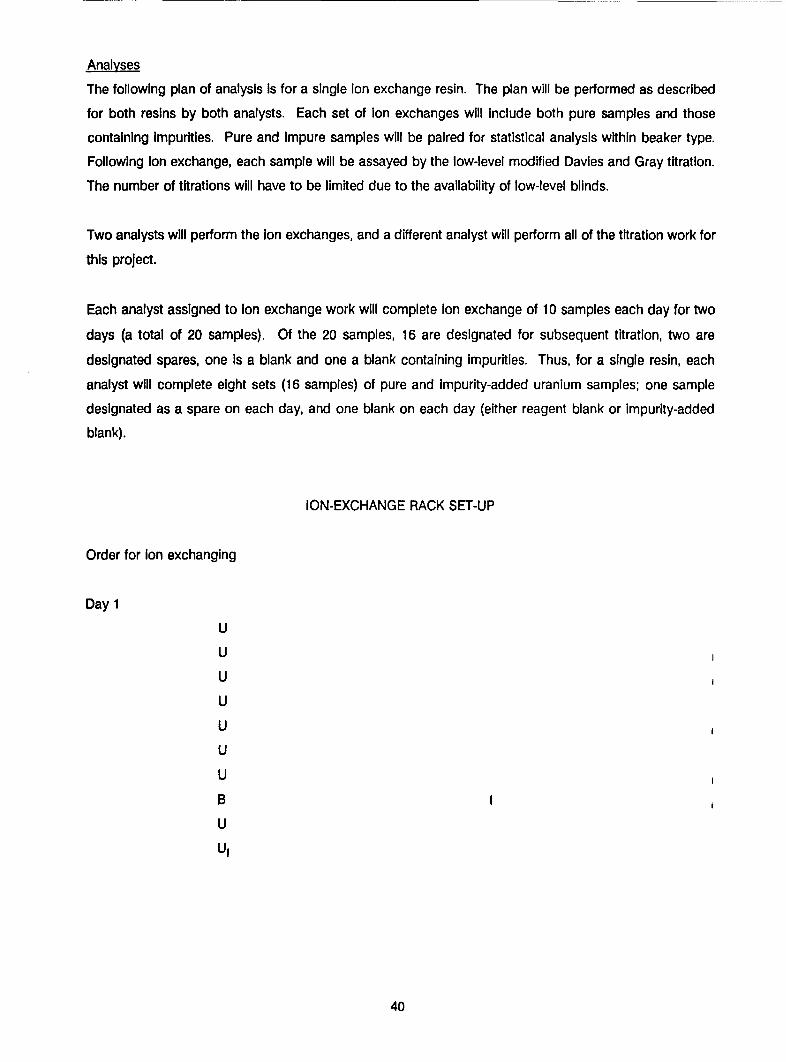
Analyses
The following plan of analysis is for a single ion exchange resin. The plan will be performed as described
for both resins by both analysts. Each set of ion exchanges will include both pure samples and those
containing Impurities. Pure and Impure samples will be paired for statistical analysis within beaker type.
Following ion exchange, each sample will be assayed by the low-level modified Davies and Gray titration.
The number of titrations will have to be limited due to the availability of low-level blinds.
Two analysts will perform the ion exchanges, and a different analyst will perform all of the titration work for
this project.
Each analyst assigned to ion exchange work will complete ion exchange of 10 samples each day for two
days (a total of 20 samples). Of the 20 samples, 16 are designated for subsequent titration, two are
designated spares, one Is a blank and one a blank containing impurities. Thus, for a single resin, each
analyst will complete eight sets (16 samples) of pure and impurity-added uranium samples; one sample
designated as a spare on each day, and one blank on each day (either reagent blank or impurity-added
blank).
ION-EXCHANGE RACK SET-UP
Order for ion exchanging
Day 1
U
U
U
U
U
U
U
B
U
Ul
40
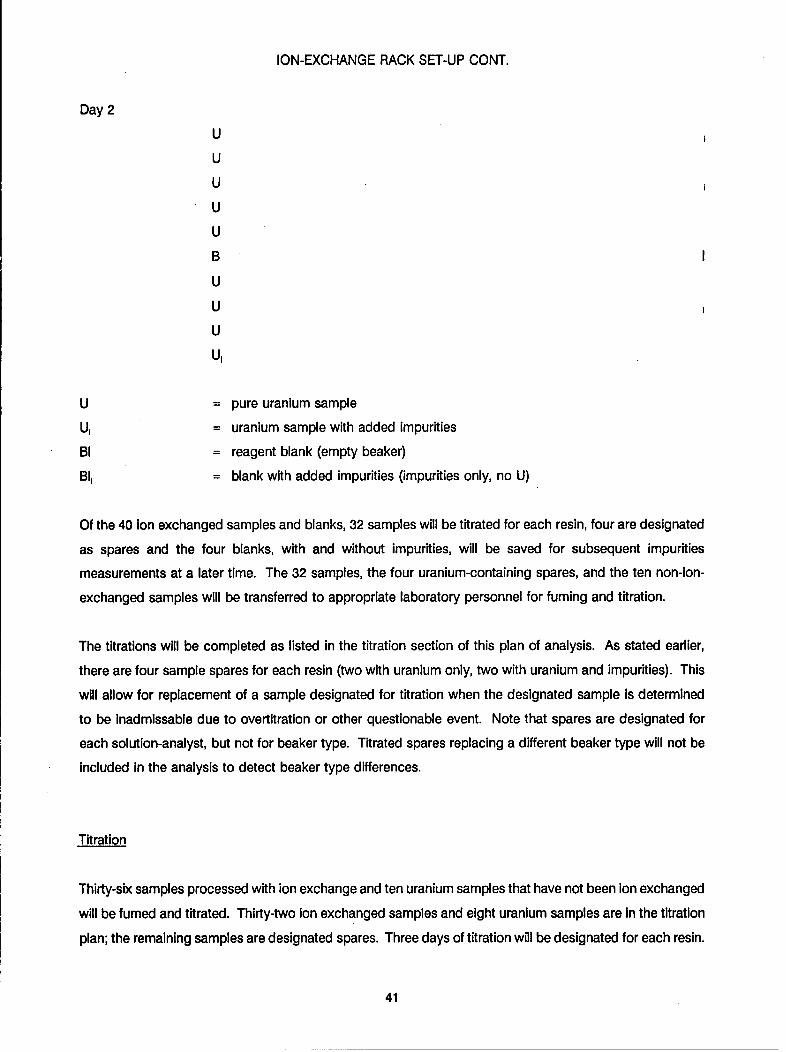
ION-EXCHANGE RACK SET-UP CONT.
Day 2
U
U
U
U
U
B
U
U
U
U'
U = pure uranium sample
U, = uranium sample with added impurities
BI = reagent blank (empty beaker)
BI3 = blank with added impurities (impurities only, no U)
Of the 40 ion exchanged samples and blanks, 32 samples will be titrated for each resin, four are designated
as spares and the four blanks, with and without impurities, will be saved for subsequent impurities
measurements at a later time. The 32 samples, the four uranium-containing spares, and the ten non-ion-
exchanged samples will be transferred to appropriate laboratory personnel for fuming and titration.
The titrations will be completed as listed in the titration section of this plan of analysis. As stated earlier,
there are four sample spares for each resin (two with uranium only, two with uranium and impurities). This
will allow for replacement of a sample designated for titration when the designated sample is determined
to be inadmissable due to overtitration or other questionable event. Note that spares are designated for
each solution-analyst, but not for beaker type. Titrated spares replacing a different beaker type will not be
included in the analysis to detect beaker type differences.
Titration
Thirty-six samples processed with ion exchange and ten uranium samples that have not been ion exchanged
will be fumed and titrated. Thirty-two ion exchanged samples and eight uranium samples are in the titration
plan; the remaining samples are designated spares. Three days of titration will be designated for each resin.
41
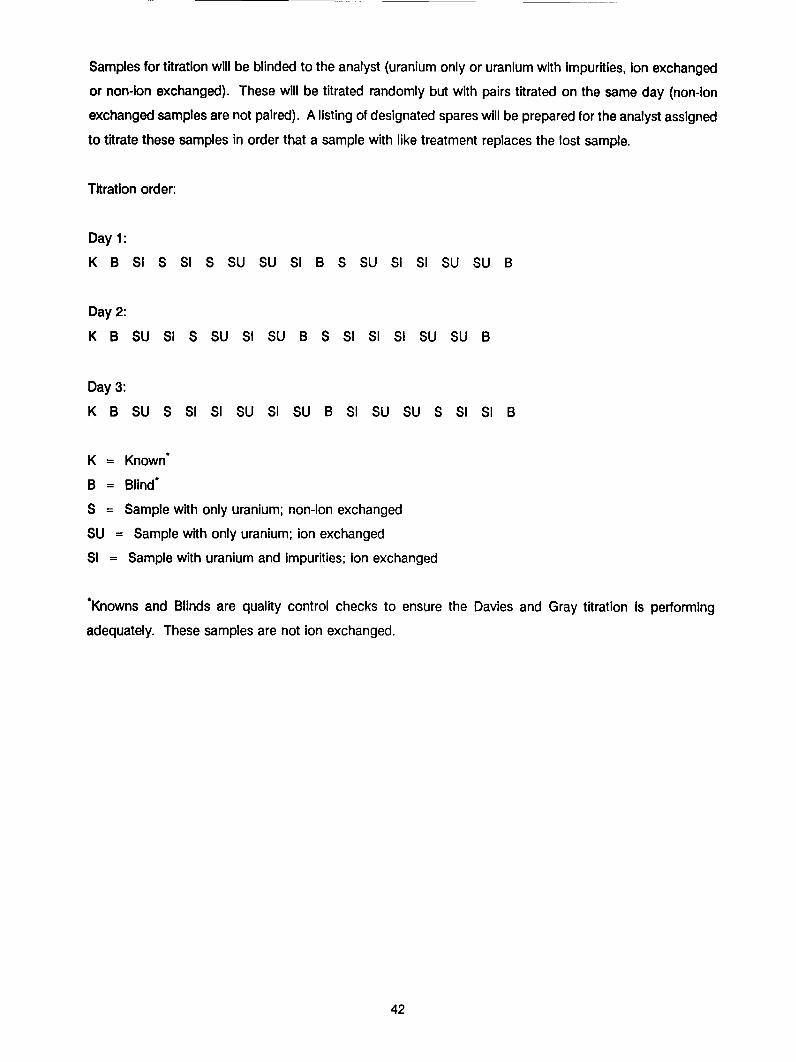
Samples for titration will be blinded to the analyst (uranium only or uranium with Impurities, Ion exchanged
or non-Ion exchanged). These will be titrated randomly but with pairs titrated on the same day (non-ion
exchanged samples are not paired). A listing of designated spares will be prepared for the analyst assigned
to titrate these samples in order that a sample with like treatment replaces the lost sample.
Titration order:
Day 1:
K B SI S SI S SU SU SI B S SU SI SI SU SU B
Day 2:
K B SU SI S SU SI SU B S SI SI SI SU SU B
Day 3:
K B SU S SI SI SU SI SU B SI SU SU S SI SI B
K = Known*
B = Blind*
S = Sample with only uranium; non-ion exchanged
SU = Sample with only uranium; ion exchanged
SI = Sample with uranium and impurities; ion exchanged
*Knowns and Blinds are quality control checks to ensure the Davies and Gray titration Is performing
adequately. These samples are not Ion exchanged.
42
APPENDIX C
STATISTICAL ANALYSIS OF URANIUM PURIFICATION PROJECT
43
REPORT OF DATA ANALYSIS
URANIUM SAMPLE PURIFICATION PROJECT
This project tested two ion exchange resins to determine which one would most closely achieve quantitative
recovery of uranium, with and without the presence of impurities in the uranium solutions. Two ion
exchange resins (Bio-Rad AG 1-X8 and MP-1) were tested. Ion exchange was performed by two analysts
In order to test for analyst-to-analyst variation in performing the procedure. The ion exchange method used
included an 8 M HCI load, 8 M HCI wash and a 1 M HCI elution.
Samples were aliquanted such that each sample contained approximately 12 mg of uranium. Samples from
bottle 1 were aliquanted into glass beakers and those from bottle 8 were aliquanted into Teflon beakers.
The use of Teflon beakers was included to test for variation in sample container type. The samples in Teflon
beakers were aliquanted at a later date.
Following ion exchange, all samples were titrated using the low-level modified Davies and Gray procedure
by one analyst with many years of experience in uranium titration. Spare samples were identified by resin,
beaker type, and ion exchange analyst.
Uranium Samples
Uranium samples were prepared from a single uranium solution made from CRM 112-A. After preparation,
this solution was stored in a series of glass bottles. The solution was aliquanted into appropriately-sized
beakers (both glass and Teflon). One bottle of uranium solution (samples 94NU0094-001-xxx) was
aliquanted into glass beakers before the Teflon beakers arrived from the supplier; the aliquants in the Teflon
beakers were from another bottle (samples 94NU0094-008-xxx) of the same solution. The assumption was
made that these bottles are the same. One analyst aliquanted all samples into the beakers, and spiked half
of them with a previously prepared combination of impurities. Aliquants to be spiked were selected using
a random number generator.
Seventy-four uranium samples were aliquanted into glass beakers and seventy-two were aliquanted into
Teflon beakers. Some of these aliquants were used for additional resin testing, and some were subjected
to direct titration without ion exchange. Thirty-six of the remaining aliquants were randomly selected from
each beaker-type for ion exchange. Because half of the aliquants in each type of beaker were randomly
selected to be spiked with a mixture of impurities, 18 aliquants from each of four classifications of samples
were prepared: uranium samples in glass beakers, uranium samples in Teflon beakers, uranium samples
45
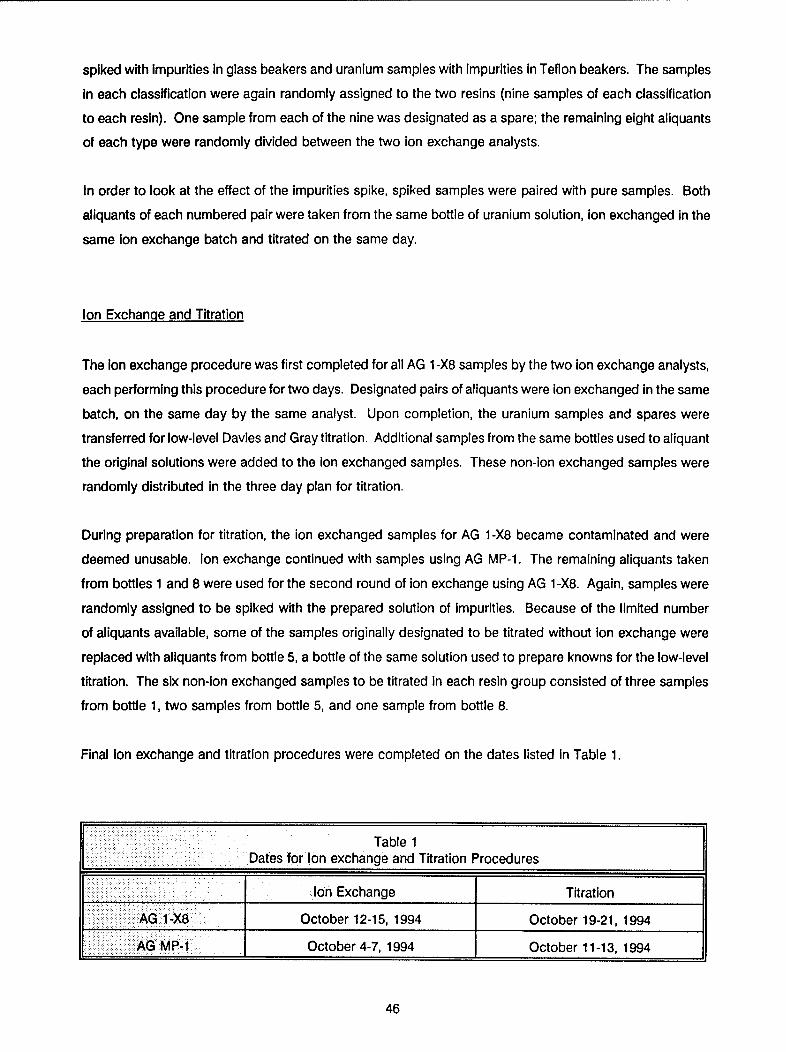
spiked with Impurities in glass beakers and uranium samples with impurities in Teflon beakers. The samples
In each classification were again randomly assigned to the two resins (nine samples of each classification
to each resin). One sample from each of the nine was designated as a spare; the remaining eight aliquants
of each type were randomly divided between the two ion exchange analysts.
In order to look at the effect of the Impurities spike, spiked samples were paired with pure samples. Both
aliquants of each numbered pair were taken from the same bottle of uranium solution, ion exchanged in the
same ion exchange batch and titrated on the same day.
Ion Exchange and Titration
The Ion exchange procedure was first completed for all AG 1 -X8 samples by the two ion exchange analysts,
each performing this procedure for two days. Designated pairs of aliquants were ion exchanged in the same
batch, on the same day by the same analyst. Upon completion, the uranium samples and spares were
transferred for low-level Davies and Gray titration. Additional samples from the same bottles used to aliquant
the original solutions were added to the Ion exchanged samples. These non-ion exchanged samples were
randomly distributed in the three day plan for titration.
During preparation for titration, the ion exchanged samples for AG 1 -X8 became contaminated and were
deemed unusable. Ion exchange continued with samples using AG MP-1. The remaining aliquants taken
from bottles 1 and 8 were used for the second round of ion exchange using AG 1 -X8. Again, samples were
randomly assigned to be spiked with the prepared solution of impurities. Because of the limited number
of aliquants available, some of the samples originally designated to be titrated without Ion exchange were
replaced with aliquants from bottle 5, a bottle of the same solution used to prepare knowns for the low-level
titration. The six non-ion exchanged samples to be titrated in each resin group consisted of three samples
from bottle 1, two samples from bottle 5, and one sample from bottle 8.
Final Ion exchange and titration procedures were completed on the dates listed in Table 1.
Table 1Dates for Ion exchange and Titration Procedures
____________.___. Ion Exchange Titration
AG 1 -X8 E l October 12-15, 1994 October 19-21, 1994
AG MP'1 October 4-7, 1994 October 11-13, 1994
46
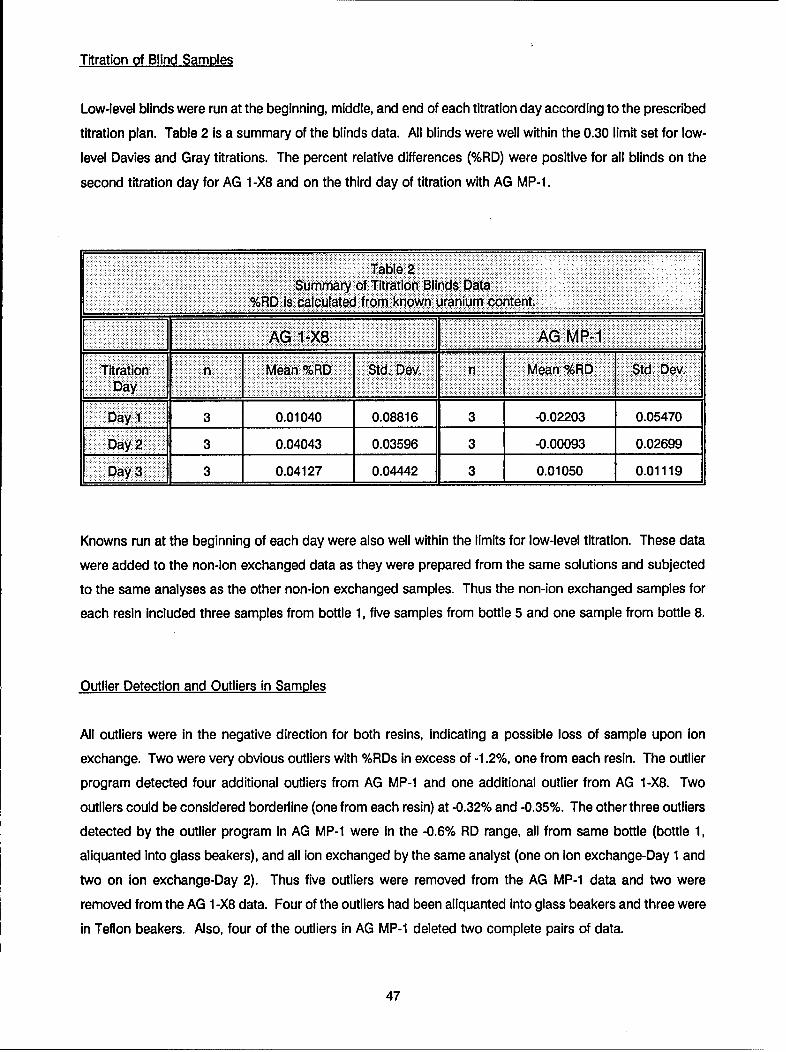
Titration of Blind Samples
Low-level blinds were run at the beginning, middle, and end of each titration day according to the prescribed
titration plan. Table 2 is a summary of the blinds data. All blinds were well within the 0.30 limit set for low-
level Davies and Gray titrations. The percent relative differences (%RD) were positive for all blinds on the
second titration day for AG 1-X8 and on the third day of titration with AG MP-1.
Table 2.......... Summary of Titration Blinds Data
%R s calculated from known uranium content.
AGI I -X8 AG MPTitration nMan %/RD Std.Dv Mean %/RD. Std.. Dev..Day.......
Day 1 3 0.01040 0.08816 3 -0.02203 0.05470
Day 2 3 0.04043 0.03596 3 -0.00093 0.02699
Day 3 3 0.04127 0.04442 3 0.01050 0.01119
Knowns run at the beginning of each day were also well within the limits for low-level titration. These data
were added to the non-ion exchanged data as they were prepared from the same solutions and subjected
to the same analyses as the other non-ion exchanged samples. Thus the non-ion exchanged samples for
each resin Included three samples from bottle 1, five samples from bottle 5 and one sample from bottle 8.
Outlier Detection and Outliers in Samples
All outliers were in the negative direction for both resins, indicating a possible loss of sample upon ion
exchange. Two were very obvious outliers with %RDs in excess of -1.2%, one from each resin. The outlier
program detected four additional outliers from AG MP-1 and one additional outlier from AG 1-X8. Two
outliers could be considered borderline (one from each resin) at -0.32% and -0.35%. The other three outliers
detected by the outlier program in AG MP-1 were in the -0.6% RD range, all from same bottle (bottle 1,
aliquanted into glass beakers), and all ion exchanged by the same analyst (one on ion exchange-Day 1 and
two on ion exchange-Day 2). Thus five outliers were removed from the AG MP-1 data and two were
removed from the AG 1 -X8 data. Four of the outliers had been aliquanted into glass beakers and three were
in Teflon beakers. Also, four of the outliers in AG MP-1 deleted two complete pairs of data.
47
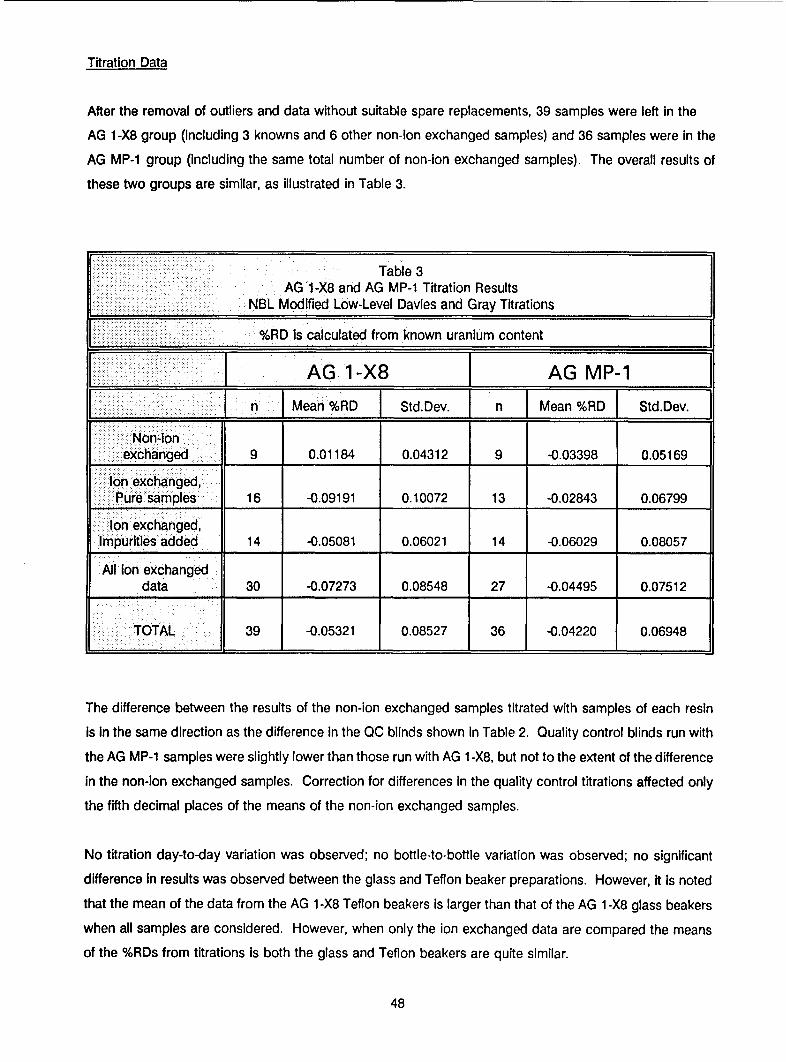
Titration Data
After the removal of outliers and data without suitable spare replacements, 39 samples were left In the
AG 1-X8 group (including 3 knowns and 6 other non-ion exchanged samples) and 36 samples were in the
AG MP-1 group (including the same total number of non-ion exchanged samples). The overall results of
these two groups are similar, as illustrated in Table 3.
Table 3AG 1-X8 and AG MP-1 Titration Results
NBL Modified Low-Level Davies and Gray Titrations
%RD Is calculated from known uranium content
I AG 1 -X8 __ AG MP- 1I.. n Mean %RD Std.Dev. n Mean %RD Std.Dev.
Non-ionexchanged 9 0.01184 0.04312 9 -0.03398 0.05169
Ion exchanged,Pure samples 16 -0.09191 0.10072 13 -0.02843 0.06799
ion exchanged,Impurities added 14 -0.05081 0.06021 14 -0.06029 0.08057
All ion exchangeddata 30 -0.07273 0.08548 27 -0.04495 0.07512
TOTAL 39 -0.05321 0.08527 36 -0.04220 0.06948
The difference between the results of the non-ion exchanged samples titrated with samples of each resin
Is in the same direction as the difference in the 0C blinds shown in Table 2. Quality control blinds run with
the AG MP-1 samples were slightly lower than those run with AG 1 -X8, but not to the extent of the difference
in the non-ion exchanged samples. Correction for differences in the quality control titrations affected only
the fifth decimal places of the means of the non-ion exchanged samples.
No titration day-to-day variation was observed; no bottle-to-bottle variation was observed; no significant
difference In results was observed between the glass and Teflon beaker preparations. However, it is noted
that the mean of the data from the AG 1 -X8 Teflon beakers is larger than that of the AG 1 -X8 glass beakers
when all samples are considered. However, when only the ion exchanged data are compared the means
of the %RDs from titrations Is both the glass and Teflon beakers are quite similar.
48
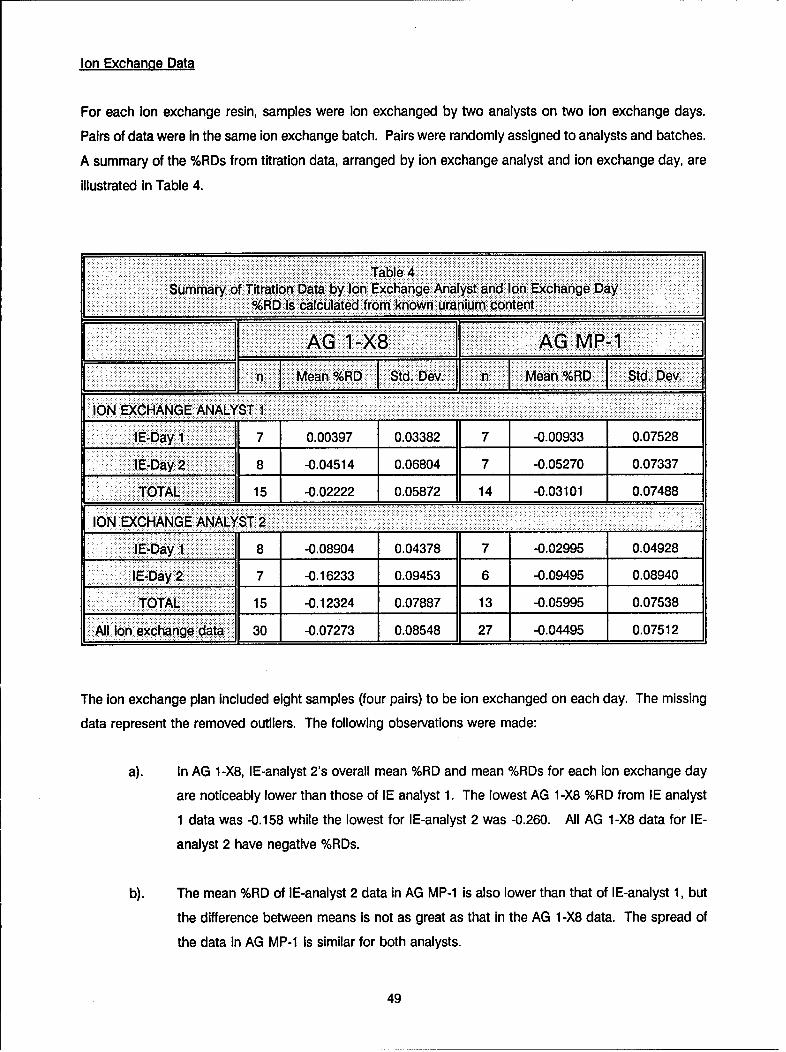
Ion Exchanaqe Data
For each Ion exchange resin, samples were ion exchanged by two analysts on two ion exchange days.
Pairs of data were in the same ion exchange batch. Pairs were randomly assigned to analysts and batches.
A summary of the %RDs from titration data, arranged by ion exchange analyst and Ion exchange day, are
illustrated In Table 4.
Table 4Sumary of Titration Data by Ion Exchange Analyst and Ion Exchange Day
1oARD is calculated from known uranium content
EiZJAG 1 -X8 AG M-Z l IZ n IMean %RD Std. Dev. 77 Mean %RD Std. Dev.
ION EXCHANGE ANALYST 1
IE-Day 1 7 0.00397 0.03382 7 -0.00933 0.07528
E-Day 2 8 -0.04514 0.06804 7 -0.05270 0.07337
TOTAL 15 -0.02222 0.05872 14 -0.03101 0.07488
ION EXCHANGE ANALYST 2
IE-Day 1 8 -0.08904 0.04378 7 -0.02995 0.04928
IE-Day 2 7 -0.16233 0.09453 6 -0.09495 0.08940
TOTAL 15 -0.12324 0.07887 13 -0.05995 0.07538
All ion exchange data 30 -0.07273 0.08548 27 -0.04495 0.07512
The ion exchange plan included eight samples (four pairs) to be ion exchanged on each day. The missing
data represent the removed outliers. The following observations were made:
a). In AG 1-X8, IE-analyst 2's overall mean %RD and mean %RDs for each ion exchange day
are noticeably lower than those of IE analyst 1. The lowest AG 1 -X8 %RD from IE analyst
1 data was -0.158 while the lowest for IE-analyst 2 was -0.260. All AG 1-X8 data for IE-
analyst 2 have negative %RDs.
b). The mean %RD of IE-analyst 2 data in AG MP-1 is also lower than that of IE-analyst 1, but
the difference between means is not as great as that in the AG 1-X8 data. The spread of
the data in AG MP-1 is similar for both analysts.
49
c). The mean %RD for each IE-analyst in AG MP-1 is not significantly different from that of the
non-ion exchanged data for AG MP-1. The mean %RD of the non-ion exchanged data for
AG 1 -X8 Is positive though not significantly different from the data of IE-analyst 1 for AG 1-
X8. However, the non-ion exchanged data for AG 1-X8 is significantly different from the IE-
analyst 2 data for AG 1 -X8.
d). In AG 1-X8 IE-analyst 1 data, IE-day 1 has very precise data, while the IE-day 2 data is
lower with considerably more spread (note that the standard deviation has more than
double for a similar number of samples).
e). The difference In Ion exchange day data is also evident in AG MP-1 data--the mean %RD
for IE-day 2 is consistently lower than the mean %RD for IE-day 1 (for both IE-analysts).
However, in AG MP-1, IE-analyst 1 data have very similar standard deviations for both IE-
days, while the AG MP-1 IE-analyst 2 data show that the standard deviation of IE-day 2 Is
considerably larger than that of IE-day 1. (Also note that five outliers were removed from
AG MP-1 data.)
Significant Analysis of Variance Results
Analyst-to-analyst variations are significantly different for AG 1 -X8 (p = .0004) but not for AG MP-1. Table
4 Illustrates agreement between the analysts for IE-day 1 but not for IE-day 2. IE-day-to-IE-day variations
(with analysts combined) are marginally significant for both resins (p = 0.08 and 0.06, In that order).
Analysis of variance procedures, performed including both ion exchange analyst, ion exchange day and the
Interaction between IE-analyst and IE-day indicate significant contributions to the amount of variation In the
%RD data for AG 1-X8 by both the ion exchange analyst (p = 0.0002) and the ion exchange day
(p = 0.015), but only the Ion exchange day has some influence (and only marginally significant with p =
0.067) on the amount of variation in AG MP-1. Interactions between IE-analyst and IE-day were not
significant In either resin. These designated contributions to the variation in AG 1 -X8 indicate that samples
were Ion exchanged with this resin by only one analyst on only one day may have somewhat biased results.
Thirty-six percent of the variation in AG 1-X8 data may be explained by IE-analyst while less than four
percent of the variation in AG MP-1 is explained by that variable. The model including both IE-analyst and
IE-day shows that 50% of the variation in AG 1-X8 and 18% of the variation in AG MP-1 are explained by
these two variables.
No titration day-to-day variation was observed; no bottle-to-bottle variation was observed; no significant
difference was observed between the samples in glass and those in Teflon beakers.
50
Significant differences were observed among the "impurity types" of the AG 1 -X8 samples. The three
Impurity types compared were the non-ion exchanged samples, the pure solution ion exchanged samples
and the Impurity spiked ion exchanged samples. The effect of this "impurities variable" was significant at
the p = 0.02 level In AG 1 -X8, but not at all significant In AG MP-1. When only the ion exchanged samples
are considered, there are no observable significant differences between the uranium only and the spiked
(with added impurities) samples in either resin. Thus the significant difference observed in AG 1 -X8 is due
to the results from the non-ion exchanged samples. In AG 1-X8, the group with the lowest %RDs is the
uranium only solution ion exchanged samples group (mean %RD = -0.092), and the non-ion exchanged
group has the highest %RDs (mean %RD = +0.118).
All three "Impurity" groups have similar means in resin AG MP-1 data. Additional analyses of variance by
Impurity group Indicate that resin AG 1-X8 and AG MP-1 are marginally different (p = 0.06) in the uranium
only Ion exchanged samples; the %RDs from AG MP-1 samples are generally higher (less negative) than
those from AG 1-X8 samples. Both Resins 1 and 2 have similar results on the impurity-spiked ion
exchanged samples. The non-ion exchanged samples are significantly different (p = 0.03), by resin group,
as discussed earlier.
Paired Differences between Impurity-Spiked and Pure Solutions
A variable DIFF = %RDno imp - %RDimp added was created for analyzing the matched pairs of samples from
the same bottle. It Is noted that the mean DIFF is negative (-0.041) for AG 1-X8 and positive (0.036) for AG
MP-1. These two values were determined to be significantly different from each other with the Student t-test.
Individually, the mean value of this difference is not significantly different from zero in the AG MP-1 data, but
is marginally different from zero for AG 1-X8 (p = 0.069).
Comments and Selection of Ion Exchange Resin
Neither AG 1 -X8 nor AG MP-1 clearly indicates a better recovery of uranium after ion exchange than the
other resin. AG MP-1 produced more consistent results than those of AG 1 -X8. However, AG MP-1 data
had five outliers removed and the results of the non-ion exchanged samples titrated with resin AG MP-1 are
still somewhat difficult to explain. The locations of the outliers removed from AG MP-1 data also raises
additional questions.
The change In sign of the difference between the paired aliquants also should be considered. The uranium
recovery of the samples containing impurities was much better than that of Uranium only ion exchanged
samples with AG 1 -X8. It would seem logical that it should be easier to recover the uranium from uranium
51
only samples than those containing uranium with impurities. The uranium only ion exchanged samples
showed a better level of recovery (though not significantly better) after ion exchange on AG MP-1 than did
the impurities-spiked samples with that resin.
Both resins produce biased results after titration: for AG 1-X8, the 95% confidence Interval of the mean Is
0.03192; thus the AG 1-X8 mean with confidence interval expression -0.07273 ± 0.03192 for all ionexchanged samples, Illustrates the bias. The AG MP-1 mean with 95% confidence interval expression,
-0.04495 ± 0.02972 for ion exchanged samples, illustrates a similar bias.
The titration results of samples prepared by ion exchange analyst 1 are similar for both resins. However,
the titration results for the two resins were not similar for samples prepared by ion exchange analyst 2: the
bias for AG 1 -X8 Is approximately double that of AG MP-1 for similar standard deviations. Titration results
for samples from both ion exchange days of AG 1-X8 by analyst 2 indicate a significant negative bias. In
all cases (both analysts, both resins), day 2 results have lower levels of recovery than those of IE-day 1.
Titration precision is similar for all titration days of AG MP-1 but not for AG 1 -X8. The precision of titrations
of samples prepared in both glass and Teflon beakers containing AG 1 -X8 are similar, although those titrated
without being Ion exchanged, contained in glass beakers, exhibit less bias. Conversely, the bias of AG MP-1
samples in both types of beakers have similar means (bias), both with and without Ion exchange, but the
precisions are somewhat different depending on container type.
52
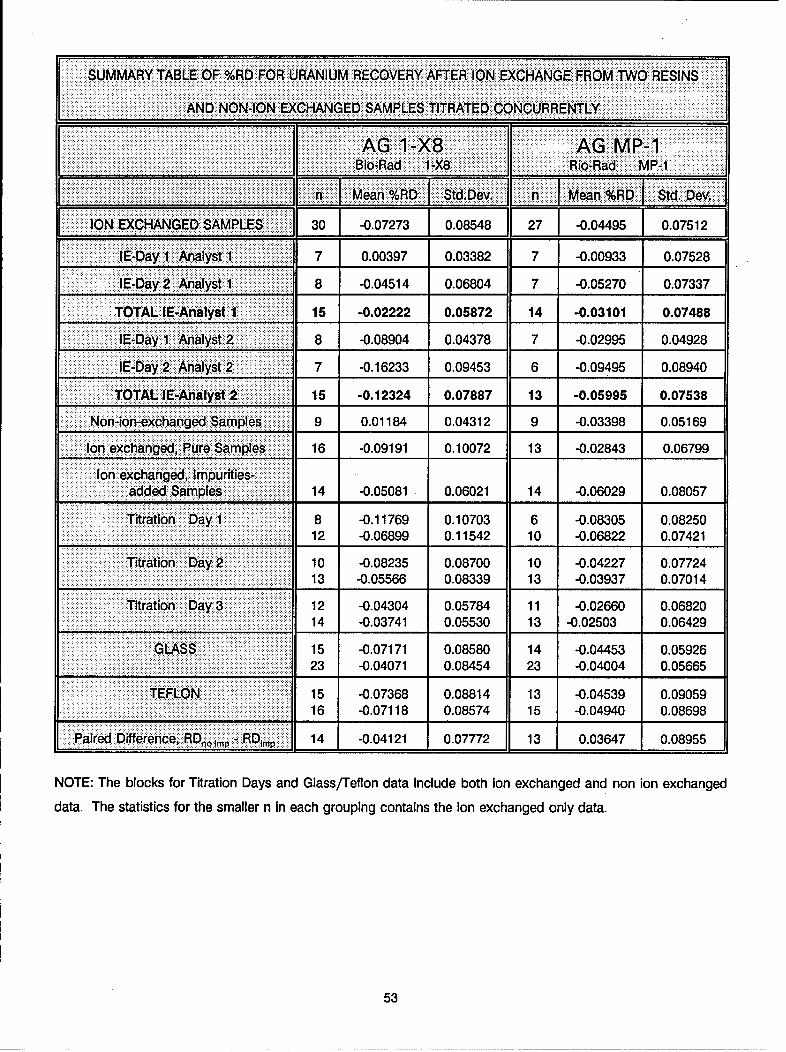
SUMMARY TABLE OF %RD FOR URANIUM RECOVERY AFTER ION EXCHANGE FROM TWO RESINS
AND NON-ION EXCHANGED SAMPLES TITRATED CONCURRENTLY
AG 1 -X8AG MP-1Bio:Rad 1:X8......... ..... o-Rad. MP-1
n: Mean %RD Std.Dev. n MenD Std. Dev,
ION EXCHANGED SAMPLES 30 -0.07273 0.08548 27 1-0.04495 0.07512
fE-Day I Analyst 1 7 0.00397 0.03382 7 -0.00933 0.07528
IE-Day 2 Analyst 1 8 -0.04514 0.06804 7 -0.05270 0.07337
TOTAL IE-Analyst 1 15 -0.02222 0.05872 14 -0.03101 0.07488
fE-Day 1 Analyst 2 8 -0.08904 0.04378 7 -0.02995 0.04928E 2 s-0.16233 0.09453 6 -0.09495 0.08940
TOTAL fE-Analyst 2 15 -0.12324 0.07887 13 -0.05995 0.07538
Non-ion-exchanged Samples 9 0.01184 0.04312 9 -0.03398 0.05169
Ion exchanged, Pure Samples 16 -0.09191 0.10072 13 -0.02843 0.06799
Ion exchanged, Impurities-added Samples 14 -0.05081 0.06021 14 -0.06029 0.08057
Titration Day 1 8 -0.11769 0.10703 6 -0.08305 0.0825012 -0.06899 0.11542 10 -0.06822 0.07421
Titration Day 2 10 -0.08235 0.08700 10 -0.04227 0.0772413 -0.05566 0.08339 13 -0.03937 0.07014
Titration Day 3 12 -0.04304 0.05784 11 -0.02660 0.0682014 -0.03741 0.05530 13 -0.02503 0.06429
GLASS 15 -0.07171 0.08580 14 -0.04453 0.0592623 -0.04071 0.08454 23 -0.04004 0.05665
TEFLON 15 -0.07368 0.08814 13 -0.04539 0.09059
16 -0.07118 0.08574 15 -0.04940 0.08698Paired Difference, RD. 01m,- RD1 ;• 14 -0.04121 0.07772 13 0.03647 0.08955
NOTE: The blocks for Titration Days and Glass/Teflon data include both ion exchanged and non ion exchanged
data. The statistics for the smaller n in each grouping contains the ion exchanged only data.
53
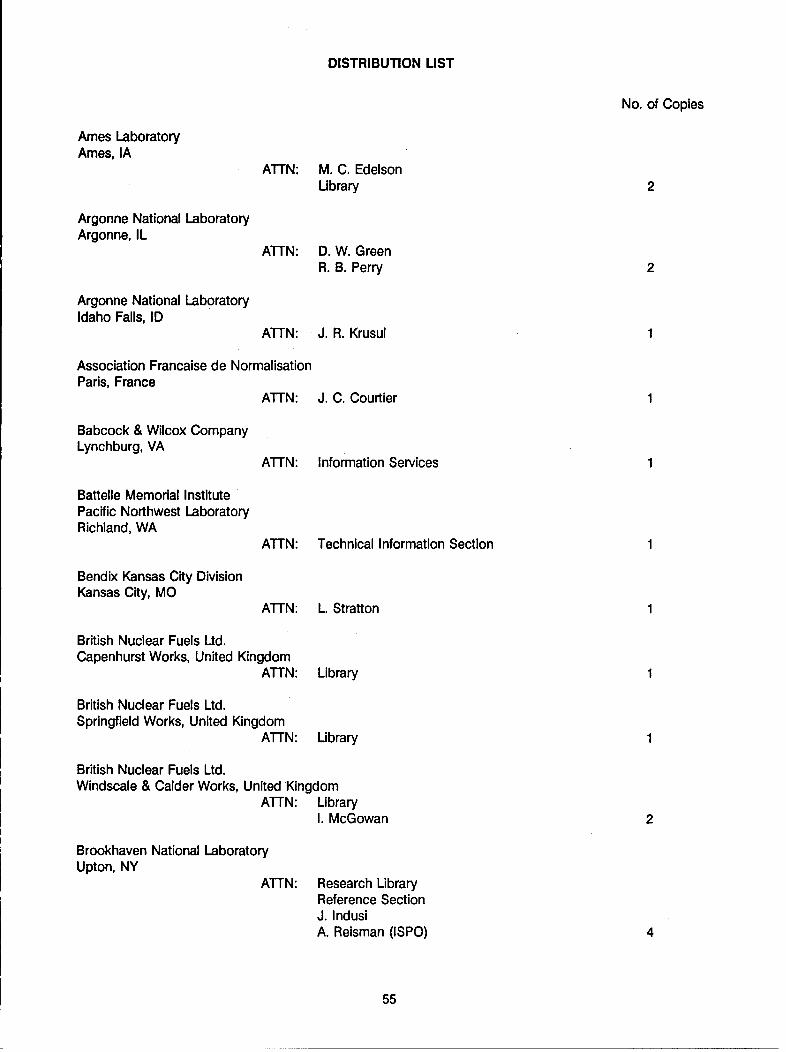
DISTRIBUTION LIST
No. of Copies
Ames LaboratoryAmes, IA
ATTN: M. C. EdelsonLibrary 2
Argonne National LaboratoryArgonne, IL
A'TN: D. W. GreenR. B. Perry 2
Argonne National LaboratoryIdaho Falls, ID
ATTN: J. R. Krusul
Association Francaise de NormalisationParis, France
ATTN: J. C. Courtier
Babcock & Wilcox CompanyLynchburg, VA
ATTN: Information Services
Battelle Memorial InstitutePacific Northwest LaboratoryRichland, WA
ATTN: Technical Information Section
Bendix Kansas City DivisionKansas City, MO
ATTN: L. Stratton
British Nuclear Fuels Ltd.Capenhurst Works, United Kingdom
ATTN: Library
British Nuclear Fuels Ltd.Springfield Works, United Kingdom
ATTN: Library
British Nuclear Fuels Ltd.Windscale & Calder Works, United Kingdom
ATTN: LibraryI. McGowan 2
Brookhaven National LaboratoryUpton, NY
ATTN: Research LibraryReference SectionJ. IndusiA. Reisman (ISPO) 4
55
Bundesanstalt fur MaterlalprufungBerlin, Federal Republic of Germany
ATTN: T. Tamberg
CEC-JRC GeelInstitute for Reference Materials and MeasurementsGeel, Belgium
ATTN: P. DeBievreK. Meyer 2
CEC-JRC KarlsruheInstitute fur TransuraneKarlsruhe, Federal Republic Germany
ATTN: W. Bartscher
CEC-JRC IspraIspra, Italy
ATTN: M. Cuypers
COGEMACenter de la HagueCherbourg, France
ATTN: Mme. Baude
COGEMAEstablissment de PierrelattePierrelatte, France
ATTN: R. Picard
Comitato Nazlonale per I'Energia NucleareRome, Italy
ATTN: A. MocciaV. Pagliai 2
Commissariat a I'Energie AtomiqueGrenoble, France
ATTN: L. ChaussabelJ. Dettwiller 2
General Atomic CompanySan Diego, CA
ATTN: Library
Gessellschaft zur Wiederaufarbeitungvon Kernbrennstoffen mbHEggenstein-LeopoldshafenFederal Republic of Germany
ATTN: R. Berg
International Atomic Energy AgencySafeguards Analytical LaboratorySeibersdorf, Austria
ATTN: S. DeronG. Bagliano 2
56
International Atomic Energy AgencyVienna, Austria
ATTN: E. Kuhn
Kernforschungszentrum Karlsruhe GmbHKarlsruhe, Federal Republic of Germany
ATTN: Library
Lawrence Livermore National LaboratoryLivermore, CA
ATTN: W. Ruhter
Los Alamos National LaboratoryLos Alamos, NM
ATTN: J. PhillipsJ. TapeD. J. TemerReport Librarian 4
Martin Marietta Energy Systems, Inc.Oak Ridge National Laboratory.Oak Ridge, TN
ATTN: J. WadeM. Poutsma 2
Martin Marietta Energy Systems, Inc.Y-12 PlantOak Ridge, TN
ATTN: J. Dorsey
Monsanto Research CorporationMiamisburg, OH
ATTN: R. GossR. SeilerLibrary 3
Westinghouse Materials Co. of OhioCincinnati, OH
ATTN: Library
Nuclear Fuel ServicesErwin, TN
ATTN: Library
Nuclear Material Control CenterSafeguards Analytical LaboratoryJapan
ATTN: K. Iwamoto 2
Reaktor Brennelement Union GmbHHanau, Federal Republic of Germany
ATTN: R. Saiger
57
Westinghouse Hanford OperationsRichland, WA
ATTN: B. BairdH. MeznarichA. E. Schilling 3
Rockwell InternationalRocketdyne DivisionCanoga Park, CA
ATTN: Library
EG&GRocky Flats PlantGolden, CO
ATTN: J. WeissLibrary 2
Sandia National LaboratoriesAlbuquerque, NM
ATTN: D. Miyoshi
Studiecentrum voor KernenergieCentre d'Etude de I'Energle NuclealreMol, Belgium
ATTN: P. DeRegge
United Kingdom Atomic Energy AuthorityAtomic Energy Research EstablishmentHarwell, United Kingdom
ATTN: D. Crossley
United Kingdom Atomic Energy AuthorityDounreay Nuclear Power Development EstablishmentUnited Kingdom
ATTN: J. L. Drummond
STRUGHOLD (TSK) Aero Medical LibraryUSAF School of Aerospace MedicineBrooks AFB, TX
ATTN: Documents Librarian
U.S. Department of EnergyWashington, D.C.
ATTN: DOE Library
U.S. Department of EnergyOffice of Safeguards and SecurityWashington, D.C.
ATTN: E. J. McCallum0. B. JohnsonB. ToddD. W. CrawfordG. D. Smith 5
58
U.S. Department of EnergyAlbuquerque Operations OfficeAlbuquerque, NM
ATTN: L. Muller
U.S. Department of EnergyChicago Operations OfficeArgonne, IL
ATTN: T. GradleC. PietriJ. HuagenR. Lang 4
U.S. Department of EnergyIdaho Operations OfficeIdaho Falls, ID
ATTN: B. Green
U.S. Department of EnergyNew Brunswick LaboratoryArgonne, IL
ATTN: H. R. MartinK. LewisR. D. OldhamW. G. MitchellM. M. Lachman 5
U.S. Department of EnergyOak Ridge, TN
ATTN: Technical Information Center 4
U.S. Department of EnergyOak Ridge Operations OfficeOak Ridge, TN
ATTN: R. GreenG. Proco 2
U.S. Department of EnergyPittsburgh Energy Technology CenterPittsburgh, PA
ATTN: Technical Library
U.S. Department of EnergyRichland Operations OfficeRichland, WA
ATTN: J. Spracklen
U.S. Department of EnergyRocky FlatsGolden, CO
ATTN: B. Reece
59
U.S. Department of EnergyOakland Operations OfficeOakland, CA
ATTN: J. TurnerD. Wilhem 2
U.S. Department of EnergySavannah River Operations OfficeAiken, SC
ATTN: T. Williams
U.S. Department of EnergySchnectady Naval Reactors OfficeSchnectady, NY
ATTN: B. M. Erickson
U.S. Environmental Protection AgencyLas Vegas, NV
ATTN: Director
U.S. Nuclear Regulatory CommissionRegion IIAtlanta, GA
ATTN: E. McAlpine
U.S. Nuclear Regulatory CommissionRegion IIIGlen Ellyn, IL
ATTN: L. Creed
U.S. Nuclear Regulatory CommissionRegion VWalnut Creek, CA
ATTN: J. Montgomery
Westinghouse Electric CorporationWest Mifflin, PA
ATTN: Librarian
Westinghouse Hanford CompanyRichland, WA
ATTN: Document Control
Westinghouse Idaho Nuclear CompanyIdaho Falls, ID
ATTN: Technical Library
Westinghouse Savannah River Co.Savannah River SiteAiken, SC
ATTN: P. T. Deason, Jr.A. GibbsM. K. HollandW. A. SpencerTechnical Library 5
60