Embed Size (px)
Citation preview
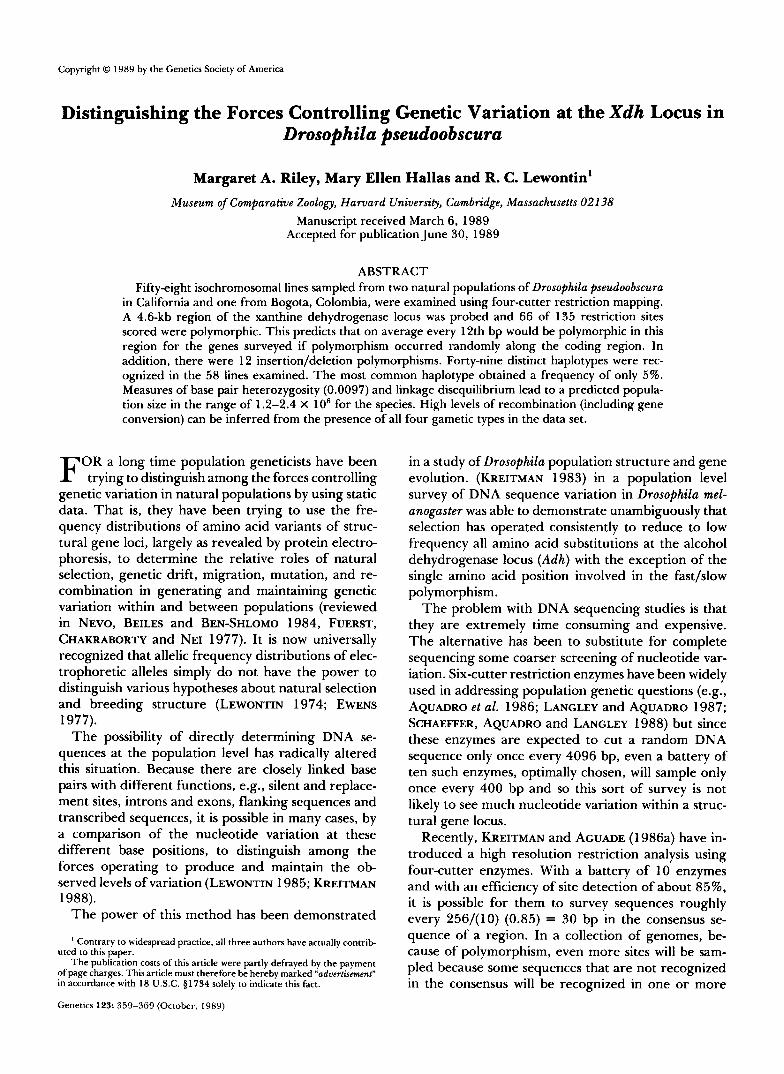
Copyright 0 1989 by the Genetics Society of America
Distinguishing the Forces Controlling Genetic Variation at the Xdh Locus in Drosophila pseudoobscura
Margaret A. Riley, Mary Ellen Hallas and R. C. Lewontin' Museum of Comparative Zoology, Haruard University, Cambridge, Massachusetts 02138
Manuscript received March 6 , 1989 Accepted for publication June 30, 1989
ABSTRACT Fifty-eight isochromosomal lines sampled from two natural populations of Drosophila pseudoobscura
in California and one from Bogota, Colombia, were examined using four-cutter restriction mapping. A 4.6-kb region of the xanthine dehydrogenase locus was probed and 66 of 135 restriction sites scored were polymorphic. This predicts that on average every 12th bp would be polymorphic in this region for the genes surveyed if polymorphism occurred randomly along the coding region. In addition, there were 12 insertion/deletion polymorphisms. Forty-nine distinct haplotypes were rec- ognized in the 58 lines examined. The most common haplotype obtained a frequency of only 5%. Measures of base pair heterozygosity (0.0097) and linkage disequilibrium lead to a predicted popula- tion size in the range of 1.2-2.4 X 1 O6 for the species. High levels of recombination (including gene conversion) can be inferred from the presence of all four gametic types in the data set.
F OR a long time population geneticists have been trying to distinguish among the forces controlling
genetic variation in natural populations by using static data. That is, they have been trying to use the fre- quency distributions of amino acid variants of struc- tural gene loci, largely as revealed by protein electro- phoresis, to determine the relative roles of natural selection, genetic drift, migration, mutation, and re- combination in generating and maintaining genetic variation within and between populations (reviewed in NEVO, BEILES and BEN-SHLOMO 1984, FUERST, CHAKRABORTY and NEI 1977). It is now universally recognized that allelic frequency distributions of elec- trophoretic alleles simply do not have the power to distinguish various hypotheses about natural selection and breeding structure (LEWONTIN 1974; EWENS 1977).
The possibility of directly determining DNA se- quences at the population level has radically altered this situation. Because there are closely linked base pairs with different functions, e.g., silent and replace- ment sites, introns and exons, flanking sequences and transcribed sequences, it is possible in many cases, by a comparison of the nucleotide variation at these different base positions, to distinguish among the forces operating to produce and maintain the ob- served levels of variation (LEWONTIN 1985; KREITMAN 1988).
The power of this method has been demonstrated
uted to this paper. ' Contrary to widespread practice, all three authors have actually contrib-
of page charges. This article must therefore be hereby marked "aduertkcmcnt" The publication costs of this article were partly defrayed by the payment
in accordance with 18 U.S.C. 81734 solely to indicate this fact.
Genetics 123: 359-369 (October, 1989)
in a study of Drosophila population structure and gene evolution. (KREITMAN 1983) in a population level survey of DNA sequence variation in Drosophila mel- anogaster was able to demonstrate unambiguously that selection has operated consistently to reduce to low frequency all amino acid substitutions at the alcohol dehydrogenase locus (Adh) with the exception of the single amino acid position involved in the fast/slow polymorphism.
The problem with DNA sequencing studies is that they are extremely time consuming and expensive. The alternative has been to substitute for complete sequencing some coarser screening of nucleotide var- iation. Six-cutter restriction enzymes have been widely used in addressing population genetic questions (e.g., AQUADRO et al. 1986; LANGLEY and AQUADRO 1987; SCHAEFFER, AQUADRO and LANGLEY 1988) but since these enzymes are expected to cut a random DNA sequence only once every 4096 bp, even a battery of ten such enzymes, optimally chosen, will sample only once every 400 bp and so this sort of survey is not likely to see much nucleotide variation within a struc- tural gene locus.
Recently, KREITMAN and AGUADE (1 986a) have in- troduced a high resolution restriction analysis using four-cutter enzymes. With a battery of 10 enzymes and with an efficiency of site detection of about 85%, it is possible for them to survey sequences roughly every 256/(10) (0.85) = 30 bp in the consensus se- quence of a region. In a collection of genomes, be- cause of polymorphism, even more sites will be sam- pled because some sequences that are not recognized in the consensus will be recognized in one or more
360 M. A. Riley, M. E. Hallas and R. C. Lewontin
members of the collection. Since each recognized sequence involves 4 bp, one is screening, under opti- mal conditions, 1 in every 7 bases.
Such a technique cannot address precisely the same questions as complete sequence data because it cannot generally distinguish between silent and replacement polymorphisms within coding regions, although it can distinguish between changes in coding and noncoding regions if a sequence of the gene is already available. However, four-cutter analysis can, as we will see, provide a great deal of information about the impor- tance of selection, migration and recombination in producing the levels and patterns of nucleotide vari- ation we observe, although the final resolution of the action of natural selection demands some amount of complete sequence data (see discussion).
Studies of the Adh locus (KREITMAN and ACUADE 1986a, b; SIMMONS et al. 1989) and the white locus (MIYASHITA and LANGLEY 1988) in D. melanogaster using the four-cutter technique have given direct evi- dence on the roles of migration, recombination and population size in determining genetic variation at these loci in Drosophila melanogaster. Moreover, from data on variation in heterozygosity from one region of the gene to another, KREITMAN and ACUADE (1 986b) and HUDSON, KREITMAN and ACUADE (1 987) were able to find evidence of balancing selection main- taining the fast/slow polymorphism at the Adh locus.
In this paper we describe a four-cutter restriction survey of nucleotide variation at the xanthine dehy- drogenase locus (Xdh) of Drosophila pseudoobscura. This is part of a larger study of sequence variation at the locus designed to discriminate among the various forces controlling genetic variation for the Xdh gene. The alcohol dehydrogenase gene is an example of a rather invariant locus. In D. melanogaster, it has only a single widespread amino acid polymorphism with two alleles, plus a low frequency polymorphism of a third amino acid variant in many populations. In D. pseudoobscura the locus is electrophoretically mono- morphic. This is in sharp contrast to the Xdh gene. In a sample of 96 and 89 genomes from two natural populations of D. pseudoobscura, 12 and 15 alleles, respectively, were found (KEITH et al. 1985), and in the closely related species, Drosophila persimilis, 23 alleles were found in only 60 genomes (COYNE 1976). The level of polymorphism is comparable in D . mela- nogaster (BUCHANAN andJOHNSON 1983). How are we to explain the immense difference in genetic variation between the Adh and Xdh genes, a difference that transcends species boundaries? What are the roles of population structure, migration, recombination and selection, in differentiating these loci? The data we will give on four-cutter analysis allow us to draw some clear conclusions, but we also show the limitations of less than complete sequence information, limitations
TABLE 1
Frequencies of electromorphs of XDH found by KEITH et al. (1985) in two California populations of D. pseudoobscura
Electromorph JR GB
A B C D E F G H I K M Other singletons Total
Numbers in parentheses are the number of lines sampled in the present study.
that can only be overcome by a second stage of study in which complete sequence information is deter- mined for certain classes of genomes.
MATERIALS AND METHODS
Samples: Flies were collected from two populations in California, James Reserve (JR) and Gundlach-Bundschu (GB) winery, separated by about 500 km (KEITH 1983). In a large study of electromorphic variation at the Xdh locus, 184 isochromosomal lines were constructed and the electro- phoretic mobility of the xanthine dehydrogenase enzyme (XDH) was determined for each line using sequential gel electrophoresis (KEITH et al. 1985). Table 1 shows the frequency distribution of the electrophoretic alleles found by KEITH et al. (1985) and shows, in parentheses, the number of lines of each electromorph from each population that appear in the present study. With one exception, we have sampled more than one line from each population for all the alleles that were multiply represented in the electropho- retic survey, plus 4 of the 13 unique alleles. In addition, we have studied three lines from Bogota, Colombia, that are representative of the common allele there (L), not found in the California populations. Our sample is then not a random sample of genomes from nature, but a representative one with respect to the electrophoretic mobility variants, with some attempt to represent these electromorphic classes in very rough proportion to their frequency in nature. The only significant departure from this protocol is the small number of lines (five from each population) of the most common electrophoretic allele which makes up 60% of the frequency distribution in both populations.
Restriction map analysis: Genomic DNA preparation, restriction digests, electrophoresis and transfer procedures all follow the methods of KREITMAN and ACUADE (1 986a). The following seven enzymes were used: AluI, DdeI, HaeIII, Hinfl, MapI, Sau96A and TaqI. A 4.5-kb EcoRIISalI frag- ment that includes a large portion of the Xdh gene of D. pseudoobscura was used. This fragment corresponds to nu- cleotides #887 to #5358 in RILEY (1989). The structure of the Xdh locus, as determined by RILEY (1989), and the location of the 4.5 Kb probe employed in this study are given in Figure 1. The location of the 3' exon of L(3)512 is given for reference. It should be noted that the 4.5-kb probe will effectively survey a longer sequence of the ge-
Xdh Nucleotide Polymorphism 36 1
0 -" - - m c m o= " -
c EN c. n-
I - " n L P E: 9 =. I =-a- T% I, 55 - - - "
" "- """" """" " "- "̂ - " I " " " "" """ - -
I
T t u - w m n=Nccraez:gSL:fs ;g :$: 33: zE g-;
: $ 2 E: I:: :$ $ 2 ;$:: $Ecr:l? """"" "" "- "- - " " " " "" """
mu) 0 d .4 JL 4 $ N a0 E - ;;$! 5 - i
IC) 0 0 P N E - n * - S ' D
" m?? - 5 s " n - - -
0 - v 1 1 I 0 E
0 0
0
9 (D
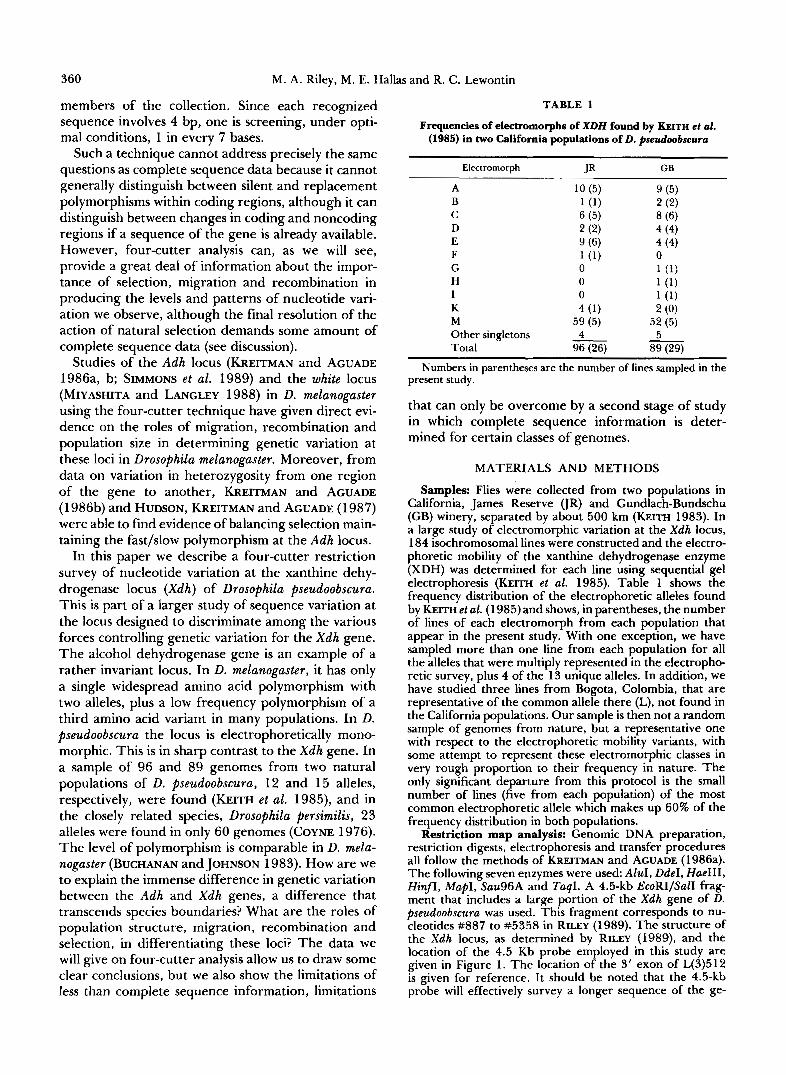
FIGURE 1.-Structure of the Xdh gene in D. pseudoobscura and the location of the polymorphic restriction sites found in this study. Center: Black boxes indicate Xdh exons, clear boxes indicate 1(3)s12 exons. Depressed lines indicate introns. Below: Scale is in base pairs with arrows delimiting the location of the probe employed. Above: Polymorphic restriction sites above the line. Insertion(i)/deletion(d) polymorphisms below the line. S = Sau96A, A = AluI, D = DdeI, H = HaeIII, F = HinfI, M = MspI, T = Tug.
nome, about 5.2 kb in this survey, since certain fragments will overhang the region probed at each end.
Polymorphic sites were scored based upon knowledge of a standard sequence for the Xdh region. 'We were able to reliably detect on our gels fragments as small as 100 bp and insertion/deletion differences of only 1 bp. The standard reference sequence predicts 149 four-base recognition se- quences for our panel of seven enzymes. We can only detect a cut site if the two nearest four-cutter sites flanking it on either side are more than 100 bp apart, because only then will a cut at the interior site cause elther the disappearance or detectable breaku of a fragment produced by the flank- ing sites. The loss o P a site that is present in the reference sequence will be detectable as a polymorphism if, again, the immediately flanking sites are more than 100 bp apart. In the reference sequence 129 out of the 149, or 86.5% meet this criterion and so should be detectable as monomorphi- cally present or polymorphic in our sample. In addition, in the total sample of all genomes, some sites that are absent from the reference sequence will be polymorphically present in at least one other genome. These will be redominantly one of the 1607 four-base sequences that di fp er by one base from a recognition sequence in the reference. Of all of these that are polymorphic, only one in twelve will have a base substitution that produces a recognition site, and of these again about 86% should be detected in our gels. As our results below show, the proportion of 4 base sequences estimated to be polymorphic is 0.289. There are then an additional (1607) (0.86) (0.289)/12 = 33 expected sites to be detected in our sample, making a grand total theoretically of 129 + 33 = 162. As we see below, we have detected reliably 135 sites, so we are close to our theoretical effi- ciency.
The loss of a site could be assigned to a specific reco ni- tion sequence (1 of 4 bases). The gain of a site could o B ten be assigned to a specific nucleotide position or region based upon knowledge of all one-off potential recognition se- quences in the standard sequence of the region, with the assumption that each site gain (and loss) involved a single nucleotide substitution. Insertion/deletion events were as- signed a location with a precision determined by the number and sizes of overlapping restriction fragments containing each insertion/deletion polymorphism.
RESULTS Restriction map variation: T h e seven four-cutter
enzymes detected 135 single sites of which 66 (49%)
were polymorphic, plus 12 insertion/deletion length polymorphisms in the 58 genomes surveyed. The locations of the 78 polymorphisms (single sites plus insertion/deletions) are shown on the physical map of the gene in Figure 1, and the statistics of these is summarized in Table 2. Fifty-seven percent of the lines differ from the most common restriction map by one or two insertion/deletion length variants. These length polymorphisms range in size from 1 base pair to 50 bp. Eleven out of the 12 insertion/deletion polymorphisms are in noncoding regions. Although five lines have more than one length variant, four of these lines share the same two deletions relative to the consensus sequence. These four lines represent both populations and one electrophoretic mobility class (E).
Different functional regions of the gene differ in their polymorphism (Table 2). The observed propor- tion of sites polymorphic is heterogeneous among regions (G4d.f. = 13.26, P = O.Ol), but this heteroge- neity is entirely accounted for by the difference be- tween coding and noncoding regions, (GI d.f. = 8.94, P < 0.01), while there is no significant heterogeneity among the exons (G2d.f. = 2.41, P = 0.30) or among noncoding regions (G2d.f. = 2.72, P = 0.25). There are twice as many polymorphisms in noncoding as in coding regions.
Statistically significant heterogeneity between re- gions can arise from determinate differences such as differences in mutation/correction rates or differ- ences in selection on the regions, or it can reflect a variance that has arisen from purely historical sam- pling processes in the breeding history of the popula- tion that give rise to real variation from region to region. The fact that the heterogeneity is between coding and noncoding regions, while there is no sig- nificant heterogeneity among exons or among non- coding regions, certainly points to selection as the cause.
362 M. A. Riley, M. E. Hallas and R. C. Lewontin
TABLE 2
Summary of results of four-cutter analysis
Region Length
5’ intergenic 199 Exon I 54 Intron I 1024 Exon I1 2613 intron I l l 62 Exon 111 528
Total 4480
-
-
scored Sites
polymorphic No. sites
Inserts/Deletes polymorphisms Total
13 7 3 10 3 0 0 0
28 20 6 26 75 25 1 26 3 1 2 3 - 25 147
- 13 66
- 0 12
- 13 78
p total = 0.087 p (noncoding) = 0.146 p (exons) = 0.062
Estimated proportion P
b.p. polymorphic
0.108 0 0.184 0.054 0.333 0.102 0.087
From the data in Table 2 we can estimate the proportion of base pairs polymorphic in this sample for the gene using a formula derived from HUDSON (1982), modified to take account of multiple hits in each four base sequence. In this calculation the inser- tion/deletion polymorphisms are excluded since they do not contribute information on the proportion of nucleotides polymorphic.
Let
k = observed number of polymorphisms m = number of sites cut including monomorphic
j = length of the recognition sequence P = estimated proportion of four-base sites poly-
sites
morphic
and
p = estimated proportion of bases polymorphic.
Then k 66
(2m - k) 270 - 66 P = - - = 0.323
p = 1 - (1 - P)’’j = 0.0938
“error” SD* = 0.01080. Thus, about 1 in every 12 bp is polymorphic in this
sample in the Xdh region of D. pseudoobscura, given the simplifying assumption that polymorphisms are randomly distributed across the region probed.
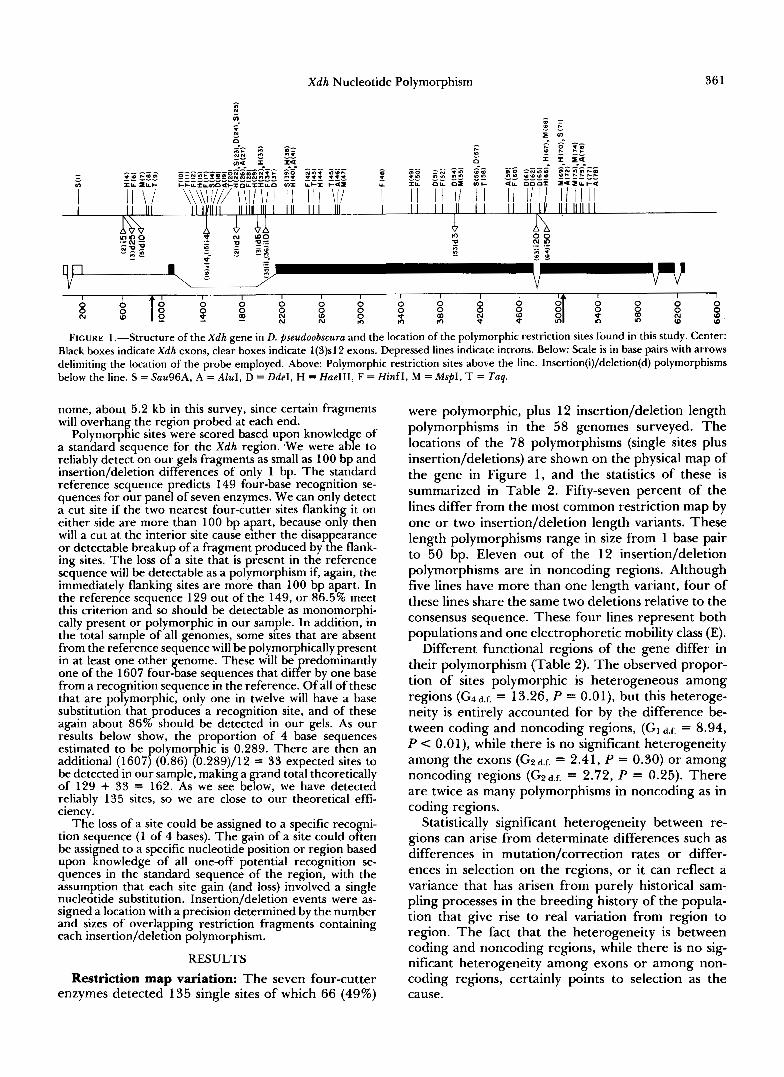
If we regard the presence of a recognition site as a “+” allele and its absence as a “-” allele, we can calculate the distribution of allele frequencies over the 78 polymorphisms. Figure 2 shows this distribu- tion. In each population separately and in the total sample the allele distributions are J-shaped with most polymorphisms having allele frequencies close to 0 or 1. There are only two (the same sites in both popula-
that the position form a homogeneous sample with only binomial sampling ’ This standard deviation is based only on binomial sampling error given
error. I t does not take account of the variance in heterozygosity among sites.
correlation among sites but, as we show below, there is essentially no linkage There is also a variance among genomes that would be associated with
disequilibrium.
24
FIGURE 2,”Distribution of + allele frequencies (q) for the 78 polymorphic sites in the two populations. JR population above the line. GB population below the line. Open boxes are the polymorphic sites absent or fixed in either population.
tions) that are at an intermediate frequency polymor- phism. These both fall in the large first intron (sites #18 and #32).
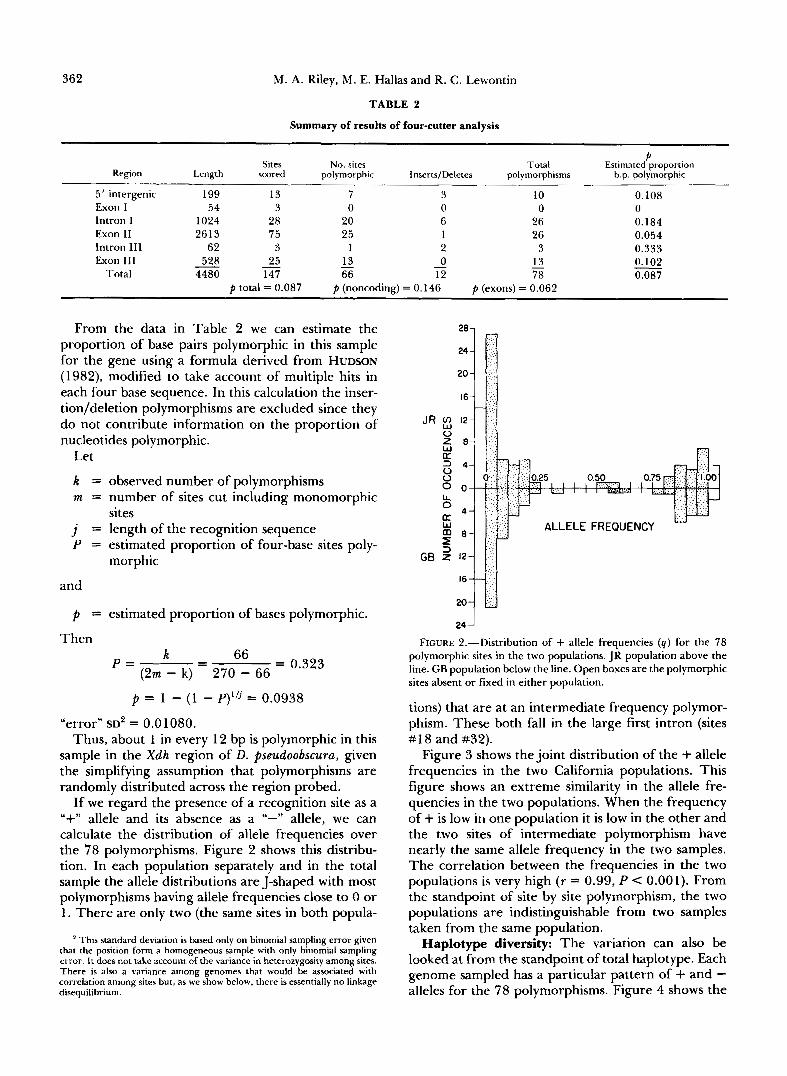
Figure 3 shows the joint distribution of the + allele frequencies in the two California populations. This figure shows an extreme similarity in the allele fre- quencies in the two populations. When the frequency of + is low in one population it is low in the other and the two sites of intermediate polymorphism have nearly the same allele frequency in the two samples. The correlation between the frequencies in the two populations is very high ( r = 0.99, P < 0.001). From the standpoint of site by site polymorphism, the two populations are indistinguishable from two samples taken from the same population.
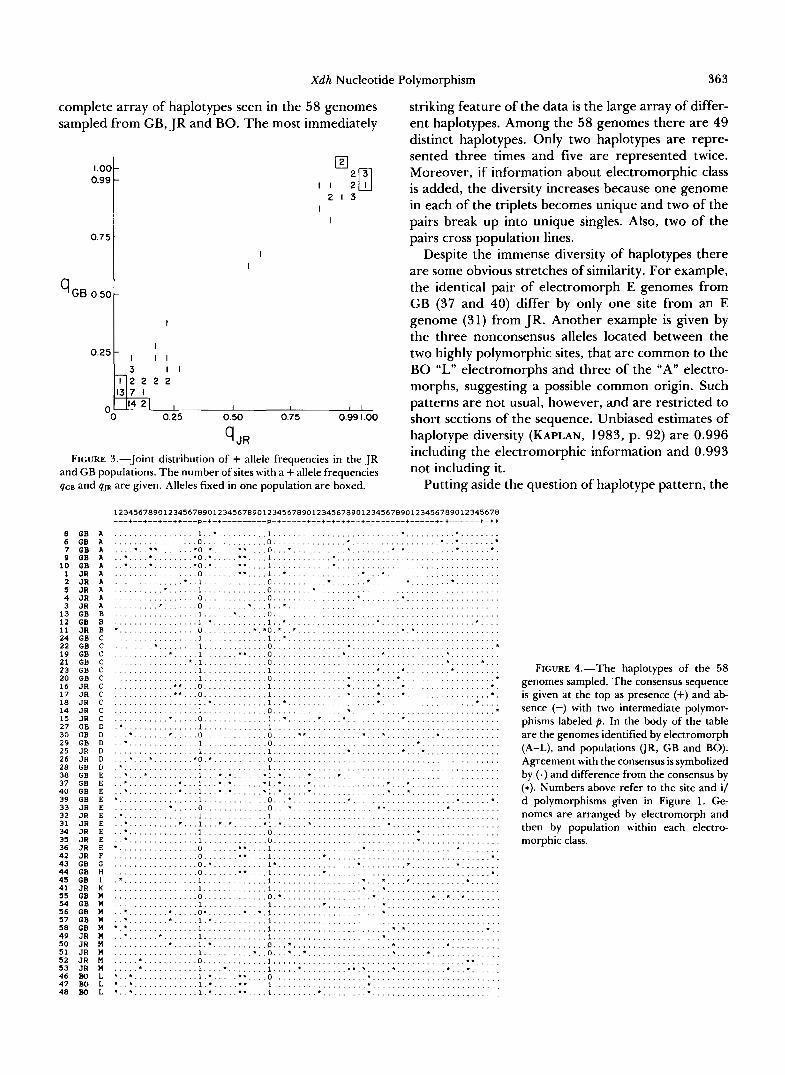
Haplotype diversity: The variation can also be looked at from the standpoint of total haplotype. Each genome sampled has a particular pattern of + and - alleles for the 78 polymorphisms. Figure 4 shows the
X d h Nucleotide Polymorphism 363
complete array of haplotypes seen in the 58 genomes sampled from GB, JR and BO. The most immediately
;:::l I I ;m El
2 1 3
0 7 5
g GB 0.50
I I
-
I I
-
I I
0.25k; 2 ; ; I 1317 l
o 114 21 I 1 I 1 1
0 0.25 0.50 0.75 0.99 1.00
%R FIGURE 3.-Joint distribution of + allele frequencies in the JR
and GB populations. The number of sites with a + allele frequencies qce and qJR are given. Alleles fixed in one population are boxed.
striking feature of the data is the large array of differ- ent haplotypes. Among the 58 genomes there are 49 distinct haplotypes. Only two haplotypes are repre- sented three times and five are represented twice. Moreover, if information about electromorphic class is added, the diversity increases because one genome in each of the triplets becomes unique and two of the pairs break up into unique singles. Also, two of the pairs cross population lines.
Despite the immense diversity of haplotypes there are some obvious stretches of similarity. For example, the identical pair of electromorph E genomes from GB (37 and 40) differ by only one site from an E genome (31) from JR. Another example is given by the three nonconsensus alleles located between the two highly polymorphic sites, that are common to the BO “L” electromorphs and three of the “A” electro- morphs, suggesting a possible common origin. Such patterns are not usual, however, and are restricted to short sections of the sequence. Unbiased estimates of haplotype diversity (KAPLAN, 1983, p. 92) are 0.996 including the electromorphic information and 0.993 not including it.
Putting aside the question of haplotype pattern, the
FIGURE 4.-The haplotypes of the 58 genomes sampled. The consensus sequence is given at the top as presence (+) and ab- sence (-) with two intermediate polymor- phisms labeled p . In the body of the table are the genomes identified by electromorph (A-L), and populations (JR, GB and BO). Agreement with the consensus is symbolized by ( - ) and difference from the consensus by (*). Numbers above refer to the site and i/ d polymorphisms given in Figure 1. Ge- nomes are arranged by electromorph and then by population within each electro- morphic class.
364 M. A. Riley, M. E. Hallas and R. C. Lewontin
TABLE 3
Number of sites differing per genome, within and between localities and electromorphs
Sites Mean Variance N SE4
Within populations 9.0086 4.9748 734 0.0823 Between populations 9.2524 25.0162 919 0.1650 Within electromorphs 8.5509 86.0773 216 0.6313 Between electromorphs 9.2742 5.6438 1437 0.0627 In populations in elec- 8.0612 80.4018 98 0.9058
In populations between 9.2469 97.2181 636 0.3910
Between populationsin 8.9576 94.1574 118 0.8933
Between population 9.2959 14.9233 801 0.1365
tromorph
electromorph
electromorph
between electro- morph
Total data 9.1796 16.1170 1653 0.0987
a Standard errors are calculated directly from the observed var- iances in number of site differences among all pairwise comparisons within a given category.
similarities of haplotypes can be computed simply from the number of sites at which any two genomes differ. We have calculated these differences for all (58) (57)/2 = 1653 pairs of genomes and the results are summarized in Table 3. The difference between two genomes ranges from 0 to 24 with a mean of 9.18. As Table 3 shows there is a slightly greater difference between genomes from different popula- tions than from the same population and a slightly greater difference between haplotypes of different electromorphs than within the same electromorphs but both of these contrasts are far from statistical significance. Because all 1653 pairs of differences are not independent of one another, the actual degrees of freedom associated with the variances in Table 3 are much smaller than the sample sizes N (they are more nearly equal to m. Thus, the true standard errors appropriate to testing significance are even larger than those given, so the contrasts are even farther from statistical significance than suggested by the standard errors in Table 3. The discrepancy be- tween the variance of haplotype differences when the haplotypes come from different populations and when they are chosen from the same population arises from a clustering of haplotypes into subclasses that may cross population boundaries. That is, some subgroups of similar haplotypes occur in both populations while others are restricted to only one population. As a result, a difference between haplotypes taken from different populations may be either large or small, depending upon whether they are taken from one of the unshared or shared haplotype groups, while dif- ferences between haplotypes within populations are more consistent. The opposite difference in variance is seen within and between electromorphs, because electromorphic classes do not show similar subgroups.
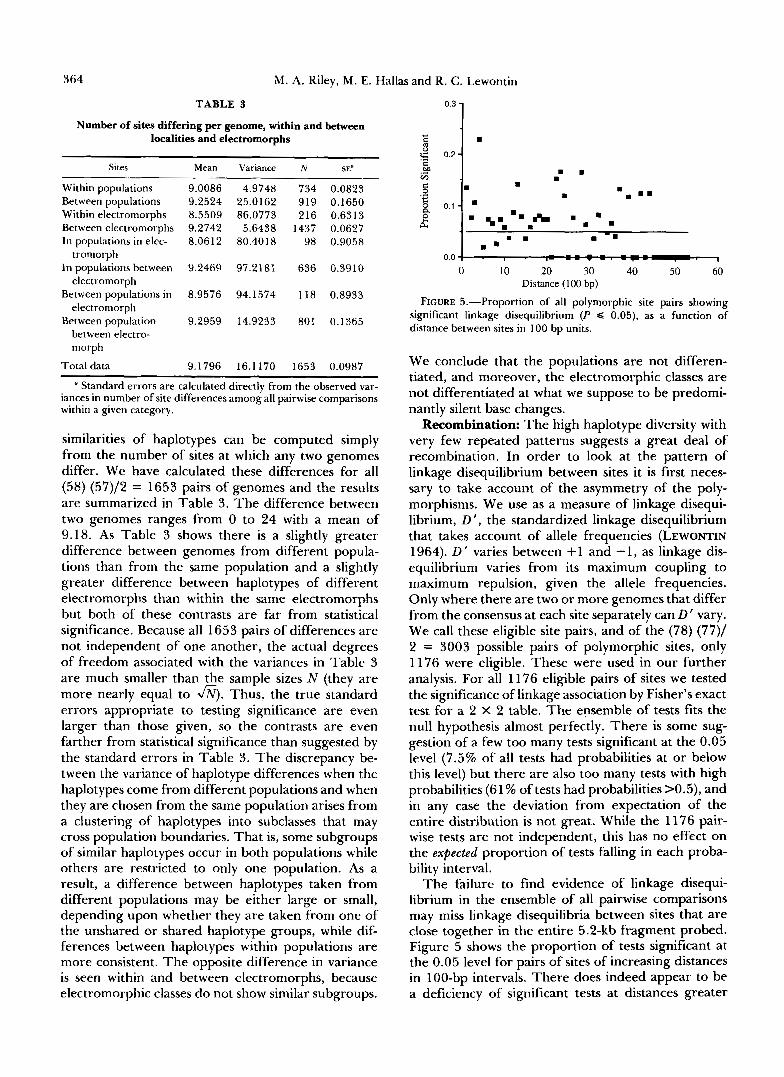
0 10 20 30 40 50 60 Distance (100 bp)
FIGURE 5.-Proportion of all polymorphic site pairs showing significant linkage disequilibrium ( P 6 0.05), as a function of distance between sites in 100 bp units.
We conclude that the populations are not differen- tiated, and moreover, the electromorphic classes are not differentiated at what we suppose to be predomi- nantly silent base changes.
Recombination: The high haplotype diversity with very few repeated patterns suggests a great deal of recombination. In order to look at the pattern of linkage disequilibrium between sites it is first neces- sary to take account of the asymmetry of the poly- morphisms. We use as a measure of linkage disequi- librium, D ', the standardized linkage disequilibrium that takes account of allele frequencies (LEWONTIN 1964). D ' varies between +1 and -1, as linkage dis- equilibrium varies from its maximum coupling to maximum repulsion, given the allele frequencies. Only where there are two or more genomes that differ from the consensus at each site separately can D' vary. We call these eligible site pairs, and of the (78) (77)/ 2 = 3003 possible pairs of polymorphic sites, only 11 76 were eligible. These were used in our further analysis. For all 1176 eligible pairs of sites we tested the significance of linkage association by Fisher's exact test for a 2 X 2 table. The ensemble of tests fits the null hypothesis almost perfectly. There is some sug- gestion of a few too many tests significant at the 0.05 level (7.5% of all tests had probabilities at or below this level) but there are also too many tests with high probabilities (6 1 % of tests had probabilities >0.5), and in any case the deviation from expectation of the entire distribution is not great. While the 1176 pair- wise tests are not independent, this has no effect on the expected proportion of tests falling in each proba- bility interval.
The failure to find evidence of linkage disequi- librium in the ensemble of all pairwise comparisons may miss linkage disequilibria between sites that are close together in the entire 5.2-kb fragment probed. Figure 5 shows the proportion of tests significant at the 0.05 level for pairs of sites of increasing distances in 100-bp intervals. There does indeed appear to be a deficiency of significant tests at distances greater
Xdh Nucleotide Polymorphism 365
.. y = 0.4619 - 5.061e-5x R = 0.25
0.8 1’ . .
V. V
0 1000 2000 3000 4000 5000
Distance Between Sites (bp)
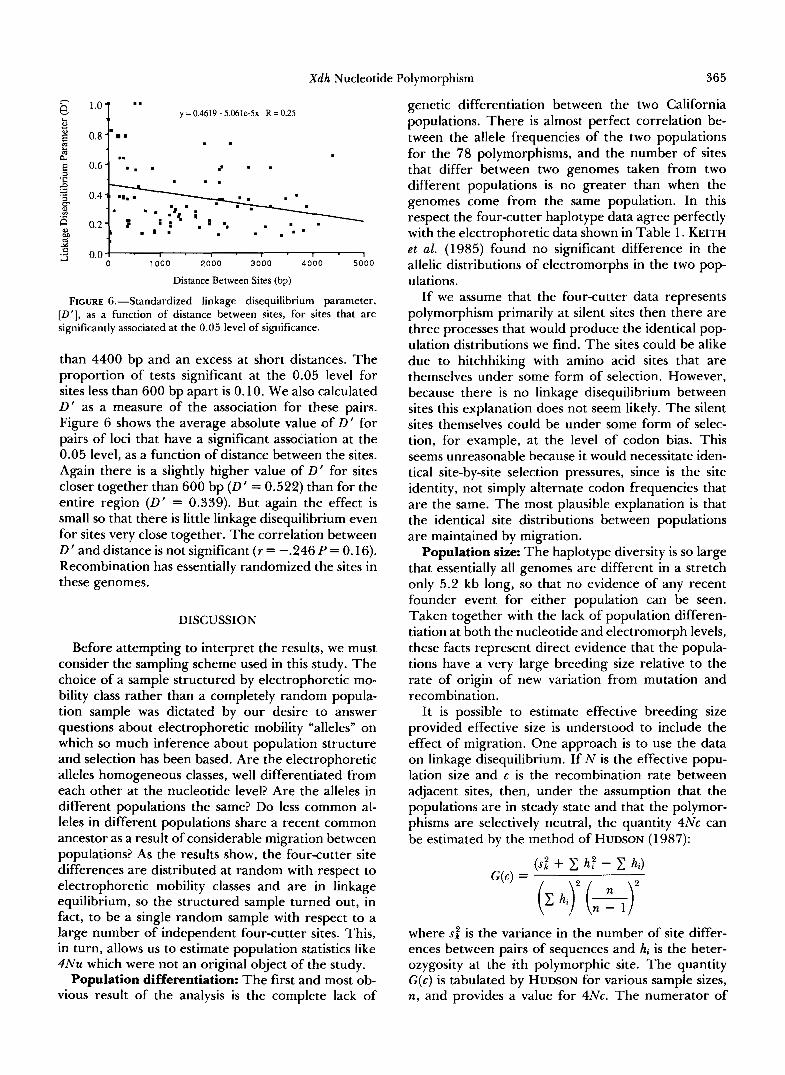
FIGURE 6,”Standardized linkage disequilibrium parameter, [ D ’ ] , as a function of distance between sites, for sites that are significantly associated at the 0.05 level of significance.
than 4400 bp and an excess at short distances. The proportion of tests significant at the 0.05 level for sites less than 600 bp apart is 0.10. We also calculated D’ as a measure of the association for these pairs. Figure 6 shows the average absolute value .of D’ for pairs of loci that have a significant association at the 0.05 level, as a function of distance between the sites. Again there is a slightly higher value of D’ for sites closer together than 600 bp (D’ = 0.522) than for the entire region (D’ = 0.339). But again the effect is small so that there is little linkage disequilibrium even for sites very close together. The correlation between D’ and distance is not significant ( r = -.246 P = 0.16). Recombination has essentially randomized the sites in these genomes.
DISCUSSION
Before attempting to interpret the results, we must consider the sampling scheme used in this study. The choice of a sample structured by electrophoretic mo- bility class rather than a completely random popula- tion sample was dictated by our desire to answer questions about electrophoretic mobility “alleles” on which so much inference about population structure and selection has been based. Are the electrophoretic alleles homogeneous classes, well differentiated from each other at the nucleotide level? Are the alleles in different populations the same? Do less common al- leles in different populations share a recent common ancestor as a result of considerable migration between populations? As the results show, the four-cutter site differences are distributed at random with respect to electrophoretic mobility classes and are in linkage equilibrium, so the structured sample turned out, in fact, to be a single random sample with respect to a large number of independent four-cutter sites. This, in turn, allows us to estimate population statistics like 4Nu which were not an original object of the study.
Population differentiation: The first and most ob- vious result of the analysis is the complete lack of
genetic differentiation between the two California populations. There is almost perfect correlation be- tween the allele frequencies of the two populations for the 78 polymorphisms, and the number of sites that differ between two genomes taken from two different populations is no greater than when the genomes come from the same population. In this respect the four-cutter haplotype data agree perfectly with the electrophoretic data shown in Table 1. KEITH et al. (1985) found no significant difference in the allelic distributions of electromorphs in the two pop- ulations.
If we assume that the four-cutter data represents polymorphism primarily at silent sites then there are three processes that would produce the identical pop- ulation distributions we find. The sites could be alike due to hitchhiking with amino acid sites that are themselves under some form of selection. However, because there is no linkage disequilibrium between sites this explanation does not seem likely. The silent sites themselves could be under some form of selec- tion, for example, at the level of codon bias. This seems unreasonable because it would necessitate iden- tical site-by-site selection pressures, since is the site identity, not simply alternate codon frequencies that are the same. The most plausible explanation is that the identical site distributions between populations are maintained by migration.
Population size: The haplotype diversity is so large that essentially all genomes are different in a stretch only 5.2 kb long, so that no evidence of any recent founder event for either population can be seen. Taken together with the lack of population differen- tiation at both the nucleotide and electromorph levels, these facts represent direct evidence that the popula- tions have a very large breeding size relative to the rate of origin of new variation from mutation and recombination.
It is possible to estimate effective breeding size provided effective size is understood to include the effect of migration. One approach is to use the data on linkage disequilibrium. If N is the effective popu- lation size and c is the recombination rate between adjacent sites, then, under the assumption that the populations are in steady state and that the polymor- phisms are selectively neutral, the quantity 4Nc can be estimated by the method of HUDSON (1987):
where 5: is the variance in the number of site differ- ences between pairs of sequences and hi is the heter- ozygosity at the ith polymorphic site. The quantity G(c) is tabulated by HUDSON for various sample sizes, n, and provides a value for 4Nc. The numerator of
366 M. A. Riley, M. E. Hallas and R. C. Lewontin
G(c) is, in fact, a general estimate of linkage disequi- librium (SVED, REED and BODMER 1967). For our data G(c) is
G(c) = (16.154 - 8.793 + 1.763)
80.21 = 0.114
and n is 55 (we do not include the Bogoti data). The estimate from HUDSON'S curve is 4Nc = 80, but the actual number must not be taken too seriously, be- cause the level of linkage disequilibrium in our data is so low that G(c) is in a region of great sensitivity of the estimate. In our data at least, the value of s i is subject to large errors. Our within-population esti- mates of s i is only 4.98, which if substituted into the estimation would give a negative value for G(c) cor- responding to an infinite population size. Finally, we note that the estimate of recombination at the Xdh locus in D. melanogaster (taking account of the lack of recombination in males) is 1 0-8 between adjacent base pairs (CHOVNICK, GELBART and MCCARRON 1977). In HUDSON'S estimator, c is taken to be the recombination between the ends of the interval which, in our case would then be 5200 bp X lo-' = 5.2 X
Using this value, we get
N = 80/(4 X 5.2 X = 3.8 x lo5.
The usual approach to estimating N is through heterozygosity. The standard relation in a steady state population of neutral variants is
H = 4Nu/(4Nu + 1)
or
4Nu = H/(1 - H> where u = mutation rate and N = effective population size. There is a problem, however, in applying this formulation to data on sequence variation. On the one hand we cannot use haplotype data even though haplotype diversity measure is, in fact, identical to haplotype heterozygosity. That is because the origin of variation is not only from mutation but also from recombination and both of these, for haplotypes, are an increasing function of the length of DNA sampled. Indeed, if one looks at a long enough sequence so that enough sites are included, virtually any sample would have all haplotypes different. Only in the case of a completely asexual organism would haplotype diver- sity be truly allelic diversity to which the formula applies. When there is recombination we do not know how to take this source of diversity into account since the effect of recombination on diversity is a function of the spatial distribution of heterozygosity along the chromosome. In fact, haplotype diversity is nearly unity for our 5.2-kb segment. It is also nearly unity for the data of MIYASHITA and LANGLEY (1 988), even when one considers only sites detected by the same
panel of enzymes as we used, and calculated only from 5.2-kb segments from the middle of the white locus. In principle one might be able to use haplotype diver- sity to compare two different species or two popula- tions, if the rate of origin of variation and the effi- ciency of detection can be assumed to be the same in the two cases. In practice, however, if the haplotype diversity is close to unity in the two samples nothing can be learned from the comparison. In general, haplotype diversity will not be an accurate tool for numerical estimation of comparative population pa- rameters except when that diversity is far from unity and when it is based on comparable members sites in the population being compared.
An alternative to haplotype diversity measures is to treat each nucleotide as a separate locus and use base pair heterozygosity, but this discards the information about population size contained in the nonrandom associations among sites. In our data we can make the calculation directly because the sites are in linkage equilibrium, so the sites can be regarded as independ- ent. We use the estimator 3 of NEI and TAJIMA (1 98 1) which employs the average number of restriction site differences between pairs of sequences in the sample.
For our data, C = 9.35. The quantity 4Nu is then estimated as
V 9.35 2 1 miri 2(91)(4)
=" - 0.0128
4Nu = 0.0128,
so, if u = lo-' per bp
N = 3.2 X lo6
which is in reasonable agreement with that calculated from the linkage disequilibrium (or, better, the lack of it).
Comparison to other restriction site data: The only comparable restriction site data available for D. pseu- doobscura is a six-cutter survey of a 32-kb region including the Adh locus (SCHAEFFER, AQUADRO and LANGLEY 1987). Levels of restriction site polymor- phism revealed at Adh are similar to Xdh with, again, no evidence of linkage disequilibrium. In addition, the Adh data reveal a similar clustering of Bogota within the diversity of the single Californian popula- tion surveyed. The Xdh data indicates that the Bogota electromorph sampled is most closely related to the (A) electromorph from the Californian populations, although, because of the high level of inferred recom- bination, no meaningful phylogeny of the Xdh haplo- types can be derived. Estimates of per-nucleotide het- erozygosity for the Adh region are 0.026, leading to two-fold higher estimates of population size ( N = 6.5
The results on D. pseudoobscura differ from those x 106).
Xdh Nucleotide Polymorphism 367
found in comparable surveys of four-cutter restriction variation in D. melanogaster at the Adh locus (KREIT- MAN and AGUADE 1986a, b; SIMMONS et al. 1989). These studies found lower haplotype diversity with a number of haplotypes present repeatedly, evidence of differentiation between populations, clear linkage dis- equilibria, and the presence in high frequency in one population of a haplotype that is in much lower fre- quency in a distant population, indicating a founder event. The study of the white locus in D. melanogaster (MIYASHITA and LANGLEY 1988) did not find the lower haplotype diversity and repeated appearance of some haplotypes that were seen at Adh, but there was clear linkage disequilibrium clustered at the 3’ end of the large intron, and evidence of population differ- entiation.
Polymorphic variation in D. melanogaster is distrib- uted evenly from high to low frequency. In D. pseu- doobscura there is a preponderance of alleles at Xdh with frequencies close to 0 or 1. As seen in Figure 2, the allele frequency distribution is J-shaped with a significant accumulation of alleles at very low frequen- cies. Our prediction is that the curve should be U- shaped. Given that there are 135 single sites surveyed, there are 135 X 4 bases X 3 alternative nucleotides = 1620 one step mutational events that would cause a site to be lost in the population. In our sequence there are 1 1 times as many one-off sequences as there are four-cutter sites. Thus, there are 1 1 X 147 sites X 1 base X 1 alternative nucleotides = 1485 one step mutational events that would cause a new four-cutter site to be gained in the population. There should then be roughly equal numbers of new sites entering the population and formerly fixed sites mutating away. This prediction assumes that mutational events are rare and that there is no bias in the direction of mutation. We have no explanation for the observed asymmetrical distribution of sites gained to sites lost in our survey.
Haplotype diversity and heterozygosity measures indicate that D. pseudoobscura harbors more nucleo- tide sequence variation than D. melanogaster. How- ever, restriction map surveys of several loci in D. melanogaster give estimates of H that range from 0.002 to 0.014 (LEIGH BROWN 1983; AQUADRO et al. 1986; SCHAEFFER, AQUADRO and LANGLEY 1988; LANGLEY and AQUADRO 1987), with an average for the species of 0.004. It is therefore necessary for a number of additional loci to be examined in D. pseudoobscura before a reliable consensus regarding population size differences can be reached.
Similar results have been reported in a single com- parison of six-cutter restriction map variation between D. melanogaster and D. simulans for the Xdh region (AQUADRO, LADO and NOON 1988). Estimates of per- nucleotide H are 0.003 and 0.019 respectively, pre-
dicting population sizes of 7.5 X lo5 and 2.1 X 10’. Population size estimates generated from H values, and corroborated with the population structure infer- ences one can make from linkage disequilibrium esti- mates and levels of population differentiation, predict that D. melanogaster has a smaller population size, by approximately threefold, than D. pseudoobscura, which is approximately tenfold smaller than D. simulans.
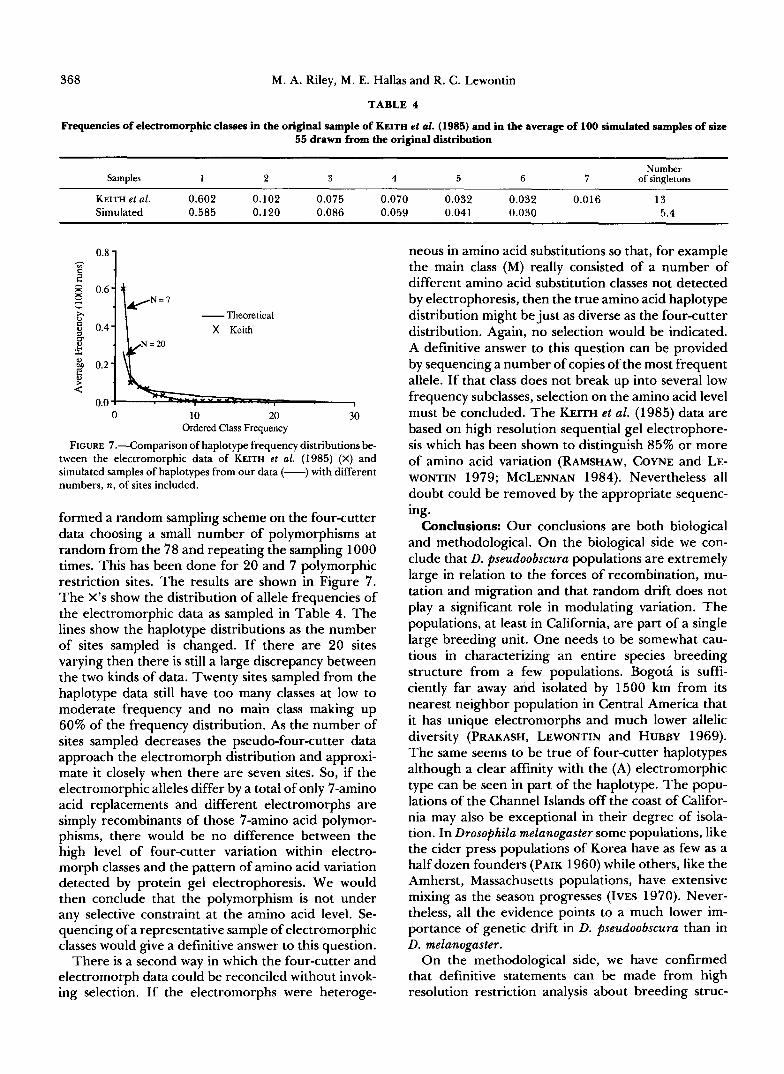
The question of selection: Finally we can ask what light these experiments throw on the question of selection for amino acid variation. If we compare the four-cutter haplotype diversity directly with the fre- quency distribution of electrophoretic alleles given in Table 1 there seems to be an immense discrepancy, the electrophoretic data showing considerable selec- tive constraints on amino acid variation. The electro- phoretic data show a single common variant with several others at frequencies of 5-10% while the four- cutter data show all haplotypes as essentially unique. However, this comparison cannot be made directly because there are two sampling differences between the data sets. First, the electrophoretic data are based on 237 genomes and therefore can include many low frequency alleles that would be absent in a smaller sample. Our sample size not including Bogoti is only 55. In order to gauge the effect of a smaller sample size on the electrophoretic data we have performed random sampling on the KEITH et al. (1 985) data, taking 100 samples of 55 from the distribution in Table 1. The result is an average distribution shown in Table 4. What is given are the frequencies of the most common down to the least common allele ap- pearing in the samples, irrespective of the identity of the allele. The distribution still has one allele in fre- quency 0.59 followed by a group of medium fre- quency alleles and then rare alleles whose expected numbers in a sample of 55 are about 1 each. The average number of alleles seen in each sample was 1 1.3 and the average number of singleton alleles was 5.4. It is this distribution to which we need to compare our haplotype distribution.
The second sampling difference is more serious. As noted before, haplotype diversity goes up with the number of sites looked at, since with every added site there is some chance to further differentiate two haplotypes. We have 66 polymorphic sites and 12 insertion/deletions in our four-cutter sample. Each of the electrophoretic alleles in Table 1 is also a haplo- type since the electromorphs differ at different amino acid positions. We do not, however, know how many such variant positions there are. If each electromorph differed at a different site then there would be 20 sites, but there could be as few as five sites, with the different electromorphs being recombinants of these five basic differences. In order to account for the effect of the smaller number of sites, we have per-
368 M. A. Riley, M. E. Hallas and R. C . Lewontin
TABLE 4
Frequencies of electromorphic classes in the original sample of KEITH et d. (1985) and in the average of 100 simulated samples of size 55 drawn from the original distribution
Samples 1 2 3 4 5 6 7 of singletons Number
KEITH et al. 0.602 0.102 0.075 0.070 0.032 0.032 0.016 13 Simulated 0.585 0.120 0.086 0.059 0.041 0.030 5.4
0.8 - h
E E 06-
F v . t / = 7 2. 3 0.4-
- Theoretical X Keith
L
$I 0.2-
2 b
0.0 I
0 10 20 30 Ordered Class Frequency
FIGURE 7.-Comparison of haplotype frequency distributions be- tween the electromorphic data of KEITH et al. (1985) (X) and simulated samples of haplotypes from our data (-) with different numbers, n, of sites included.
formed a random sampling scheme on the four-cutter data choosing a small number of polymorphisms at random from the 78 and repeating the sampling 1000 times. This has been done for 20 and 7 polymorphic restriction sites. The results are shown in Figure 7. The X’s show the distribution of allele frequencies of the electromorphic data as sampled in Table 4. The lines show the haplotype distributions as the number of sites sampled is changed. If there are 20 sites varying then there is still a large discrepancy between the two kinds of data. Twenty sites sampled from the haplotype data still have too many classes at low to moderate frequency and no main class making up 60% of the frequency distribution. As the number of sites sampled decreases the pseudo-four-cutter data approach the electromorph distribution and approxi- mate it closely when there are seven sites. So, if the electromorphic alleles differ by a total of only 7-amino acid replacements and different electromorphs are simply recombinants of those 7-amino acid polymor- phisms, there would be no difference between the high level of four-cutter variation within electro- morph classes and the pattern of amino acid variation detected by protein gel electrophoresis. We would then conclude that the polymorphism is not under any selective constraint at the amino acid level. Se- quencing of a representative sample of electromorphic classes would give a definitive answer to this question.
There is a second way in which the four-cutter and electromorph data could be reconciled without invok- ing selection. If the electromorphs were heteroge-
neous in amino acid substitutions so that, for example the main class (M) really consisted of a number of different amino acid substitution classes not detected by electrophoresis, then the true amino acid haplotype distribution might be just as diverse as the four-cutter distribution. Again, no selection would be indicated. A definitive answer to this question can be provided by sequencing a number of copies of the most frequent allele. If that class does not break up into several low frequency subclasses, selection on the amino acid level must be concluded. The KEITH et al. (1985) data are based on high resolution sequential gel electrophore- sis which has been shown to distinguish 85% or more of amino acid variation (RAMSHAW, COYNE and LE- WONTIN 1979; MCLENNAN 1984). Nevertheless all doubt could be removed by the appropriate sequenc- ing.
Conclusions: Our conclusions are both biological and methodological. On the biological side we con- clude that D. pseudoobscura populations are extremely large in relation to the forces of recombination, mu- tation and migration and that random drift does not play a significant role in modulating variation. The populations, at least in California, are part of a single large breeding unit. One needs to be somewhat cau- tious in characterizing an entire species breeding structure from a few populations. Bogoti is suffi- ciently far away and isolated by 1500 km from its nearest neighbor population in Central America that it has unique electromorphs and much lower allelic diversity (PRAKASH, LEWONTIN and HUBBY 1969). The same seems to be true of four-cutter haplotypes although a clear affinity with the (A) electromorphic type can be seen in part of the haplotype. The popu- lations of the Channel Islands off the coast of Califor- nia may also be exceptional in their degree of isola- tion. In Drosophila melanoguster some populations, like the cider press populations of Korea have as few as a half dozen founders (PAIK 1960) while others, like the Amherst, Massachusetts populations, have extensive mixing as the season progresses (IVES 1970). Never- theless, all the evidence points to a much lower im- portance of genetic drift in D. pseudoobscura than in D. melanogaster.
On the methodological side, we have confirmed that definitive statements can be made from high resolution restriction analysis about breeding struc-
Xdh Nucleotide Polymorphism 369
ture and the role of recombination in generating diversity. Such analysis also makes the determination of the role of selection from sequence studies much more efficient. To test the two alternatives to selection at the amino acid level, we require sequences of the twenty different electrophoretic alleles or, failing that, of about a dozen alleles, especially the multiply rep- resented classes, and about a dozen sequences of the common class (M) to determine its amino acid homo- geneity. Thus, between 25 and 30 sequences would, in conjunction with the haplotype data, give a clear answer to the question of selection in producing the patterns of electrophoretic variation observed for XDH.
This work was supported by a grant to R.C.L. from the National Institutes of Health (GM-29301). We thank MARTY KREITMAN, CHARLES AQUADRO, CHARLES LANGLEY, and two anonymous re- viewers for critical and helpful comments on earlier versions of this manuscript. I n particular we thank RICHARD HUDSON for saving us from making several embarrassing errors in the manuscript.
LITERATURE CITED AQUADRO, C. F., S. F. DEESE, M. M. BLAND, C. H. LANGLEY and
C. C. LAURIE-AHLBERG, 1986 Molecular population genetics of alcohol dehydrogenase gene region of Drosophila melano- gaster. Genetics 114: 1 165-1 190.
AQUADRO, C. F., K. M. LAW and W. A. NOON, 1988 The rosy region of Drosophila melanogaster and Drosophila simulans. I. Contrasting levels of naturally occurring DNA restriction map variation and divergence. Genetics 119 875-888.
BUCHANON, B. A., and D. L. E. JOHNSON, 1983 Hidden electro- phoretic variation at the xanthine dehydrogenase locus in natural populations of Drosophila melanogaster. Genetics 104:
CHOVNICK, A., W. GELBART, and M. MCCARRON, 1977 Organization of the rosy locus in Drosophila melanogaster. Cell 11: 1-10.
COYNE, J. A., 1976 Lack of genetic similarity between two sibling species of Drosophila as revealed by varied techniques. Genetics
EWENS, W. J., 1977 Population genetics theory in relation to the neutralist-selectionist controversy. Adv. Hum. Genet. 8: 67- 134.
FUERST, P. A., R. CHAKRABORTY and M. NEI, 1977 Statistical studies on protein polymorphism in natural populations. I . Distribution of single locus heterozygosity. Genetics 86 455- 483.
HUDSON, R. R., 1982 Estimating genetic variability with restric- tion endonucleases. Genetics 100: 7 1 1-7 19.
HUDSON, R. R., 1987 Estimating the recombination parameter of a finite population model without selection. Genet. Res. 50:
HUDSON, R. R., M. KREITMAN and M. AGUADE, 1987 A test of neutral molecular evolution based on nucleotide data. Genetics
IVES, P., 1970 Further genetic studies of the South Amherst population of Drosophila melanogaster. Evolution 2 4 507-5 18.
KAPLAN, N. 1983. Statistical analysis of restriction enzyme map data and nucleotide sequence data, pp. 75-106 in Statistical Analysis of DNA Seqence Data, edited by B. S. WEIR. Dekker, New York.
KEITH, T. P., 1983 Frequency distributions of esterase-5 alleles in two populations of Drosophila pseudoobscura. Genetics 95:
301-315.
8 4 593-607.
245-250.
116: 153-159.
467-475.
KEITH, T. P., L. D. BROOKS, R. C. LEWONTIN, J. C. MARTINEZ- CRUZADO and D. L. RIGBY, 1985 Nearly identical allelic dis- tributions of xanthine dehydrogenase in two populations of Drosophila pseudoobscura. Mol. Biol. Evol. 2: 206-216.
KREITMAN, M., 1983 Nucleotide polymorphism at the alcohol dehydrogenase locus of Drosophila melanogaster. Nature 304:
KREITMAN, M., 1988 Molecular population genetics. Oxford Surv. Evol. Biol. 4 38-60.
KREITMAN, M., and M. AGUADE, 1986a Genetic uniformity in two populations of Drosophila melanogaster as revealed by filter hybridization of four-nucleotide-recognizing restriction en- zyme digests. Proc. Natl. Acad. Sci. USA 83: 3562-3566.
KREITMAN, M., and M. AGUADE, 1986b Excess polymorphism at the Adh locus in Drosophila melanogaster. Genetics 114 93- 110.
LANGLEY, C. H., and C. F. AQUADRO, 1987 Restriction map variation in natural populations of Drosophila melanogaster: white locus region. Mol. Biol. Evol. 4: 651-663.
LEIGH BROWN, A. J., 1983 Variation at the 87A heat-shock locus in Drosophila melanogaster. Proc. Natl. Acad. Sci. USA 8 0
LEWONTIN, R. C., 1964 The interaction of selection and linkage. I. General consideration; heterotic models. Genetics 49: 49- 67.
LEWONTIN, R. C., 1974 The Genetic Basis of Evolutionay Change, pp. 189-27 1. Columbia University Press, New York.
LEWONTIN, R. C., 1985 Population genetics. Annu. Rev. Gent.
MCLELLAN, T., 1984 Molecular charge and electrophoretic mo- bility in Cetacean myoglobins of known sequence. Biochem. Genet. 22: 181-200.
MIYASHITA, N., and C. H. LANGLEY, 1988 Molecular and phe- notypic variation of the white locus region in Drosophila mela- nogaster. Genetics 120: 199-2 12.
NEI, M., and F. TAJIMA, 1981 DNA polymorphism detectable by restriction endonucleases. Genetics 97: 145-163.
NEVO, E., A. BEILES and R. BEN-SHLOMO, 1984 The evolutionary significance of genetic diversity: ecological, demographic and life history correlates. Lect. Notes Biomath. 53: 1-213.
PAIK, Y. K., 1960 Genetic variability in Korean populations of Drosophila melanogaster. Evolution 1 4 293-303.
PRAKASH, S., R. C. L E W O N T I N ~ ~ ~ J. L. HUBBY, 1969 A molecular approach to the study of genic heterozygosity in natural pop- ulations. IV. Patterns of genic variation in central, marginal and isolated populations of Drosophila pseudoobscura. Genetics
RAMSHAW, J. A. M., J. A. COYNE and R. C. LEWONTIN, 1979 The sensitivity of gel electrophoresis as a detector of genetic varia- tion. Genetics 93: 1019-1037.
RILEY, M. A., 1989 Nucleotide sequence of the Xdh region in Drosophila pseudoobscura and an analysis of the evolution of synonymous codons. Mol. Biol. Evol. 6 33-52.
SCHAEFFER, S. W., C. F. AQUADRO and W. W. ANDERSON, 1987 Restriction map variation in the alcohol dehydrogenase region of Drosophila pseudoobscura. Mol. Biol. Evol. 4: 252- 263.
SCHAEFFER, S. W., C. F. AQUADRO and C. H. LANGLEY, 1988 Restriction-map variation in the Notch region of Dro- sophila melanogaster. Mol. Biol. Evol. 5: 30-40.
SIMMONS, G. M., M. E. KREITMAN, W. F. QUAITLEBAUM and N. MIYASHITA, 1989 Molecular analysis of the alleles of alcohol dehydrogenase along a cline in Drosophila melanogaster. I . Maine, North Carolina and Florida. Evolution (in press).
SVED, J. A., T. E. REED and W. F. BODMER, 1967 The number of balanced polymorphisms that can be maintained in a natural populations. Genetics 5 5 469-48 1.
412-417.
5350-5354.
19: 81-102.
61: 841-858.
Communicating editor: R. R. HUDSON