Embed Size (px)
Citation preview

62
International Journal of Structural and Civil Engineering Research Vol. 5, No. 1, February 2016
© 2016 Int. J. Struct. Civ. Eng. Res.doi: 10.18178/ijscer.5.1.62-66
Analysis of Controlling Parameters for Shear
behavior of Rock Joints with FLAC3D
Prasoon Tiwari and Hakan Sahin Professional Service Industries, Inc. (PSI), Geotechnical Services Department, Houston, USA
Email: {prasoon.tiwari, hakan.sahin}@psiusa.com
Omer F. Usluogullari Civil Engineering Department, Turgut Ozal University, Ankara, Turkey
Email: [email protected]
Abstract—The research aims at performing analysis to
determine the sensitivity of parameters affecting the
strength of joints in rock mass. Friction angle, normal
stiffness, shear stiffness and shear displacement are the
parameters analyzed with respect to shear strength of
rock joints. Discontinuities have an important influence on
the deformational behavior of rock systems; hence, proper
consideration of the physical and mechanical properties of
discontinuities is necessary during experimental
investigation in order to correctly evaluate the shear
behavior. These parameters are utilized to simulate the in-
situ stress condition in numerical modeling, which is
important for safe and economical design of various
engineering constructions. These parameters can be
obtained through laboratory testing on natural rock core
samples. In the present work, the detailed account of test
results of direct shear tests performed on rock joints is
presented. Rock samples, containing joint are obtained by
core drilling in an underground mine, in Nevada, and are
used to perform direct shear strength test. Calibration of
numerical model is done on average values obtained from
direct shear strength test. Analysis of sensitivity of
parameters effecting shear strength of rock is done in
FLAC3D shear test environment. A numerical parametric
study is done, according to the Mohr-Coulomb constitutive
model, and results obtained are plotted to estimate
performance of rock joints.
Index Terms—FLAC3D, numerical modeling, rock joints,
shear strength
I. INTRODUCTION
Rock joint shear strength is one of the key properties
used in the stability analysis and design of engineering
structures in rock mass, e.g. slopes, tunnels and
foundations [1]. Joints are the main features encountered
in rock and are defined as ruptures of geological origin
along which no relative displacement is visible [2]. Since
sliding of rock blocks on joints is classified as the
principal source of instability in underground excavations,
the parameter which has drawn attention for its major
importance in this context is the peak shear strength of
Manuscript received July 31, 2015; revised October 23, 2015.
joints [3]. Various factors affect shear behavior of in-situ
rock joints and these factors are utilized to simulate the
in situ stress condition in numerical modeling, which is
important for safe and economical design of various
engineering constructions. These concerns require
accurate quantification of shear strength of unfilled and in
filled joints, proper understanding of the basic mechanics
of discontinuity and the principals involved in their shear
deformation [4]. Therefore, the choice of an appropriate
shear-strength criterion for rock joints, that can be used to
engineer structures in rock, depends on a sound
understanding of the basic mechanics of shear failure.
This requires an understanding of the factors that
influence the shear- strength characteristics of a rock mass.
In the present paper the detailed account of test results of
direct shear tests performed on rock joints is presented.
These jointed rock samples are obtained by core drilling
in an underground gold mine in Nevada and are used to
perform direct shear strength test. Results obtained from
tests are used to develop a numerical model and analyze
the effect of various parameters on shear strength of rock
joints. Mohr-Coulomb's criterion is used to describe the shear
strength of the joints. The rock samples containing joints
are used to perform direct shear strength test. Series of
direct shear testing are carried out on direct shear testing
machine to determine the friction angles (φ), cohesion (c)
and stiffness of rock fractures.
The shear box device was used to determine the initial
peak and residual shear strength of a test material as a
function of stresses normal to shear plane. It consists of
setting a test specimen in an encapsulation compound
within the shear box device with the joint plane
positioned precisely between the upper and lower sample
holders. The normal and shear deformations are
monitored as normal and shear loads are applied [5].
II. RESEARCH OBJECTIVE
The objective of the study is to perform analysis to
determine sensitivity of parameters affecting the strength
of joints in rock mass. The study is focused on both
direct shear strength laboratory testing method and
Numerical Simulation using finite difference computer
program, Fast Lagrangian Analysis of Continua (FLAC).
It is the aim of this work to contribute to this
understanding and to encourage readers to further explore
the subject of joint shear strength.
III. LABORATORY TESTING
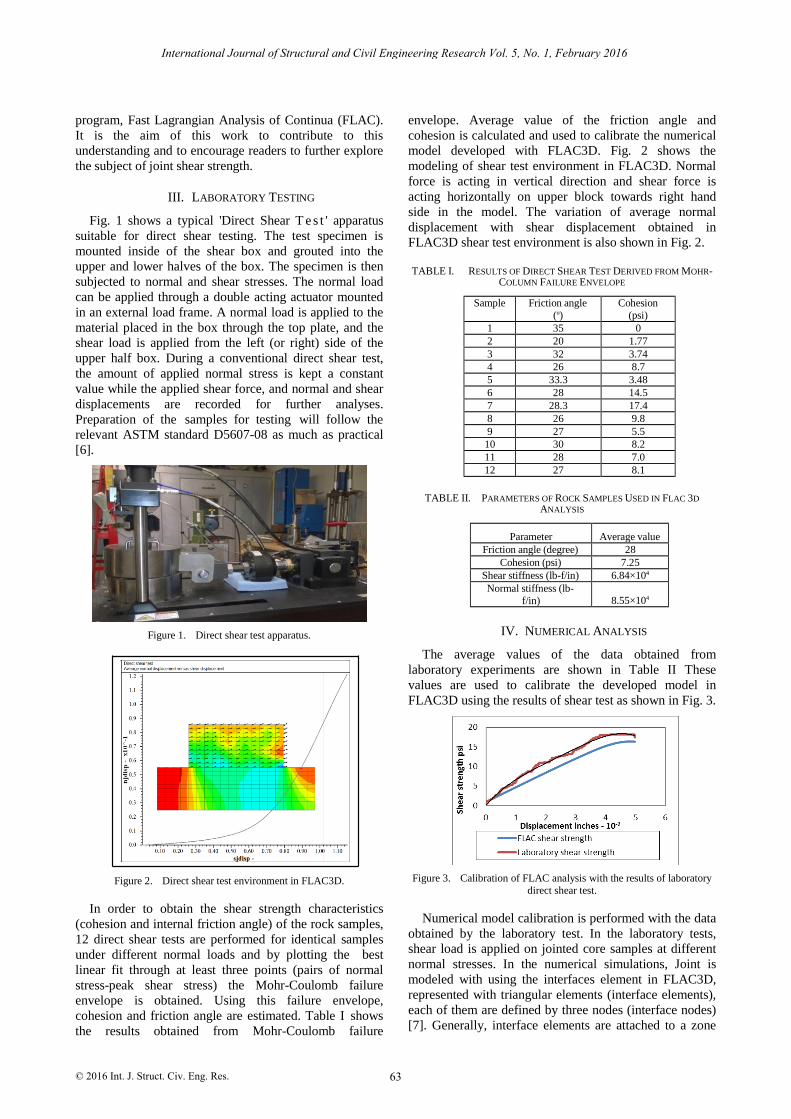
Fig. 1 shows a typical 'Direct Shear T e s t ' apparatus
suitable for direct shear testing. The test specimen is
mounted inside of the shear box and grouted into the
upper and lower halves of the box. The specimen is then
subjected to normal and shear stresses. The normal load
can be applied through a double acting actuator mounted
in an external load frame. A normal load is applied to the
material placed in the box through the top plate, and the
shear load is applied from the left (or right) side of the
upper half box. During a conventional direct shear test,
the amount of applied normal stress is kept a constant
value while the applied shear force, and normal and shear
displacements are recorded for further analyses.
Preparation of the samples for testing will follow the
relevant ASTM standard D5607-08 as much as practical
[6].
Figure 1. Direct shear test apparatus.
Figure 2. Direct shear test environment in FLAC3D.
In order to obtain the shear strength characteristics
(cohesion and internal friction angle) of the rock samples,
12 direct shear tests are performed for identical samples
under different normal loads and by plotting the best
linear fit through at least three points (pairs of normal
stress-peak shear stress) the Mohr-Coulomb failure
envelope is obtained. Using this failure envelope,
cohesion and friction angle are estimated. Table I shows
the results obtained from Mohr-Coulomb failure
envelope. Average value of the friction angle and
cohesion is calculated and used to calibrate the numerical
model developed with FLAC3D. Fig. 2 shows the
modeling of shear test environment in FLAC3D. Normal
force is acting in vertical direction and shear force is
acting horizontally on upper block towards right hand
side in the model. The variation of average normal
displacement with shear displacement obtained in
FLAC3D shear test environment is also shown in Fig. 2.
TABLE I. RESULTS OF DIRECT SHEAR TEST DERIVED FROM MOHR-COLUMN FAILURE ENVELOPE
Sample Friction angle
(o)
Cohesion
(psi)
1 35 0
2 20 1.77
3 32 3.74
4 26 8.7
5 33.3 3.48
6 28 14.5
7 28.3 17.4
8 26 9.8
9 27 5.5
10 30 8.2
11 28 7.0
12 27 8.1
TABLE II. PARAMETERS OF ROCK SAMPLES USED IN FLAC 3D
ANALYSIS
Parameter Average value
Friction angle (degree) 28
Cohesion (psi) 7.25
Shear stiffness (lb-f/in) 6.84×10⁴
Normal stiffness (lb-
f/in)
8.55×10⁴
IV. NUMERICAL ANALYSIS
The average values of the data obtained from
laboratory experiments are shown in Table II These
values are used to calibrate the developed model in
FLAC3D using the results of shear test as shown in Fig. 3.
Figure 3. Calibration of FLAC analysis with the results of laboratory
direct shear test.
Numerical model calibration is performed with the data
obtained by the laboratory test. In the laboratory tests,
shear load is applied on jointed core samples at different
normal stresses. In the numerical simulations, Joint is
modeled with using the interfaces element in FLAC3D,
represented with triangular elements (interface elements),
each of them are defined by three nodes (interface nodes)
[7]. Generally, interface elements are attached to a zone
63
International Journal of Structural and Civil Engineering Research Vol. 5, No. 1, February 2016
© 2016 Int. J. Struct. Civ. Eng. Res.

surface face; two triangular interface elements are defined
for every quadrilateral zone face [8].
Figure 4. Average shear stress vs. shear displacement in FLAC3D
environment.
Variation of the shear stress with the shear
displacement, along the joint and the average normal
displacement versus shear displacement is plotted as
shown in Fig. 4. These plots indicate that joint slip occurs
for the prescribed properties and conditions. The loading
slope is initially linear, and then becomes non-linear as
interface nodes begin to fail and reach a peak shear
strength. The joint begins to dilate when the interface
nodes begin to fail in shear as shown in Fig. 4. The curve
includes two parts: the linear elastic stage and the
perfectly plastic stage [9]
The average value of the data obtained from laboratory
experiments is used to perform numerical modeling using
FLAC3D. Parameter analysis is carried out on different
mechanical properties based on these values.
V. RESULTS
Shear tests were simulated for different normal stress
conditions in FLAC3D model. Behavior of parameters
such as friction angle, normal and shear stiffness of joints
i s observed for various normal force loading values.
Using the results of FLAC3D analysis, the variation
of shear strength with various parameters for three
different normal stresses are plotted (Fig. 5, Fig. 6 and
Fig. 7). Normal stresses used to perform direct shear test
in FLAC3D model are 15 psi, 36 psi, and 72 psi.
Figure 5. Plot of shear strength vs. normal stiffness
Also, normal stiffness values might be co-related to the
filling material. The normal stiffness values for rock
joints typically range from roughly 103 to 104 lb.-f/inch
for joints with soft in-filling, to over 105 to 106 lb-f/inch
for tight joints in rocks. Published data on stiffness
properties for rock joints are limited; summaries of data
can be found in reference literature [10]. Lower values
used here resemble the soft filling material condition in
rock joints while higher values reflect the hard joint
condition. Table III represents correlation between
normal stiffness and type of fill material in rock joints.
TABLE III. CO-RELATION BETWEEN NORMAL STIFFNESS AND FILL
MATERIAL
S./no. Normal stiffness
(lb-f/inch)
Filling material (property)
1 1000 Very soft
2 100000 Medium soft
3 1000000 High joint condition
A. Plot Between Shear Strength vs. Normal Stiffness
In Fig. 5, shear strength is plotted against normal
stiffness value for three normal stresses. Normal stress
values are referred as N, and the plot in Fig. 5 shows the
variation of shear strength with normal stiffness. It shows
that at lower values of normal stiffness, shear strength of
the model is very sensitive towards this parameter and
shows rapid increase as normal stiffness increases.
Furthermore, increase in stiffness reduces the joint
dilution, causing the normal stress increases due to the
shear displacement.
From the plot obtained in Fig. 5, it can be concluded
that the shear strength is sensitive when the filling
material behavior changes from very soft, soft to hard
nature. There is steep increase in shear strength at lower
stiffness increment. Also, shear strength shows less
variation when hard joint condition is observed. It shows
very less sensitivity at higher values. Normal stiffness
value is co-related with type of fill material in rock joints.
Table IV shows co-relation between sensitivity of
shear strength with the type of filling material.
B. Plot Between Shear Displacements vs. Normal
Stiffness
In Fig. 6, shear displacement of joint at failure is
plotted against normal stiffness. Normal stress values are
referred as N. Plot shows that although shear strength is
increased with the increment of normal stiffness, the
displacement at failure is decreased.
Figure 6. Plot of shear strength vs. friction angle.
Lower values used here resemble the soft filling
material condition in rock joints while higher values
reflect the hard joint condition. Fig. 6 shows that at lower
values of normal stiffness, shear displacement of model is
very sensitive towards this parameter and shows rapid
decrease as normal stiffness increases. At higher stiffness
64
International Journal of Structural and Civil Engineering Research Vol. 5, No. 1, February 2016
© 2016 Int. J. Struct. Civ. Eng. Res.
shear strength shows brittle behavior and joint fails at
very less shear displacement as compared to lower
stiffness values. Table V shows the co-relation between
sensitivity of shear displacement with the type of filling
material.
C. Plot Between Shear Strength vs. Friction Angle
In Fig. 7, the influence of normal stress on the friction
angle is plotted against shear strength of rock. Normal
stress values are referred as N. Plot shows the sensitivity
shear behavior of joints towards friction angle range. It
shows almost linear behavior between shear strength and
friction angle. Although at higher friction angle, strength
shows more sensitive behavior towards friction angle as
shown in Table VI.
Figure 7. Plot of shear strength vs. friction angle
TABLE IV. SENSITIVITY OF SHEAR BEHAVIOR OF ROCK JOINTS WITH
RESPECT TO FILLING MATERIAL
S/no. Filling material Sensitivity of shear
strength Shear behavior
1 Very soft Highly sensitive Sharp increase
2 Medium soft Linear relationship Linear increase
3 Hard joint
condition Very less effect Constant
TABLE V. SENSITIVITY OF SHEAR DISPLACEMENT OF ROCK JOINTS
WITH RESPECT TO FILLING MATERIAL
S/no. Filling material Sensitivity of shear
strength
Shear
displacemen
t
1 Very soft Highly sensitive Sharp decrease
2 Medium soft Linear relationship Linear decrease
3 Hard joint condition
Very less effect Constant
TABLE VI. SENSITIVITY OF SHEAR BEHAVIOR OF ROCK JOINTS WITH
RESPECT TO FRICTION ANGLE
S/no. Friction Sensitivity of shear
strength Shear behavior
1 Low sensitive Linear increase
2 Medium sensitive Linear increase
3 High Slightly more
sensitive Linear increase
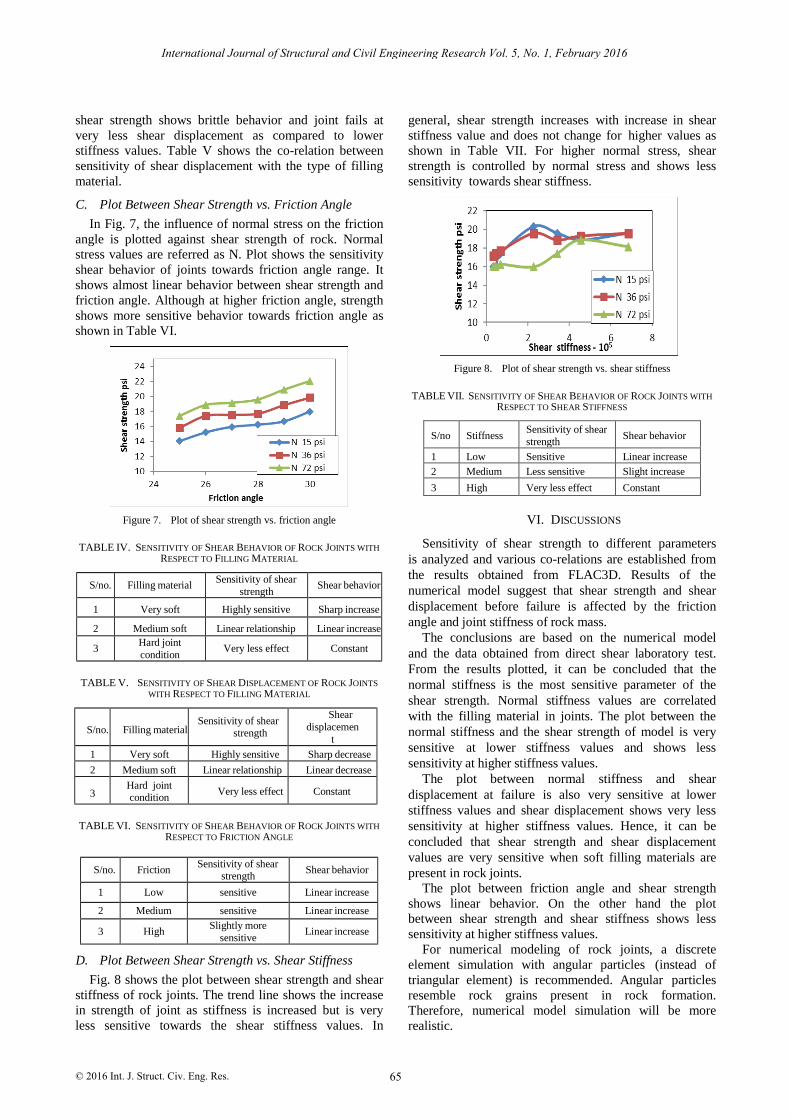
D. Plot Between Shear Strength vs. Shear Stiffness
Fig. 8 shows the plot between shear strength and shear
stiffness of rock joints. The trend line shows the increase
in strength of joint as stiffness is increased but is very
less sensitive towards the shear stiffness values. In
general, shear strength increases with increase in shear
stiffness value and does not change for higher values as
shown in Table VII. For higher normal stress, shear
strength is controlled by normal stress and shows less
sensitivity towards shear stiffness.
Figure 8. Plot of shear strength vs. shear stiffness
TABLE VII. SENSITIVITY OF SHEAR BEHAVIOR OF ROCK JOINTS WITH
RESPECT TO SHEAR STIFFNESS
S/no Stiffness Sensitivity of shear
strength Shear behavior
1 Low Sensitive Linear increase
2 Medium Less sensitive Slight increase
3 High Very less effect Constant
VI. DISCUSSIONS
Sensitivity of shear strength to different parameters
is analyzed and various co-relations are established from
the results obtained from FLAC3D. Results of the
numerical model suggest that shear strength and shear
displacement before failure is affected by the friction
angle and joint stiffness of rock mass.
The conclusions are based on the numerical model
and the data obtained from direct shear laboratory test.
From the results plotted, it can be concluded that the
normal stiffness is the most sensitive parameter of the
shear strength. Normal stiffness values are correlated
with the filling material in joints. The plot between the
normal stiffness and the shear strength of model is very
sensitive at lower stiffness values and shows less
sensitivity at higher stiffness values.
The plot between normal stiffness and shear
displacement at failure is also very sensitive at lower
stiffness values and shear displacement shows very less
sensitivity at higher stiffness values. Hence, it can be
concluded that shear strength and shear displacement
values are very sensitive when soft filling materials are
present in rock joints.
The plot between friction angle and shear strength
shows linear behavior. On the other hand the plot
between shear strength and shear stiffness shows less
sensitivity at higher stiffness values.
For numerical modeling of rock joints, a discrete
element simulation with angular particles (instead of
triangular element) is recommended. Angular particles
resemble rock grains present in rock formation.
Therefore, numerical model simulation will be more
realistic.
65
International Journal of Structural and Civil Engineering Research Vol. 5, No. 1, February 2016
© 2016 Int. J. Struct. Civ. Eng. Res.

ACKNOWLEDGMENT
The authors wish to thank Mr. John Leland in
University of Nevada, Reno, for his support during the
laboratory testing of rock samples for this project.
REFERENCES
[1] R. Kemthong. “Determination of rock joint shear strength based
on rock physical properties,” M.S. Thesis, Suranaree University of Technology, Thailand, 2006.
[2] L. Zhang, “Engineering properties of rocks,” in Elsevier geo
Engineering Book Series, 2005, vol. 4, pp. 53-56. [3] E. Lazzari, “Analysis of shear strength of rock joints with
PFC2D,” M.S. Thesis, Division of Soil and Rock Mechanics, Department of Civil Architecture and the Built Environment,
KTH Royal Institute of Technology Stockholm, Sweden, 2013.
[4] G. Grasselli, “Shear strength of rock joints based on quantified surface description,” Ph.D. dissertation, Laurea in Ingegneria
Civile, Univeristá di Parma, Lausanne, EPFL, 2001.
[5] CATS Direct Shear test Mode 1.96. User’s Guide and Reference, Geotechnical Consulting & Testing Systems, Tempe, Arizona,
2011.
[6] Standard Test Method for Performing Laboratory Direct Shear Strength Tests of Rock Specimens Under Constant Normal
Force, ASTM Standard D5607-08.
[7] Theory and background, Itasca Consulting Group, Inc. FLAC3D Fast Lagrangian Analysis of Continua in Three-Dimensions, Ver.
5.0. Minneapolis, Itasca, 2012.
[8] H. Lin, P. Cao, and Y. Zhou, “Numerical simulation for direct shear test of joint in rock mass,” International Journal of Image,
Graphics and Signal Processing, vol. 2, no. 1, pp. 39-45, Nov.
2010.
[9] C. A. Skinas, S. C. Bandis, and C. A. Demiris, “Experimental investigations and modeling of rock joint behavior under
constant normal stiffness,” in Proc. Rock Joint,. Loen, Norway,
1990, pp. 301-308. [10] H. Wu, Y. Shu, and J. Zhu, “Implementation and verification of
interface constitutive model in FLAC3D,” Water Science and
Engineering, vol. 4, no. 3, pp. 305-316, 2011.
Mr. Prasoon Tiwari MSc. University of Nevada Reno, USA, 2014 –
specialization in Geo-technical engineering. He is a staff engineer for geotechnical engineering department in Professional Service Industries,
Inc. (PSI). Currently, he is working in the Houston office of PSI.
Mr. Tiwari has worked as a Teaching assistant in geotechnical laboratory at the University of Nevada Reno, USA. He has worked in
geotechnical field for TATA Steel, Iron ore mines, India, for 2 years.
Dr. Hakan Sahin Ph.D. Texas A&M University, College Station,
Texas, USA, 2014 – Civil Engineering, Pavement Materials and
Geotechnical Engineering.
Since 2014, Dr. Sahin has been working as a project manager in
geotechnical engineering department at Professional Service Industries,
Inc. (PSI).
Dr. Omer F. Usluogullari Ph.D. University of Houston, Houston,
Texas, USA, 2009 – Civil Engineering, Geotechnical Engineering. Dr. Usluogullari has worked as Project and Planning Engineer between
2009-2011, responsible from managing, coordinating, and
administering of constructions projects through planning, engineering, procurement, construction, initial operations, and prime contract close-
out. From 2011 to 2013, he carried the activities as Planning Engineer
at Programming Division of MINISTERY of SCIENCE, INDUSTRY and TECHNOLOGY. From 2013, he has been working as Asst. Prof. at
Civil Engineering Department of Turgut Ozal University and his
research interest is Geotechnical Engineering.
66
International Journal of Structural and Civil Engineering Research Vol. 5, No. 1, February 2016
© 2016 Int. J. Struct. Civ. Eng. Res.