Embed Size (px)
Citation preview
1
A compilation of global bio-optical in situ data for ocean-colour
satellite applications – version two
André Valente1, Shubha Sathyendranath2 , Vanda Brotas1,2 , Steve Groom2, Michael Grant2,3, Malcolm
Taberner3, David Antoine4,5, Robert Arnone6, William M. Balch7, Kathryn Barker8,9,10, Ray Barlow11, 5
Simon Bélanger12, Jean-François Berthon13, Şükrü Beşiktepe14, Yngve Borsheim15, Astrid Bracher16,17,
Vittorio Brando9,18, Elisabetta Canuti13, Francisco Chavez19, Andrés Cianca20, Hervé Claustre4, Lesley
Clementson9, Richard Crout21, Robert Frouin22, Carlos García-Soto23,24, Stuart W. Gibb25, Richard
Gould21, Stanford B. Hooker26, Mati Kahru22, Milton Kampel27, Holger Klein28, Susanne Kratzer29,
Raphael Kudela30, Jesus Ledesma31, Hubert Loisel32, Patricia Matrai7, David McKee33, Brian G. 10
Mitchell22, Tiffany Moisan34, Frank Muller-Karger35, Leonie O'Dowd36, Michael Ondrusek37, Trevor
Platt2, Alex J. Poulton38, Michel Repecaud39, Thomas Schroeder9, Timothy Smyth2, Denise Smythe-
Wright40, Heidi M. Sosik41, Michael Twardowski42, Vincenzo Vellucci4, Kenneth Voss43, Jeremy
Werdell26, Marcel Wernand44, Simon Wright45, Giuseppe Zibordi13
15
[1] {MARE - Marine and Environmental Sciences Centre, Faculdade de Ciências, Universidade de Lisboa, Campo Grande,
1749-016 Lisboa, Portugal}
[2] {Plymouth Marine Laboratory, Plymouth, PL1 3DH, UK}
[3] {EUMETSAT, Eumetsat-Allee 1, 64295 Darmstadt, Germany} 20
[4] {Sorbonne Université, CNRS, Laboratoire d'Océanographie de Villefranche, LOV, F-06230 Villefranche-sur-Mer,
France}
[5] {Remote Sensing and Satellite Research Group, School of Earth and Planetary Sciences, Curtin University, Perth, WA
6845, Australia}
[6] {University of Southern Mississippi, Stennis Space Center, MS, USA} 25
[7] {Bigelow Laboratory for Ocean Sciences, 60 Bigelow Dr., East Boothbay, ME 04544, Maine, USA}
[8] {ARGANS Ltd, UK}
[9] {CSIRO Oceans and Atmosphere, Australia}
[10] {Australian Research Data Commons}
[11] {Bayworld Centre for Research and Education, Cape Town, South Africa} 30
[12] {Université du Québec à Rimouski, Rimouski (Québec), Canada}
[13] {European Commission, Joint Research Centre, Ispra, Italy}
[14] {Dokuz Eylul University, Institute of Marine Science and Technology, Izmir, Turkey}
[15] {Institute of Marine Research, Bergen, Norway}
[16] {Alfred-Wegener-Institute Helmholtz Centre for Polar and Marine Research, Bremerhaven, Germany} 35
[17] {Institute of Environmental Physics, University Bremen, Bremen, Germany}
Earth Syst. Sci. Data Discuss., https://doi.org/10.5194/essd-2019-27
Ope
n A
cces
s Earth System
Science
DataD
iscussio
ns
Manuscript under review for journal Earth Syst. Sci. DataDiscussion started: 18 February 2019c© Author(s) 2019. CC BY 4.0 License.
2
[18] {CNR - ISMAR, Rome, Italy}
[19] {Monterey Bay Aquarium Research Institute, Moss Landing, CA, USA}
[20] {PLOCAN-Oceanic Platform of the Canary Islands. Carretera de Taliarte, 35214 Telde, Gran Canaria, Spain}
[21] {Naval Research Laboratory, Stennis Space Center, MS, USA}
[22] {Scripps Institution of Oceanography, University of California San Diego, CA, USA} 5
[23] {Spanish Institute of Oceanography (IEO), Corazón de María 8, 28002 Madrid, Spain}
[24] {Plentziako Itsas Estazioa/ Euskal Herriko Unibetsitatea (PIE/EHU), Areatza z/g, 48620 Plentzia, Spain}
[25] {Environmental Research Institute, North Highland College, University of the Highlands and Islands, Thurso, Scotland,
UK}
[26] {NASA Goddard Space Flight Center, Greenbelt, Maryland, USA} 10
[27] {Remote Sensing Division, National Space Research Institute (INPE), Sao Jose dos Campos, Brazil}
[28] {Operational Oceanography Group, Federal Maritime and Hydrographic Agency, Hamburg, Germany}
[29] {Department of Ecology, Environment and Plant Sciences, Stockholm University, 106 91 Stockholm, Sweden}
[30] {University of California Santa Cruz, Santa Cruz, CA USA}
[31] {Instituto del Mar del Perú} 15
[32] { Laboratoire d'Océanologie et de Géosciences, Université du Littoral-Côte-d'Opale, Université Lille, CNRS, UMR
8187, LOG, 32 avenue Foch, Wimereux, France }
[33] {Physics Dept, University of Strathclyde, Glasgow, G4 0NG, Scotland}
[34] {NASA Goddard Space Flight Center, Wallops Flight Facility, Wallops Island, VA, USA}
[35] {Institute for Marine Remote Sensing/ImaRS, College of Marine Science, University of South Florida, FL, USA} 20
[36] {Fisheries and Ecosystem Advisory Services, Marine Institute, Rinville – Oranmore, Galway, Ireland}
[37] {NOAA/NESDIS/STAR/SOCD, College Park, MD, USA}
[38] {Lyell Centre for Earth and Marine Science and Technology, Heriot-Watt University, Edinburgh, UK}
[39] {IFREMER Centre de Brest, Plouzane, France}
[40] {Ocean Biogeochemistry and Ecosystems, National Oceanography Centre, Waterfront Campus, Southampton, UK} 25
[41] {Biology Department, Woods Hole Oceanographic Institution, Woods Hole, MA, USA}
[42] {Harbor Branch Oceanographic Institute, Fort Pierce, FL, USA}
[43] {University of Miami, Coral Gables, FL, USA}
[44] {Royal Netherlands Institute for Sea Research, Texel, Netherlands}
[45] {Australian Antarctic Division and the Antarctic Climate and Ecosystems Cooperative Research Centre, Hobart, 30
Australia}
Correspondence to: A. Valente ([email protected])
Earth Syst. Sci. Data Discuss., https://doi.org/10.5194/essd-2019-27
Ope
n A
cces
s Earth System
Science
DataD
iscussio
ns
Manuscript under review for journal Earth Syst. Sci. DataDiscussion started: 18 February 2019c© Author(s) 2019. CC BY 4.0 License.
3
Abstract. A global compilation of in situ data is useful to evaluate the quality of ocean-colour satellite data records. Here we
describe the data compiled for the validation of the ocean-colour products from the ESA Ocean Colour Climate Change
Initiative (OC-CCI). The data were acquired from several sources (including, inter alia, MOBY, BOUSSOLE, AERONET-
OC, SeaBASS, NOMAD, MERMAID, AMT, ICES, HOT, GeP&CO) and span the period from 1997 to 2018. Observations
of the following variables were compiled: spectral remote-sensing reflectances, concentrations of chlorophyll-a, spectral 5
inherent optical properties, spectral diffuse attenuation coefficients and total suspended matter. The data were from multi-
project archives acquired via open internet services or from individual projects, acquired directly from data providers.
Methodologies were implemented for homogenisation, quality control and merging of all data. No changes were made to the
original data, other than averaging of observations that were close in time and space, elimination of some points after quality
control and conversion to a standard format. The final result is a merged table designed for validation of satellite-derived 10
ocean-colour products and available in text format. Metadata of each in situ measurement (original source, cruise or
experiment, principal investigator) were propagated throughout the work and made available in the final table. By making
the metadata available, provenance is better documented, and it is also possible to analyse each set of data separately. This
paper also describes the changes that were made to the compilation in relation to the previous version (Valente et al., 2016).
The compiled data are available at https://doi.org/10.1594/PANGAEA.898188 . 15
1 Introduction
Currently, there are several sets of in situ bio-optical data, worldwide, suitable for validation of ocean-colour satellite data.
Although some are managed by the data producers, others are in international repositories with contributions from multiple
scientists. Many have rigid quality controls and are built specifically for ocean colour validation. The use of only any one of
these data sets would limit the number of data in validation exercises. It is, therefore, vital to acquire and merge all these data 20
sets into a single unified data set to maximize the number of matchups available for validation, their distribution in time and
space, and, consequently, to reduce uncertainties in the validation exercise. However, merging several data sets together can
be a complicated task. First it is necessary to acquire and harmonize all data sets into a single standard format. Second,
during the merging, duplicates between data sets have to be identified and removed. Third, the metadata should be
propagated throughout the process and made available in the final merged product. Ideally, the compiled data set would be 25
made available as a simple text table, to facilitate ease of access and manipulation. In this work such unification of multiple
data sets is presented. This was done for the validation of the ocean-colour products from the ESA Ocean Colour Climate
Change Initiative (OC-CCI), but with the intent to serve the broader user community as well.
A merged data set is not without drawbacks: it is likely to be large and so not always easy to manipulate; because the
merging is done on pre-existing, processed databases, it is not possible to have full control of the whole processing chain; the 30
data set would be a compilation of observations collected by several investigators using different instruments, sampling
methods and protocols, which might eventually have been modified by the processing routines used by the repositories or
Earth Syst. Sci. Data Discuss., https://doi.org/10.5194/essd-2019-27
Ope
n A
cces
s Earth System
Science
DataD
iscussio
ns
Manuscript under review for journal Earth Syst. Sci. DataDiscussion started: 18 February 2019c© Author(s) 2019. CC BY 4.0 License.
4
archives. To minimise these potential drawbacks, we have, for the most part, incorporated only data sets that have emerged
from the long-term efforts of the ocean-colour and biological oceanographical communities to provide scientists with high-
quality in situ data, and implemented additional quality checks on the data, to enhance confidence in the quality of the
merged product. Nevertheless, it is still recognized that different and somehow unpredictable uncertainties may affect data
from the diverse sources as a result of the application of a variety of field/laboratory instruments, methods and data 5
reductions schemes.
In Sect. 2 the methodologies used to harmonize and integrate all data, as well as a description of individual data sets acquired
are provided. In Sect. 3 the geographic distribution and other characteristics of the final merged data set are shown. Section 4
provides an overview of the data.
2 Data and methods 10
2.1 Pre-processing and merging
The compiled global set of bio-optical in situ data described in this work has an emphasis, though not exclusively, on open-
ocean data. It comprises the following variables: remote-sensing reflectance ("rrs"), chlorophyll-a concentration ("chla"),
algal pigment absorption coefficient ("aph"), detrital and coloured dissolved organic matter absorption coefficient ("adg"),
particle backscattering coefficient ("bbp"), diffuse attenuation coefficient for downward irradiance ("kd") and total 15
suspended matter (“tsm”). The variables "rrs", "aph", "adg", "bbp" and "kd" are spectrally dependent, and this dependence
is, hereafter, implied. The data were compiled from 27 sources (MOBY, BOUSSOLE, AERONET-OC, SeaBASS,
NOMAD, MERMAID, AMT, ICES, HOT, GeP&CO, AWI, ARCSSPP,BARENTSSEA, BATS, BIOCHEM, BODC,
CALCOFI, CCELTER, CIMT, COASTCOLOUR, ESTOC, IMOS, MAREDAT, PALMER, SEADATANET, TPSS and
TARA): each one described in Sect. 2.2. The data sources in this work should also be viewed as groups of data that were 20
acquired from a specific source, standardized with a specific method and later merged into the compilation. The compiled in
situ observations have a global distribution and cover the period 1997 to 2018. The listed variables, with the exception of
total suspended matter, were chosen as they are the operational satellite ocean-colour products of ESA OC-CCI project,
which currently focuses on the merging of four ocean-colour satellite sensors: the Medium Resolution Imaging Spectrometer
(MERIS) of ESA; the Moderate Resolution Imaging Spectro-radiometer (MODIS) of NASA; the Sea-viewing Wide Field-25
of-view Sensor (SeaWiFS) of NASA; and the Visible Infrared Imaging Radiometer Suite (VIIRS) of NASA and National
Oceanic and Atmospheric Administration (NOAA), to create a time series of satellite data.
This is a second version of the compilation of global bio-optical in situ data described by Valente et al. (2016). The new
version has more data, and a higher temporal and spatial coverage. The increases in number of observations are mainly for
“chla”, “rrs” and “aph”. In comparison with Valente et al. (2016), the observations of “chla” and “aph” have doubled in 30
number and provide a better spatial coverage, especially in the Southern and Arctic Oceans. The “rrs” values also increased
Earth Syst. Sci. Data Discuss., https://doi.org/10.5194/essd-2019-27
Ope
n A
cces
s Earth System
Science
DataD
iscussio
ns
Manuscript under review for journal Earth Syst. Sci. DataDiscussion started: 18 February 2019c© Author(s) 2019. CC BY 4.0 License.
5
in number, but not as much in spatial coverage, because most of the new observations came from fixed locations.
The present second version is a compilation of data from sources used in the first version (MOBY, BOUSSOLE,
AERONET-OC, SeaBASS, NOMAD, MERMAID, AMT, ICES, HOT, GeP&CO) plus data from the new sources (AWI,
ARCSSPP, BARENTSSEA, BATS, BIOCHEM, BODC, CALCOFI, CCELTER, CIMT, COASTCOLOUR, ESTOC,
IMOS, MAREDAT, PALMER, SEADATANET, TPSS and TARA). The main differences to the first version are: 1) some 5
of the data sources used in the first version were updated (MOBY, AERONET, SeaBASS and HOT), 2) new data sources
were added, 3) a new variable was compiled (Total Suspended Matter), 4) the format in which the compilation is provided is
different, and 5) two flags were added.
Concerning the change of format, in Valente et al. ( 2016) the compilation was provided as one unique two-dimensional
table. Now, given its increased size (136,250 rows and 1,286 columns compared with 80,524 rows and 267 columns 10
previously), the table has been broken into three smaller tables that relate to each other via one unique key identifying each
row. One additional table is also provided to help with data manipulation. Despite this change, the compilation should still be
viewed conceptually as one unique table, and as such, it is still described in that way. In the present version, two flags were
added: “flag_time” and “flag_chl_method”. The first is because in the present version three data sources were used (ESTOC,
MAREDAT and TPSS) where information on time (hour of the day) was not available. The time for these observations was 15
set to 12:00:00 (UTC) and the observations were flagged with “1” in column “flag_time”. A second flag was necessary,
because in two data sources (ARCSSPP and SEADATANET) there was uncertainty on whether the compiled chlorophyll
were from fluorometry, spectrophotometric or HPLC methods. The compiled chlorophyll observations from these two data
sources were flagged with “1” in column “flag_chl_method” and were marked as “chla_fluor”.
Remote-sensing reflectance ("rrs") is a primary ocean colour product defined as “rrs = Lw/Es”, where “Lw” is the upward 20
water-leaving radiance and “Es” is the total downward irradiance at sea level. Remote-sensing reflectance is related to
irradiance reflectance (“Rw”) approximately through “rrs = Rw/Q”, where Q ranges from 3 to 5 in natural waters and is
equal to π for an isotropic (Lambertian) light field. Another quantity that is often required is the “normalized” water-leaving
radiance (“nLw”) (Gordon and Clark, 1981), which is related to remote-sensing reflectance via “rrs = nLw/Fo”, where "Fo"
is the top-of-the-atmosphere solar irradiance. If not directly available, remote-sensing reflectance was calculated through the 25
equations described above, depending on the format of the original data. The original data were acquired in an advanced
form (e.g. time-averaged, extrapolated to surface), from nine data sources designed for ocean-colour validation and
applications (MOBY, BOUSSOLE, AERONET-OC, SeaBASS, NOMAD, MERMAID, COASTCOLOUR, TARA, AWI),
therefore, only requiring the conversion to a common format. In the processing made by the space agencies, the quantity
“rrs” is normalized to a single Sun-viewing geometry (Sun at zenith and nadir viewing) taking in account the bidirectional 30
effects as described in Morel and Gentili (1996) and Morel et al. (2002). Thus, for consistency with satellite “rrs” product,
only in situ “rrs” that included the latter normalization were included in the compilation.
Chlorophyll-a concentration is the conventional measure for phytoplankton biomass and one of the most-widely used
Earth Syst. Sci. Data Discuss., https://doi.org/10.5194/essd-2019-27
Ope
n A
cces
s Earth System
Science
DataD
iscussio
ns
Manuscript under review for journal Earth Syst. Sci. DataDiscussion started: 18 February 2019c© Author(s) 2019. CC BY 4.0 License.
6
satellite ocean-colour products (IOCCG, 2008). To validate satellite-derived chlorophyll-a concentration, two different
variables were compiled: one of these represents chlorophyll-a measurements made through fluorometric or
spectrophotometric methods, referred to hereafter as “chla_fluor” and the other is the chlorophyll concentration derived from
HPLC (High-Performance Liquid Chromatography) measurements, referred to hereafter as “chla_hplc”. The chlorophyll
data were compiled from the following 25 data sources: BOUSSOLE, SeaBASS, NOMAD, MERMAID, AMT, ICES, HOT, 5
GeP&CO, AWI, ARCSSPP, BARENTSSEA, BATS, BIOCHEM, BODC, CALCOFI, CCELTER, CIMT,
COASTCOLOUR, ESTOC, IMOS, MAREDAT, PALMER, SEADATANET, TPSS and TARA. One requirement for
“chla_fluor” measurements was that they were made using in vitro methods (i.e. based on extractions of chlorophyll-a).
Although this severely decreased the number of observations, since in situ fluorometry (e.g. fluorometers mounted on
CTD's) is widely available in oceanographic databases, it was decided to exclude such data because of potential problems 10
with the calibration of in situ fluorometers. The variable “chla_hplc” was calculated by summing all reported chlorophyll-a
derivatives, including divinyl chlorophyll-a, epimers, allomers, and chlorophyllide-a. The two chlorophyll variables are
retained separately in the database to facilitate their use. HPLC measurements could be considered of higher quality, but
fluorometric measurements are more numerous. Thus one option for users is to use “chla_fluor” only when there are no
“chla_hplc” measurements available. To be consistent with satellite-derived chlorophyll values, which are derived from the 15
light emerging from the upper layer of the ocean, all chlorophyll observations in the top 10 meters (replicates at the same
depth, or measurements at multiple depths) were averaged if the coefficient of variation among observations was less than 50
%, otherwise they were discarded. The averages were then assigned to the surface. The depth of 10 m was chosen as a
compromise between clear oligotrophic and turbid eutrophic waters. Other methods, such as chlorophyll depth-averages
using local attenuation conditions (Morel and Maritorena, 2001), require observations at multiple depths, which, given our 20
decision to use only in vitro measurements, would have reduced considerably the final number of observations.
With regard to the inherent optical properties ("aph", "adg", "bbp"), if not already calculated and provided in the contributed
data sets, they were computed from related variables that were available: particle absorption ("ap"), detrital absorption
("ad"), coloured dissolved organic matter (CDOM) absorption ("ag"), total backscattering ("bb"). The following equations
were used “adg = ad + ag”, “ap = aph + ad”, and “bb = bbp + bbw”. For the latter equation, the variable "bbw" was 25
computed using “bbw = bw/2”, where "bw" is the scattering coefficient of seawater derived from Zhang et al. (2009). The
diffuse attenuation coefficient for downward irradiance (“kd”) did not require any conversion and was compiled as originally
acquired. Observations of inherent optical properties (surface values) and diffuse attenuation coefficient for downward
irradiance, were acquired in total from six data sources designed for ocean-colour validation and applications (SeaBASS,
NOMAD, MERMAID, AWI, COASTCOLOUR, TPSS), thus already subject to the processing routines of these data sets. 30
Concerning total suspended matter, these data were compiled as originally available from MERMAID and
COASTCOLOUR.
The merged data set was compiled from 27 sets of in situ data, which were obtained individually either from archives that
Earth Syst. Sci. Data Discuss., https://doi.org/10.5194/essd-2019-27
Ope
n A
cces
s Earth System
Science
DataD
iscussio
ns
Manuscript under review for journal Earth Syst. Sci. DataDiscussion started: 18 February 2019c© Author(s) 2019. CC BY 4.0 License.
7
incorporate data from multiple contributors (SeaBASS, NOMAD, MERMAID, ICES, ARCSSPP, BIOCHEM, BODC,
COASTCOLOUR, MAREDAT, SEADATANET), or from particular contributors, measurement programs or projects
(MOBY, BOUSSOLE, AERONET-OC, HOT, GeP&CO, AMT, AWI, BARENTSSEA, BATS, CALCOFI, CCELTER,
CIMT, ESTOC, IMOS, PALMER, TPSS, TARA) and were subsequently, homogenized and merged. Data contributors are
listed in Table 2 and in the auxiliary material. There were methodological differences between data sets. Therefore, after 5
acquisition, and prior to any merging, each set of data was pre-processed for quality control and converted to a common
format. During this process, data were discarded if they had: 1) unrealistic or missing, date and geographic coordinate fields;
2) poor quality (e.g. original flags) or method of observation that did not meet the criteria for the data set (e.g. in situ
fluorescence for chlorophyll concentration); and 3) spuriously high or low data. For the last, the following limits were
imposed: for “chla_fluor” and “chla_hplc” [0.001-100] mg m-3; for “rrs” [0-0.15] sr-1; for “aph”, “adg” and “bbp” [0.0001-10
10] m-1; for “tsm” [0-1000] g m-3; for “kd” [(aw(λ)-10] m-1, where “aw” are the pure water absorption coefficients derived
from Pope and Fry (1997). Also during this stage, three metadata strings were attributed to each observation: “dataset”,
“subdataset” and “contributor”. The “dataset” contains the name of the original set of data, and can only be one of the
following: “aoc”, “boussole”, “mermaid”, “moby”, “nomad”, “seabass”, “hot”, “ices”, “amt”, “gepco”, “arcsspp”, “awi“,
“barentssea“, “bats“, “biochem“, “bodc“, “calcofi“, “cc“, “ccelter“, “cimt“, “estoc“, “imos“, “maredat“, “palmer“, 15
“seadatanet“, “tpss“, “tara”. The “subdataset” starts with the “dataset” identifier and is followed by additional information
about the data, as <dataset>_<cruise/station/site>) (e.g. “seabass_car81”). The “contributor” contains the name of the data
contributor. An effort was made to homogenize the names of data contributors from the different sets of data. These three
metadata are the link to trace each observation to its origin and were propagated throughout the processing. Finally, this
processing stage ended with each set of data being scanned for replicate variable data and replicate station data, which when 20
found, were averaged if the coefficient of variation was less than 50 %, otherwise they were discarded. Replicates were
defined as multiple observations of the same variable, with the same date, time, latitude, longitude and depth. Replicate
station data were defined as multiple measurements of the same variable, with the same date, time, latitude and longitude.
For the latter case, a search window of 5 minutes in time and 200 meters in distance was given, to account for station drift. A
small number of observations that were identified as replicates had a different “subdataset” identifiers (i.e. different cruise 25
names). These observations were considered suspicious if the values were different, and discarded. If the values were the
same, one of the observations was retained. This possibly originated from the same group of data being contributed to an
archive by two different data contributors.
Once a set of data was homogenized, its data were integrated into a unique table. This final merging focused on the removal
of duplicates between the sets of data. Although some duplicates are known (e.g. MOBY, BOUSSOLE, AERONET-OC and 30
NOMAD data are found in SeaBASS and MERMAID), others are unknown (e.g. how many of GeP&CO, ICES, AMT, HOT
are within NOMAD, SeaBASS and MERMAID). Therefore, duplicates were identified using the metadata ("dataset" and
"subdataset") when possible, and temporal-spatial matches, as an additional precaution. For temporal-spatial matches,
several thresholds were used, but typically 5 minutes and 200 meters were taken to be sufficient to identify most duplicated
Earth Syst. Sci. Data Discuss., https://doi.org/10.5194/essd-2019-27
Ope
n A
cces
s Earth System
Science
DataD
iscussio
ns
Manuscript under review for journal Earth Syst. Sci. DataDiscussion started: 18 February 2019c© Author(s) 2019. CC BY 4.0 License.
8
data, which reflected small differences in time, latitude and longitude, between the different sets of data. Larger thresholds
were used in some cases as a cautionary procedure. This was the case when searching for NOMAD data in other data sets,
because NOMAD includes a few cases where merging of radiometric and pigment data was done with large spatial-temporal
thresholds (Werdell and Bailey, 2005). A large temporal threshold was also used when integrating observations from the
three data sources that did not have time available (ESTOC, MAREDAT and TPSS). In regard to all data, if duplicates were 5
found, data from the NOMAD data set were selected first, followed by data from individual projects or contributors (MOBY,
BOUSSOLE, AERONET-OC, AMT, HOT,GeP&CO, AWI, BARENTSSEA, BATS, CALCOFI, CCELTER, CIMT,
ESTOC, IMOS, PALMER, TPSS and TARA) and finally for the remaining data sets (SeaBASS, MERMAID,ICES,
ARCSSPP, BIOCHEM, BODC, COASTCOLOUR, MAREDAT and SEADATANET). This procedure was chosen to
preserve the NOMAD data set as a whole, since it is widely used in ocean-colour validation. It should be noted that, by this 10
procedure, data from individual projects or contributors may be listed under NOMAD (e.g. some PALMER data are found in
NOMAD with metadata string “nomad_palmer_lter”). After giving priority to NOMAD, the priority was generally given to
data from individual projects or contributors, but due to an incremental approach, where only new data are added to previous
versions of the compilation, some data from individual projects or contributors (BATS, CALCOFI, CIMT, PALMER and
TPSS) added in later stages, may be found under other data sources. This occurs mainly for BATS and CALCOFI, which 15
have their earlier chlorophyll data in SeaBASS with metadata strings “seabass_bats*” and “seabass_cal*”, and also CIMT
which has some of its data under COASTCOLOUR. After all data from a given source were free of duplicates, they were
merged consecutively by variable in the final table. During this process, we also searched for rows (stations) that were
separated from each other by time differences less than 5 minutes and horizontal spatial differences of less than 200 meters.
When such rows were found, the observations in those rows were merged into a single row. The compiled merged data were 20
compared with the original sets to certify that no errors occurred during the merging. As a final step, a water-column
(station) depth was recorded for each observation, which was the closest water column depth from the ETOPO1 global relief
model (National Geophysical Data Center ETOPO1; Amante and Eakins, 2009). For observations where the closest water
depth was above sea level (e.g. data collected very near the coast), it was given the value of zero.
Data processing thus included two major steps: pre-processing and merging. The first step was related to each set of 25
contributing data sets in particular and aimed to identify problems and convert the data of interest to a standard format. The
second step dealt with the integration of data into one unique file and included the elimination of duplicated data between the
individual sets of data. In the next subsections a brief overview of each original set of data is provided.
2.2 Pre-processing of each set of data
2.2.1 Marine Optical Buoy (MOBY) 30
MOBY is a fixed mooring system operated by the National Oceanic and Atmospheric Administration (NOAA) that provides
a continuous time series of water-leaving radiance and surface irradiance in the visible region of the spectra since 1997. The
Earth Syst. Sci. Data Discuss., https://doi.org/10.5194/essd-2019-27
Ope
n A
cces
s Earth System
Science
DataD
iscussio
ns
Manuscript under review for journal Earth Syst. Sci. DataDiscussion started: 18 February 2019c© Author(s) 2019. CC BY 4.0 License.
9
site is located a few kilometres west of the Hawaiian Island of Lanai where the water depth is about 1200 m. Since its
deployment, MOBY measurements have been the primary basis for the on-orbit vicarious calibrations of the SeaWiFS and
MODIS ocean colour sensors. A full description of the MOBY system and processing is provided in Clark et al. (2003). Data
are freely available for scientific use at the MOBY Gold directory. The products of interest are the “Scientific Time Series”
files, which refer to MOBY data averaged over sensor-specific wavelengths and particular hours of the day (around 20-23 5
UTC). For this work, the satellite band-average products for SeaWiFS, MODIS AQUA, MERIS, VIIRS and the Ocean and
Land Colour Instrument (OLCI) were compiled from the “R2017 Reprocessing” . The “inband” average subproduct was
used, and to maintain the highest quality, only data determined from the upper two arms ("Lw1") and flagged "good" quality
were acquired. Data from the MOBY203 deployment were discarded due to the absence of surface irradiance data. The
compiled variable was the remote-sensing reflectance, “rrs”, which was computed from the original water-leaving radiance 10
(“Lw”) and surface irradiance (“Es”). The water-leaving radiances were corrected for the bidirectional nature of the light
field (Morel and Gentili, 1996; Morel et al., 2002) using the same look-up table and method as that used in the SeaWiFS
Data Analysis System (SeaDAS) processing code. The MOBY data were reprocessed in 2017 (“MOBY R2017
Reprocessing”) to include various improvements in the calibration of the instrument and post processing, which include: 1) a
new method to extrapolate the upwelling radiance attenuation coefficient to the surface; 2) an increase in arm depth by 0.234 15
m; and 3) a single pixel shift in the data for the red spectrograph collected at a bin factor of 384. Only the last two changes
were included in present compilation. As mentioned before, the MOBY data compiled in this work are sensor-specific.
Therefore, attention is necessary to use the correct MOBY data when validating a particular sensor. The way MOBY data are
stored in the final merged table is consistent with the original wavelengths; however, these wavelengths can differ from what
is sometimes expected to be the central wavelength of a given band and sensor. Irrespective of the wavelength where MOBY 20
data are stored in the final table, for validation of bands 1-6 of SeaWiFS, MOBY data stored in the final merged table at 412,
443, 490, 510, 555 and 670 nm, respectively, should be used. For validation of bands 1-6 of MODIS AQUA, MOBY data
stored in the final merged table at 416, 442, 489, 530, 547 and 665 nm, respectively, should be used. For validation of bands
1-7 of MERIS, MOBY data stored in the final merged table at 410.5, 440.4, 487.8, 507.7, 557.6, 617.5 and 662.4 nm,
respectively, are the appropriate data. For validation of bands 2-8 of OLCI, MOBY data stored in the final merged table at 25
412.0676, 443.1898, 490.7176, 510.6403, 560.5796, 620.626 nm and 665.3737, respectively, are the appropriate data.
Finally, for validation of bands 1-5 of VIIRS, MOBY data stored in the final merged table at 412.9, 444.5, 481.2, 556.3 and
674.6 nm, respectively, are the appropriate data.
2.2.2 BOUée pour l’acquiSition de Séries Optiques à Long termE (BOUSSOLE)
BOUSSOLE Project started in 2001 with the objective of establishing a time series of bio-optical properties in oceanic 30
waters to support the calibration and validation of ocean-colour satellite sensors (Antoine et al., 2006). The project consists
of a monthly cruise program and a permanent optical mooring (Antoine et al., 2008). The mooring collects radiometry and
inherent optical properties (IOPs) in continuous mode every 15 minutes at 2 depths (4 and 9 m nominally). The monthly
Earth Syst. Sci. Data Discuss., https://doi.org/10.5194/essd-2019-27
Ope
n A
cces
s Earth System
Science
DataD
iscussio
ns
Manuscript under review for journal Earth Syst. Sci. DataDiscussion started: 18 February 2019c© Author(s) 2019. CC BY 4.0 License.
10
cruises are devoted to the mooring servicing, to the collection of vertical profiles of radiometry and IOPs, and to water
sampling at 11 depths from the surface down to 200 m, for subsequent analyses including phytoplankton pigments,
particulate absorption, CDOM absorption and suspended particulate matter load. The BOUSSOLE mooring is in the Western
Mediterranean Sea at a water depth of 2400m. All pigment (2001-2012) and radiometric (2003-2012) data were provided by
the Principal Investigator. The compiled variables were “rrs” and “chla_hplc”. Observations of the diffuse attenuation 5
coefficient (“kd”) were not included in the present compilation, as they were under internal quality revision at the time of
data acquisition. Remote-sensing reflectance was computed from the original “fully-normalized” water-leaving radiance
(“nLw_ex”), which is the “normalized” water-leaving radiance (“nLw” previously described), with a correction for the
bidirectional nature of the light field (Morel and Gentili, 1996; Morel et al., 2002). The solar irradiance (“Fo”) was computed
from two available variables in the original set of data: the normalized water-leaving radiance ("nLw") and the remote-10
sensing reflectance ("rrs"), using the equation “Fo = nLw/rrs”. Only radiometric observations that meet the following criteria
were used: 1) tilt of the buoy was less than 10 °; 2) the buoy was not lowered by more than 2 m as compared to its nominal
water line (to ensure the Es reference sensor is above water and exempt from sea spray); and 3) the solar irradiance was
within 10 % of its theoretical clear-sky value (determined from Gregg and Carder, 1990). The latter criterion was used to
select clear skies only. An additional quality control was to remove observations that were 50 % higher or lower than the 15
daily average. This removed a small number of “spikes” in the time series. The final quality control step was to remove days
where the standard deviation was more than half of the daily average. This was meant to identify days with high variability.
Very few days (N = 2) were removed with this test. These quality control criteria were applied per wavelength, which
resulted in some observations with an incomplete spectrum.
2.2.3 AErosol RObotic NETwork-Ocean Color (AERONET-OC) 20
AERONET-OC is a component of AERONET, including sites where sun-photometers operate with a modified measurement
protocol leading to the determination of the fully-normalized water leaving radiance (Zibordi et al., 2006; Zibordi et al.,
2009). As a result of collaboration between the Joint Research Centre (JRC) and NASA, this component has been
specifically developed for the validation of ocean-colour radiometric products. The strength of AERONET-OC is “the
production of standardised measurements that are performed at different sites with identical measuring systems and 25
protocols, calibrated using a single reference source and method, and processed with the same codes” (Zibordi et al., 2006;
Zibordi et al., 2009). All high quality data (“Level-2”) were acquired from the project website, for 11 sites:
Abu_Al_Bukhoosh (~25° N, ~53° E) , COVE_SEAPRISM (~36° N, ~75° W), Gloria (~44° N, ~29 °E),
Gustav_Dalen_Tower (~58 °N, ~17 °E), Helsinki Lighthouse (~59 °N, ~24° E), LISCO (~40° N, ~73° W), Lucinda (~18° S,
~146° E), MVCO (~41° N, ~70° W), Palgrunden (~58° N, ~13° E; Philipson et al., 2016), Venice (~45° N, ~12° E) and 30
WaveCIS_Site_CSI_6 (~28° N, ~90° W). The compiled variable was “rrs”. Remote-sensing reflectance was computed from
the original “fully-normalized” water-leaving radiance (see Sect. 2.2.2 for definition). The solar irradiance (“Fo”), which is
not part of the AERONET-OC data, was computed from the Thuillier (2003) solar spectrum irradiance, by averaging “Fo”
Earth Syst. Sci. Data Discuss., https://doi.org/10.5194/essd-2019-27
Ope
n A
cces
s Earth System
Science
DataD
iscussio
ns
Manuscript under review for journal Earth Syst. Sci. DataDiscussion started: 18 February 2019c© Author(s) 2019. CC BY 4.0 License.
11
over a wavelength-centred 10 nm window. Data were compiled for the exact wavelengths of each record, which can change
over time for a given site depending on the specific instrument deployed.
In comparison with the previous compilation of AERONET-OC data from Lucinda site a calibration correction was applied
by NASA affecting instrument SN-520. All radiometric data from this instrument provided by NASA prior to October 2018
were underestimated by approximately a factor of two due to incorrect application of instrument gains during the processing. 5
2.2.4 SeaWiFS Bio-optical Archive and Storage System (SeaBASS)
SeaBASS is one of the largest archives of in situ marine bio-optical data (Werdell and Bailey, 2003). It is maintained by
NASA’s Ocean Biology Processing Group (OBPG) and includes measurements of optical properties, phytoplankton pigment
concentrations, and other related oceanographic and atmospheric data. The SeaBASS database consists of in situ data from
multiple contributors, collected using a variety of measurement instruments with consistent, community-vetted protocols, 10
from several marine platforms such as fixed buoys, hand-held radiometers and profiling instruments. Quality control of the
received data includes a rigorous series of protocols that range from file format verification to inspection of the geophysical
data values (Werdell and Bailey, 2003). Radiometric data were acquired through the "Validation" search tool, which
provided in situ data with matchups for particular ocean-colour sensors (Bailey and Werdell, 2006). The criterion in the
search-query was defined to have the minimal flag conditions in the satellite data, to retrieve a greater number of matchups 15
and, therefore, in situ data. Regarding phytoplankton pigment data, the majority were acquired through the "Pigment" search
tool, which provided pigment data directly from the archives. As was stated in the SeaBASS website , the "Pigment" search
tool was originally designed to return only in vitro fluorometric measurements, which is consistent with our approach, but
over time chlorophyll-a measurements made using other methods (e.g. in situ fluorometry) were included in the retrieved
pigment data. In the pigment data used in this work, a large number of in situ fluorometric measurements from continuous 20
underway instruments were identified and discarded. These data were initially identified from cruises with more than 50
observations per day, and then re-checked in the SeaBASS website to confirm whether indeed they were continuous
underway measurements. A total of 120412 such measurements were identified and discarded. Given the large volume of
this group of data, it is possible that some chlorophyll-a observations from in situ methods may have escaped the scrutiny
and persited into the final merged data set. The "Pigment" search tool was recently discontinued and, instead, the “File” 25
search tool can be used, which was also used here to acquire chlorophyll observations for more recent years. The compiled
variables from SeaBASS data were: “rrs”, “chla_hplc”, “chla_fluor”, “aph”, “adg”, “bbp”, “kd”. No conversion was
necessary since all variables were acquired in the desired format.
2.2.5 NASA bio-Optical Marine Algorithm Data set (NOMAD)
NOMAD is a publicly-available data set compiled by the NASA OBPG at the Goddard Space Flight Center. It is a high-30
quality global data set of coincident radiometric and phytoplankton pigment observations for use in ocean-colour algorithm
Earth Syst. Sci. Data Discuss., https://doi.org/10.5194/essd-2019-27
Ope
n A
cces
s Earth System
Science
DataD
iscussio
ns
Manuscript under review for journal Earth Syst. Sci. DataDiscussion started: 18 February 2019c© Author(s) 2019. CC BY 4.0 License.
12
development and satellite-data product-validation activities (Werdell and Bailey, 2005). The source bio-optical data is the
SeaBASS archive, therefore, many dependencies exist between these two data sets, which were addressed during the
merging. The current version (Version 2.0 ALPHA, 2008) includes data from 1991 to 2007 and an additional set of
observations of inherent optical properties. The current version was used in this work, but with an additional set of columns
of remote-sensing reflectance corrected for the bidirectional effects (Morel and Gentili, 1996; Morel et al., 2002). This 5
additional set of columns was provided directly by the NOMAD creators. The compiled variables were “rrs”, “chla_hplc”,
“chla_fluor”, “aph”, “adg”, “bbp”, “kd”. Conversion was necessary only for “aph”, “adg” and “bbp”, and followed the
procedures described in Sect. 2.1. For the calculation of “bbp” the variable “bb” was used with a smooth fitting to remove
noise. A portion of NOMAD data were optically weighted (for methods see Werdell and Bailey, 2005). These data are not
consistent with the protocols chosen in this work, but these observations were retained since NOMAD is a widely-used data 10
set in ocean-colour validation.
2.2.6 MERIS Match-up In situ Database (MERMAID)
MERMAID provides in situ bio-optical data matched with concurrent and comparable MERIS Level 2 satellite ocean-colour
products (Barker, 2013a; Barker, 2013b). The MERMAID in situ database consists of data from multiple contributors,
measured using a variety of instruments and protocols, from several marine platforms such as fixed buoys, hand-held 15
radiometers and profiling instruments. Comprehensive quality control and protocols are used by MERMAID to integrate all
the data into a common and comparable format (Barker, 2013a; Barker, 2013b). Access to MERMAID data is limited to the
MERIS Validation Team, the MERIS Quality Working Group and to the in situ data contributors. For this work, access has
been granted to the MERMAID database, through a signed Service Level Agreement. The MERMAID data includes sub-sets
of several data sets used in this compilation (MOBY, AERONET-OC, BOUSSOLE, NOMAD). These observations were 20
removed from the MERMAID dataset to avoid duplication (as discussed in Sect. 2.1). The compiled variables were “rrs”,
“chla_hplc”, “chla_fluor”, “aph”, “adg”, “bbp”, “kd” and “tsm”. Remote-sensing reflectance was calculated by dividing by π
the original irradiance reflectance provided. Conversion was also necessary for “aph”, “adg” and “bbp”, and followed the
procedures described in Sect. 2.1.
2.2.7 Hawaii Ocean Time-series (HOT) 25
HOT programme provides repeated comprehensive observations of the hydrography, chemistry and biology of the water
column at a station located 100 km north of Oahu, Hawaii, since October 1988 (Karl and Michaels, 1996). This site is
representative of the North Pacific subtropical gyre. Cruises are made approximately once a month to the deep-water Station
ALOHA (A Long-Term Oligotrophic Habitat Assessment; 22° 45' N, 158° 00' W). Pigment data ("chla_hplc" and
"chla_fluor") were extracted directly from the project website. Radiometric measurements from the HOT project are also 30
available, but observations of “rrs” and “kd” from the HOT project were acquired in this work as part of the SeaBASS data
set.
Earth Syst. Sci. Data Discuss., https://doi.org/10.5194/essd-2019-27
Ope
n A
cces
s Earth System
Science
DataD
iscussio
ns
Manuscript under review for journal Earth Syst. Sci. DataDiscussion started: 18 February 2019c© Author(s) 2019. CC BY 4.0 License.
13
2.2.8 Geochemistry, Phytoplankton, and Color of the Ocean (GeP&CO)
GeP&CO is part of the French PROOF programme and aims to describe and understand the variability of phytoplankton
populations, and to assess its consequences on the geochemistry of the oceans (Dandonneau and Niang, 2007). It is based on
the quarterly travels of the merchant ship Contship London from France to New Caledonia in the Pacific. A scientific
observer sailed on each trip and operated the sampling for surface water, filtration, various measurements and checking at 5
several times of each day. The experiment started in October 1999 and finished in July 2002. Pigment data were extracted
from the project website. Additional pigment data obtained during the OISO-4 cruise in the south Indian Ocean onboard R/V
Marion-Dufresne (Jan-Feb 2000) were added. The samples were measured by Yves Dandonneau following the method used
in the GeP&CO project. The compiled variable was "chla_hplc" and “chla_fluor”.
2.2.9 Atlantic Meridional Transect (AMT) 10
AMT is a multidisciplinary programme, which undertakes biological, chemical and physical oceanographic research during
an annual voyage between the UK and destinations in the South Atlantic (Robinson et al., 2006). The programme was
established in 1995 and since then has completed 28 research cruises. Pigment data between 1997 (AMT5) and 2005
(AMT17) were provided by the British Oceanographic Data Centre (BODC) following a specific request for discrete
observations of chlorophyll-a concentration since 1997. The AMT data were isolated by searching for the string “AMT” in 15
the “Cruise” columns and the respective Principal Investigators were then searched individually in a separated metadata file.
Data not flagged with highest quality or without method of measurement were not used. For any interest in the original data,
BODC is the point of contact, which ensures that if there are any updates, the most recent data are supplied. The compiled
variables are "chla_hplc" and "chla_fluor".
2.2.10 International Council for the Exploration of the Sea (ICES) 20
ICES is a network of more than 4000 scientists from almost 300 institutes, with 1600 scientists participating in activities
annually. The ICES Data Centre manages a number of large data set collections related to the marine environment covering
the North East Atlantic, Baltic Sea, Greenland Sea and Norwegian Sea. The majority of data originate from national
institutes that are part of the ICES network of member countries. Data were provided (on 2014-04-28) from the ICES
database on the marine environment (Copenhagen, Denmark) following a specific request. The ICES data were made 25
available under the ICES data policy and if there is any conflict between this and the policy adopted by the users, then the
ICES policy applies. The compiled variables were "chla_hplc" and "chla_fluor".
2.2.11 Arctic System Science Primary Production (ARCSSPP)
ARCSSPP database is a synthesis of observations between 1954 and 2006, from the Arctic Ocean and northern Seas (Matrai
et al., 2013). The observations were acquired from data repositories, publications or provided by individual investigators. 30
Earth Syst. Sci. Data Discuss., https://doi.org/10.5194/essd-2019-27
Ope
n A
cces
s Earth System
Science
DataD
iscussio
ns
Manuscript under review for journal Earth Syst. Sci. DataDiscussion started: 18 February 2019c© Author(s) 2019. CC BY 4.0 License.
14
The database includes quality-controlled observations of productivity and chlorophyll a, photosynthetically available
radiation and hydrographic parameters. This collection of data was acquired at http://www.nodc.noaa.gov/cgi-
bin/OAS/prd/accession/download/63065. For the present work, only observations of chlorophyll-a concentration with known
time zones were used. The compiled chlorophyll observations were from discrete samples, but the exact method (either
“chla_fluor” or “chla_hplc”) was not available for all observations. Thus, the ARCSSPP chlorophyll observations were 5
marked as “chla_fluor”, although some might have been from HPLC measurements, and were flagged with “1” in a column
“flag_chla_method”. The compiled variable was "chla_fluor".
2.2.12 Data provided by Astrid Bracher, Alfred-Wegener-Institute Helmholtz Centre for Polar and Marine Research
(AWI)
In this work, the AWI data source refers to the group of observations that were provided to OC-CCI project by Astrid 10
Bracher. These are bio-optical observations collected during several cruises in the Atlantic and Pacific Oceans. All data were
available through the PANGAEA repository. Observations of concentration of chlorophyll-a, and 1nm spectrally resolved
remote sensing reflectances and algal pigment absorption coefficient were considered. The methods for these observations
are described by Taylor et al. (2011). For chlorophyll, data from the following cruises were used: ANT-XXIV/1, ANT-
XXIV/4, ANT-XXVI/4 and MSM18/3 (doi.pangaea.de/10.1594/PANGAEA.847820), SO202/2 15
(doi.pangaea.de/10.1594/PANGAEA.820607), ANT-XXVII/2 (doi.pangaea.de/10.1594/PANGAEA.848590), ANT-XXV/1
(doi.pangaea.de/10.1594/PANGAEA.819099), ANT-XXVIII/3 and SO218 (doi.pangaea.de/10.1594/PANGAEA.848591).
Concerning remote sensing reflectances, the observations taken during cruises ANT-XXIV/4 and ANT-XXVI/4
(doi.pangaea.de/10.1594/PANGAEA.847820), and cruise ANT-XXV/1 (doi.pangaea.de/10.1594/PANGAEA.819099) were
gathered. The remote sensing reflectances were corrected for the bidirectional nature of the light field (Morel and Gentili, 20
1996; Morel et al., 2002). The absorption coefficients were taken during cruise SO202/2
(doi.pangaea.de/10.1594/PANGAEA.820607), cruise ANT_XXV/1 (doi.pangaea.de/10.1594/PANGAEA.819099) and
cruises ANT-XXVI/3 and ANT-XXVIII/3 (doi.pangaea.de/10.1594/PANGAEA.819617). The compiled variables were
"chla_hplc", “rrs” and “aph”.
2.2.13 Bermuda Atlantic Time-series Study (BATS) 25
BATS is a long-term study by the Bermuda Institute of Ocean Sciences based on regular cruises in the western Atlantic
Ocean (Sargasso Sea) since 1988. The cruises at BATS site (~ 31º 40'N, 64º 10'W) sample ocean temperature and salinity,
but are focused on biogeochemical variables such as nutrients, dissolved inorganic carbon, oxygen, HPLC of pigments,
primary production and sediment trap flux. In this work all the phytoplankton pigment data available from the BATS website
(http://bats.bios.edu/bats-data/) were considered, which also included regional and transect cruises not specific to the 30
nominal BATS site. The compiled variables were "chla_hplc" and “chla_fluor”.
Earth Syst. Sci. Data Discuss., https://doi.org/10.5194/essd-2019-27
Ope
n A
cces
s Earth System
Science
DataD
iscussio
ns
Manuscript under review for journal Earth Syst. Sci. DataDiscussion started: 18 February 2019c© Author(s) 2019. CC BY 4.0 License.
15
2.2.14 Data provided by Knut Yngve Børsheim (BARENTSSEA)
The BARENTSSEA data source refers to a group of observations that were provided to OC-CCI project by Knut Yngve
Børsheim. This collection was developed using data from the archives of the Institute of Marine Research (Norway). It
comprises observations of temperature, salinity and chlorophyll-a routinely collected by cruises, mainly in the North Sea, the
Norwegian Sea and the Barents Sea between 1997 and 2013. The chlorophyll-a concentration was measured by filtering and 5
extraction using Turner fluorometers. The compiled variable was "chla_fluor".
2.2.15 The Fisheries and Oceans Canada database for biological and chemical data (BIOCHEM)
BioChem is an archive of marine biological and chemical data maintained by Fisheries and Oceans Canada (DFO, 2018;
Devine et al., 2014). The available observations are from department research initiatives and collected in areas of Canadian
interest. Available parameters include pH, nutrients, chlorophyll, dissolved oxygen and other plankton data (species and 10
biomass). Chlorophyll measurements from in vitro fluorometric methods were extracted (from http://www.dfo-
mpo.gc.ca/science/data-donnees/biochem/index-eng.html) with close guidance by the BioChem helpdesk, confirming quality
and methods. The used data span from 1997 to 2014 and were mainly from the Gulf of St. Lawrence (western North
Atlantic). The compiled variable was "chla_fluor".
2.2.16 British Oceanographic Data Centre (BODC) 15
(BODC is the designated marine science data centre for the United Kingdom. The data used in this work derive from a
specific request for discrete observations of chlorophyll-a concentration since 1997. Initially, this request was used to
compile AMT data (see section 2.2.9). The remaining data comprising observations of chlorophyll-a concentration from
fluorometric and HPLC methods, mostly sampled in the North Atlantic, were analysed and added (the dataset string for this
data source is “bodc”). Data not flagged with highest quality or without method of measurement were discarded. The 20
compiled variables were "chla_hplc" and "chla_fluor".
2.2.17 California Cooperative Oceanic Fisheries Investigations (CALCOFI)
CalCOFI is a partnership of the California Department of Fish & Wildlife, National Oceanic & Atmospheric Administration
Fisheries Service and Scripps Institution of Oceanography. CalCOFI has conducted quarterly cruises off southern and central
California since 1949. Data collected in the upper 500 meters include: temperature, salinity, oxygen, nutrients, chlorophyll, 25
primary productivity, plankton biodiversity, and biomass. For this work, only observations of chlorophyll-a concentration
derived from fluorometric methods flagged with highest quality were used. Data were acquired from the file
“CalCOFI_Database_194903-201701_csv_20Sept2017.zip” available at
http://www.calcofi.org/new.data/index.php/reporteddata#database. The compiled variable was "chla_fluor".
2.2.18 California Current Ecosystem Long-Term Ecological Research (CCELTER) 30
Earth Syst. Sci. Data Discuss., https://doi.org/10.5194/essd-2019-27
Ope
n A
cces
s Earth System
Science
DataD
iscussio
ns
Manuscript under review for journal Earth Syst. Sci. DataDiscussion started: 18 February 2019c© Author(s) 2019. CC BY 4.0 License.
16
CCELTER investigates the California Current coastal pelagic ecosystem, with a focus on long term forcing. The CCELTER
data includes primary and derived measurements from both Process and CalCOFI-augmented cruises, as well other time
series. CCELTER data include variables from the physical environment, biogeochemistry and biological
populations/communities. For this work chlorophyll observations measured from discrete bottle samples from CCELTER
Process cruises determined by extraction and bench fluorometry 5
(http://dx.doi.org/10.6073/pasta/7feb632dabb30f0e79683017721a83c7) were compiled. The compiled variable was
"chla_fluor".
2.2.19 Center for Integrated Marine Technologies (CIMT)
CIMT was a non-operational program where marine scientists from different disciplines and institutions combine their
efforts on observations directed towards understanding the central California upwelling system. The CIMT archived data 10
includes coastal ocean observations from satellites, shipboard data, moorings and large marine animal movements. For this
work, pigment data from discrete bottle samples taken during CIMT monthly cruises were used. Data were acquired from the
project website (https://cimt.ucsc.edu/data_portal.htm). The compiled variable was "chla_fluor".
2.2.20 CoastColour Round Robin (COASTCOLOUR)
COASTCOLOUR datasets were designed to evaluate the performance of ocean colour satellite algorithms in the retrieval of 15
water quality parameters in coastal waters (Nechad et al., 2015). Three types of COASTCOLOUR datasets are available: 1)
a match-up dataset where in-situ bio-optical observations are available simultaneously with a cloud-free MERIS product; 2)
an in-situ reflectance dataset where an in-situ reflectance is available simultaneously with an in-situ measurement of
chlorophyll-a concentration and/or total suspended matter; and 3) a simulated dataset where reflectances were generated by a
radiative transfer model. This work used the match-up dataset, which includes most of the in-situ measurements, and is 20
available at https://doi.pangaea.de/10.1594/PANGAEA.841950. The match-up dataset provides optical, biogeochemical and
physical data collections at 17 sites across the globe. From this dataset, observations of reflectance, chlorophyll a, total
suspended matter and IOPs were compiled. The remote sensing reflectances were corrected for the bidirectional nature of the
light field (Morel and Gentili, 1996; Morel et al., 2002). The compiled variables were “rrs”, “chla_hplc”, “chla_fluor”,
“aph”, “adg”, “bbp” and “tsm”. 25
2.2.21 European Station for Time series in the Ocean, Canary Islands (ESTOC)
ESTOC is an open-ocean monitoring site located in the eastern North Atlantic subtropical gyre. ESTOC was initiated in
1991 with particle flux measurements, and in 1994 began standard observations of the water column, in addition to the
deployment of a current meter mooring. The core parameters measured at ESTOC include salinity, temperature, current
speed, nutrients, chlorophyll, inorganic carbon, particulate organic carbon and nitrogen, and sinking particle flux (Neuer et 30
al., 2007). For this work measurements of chlorophyll a concentration from monthly cruises from 1994 to 2011 were used.
Earth Syst. Sci. Data Discuss., https://doi.org/10.5194/essd-2019-27
Ope
n A
cces
s Earth System
Science
DataD
iscussio
ns
Manuscript under review for journal Earth Syst. Sci. DataDiscussion started: 18 February 2019c© Author(s) 2019. CC BY 4.0 License.
17
These data were provided to CCI following a specific request. The time of day was unavailable and was set to 12:00:00
(UTC). These observations were flagged with “1” in column “flag_time”. The compiled variable was “chla_fluor”.
2.2.22 Integrated Marine Observing System (IMOS)
IMOS is a national collaborative research infrastructure supported by Australian Government. Since 2006, IMOS operates a
wide range of observing equipment throughout the coastal and open ocean around Australia, making all data openly 5
available to the scientific community, and other stakeholders and users. In this work, the IMOS dataset refers only to a data
collection entitled IMOS National Reference Station (NRS) - Phytoplankton HPLC Pigment Composition Analysis, which
was acquired from the Australian Ocean Data Network Portal (https://portal.aodn.org.au). This dataset comprises
phytoplankton pigment composition measured by HPLC collected as part of the IMOS National Mooring Network - National
Reference Station field sampling. Pigment sampling was conducted on a monthly basis with small vessels at nine sites. The 10
IMOS also hosts the Satellite Remote Sensing Bio-optical Database, which comprises phytoplankton pigment composition
measured by HPLC collected as part of a suite of bio-optical parameters from samples collected from research voyages in
Australian waters, however for this work, the observations from the IMOS Bio-optical Database were acquired as a subset of
the SeaBASS dataset. The compiled variable was “chla_hplc”.
2.2.23 MARineEcosytem DATa (MAREDAT) 15
MAREDAT database is a global assemblage of pigments measured by HPLC (Peloquin et al., 2013) from combination of
136 independent field datasets, solicited from investigators and databases. The database provides high quality measurements
of taxonomic pigments including chlorophylls a and b, 19’-butanoyloxyfucoxanthin, 19’-hexanoyloxyfucoxanthin,
alloxanthin, divinyl chlorophyll a, fucoxanthin, lutein, peridinin, prasinoxanthin, violaxanthin and zeaxanthin. The database
is available through PANGAEA (http://doi.pangaea.de/10.1594/PANGAEA.793246). For this work only measurements of 20
Total Chlorophyll a flagged with high quality were used. The time of day was unavailable and was set to 12:00:00 (UTC).
These observations were flagged with “1” in column “flag_time”. The compiled variable was “chla_hplc”.
2.2.24 Palmer Station Long-Term Ecological Research (PALMER)
PALMER is a monitoring station located in western Antarctic Peninsula. The Palmer station investigates the marine ecology
of the Southern Ocean with focus on the pelagic marine ecosystem, including sea ice habitats, regional oceanography and 25
nesting sites of seabird predators. The PALMER data include measurements of meteorological, oceanographic, sea ice,
predators, nutrients and biogeochemistry, pigments, primary production, zooplankton and microbes parameters. This work
used the measurements of chlorophyll analysed by HPLC and fluorometry taken at the Palmer Station
(http://dx.doi.org/10.6073/pasta/0624c7d161d3b5486d7ba06c2e50ee21 and
http://dx.doi.org/10.6073/pasta/dea95430a6ad84ecea023ee1ced650d3) and from the annual cruises off the coast of the 30
Earth Syst. Sci. Data Discuss., https://doi.org/10.5194/essd-2019-27
Ope
n A
cces
s Earth System
Science
DataD
iscussio
ns
Manuscript under review for journal Earth Syst. Sci. DataDiscussion started: 18 February 2019c© Author(s) 2019. CC BY 4.0 License.
18
Western Antarctica Peninsula (http://dx.doi.org/10.6073/pasta/4d583713667a0f52b9d2937a26d0d82e and
http://dx.doi.org/10.6073/pasta/c479b922d42ace1ce37f9a977e214952). The compiled variables were “chla_hplc”,
“chla_fluor”.
2.2.25 SeaDataNet archive (SEADATANET)
SeaDataNet is a Pan-European infrastructure for ocean and marine data management. It aims to develop a standardised 5
system for managing large and diverse data sets collected by oceanographic cruises and automatic observation systems. For
this work, discrete chlorophyll-a concentration observations with an “access restriction” set to "academic" and "unrestricted"
were acquired from the SeaDataNet platform with guidance from helpdesk. Only data from the “Institute of Marine Research
- Norwegian Marine Data Centre (NMD), Norway”, which comprised most of the acquired data, were used. All chlorophyll
observations were from discrete samples measured by fluorometric, spectrophotometric or HPLC methods, but the exact 10
method was not given. Thus, the observations were marked as “chla_fluor”, although some were possibly from HPLC
measurements, and were flagged with “1” in a column “flag_chla_method”. The compiled variables were “chla_fluor”.
2.2.26 Data provided by Trevor Platt and Shubha Sathyendranath (TPSS)
In this work, the TPSS data source refers to a group of observations that were provided to this compilation by Trevor Platt
and Shubha Sathyendranath. This is a collection of bio-optical in-situ data collected during cruises predominantly in the 15
North West Atlantic, but also from the Indian Ocean, South Pacific and Central Atlantic (see Sathyendranath et al. 2009 for
additional details). It comprises measurements of phytoplankton pigments and algal pigment absorption coefficients. The
time of day was unavailable and was set to 12:00:00 (UTC). These observations were flagged with “1” in column
“flag_time”. The compiled variables were "chla_hplc", "chla_fluor" and “aph”.
2.2.27 Bio-optical data from Tara expeditions (TARA) 20
The Tara expeditions consist of several cruises around the world, some with durations of several years, designed to study and
understand the distribution of planktonic organisms in the world ocean. The discrete observations of remote sensing
reflectance and chlorophyll-a concentration from HPLC measurements taken during the Tara “Oceans” (2009-2013) and
“Mediterranean” (2014) expeditions were considered in this work. These data were provided to ESA OC-CCI project by
Emmanuel Boss and were available in the SeaBASS archive. The remote sensing reflectances were corrected for the 25
bidirectional nature of the light field (Morel and Gentili, 1996; Morel et al., 2002). The compiled variables were "chla_hplc"
and “rrs”.
3 Results
In this work several sets of bio-optical in situ data were acquired, homogenised and merged into a single table. The table is
Earth Syst. Sci. Data Discuss., https://doi.org/10.5194/essd-2019-27
Ope
n A
cces
s Earth System
Science
DataD
iscussio
ns
Manuscript under review for journal Earth Syst. Sci. DataDiscussion started: 18 February 2019c© Author(s) 2019. CC BY 4.0 License.
19
comprises in situ observations between 1997 and 2017, with a global distribution, and includes the following variables:
remote-sensing reflectance ("rrs"), chlorophyll-a concentration ("chla"), algal pigment absorption coefficient ("aph"), detrital
and coloured dissolved organic matter absorption ("adg"), particle backscattering coefficient ("bbp"), diffuse attenuation
coefficient for downward irradiance ("kd") and total suspended matter (“tsm”). All observations in the table were processed
in such a way that they can be compared directly with satellite-derived ocean-colour data. The table consists of 136,250 rows 5
and 1,286 columns. Each row represents a unique station in space and time, separated from the rest by at least 5 minutes and
200 meters. For each observation in a given station, there are three metadata strings: “dataset”, “subdataset” and
“contributor”. The columns of the table take the form described in Table 1. The data contributors are indicated in Table 2.
Regarding spectral variables, all original wavelengths were preserved, which requires a large number of unique wavelengths
to be maintained in the database. No band shifting was performed (though some archived data in some data sources may 10
have been merged with nearby wavelengths) and no minimum number of wavelengths per observation was imposed. This
allows further manipulation of the table for different purposes. In the following paragraphs, the table is analysed and the
final group of observations is described for each contributing data set; however, the numbers reported here do not reflect the
original numbers in each data set, since duplicates across contributing data sets were removed (e.g. NOMAD and others
were removed from MERMAID). 15
Observations of remote-sensing reflectance are available at 611 unique wavelengths (i.e. columns), between 404.7 nm and
1022.1 nm (Fig. 1). In total there are 59,781 observations (i.e. rows) with remote-sensing reflectance in the table. The total
number of observations are partitioned per contributing data sets as follows: AERONET-OC (31,574), BOUSSOLE
(17,364), MOBY (5,466), NOMAD (3,326), MERMAID (885), SeaBASS (698), AWI (54), COASTCOLOUR (307) and
TARA (107). Data from AERONET-OC, BOUSSOLE and MOBY correspond to continuous time series, and, hence, the 20
higher number of observations. Data distribution at 44X nm and 55X nm is provided in Fig. 2a and b, respectively. Data
were first searched at 445 and 555 nm, and then with a search window up to 8 nm, to include also data at 547 nm. Median
values at 44X nm range from 0.003 m-1 (AERONET-OC) and 0.009 m-1 (MOBY), whereas at 55X nm the median values lie
between 0.001 m-1 (AWI) and 0.007 m-1 (COASTCOLOUR). The observations are unevenly distributed between each month
of the year in both hemispheres, with a higher coverage in summer months (Figure 3). There are fewer data in the Southern 25
Hemisphere than in the Northern Hemisphere (Fig. 3). For additional analysis, “rrs” band ratios were plotted against each
other (490:555 versus 412:443, Fig. 4). Most points are within the boundaries of the NOMAD dataset, but some scattered
points were found. These points were retained in the table to allow further manipulation with different quality control
criteria. Complementary analysis of remote-sensing reflectance data is made when other variables are concurrently available
and discussed below (see Fig. 11 and Fig. 16). The geographic distribution of remote-sensing reflectance observations (Fig. 30
5) shows a higher number of observations in some coastal regions, such as those of North America and Northern Europe.
The central regions of the ocean show a lower number of observations, with the Atlantic Ocean having the highest density in
relation to the other oceans. Best geographic coverage is provided by the NOMAD database. Data from SeaBASS are fewer
in number but are still important. Data from MERMAID are mainly located along the coasts of Europe, North America, and
Earth Syst. Sci. Data Discuss., https://doi.org/10.5194/essd-2019-27
Ope
n A
cces
s Earth System
Science
DataD
iscussio
ns
Manuscript under review for journal Earth Syst. Sci. DataDiscussion started: 18 February 2019c© Author(s) 2019. CC BY 4.0 License.
20
the central region of the North Atlantic Ocean. The observations from COASTCOLOUR are concentrated in 17 coastal sites
around the world, while AWI data are available for the Atlantic, Pacific and Southern Ocean. TARA data are scattered
across several regions, with highest data density in Mediterranean Sea.
For chlorophyll-a concentration, two types of observations were compiled, one measured by fluorometric or
spectrophotometric methods (“chla_fluor”), and the other measured by HPLC methods (“chla_hplc”). A comparison of both 5
measurements (Fig. 6), when available at the same station shows good agreement (Trees et al., 1985). As stated before, the
analysis was done on the final merged table, thus no data were filtered and the good relation can be explained in part by the
quality control implemented by the data providers and curators of repositories such as NOMAD and SeaBASS (Werdell and
Bailey, 2005). The total number of rows with concurrent “chla_fluor” and “chla_hplc” is 5344, with contributions from
SeaBASS (39 %), TPSS (18%), NOMAD (13 %), PALMER (9%), BATS (6%), COASTCOLOUR (5%), MERMAID (4 %), 10
HOT (4 %), AMT+GeP&CO+BODC+CCELTER+CALCOFI (2 %). The “chla_fluor” observations are available in 61,525
stations (rows), with values ranging from 0.001 to 100 mg m-3 (Fig. 7). They are from NOMAD (2,350), SeaBASS (18,122),
MERMAID (3,711), ICES (5,421), HOT (702),AMT (164), ARCSSPP (189), BARENTSSEA (7,188), BATS (356),
BIOCHEM (4,592), BODC (895), CALCOFI (4,631), COASTCOLOUR (3,322), CCELTER (254), CIMT (204.), ESTOC
(100), GEPCO (56), PALMER (2,865), SEADATANET (5,403) and TPSS (1000). The total number of “chla_hplc” 15
observations is 23,550, ranging from 0.002 to 99.8 mg m-3 (Fig. 7), with contributions from NOMAD (1,309), SeaBASS
(9,478), MERMAID (707), ICES (2,994), HOT (193), GeP&CO (1,536), BOUSSOLE (397), AMT (902), AWI (750),
BATS (334), BODC (735), COASTCOLOUR (848), IMOS (103), MAREDAT (1,024), PALMER (1,077), TPSS (1,002)
and TARA (161). The combined chlorophyll data set (all chlorophyll data considered, but for a given station, HPLC data
were selected if available), has a total of 79,731 observations, with 10 %, 49 %, 41 % respectively from oligotrophic (<0.1 20
mg m-3), mesotrophic (0.1 - 1 mg m-3), and eutrophic (>1 mg m-3) waters. When compared with the proportions of the world
ocean in these trophic classes, 56% oligotrophic, 42% mesotrophic and 2% eutrophic (Antoine et al., 1996), oligotrophic
waters are under-represented and eutrophic waters are over-represented in the compilation. The combined chlorophyll data
set is unevenly distributed between each month of the year in both Northern and Southern Hemispheres, with higher
coverage in summer months (Fig. 3). There are fewer data in the Southern Hemisphere than in the Northern Hemisphere 25
(Fig. 3). The spatial distribution of the chlorophyll values for the combined data set (Fig. 8) shows a good agreement with
known biogeographical features, such as lower chlorophyll values in the subtropical gyres, and higher values in temperate,
coastal and upwelling regions. Many regions show a good spatial coverage (e.g. Atlantic and Pacific Ocean), while others
are less well sampled (e.g. Southern and Indian Oceans). Of the contributing data sets, NOMAD and SeaBASS provide a
good spatial coverage in many regions (Fig. 9). Other data sets also provide coverage from several locations across the globe 30
(GEPCO, MAREDAT, TARA). The ICES,MERMAID and BODC data are mainly located along the coastal regions of
Europe. The AMT and many AWI data mainly covers the central part of the Atlantic Ocean, other AWI data cover the
Atlantic sector and the Amundsen to Bellinghausen Sea of the Southern Ocean and the Western subtropical and tropical
Pacific. The SEADATANET, ARCSSPP and BARENTSEA provide coverage for the Arctic region and northern seas of the
Earth Syst. Sci. Data Discuss., https://doi.org/10.5194/essd-2019-27
Ope
n A
cces
s Earth System
Science
DataD
iscussio
ns
Manuscript under review for journal Earth Syst. Sci. DataDiscussion started: 18 February 2019c© Author(s) 2019. CC BY 4.0 License.
21
North Atlantic. The observations from BIOCHEM and TPSS are mostly concentrated in the eastern coast of North America,
while CALCOFI, CCELTER and CIMT provide data for the western coast. The remaining data sets provide observations for
fixed locations: PALMER (western Antarctic peninsula), COASTCOLOUR (17 coastal sites across the world), BATS
(Bermuda, North Atlantic), BOUSSOLE (Mediterranean), HOT (Hawaii, North Pacific), IMOS (coastal sites around
Australia), ESTOC (Canaries, North Atlantic). Figure 9 shows all data sources that contribute with chlorophyll observations, 5
but many overlap each other, especially around Europe and North America. For additional analysis and as an example of the
applications of the compiled data set, the combined chlorophyll data (“chla_fluor” and “chla_hplc”) were partitioned into 5º
x 5º boxes and for each box the number of observations, average value and standard deviation were computed (Fig. 10 a, b
and c, respectively). The number of observations can be very high (>1000) in some boxes along the European and North
American coastlines and relatively low (<20) in oceanic regions. Again there is evidence in the average value map (Fig. 10 10
b) of well-known biogeographical features, such as the lower chlorophyll in the subtropical gyres and higher values in
coastal and upwelling areas. There is a close correspondence between the spatial patterns of the average and standard
deviation maps (Fig. 10 b and c), which may be an indicator of the data quality.
Coincident observations of chlorophyll-a concentration and remote-sensing reflectance are available at 3,814 stations. These
observations are mostly from NOMAD (79 %), MERMAID (9 %), COASTCOLOUR (6%), and SeaBASS (5 %). The 15
maximum of three band ratios of remote-sensing reflectance is plotted against chlorophyll-a concentration (Fig. 11). The
“chla” values used are the combined HPLC and fluorometric chlorophyll-a and for the “rrs”, the closest spectral observation
within 2 nm was used. The maximum band ratios were calculated using the maximum value between [rrs(443)/rrs(555),
rrs(490)/rrs(555), rrs(510)/rrs(555)] or [rrs(443)/rrs(560), rrs(490)/rrs(560), rrs(510)/rrs(560)] if rrs(555) was not available.
The relationship between maximum band ratio and chlorophyll is close to the NASA OC4 and OC4E v6 standard algorithm 20
(http://oceancolor.gsfc.nasa.gov/cms/atbd/chlor_a) equally based on maximum band ratios, providing confidence in the
quality of the compiled data.
The inherent optical properties (“aph”, “adg” and “bbp”) are available at 550 unique wavelengths between 300 and 850 nm.
There is a total of 3,293, 1,654 and 792 observations, for “aph”, “adg” and “bbp”, respectively. For “aph” the total number of
observations is distributed among NOMAD (1,190), TPSS (966), COASTCOLOUR (593), AWI (458), SeaBASS (14) 25
andMERMAID (72). For “adg” the contributions are as follows: NOMAD (1,079), COASTCOLOUR (531), SeaBASS (11)
and MERMAID (33). The “bbp” observations come from NOMAD (371), COASTCOLOUR (154), SeaBASS (32) and
MERMAID (235). Data distribution of “aph”, “adg” and “bbp” at 44X nm and 55X nm for each data set is provided in Fig.
12 a - f. Median values of “aph”, “adg” and “bbp” at 44X and 55X nm for each data set are summarized in Table 3. For
additional analysis, the following band ratios for the absorption coefficients were calculated: aph(490)/aph(443), 30
aph(412)/aph(443), adg(443)/adg(490) and adg(412)/adg(443). Data within 2 nm of the wavelengths were used to maximize
the number of points. The distribution of the ratios is shown in Fig. 13. Several observations were found to be outside the
thresholds used in the IOCCG report 5 for quality control (see dotted vertical black lines in Fig. 13). These points are
Earth Syst. Sci. Data Discuss., https://doi.org/10.5194/essd-2019-27
Ope
n A
cces
s Earth System
Science
DataD
iscussio
ns
Manuscript under review for journal Earth Syst. Sci. DataDiscussion started: 18 February 2019c© Author(s) 2019. CC BY 4.0 License.
22
highlighted here for information, but retained in the database, as these were mostly from NOMAD and there was an interest
to preserve this data set as a whole. Also, not discarding these data allows further manipulation with different quality control
criteria. On the annual scale, the observations of the inherent optical properties are strongly underrepresented in the Southern
Hemisphere where there is a complete absence of data in several months of the year (Fig. 3). Overall, the geographic
coverage for observations of “aph”, “adg” and “bbp” (Fig. 14) is poor, with most open ocean regions not being sampled, 5
except for the Atlantic Ocean. Small clusters of data are located in particular coastal regions.
Finally, for the diffuse attenuation coefficient for downward irradiance ("kd") there are 25 unique wavelengths between 405
and 709 nm. There is a total of 2,454 observations, from NOMAD (2,266), SeaBASS (118) and MERMAID (70). Data
distribution of “kd” at 44X nm and 55X nm for each data set is shown in Fig. 12 g and h. No “kd” data at these wavelengths
were available for the SeaBASS data set (only at 490 nm). Median values of “kd” at 44X nm span between 0.08 m-1 10
(NOMAD) and 0.1 m-1 (MERMAID), whereas at 55X nm the “kd” values are approximately 0.1 m-1 (NOMAD and
MERMAID). NOMAD provides the best geographical coverage (Fig. 15), with a higher coverage in the Atlantic, compared
with other oceans. With the exception of the coastal regions of North America and the Japan Sea, most coastal regions are
not sampled. In the Northern Hemisphere, “kd” is distributed roughly evenly across all months of the year, but in the
Southern Hemisphere there are few data points during the austral winter and none at all in September (Fig. 3). For total 15
suspended matter (“tsm”) there is a total of 1546 observations divided between COASTCOLOUR (1199) and MERMAID
(347). The observations of “tsm” are available in a greater number in the Northern Hemisphere (Fig. 3) and are distributed
across several coastal regions around Europe, Mediterranean Sea, China Sea, Indonesia and Australia (Fig 15).
Although most of the stations with concurrent variables are from the NOMAD data set, for completeness, an examination of
bio-optical relationships is provided (Fig. 16). The relation between “aph” at 443 nm and chlorophyll-a (Fig. 16 a) agrees 20
with Bricaud et al. (2004). A total of 2,953 points exists with these two variables available (34 % from NOMAD, 32 % from
TPSS, 11 % from AWI, 11% from COASTCOLOUR and remaining 12 % from MERMAID and SeaBASS). The relation
between the sum of “aph” and “adg” at 443 nm and “rrs” at 443 nm (Fig. 16 b), shows a similar dispersion, with the
exception of some scattered points, to an equivalent analysis on the IOCCG report 5 (see their Fig. 2.3). Again, the scattered
data were retained in the final table to preserve the NOMAD data set. A total of 1112 points exists for which these three 25
variables are available (97 % from NOMAD). The relation between the ratio rrs(490)/rrs(555) and kd(490) (Fig. 16 c) shows
a good agreement with the NASA KD2S standard algorithm (http://oceancolor.gsfc.nasa.gov/cms/atbd/kd_490). A total of
2,280 points exist for which these three variables are available (93 % from NOMAD). The relation between the ratio
rrs(490)/rrs(555) and “bbp” at 555 nm (Fig. 16 c) shows a good agreement with the relation suggested by Tiwari and
Shanmugam (2013). A total of 365 points exist for which these three variables are available (89 % from NOMAD). 30
Earth Syst. Sci. Data Discuss., https://doi.org/10.5194/essd-2019-27
Ope
n A
cces
s Earth System
Science
DataD
iscussio
ns
Manuscript under review for journal Earth Syst. Sci. DataDiscussion started: 18 February 2019c© Author(s) 2019. CC BY 4.0 License.
23
4 Conclusions
In this work, a compilation of bio-optical in situ data is presented, resulting from the acquisition, homogenization and
integration of several sets of data obtained from different sources. The compiled data have a global coverage and span the
period from 1997 to 2018. Minimal changes were made on the original data, other than the ones occurring from conversion
to standard format and quality control. In situ measurements of the following variables were compiled: remote-sensing 5
reflectance, chlorophyll-a concentration, algal pigment absorption coefficient, detrital and coloured dissolved organic matter
absorption coefficient, particle backscattering coefficient, diffuse attenuation coefficient for downward irradiance and total
suspended matter.
The final set of data consists of a substantial number of in situ observations, available in a simple text table, and processed in
a way that could be used directly for the evaluation of satellite-derived ocean-colour data. The major advantages of this 10
compilation are that it merges six commonly-used data sources in ocean-colour validation (MOBY, BOUSSOLE,
AERONET-OC, SeaBASS, NOMAD, MERMAID), four data sources developed for ocean-colour applications (AWI,
COASTCOLOUR, TPSS and TARA) and 17 additional sets of chlorophyll-a concentration data (AMT, ICES,
HOT,GeP&CO, ARCSSPP, BARENTSSEA, BATS, BIOCHEM, BODC, CALCOFI, CCELTER, CIMT, ESTOC, IMOS,
MAREDAT, PALMER, SEADATANET) into a simple text table free of duplicated observations. This compilation was 15
initially created with the intention of evaluating the quality of the satellite ocean-colour products from the ESA OC-CCI
project, but it can also be used for other purposes, including the validation of retrievals from recent space-borne sensors such
as Landsat 8 and Sentinel-2,3. It may also be useful in the preparation of future sensors like NASA PACE. The objective of
publishing the compilation is to make it easily accessible by the broader community.
Author contribution 20
The first six authors belong to the ESA OC-CCI team and contributed to the design of the compilation. The remaining
authors are listed alphabetically and are data contributors (see their respective data set on Table 2) or individuals responsible
for the development of a particular data set (e.g. Jeremy Werdell for NOMAD and Kathryn Barker for MERMAID). All data
contributors (listed in Table 2) were contacted for authorization of data publishing and offered co-authorship. In the case of
the ICES data set the permission for publishing was given by the ICES team. All the authors have critically reviewed the 25
manuscript.
Earth Syst. Sci. Data Discuss., https://doi.org/10.5194/essd-2019-27
Ope
n A
cces
s Earth System
Science
DataD
iscussio
ns
Manuscript under review for journal Earth Syst. Sci. DataDiscussion started: 18 February 2019c© Author(s) 2019. CC BY 4.0 License.
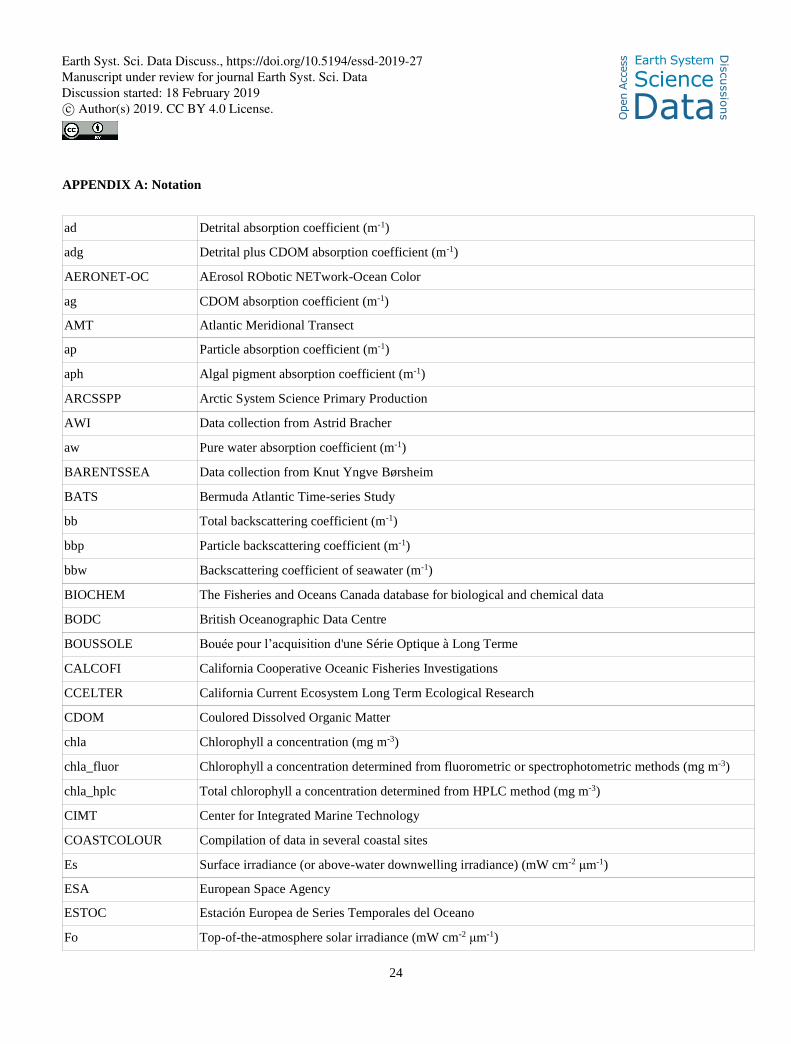
24
APPENDIX A: Notation
ad Detrital absorption coefficient (m-1)
adg Detrital plus CDOM absorption coefficient (m-1)
AERONET-OC AErosol RObotic NETwork-Ocean Color
ag CDOM absorption coefficient (m-1)
AMT Atlantic Meridional Transect
ap Particle absorption coefficient (m-1)
aph Algal pigment absorption coefficient (m-1)
ARCSSPP Arctic System Science Primary Production
AWI Data collection from Astrid Bracher
aw Pure water absorption coefficient (m-1)
BARENTSSEA Data collection from Knut Yngve Børsheim
BATS Bermuda Atlantic Time-series Study
bb Total backscattering coefficient (m-1)
bbp Particle backscattering coefficient (m-1)
bbw Backscattering coefficient of seawater (m-1)
BIOCHEM The Fisheries and Oceans Canada database for biological and chemical data
BODC British Oceanographic Data Centre
BOUSSOLE Bouée pour l’acquisition d'une Série Optique à Long Terme
CALCOFI California Cooperative Oceanic Fisheries Investigations
CCELTER California Current Ecosystem Long Term Ecological Research
CDOM Coulored Dissolved Organic Matter
chla Chlorophyll a concentration (mg m-3)
chla_fluor Chlorophyll a concentration determined from fluorometric or spectrophotometric methods (mg m-3)
chla_hplc Total chlorophyll a concentration determined from HPLC method (mg m-3)
CIMT Center for Integrated Marine Technology
COASTCOLOUR Compilation of data in several coastal sites
Es Surface irradiance (or above-water downwelling irradiance) (mW cm-2 μm-1)
ESA European Space Agency
ESTOC Estación Europea de Series Temporales del Oceano
Fo Top-of-the-atmosphere solar irradiance (mW cm-2 μm-1)
Earth Syst. Sci. Data Discuss., https://doi.org/10.5194/essd-2019-27
Ope
n A
cces
s Earth System
Science
DataD
iscussio
ns
Manuscript under review for journal Earth Syst. Sci. DataDiscussion started: 18 February 2019c© Author(s) 2019. CC BY 4.0 License.
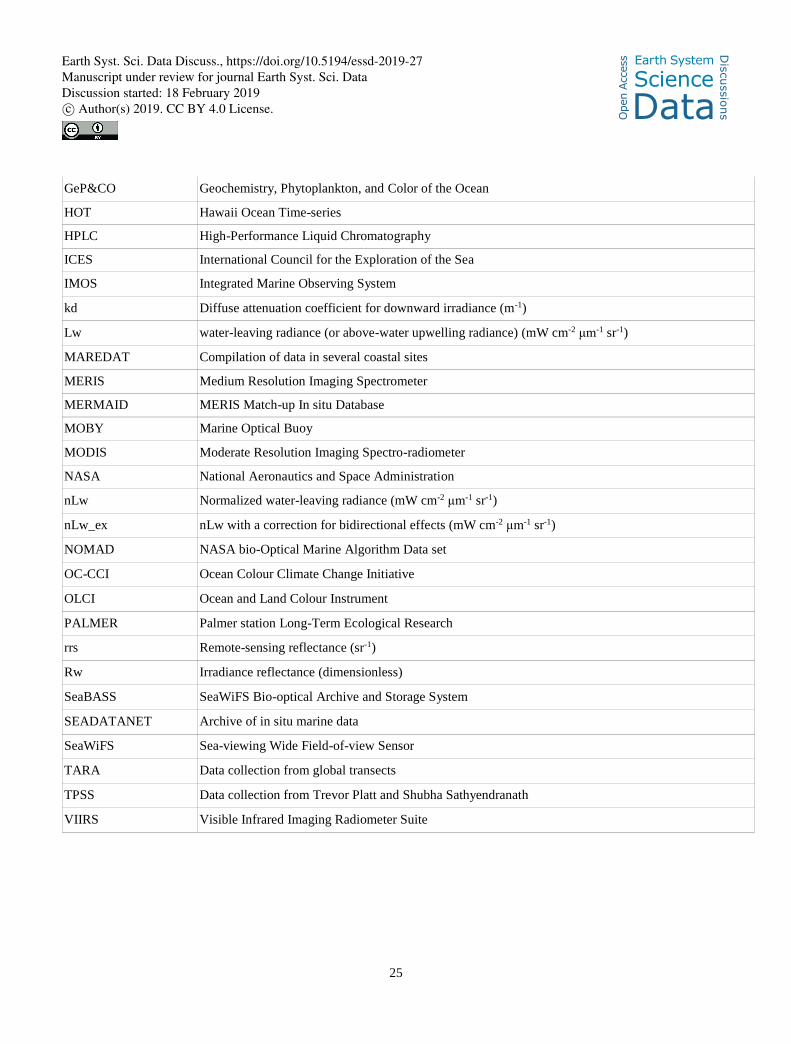
25
GeP&CO Geochemistry, Phytoplankton, and Color of the Ocean
HOT Hawaii Ocean Time-series
HPLC High-Performance Liquid Chromatography
ICES International Council for the Exploration of the Sea
IMOS Integrated Marine Observing System
kd Diffuse attenuation coefficient for downward irradiance (m-1)
Lw water-leaving radiance (or above-water upwelling radiance) (mW cm-2 μm-1 sr-1)
MAREDAT Compilation of data in several coastal sites
MERIS Medium Resolution Imaging Spectrometer
MERMAID MERIS Match-up In situ Database
MOBY Marine Optical Buoy
MODIS Moderate Resolution Imaging Spectro-radiometer
NASA National Aeronautics and Space Administration
nLw Normalized water-leaving radiance (mW cm-2 μm-1 sr-1)
nLw_ex nLw with a correction for bidirectional effects (mW cm-2 μm-1 sr-1)
NOMAD NASA bio-Optical Marine Algorithm Data set
OC-CCI Ocean Colour Climate Change Initiative
OLCI Ocean and Land Colour Instrument
PALMER Palmer station Long-Term Ecological Research
rrs Remote-sensing reflectance (sr-1)
Rw Irradiance reflectance (dimensionless)
SeaBASS SeaWiFS Bio-optical Archive and Storage System
SEADATANET Archive of in situ marine data
SeaWiFS Sea-viewing Wide Field-of-view Sensor
TARA Data collection from global transects
TPSS Data collection from Trevor Platt and Shubha Sathyendranath
VIIRS Visible Infrared Imaging Radiometer Suite
Earth Syst. Sci. Data Discuss., https://doi.org/10.5194/essd-2019-27
Ope
n A
cces
s Earth System
Science
DataD
iscussio
ns
Manuscript under review for journal Earth Syst. Sci. DataDiscussion started: 18 February 2019c© Author(s) 2019. CC BY 4.0 License.
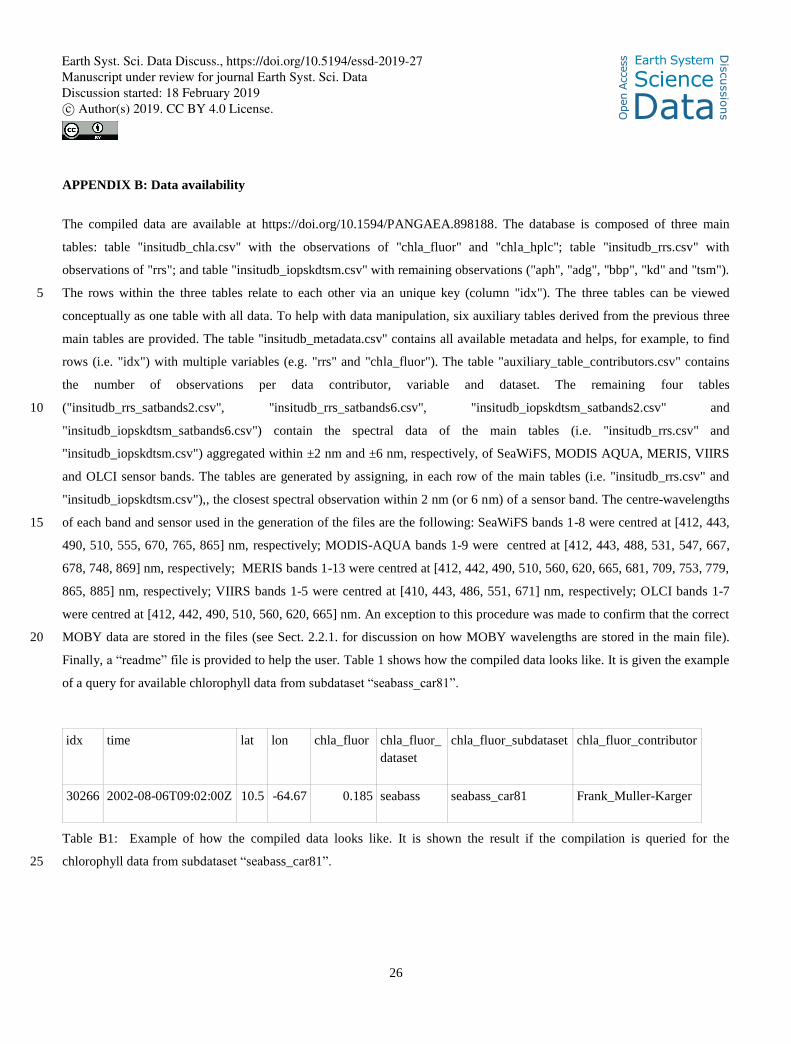
26
APPENDIX B: Data availability
The compiled data are available at https://doi.org/10.1594/PANGAEA.898188. The database is composed of three main
tables: table "insitudb_chla.csv" with the observations of "chla_fluor" and "chla_hplc"; table "insitudb_rrs.csv" with
observations of "rrs"; and table "insitudb_iopskdtsm.csv" with remaining observations ("aph", "adg", "bbp", "kd" and "tsm").
The rows within the three tables relate to each other via an unique key (column "idx"). The three tables can be viewed 5
conceptually as one table with all data. To help with data manipulation, six auxiliary tables derived from the previous three
main tables are provided. The table "insitudb_metadata.csv" contains all available metadata and helps, for example, to find
rows (i.e. "idx") with multiple variables (e.g. "rrs" and "chla_fluor"). The table "auxiliary_table_contributors.csv" contains
the number of observations per data contributor, variable and dataset. The remaining four tables
("insitudb_rrs_satbands2.csv", "insitudb_rrs_satbands6.csv", "insitudb_iopskdtsm_satbands2.csv" and 10
"insitudb_iopskdtsm_satbands6.csv") contain the spectral data of the main tables (i.e. "insitudb_rrs.csv" and
"insitudb_iopskdtsm.csv") aggregated within ±2 nm and ±6 nm, respectively, of SeaWiFS, MODIS AQUA, MERIS, VIIRS
and OLCI sensor bands. The tables are generated by assigning, in each row of the main tables (i.e. "insitudb_rrs.csv" and
"insitudb_iopskdtsm.csv"),, the closest spectral observation within 2 nm (or 6 nm) of a sensor band. The centre-wavelengths
of each band and sensor used in the generation of the files are the following: SeaWiFS bands 1-8 were centred at [412, 443, 15
490, 510, 555, 670, 765, 865] nm, respectively; MODIS-AQUA bands 1-9 were centred at [412, 443, 488, 531, 547, 667,
678, 748, 869] nm, respectively; MERIS bands 1-13 were centred at [412, 442, 490, 510, 560, 620, 665, 681, 709, 753, 779,
865, 885] nm, respectively; VIIRS bands 1-5 were centred at [410, 443, 486, 551, 671] nm, respectively; OLCI bands 1-7
were centred at [412, 442, 490, 510, 560, 620, 665] nm. An exception to this procedure was made to confirm that the correct
MOBY data are stored in the files (see Sect. 2.2.1. for discussion on how MOBY wavelengths are stored in the main file). 20
Finally, a “readme” file is provided to help the user. Table 1 shows how the compiled data looks like. It is given the example
of a query for available chlorophyll data from subdataset “seabass_car81”.
idx time lat lon chla_fluor chla_fluor_
dataset
chla_fluor_subdataset chla_fluor_contributor
30266 2002-08-06T09:02:00Z 10.5 -64.67 0.185 seabass seabass_car81 Frank_Muller-Karger
Table B1: Example of how the compiled data looks like. It is shown the result if the compilation is queried for the
chlorophyll data from subdataset “seabass_car81”. 25
Earth Syst. Sci. Data Discuss., https://doi.org/10.5194/essd-2019-27
Ope
n A
cces
s Earth System
Science
DataD
iscussio
ns
Manuscript under review for journal Earth Syst. Sci. DataDiscussion started: 18 February 2019c© Author(s) 2019. CC BY 4.0 License.
27
Acknowledgements
This paper is a contribution to the ESA OC-CCI project. This work is also a contribution to project PEst-
OE/MAR/UI0199/2014. We would like to thank the efforts of the teams responsible for collection of the data in the field and
of the teams responsible for processing and storing the data in archives, without which this work would not be possible. We
thank Tamoghna Acharyya and Robert Brewin at Plymouth Marine Laboratory for their initial contribution to this work. We 5
thank the NOAA (US) for making available the MOBY data, and Yong Sung Kim for the help in questions about MOBY
data. BOUSSOLE is supported and funded by the European Space Agency (ESA), the Centre National d'Etudes Spatiales
(CNES), the Centre National de la Recherche Scientifique (CNRS), the Institut National des Sciences de l'Univers (INSU),
the Sorbonne Université (SU), and the Institut de la Mer de Villefranche (IMEV). We thank ACRI-ST, ARGANS and ESA
for access to the MERMAID Database (http://hermes.acri.fr/mermaid). We thank Annelies Hommersom, Pierre Yves 10
Deschamps, Gavin Tilstone and David Siegel for allowing the use of MERMAID data for which they are Principal
Investigators. We thank the British Oceanographic Data Centre (BODC) for access to AMT data and in particular to Polly
Hadziabdic and Rob Thomas for their help in questions about the AMT data set. We thank Victoria Hill, Patrick Holligan,
Gerald Moore and Emilio Suarez for the use of AMT data for which they are Principal Investigators. We thank Sam Ahmed,
Hui Feng, Alex Gilerson and Brent Holben for allowing the use of the AERONET-OC data for which they are Principal 15
Investigators. We thank also the AERONET staff and site support people. The Australian Integrated Marine Observing
System (IMOS) and CSIRO are acknowledged for funding the Lucinda AERONET-OC site. We thank Bob Bidigare,
Matthew Church, Ricardo Letelier and Jasmine Nahorniak for making the HOT data available, and the National Science
Foundation for support of the HOT research (grant OCE 09-26766). We thank Yves Dandonneau for allowing the use of
GeP&CO data. We thank ICES database on the marine environment (Copenhagen, Denmark, 2014) for allowing the use of 20
their archived data, and Marilynn Sørensen for the help with questions about the ICES data set. We thank all ICES
contributors for their data. We thank Eric Zettler and SEA Education Association. The CARIACO Ocean Time-Series
program also provided significant decade-long bio-optical information used in this study. These data were obtained from
NOMAD and SeaBASS. We thank NASA, SeaBASS and the Ocean Biology Processing Group (OBPG) for access to
SeaBASS and NOMAD data. We thank NASA for project funding for data collection. We thank Chris Proctor from 25
SeaBASS for his valuable and prompt help in a variety of questions. We are deeply thankful to the data contributors of
NOMAD and SeaBASS: Kevin Arrigo, Mike Behrenfeld, Emmanuel Boss, Chris Brown, Mary Luz Canon, Douglas
Capone, Ken Carder, Alex Chekalyuk, Jay-Chung Chen, Dennis Clark, Jorge Corredor, Glenn Cota, Yves Dandonneau,
Heidi Dierssen, David Eslinger, Piotr Flatau, Alex Gilerson, Joaquim Goes, Gwo-Ching Gong, Adriana Gonzalez-Silvera,
Larry Harding, Jon Hare, Chuanmin Hu, Sung-Ho Kang, Gary Kirkpatrick, Oleg Kopelevich, Sam Laney, Pierre Larouche, 30
Zhongping Lee, Ricardo Letelier, Marlon Lewis, Steven Lohrenz, Antonio Mannino, John Marra, Chuck McClain,
Christophe Menkes, Mark Miller, Ru Morrison, James Mueller, Ruben Negri, James Nelson, Norman Nelson, Mary Jane
Perry, David Phinney, John Porter, Collin Roesler, David Siegel, Mike Sieracki, Jeffrey Smart, Raymond Smith, James
Spinhirne, Dariusz Stramski, Rick Stumpf, Ajit Subramaniam, Chuck Trees, Ronald Zaneveld, Eric Zettler and Richard
Zimmerman. For the BIOCHEM data we thank the Fisheries and Oceans Canada and the following data contributors: Diane 35
Archambault, Hughes Benoit, Esther Bonneau, Eugene Colbourne, Alain Gagne, Yves Gagnon, Tom Hurlbut, Catherine
Johnson, Pierre Joly, Maurice Levasseur, Jean-Francois Lussier, Sonia Michaud, Patrick Ouellet, Jacques Plourde, Stephane
Plourde, Luc Savoie, Michael Scarratt, Philippe Schwab, Michel Starr and François Villeneuve. We also thank Laure Devine
for the help in processing the BIOCHEM data set. We thank Ralph Goericke for allowing the use of the CalCOFI and
CCELTER data. CalCOFI research is supported by contributions from the participating agencies: The California State 40
Department of Fish and Wildlife, NOAA,National Marine Fisheries Service, Southwest Fisheries Science Center, and the
University of California, Integrative Oceanography Division at the Scripps Institution of Oceanography, UCSD. The authors
would like to thank the Oceanic Platform of the Canary Islands (PLOCAN) and its staff for making freely available the use
Earth Syst. Sci. Data Discuss., https://doi.org/10.5194/essd-2019-27
Ope
n A
cces
s Earth System
Science
DataD
iscussio
ns
Manuscript under review for journal Earth Syst. Sci. DataDiscussion started: 18 February 2019c© Author(s) 2019. CC BY 4.0 License.
28
of this ESTOC data set. We thank the following MAREDAT data providers: Robert Bidigare, Denise Cummings, Giacomo
DiTullio, Chris Gallienne, Ralf Goericke, Patrick Holligan, David Karl, Michael Landry, Michael Lomas, Michael Lucas,
Jean-Claude Marty, Walker Smith, Rick Stumpf, Emilio Suarez, Koji Suzuki, Maria Vernet and Simon Wright. We thank
Oscar Schofield, Raymond Smith and Maria Vernet for allowing the use of the PALMER data. Data from the Palmer LTER
data repository were supported by Office of Polar Programs, NSF Grants OPP-9011927, OPP-9632763 and OPP-0217282. 5
We thank the SeaDataNet Pan-European infrastructure for ocean and marine data management (http://www.seadatanet.org).
We thank Emmanuel Boss for the TARA data. Funding for the collection and processing of the TARA data set was provided
by NASA Ocean Biology and Biogeochemistry program under grants NNX11AQ14G, NNX09AU43G, NNX13AE58G and
NNX15AC08G to the University of Maine. We would like to honour the memory of Marcel Wernand and Tiffany Moisan,
authors who contributed to the first version. 10
References
Amante, C. and Eakins, B.W.: ETOPO1, 1 Arc-Minute Global Relief Model: Procedures, Data Sources and Analysis.
NOAA Technical Memorandum NESDIS NGDC-24. National Geophysical Data Center, NOAA, 2009.
Antoine, D., André, J. M. and Morel, A.: Oceanic primary production: 2. Estimation at global scale from satellite (CZCS)
chlorophyll. Global Biogeochemical Cycles, 10, 57 – 70, 1996. 15
Antoine, D., Chami, M., Claustre, H., D'Ortenzio, F., Morel, A., Bécu, G. , Gentili, B., Louis, F., Ras, J., Roussier, E., Scott,
A.J. , Tailliez, D., Hooker, S. B.,Guevel, P., Desté, J.-F., Dempsey, C. and Adams, D.: BOUSSOLE : a joint CNRS-INSU,
ESA, CNES and NASA Ocean Color Calibration And Validation Activity. NASA Technical memorandum N° 2006 -
214147, 61 pp, 2006.
Antoine, D., Guevel, P., Desté, J.-F., Bécu, G., Louis, F., Scott, A. and Bardey, P.: The “BOUSSOLE” Buoy—A New 20
Transparent-to-Swell Taut Mooring Dedicated to Marine Optics: Design, Tests, and Performance at Sea. J. Atmos. Oceanic
Technol., 25, 968–989, 2008.
Bailey, S.W. and Werdell, P.J.: A multi-sensor approach for the on-orbit validation of ocean color satellite data products.
Rem. Sens. Environ., 102, 12-23, 2006.
Barker, K.: In-situ Measurement Protocols. Part A: Apparent Optical Properties, Issue 2.0, Doc. no: CO-SCI-ARG-TN-0008, 25
ARGANS Ltd., p. 126, 2013a.
Barker, K.: In-situ Measurement Protocols. Part B: Inherent Optical Properties and in-water constituents, Issue 1.0, Doc. no:
CO-SCI-ARG-TN-0008, ARGANS Ltd., p. 39, 2013b.
Bricaud, A., Claustre, H., Ras, J., and Oubelkheir, K.: Natural variability of phytoplanktonic absorption in oceanic waters:
Influence of the size sctructure of algal populations. J. Geophys. Res., 109, C11010, doi:10.1029/2004JC002419, 2004. 30
Clark, D. K., Yarborough, M. A., Feinholz, M. E., Flora, S., Broenkow, W., Kim, Y. S., Johnson, B. C., Brown, S. W.,
Earth Syst. Sci. Data Discuss., https://doi.org/10.5194/essd-2019-27
Ope
n A
cces
s Earth System
Science
DataD
iscussio
ns
Manuscript under review for journal Earth Syst. Sci. DataDiscussion started: 18 February 2019c© Author(s) 2019. CC BY 4.0 License.
29
Yuen, M. and Mueller, J. L.: MOBY, A Radiometric Buoy for Performance Monitoring and Vicarious Calibration of
Satellite Ocean Colour Sensors: Measurements and Data Analysis Protocols. In Ocean Optics Protocols for Satellite Ocean
Colour Sensor Validation, NASA Technical Memo. 2003-211621/Rev4, Vol VI, 3-34 (Eds J. L. Muller, G. Fargion and C.
McClain). Greenbelt, MD.: NASA/GSFC, 2003.
Dandonneau, Y. and Niang, A.: Assemblages of phytoplankton pigments along a shipping line through the North Atlantic 5
and Tropical Pacific. Prog. Oceanogr., 73, 2007.
Devine, L., Kennedy, M.K., St-Pierre, I., Lafleur, C. , Ouellet, M. and Bond, S.: BioChem: the Fisheries and Oceans Canada
database for biological and chemical data. Can. Tech. Rep. Fish. Aquat. Sci., 3073: iv + 40 pp, http://waves-vagues.dfo-
mpo.gc.ca/Library/351319.pdf, 2014.
DFO.: BioChem: database of biological and chemical oceanographic data. Department of Fisheries and Oceans, Canada. 10
http://www.dfo-mpo.gc.ca/science/data-donnees/biochem/index-eng.html. Database accessed on April 2015, 2018
Gordon, H. R. and Clark, D.K.: Clear water radiances for atmospheric correction of coastal zone color scanner imagery,
Applied Optics, 20, 4175-4180, 1981.
Gregg, W.W. and Carder, K. L.: A simple spectral solar irradiance model for cloudless maritime atmospheres, Limnol.
Oceanogr., 35, 1657-1675, 1990. 15
IOCCG report 5: "Remote Sensing of Inherent Optical Properties: Fundamentals, Tests of Algorithms, and Applications," in
Reports of the International Ocean-Colour Coordinating Group, No. 5. vol. 5, Z.-P. Lee, Ed., Dartmouth, Canada: IOCCG,
2006, p. 126, 2006.
IOCCG: Why Ocean Colour? The Societal Benefits of Ocean-Colour Technology. Platt, T., Hoepffner, N., Stuart, V. and
Brown, C. (eds.), Reports of the International Ocean-Colour Coordinating Group, No. 7, IOCCG, Dartmouth, Canada, 2008. 20
Karl, D.M. and Michaels, A.F.: The Hawaiian Ocean Time-series (HOT) and Bermuda Atlantic Time-series Study
(BATS)—Preface . Deep-Sea Res. II, 43, 127–128, 1996.
Matrai, P. A., Olson, E., Suttles, S., Hill, V. J., Codispoti, L. A., Light, B. and Steele, M.: Synthesis of primary production in
the Arctic Ocean: I. Surface waters, 1954-2007. Prog. Oceanogr., 110, 93-106, doi:10.1016/j.pocean.2012.11.004, 2013
Morel, A. and Gentilli, B.: Diffuse Reflectance of Oceanic Waters. 3. Implications of Bidirectionality for the Remote-25
Sensing Problem. Applied Optics, 35, 4850-4862, 1996.
Morel, A., Antoine, D. and Gentilli, B.: Bidirectional reflectance of oceanic waters: accounting for Raman emission and
varying particle scattering phase function. Applied Optics, 41(30), 6289-6306, 2002.
Morel, A. and Maritorena, S.: Bio-optical properties of oceanic waters: A reappraisal. Journal of Geophysical Research, 106,
7163 – 7180, 2001. 30
Earth Syst. Sci. Data Discuss., https://doi.org/10.5194/essd-2019-27
Ope
n A
cces
s Earth System
Science
DataD
iscussio
ns
Manuscript under review for journal Earth Syst. Sci. DataDiscussion started: 18 February 2019c© Author(s) 2019. CC BY 4.0 License.
30
Nechad, B., Ruddick, K., Schroeder, T., Oubelkheir, K., Blondeau-Patissier, D., Cherukuru, N., Brando, V., Dekker, A.,
Clementson, L., Banks, A. C., Maritorena, S., Werdell, J., Sá, C., Brotas, V., Caballero de Frutos, I., Ahn, Y.-H., Salama, S.,
Tilstone, G., Martinez-Vicente, V., Foley, D., McKibben, M., Nahorniak, J., Peterson, T., Siliò-Calzada, A., Röttgers, R.,
Lee, Z., Peters, M., and Brockmann, C.: CoastColour Round Robin datasets: a database to evaluate the performance of
algorithms for the retrieval of water quality parameters in coastal waters. Earth Syst. Sci. Data Discuss., 8, 173-258, 5
doi:10.5194/essdd-8-173-2015, 2015.
Neuer, S., Cianca, A., Helmke, P., Freudenthal, T., Davenport, R., Meggers, H., Knoll, M., Santana-Casiano, J.M.,
González-Davila, M., Rueda, M.-J. and Llinás, O.: Biogeochemistry and hydrography in the eastern subtropical North
Atlantic gyre. Results from the European time-series station ESTOC. Progress in Oceanography, 72, 1–29,
doi:10.1016/j.pocean.2006.08.001, 2007. 10
Peloquin, J., Swan, C., Gruber, N., Vogt, M., Claustre, H., Ras, J., Uitz, J., Barlow, R., Behrenfeld, M., Bidigare, R.,
Dierssen, H., Ditullio, G., Fernandez, E., Gallienne, C., Gibb, S., Goericke, R., Harding, L., Head, E., Holligan, P., Hooker,
S., Karl, D., Landry, M., Letelier, R., Llewellyn, C. A., Lomas, M., Lucas, M., Mannino, A., Marty, J.-C., Mitchell, B. G.,
Muller-Karger, F., Nelson, N., O'Brien, C., Prezelin, B., Repeta, D., Jr. Smith, W. O., Smythe-Wright, D., Stumpf, R.,
Subramaniam, A., Suzuki, K., Trees, C., Vernet, M., Wasmund, N., and Wright, S.: The MAREDAT global database of high 15
performance liquid chromatography marine pigment measurements, Earth Syst. Sci. Data, 5, 109-123,
https://doi.org/10.5194/essd-5-109-2013, 2013.
Philipson, P., Kratzer, S., Ben Mustapha, S., Strömbeck, N. and Stelzer, K.: Satellite-based water quality monitoring in Lake
Vänern, Sweden. International Journal of Remote Sensing, 37:16, 3938-3960, doi:10.1080/01431161.2016.1204480, 2016.
Pope, R., and Fry, E.: Absorption spectrum (380 - 700nm) of pure waters: II. Integrating cavity measurements, Appl. Opt. 20
36, 8710-8723, 1997.
Robinson, C., Poulton, A. J., Holligan, P. M., Baker, A. R., Forster, G., Gist, N., Jickells, T. D., Malin G., Upstill-Goddard,
R., Williams, R. G., Woodward, E. M. S. and Zubkov, M. V.: The Atlantic Meridional Transect (AMT) Programme: a
contextual view 1995-2005. Deep-Sea Research II, 53, 1485-1515, doi: 10.1016/j.dsr2.2006.05.015, 2006.
Sathyendranath, S., Stuart, V., Nair, A., Oka, K., Nakane, T., Bouman, H., Forget, M.-H., Maass, H. and Platt, T.: Carbon-25
to-chlorophyll ratio and growth rate of phytoplankton in the sea. Mar. Ecol. Prog. Ser., 383: 73–84, doi: 10.3354/meps07998,
2009.
Taylor, B. B., Torrecilla, E., Bernhardt, A., Taylor, M. H., Peeken, I., Röttgers, R., Piera, J., and Bracher, A.: Bio-optical
provinces in the eastern Atlantic Ocean and their biogeographical relevance. Biogeosciences, 8, 3609-3629,
https://doi.org/10.5194/bg-8-3609-2011, 2011. 30
Thuillier, G., Hersé, M., Labs, D., Foujols, T., Peetermans, W., Gillotay, D., Simon, P. C. and Mandel, H.: The solar spectral
Earth Syst. Sci. Data Discuss., https://doi.org/10.5194/essd-2019-27
Ope
n A
cces
s Earth System
Science
DataD
iscussio
ns
Manuscript under review for journal Earth Syst. Sci. DataDiscussion started: 18 February 2019c© Author(s) 2019. CC BY 4.0 License.
31
irradiance from 200 nnm to 2400 nm as measured by the SOLSPEC spectrometer from the ATLAS 1-2-3 and EURECA
missions. Solar Physics, 214:1–22, 2003.
Tiwari, S. P., and Shanmugam, P.: An optical model for deriving the spectral particulate backscattering coefficients in
oceanic waters. Ocean Science, 9 (6), 987-1001, 2013.
Trees, C. C., Kennicutt II, M. C. and Brooks, J. M.: Errors associated with the standard fluorimetric determination of 5
chlorophylls and phaeopigments. Marine Chemistry, 17: 1-12, 1985.
Valente, A., Sathyendranath, S., Brotas, V., Groom, S., Grant, M., Taberner, M., Antoine, D., Arnone, R., Balch, W. M.,
Barker, K., Barlow, R. G., Bélanger, S., Berthon, J.-F., Besiktepe, S., Brando, V., Canuti, E., Chavez, F., Claustre, H., Crout,
R., Frouin, R., García-Soto, C., Gibb, S. W., Gould, R., Hooker, S. B., Kahru, M., Klein, H., Kratzer, S., Loisel, H., McKee,
D., Mitchell, B. G., Moisan, T., Muller-Karger, F., O'Dowd, L., Ondrusek, M., Poulton, A. J., Repecaud, M., Smyth, T.; 10
Sosik, H. M., Twardowski, M., Voss, K., Werdell, J., Wernand, M. and Zibordi, G.: A compilation of global bio-optical in
situ data for ocean-colour satellite applications, PANGAEA, https://doi.org/10.1594/PANGAEA.854832, 2015.
Valente, A., Sathyendranath, S., Brotas, V., Groom, S., Grant, M., Taberner, M., Antoine, D., Arnone, R., Balch, W. M.,
Barker, K., Barlow, R. G., Bélanger, S., Berthon, J.-F., Besiktepe, S., Borsheim, Y., Bracher, A., Brando, V., Canuti, E.,
Chavez, F., Cianca, A., Claustre, H., Clementson, L., Crout, R., Frouin, R., García-Soto, C., Gibb, S. W., Gould, R., Hooker, 15
S. B., Kahru, M., Kampel, M., Klein, H., Kratzer, S., Kudela, R., Ledesma, J., Loisel, H., Matrai, P., McKee, D., Mitchell, B.
G., Moisan, T., Muller-Karger, F., O'Dowd, L., Ondrusek, M., Platt, T., Poulton, A., Repecaud, M., Schroeder, T., Smyth,
T., Smythe-Wright, D., Sosik, H. M., Twardowski, M., Vellucci, V., Voss, K., Werdell, J., Wernand, M., Wright, S. and
Zibordi, G.: A compilation of global bio-optical in situ data for ocean-colour satellite applications - version two.
PANGAEA, https://doi.org/10.1594/PANGAEA.898188, 2019 20
Werdell, P.J., Bailey, S., Fargion, G., Pietras, C., Knobelspiesse, K., Feldman, G. and McClain, C.: Unique data repository
facilitates ocean color satellite validation. EOS Transactions AGU, 84(38), 379, 2003.
Werdell, P.J. and Bailey, S. W.: An improved bio-optical data set for ocean color algorithm development and satellite data
product validation. Remote Sensing of Environment, 98(1), 122-140, 2005.
Zibordi, G., Holben, B.N., Hooker, S.B., Mélin, F., Berthon, J.-F., Slutsker, I., Giles, D., Vandemark, D., Feng, H., Rutledge, 25
K., Schuster, G. and Al Mandoos, A.: A network for standardized ocean color validation measurements. EOS Trans. Am.
Geophys. Union, 87, 30, 293, 297, 2006.
Zibordi, G., Holben, B.N., Slutsker, I., Giles, D., D'Alimonte, D., Mélin, F., Berthon, J.-F., Vandemark, D., Feng, H.,
Schuster, G., Fabbri, B.E., Kaitala, S. and Seppälä, J.: AERONET-OC: A network for the validation of ocean color primary
radiometric products. J. Atmos. Ocean. Tech., 26, 1634-1651, 2009. 30
Zhang, X., Hu, L. and He, M.-X.: Scattering by pure seawater: Effect of Salinity. Optics Express, 17, 5698-5710, 2009.
Earth Syst. Sci. Data Discuss., https://doi.org/10.5194/essd-2019-27
Ope
n A
cces
s Earth System
Science
DataD
iscussio
ns
Manuscript under review for journal Earth Syst. Sci. DataDiscussion started: 18 February 2019c© Author(s) 2019. CC BY 4.0 License.
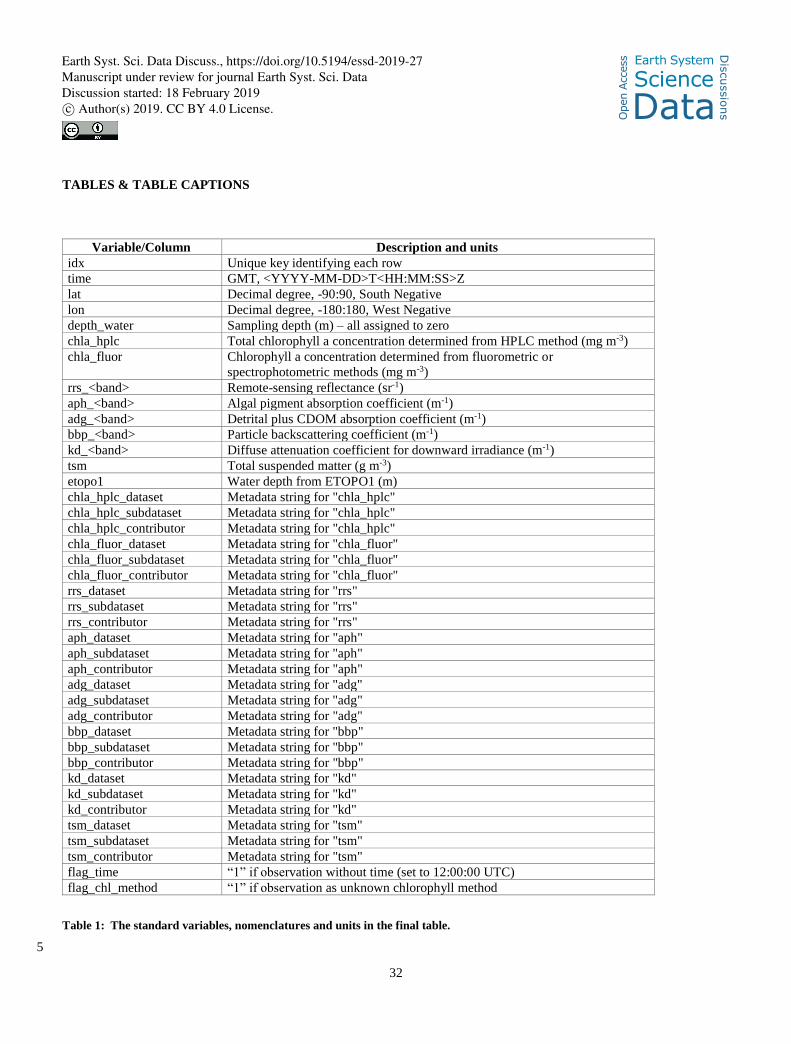
32
TABLES & TABLE CAPTIONS
Variable/Column Description and units
idx Unique key identifying each row
time GMT, <YYYY-MM-DD>T<HH:MM:SS>Z
lat Decimal degree, -90:90, South Negative
lon Decimal degree, -180:180, West Negative
depth_water Sampling depth (m) – all assigned to zero
chla_hplc Total chlorophyll a concentration determined from HPLC method (mg m-3)
chla_fluor Chlorophyll a concentration determined from fluorometric or
spectrophotometric methods (mg m-3)
rrs_<band> Remote-sensing reflectance (sr-1)
aph_<band> Algal pigment absorption coefficient (m-1)
adg_<band> Detrital plus CDOM absorption coefficient (m-1)
bbp_<band> Particle backscattering coefficient (m-1)
kd_<band> Diffuse attenuation coefficient for downward irradiance (m-1)
tsm Total suspended matter (g m-3)
etopo1 Water depth from ETOPO1 (m)
chla_hplc_dataset Metadata string for "chla_hplc"
chla_hplc_subdataset Metadata string for "chla_hplc"
chla_hplc_contributor Metadata string for "chla_hplc"
chla_fluor_dataset Metadata string for "chla_fluor"
chla_fluor_subdataset Metadata string for "chla_fluor"
chla_fluor_contributor Metadata string for "chla_fluor"
rrs_dataset Metadata string for "rrs"
rrs_subdataset Metadata string for "rrs"
rrs_contributor Metadata string for "rrs"
aph_dataset Metadata string for "aph"
aph_subdataset Metadata string for "aph"
aph_contributor Metadata string for "aph"
adg_dataset Metadata string for "adg"
adg_subdataset Metadata string for "adg"
adg_contributor Metadata string for "adg"
bbp_dataset Metadata string for "bbp"
bbp_subdataset Metadata string for "bbp"
bbp_contributor Metadata string for "bbp"
kd_dataset Metadata string for "kd"
kd_subdataset Metadata string for "kd"
kd_contributor Metadata string for "kd"
tsm_dataset Metadata string for "tsm"
tsm_subdataset Metadata string for "tsm"
tsm_contributor Metadata string for "tsm"
flag_time “1” if observation without time (set to 12:00:00 UTC)
flag_chl_method “1” if observation as unknown chlorophyll method
Table 1: The standard variables, nomenclatures and units in the final table.
5
Earth Syst. Sci. Data Discuss., https://doi.org/10.5194/essd-2019-27
Ope
n A
cces
s Earth System
Science
DataD
iscussio
ns
Manuscript under review for journal Earth Syst. Sci. DataDiscussion started: 18 February 2019c© Author(s) 2019. CC BY 4.0 License.
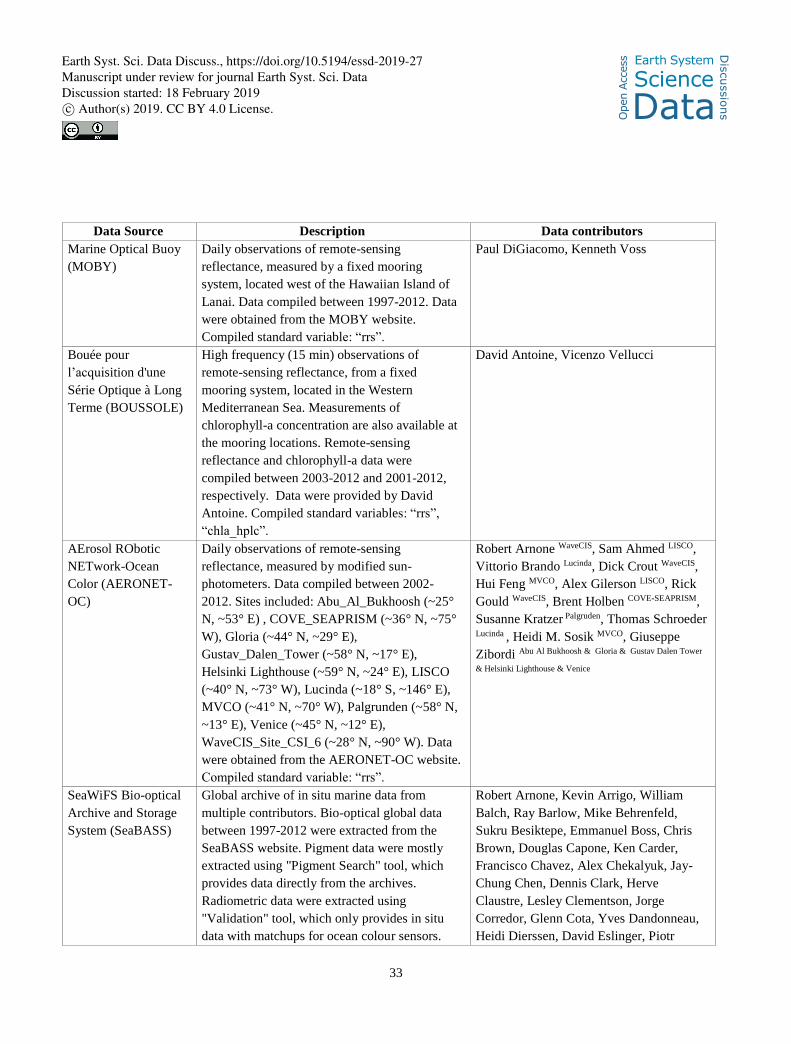
33
Data Source Description Data contributors
Marine Optical Buoy
(MOBY)
Daily observations of remote-sensing
reflectance, measured by a fixed mooring
system, located west of the Hawaiian Island of
Lanai. Data compiled between 1997-2012. Data
were obtained from the MOBY website.
Compiled standard variable: “rrs”.
Paul DiGiacomo, Kenneth Voss
Bouée pour
l’acquisition d'une
Série Optique à Long
Terme (BOUSSOLE)
High frequency (15 min) observations of
remote-sensing reflectance, from a fixed
mooring system, located in the Western
Mediterranean Sea. Measurements of
chlorophyll-a concentration are also available at
the mooring locations. Remote-sensing
reflectance and chlorophyll-a data were
compiled between 2003-2012 and 2001-2012,
respectively. Data were provided by David
Antoine. Compiled standard variables: “rrs”,
“chla_hplc”.
David Antoine, Vicenzo Vellucci
AErosol RObotic
NETwork-Ocean
Color (AERONET-
OC)
Daily observations of remote-sensing
reflectance, measured by modified sun-
photometers. Data compiled between 2002-
2012. Sites included: Abu_Al_Bukhoosh (~25°
N, ~53° E) , COVE_SEAPRISM (~36° N, ~75°
W), Gloria (~44° N, ~29° E),
Gustav_Dalen_Tower (~58° N, ~17° E),
Helsinki Lighthouse (~59° N, ~24° E), LISCO
(~40° N, ~73° W), Lucinda (~18° S, ~146° E),
MVCO (~41° N, ~70° W), Palgrunden (~58° N,
~13° E), Venice (~45° N, ~12° E),
WaveCIS_Site_CSI_6 (~28° N, ~90° W). Data
were obtained from the AERONET-OC website.
Compiled standard variable: “rrs”.
Robert Arnone WaveCIS, Sam Ahmed LISCO,
Vittorio Brando Lucinda, Dick Crout WaveCIS,
Hui Feng MVCO, Alex Gilerson LISCO, Rick
Gould WaveCIS, Brent Holben COVE-SEAPRISM,
Susanne Kratzer Palgruden, Thomas Schroeder Lucinda , Heidi M. Sosik MVCO, Giuseppe
Zibordi Abu Al Bukhoosh & Gloria & Gustav Dalen Tower
& Helsinki Lighthouse & Venice
SeaWiFS Bio-optical
Archive and Storage
System (SeaBASS)
Global archive of in situ marine data from
multiple contributors. Bio-optical global data
between 1997-2012 were extracted from the
SeaBASS website. Pigment data were mostly
extracted using "Pigment Search" tool, which
provides data directly from the archives.
Radiometric data were extracted using
"Validation" tool, which only provides in situ
data with matchups for ocean colour sensors.
Robert Arnone, Kevin Arrigo, William
Balch, Ray Barlow, Mike Behrenfeld,
Sukru Besiktepe, Emmanuel Boss, Chris
Brown, Douglas Capone, Ken Carder,
Francisco Chavez, Alex Chekalyuk, Jay-
Chung Chen, Dennis Clark, Herve
Claustre, Lesley Clementson, Jorge
Corredor, Glenn Cota, Yves Dandonneau,
Heidi Dierssen, David Eslinger, Piotr
Earth Syst. Sci. Data Discuss., https://doi.org/10.5194/essd-2019-27
Ope
n A
cces
s Earth System
Science
DataD
iscussio
ns
Manuscript under review for journal Earth Syst. Sci. DataDiscussion started: 18 February 2019c© Author(s) 2019. CC BY 4.0 License.
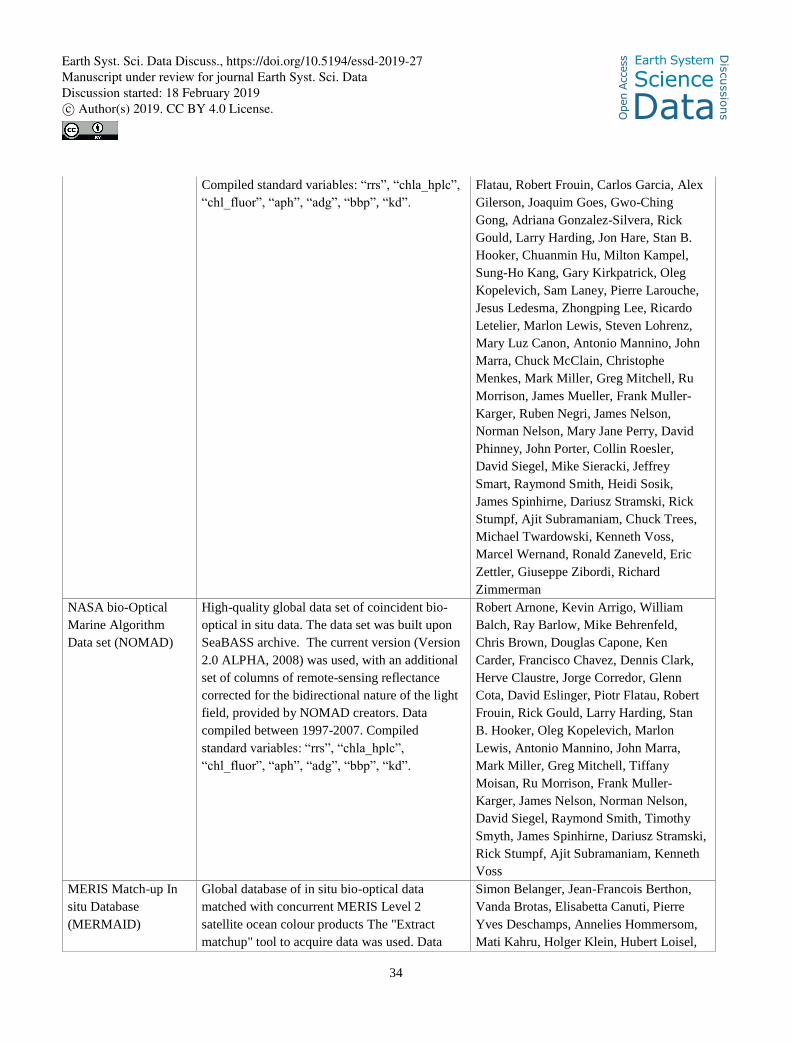
34
Compiled standard variables: “rrs”, “chla_hplc”,
“chl_fluor”, “aph”, “adg”, “bbp”, “kd”.
Flatau, Robert Frouin, Carlos Garcia, Alex
Gilerson, Joaquim Goes, Gwo-Ching
Gong, Adriana Gonzalez-Silvera, Rick
Gould, Larry Harding, Jon Hare, Stan B.
Hooker, Chuanmin Hu, Milton Kampel,
Sung-Ho Kang, Gary Kirkpatrick, Oleg
Kopelevich, Sam Laney, Pierre Larouche,
Jesus Ledesma, Zhongping Lee, Ricardo
Letelier, Marlon Lewis, Steven Lohrenz,
Mary Luz Canon, Antonio Mannino, John
Marra, Chuck McClain, Christophe
Menkes, Mark Miller, Greg Mitchell, Ru
Morrison, James Mueller, Frank Muller-
Karger, Ruben Negri, James Nelson,
Norman Nelson, Mary Jane Perry, David
Phinney, John Porter, Collin Roesler,
David Siegel, Mike Sieracki, Jeffrey
Smart, Raymond Smith, Heidi Sosik,
James Spinhirne, Dariusz Stramski, Rick
Stumpf, Ajit Subramaniam, Chuck Trees,
Michael Twardowski, Kenneth Voss,
Marcel Wernand, Ronald Zaneveld, Eric
Zettler, Giuseppe Zibordi, Richard
Zimmerman
NASA bio-Optical
Marine Algorithm
Data set (NOMAD)
High-quality global data set of coincident bio-
optical in situ data. The data set was built upon
SeaBASS archive. The current version (Version
2.0 ALPHA, 2008) was used, with an additional
set of columns of remote-sensing reflectance
corrected for the bidirectional nature of the light
field, provided by NOMAD creators. Data
compiled between 1997-2007. Compiled
standard variables: “rrs”, “chla_hplc”,
“chl_fluor”, “aph”, “adg”, “bbp”, “kd”.
Robert Arnone, Kevin Arrigo, William
Balch, Ray Barlow, Mike Behrenfeld,
Chris Brown, Douglas Capone, Ken
Carder, Francisco Chavez, Dennis Clark,
Herve Claustre, Jorge Corredor, Glenn
Cota, David Eslinger, Piotr Flatau, Robert
Frouin, Rick Gould, Larry Harding, Stan
B. Hooker, Oleg Kopelevich, Marlon
Lewis, Antonio Mannino, John Marra,
Mark Miller, Greg Mitchell, Tiffany
Moisan, Ru Morrison, Frank Muller-
Karger, James Nelson, Norman Nelson,
David Siegel, Raymond Smith, Timothy
Smyth, James Spinhirne, Dariusz Stramski,
Rick Stumpf, Ajit Subramaniam, Kenneth
Voss
MERIS Match-up In
situ Database
(MERMAID)
Global database of in situ bio-optical data
matched with concurrent MERIS Level 2
satellite ocean colour products The "Extract
matchup" tool to acquire data was used. Data
Simon Belanger, Jean-Francois Berthon,
Vanda Brotas, Elisabetta Canuti, Pierre
Yves Deschamps, Annelies Hommersom,
Mati Kahru, Holger Klein, Hubert Loisel,
Earth Syst. Sci. Data Discuss., https://doi.org/10.5194/essd-2019-27
Ope
n A
cces
s Earth System
Science
DataD
iscussio
ns
Manuscript under review for journal Earth Syst. Sci. DataDiscussion started: 18 February 2019c© Author(s) 2019. CC BY 4.0 License.
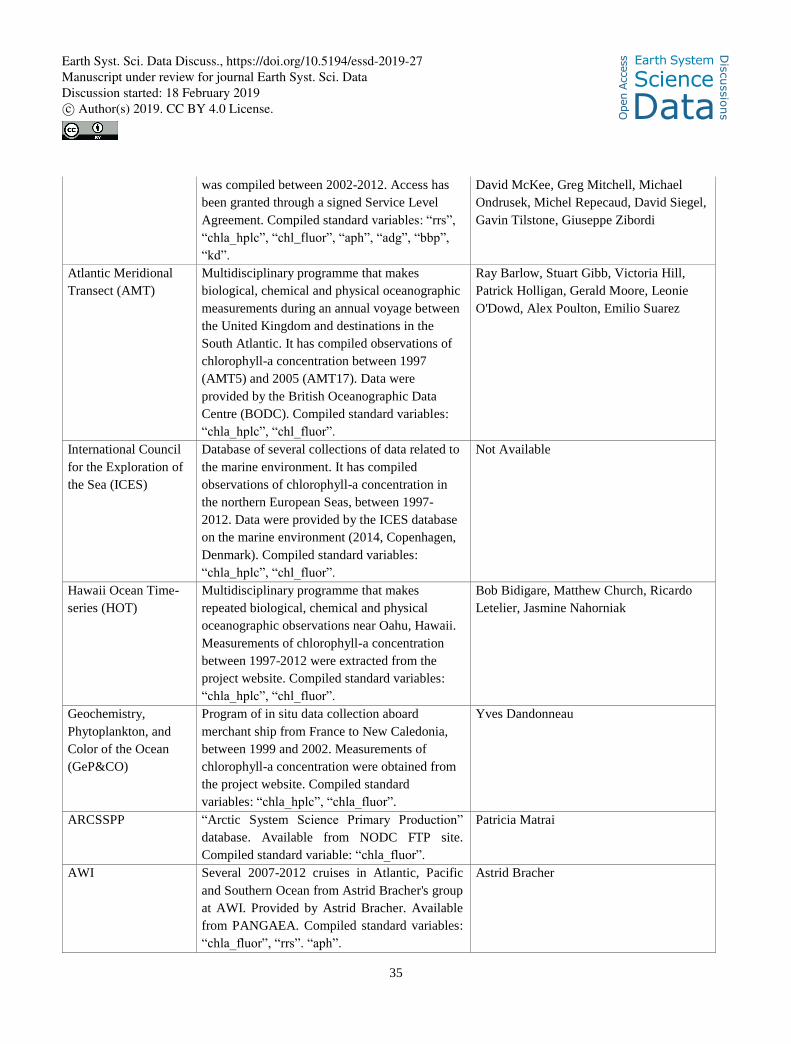
35
was compiled between 2002-2012. Access has
been granted through a signed Service Level
Agreement. Compiled standard variables: “rrs”,
“chla_hplc”, “chl_fluor”, “aph”, “adg”, “bbp”,
“kd”.
David McKee, Greg Mitchell, Michael
Ondrusek, Michel Repecaud, David Siegel,
Gavin Tilstone, Giuseppe Zibordi
Atlantic Meridional
Transect (AMT)
Multidisciplinary programme that makes
biological, chemical and physical oceanographic
measurements during an annual voyage between
the United Kingdom and destinations in the
South Atlantic. It has compiled observations of
chlorophyll-a concentration between 1997
(AMT5) and 2005 (AMT17). Data were
provided by the British Oceanographic Data
Centre (BODC). Compiled standard variables:
“chla_hplc”, “chl_fluor”.
Ray Barlow, Stuart Gibb, Victoria Hill,
Patrick Holligan, Gerald Moore, Leonie
O'Dowd, Alex Poulton, Emilio Suarez
International Council
for the Exploration of
the Sea (ICES)
Database of several collections of data related to
the marine environment. It has compiled
observations of chlorophyll-a concentration in
the northern European Seas, between 1997-
2012. Data were provided by the ICES database
on the marine environment (2014, Copenhagen,
Denmark). Compiled standard variables:
“chla_hplc”, “chl_fluor”.
Not Available
Hawaii Ocean Time-
series (HOT)
Multidisciplinary programme that makes
repeated biological, chemical and physical
oceanographic observations near Oahu, Hawaii.
Measurements of chlorophyll-a concentration
between 1997-2012 were extracted from the
project website. Compiled standard variables:
“chla_hplc”, “chl_fluor”.
Bob Bidigare, Matthew Church, Ricardo
Letelier, Jasmine Nahorniak
Geochemistry,
Phytoplankton, and
Color of the Ocean
(GeP&CO)
Program of in situ data collection aboard
merchant ship from France to New Caledonia,
between 1999 and 2002. Measurements of
chlorophyll-a concentration were obtained from
the project website. Compiled standard
variables: “chla_hplc”, “chla_fluor”.
Yves Dandonneau
ARCSSPP “Arctic System Science Primary Production”
database. Available from NODC FTP site.
Compiled standard variable: “chla_fluor”.
Patricia Matrai
AWI Several 2007-2012 cruises in Atlantic, Pacific
and Southern Ocean from Astrid Bracher's group
at AWI. Provided by Astrid Bracher. Available
from PANGAEA. Compiled standard variables:
“chla_fluor”, “rrs”. “aph”.
Astrid Bracher
Earth Syst. Sci. Data Discuss., https://doi.org/10.5194/essd-2019-27
Ope
n A
cces
s Earth System
Science
DataD
iscussio
ns
Manuscript under review for journal Earth Syst. Sci. DataDiscussion started: 18 February 2019c© Author(s) 2019. CC BY 4.0 License.
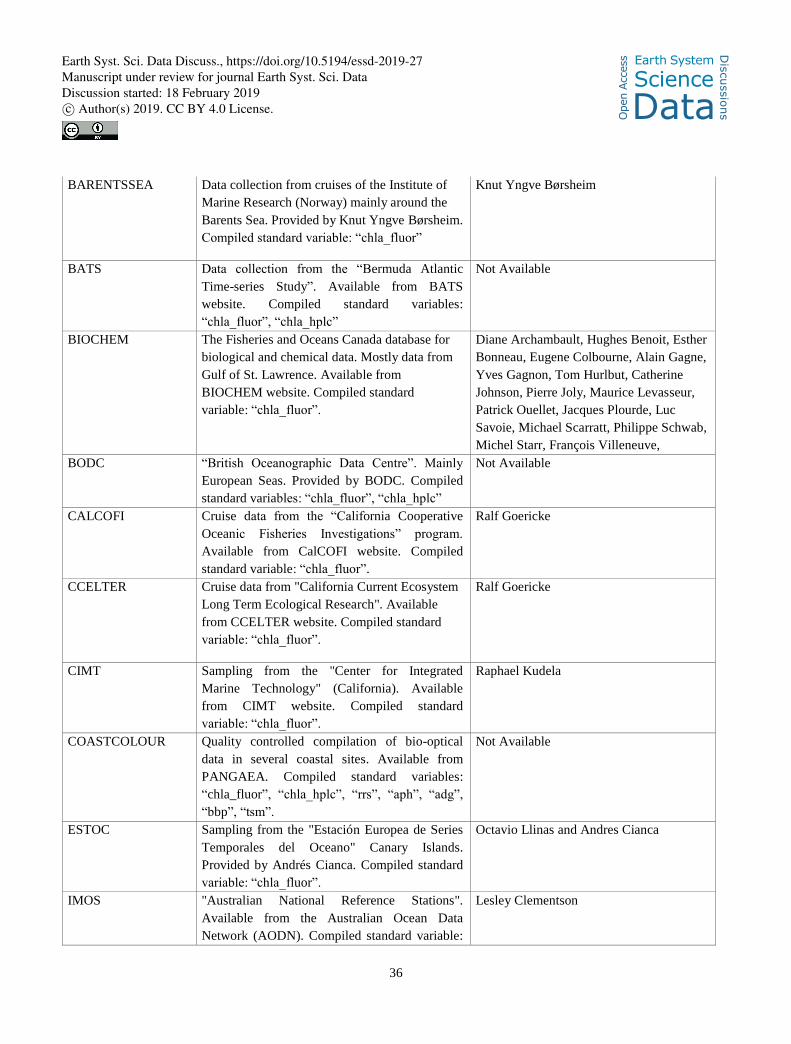
36
BARENTSSEA Data collection from cruises of the Institute of
Marine Research (Norway) mainly around the
Barents Sea. Provided by Knut Yngve Børsheim.
Compiled standard variable: “chla_fluor”
Knut Yngve Børsheim
BATS Data collection from the “Bermuda Atlantic
Time-series Study”. Available from BATS
website. Compiled standard variables:
“chla_fluor”, “chla_hplc”
Not Available
BIOCHEM The Fisheries and Oceans Canada database for
biological and chemical data. Mostly data from
Gulf of St. Lawrence. Available from
BIOCHEM website. Compiled standard
variable: “chla_fluor”.
Diane Archambault, Hughes Benoit, Esther
Bonneau, Eugene Colbourne, Alain Gagne,
Yves Gagnon, Tom Hurlbut, Catherine
Johnson, Pierre Joly, Maurice Levasseur,
Patrick Ouellet, Jacques Plourde, Luc
Savoie, Michael Scarratt, Philippe Schwab,
Michel Starr, François Villeneuve,
BODC “British Oceanographic Data Centre”. Mainly
European Seas. Provided by BODC. Compiled
standard variables: “chla_fluor”, “chla_hplc”
Not Available
CALCOFI Cruise data from the “California Cooperative
Oceanic Fisheries Investigations” program.
Available from CalCOFI website. Compiled
standard variable: “chla_fluor”.
Ralf Goericke
CCELTER Cruise data from "California Current Ecosystem
Long Term Ecological Research". Available
from CCELTER website. Compiled standard
variable: “chla_fluor”.
Ralf Goericke
CIMT Sampling from the "Center for Integrated
Marine Technology" (California). Available
from CIMT website. Compiled standard
variable: “chla_fluor”.
Raphael Kudela
COASTCOLOUR Quality controlled compilation of bio-optical
data in several coastal sites. Available from
PANGAEA. Compiled standard variables:
“chla_fluor”, “chla_hplc”, “rrs”, “aph”, “adg”,
“bbp”, “tsm”.
Not Available
ESTOC Sampling from the "Estación Europea de Series
Temporales del Oceano" Canary Islands.
Provided by Andrés Cianca. Compiled standard
variable: “chla_fluor”.
Octavio Llinas and Andres Cianca
IMOS "Australian National Reference Stations".
Available from the Australian Ocean Data
Network (AODN). Compiled standard variable:
Lesley Clementson
Earth Syst. Sci. Data Discuss., https://doi.org/10.5194/essd-2019-27
Ope
n A
cces
s Earth System
Science
DataD
iscussio
ns
Manuscript under review for journal Earth Syst. Sci. DataDiscussion started: 18 February 2019c© Author(s) 2019. CC BY 4.0 License.
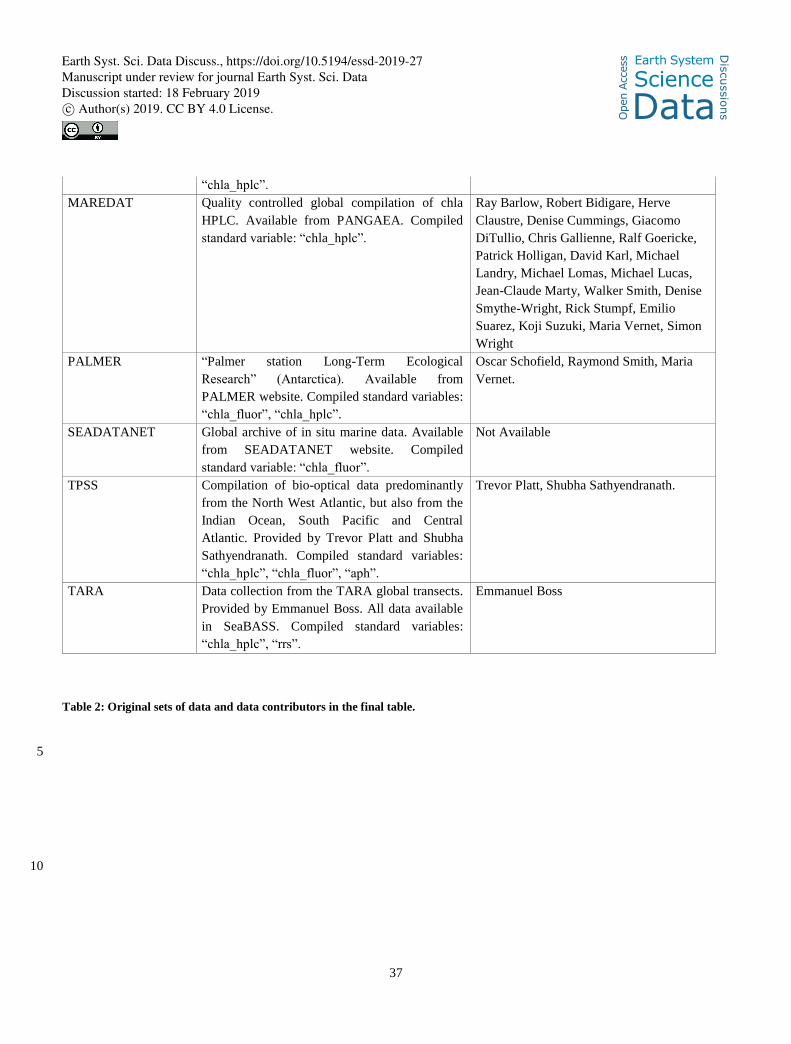
37
“chla_hplc”.
MAREDAT Quality controlled global compilation of chla
HPLC. Available from PANGAEA. Compiled
standard variable: “chla_hplc”.
Ray Barlow, Robert Bidigare, Herve
Claustre, Denise Cummings, Giacomo
DiTullio, Chris Gallienne, Ralf Goericke,
Patrick Holligan, David Karl, Michael
Landry, Michael Lomas, Michael Lucas,
Jean-Claude Marty, Walker Smith, Denise
Smythe-Wright, Rick Stumpf, Emilio
Suarez, Koji Suzuki, Maria Vernet, Simon
Wright
PALMER “Palmer station Long-Term Ecological
Research” (Antarctica). Available from
PALMER website. Compiled standard variables:
“chla_fluor”, “chla_hplc”.
Oscar Schofield, Raymond Smith, Maria
Vernet.
SEADATANET Global archive of in situ marine data. Available
from SEADATANET website. Compiled
standard variable: “chla_fluor”.
Not Available
TPSS Compilation of bio-optical data predominantly
from the North West Atlantic, but also from the
Indian Ocean, South Pacific and Central
Atlantic. Provided by Trevor Platt and Shubha
Sathyendranath. Compiled standard variables:
“chla_hplc”, “chla_fluor”, “aph”.
Trevor Platt, Shubha Sathyendranath.
TARA Data collection from the TARA global transects.
Provided by Emmanuel Boss. All data available
in SeaBASS. Compiled standard variables:
“chla_hplc”, “rrs”.
Emmanuel Boss
Table 2: Original sets of data and data contributors in the final table.
5
10
Earth Syst. Sci. Data Discuss., https://doi.org/10.5194/essd-2019-27
Ope
n A
cces
s Earth System
Science
DataD
iscussio
ns
Manuscript under review for journal Earth Syst. Sci. DataDiscussion started: 18 February 2019c© Author(s) 2019. CC BY 4.0 License.
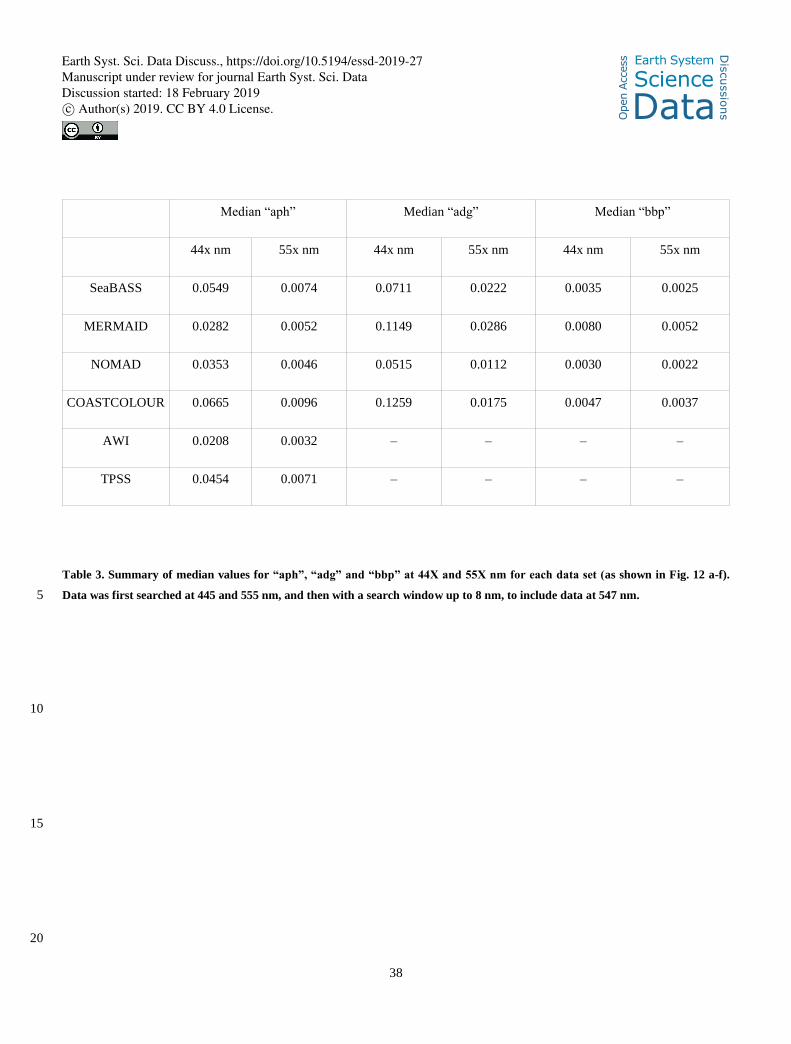
38
Median “aph” Median “adg” Median “bbp”
44x nm 55x nm 44x nm 55x nm 44x nm 55x nm
SeaBASS 0.0549 0.0074 0.0711 0.0222 0.0035 0.0025
MERMAID 0.0282 0.0052 0.1149 0.0286 0.0080 0.0052
NOMAD 0.0353 0.0046 0.0515 0.0112 0.0030 0.0022
COASTCOLOUR 0.0665 0.0096 0.1259 0.0175 0.0047 0.0037
AWI 0.0208 0.0032 – – – –
TPSS 0.0454 0.0071 – – – –
Table 3. Summary of median values for “aph”, “adg” and “bbp” at 44X and 55X nm for each data set (as shown in Fig. 12 a-f).
Data was first searched at 445 and 555 nm, and then with a search window up to 8 nm, to include data at 547 nm. 5
10
15
20
Earth Syst. Sci. Data Discuss., https://doi.org/10.5194/essd-2019-27
Ope
n A
cces
s Earth System
Science
DataD
iscussio
ns
Manuscript under review for journal Earth Syst. Sci. DataDiscussion started: 18 February 2019c© Author(s) 2019. CC BY 4.0 License.
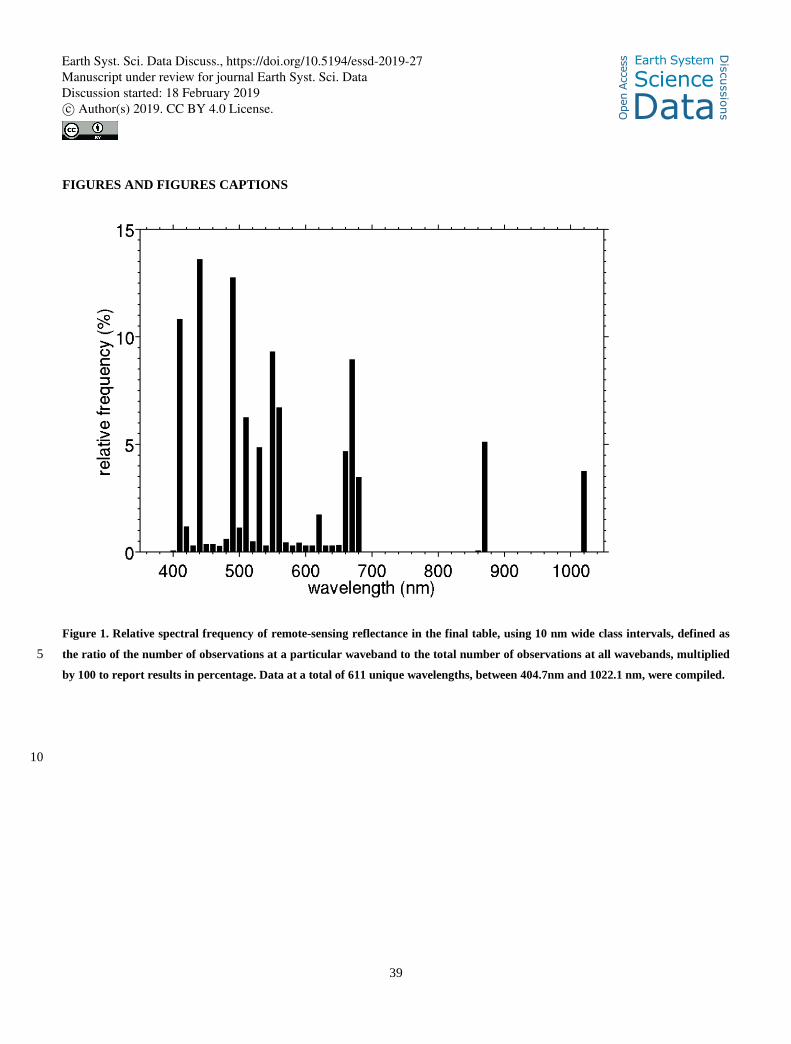
39
FIGURES AND FIGURES CAPTIONS
Figure 1. Relative spectral frequency of remote-sensing reflectance in the final table, using 10 nm wide class intervals, defined as
the ratio of the number of observations at a particular waveband to the total number of observations at all wavebands, multiplied 5
by 100 to report results in percentage. Data at a total of 611 unique wavelengths, between 404.7nm and 1022.1 nm, were compiled.
10
Earth Syst. Sci. Data Discuss., https://doi.org/10.5194/essd-2019-27
Ope
n A
cces
s Earth System
Science
DataD
iscussio
ns
Manuscript under review for journal Earth Syst. Sci. DataDiscussion started: 18 February 2019c© Author(s) 2019. CC BY 4.0 License.
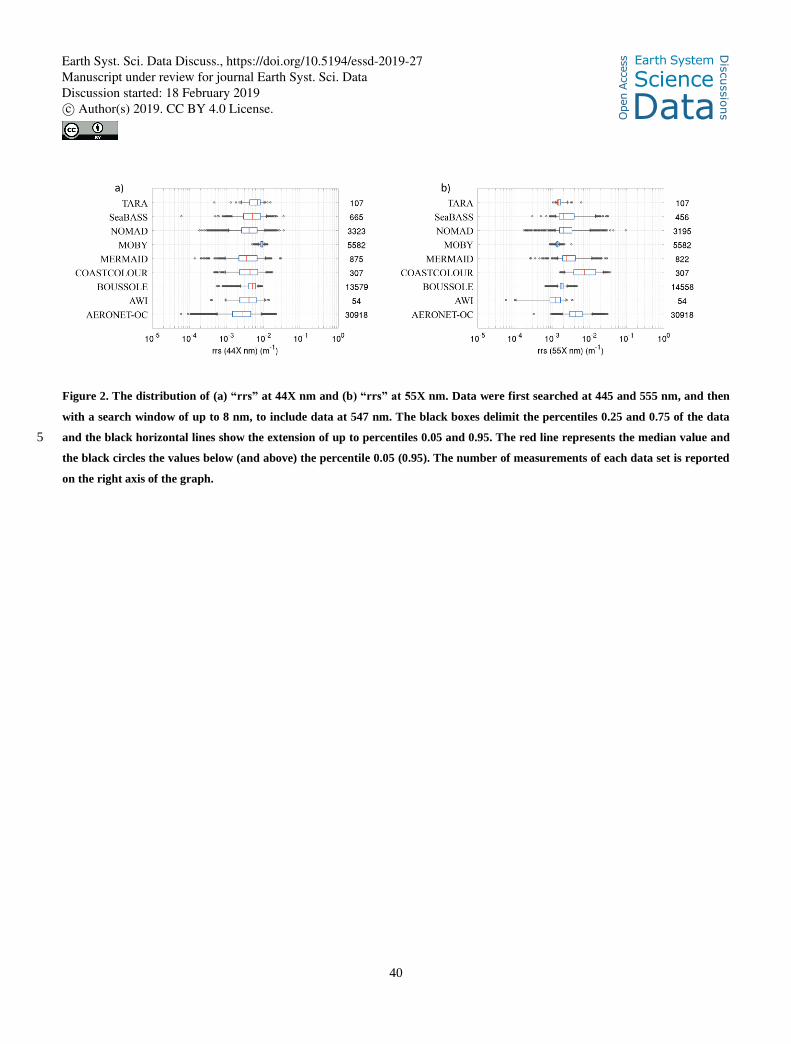
40
Figure 2. The distribution of (a) “rrs” at 44X nm and (b) “rrs” at 55X nm. Data were first searched at 445 and 555 nm, and then
with a search window of up to 8 nm, to include data at 547 nm. The black boxes delimit the percentiles 0.25 and 0.75 of the data
and the black horizontal lines show the extension of up to percentiles 0.05 and 0.95. The red line represents the median value and 5
the black circles the values below (and above) the percentile 0.05 (0.95). The number of measurements of each data set is reported
on the right axis of the graph.
Earth Syst. Sci. Data Discuss., https://doi.org/10.5194/essd-2019-27
Ope
n A
cces
s Earth System
Science
DataD
iscussio
ns
Manuscript under review for journal Earth Syst. Sci. DataDiscussion started: 18 February 2019c© Author(s) 2019. CC BY 4.0 License.
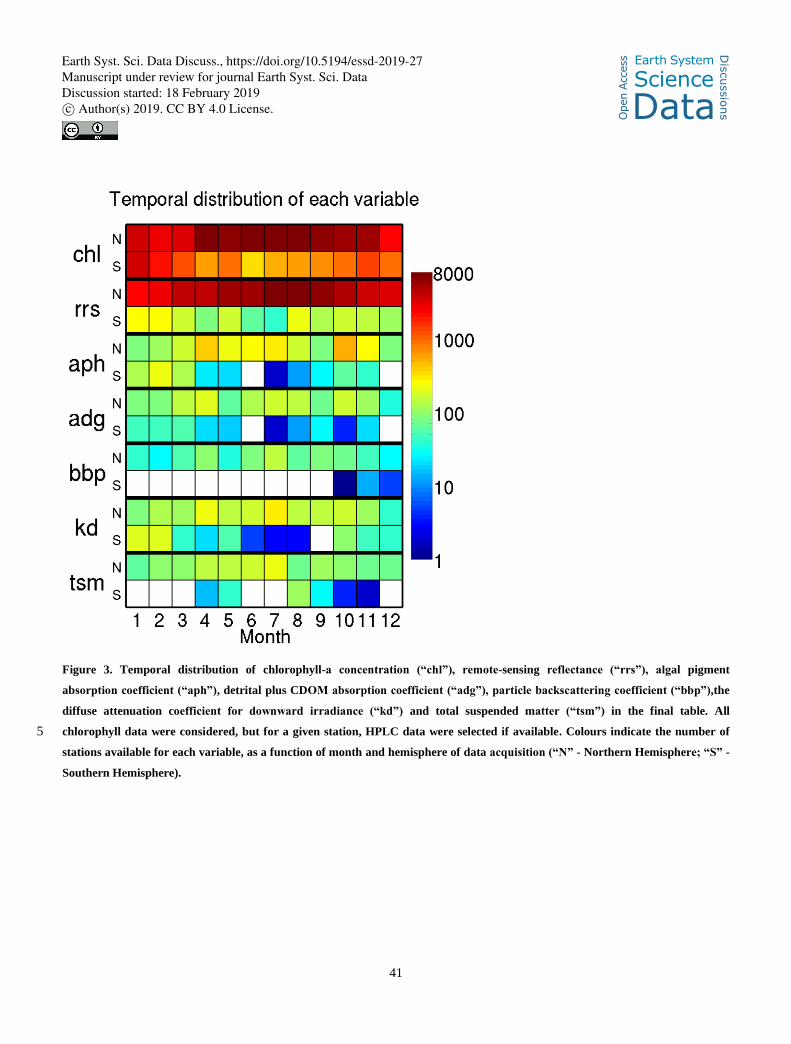
41
Figure 3. Temporal distribution of chlorophyll-a concentration (“chl”), remote-sensing reflectance (“rrs”), algal pigment
absorption coefficient (“aph”), detrital plus CDOM absorption coefficient (“adg”), particle backscattering coefficient (“bbp”),the
diffuse attenuation coefficient for downward irradiance (“kd”) and total suspended matter (“tsm”) in the final table. All
chlorophyll data were considered, but for a given station, HPLC data were selected if available. Colours indicate the number of 5
stations available for each variable, as a function of month and hemisphere of data acquisition (“N” - Northern Hemisphere; “S” -
Southern Hemisphere).
Earth Syst. Sci. Data Discuss., https://doi.org/10.5194/essd-2019-27
Ope
n A
cces
s Earth System
Science
DataD
iscussio
ns
Manuscript under review for journal Earth Syst. Sci. DataDiscussion started: 18 February 2019c© Author(s) 2019. CC BY 4.0 License.
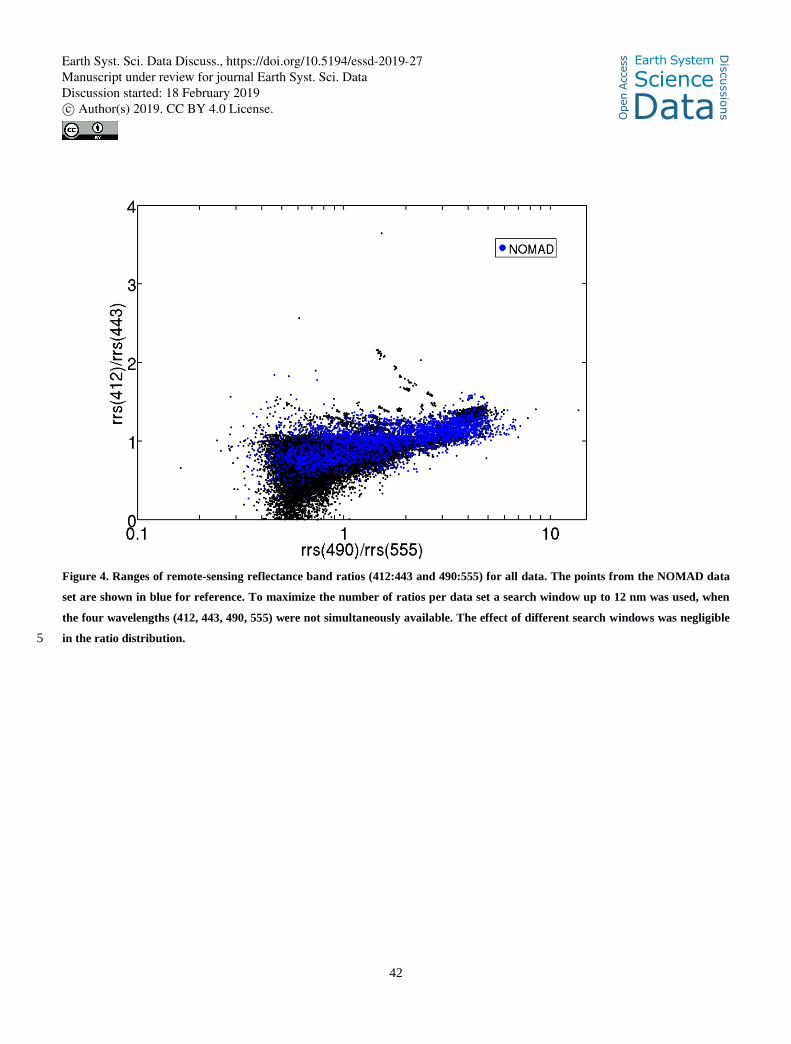
42
Figure 4. Ranges of remote-sensing reflectance band ratios (412:443 and 490:555) for all data. The points from the NOMAD data
set are shown in blue for reference. To maximize the number of ratios per data set a search window up to 12 nm was used, when
the four wavelengths (412, 443, 490, 555) were not simultaneously available. The effect of different search windows was negligible
in the ratio distribution. 5
Earth Syst. Sci. Data Discuss., https://doi.org/10.5194/essd-2019-27
Ope
n A
cces
s Earth System
Science
DataD
iscussio
ns
Manuscript under review for journal Earth Syst. Sci. DataDiscussion started: 18 February 2019c© Author(s) 2019. CC BY 4.0 License.
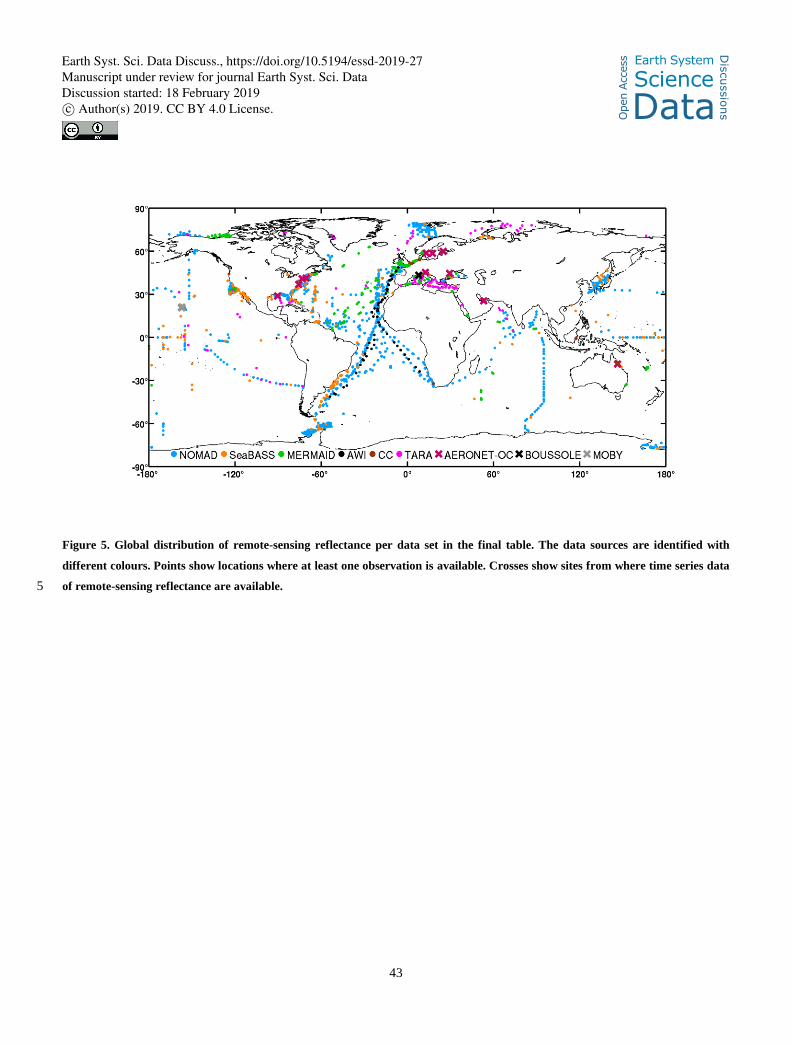
43
Figure 5. Global distribution of remote-sensing reflectance per data set in the final table. The data sources are identified with
different colours. Points show locations where at least one observation is available. Crosses show sites from where time series data
of remote-sensing reflectance are available. 5
Earth Syst. Sci. Data Discuss., https://doi.org/10.5194/essd-2019-27
Ope
n A
cces
s Earth System
Science
DataD
iscussio
ns
Manuscript under review for journal Earth Syst. Sci. DataDiscussion started: 18 February 2019c© Author(s) 2019. CC BY 4.0 License.
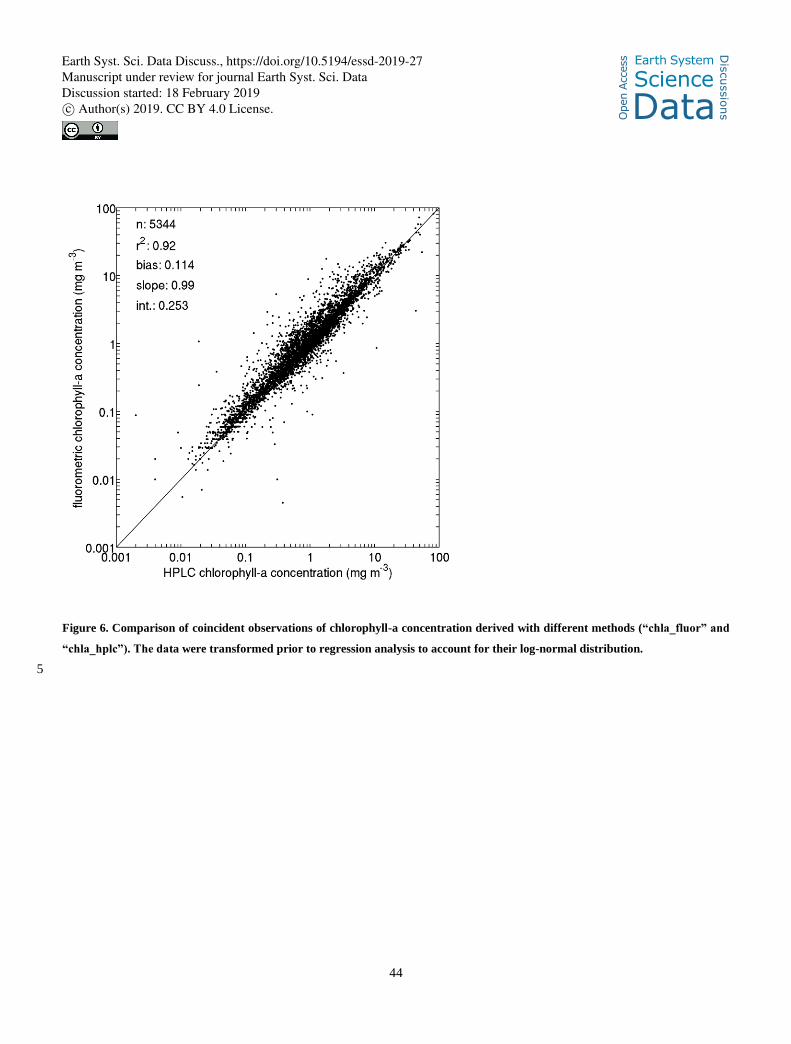
44
Figure 6. Comparison of coincident observations of chlorophyll-a concentration derived with different methods (“chla_fluor” and
“chla_hplc”). The data were transformed prior to regression analysis to account for their log-normal distribution.
5
Earth Syst. Sci. Data Discuss., https://doi.org/10.5194/essd-2019-27
Ope
n A
cces
s Earth System
Science
DataD
iscussio
ns
Manuscript under review for journal Earth Syst. Sci. DataDiscussion started: 18 February 2019c© Author(s) 2019. CC BY 4.0 License.
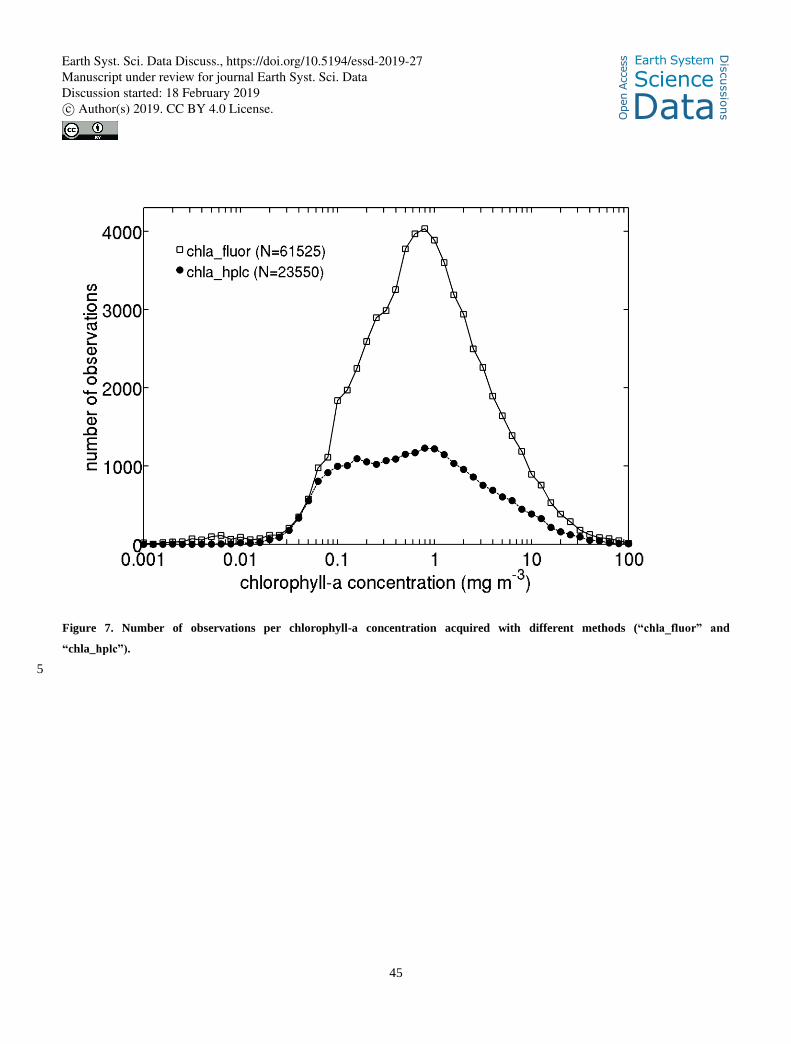
45
Figure 7. Number of observations per chlorophyll-a concentration acquired with different methods (“chla_fluor” and
“chla_hplc”).
5
Earth Syst. Sci. Data Discuss., https://doi.org/10.5194/essd-2019-27
Ope
n A
cces
s Earth System
Science
DataD
iscussio
ns
Manuscript under review for journal Earth Syst. Sci. DataDiscussion started: 18 February 2019c© Author(s) 2019. CC BY 4.0 License.
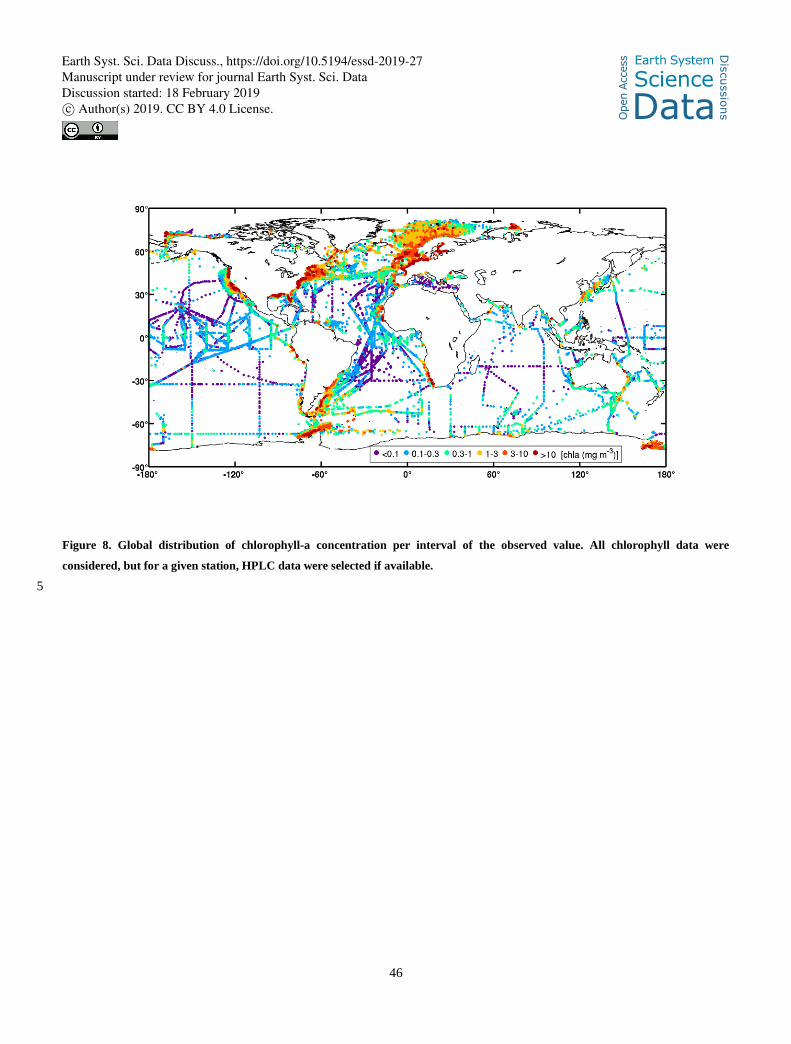
46
Figure 8. Global distribution of chlorophyll-a concentration per interval of the observed value. All chlorophyll data were
considered, but for a given station, HPLC data were selected if available.
5
Earth Syst. Sci. Data Discuss., https://doi.org/10.5194/essd-2019-27
Ope
n A
cces
s Earth System
Science
DataD
iscussio
ns
Manuscript under review for journal Earth Syst. Sci. DataDiscussion started: 18 February 2019c© Author(s) 2019. CC BY 4.0 License.
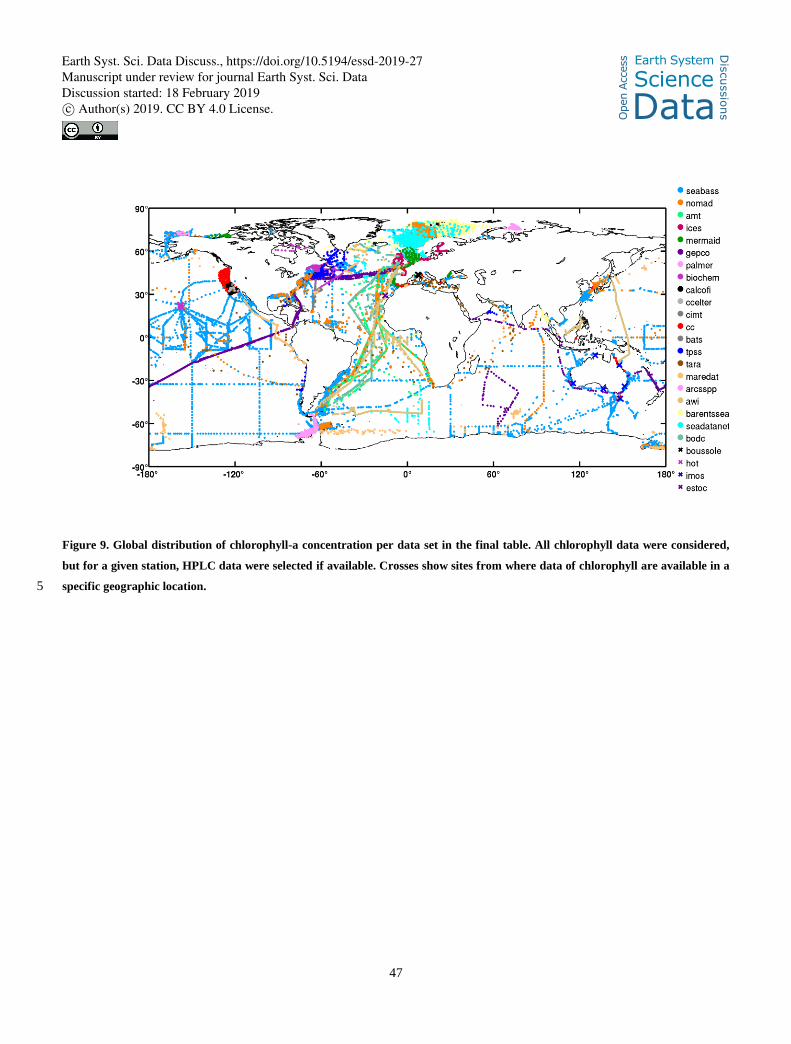
47
Figure 9. Global distribution of chlorophyll-a concentration per data set in the final table. All chlorophyll data were considered,
but for a given station, HPLC data were selected if available. Crosses show sites from where data of chlorophyll are available in a
specific geographic location. 5
Earth Syst. Sci. Data Discuss., https://doi.org/10.5194/essd-2019-27
Ope
n A
cces
s Earth System
Science
DataD
iscussio
ns
Manuscript under review for journal Earth Syst. Sci. DataDiscussion started: 18 February 2019c© Author(s) 2019. CC BY 4.0 License.
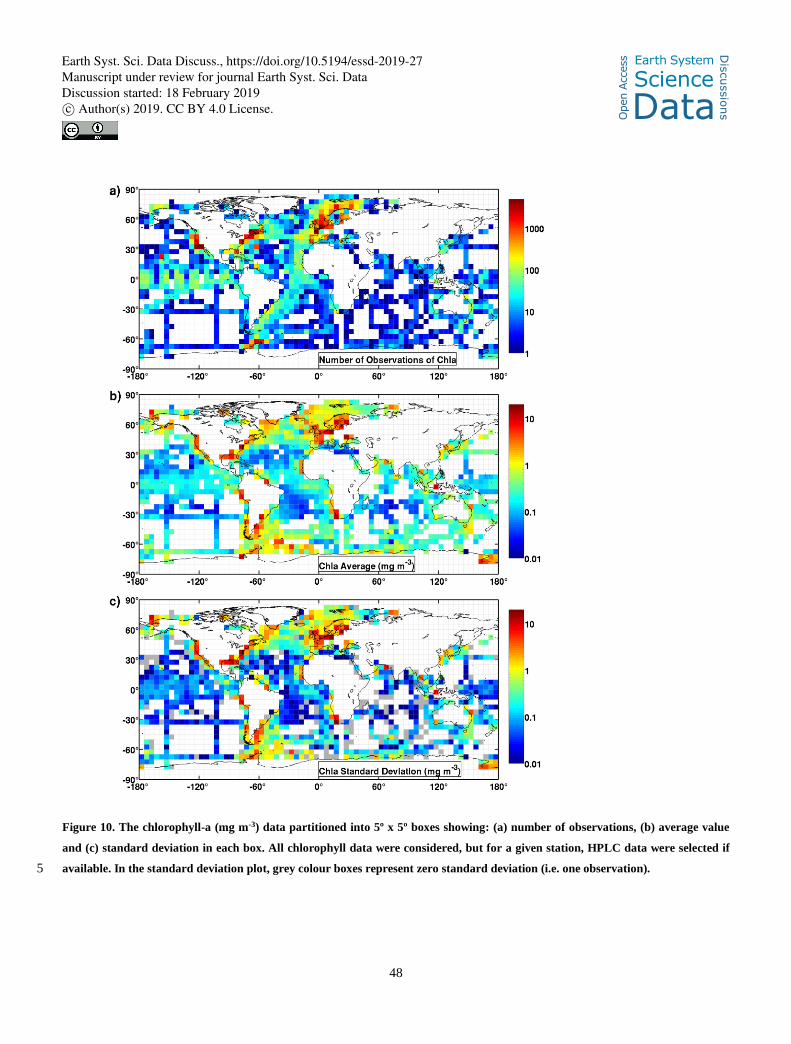
48
Figure 10. The chlorophyll-a (mg m-3) data partitioned into 5º x 5º boxes showing: (a) number of observations, (b) average value
and (c) standard deviation in each box. All chlorophyll data were considered, but for a given station, HPLC data were selected if
available. In the standard deviation plot, grey colour boxes represent zero standard deviation (i.e. one observation). 5
Earth Syst. Sci. Data Discuss., https://doi.org/10.5194/essd-2019-27
Ope
n A
cces
s Earth System
Science
DataD
iscussio
ns
Manuscript under review for journal Earth Syst. Sci. DataDiscussion started: 18 February 2019c© Author(s) 2019. CC BY 4.0 License.
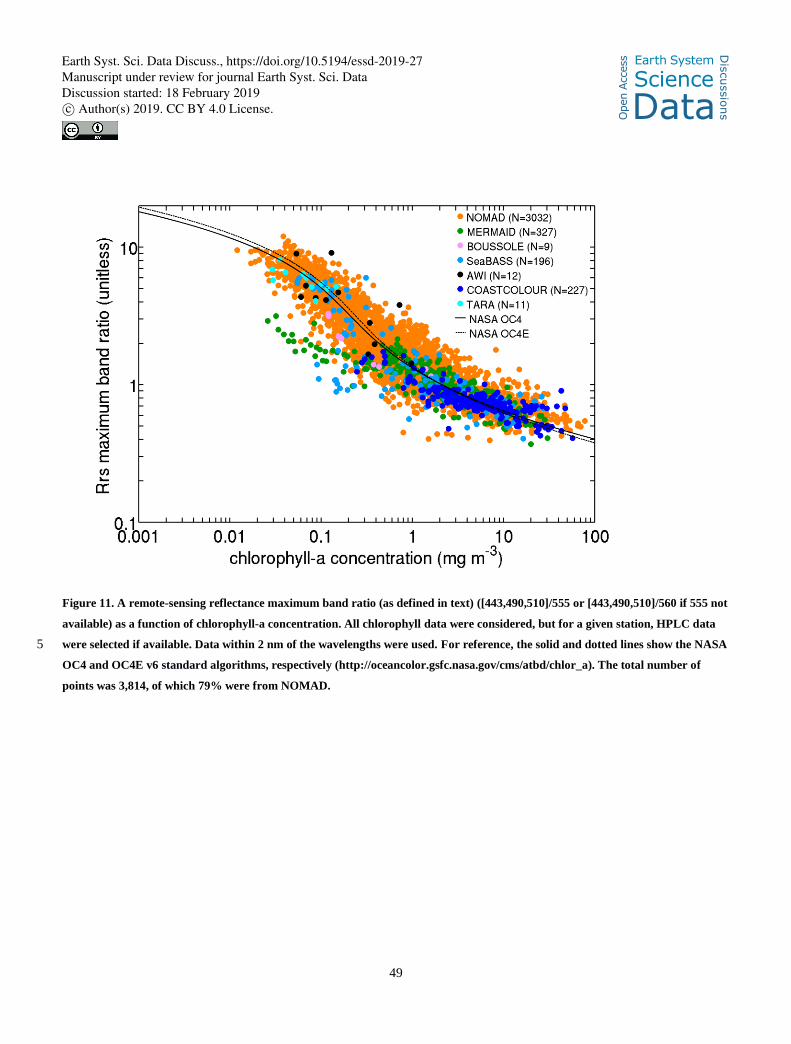
49
Figure 11. A remote-sensing reflectance maximum band ratio (as defined in text) ([443,490,510]/555 or [443,490,510]/560 if 555 not
available) as a function of chlorophyll-a concentration. All chlorophyll data were considered, but for a given station, HPLC data
were selected if available. Data within 2 nm of the wavelengths were used. For reference, the solid and dotted lines show the NASA 5
OC4 and OC4E v6 standard algorithms, respectively (http://oceancolor.gsfc.nasa.gov/cms/atbd/chlor_a). The total number of
points was 3,814, of which 79% were from NOMAD.
Earth Syst. Sci. Data Discuss., https://doi.org/10.5194/essd-2019-27
Ope
n A
cces
s Earth System
Science
DataD
iscussio
ns
Manuscript under review for journal Earth Syst. Sci. DataDiscussion started: 18 February 2019c© Author(s) 2019. CC BY 4.0 License.
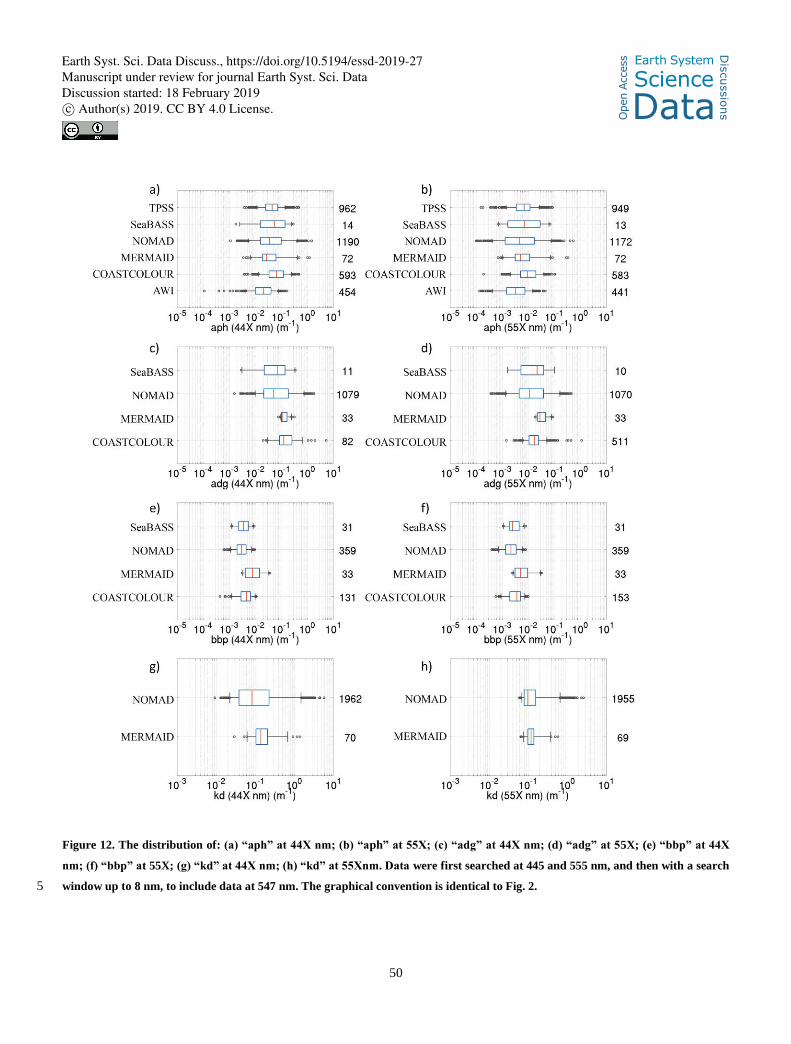
50
Figure 12. The distribution of: (a) “aph” at 44X nm; (b) “aph” at 55X; (c) “adg” at 44X nm; (d) “adg” at 55X; (e) “bbp” at 44X
nm; (f) “bbp” at 55X; (g) “kd” at 44X nm; (h) “kd” at 55Xnm. Data were first searched at 445 and 555 nm, and then with a search
window up to 8 nm, to include data at 547 nm. The graphical convention is identical to Fig. 2. 5
Earth Syst. Sci. Data Discuss., https://doi.org/10.5194/essd-2019-27
Ope
n A
cces
s Earth System
Science
DataD
iscussio
ns
Manuscript under review for journal Earth Syst. Sci. DataDiscussion started: 18 February 2019c© Author(s) 2019. CC BY 4.0 License.
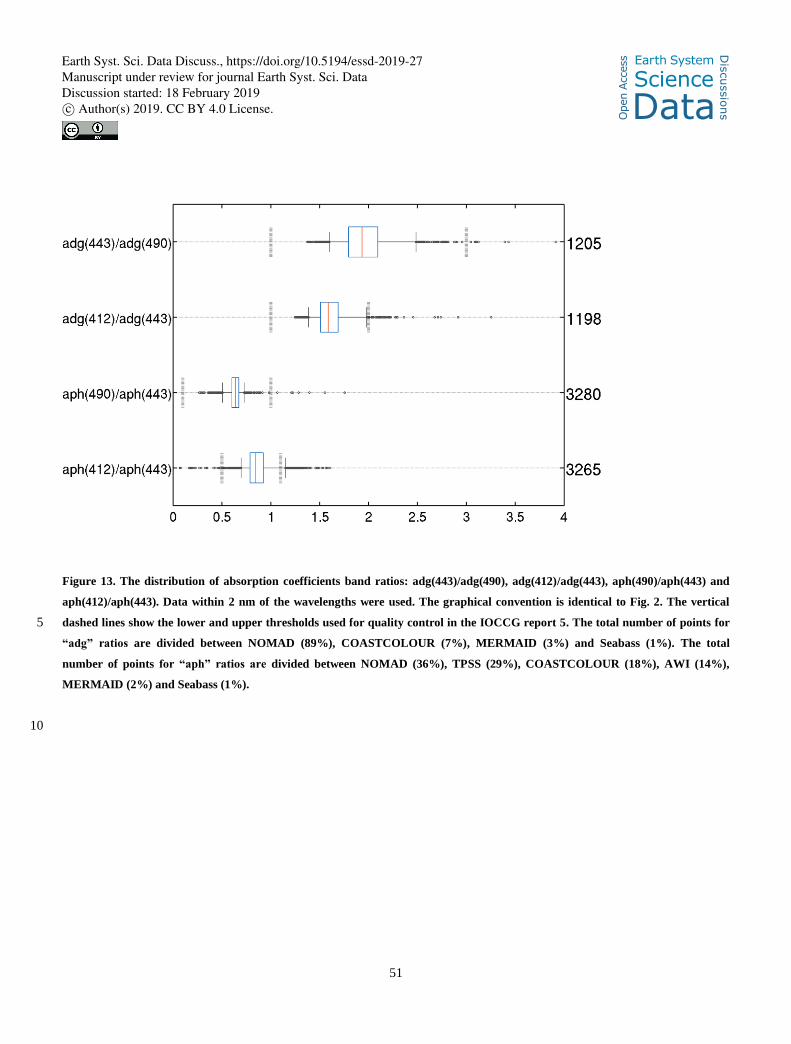
51
Figure 13. The distribution of absorption coefficients band ratios: adg(443)/adg(490), adg(412)/adg(443), aph(490)/aph(443) and
aph(412)/aph(443). Data within 2 nm of the wavelengths were used. The graphical convention is identical to Fig. 2. The vertical
dashed lines show the lower and upper thresholds used for quality control in the IOCCG report 5. The total number of points for 5
“adg” ratios are divided between NOMAD (89%), COASTCOLOUR (7%), MERMAID (3%) and Seabass (1%). The total
number of points for “aph” ratios are divided between NOMAD (36%), TPSS (29%), COASTCOLOUR (18%), AWI (14%),
MERMAID (2%) and Seabass (1%).
10
Earth Syst. Sci. Data Discuss., https://doi.org/10.5194/essd-2019-27
Ope
n A
cces
s Earth System
Science
DataD
iscussio
ns
Manuscript under review for journal Earth Syst. Sci. DataDiscussion started: 18 February 2019c© Author(s) 2019. CC BY 4.0 License.
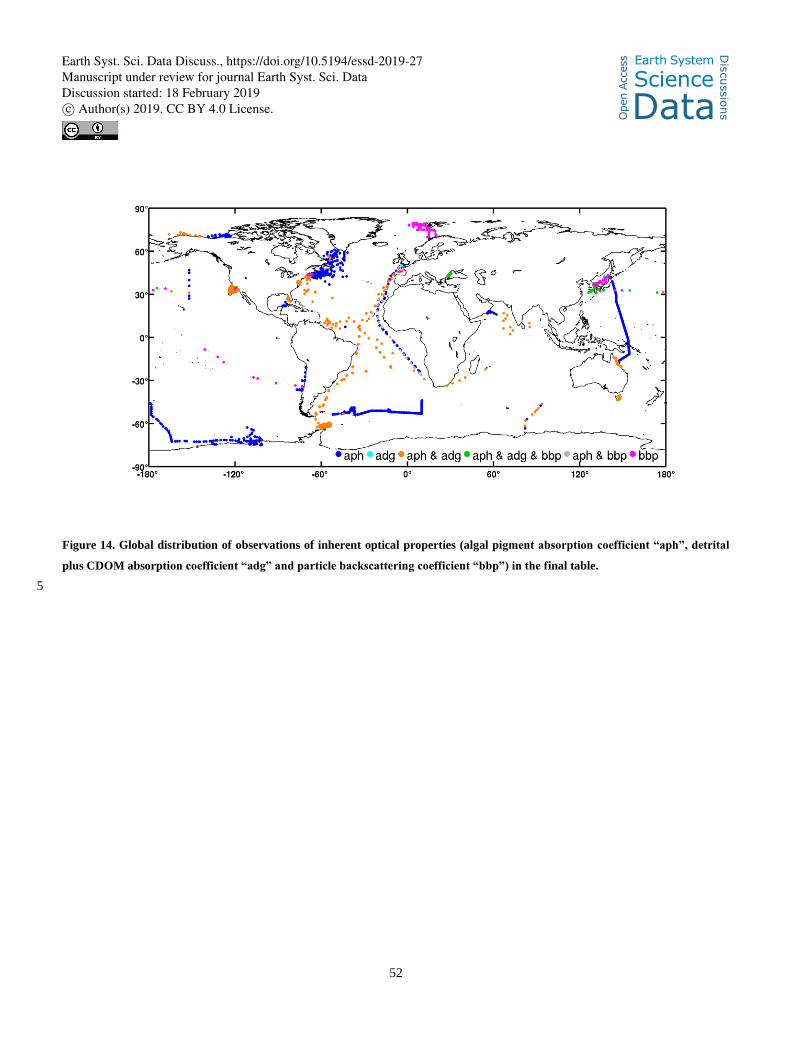
52
Figure 14. Global distribution of observations of inherent optical properties (algal pigment absorption coefficient “aph”, detrital
plus CDOM absorption coefficient “adg” and particle backscattering coefficient “bbp”) in the final table.
5
Earth Syst. Sci. Data Discuss., https://doi.org/10.5194/essd-2019-27
Ope
n A
cces
s Earth System
Science
DataD
iscussio
ns
Manuscript under review for journal Earth Syst. Sci. DataDiscussion started: 18 February 2019c© Author(s) 2019. CC BY 4.0 License.
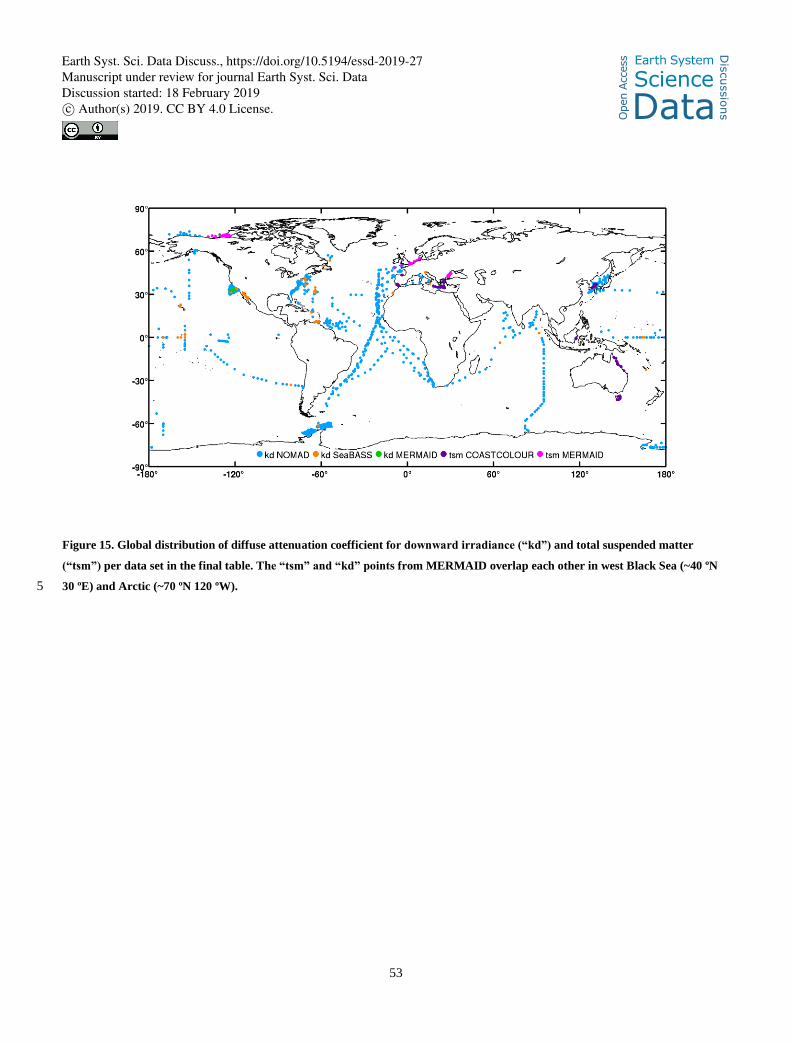
53
Figure 15. Global distribution of diffuse attenuation coefficient for downward irradiance (“kd”) and total suspended matter
(“tsm”) per data set in the final table. The “tsm” and “kd” points from MERMAID overlap each other in west Black Sea (~40 ºN
30 ºE) and Arctic (~70 ºN 120 ºW). 5
Earth Syst. Sci. Data Discuss., https://doi.org/10.5194/essd-2019-27
Ope
n A
cces
s Earth System
Science
DataD
iscussio
ns
Manuscript under review for journal Earth Syst. Sci. DataDiscussion started: 18 February 2019c© Author(s) 2019. CC BY 4.0 License.
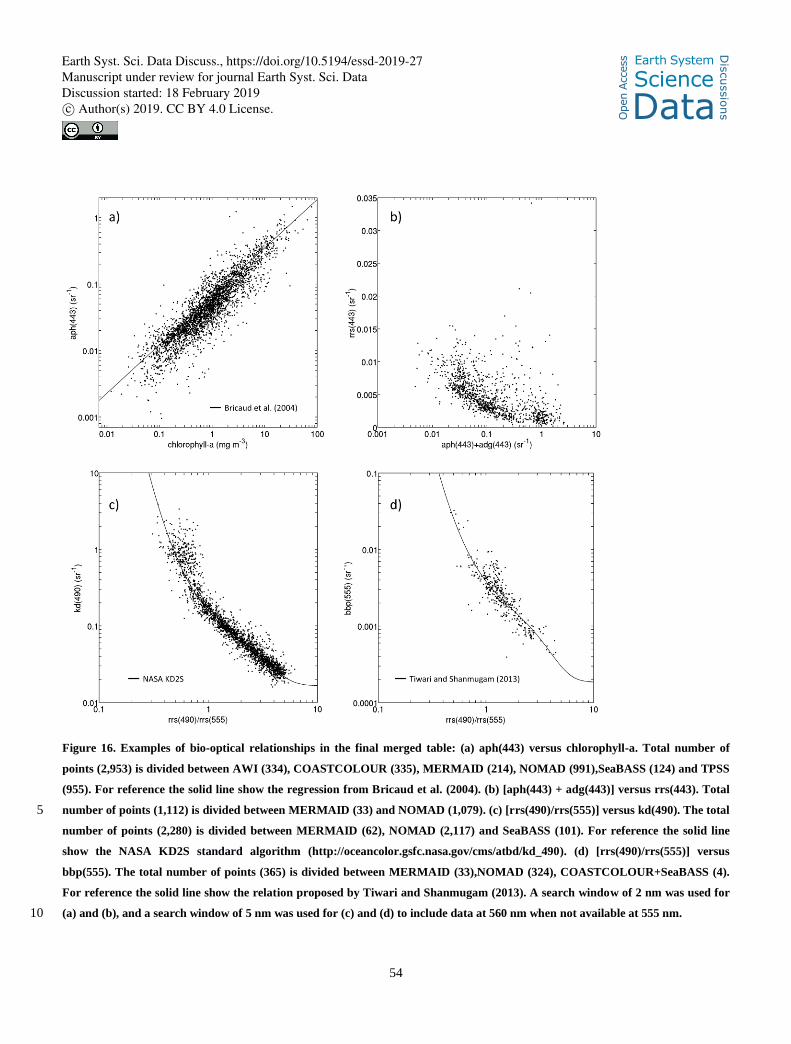
54
Figure 16. Examples of bio-optical relationships in the final merged table: (a) aph(443) versus chlorophyll-a. Total number of
points (2,953) is divided between AWI (334), COASTCOLOUR (335), MERMAID (214), NOMAD (991),SeaBASS (124) and TPSS
(955). For reference the solid line show the regression from Bricaud et al. (2004). (b) [aph(443) + adg(443)] versus rrs(443). Total
number of points (1,112) is divided between MERMAID (33) and NOMAD (1,079). (c) [rrs(490)/rrs(555)] versus kd(490). The total 5
number of points (2,280) is divided between MERMAID (62), NOMAD (2,117) and SeaBASS (101). For reference the solid line
show the NASA KD2S standard algorithm (http://oceancolor.gsfc.nasa.gov/cms/atbd/kd_490). (d) [rrs(490)/rrs(555)] versus
bbp(555). The total number of points (365) is divided between MERMAID (33),NOMAD (324), COASTCOLOUR+SeaBASS (4).
For reference the solid line show the relation proposed by Tiwari and Shanmugam (2013). A search window of 2 nm was used for
(a) and (b), and a search window of 5 nm was used for (c) and (d) to include data at 560 nm when not available at 555 nm. 10
Earth Syst. Sci. Data Discuss., https://doi.org/10.5194/essd-2019-27
Ope
n A
cces
s Earth System
Science
DataD
iscussio
ns
Manuscript under review for journal Earth Syst. Sci. DataDiscussion started: 18 February 2019c© Author(s) 2019. CC BY 4.0 License.