Embed Size (px)
Citation preview
Discussion of Capital Market Return Expectations
Rhode Island Municipalities
January 24, 2012
Rhode Island Municipalities
Presented by:
Allan Emkin
Pension Consulting Alliance, Inc.

Background
Investment Earnings + Contributions = Benefit Payments + ExpensesInvestment Earnings + Contributions Benefit Payments + Expenses
Today’s Presentation will focus on Investment Earnings:oday s ese tat o ocus o est e t a gs
Earnings on Earnings onInvestment Earnings = Income assets (Fixed Income) + Growth assets (Equity) g ( ) ( q y)
Fixed Income returns are expected to be lower than in the past
To the extent economic growth is lower, Equity returns will be challenged to deliver at historical levels
Take-away: Long-term investors should expect lower capital market returns over the next decade than historical averages
2

CHANGED INVESTMENT LANDSCAPE
Changed Investment Landscape
THE WORLD HAS CHANGED FOR LONG-TERM INVESTORS:
RECENT MARKET DYNAMICS
Factors that provided a tailwind in the past are expected to present a headwind
L I t t t i tLower Interest rate environment
Debt levels are higherGovernment: to finance operationsGovernment: to finance operations Consumer: to fund purchases of housing and consumer goods
Growing capital flows increase the potential for global capital marketGrowing capital flows increase the potential for global capital market volatility
Other influencesOther influences
Take-away: Powerful secular trends have the potential to influence the investment landscape in a negative way for the next decade
4
investment landscape in a negative way for the next decade and possibly beyond
Changed Investment Landscape
LOWER INTEREST RATE ENVIRONMENTLOWER INTEREST RATE ENVIRONMENT:
Indicates that future expected returns from Fixed Income will be lower than in the pastthan in the past
Future Fixed Income market returns are relatively easy to estimate Today’s 10 year Treasury note’s Yield to Maturity is a goodToday s 10 year Treasury note s Yield-to-Maturity is a good predictor of a 10-year holding period return
Take-away: Long-term Investors can expect a 2.25 – 2.75% returnon a diversified portfolio of U.S. Fixed Income securities
5

Decline in Interest Rates: Negative Real Returns
90 Day Treasury Bills Real Yield(1982‐2011)
8
10
(1982 2011)
4
6
2
4
‐2
0
‐4
6

Declining Interest Rates: Fixed Income Tailwind
U.S. Fixed Income Returns and Interest Rates (1982 2011)
30
35(1982‐2011)
20
25
BC US Aggregate 12‐Month Trailing Return
10
15 Interest Rate (10‐Year US Treasury)
0
5
‐5
7

Decline in Interest Rates & Rise in Interest Rate Risk
10 Year U.S. Treasury Yield & Duration
9
1018
7
8
9
12
14
16
4
5
6
8
10
12
Years (D
uratio
eld to M
aturity
2
3
4
4
6
n)Yie
0
1
0
2
10 Year Nominal Yield 10 Year Duration
8

Changed Investment Landscape
DEBT LEVELS ARE HIGHER:
The U S Government and the citizenry have over-extended theirThe U.S. Government and the citizenry have over-extended their debt burdens.
Debt / Borrowing can stimulate economic activity in the near-to-Debt / Borrowing can stimulate economic activity in the near tomid term
However, Debt has a costInterest (debt servicing), and ( g),Debt needs to be repaid
When debt reaches high levels it can act as a brake on economic growth
Interest payments and debt repayment can crowd out future purchases and economic projects
Take-away: Debt financing burdens point to Lower economic growth prospects and potentially lower Equity market
t
9
returns

Changed Investment Landscape
ADDITIONAL FACTORS CONTRIBUTING TO LOWER ECONOMIC GROWTH PROSPECTS IN THE DEVELOPED ECONOMIES:GROWTH PROSPECTS IN THE DEVELOPED ECONOMIES:
Aging populationsAging populations
Slowing population growth
As a result Economic Growth is expected to be lower in the developed market economies
Take Away: Lower economic growth prospects in the developed markets point to lower Equity market returns
10
Changed Investment Landscape
60
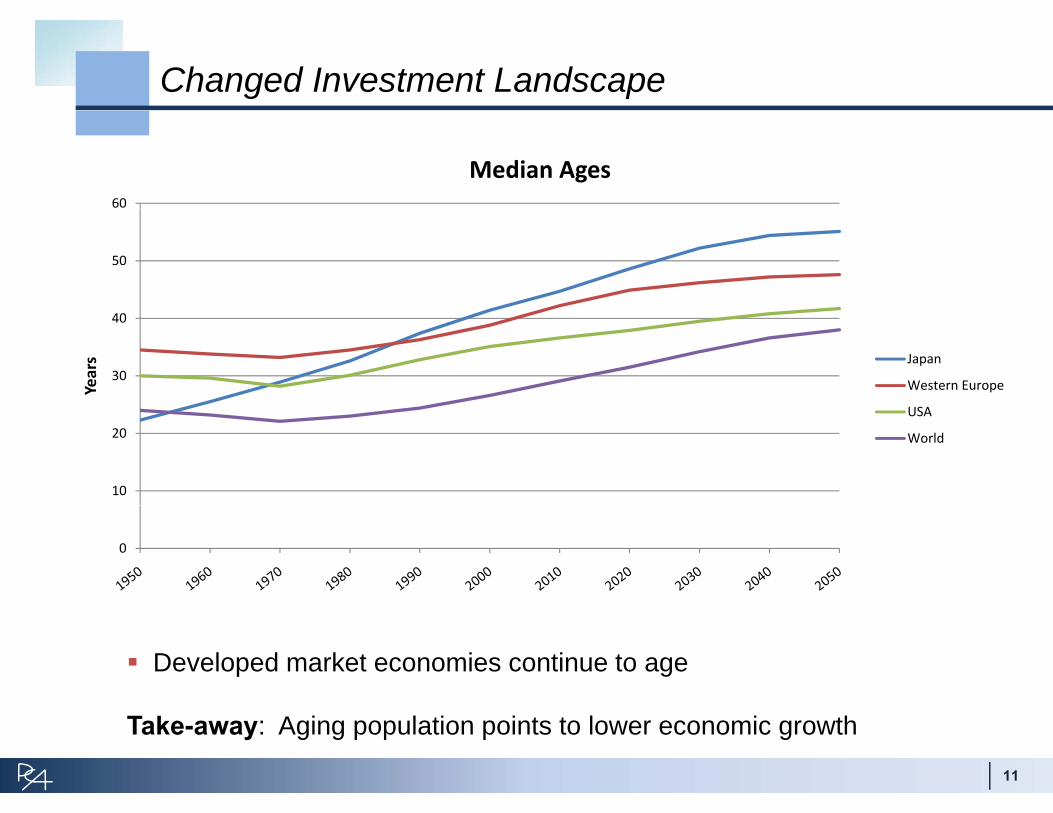
Median Ages
50
30
40
Years Japan
Western Europe
S
10
20
USA
World
0
Developed market economies continue to age
11
Take-away: Aging population points to lower economic growth
Changed Investment Landscape
GROWING CAPITAL FLOWS INCREASE THE POTENTIAL FOR GLOBAL CAPITAL MARKET VOLATILITYGLOBAL CAPITAL MARKET VOLATILITY:
Growing global capital flows could increase the probability of tail risk events (low probability events that trigger large equity market losses)events (low probability events that trigger large equity market losses)
Greater interconnectedness of the global financial system increases the likelihood of a global financial market contagion (U S sub-primethe likelihood of a global financial market contagion (U.S. sub-prime problem)
Large trade imbalances continue to stress the global financial systemLarge trade imbalances continue to stress the global financial system
Take-away: As financial wealth becomes more equally distributed globally the potential for market volatility increases asglobally the potential for market volatility increases as various economic interests compete in the marketplace
12
Equity Market: Recent Volatility
160Russell 3000 Index
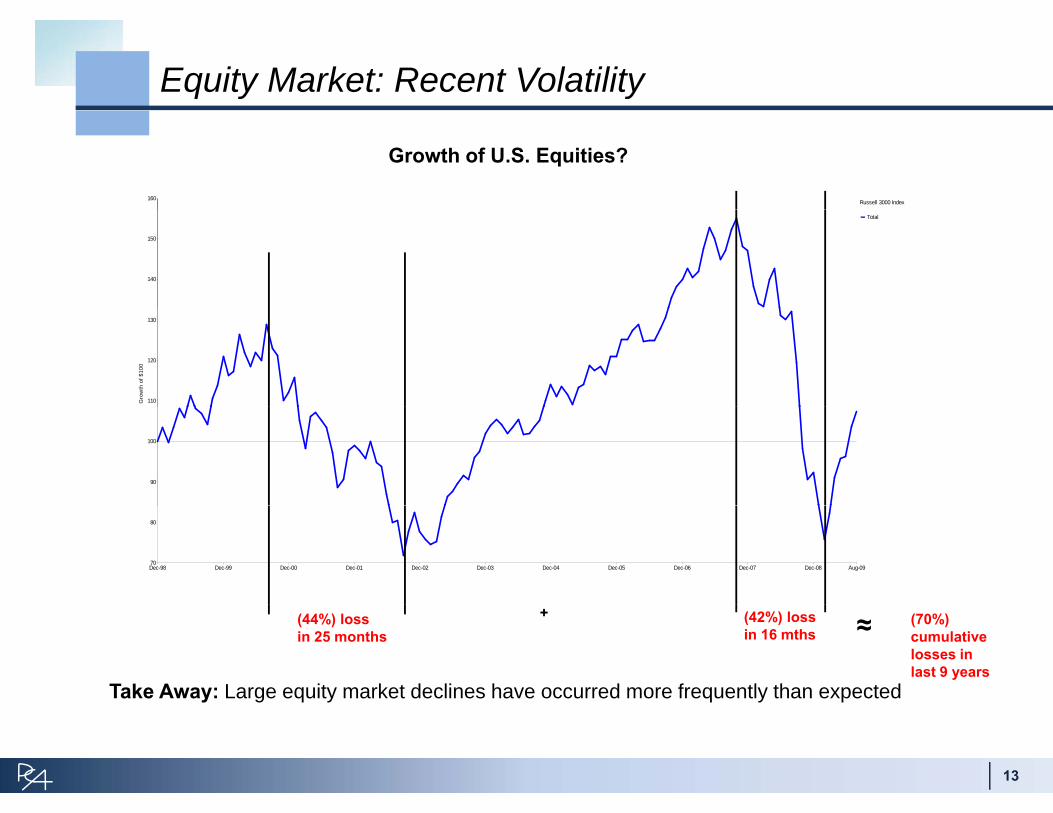
Growth of U.S. Equities?
140
150
Total
110
120
130
Gro
wth
of $
100
90
100
Created with mpi Stylu
70
80
Dec-98 Dec-99 Dec-00 Dec-01 Dec-02 Dec-03 Dec-04 Dec-05 Dec-06 Dec-07 Dec-08 Aug-09
(44%) lossin 25 months
(42%) lossin 16 mths
+ ≈ (70%) cumulativelosses in last 9 years
Take Away: Large equity market declines have occurred more frequently than expected
13
Equity Market Expectations
There are several structural conditions that present a headwind for future equity market return prospects
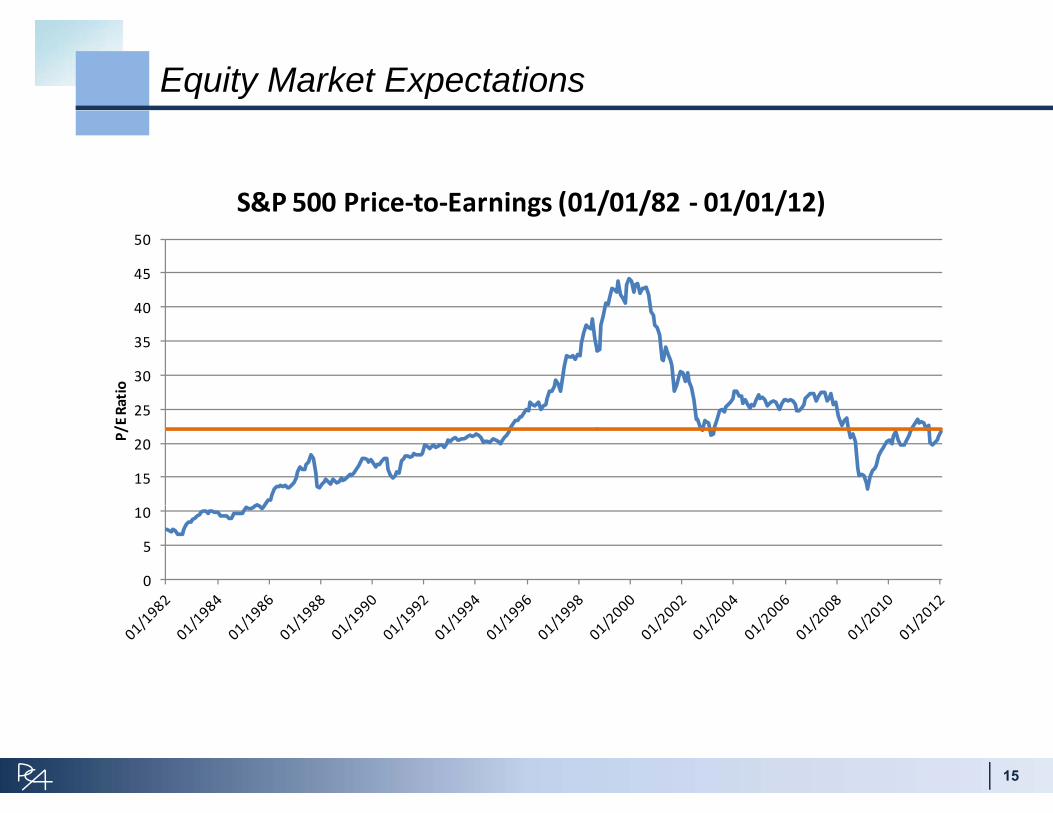
I ddi i E i k i d hIn addition, Equity markets are not priced cheapCurrent U.S. price / earnings ratio = 21.7 x
M t j it b ll k t t t d f l l ti l lMost major equity bull markets started from very low valuation levelsi.e. 1982 price / earnings ratio = 7.8 x
Take-away: Equity markets are not priced cheaply. It is unlikely that a sustainable long-term bull market for equities would start from current market valuation levelscurrent market valuation levels
14
Equity Market Expectations
S&P 500 Price‐to‐Earnings (01/01/82 ‐ 01/01/12)
40
45
50
S&P 500 Price to Earnings (01/01/82 01/01/12)
25
30
35
40
Ratio
15
20
25
P/E R
0
5
10
15

Equity Market Expectations
Equity Market Return Expectations are Challenged:
Over long term:
Equity Market Return =Equity Market Return = Dividend Yield of market + economic growth + p/e multiple change
Today: Div yield = 1.9% (historically low yield level)Economic Growth = 3.0% (lower growth than historic levels)p/e multiple change = 21.7 X (average p/e level – chance of p p g ( g p
future multiple expansion is not high)
Take-away: Historically low dividend yield, lower economic growth expectations and a fairly priced equity market are not predictive of strong equity market returns
16

10-YEAR CAPITAL MARKET EXPECTATIONS

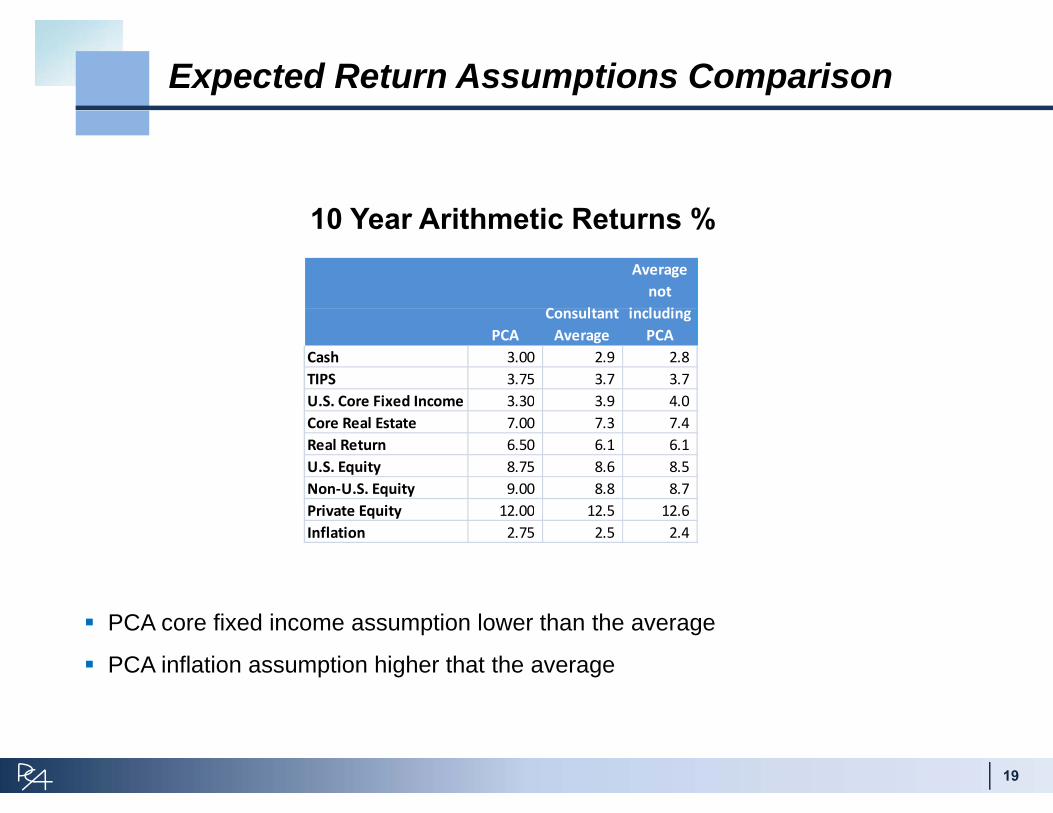
Expected Return Assumptions Comparison
Average not
10 Year Arithmetic Returns %
PCA RussellEnnis Knupp Callan Cliffwater Wilshire Average
not including
PCACash 3.00 3.40 2.75 3.00 2.50 2.50 2.9 2.8 TIPS 3.75 3.90 3.90 3.60 3.50 3.50 3.7 3.7 U.S. Core Fixed Income 3.30 4.40 4.50 3.80 3.10 4.00 3.9 4.0 Core Real Estate 7.00 6.70 6.80 7.85 8.90 6.50 7.3 7.4 Real Return 6 50 6 70 6 50 4 50 6 50 6 1 6 1Real Return 6.50 6.70 6.50 4.50 6.50 6.1 6.1 U.S. Equity 8.75 7.30 8.70 9.35 9.10 8.25 8.6 8.5 Non‐U.S. Equity 9.00 7.40 8.90 9.50 9.20 8.50 8.8 8.7 Private Equity 12.00 9.60 15.10 13.10 12.90 12.50 12.5 12.6 Inflation 2.75 2.50 2.40 2.50 2.30 2.25 2.5 2.4
Note: Real Return for Callan and Cliffwater are Commodities
18
Expected Return Assumptions Comparison
10 Y A ith ti R t %10 Year Arithmetic Returns %
C l
Average not
i l diPCA
Consultant Average
including PCA
Cash 3.00 2.9 2.8 TIPS 3.75 3.7 3.7 U.S. Core Fixed Income 3.30 3.9 4.0 Core Real Estate 7.00 7.3 7.4 Real Return 6.50 6.1 6.1 U.S. Equity 8.75 8.6 8.5 Non‐U.S. Equity 9.00 8.8 8.7 P i E i 12 00 12 5 12 6Private Equity 12.00 12.5 12.6 Inflation 2.75 2.5 2.4
PCA core fixed income assumption lower than the average
PCA inflation assumption higher that the average
19

10 Year Expected Returns: Arithmetic and Geometric
Expected Avg. Arithmetic
Annual Return
Expected Geometric
(Compound) Annual Return
Cash 3.00 3.00
Treasury Infl. Protected Securities 3.75 3.60
Domestic US Fixed Income 3 30 3 20Domestic US Fixed Income 3.30 3.20
International Fixed Income 3.30 2.80Global Fixed Income 3.30 3.00
Core Real Estate 7.00 6.50Real Return 6 50 6 20Real Return 6.50 6.20
Domestic Equity 8.75 7.30International Equity 9.00 7.00
Global Equity 8.90 7.40
Hedged International Equity 8 90 7 10
A ith ti t t t i
Hedged International Equity 8.90 7.10
Private Equity/Venture Capital 12.00 8.90
Inflation 2.75 2.75
Arithmetic return – average return you can expect in any year
Geometric return – average compounded return Incorporates return volatility
20
Geometric returns are lower than Arithmetic returns

Projected Public Fund 10 Year Returns
,
Return and Risk based on Wilshire’s Capital Market Assumptions and States’ Asset Allocation Policy
21
Source: Wilshire Consulting - 2011 Wilshire Report on State Retirement Systems

CONCLUSION
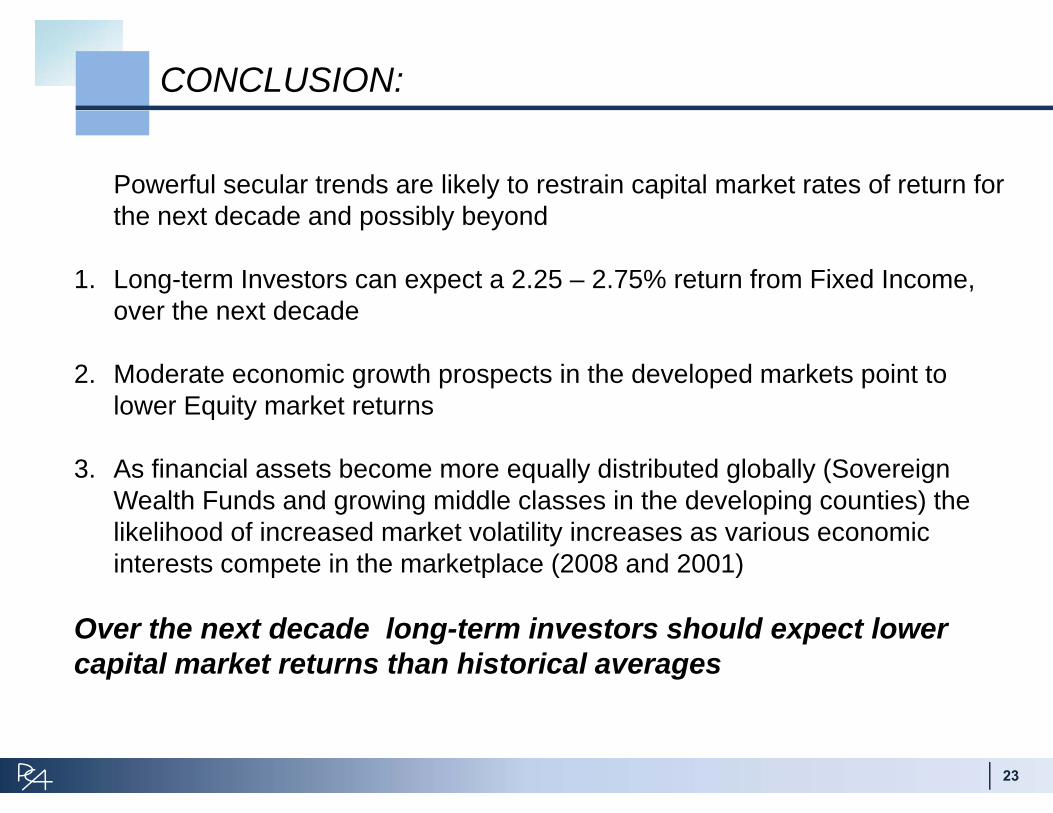
CONCLUSION:
Powerful secular trends are likely to restrain capital market rates of return for th t d d d ibl b dthe next decade and possibly beyond
1. Long-term Investors can expect a 2.25 – 2.75% return from Fixed Income, over the next decadeover the next decade
2. Moderate economic growth prospects in the developed markets point to lower Equity market returnslower Equity market returns
3. As financial assets become more equally distributed globally (Sovereign Wealth Funds and growing middle classes in the developing counties) theWealth Funds and growing middle classes in the developing counties) the likelihood of increased market volatility increases as various economic interests compete in the marketplace (2008 and 2001)
Over the next decade long-term investors should expect lower capital market returns than historical averages
23