Embed Size (px)
Citation preview

The opinions expressed in this presentation are those of the speaker. The International Foundationdisclaims responsibility for views expressed and statements made by the program speakers.
Strategies for Long-Term Return in a Low-Return Environment
Adam L. Berger, CFAManaging Director and Multi-Asset StrategistWellington Management Company, LLPBoston, Massachusetts
I06-1

“Do what you can with what you’ve got where you are.”
Theodore Roosevelt
I06-2

“Do what you can with what you’ve got where you are” Liabilities
I06-3

“Do what you can with what you’ve got where you are”
Expected returnsLiabilities
I06-4

“Do what you can with what you’ve got where you are”
Investment decisionsExpected returnsLiabilities
I06-5

Today’s Agenda
Where are you? Liabilities
What do you have? Investments and their expected returns
What can you do? “Stepping stones”
I06-6

Where Are You?
Liabilities
I06-7

Where Are You?
What is your plan’s funded status?A. 100% or greaterB. 90 to 99%C. 80 to 89%D. 60 to 80%E. Less than 60%
I06-8

Where Are You?
What is your plan’s actuarial return on assets?A. Greater than 8%B. 7.50 to 8.00%C. 7.00 to 7.49%D. 6.50 to 6.99%E. Less than 6.50%
I06-9

Where Are You?
Funded status 75% in aggregate
21% of plans <65% funded47% of plans <80% funded
Assumed rates of Nearly 90% are in the 7-8% rangeReturn Nearly 50% are at exactly 7.5%
Source: Milliman
I06-10

Liabilities Matter Because They Will Grow
Liabilities grow at actuarial rate of return
Model assumes liabilities have initial present value of $100 and grow at 7.5% actuarial rate of return.
I06-11

Liabilities Matter Because They Will Grow
Looks okay if you’re fully funded
Model assumes liabilities have initial present value of $100 and grow at 7.5% actuarial rate of return.Assets have an initial value of $100 and grow at 7.5% actuarial rate of return.
I06-12

Liabilities Matter Because They Will Grow
Not as good if you start underfunded (impact of 75% funded ratio)
Still 75% funded, but deficit grows 4.2x
Model assumes liabilities have initial present value of $100 and grow at 7.5% actuarial rate of return.Assets have an initial value of $75 and grow at 7.5% actuarial rate of return.
I06-13

Liabilities Matter Because They Will Grow
And under-earning makes things worse (impact of 7% return)
End point is 68% funded and deficit grows 5.4x
Model assumes liabilities have initial present value of $100 and grow at 7.5% actuarial rate of return.Assets have an initial value of $75 and grow at 7%.
I06-14

Liabilities Matter Because They Will Grow
Under-earning hurts even if you start fully funded (impact of earning 7% return)
End point is 90% funded
Model assumes liabilities have initial present value of $100 and grow at 7.5% actuarial rate of return.Assets have an initial value of $100 and grow at 7%.
I06-15

Where Are You?
Funded status is important, but• It’s given to you• It’s just the starting point
The biggest issue is typically returns• Can you keep up with your actuarial rate?
I06-16

What Do You Have?
Expected Returns
I06-17
What Do You Have?
What do you think your stock portfolio will return on average over the next 10 years?(The S&P 500 returned 7.4% last 10 years and 9.8% last 30 years) A. Greater than 10%
B. 9.0 to 9.9%
C. 8.0 to 8.9%
D. 7.0 to 7.9%
E. Less than 7.0%
I06-18

What Do You Have?
What do you think your bond portfolio will return on average over the next 10 years?(The Barclays Aggregate returned 5.1% last 10 years and 6.6% last 30 years) A. Greater than 10%B. 9.0 to 9.9%C. 8.0 to 8.9%D. 7.0 to 7.9%E. Less than 7.0%
I06-19

History of Earning 7.0%
Stocks: S&P 500; bonds: Jan 2013 – Jun 2016 Barclays US Govt Intm Bond, 1926-2012 Ibbotson Us Intm Govt Bond. Portfolio rebalanced monthly. | For illustrative purposes only. Not representative of an actual investment | Sources: Ibbotson, Datastream, Wellington Management
Percent of time a 60% stock/40% bond mix can meet sample institutional objectives, 1926-June 2016 (%)
I06-20
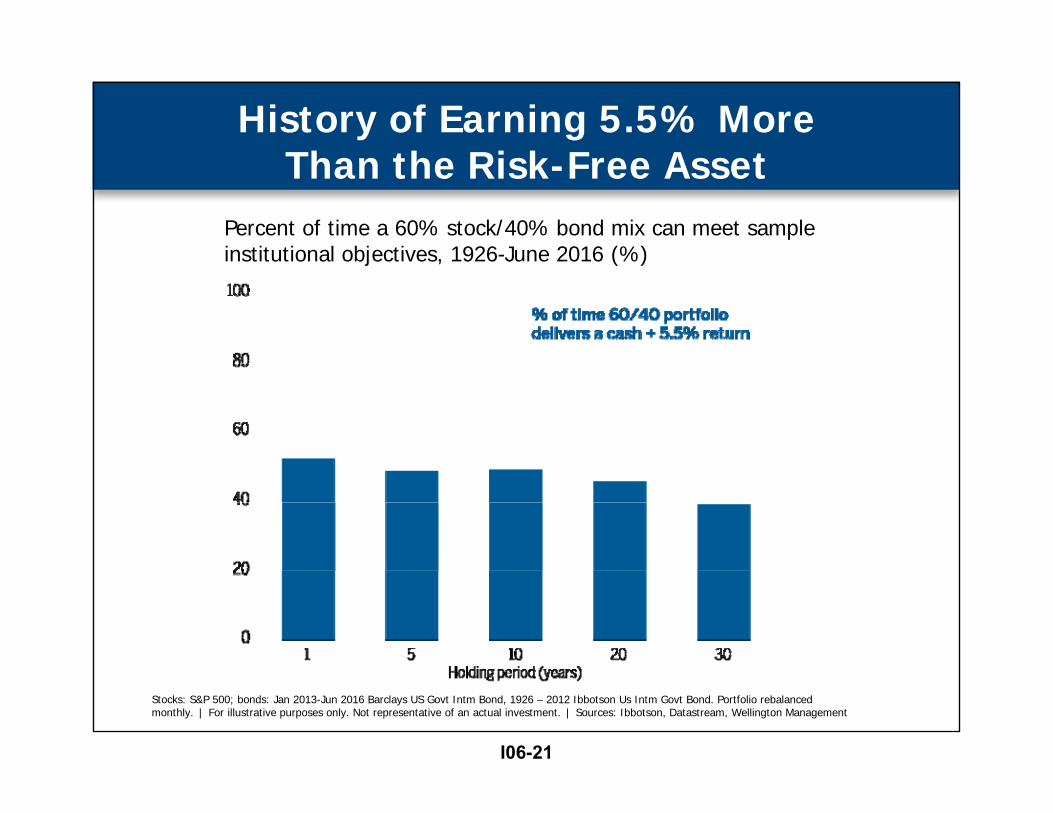
History of Earning 5.5% More Than the Risk-Free Asset
Stocks: S&P 500; bonds: Jan 2013-Jun 2016 Barclays US Govt Intm Bond, 1926 – 2012 Ibbotson Us Intm Govt Bond. Portfolio rebalanced monthly. | For illustrative purposes only. Not representative of an actual investment. | Sources: Ibbotson, Datastream, Wellington Management
Percent of time a 60% stock/40% bond mix can meet sample institutional objectives, 1926-June 2016 (%)
I06-21

What Have You Got?
Average Investment Consultant Capital Market Expectations
Average return expectations (%)
Global stocks 7.0Core bonds 2.9
Implied 60/40 portfolio 5.4
Private equity 8.3High yield bonds 5.1Emerging market debt 4.9
Implied 60/40 “plus” portfolio 5.8
Average return expectations were sourced from eight major investment consultants. Available estimates for each asset class were averaged after removing the highest and lowest estimates. 60/40 portfolio: 60% global equities/40% core fixed income. 60/40 “plus” portfolio: 45% global equities/15% private equity/30% core fixed income/5% emerging market debt/5‐yr high yield bond. | Source: Wellington Management | Data as of August 2016
I06-22

Why Have Expected Returns Come Down So Much?
Potential reasons• Lower risk-free rate• Higher stock valuations• Demographic effects• More investors pursuing alternatives
I06-23

What Can You Do?
Investment decisions
I06-24

What Can You Do?
What is your current stock allocation?A. 80% or moreB. 70-79%C. 60-69%D. 50-59%E. 50% or less
I06-25

What Can You Do?
In the next 1-2 years, how do you expect your stock allocation to change?A. Up 5% or moreB. Up 1-4%C. Little or no changeD. Down 1-4 %E. Down 5% or more
I06-26
What Can You Do?
In the next 1-2 years, how do you expect your bond allocation to change?A. Up 5% or moreB. Up 1-4%C. Little or no changeD. Down 1-4 %E. Down 5% or more
I06-27

What Can You Do?
In the next 1-2 years, how do you expect your alternatives allocation to change?A. Up 5% or moreB. Up 1-4%C. Little or no changeD. Down 1-4 %E. Down 5% or more
I06-28

What Can You Do?
• Do nothing• Ramp up risk• Look to alternatives• Something else?
I06-29

Do Nothing
• Not as crazy as it sounds• Capital market expectations: 5-10 year
horizon• Assumed rates of return: 30+ year horizon• Can you wait it out?
I06-30

Can You Afford to Do Nothing?
If you underperform, you can regain lost ground
Model assumes liabilities have initial present value of $100 and grow at 7.5% actuarial rate of return. | Assets have an initial value of $100 and grow at 7.5% actuarial rate of return. | New Scenario assets grow at 6% in years 1-10 and 9% in years 11-20
I06-31

Can You Afford to Do Nothing?
Being underfunded doesn’t change much (impact of 75% funded ratio)
Model assumes liabilities have initial present value of $100 and grow at 7.5% Actuarial Rate of Return. | Assets have an initial value of $75 and grow at 7.5% Actuarial Rate of Return. | New Scenario assets grow at 6% in years 1-10 and 9% in years 11-20.
I06-32

Can You Afford to Do Nothing?But plan outflows do (impact of 3% annual net outflow)
Model assumes liabilities have initial present value of $100 and grow at 7.5% Actuarial Rate of Return. | Assets have an initial value of $75 and grow at 7.5% Actuarial Rate of Return. | New Scenario assets grow at 6% in years 1-10 and 9% in years 11-20.Benefit outflow equal to 3% of liabilities every year.
I06-33

Do Nothing?
• Depends on your starting point• Avoids the risk of bad decisions/overreaction• Runs the risk of digging a deeper hole• What if rates stay lower for even longer?
I06-34
Ramp Up Risk
• One way to pursue returns: take more risk• Typically means selling bonds to buy stocks• General concern: taking more risk means
taking more risk• Specific concern: is this the moment to add
to stocks?• Overarching point: we are typically talking about
a lot more stocks
I06-35

Consultant Capital Market Expectations
Stocks 7.0%
Bonds 3.0%
Getting a 7.5% Return—IMPOSSIBLE
Average return expectations were sourced from eight major investment consultants. Available estimates for each asset class were averaged after removing the highest and lowest estimates. Source: Wellington Management | Data as of August 2016
I06-36
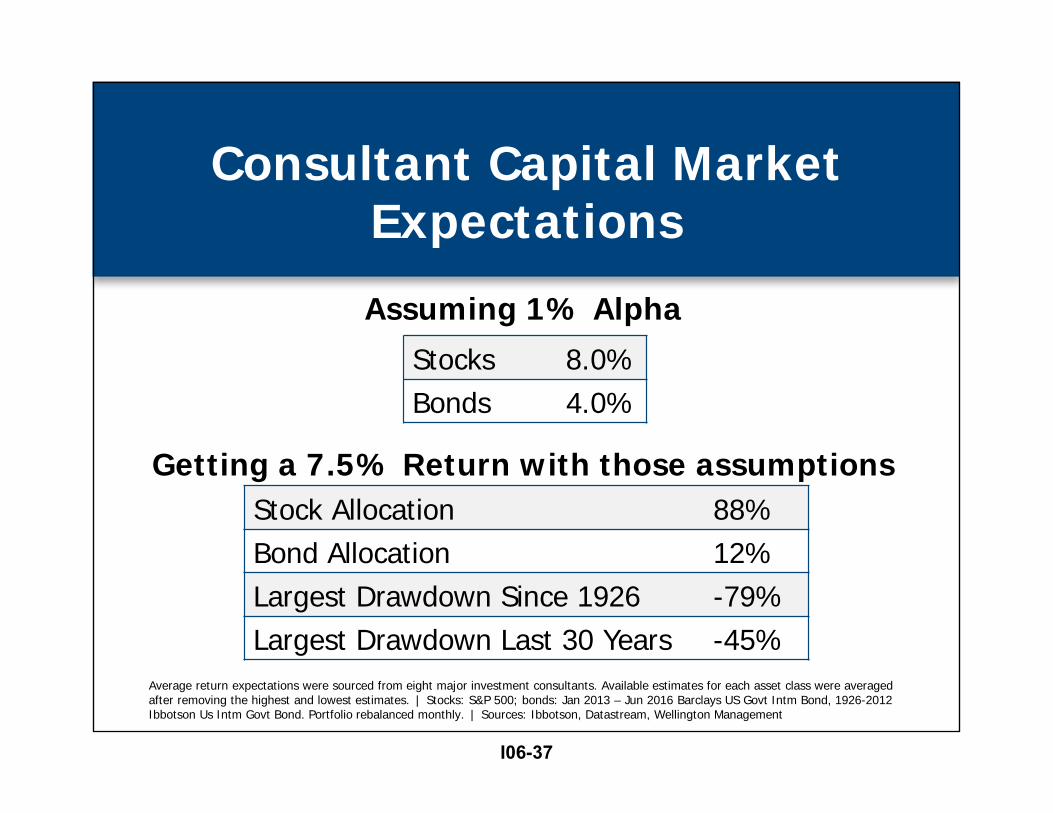
Consultant Capital Market Expectations
Stocks 8.0%Bonds 4.0%
Assuming 1% Alpha
Getting a 7.5% Return with those assumptionsStock Allocation 88%Bond Allocation 12%Largest Drawdown Since 1926 -79%Largest Drawdown Last 30 Years -45%
Average return expectations were sourced from eight major investment consultants. Available estimates for each asset class were averaged after removing the highest and lowest estimates. | Stocks: S&P 500; bonds: Jan 2013 – Jun 2016 Barclays US Govt Intm Bond, 1926-2012 Ibbotson Us Intm Govt Bond. Portfolio rebalanced monthly. | Sources: Ibbotson, Datastream, Wellington Management
I06-37

Ramp Up Risk?
Why we would be cautious• We’re well into bull market and valuations
are high• Adding risk likely means giving up diversification• Wide range of possible market outcomes
today—hard to bet on just one• Analogy of “reaching for yield” is a warning sign
I06-38

Alternatives as a Potential Answer
• Strong historical returns• Potentially more risk, but with
diversification benefit• “Good enough for Yale”• Lots of potential opportunities to get in
I06-39

Alternatives: Tread cautiously
• More crowded than they were historically• Often less diversifying than investors expect• Challenges of liquidity, transparency,
and complexity• “Sticker shock” of prices can be an issue
for some
I06-40

The 1990s were a tough act to followGrowth of US$100 in HFRI Fund-Weighted Composite Index, with annualized returns every five years, December 1990-December 2015
Source: Hedge Fund Research
Alternatives: Tread cautiously
I06-41

Alternatives: Tread cautiously
Concerns in today’s market• Private equity: missing the full cost and
liquidity impact• Real estate: with valuations high, returns
could be low• Real assets: looks appealing, but recent performance is
a potential obstacle for some• Hedge funds: fees and complexity can make
it hard to have conviction
I06-42

Alternatives: Not the Whole Answer
Good • Potentially attractive
risk/return• Absolute-return focus• Diversifying
Bad • Illiquid• Opaque• Expensive
I06-43

What Can You Do?
A “stepping-stone” approach
I06-44

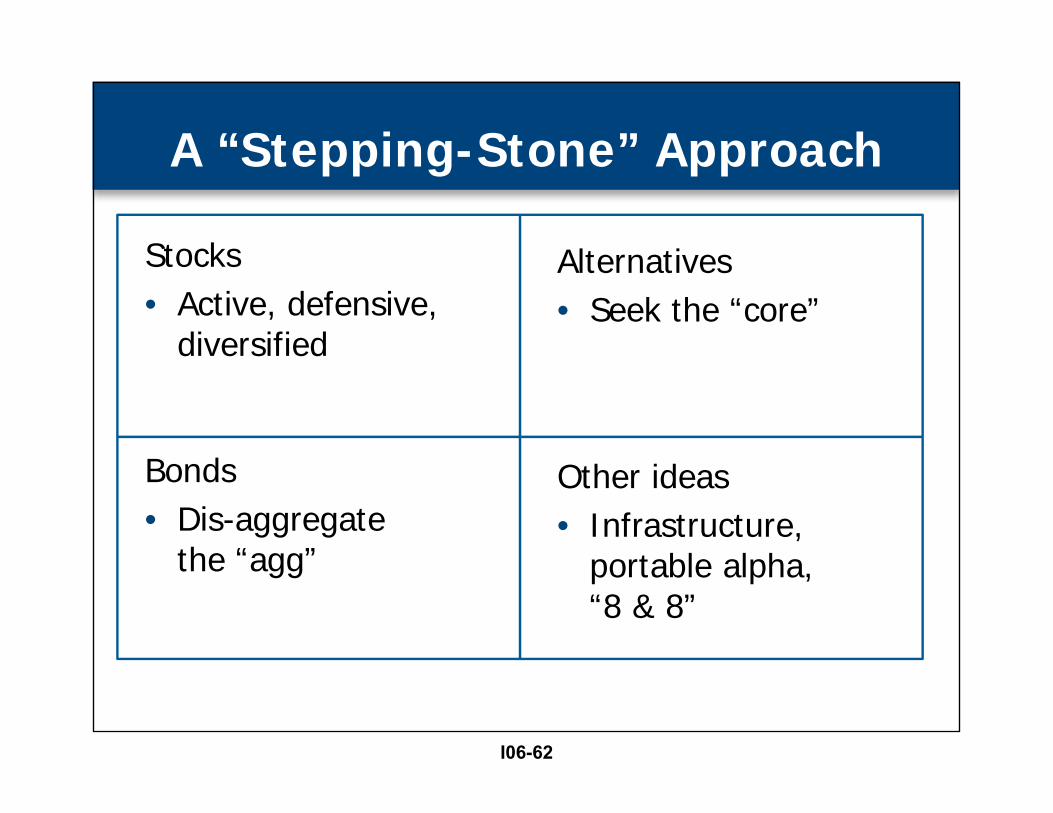
A “Stepping-Stone” Approach
Stocks• Active, defensive,
diversified
Bonds• Dis-aggregate
the “agg”
Alternatives• Seek the “core”
Other ideas• Infrastructure,
portable alpha, “8 & 8”
I06-45

Stocks: Seek to Get More Active
• The medium-term outlook for many risk assets is below-average
• The medium-term outlook for active management may be at (or even above) average
• This implies a potential tactical opportunity to shift risk at the margin towards active
But: asset managers can often promise to help solve return problems—be cautious!
I06-46

Stocks: Potential Ways to Get More Active
• Look beyond the style box• Pay more attention to active share and turnover• Avoid the hamster wheel of hiring and firing• Seek arrangements that align incentives
I06-47

Stocks: Beyond the Style Box
Style box model
Value Core GrowthLarge Large cap
valueLarge cap core
Large cap growth
Mid Mid cap value
Mid cap core
Mid cap growth
Small Small cap value
Small cap core
Small cap growth
Factor/style model
Contrarian
Liquidity
Value
Growth
Size
Momentum
Quality
Volatility
I06-48

Stocks: Seek to Play Defense
Source: Wellington Management | Period analyzed from January 1995 through 30 June 2016 based on monthly returns. The 95%/85% strategy is for illustrative purposes only, and is not representative of an actual account managed by Wellington Management. Hypothetical returns were calculated with monthly S&P 500 Index returns. Each positive monthly return was multiplied by 0.95 and each negative monthly return by 0.85. The resulting monthly return stream was then used to calculate hypothetical performance and characteristics for the 95%/85% strategy. | PAST RESULTS ARE NOT NECESSARILY INDICATIVE OF FUTURE RESULTS. This strategy is hypothetical and is not offered by Wellington Management.
95% upside/85% downside vs. the S&P 500 past 80 years—growth of $1
Relative performance of 95% upside participation/85% downside participation strategy in bull and bear markets vs the S&P 500
I06-49

Stocks: Seek to Play Defense
Multiple approaches to “defensive”• Low volatility• Steady cash flow compounders• High quality—growth or value• Managed volatility
I06-50
Bonds: Dis-Aggregate the Agg
Bonds can play multiple roles in a portfolio• Liquidity• Less volatility/steadier ride• Predictable income• Diversification from stocks• Attractive total return
One of these things is not like the others . . .
I06-51

Bonds: Dis-Aggregate the Agg
Bonds can play multiple roles in a portfolio• Liquidity• Less volatility/steadier ride• Predictable income• Diversification from stocks• Attractive total return
One of these things is not like the others . . .
I06-52

Bonds: Dis-Aggregate the Agg
Source: Bloomberg and Barclays as of 31 August 2016 | All data is Barclays except JPMorgan EMB+ for EMD | 99% = wide spread
Current yield-to-
worst (%)
Current spread (bps)
Percentile vs history
(%)Emerging Market Debt (0.4) 5.2 350 39High Yield (1.3) 6.3 490 53
Securitized (5.5) 2.0 18 0
Corporates (2.8) 2.8 135 57
Government-related (1.5) 2.0 74 84
Treasury (6.7) 1.3 0 56
Market cap ($ tril)
Core Plus sectors
Barclays Aggsectors
I06-53

Bonds: Where to Seek Return
• High yield• Bank loans• Emerging market debt• Multi-sector approaches• Absolute-return approaches
I06-54

Alternatives: Seek the “Core”
Strategies that are• Liquid• Transparent• Low-cost• Scale-able• Relatively simple
I06-55

Alternatives: Why?
What makes alternatives “different”?• Explicit capital-preservation objective• Focus on risk management• “Go-anywhere” investment set• Flexibility to hold less-liquid securities• No benchmark—able to hold
concentrated positions• Combination of long and short exposures• Ability to use leverage
I06-56

Alternatives: Why?
Limit volatility of stock exposure
Limit volatility of stock exposure
Improve overall diversification
Outperform stocks
Hedgedequities
Bondalternatives
Alternative exposures
High risk/High return
Investment objective
I06-57

Alternatives: Seek the “core”
For illustrative purposes only. | There can be no assurance the characteristics described will appear in all satellite strategies.
Core alternatives
Satellite
Satellite
Satellite
Satellite
Satellite
Satellite
Satellite
Satellite
Core alternative characteristics• Transparent• Liquid• Less expensive• Scalable• Simpler
Potential satellite characteristics• Higher risk/return• Less correlation• Less liquid• More complex• Differentiated return source• Higher fee• Harder to access
Core alternatives
I06-58

Other Ideas: Infrastructure
Examples of US government structures include highways and streets, educational structures, other transportation structures, office buildings, water and sewer structures, power facilities, healthcare facilities, recreation and amusement facilities, residential facilities, military facilities, and others | Sources: BEA, Bloomberg, Wellington Management
Historical illustration: U.S. gross government investment in structures as a % of GDP, 1947-2014
I06-59

Other Ideas: Portable Alpha
1Annualized return five years ended 31 December 2015 of 20 year STRIPS | 2Total gross performance of DAS Plus Beta – Long Duration 20 Year less the performance of the synthetic bond beta | PAST RESULTS ARE NOT NECESSARILY INDICATIVE OF FUTURE RESULTS. There can be no assurance nor should it be assumed that future investment performance of any strategy will conform to any performance examples set forth in this material or that the portfolio’s underlying investments will be able to avoid losses. The investment results and any portfolio compositions set forth in this material are provided for illustrative purposes only and may not be indicative of the future investment results or future portfolio composition. The composition, size of, and risks associated with an investment in the strategy may differ substantially from the examples set forth in this material. An investment can lose value.
Example: DAS 20-yr (%) Portable alpha approach• Pair long market beta with
liquid market neutral absolute return strategy
Lessons learned• Beware of beta disguised
as alpha• Maintain balance between
beta and alpha volatility• Look out for hidden costs• Focus on counterparty risk• Avoid behavioral biases in
alpha selection
I06-60

Other Ideas: “8 & 8” Strategies
Desire for upsidePlans seeking to meet actuarial return assumptions of ~8% in a low return environmentFear of downsideMany concerned about market volatility, macro uncertainty, and big fund drawdownsStrategies that target ~8% return with ~8% volatility can potentially meet both goals
Market exposureOften better-balanced, dynamic, quality-focused
Active managementMay be implemented long-short
Risk managementTypically a key part of investment process
Opportunity setCan be wide and flexible
Toolkit for “8 & 8” strategies
I06-61
A “Stepping-Stone” Approach
Stocks• Active, defensive,
diversified
Bonds• Dis-aggregate
the “agg”
Alternatives• Seek the “core”
Other ideas• Infrastructure,
portable alpha, “8 & 8”
I06-62

Which Stepping Stones?
Seek “stepping stones” that are . . .• In synch with the organization’s beliefs• Consistent with board priorities• Connected to investment history• Associated with staff and/or consultant’s expertise
So that they can be . . .• Tied in to overall investment strategy• Held with conviction• Explained to constituents
I06-63

Communication
How• Clear• Simple• Honest• Humble• Transparent
What• The markets are not a
machine• The current environment
is challenging• Our levers are limited• These are our beliefs
about the markets• This is the forward course
we are plotting• This is how we think about
long- and short-term
I06-64

62nd Annual Employee Benefits ConferenceNovember 13-16, 2016Orlando, Florida
Session #I06
Strategies for Long-Term Return in a Low-Return Environment
• “Do what you can with what you’ve got where you are.”
• Many plans are starting from a tough spot• All you have to work with is policy—but
underneath are many possible tools• Be cautious about doing too much, but
wary of doing nothing• Find the tools that are right for your plan• Communicate clearly why you are
using them
I06-65

2017 Educational ProgramsInvestments
63rd Annual Employee Benefits Conference October 22-25, 2017 Las Vegas, Nevadawww.ifebp.org/usannual
Investments InstituteMarch 13-15, 2017 Phoenix, Arizonawww.ifebp.org/investments
Portfolio Concepts and ManagementMay 1-4, 2017 Philadelphia, Pennsylvaniawww.ifebp.org/wharton
Related ReadingVisit one of the on-site Bookstore locations or see www.ifebp.org/bookstore for more books.
The Tools & Techniques of Investment Planning, 3rd EditionItem #9029www.ifebp.org/books.asp?9029
816
I06-66