Embed Size (px)
Citation preview
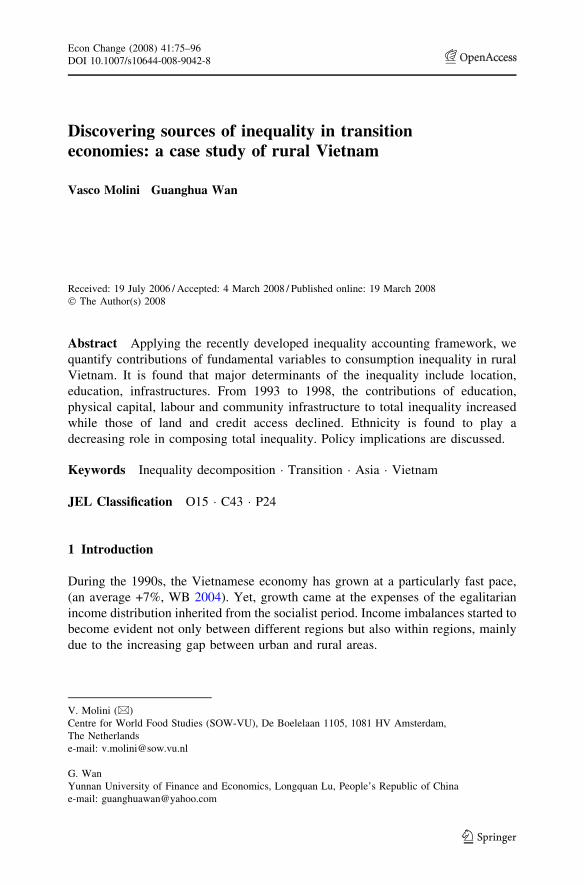
Discovering sources of inequality in transitioneconomies: a case study of rural Vietnam
Vasco Molini Æ Guanghua Wan
Received: 19 July 2006 / Accepted: 4 March 2008 / Published online: 19 March 2008
� The Author(s) 2008
Abstract Applying the recently developed inequality accounting framework, we
quantify contributions of fundamental variables to consumption inequality in rural
Vietnam. It is found that major determinants of the inequality include location,
education, infrastructures. From 1993 to 1998, the contributions of education,
physical capital, labour and community infrastructure to total inequality increased
while those of land and credit access declined. Ethnicity is found to play a
decreasing role in composing total inequality. Policy implications are discussed.
Keywords Inequality decomposition � Transition � Asia � Vietnam
JEL Classification O15 � C43 � P24
1 Introduction
During the 1990s, the Vietnamese economy has grown at a particularly fast pace,
(an average +7%, WB 2004). Yet, growth came at the expenses of the egalitarian
income distribution inherited from the socialist period. Income imbalances started to
become evident not only between different regions but also within regions, mainly
due to the increasing gap between urban and rural areas.
V. Molini (&)
Centre for World Food Studies (SOW-VU), De Boelelaan 1105, 1081 HV Amsterdam,
The Netherlands
e-mail: [email protected]
G. Wan
Yunnan University of Finance and Economics, Longquan Lu, People’s Republic of China
e-mail: [email protected]
123
Econ Change (2008) 41:75–96
DOI 10.1007/s10644-008-9042-8
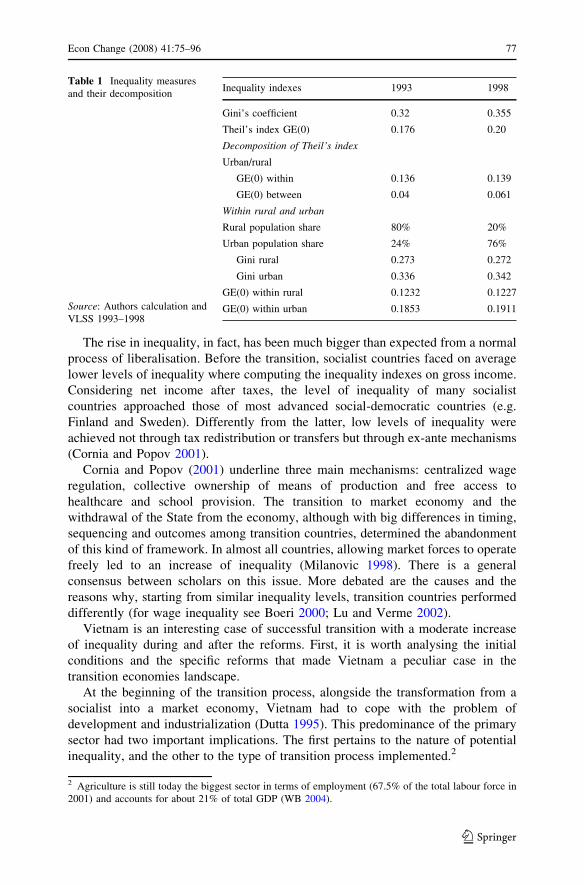
By contrast, in the same period the income inequality in rural areas remained
substantially unmodified (see Table 1). While the increasing urban rural gap has
attracted the attention of many scholars (Glewwe et al. 2002; Baulch and Minot 2004
inter alia), the issue of stability of income distribution in rural areas has been less
analyzed, although almost 80% of the population was residing there during the 1990s.1
In particular, a part for few exceptions (Benjamin and Brandt 2004), it has been
overlooked the nexus between key reforms like the de-collectivization of land and the
liberalization of crop markets and their ultimate impact on the income distribution.
The aim of this paper is precisely filling this gap. We plan to investigate the
sources of rural inequality and quantify their contributions. Next, through an inter-
temporal comparison between the two available surveys (1993–1998), we try to
interpret the modification of income inequality determinants. The so-conducted
analysis, besides the validity on its own, it is useful to both foresee future trends and
provide useful insights to policy makers. In the first case, once the main
determinants are identified and quantified, it becomes easier predicting likely
changes in the overall inequality. In the second case, a quantitative analysis on
inequality determinants might be used in deciding the tools and the targets for
redistributive policies. For example, government can better justify infrastructure
investments in poor regions if location is found to be dis-equalising and contributing
for a significant amount to total inequality.
The analytical method used in this paper is a combination of regression-based
decomposition of Wan (2004) with the Shapley’s value technique of Shorrocks
(1999, Unpublished Manuscript). Regression-based decomposition was initiated by
Oaxaca (1973) and Blinder (1973), which has been largely used to analyze
discrimination in the labour market. The Shapley’s value technique is based on
cooperative game theory and is a general decomposition framework which can be
used in contexts other than inequality decomposition. This combination introduces
flexibility in the specification of the underlying income or consumption function and
in the choice of inequality measures.
The paper is organised as follows. Sections 2–4 provide a general overview on
initial conditions, economic reforms and income distribution of Vietnam from late
1980s to the 1990s. In Sect. 5, we present the Shapley’s value decomposition and
the data used while in Sects. 6 and 7 are discussed the econometric and the
decomposition results, respectively. Section 8 concludes.
2 Transition and inequality: the initial conditions
The process of transition has been widely analysed since the collapse of the Soviet
block (Lavigne 1999; Roland 2000 inter alia). In particular, after the dramatic
increase of inequality in most of the former socialist countries, the nexus between
transition and inequality has been studied in depth (Cornia and Popov 2001;
Flemming and Micklewright 1999; Milanovic 1995, 1998).
1 According to the World Bank (2004), the rural population accounted in 2003 to 74% of the total
population.
76 Econ Change (2008) 41:75–96
123
The rise in inequality, in fact, has been much bigger than expected from a normal
process of liberalisation. Before the transition, socialist countries faced on average
lower levels of inequality where computing the inequality indexes on gross income.
Considering net income after taxes, the level of inequality of many socialist
countries approached those of most advanced social-democratic countries (e.g.
Finland and Sweden). Differently from the latter, low levels of inequality were
achieved not through tax redistribution or transfers but through ex-ante mechanisms
(Cornia and Popov 2001).
Cornia and Popov (2001) underline three main mechanisms: centralized wage
regulation, collective ownership of means of production and free access to
healthcare and school provision. The transition to market economy and the
withdrawal of the State from the economy, although with big differences in timing,
sequencing and outcomes among transition countries, determined the abandonment
of this kind of framework. In almost all countries, allowing market forces to operate
freely led to an increase of inequality (Milanovic 1998). There is a general
consensus between scholars on this issue. More debated are the causes and the
reasons why, starting from similar inequality levels, transition countries performed
differently (for wage inequality see Boeri 2000; Lu and Verme 2002).
Vietnam is an interesting case of successful transition with a moderate increase
of inequality during and after the reforms. First, it is worth analysing the initial
conditions and the specific reforms that made Vietnam a peculiar case in the
transition economies landscape.
At the beginning of the transition process, alongside the transformation from a
socialist into a market economy, Vietnam had to cope with the problem of
development and industrialization (Dutta 1995). This predominance of the primary
sector had two important implications. The first pertains to the nature of potential
inequality, and the other to the type of transition process implemented.2
Table 1 Inequality measures
and their decomposition
Source: Authors calculation and
VLSS 1993–1998
Inequality indexes 1993 1998
Gini’s coefficient 0.32 0.355
Theil’s index GE(0) 0.176 0.20
Decomposition of Theil’s index
Urban/rural
GE(0) within 0.136 0.139
GE(0) between 0.04 0.061
Within rural and urban
Rural population share 80% 20%
Urban population share 24% 76%
Gini rural 0.273 0.272
Gini urban 0.336 0.342
GE(0) within rural 0.1232 0.1227
GE(0) within urban 0.1853 0.1911
2 Agriculture is still today the biggest sector in terms of employment (67.5% of the total labour force in
2001) and accounts for about 21% of total GDP (WB 2004).
Econ Change (2008) 41:75–96 77
123
In a less industrialized country, land concentration is one of the main
determinants of income distribution. A fair land distribution has a positive effect
on this latter and preserves social stability too, a crucial element to determine
investment propensity. Alesina and Perotti (1996) use this argument to explain
different performance of Latin American and East Asian countries. Having
implemented egalitarian land reforms after the Second World War, Taiwan and
South Korea achieved the maintenance of a level of socio-political stability.
Conversely, the inability of Latin America to reducing land concentration,
protracted until now an unfair distribution of assets generating strong income
inequality and compromised their growth performance through a continuous social
instability.
The way de-collectivisation has been implemented in Vietnam during early
1990s (Sect. 3), strongly affected income distribution during 1990s and will
probably do it for a long period. The limited importance of manufacturing and
services before the reforms, conditioned the pattern of reforms too.
In contrast to the other transition economies, during the transition to a market
economy Vietnam (and China) did not experience a collapse of the GDP protracted
for a long period and a mass increase of unemployment: GDP’s growth simply
decelerated to 5% during 1990–1991. Once macroeconomic stabilization was
achieved in early 1990s (Dutta 1995), growth accelerated again averaging 9% over
1992–1995. Because of this high growth and initial reforms of the tax system, tax
revenue increased rapidly after 1991. The government was therefore able to restore
the investment and social expenditures cut during the austerity period (1986–1989).
According to various authors, a low level of economic development (low-level
capital/output ratios, Cornia and Popov 2001) or less economic complexity
(Blanchard and Kremer 1997; Roland 2000) might have given an advantage to these
economies. This because the resources to be reallocated from declining sectors to
expanding ones were smaller and so was the level of distortion. In the case of
Blanchard and Kremer’s model, in more complex economies, a bigger output fall
occurs due to disorganisation of production linkages and the greater difficulties met
in reconstructing them when several actors participate in the production chain and
asymmetric information is widespread.
Vietnam entered the process of transition with a low level of capital
accumulation, limited importance placed on the state controlled industrial sector
and with land still representing one of the most important asset for most of the
households (Kerkvliet and Selden 1998). This gave the country indubitable
advantages in terms of speed and costs of transition while on the other side, made
the de-collectivisation in the agriculture a much more crucial reform than in other
more industrialised transition economies.
3 The reforms: 1986–1998
One of the main consequences of the reform process (Doi Moi) introduced by the
6th Congress of the Communist party in 1986 was the general acceptance of the
failure of collectivisation in both agricultural and industrial sector. In 1988, the
78 Econ Change (2008) 41:75–96
123
government issued the Resolution 10, which contained the guidelines for the de-
collectivisation of agriculture. Given the fact that about 80% of the population was
living at that time in rural areas, this and the crop market liberalisation represented
the most important reform for household economy.
According to various authors, (Luong and Unger 1998; Ravallion and Van der
Walle 2001, 2003) distribution of farmland to families was carried out in a relatively
fair way. The national leadership, in order to maintain socio-political stability,
assigned the plots of land among the villagers on a strictly egalitarian way and only
a small number of plots were assigned through auctions.
Villagers received the usufruct on the land for 20 years for annual crops and 50
for perennial. While favouring the long-term distribution of use rights, many
preferred periodic redistribution in order to maintain equity, a pattern in use in pre-
revolution village practice. During the period of tenure they could transfer, lend or
rent out the use right (Kerkliviet and Selden 1998).
Land concentration was strongly discouraged. The law allowed up to four
hectares of annually cropped land per household and local authorities had the option
to reduce the size by redistributing the excess. After and distribution, local
authorities gave away, sold or contracted capital, draft animals and sideline
enterprises to small farmers.
Jointly with the land de-collectivisation, the Vietnamese government started a
progressive liberalization of crops markets. The contract system requiring farmers to
sell a large part of their output to the state at a low price was replaced with a more
market-oriented mechanism. Crop markets and inputs markets were fully liberalised
but the State kept the control on export and the marketisation between North and
South (Ghosh and Whalley 2004). According to Ghosh and Whalley (2004) the
impact of policy reforms resulted in a massive increase in production of rice, maize
sweet potatoes and cassava. This was the combined outcome of an expansion in the
area cultivated, the more efficient use of chemical fertilizers and in the adoption for
rice cropping of more productive methods of cultivation such as the conversion of
deep water rice cultivation area to double cropped irrigated rice.
The consequence of these reforms was an increase in income level of rural
households. The price liberalisation and land reform fostered the demand of
internally produced goods (construction sector products, tools, bicycles, etc.)
avoiding an output fall. Furthermore, the gradual price liberalisation created new
incentives for farmers and producers of internally consumed goods. The increase in
rural household income supported the buoyant growth of the domestic sector
(manufacturing and services) and induced domestic producers to substitute
previously imported products (Jansen 2002).
This was possible not only thanks to the gradual character of the reform process,
but also because the agriculture was not so heavily characterized by the distorted
incentives typical of other socialist economies (Lavigne 1999). Differently from the
Soviet Union’s farms that comprised a huge centralized infrastructure, Vietnamese
communes had relied since early 1980s on the household’s economy and incentives
were similar to those of cooperatives (Kerkvliet and Selden 1998).
Meanwhile, changes in the enterprise laws and the progressive reform in the State
Owned Enterprise (SOEs) sector allowed the development of private firms. Further,
Econ Change (2008) 41:75–96 79
123

reductions in tariff barriers and FDI controls encourage trade and the inflow of
capitals and technology. The reforms have resulted in robust economic growth,
averaging 7.9% during the period 1990–2000 (Glewwe et al. 2002). Even the
financial crisis of 1997 did not affect the Vietnamese economy significantly
although it led to some reductions in FDI originated from Asian countries. In
passing, it is noted that throughout the reform period, employment growth has been
low, particularly in the manufacturing sector. This is partly attributable to the small
share of industrial GDP in Vietnam and partly to the very low elasticity of
employment to output growth in Vietnam (Jenkins and Sen 2002; Tarp et al. 2003).
Meanwhile, the SOEs have been reducing their labour force.
4 Growth and income distribution in Vietnam
The important successes that occurred in the economic growth of Vietnam have
been accompanied by a massive reduction of poverty (from 58.1% in 1993 to 37.4%
in 1998) and by a ‘‘tolerable’’ increase in inequality. The Gini’s index measured on
consumption per capita data increased from 0.32 in 1992–1993 to 0.352 in 1997–
1998. The decomposition analysis between subgroups (rural and urban) with Theil’s
index shows that in 1993 the main contribution to the total inequality is given by the
rural inequality (within rural inequality multiplied by the population share in
Table 1), followed by the urban inequality and between groups inequality. In 1998,
the inequality within groups remains stable and the between group divide increases.
The urban–rural gap, therefore, explains most of the increase in the inequality, while
the within rural and within urban variations are limited (Glewwe 2004 and Table 1).
Is this phenomenon attributable to a dramatic decrease of rural population? When
the urban rural gap increases, one would expect to see increasing migration out of
rural areas (Harris and Todaro 1970). As in general more skilled and young workers
tend to migrate, the outcome should be a decrease of inequality in rural areas and an
increase in urban ones, due to the mass inflow of relatively less skilled and less
remunerated workers. In the long-run, this effect should disappear due to the
increased competition among wages.
Our analysis of Vietnamese household surveys and various contributions (Liu
2001; de Brauwn and Harigaya 2004) found little evidence in this direction.
Excluding those households that have immigrated to urban areas and not registered,
for whom there is no information available, data show only a limited variation in the
urban rural population shares3 (Table 1). De Brauwn and Harigaya (2004), in their
analysis of migration, do not observe many whole families migrating. On the other
hand, they find an increasing role for seasonal migration in the household budget.
The rural households continue to work the land, partially due to the fear of
expropriation, but some members, conscious of higher wages paid in the towns,
move temporary there, without changing their official residence and sending home
their remittances. Thus, if there is a population effect on rural inequality this is
3 If we take in to account that from 1993 to 1998 some previously denominated urban areas have been
reclassified as urban, the share of households that really moved to urban areas might be even smaller.
80 Econ Change (2008) 41:75–96
123
minimal or not measurable with the available data. We should investigate other
potential explanations.
While the increasing rural urban divide (Litchfield and Justino 2003) and the
transformation of labour markets (Liu 2004) received a lot of attention, only few
contributions explicitly tried to interpret the stability in rural inequality during
1990s (Benjamin and Brandt 2004; Liu 2001). In particular, little attention was
given to the relation among reforms (land reform, market liberalisation), govern-
ment intervention (infrastructures provision and incentives to disadvantaged areas)
and income distribution in rural areas.
Benjamin and Brandt (2004) analyse the impact of rice market liberalization on
inequality in rural Vietnam. They show that increased producer prices for rice
primarily benefited the poorer and middle-income farmers. Using the factor
components decomposition (Shorrocks 1982), they analyse the role of different
sources of income (wages, other non-farm revenues, etc.) in determining income
inequality. Although their findings are important in confirming that agricultural
income is not the primary source of income inequality in rural areas (around 26% on
national scale), the analysis is not complete. Their decomposition cannot take into
account the direct contribution on income of many important non-monetary
elements like infrastructure, education, location that in general play an important
role in determining the well being of households.
Using the Oaxaca (1973) methodology, Glewwe et al. (2002) decompose the
change in per capita consumption from 1993 to 1998 into changes in family
characteristics and changes in the returns to these characteristics. The results show
that the increasing gaps are almost completely explained by changes in the returns.
Highly educated people and household heads working in secondary or tertiary
sectors benefited more than others as they experienced substantial increases in the
returns to characteristics. This study focuses on what determine changes in the
average consumption level, not consumption inequality.
Heltberg (2003) proposes a regression-based decomposition using the coefficients
of an earnings function, but he does not focus specifically on rural areas. Considering
rural and urban areas together is difficult. For example is not possible to evaluate the
importance of specific rural factors in the determination of earnings such as land
productivity, capital and some infrastructure variables, available in VLSS only for
rural areas and medium size towns. Another important contribution on inequality is
the paper proposed by Wagstaff et al. (2003) but they focus only on a very specific
dimension of inequality: the malnutrition and the disparity in access to healthcare.
5 Methodology and data
To discover sources of inequality in income or consumption, two analytical
frameworks can be employed. The first is commonly known as decomposition by
population subgroups or by factor components (Shorrocks 1980, 1982). Examples of
the subgroup decomposition include male–female or white-black divides, which
produces what is called within- and between-group contributions. Policy implica-
tions from this kind of decomposition are limited because the contributions cannot
Econ Change (2008) 41:75–96 81
123
be attributed to the dividing variable such as sex or race alone when other variables
such as education and experience are not controlled for (Shorrocks and Wan 2005).
On the other hand, decomposition by factor components is often used to attribute
total income inequality into components associated with wage income, investment
income, and other incomes. These factor incomes are functions of more
fundamental variables such as wealth holding, human capital, family characteristics
and residential location. It is desirable, particularly from policy-maker’s point of
view, to identify contributions by these more fundamental variables.
The second analytical framework—regression based decomposition—was initi-
ated by Oaxaca (1973) and Blinder (1973) and extended by Juhn et al. (1993) and
Wan (2004). A major advantage of this approach is that other variables can be
controlled for thus the contributions of fundamental variables to total inequality can
be isolated with little contamination. Early development of this framework is
restricted in the sense that it only permits decomposition of income or wage
difference between two population groups.
Recent work of Wan (2004) relaxes this limitation and leads to an inequality
accounting technique where inequality of income or consumption can be attributed
to fundamental variables.
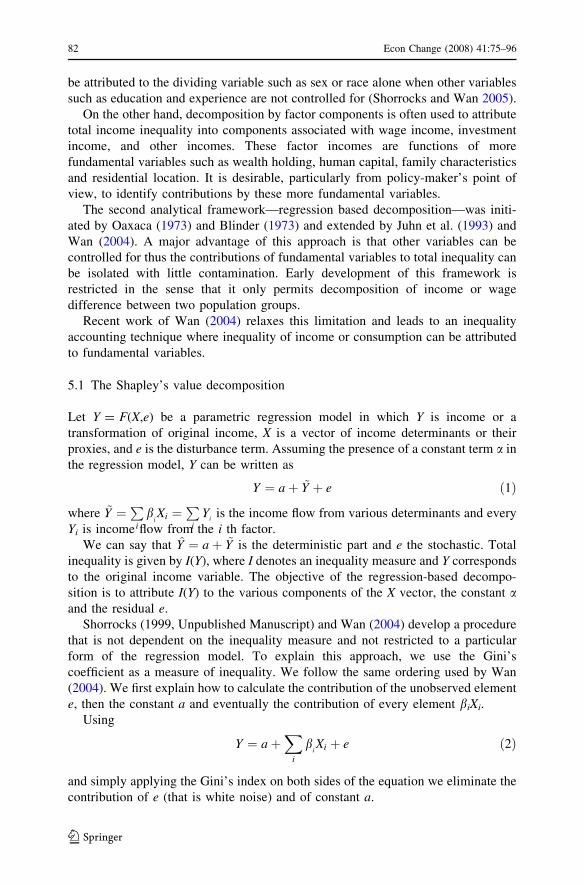
5.1 The Shapley’s value decomposition
Let Y = F(X,e) be a parametric regression model in which Y is income or a
transformation of original income, X is a vector of income determinants or their
proxies, and e is the disturbance term. Assuming the presence of a constant term a in
the regression model, Y can be written as
Y ¼ aþ ~Y þ e ð1Þ
where ~Y ¼P
i
biXi ¼
P
i
Yi
is the income flow from various determinants and every
Yi is income flow from the i th factor.
We can say that Y ¼ aþ ~Y is the deterministic part and e the stochastic. Total
inequality is given by I(Y), where I denotes an inequality measure and Y corresponds
to the original income variable. The objective of the regression-based decompo-
sition is to attribute I(Y) to the various components of the X vector, the constant aand the residual e.
Shorrocks (1999, Unpublished Manuscript) and Wan (2004) develop a procedure
that is not dependent on the inequality measure and not restricted to a particular
form of the regression model. To explain this approach, we use the Gini’s
coefficient as a measure of inequality. We follow the same ordering used by Wan
(2004). We first explain how to calculate the contribution of the unobserved element
e, then the constant a and eventually the contribution of every element biXi.
Using
Y ¼ aþX
i
biXi þ e ð2Þ
and simply applying the Gini’s index on both sides of the equation we eliminate the
contribution of e (that is white noise) and of constant a.
82 Econ Change (2008) 41:75–96
123

GðYÞ ¼ 0þX
i
EðYiÞ=EðYÞCðYiÞ þ 0 ð3Þ
We know from Wan (2004) that the unobservable does affect the underlying
income density function and thus inequality. Moreover, the Gini’s index declines
(increases) when a positive (negative) constant is added to every income recipient. It
follows that is inappropriate to use Eq. 3 for inequality decomposition because both
these effects are not considered.
To account for the contribution or the residual term, we follow the procedure in
Shorrocks (1999, Unpublished Manuscript) and (Wan 2004) and eliminate e from
Eq. 2. Hence, we have
Yðe ¼ 0Þ ¼ Y ð4ÞGðY je ¼ 0Þ ¼ GðYÞ ð5Þ
The contribution of e to G(Y) is defined as
COe ¼ GðYÞ � GðYÞ ð6ÞDespite the fact that the expected values of Y and Y are identical, G(Y) and G Y
� �
can be written as:
GðYÞ ¼X
i
EðYiÞ=EðYÞCðYiÞjrank byY ð7Þ
GðYÞ ¼X
i
EðYiÞ=EðYÞCðYÞjrank byY ð8Þ
The only difference between (7) and (8) is the ranking of Yi in calculating C(Yi),
the concentration index. Having identified the contribution of the residual to total
inequality, we turn to the identification of the contribution of the constant term.
Using the deterministic part Y ¼ ~Y þ a and applying Gini
GðYja ¼ 0Þ ¼ Gð ~YÞ ¼X
i
ðEðYiÞ=Eð ~YÞÞCðYiÞjrank byY or ~Y ð9Þ
it follows that the contribution of the constant term can be defined as
COa ¼ GðYÞ � Gð ~YÞ ð10ÞFinally, the contributions of the various terms in the vector X is given as
CO ~Y ¼ Gð ~YÞ ¼X
i
ðEðYiÞ=Eð ~YÞÞCðYiÞjrank byY or ~Y ð11Þ
where COi ¼ EðYiÞ=Eð ~YÞÞCðYiÞjrank byY or ~Y is the contribution of the i th variable.
In general, a contribution is interpreted to measure the effect on total inequality
if a particular variable or income source is eliminated. Elimination could mean
either removal or assuming an even distribution of the relevant variable among all
income recipients. If inequality increases (decreases), this source or variable
makes a negative (positive) contribution and it is inequality-reducing (inequality-
increasing).
Econ Change (2008) 41:75–96 83
123
The procedure, although simple to be programmed,4 is extremely time-
consuming the more the number of variables to be considered increases. Given
the limited capacity of our computers to complete the calculations in a reasonable
amount of time, we opted to reduce the number of variables passing from the
estimation model to the decomposition and aggregated the variables into macro
classes showing homogeneous characteristics (for details see Sect. 7).
5.2 The econometric model
In this paper, inequality of consumption expenditure rather than income is analysed.
As argued elsewhere consumption is considered a better measure of human well-
being. Also, relative to the income variable, consumption shows less volatility as it
is not so vulnerable to idiosyncratic shocks. According to Deaton (1997),
consumption data are less influenced by measurement errors, particularly for rural
households.
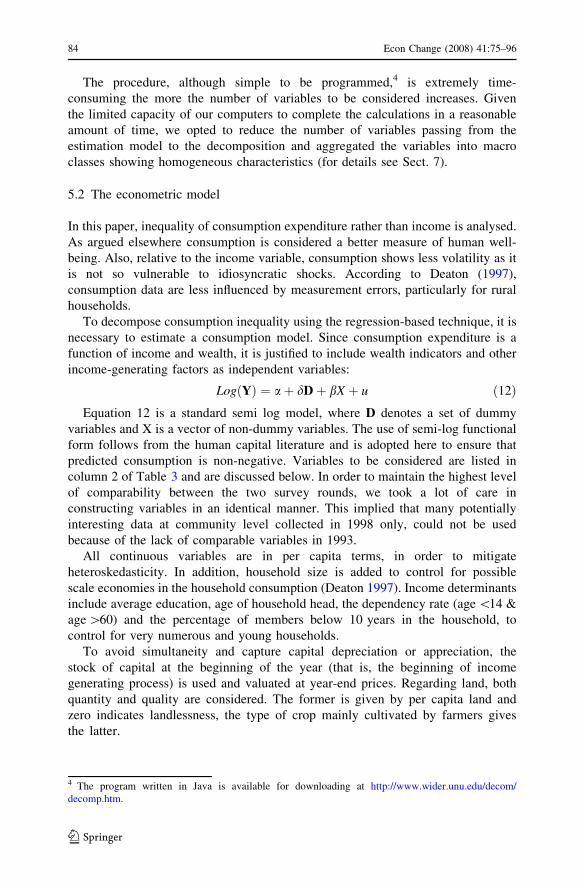
To decompose consumption inequality using the regression-based technique, it is
necessary to estimate a consumption model. Since consumption expenditure is a
function of income and wealth, it is justified to include wealth indicators and other
income-generating factors as independent variables:
LogðYÞ ¼ aþ dDþ bX þ u ð12ÞEquation 12 is a standard semi log model, where D denotes a set of dummy
variables and X is a vector of non-dummy variables. The use of semi-log functional
form follows from the human capital literature and is adopted here to ensure that
predicted consumption is non-negative. Variables to be considered are listed in
column 2 of Table 3 and are discussed below. In order to maintain the highest level
of comparability between the two survey rounds, we took a lot of care in
constructing variables in an identical manner. This implied that many potentially
interesting data at community level collected in 1998 only, could not be used
because of the lack of comparable variables in 1993.
All continuous variables are in per capita terms, in order to mitigate
heteroskedasticity. In addition, household size is added to control for possible
scale economies in the household consumption (Deaton 1997). Income determinants
include average education, age of household head, the dependency rate (age \14 &
age [60) and the percentage of members below 10 years in the household, to
control for very numerous and young households.
To avoid simultaneity and capture capital depreciation or appreciation, the
stock of capital at the beginning of the year (that is, the beginning of income
generating process) is used and valuated at year-end prices. Regarding land, both
quantity and quality are considered. The former is given by per capita land and
zero indicates landlessness, the type of crop mainly cultivated by farmers gives
the latter.
4 The program written in Java is available for downloading at http://www.wider.unu.edu/decom/
decomp.htm.
84 Econ Change (2008) 41:75–96
123
We included these dummies in order to investigate the role of crop diversification
on income. Our insight is that households achieving to cultivate tradable crops, if
the market conditions are favourable, tend to be better off than household that limits
themselves to rice auto-production or to other cereals auto-production (grains, etc.).
Also, the movement out of rice might suggest the increasing importance in that area
of rice/food markets which permits some farmers to stop growing their own food,
shifting to a more remunerative cropping pattern (Benjamin and Brandt 2004). Non-
farming employment opportunities help household to diversify income sources and
mitigate income risks. This is represented by the proportions of employed in
secondary and tertiary sector in the household labour force.
In addition, we included a dummy for ethnicity to control for discrimination and
social exclusion that characterise some ethnic groups (Glewwe et al. 2002). In this
case we did not consider the Chinese minority to be included in ethnic minorities.
First, because very few members of the Chinese minority live in rural areas, while
almost all of them are concentrated in towns. Secondly, the Chinese community
shows levels of consumption that are far above the average and is particularly active
in the most dynamic sectors (i.e. trade and services). After a long period of social
exclusion caused by the Vietnam’s bad relationship with China, the treatment of this
group can no longer be labelled discriminatory.
Credit access, defined as the amount of credit transactions in the previous year, is
crucial for consumption smoothing and income generation. Observations are also
available on facilities at the commune level that will be used to capture community
infrastructure effects Community infrastructure is important for income generation
and consumption. Variables used to capture this include presence of sewer system
supply, access to electricity, housing (permanent and semi-permanent) and the
distance from the first healthcare centre. Finally, commune dummy variables are
included in the model to capture location effects.
The data used are extracted from the two waves of the Vietnamese Living
Standard Survey, 1992–1993 and 1997–1998. The sample contains detailed record
on production and consumption for 3,839 (1993) and 4,266 (1998) rural households.
Variables in value terms are deflated by regional price index, thus differences in
price levels across regions are eliminated. The consumption functions for 1993 and
1998 were estimated with heteroskedasticity corrected using the popular procedure
of White (1980). The 1998s model, to keep the sample nationally representative,
was estimated using sampling weights.
6 Econometric results
Tables 2 and 3 presents the mean of the variables and the estimation results,
respectively (location dummy variables are not shown to economize space). Overall,
the fitted models show good R2. All parameters possess the expected signs and most
of them are significantly different from 0 at the 5% level of significance.
Although the magnitudes of some estimates changed from 1993 to 1998, they
maintain the same signs when non-significant estimates are ignored. It is interesting
to note that most of the economic relevant variables not significant in 1993 (dummy
Econ Change (2008) 41:75–96 85
123

for permanent house) or with the wrong sign (crop dummies) became significant or
with the right sign in 1998. This corroborates well with the increasing relevance of
market forces in transitional economies as reform proceeds, making the income-
generating model more accurate in describing the rural economy (as confirmed by
the increase in R square).
Per capita expenditures decrease with the proportion of non-labor force members
in the household, in particular when the household composition is characterized by a
high proportion of children. The dummy for ethnic groups shows that ethnic
minorities are worse-off but there is a decline in the elasticity, suggesting some
improvements. Similar findings are obtained by Heltberg (2003) and Baulch and
Minot (2004). More social-oriented studies (Gunewardena and Van der Walle 2000;
Baulch et al. 2001) while suggesting some improvements during 1990s, confirm the
existence of this discrimination.
Education raises expenditures although the returns are not particularly high.5 It is
interesting to note that in 1998, thanks to a more market-oriented environment, the
return on education increases and the function assumes the expected Mincerian-type
form with declining returns on age (though non-significant). This increasing
Table 2 Variables means
Means 1993 1998
Log of household expenditures per capita 7.34 7.65
Km from 1st health care center 9.48 4.37
Dummy for permanent house 1 = having 0.03 0.09
Dummy for semi-permanent house 1 = having 0.57 0.61
Dummy sewer system, 1 = having 0.47 0.78
Dummy for having electricity 1 = having 0.39 0.72
Household size 4.97 4.80
Proportion of young people in household 0.27 0.23
Dependency rate 0.43 0.40
Household head education in years 5.96 6.31
Household head age in years 44.85 47.18
Dummy for ethnic minority 1 = ethnic minority 0.14 0.16
Proportion of empl. In secondary tertiary sector, in lab force household 0.16 0.24
Value of capital per capita (million dongs) 0.10 0.27
Land for annual and perennial crops per capita (0 = landless) 0.87 0.84
Coffee dummy 1 = having 0.01 0.02
Palm dummy 1 = having 0.04 0.09
Fruit trees dummy 1 = having 0.14 0.17
Industrial crop 1 = having 0.02 0.15
Oth. Crops non rice and non maize 1 = having 0.14 0.10
Credit received during the previous year and invested (million dongs) 0.13 0.46
Source: Authors calculation and VLSS 1993–1998
5 One year of schooling increases only of 2.6% the household income in 1998.
86 Econ Change (2008) 41:75–96
123

Table 3 Estimated consumption functions
Variable group 1993 1998
Infrastructures Km from 1st health care centre -0.0005104 -0.0029483
-0.21 -1.6
Dummy for permanent house 0.00644 0.26876
0.18 10.10**
Dummy for semi-permanent house 0.17357 0.14496
11.53** 9.81**
Dummy sewer system, 1 = have 0.10016 0.1147
6.25** 7.31**
Dummy for having electricity 0.13727 0.12978
7.63** 7.43**
Household structure Household size -0.05145 -0.0709
-12.89** -20.18**
Proportion of young people in household (\10) -0.33184 -0.28925
7.50** 7.28**
Dependency rate -0.07229 -0.08329
-2.02* -2.67**
Education Household head education in years 0.0227754 0.0264582
12.23** 14.70**
Age Household head age in years 0.00646 0.00814
2.17* 2.57*
Square of household head age in years -0.00005 -0.00006
-1.61 -1.88
Ethnicity Dummy for ethnic minority -0.19964 -0.10025
-8.14** -4.39**
Labour opportunities Proportion of empl. In secondary tertiary
sector, in lab force household
0.19679 0.1746
7.12** 8.89**
Capital Value of capital per capita 0.06456 0.0401
2.89** 4.17**
Land Land for annual and perennial crops
per capita
0.05895 0.03636
7.80** 6.28**
Land quality Coffee dummy 0.0727 0.14019
0.7 3.48**
Palm dummy 0.10272 0.04639
3.02** 2.27*
Fruit trees dummy 0.0277 0.00862
1.56 0.53
Industrial crops dummy -0.01644 0.02139
-0.44 1.14
Oth. crops non rice and non maize -0.02808 0.02269
-1.56 1.1
Credit access Credit received during the previous year
and invested
0.12811 0.03235
5.03** 3.48**
Econ Change (2008) 41:75–96 87
123
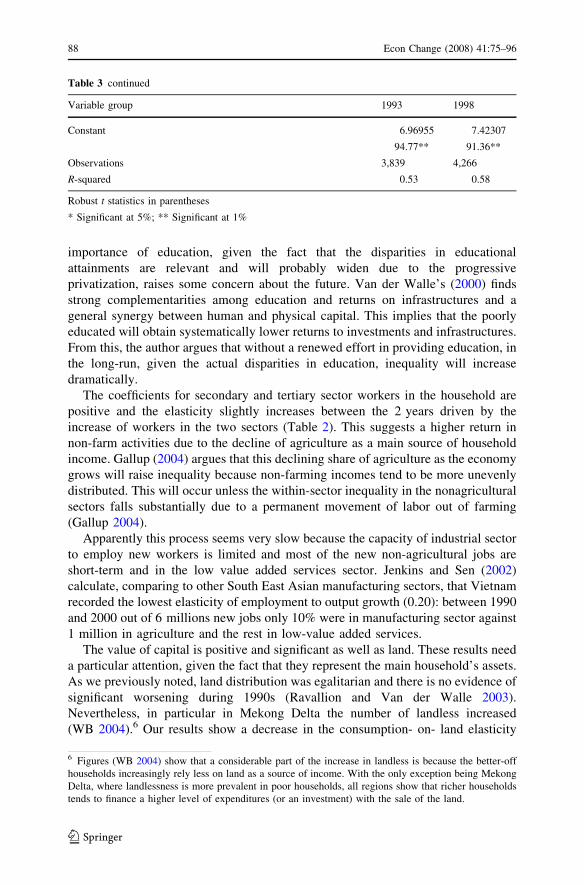
importance of education, given the fact that the disparities in educational
attainments are relevant and will probably widen due to the progressive
privatization, raises some concern about the future. Van der Walle’s (2000) finds
strong complementarities among education and returns on infrastructures and a
general synergy between human and physical capital. This implies that the poorly
educated will obtain systematically lower returns to investments and infrastructures.
From this, the author argues that without a renewed effort in providing education, in
the long-run, given the actual disparities in education, inequality will increase
dramatically.
The coefficients for secondary and tertiary sector workers in the household are
positive and the elasticity slightly increases between the 2 years driven by the
increase of workers in the two sectors (Table 2). This suggests a higher return in
non-farm activities due to the decline of agriculture as a main source of household
income. Gallup (2004) argues that this declining share of agriculture as the economy
grows will raise inequality because non-farming incomes tend to be more unevenly
distributed. This will occur unless the within-sector inequality in the nonagricultural
sectors falls substantially due to a permanent movement of labor out of farming
(Gallup 2004).
Apparently this process seems very slow because the capacity of industrial sector
to employ new workers is limited and most of the new non-agricultural jobs are
short-term and in the low value added services sector. Jenkins and Sen (2002)
calculate, comparing to other South East Asian manufacturing sectors, that Vietnam
recorded the lowest elasticity of employment to output growth (0.20): between 1990
and 2000 out of 6 millions new jobs only 10% were in manufacturing sector against
1 million in agriculture and the rest in low-value added services.
The value of capital is positive and significant as well as land. These results need
a particular attention, given the fact that they represent the main household’s assets.
As we previously noted, land distribution was egalitarian and there is no evidence of
significant worsening during 1990s (Ravallion and Van der Walle 2003).
Nevertheless, in particular in Mekong Delta the number of landless increased
(WB 2004).6 Our results show a decrease in the consumption- on- land elasticity
Table 3 continued
Variable group 1993 1998
Constant 6.96955 7.42307
94.77** 91.36**
Observations 3,839 4,266
R-squared 0.53 0.58
Robust t statistics in parentheses
* Significant at 5%; ** Significant at 1%
6 Figures (WB 2004) show that a considerable part of the increase in landless is because the better-off
households increasingly rely less on land as a source of income. With the only exception being Mekong
Delta, where landlessness is more prevalent in poor households, all regions show that richer households
tends to finance a higher level of expenditures (or an investment) with the sale of the land.
88 Econ Change (2008) 41:75–96
123

between 1993 and 1998, confirming the previously evidenced decline in agriculture
importance and in the land as main asset.
On the other hand, the return on capital significantly increases because of the
slow movement towards mechanization and the increasing demand for it. Due to the
limited size of agricultural plots and the low-cost labour supply, Vietnamese
agriculture is extremely labour intensive and undercapitalised. Until now for
example, mechanical power technologies have not been introduced as extensively as
with other Asian neighbours, especially for land preparation and threshing (Pingali
et al. 1997). Besides the comparative advantage still represented by labour force,
the main obstacle to the mechanisation of agriculture has been the high cost of
capital and limited credit access. However, in the long-run, the combined effect of
rising wages and the liberalization policies surrounding machinery imports will help
alleviate the current bottlenecks.
Moreover, our estimation results show that cropping diversification starts to pay a
higher return the more agriculture produces for export (late 1990s). The dummy for
coffee, a cultivation introduced massively in Central Highlands since 1995,
becomes positive in 1998 thanks to the strong commitment of government to foster
its export and to help resettlement in area where coffee can be grown. The other
crop dummies assume a positive sign in 1998, but only the palm dummy is
significant.
The non-significance of the fruit tree dummies can be explained by the fact that
these crops have been planted only in mid 1990s and, typically, they have three- to-
five lags in revenue generation. These results confirm the findings of Benjamin and
Brandt (2004) on preliminary modifications (with some lags and regional variations)
in the households cropping pattern occurred among 1993 and 1998. Community
facilities are clearly important for improving household well-being as access to
water; to sewage, system and electricity are all positively related to consumption as
well.
Finally, the estimates associated with credit access show an increase in the return
on this variable, suggesting a strong demand for it not yet satisfied by the still
underdeveloped financial system. One of the main problems of rural households in
transition countries is credit and market access (Lavigne 1999). The collapse of state
structure has not automatically been followed by the emergence of a private credit
sector willing to lend to rural households. Furthermore, post-transition bank systems
generally suffer from heavy credit constraints.
In Vietnam, World Bank (2004) observed important improvements during
1990s. Rural households, even the poorest, thanks to micro-finance targeted
programs, have had, for the first time, access to significant set of credit
institutions. Moreover, several communes, with the help of NGOs run savings and
loans schemes. In passing, we notice that the informal sector continues to be of
great importance, accounting for close to 50% of the total micro-credit market.
However, this figure might be biased downward. Although the interest rates
charged by the informal sector were higher, borrowing rates were significantly
higher than in the formal one. In particular, poor households seem to prefer the
informal network and in poor communes, few of them seem to save through a
formal mechanism (WB 2004).
Econ Change (2008) 41:75–96 89
123

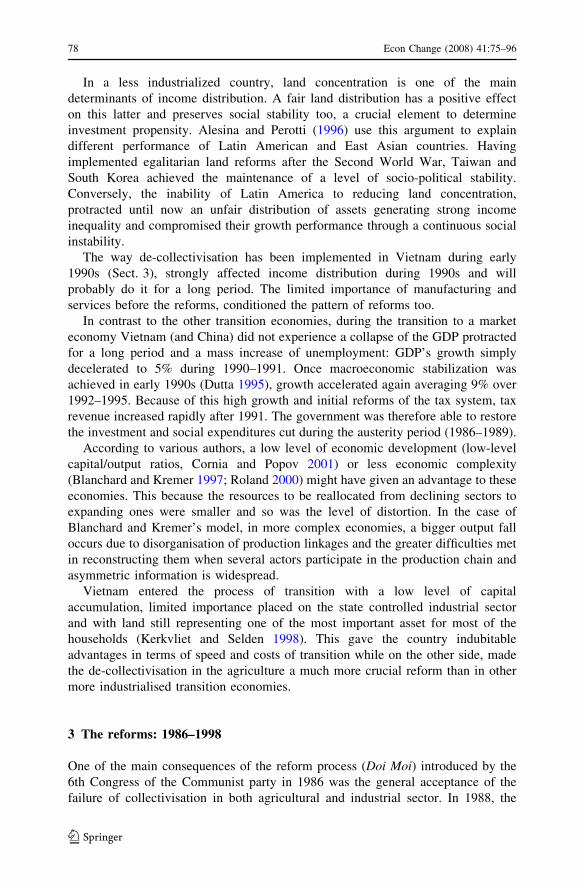
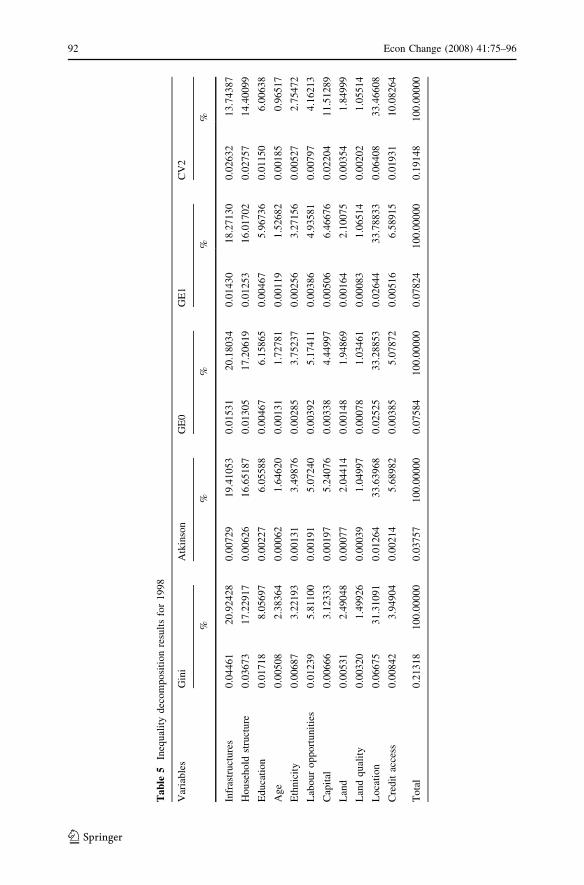
7 Decomposition results
Since the decomposition procedure is computationally demanding, it is necessary to
group some of the terms in the consumption function before running the
decomposition program. The variables multiplied by their coefficient are aggregated
additively in order to arrive to a more treatable number. From about 20 variables,
we obtained 11 groups defined in column 1 of Table 4. Therefore, the consumption
function is rewritten as:
LogðYÞ ¼ aþ Infrastructuresþ Household Structureþ Educationþ Age
þ Ethnicityþ Land þ Capitalþ Labour Opportunitiesþ Land Quality
þ Locationþ Credit Accessþ Residual
ð13Þ
where a is the estimated constant.
Although the decomposition procedure can be applied with any inequality
measure, decomposition results could differ depending on the measure used. Under
such a circumstance, it is common practice to choose one particular indicator when
discussing analytical results. Given its popularity, the Gini’s coefficient will be
employed hereafter in this paper. Results under other measures are presented in
Tables 4 and 5 but will not be discussed.
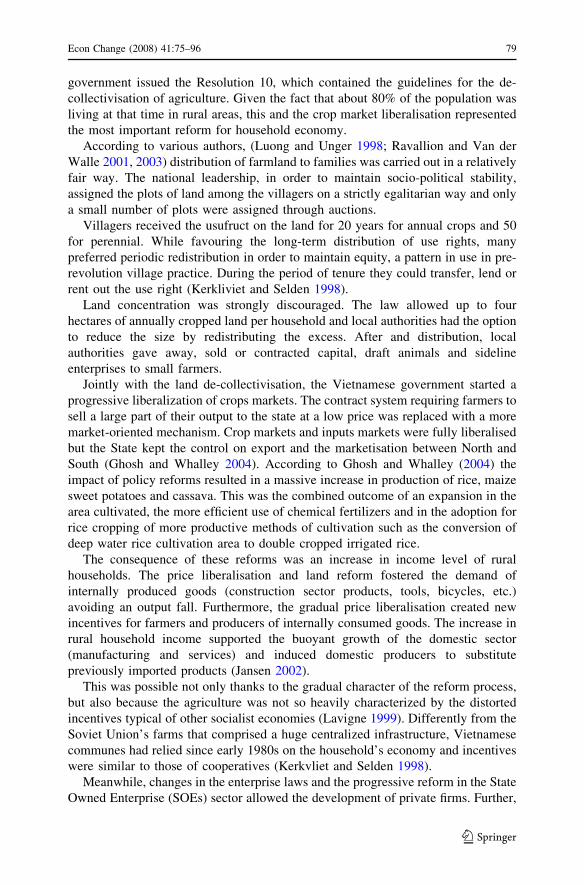
Referring to column 3 of Tables 4 and 5 it is clear that the most important
determinant of inequality in rural Vietnam is location. The importance of location in
economic development is long recognised and is more recently highlighted in the
new economic geography theory. For countries like Vietnam where farmers derive a
considerable amount of income from farming, the location variable must be crucial
as it reflects climatic and geographic conditions. Needless to say, isolated areas are
typically poorer and lag behind in development.
The second most important contributor is community facilities. More interesting
is that the contribution increases from 1993 to 1998. As community facilities are
largely provided by local government, this finding indicates a growing gap in
financial capacities of local governments. Development economists may argue that
community investment should be biased towards the poor but this clearly is not the
case in Vietnam. It is perhaps a unique feature of the transition process that
decentralization weakens or even reverses the redistributive impact of government
or public investment. These results are supported by the public economics literature
that decentralisation may well bring about negative impact on spatial inequality
(Prud’homme 1995).
It is worth analysing together the decline in the contribution of location and the
increase of infrastructures among the 2 years (Tables 4 and 5). We consider this
result not coincidental. Looking at the rates of growth of rural consumption in the
North and South Vietnam7 and among the seven regions there is some evidence of
convergence if we exclude Ho Chi Mihn region performance (Liu 2001). Thus,
7 In North Vietnam we include Northern Uplands, Red River Delta, Northern Coastal, in South Southern
Coastal, Central Highlands, Ho Chi Mihn and Mekong Delta.
90 Econ Change (2008) 41:75–96
123

Ta
ble
4In
equ
alit
yd
eco
mp
osi
tio
nre
sult
sfo
r1
99
3
Var
iab
les
Gin
iA
tkin
son
GE
0G
E1
CV
2
%%
%%
%
Infr
astr
uct
ure
s0.0
3505
17.2
8446
0.0
0535
15.1
9512
0.0
1085
15.6
2493
0.0
1095
14.5
5441
0.0
2396
12.3
8962
Ho
use
ho
ldst
ruct
ure
0.0
32
76
16
.15
36
00
.00
46
01
3.0
44
55
0.0
09
29
13
.38
02
40
.009
43
12
.52
97
40
.021
21
10
.96
43
3
Ed
uca
tio
n0
.013
43
6.6
20
68
0.0
01
23
3.5
02
24
0.0
02
63
3.7
87
59
0.0
02
37
3.1
49
25
0.0
04
31
2.2
31
05
Ag
e0
.004
22
2.0
80
90
0.0
00
55
1.5
57
68
0.0
01
09
1.5
76
15
0.0
01
17
1.5
53
02
0.0
03
07
1.5
86
33
Eth
nic
ity
0.0
11
57
5.7
03
34
0.0
02
06
5.8
43
83
0.0
04
35
6.2
71
23
0.0
04
09
5.4
37
03
0.0
08
87
4.5
84
37
Lab
our
op
port
un
itie
s0
.010
16
5.0
08
54
0.0
01
66
4.7
11
31
0.0
03
32
4.7
83
32
0.0
03
48
4.6
29
17
0.0
08
35
4.3
15
20
Cap
ital
0.0
03
89
1.9
17
47
0.0
01
14
3.2
25
42
0.0
01
98
2.8
50
63
0.0
02
82
3.7
46
82
0.0
10
25
5.2
99
11
Lan
d0
.010
75
5.2
98
89
0.0
02
39
6.7
90
99
0.0
04
22
6.0
77
42
0.0
05
78
7.6
74
77
0.0
19
10
9.8
74
34
Lan
dq
ual
ity
0.0
02
99
1.4
75
11
0.0
00
36
1.0
12
03
0.0
00
71
1.0
22
56
0.0
00
76
1.0
03
28
0.0
01
88
0.9
71
57
Lo
cati
on
0.0
67
08
33
.07
67
50
.01
26
33
5.8
35
74
0.0
25
32
36
.46
35
00
.026
29
34
.93
42
50
.062
74
32
.43
82
8
Cre
dit
0.0
10
91
5.3
80
26
0.0
03
27
9.2
81
08
0.0
05
67
8.1
62
43
0.0
08
12
10
.78
82
80
.029
68
15
.34
58
0
To
tal
0.2
06
10
00
.07
01
00
0.0
73
10
00
.093
10
00
.433
10
0
Econ Change (2008) 41:75–96 91
123
Tab
le5
Ineq
ual
ity
dec
om
po
siti
on
resu
lts
for
19
98
Var
iab
les
Gin
iA
tkin
son
GE
0G
E1
CV
2
%%
%%
%
Infr
astr
uct
ure
s0
.044
61
20
.92
42
80
.007
29
19
.41
05
30
.015
31
20
.18
03
40
.01
43
01
8.2
71
30
0.0
26
32
13
.74
38
7
Ho
use
ho
ldst
ruct
ure
0.0
36
73
17
.22
91
70
.006
26
16
.65
18
70
.013
05
17
.20
61
90
.01
25
31
6.0
17
02
0.0
27
57
14
.40
09
9
Ed
uca
tio
n0
.017
18
8.0
56
97
0.0
02
27
6.0
55
88
0.0
04
67
6.1
58
65
0.0
04
67
5.9
67
36
0.0
11
50
6.0
06
38
Ag
e0
.005
08
2.3
83
64
0.0
00
62
1.6
46
20
0.0
01
31
1.7
27
81
0.0
01
19
1.5
26
82
0.0
01
85
0.9
65
17
Eth
nic
ity
0.0
06
87
3.2
21
93
0.0
01
31
3.4
98
76
0.0
02
85
3.7
52
37
0.0
02
56
3.2
71
56
0.0
05
27
2.7
54
72
Lab
our
op
port
un
itie
s0
.012
39
5.8
11
00
0.0
01
91
5.0
72
40
0.0
03
92
5.1
74
11
0.0
03
86
4.9
35
81
0.0
07
97
4.1
62
13
Cap
ital
0.0
06
66
3.1
23
33
0.0
01
97
5.2
40
76
0.0
03
38
4.4
49
97
0.0
05
06
6.4
66
76
0.0
22
04
11
.51
28
9
Lan
d0
.005
31
2.4
90
48
0.0
00
77
2.0
44
14
0.0
01
48
1.9
48
69
0.0
01
64
2.1
00
75
0.0
03
54
1.8
49
99
Lan
dq
ual
ity
0.0
03
20
1.4
99
26
0.0
00
39
1.0
49
97
0.0
00
78
1.0
34
61
0.0
00
83
1.0
65
14
0.0
02
02
1.0
55
14
Lo
cati
on
0.0
66
75
31
.31
09
10
.012
64
33
.63
96
80
.025
25
33
.28
85
30
.02
64
43
3.7
88
33
0.0
64
08
33
.46
60
8
Cre
dit
acce
ss0
.008
42
3.9
49
04
0.0
02
14
5.6
89
82
0.0
03
85
5.0
78
72
0.0
05
16
6.5
89
15
0.0
19
31
10
.08
26
4
To
tal
0.2
13
18
10
0.0
00
00
0.0
37
57
10
0.0
00
00
0.0
75
84
10
0.0
00
00
0.0
78
24
10
0.0
00
00
0.1
91
48
10
0.0
00
00
92 Econ Change (2008) 41:75–96
123
there is a declining role played by the pure geography, while the infrastructures gain
some momentum because, the fast growing areas Ho Chi Mihn and Red river Delta
are those more urbanised and better endowed with facilities, electricity, sewer
systems, roads, etc. Generalising this result, in the long-run and without corrective
interventions, we might observe a reduction in the gap among rural North and
South, less homogeneity within regions and an increasing divide among areas with
or without infrastructures.
The third and fourth components are represented by the household structure and
education. Both tend to increase in 1998, but from a political point of view, the
increase of the education contribution deserves a particular attention. Van der
Walle’s (2000) analysis previously mentioned is based on 1993s data and at that
time, the uneven distribution of education was already creating some concerns.
The 1998s situation further supports this view, confirming the urgency of
government’s corrective intervention. The human capital, in fact, is not only
important in it but as evidence shows (Van der Walle 2000); the full return on
infrastructures will not realised by the poor without a concomitant effort in
improving education.
The total inequality attributable to land, as expected, is limited, suggesting two
important conclusions. First, the land reform was successful in fairly distributing
this asset and the positive effects tend to be persistent (Ravallion and Van der Walle
2003). Also, as evidenced by Benjamin and Brandt (2004), the declining role played
by land implies that farming had become less important in affecting consumption
and inequalities.
The same cannot be said about capital, though its contribution is small. At
present, the dominant input in rural Vietnam is labour with limited use of
machinery or other capital input. However, the Chinese experience demonstrates
that once farmers start to diversify into non-farming activities, capital will fast
become the most crucial factor in both income or consumption generation and
inequality (Wan 2004). We interpret the increase in the inequality contribution
(Tables 4 and 5) as preliminary evidence in this direction. This variation
confirms that, due to partial liberalisation of machinery market, in some area of
the country is starting an embryonic mechanisation (Pingali et al. 1997). Cleary
households with a better access to credit and enough landholdings to exploit
economies of scale are favoured. Regarding credit, the decline in the contribution
is encouraging and shows that during 1990s the joint effort of NGO’s,
government and World Bank to set up rural bank and micro-finance institutions
was successful.
Finally, it is worth noting the increase of labour farm activities as a source of
inequality and the decline of ethnicity. The first moves in the expected direction
with an increase among the 2 years as suggested by other authors. Nevertheless, the
magnitude of the contribution is limited as compared to Gallup (2004), Benjamin
and Brandt (2004) decomposition, because we control for other factor not includable
in a factor-components analysis. Regarding ethnicity, although the decline is
significant, such a contribution deserves serious policy consideration. As argued by
Kanbur et al. (2005), ethnicity-induced inequality cannot be taken on its face value;
it may cause ethnic tensions even unrest.
Econ Change (2008) 41:75–96 93
123

8 Conclusions
By combining the Shapley’s value technique of Shorrocks (1999, Unpublished
Manuscript) and regression based decomposition framework of Wan (2004), this
paper explores the composition of inequality in rural Vietnam and analyses its
modification between 1993 and 1998. Although total inequality in rural Vietnam
more or less remained stable in the period considered, interesting changes are found
with regard to the individual components associated with various inequality
determinants.
Our results demonstrate that, human capital, physical capital, infrastructures and
household structure gained importance while other factors lost ground in
determining rural inequality. Based on the empirical results, a number of policy
implications or recommendations can be made to tackle the potential inequality-
increasing elements.
A well-implemented and egalitarian land reform seems to have had positive and
persistent consequences on rural income distribution. The same can be said about
polices targeted to increase the access to credit in rural areas. In both case we
observe a low and declining contribution to inequality.
Besides that, the central government must take measures to abate the regressive
nature of public investment in community infrastructures. Poor communities
deserve special support in the provision of infrastructure, preferably inversely linked
to the financial status of the local governments. Similarly, adequate arrangement
should be made to ensure equal access to education in poor areas given the
increasing contribution of this variable to total inequality.
Finally, government should intervene to eliminate the distortions created by the
actual distribution of capital and non-farm opportunities. There is a problem of
incentives in the sense that private manufacturing sector (due to poor access to
credit) is still not able to absorb the surplus agricultural labour force. This makes
labour force cost in agriculture particularly competitive and discourages the
introduction of machinery. The consequences are an increasing inequality generated
by non-farm revenues, accessible only for a limited part of the population, and a
slow increase of higher value added activities.
Acknowledgements The authors acknowledge Giovanni Andrea Cornia of University of Florence, the
editor and the anonymous referee for useful comments and suggestions. The usual disclaimer applies.
Open Access This article is distributed under the terms of the Creative Commons Attribution Non-
commercial License which permits any noncommercial use, distribution, and reproduction in any
medium, provided the original author(s) and source are credited.
References
Alesina A, Perotti R (1996) Income distribution, political instability, and investment. Eur Econ Rev
40(6):1203–1228
Blanchard O, Kremer M (1997) Disorganization. Quart J Econ 112(4):1091–1126
Blinder AS (1973) Wage discrimination: reduced form and structural estimates. J Hum Resour 8:436–455
94 Econ Change (2008) 41:75–96
123
Baulch B, Truong TK, Chuyen D, Haughton J (2001) Ethnic minority development in Vietnam: a
socioeconomic perspective. Policy Research Working Paper 2836. The World Bank, Washington,
DC
Baulch B, Minot N (2004) The spatial distribution of poverty in Vietnam and the potential for targeting.
In: Dollar D, Glewwe P, Agrawal N (eds) Economic growth, poverty and household welfare in
Vietnam. The World Bank, Washington, DC
Boeri T (2000) Structural change, welfare systems, and labour reallocation lessons from the transition of
formerly planned economies. Oxford University Press, Oxford
Cornia GA, Popov V (2001) Transition and institutions: the experience of gradual and late reformers.
Oxford University Press, Oxford
De Brauwn A, Harigaya T (2004) Seasonal migration and improving living standards in Vietnam. mimeo
Deaton A (1997) The analysis of household surveys: a micro-econometric approach to development
policy. Johns Hopkins University Press, Baltimore and London
Dutta M (1995) Vietnam marketization and internationalization of its economy. J Asian Econ 6(3):311–
326
Benjamin D, Brandt L (2004) Agriculture and income distribution in rural Vietnam under economic
reforms: a tale of two regions. In: Dollar D, Glewwe P, Agrawal N (eds) Economic growth, poverty
and household welfare in Vietnam. The World Bank, Washington, DC
Flemming J, Micklewright J (1999) Income distribution, economic systems and transition. Innocenti
Working Papers N.88
Gallup J (2004) The wage labor market and inequality in Vietnam in the 1990s. In: Dollar D, Glewwe P,
Agrawal N (eds) Economic growth, poverty and household welfare in Vietnam. The World Bank,
Washington, DC
Ghosh M, Whalley J (2004) Are price controls necessarily bad? The case of rice in Vietnam. J Dev Econ
73:215–232
Glewwe P, Gragnolati M, Zaman H (2002) Who gained from Vietnam’s boom in the 1990s? An analysis
of poverty and inequalities trends. Econ Dev Cult Change 50(4):773–782
Glewwe P (2004) An overview of economic growth and household welfare in Vietnam in the 1990s. In:
Dollar D, Glewwe P, Agrawal N (eds) Economic growth, poverty and household welfare in
Vietnam. The World Bank, Washington, DC
Gunewardena D, Van Der Walle D (2000) Sources of ethnic inequality in Vietnam World Bank Research
Paper 2297, The World Bank, Washington, DC
Harris J, Todaro MP (1970) Migration, unemployment and development: a two sector analysis. Am Econ
Rev 60:126–143
Heltberg R (2003) Spatial inequality in Vietnam: a regression-based decomposition. Paper presented at
the WIDER’s conference ‘‘Inequality Poverty and Human Well Being’’
Jansen K (2002) Economic reform and welfare in Vietnam. In: Lu A, Montes M (eds) Poverty, income
distribution and well-being in Asia during the transition’’. Palgrave Macmillan and UNU-WIDER
Jenkins R, Sen K (2002) Globalization and labor markets in the south. paper presented at the conference
‘‘globalization, growth and (in)equality’’. University of Warwick, March 2002
Kanbur R, Venables T, Wan GH (2005) Spatial disparities in human development in Asia. UNU Press
Kerkvliet TBJ, Selden M (1998) Agrarian transformations in China and Vietnam. The China Journal, No.
40, Special Issue Transforming Asian Socialism. China and Vietnam compared (July) 37–58
Juhn C, Murphy KM, Brooks P (1993) Wage inequality and the rise in returns to skill. J Polit Econ
101:410–442
Lavigne M (1999) The economics of transition: from socialist economy to market economy, 2nd edn.
Mac Millan Press, London
Litchfield J, Justino P (2003) Welfare in Vietnam during the 1990s: poverty, inequality and poverty
dynamics. J Asia Pacific Econ 2004 9(2):145–169
Liu AYC (2001) Markets, inequality and poverty in Vietnam. Asian Econ J 15(211)
Liu AYC (2004) Gender wage gap in Vietnam: 1993 to 1998. J Comp Econ 32:586–596
Lu A, Verme P (2002) Labour markets in Asian transition economies. In: Lu A, Montes M (eds)
‘‘Poverty, income distribution and well-being in Asia during the transition’’. Palgrave Macmillan
and UNU-WIDER
Luong HV, Unger J (1998) Wealth, power and poverty in the transition to market economies: the process
of socio economic differentiation in rural China and Northern Vietnam. The China Journal, No. 40,
Special Issue Transforming Asian Socialism. China and Vietnam Compared (July 1998) 61–93
Econ Change (2008) 41:75–96 95
123

Milanovic B (1995) Poverty, inequality, and social policy in transition economies, Policy Research
Working Paper Series 1530. The World Bank, Washington, DC
Milanovic B (1998) Explaining the increase in inequality during the transition. Policy Research Working
Paper Series 1935. The World Bank, Washington, DC
Oaxaca RL (1973) Male–female wage differences in urban labour markets. Int Econ Rev 14:693–709
Pingali PL, Khiem NT, Gerpacio RV, Xuan VT (1997) Prospect for sustaining Vietnam’s re-acquired rice
exporters status. Food Policy 22(4):345–358
Prud’homme R (1995) The danger of decentralization. World Bank Res Obs 10(2):201–220
Roland G (2000) Transition and economics: politics, markets and firms. MIT Press, Cambridge Mass
Ravallion M, Van der Walle D (2001) Breaking up the collective farm: welfare outcomes of Vietnam’s
massive land privatization. Policy Research Working Paper Series 2710. The World Bank
Ravallion M, Van der Walle D (2003) Land allocation in Vietnam’s agrarian transition. Policy Research
Working Paper Series 2951. The World Bank
Shorrocks AF (1980) The class of additively decomposable inequality measures. Econometrica 48:
613–625
Shorrocks AF (1982) Inequality decomposition by factor components. Econometrica 50:193–211
Shorrocks AF, Wan GH (2005) Spatial decomposition of inequality. J Econ Geogr 5(1):59–81
Tarp F, Roland-Holst D, Rand J (2003) Economic structure and development in an emergent Asian
economy: evidence from a social accounting matrix for Vietnam. J Asian Econ 13:847–871
Van der Walle D (2000) Are returns to investment lower for poor? Human and Physical Capital
Interactions in Rural Vietnam. Policy Research Paper 2425. The World Bank, Washington, DC
Wagstaff A, van Doorslaer E, Watanabe N (2003) On decomposing the causes of health sector
inequalities with an application to malnutrition inequalities in Vietnam. J Econom 112(1):207–223
Wan GH (2004) Accounting for income inequality in rural China: a regression based approach. J Comp
Econ 32(2):348–363
White H (1980) A heteroskedasticity-consistent covariance matrix estimator and a direct test for
heteroskedasticity. Econometrica 48:817–838
World Bank (WB) (2004) Vietnam development report 2004. The World Bank, Poverty Washington, DC
96 Econ Change (2008) 41:75–96
123