Embed Size (px)
Citation preview
Louisiana State UniversityLSU Digital Commons
LSU Doctoral Dissertations Graduate School
6-25-2016
Discovering Potential Protein, Carbohydrate, andLipid Based Food Ingredients in a Co-Culture ofMicroalgaeChelsea [email protected]
Follow this and additional works at: https://digitalcommons.lsu.edu/gradschool_dissertations
Part of the Agricultural Science Commons, Food Biotechnology Commons, and the FoodChemistry Commons
This Dissertation is brought to you for free and open access by the Graduate School at LSU Digital Commons. It has been accepted for inclusion inLSU Doctoral Dissertations by an authorized graduate school editor of LSU Digital Commons. For more information, please [email protected].
Recommended CitationTyus, Chelsea, "Discovering Potential Protein, Carbohydrate, and Lipid Based Food Ingredients in a Co-Culture of Microalgae"(2016). LSU Doctoral Dissertations. 5018.https://digitalcommons.lsu.edu/gradschool_dissertations/5018
DISCOVERING POTENTIAL PROTEIN, CARBOHYDRATE, AND LIPID BASED
FOOD INGREDIENTS IN A CO-CULTURE OF MICROALGAE
A Dissertation
Submitted to the Graduate Faculty of the
Louisiana State University and
Agricultural and Mechanical College
in partial fulfillment of the
requirements for the degree of
Doctor of Philosophy
in
The School of Nutrition and Food Sciences
by
Chelsea Tyus
B.S., Alabama A&M University, 2009
M.S., University of Missouri, 2014
August 2019
ii
Copyright © 2019
Chelsea Tyus
All Rights Reserved.
iii
This dissertation is dedicated to my loved ones and fellow women scientists, especially
women scientists of color who must fight for a seat at the table and work twice as hard to stay
there.
To my family thank you for supporting me and giving me wings so that I could believe
in myself and achieve this goal. Sincere thanks to my parents, Thomas & Sherry Ousley, who
covered every expense they could with no complaints, provided me sound advice, gave me love
and a great foundation. Dad thanks for starting the Infinite Scholar Program and showing me
what responsibility, dedication and sacrifice look like. Mom thanks for believing in me, traveling
to see me in Louisiana whenever you could, and for calling every night so I could never feel
lonely. To my maternal grandmother, Martha Wilcox, a million thanks for calling me every
morning to wake me up and make sure I was going to school, for listening to me complain, for
caring about my friends, for making me laugh endlessly, for loving me unconditionally. I thank
God that you’re my grandmother and my friend. To my late paternal grandmother, Verneda
Tyus, I love you and have fond memories of the times we shared. To my best friends thank you
for being supportive, comedic relief, sounding boards, editors, and traveling companions. To my
angel, Melisa Mershon, thank you for spiritual guidance, laughs and endless encouragement.
You impacted the woman I am greatly and will be missed.
I hope that me getting this degree inspires my family, friends and community to chase
after their dreams. I never imagined my education would take this route. Thank you, Alabama
A&M University, and University of Missouri for turning me into a great student and scientist. I
am thankful for the journey, growth, opportunity, and perseverance.

iv
The most beautiful experience we can have is the mysterious. It is the fundamental emotion that
stands at the cradle of true art and true science.
-- Albert Einstein
The World as I See It
v
Acknowledgments
I would like to thank Dr. Joan King for accepting me as a Ph.D. student in her lab group within
the LSU School of Nutrition and Food Sciences, she is a patient, understanding and
knowledgeable advisor. Dr. King has propelled me to new heights in research and leadership. I
would like to thank my graduate committee members Dr. Zhimin Xu, Dr. Maria Teresa
Gutierrez-Wing and Dr. Jong Ham for their time and expertise. Special thanks to Nick Magazine,
JeeWon Koh, Millicent Yeboah-Awudzi, Gabriella Paz, and Kwan Rhea for their laboratory
expertise in food science, their comradery and shoulders to cry on. Thank you to Dr. BeiBei Guo,
Connie David, Dong Liu, Dr. Gauthier, Dr. Jeonghoon Lee, Dr. Jack Losso and his lab, LSU Soil
Science Lab, and LSU Aquatic Germplasm and Genetic Resources Center for lab analysis and
guidance. I would like to thank my fellow lab mates for encouragement and lab assistance. I
would like to thank Petrie Baker, Mitch Boudreaux, Sue Hagius, Celika Murphy, and Jennifer
Marceaux for always being helpful, responding to emails, scheduling rooms, and answering
every question I threw at them over the years. I would like to thank Catherine McKenzie for her
help with formatting this dissertation. I have immense gratitude for IFT, IFTSA, AOCS, Phi Tau
Sigma Honor Society, ABO, CABLE program (Melinda Lloyd, Denny Hall, Dr. Giovanna Aita),
Louisiana Fish Fry Products, Inc. (Tana Pittman, Erika Hall), Sugar Belle (Kasie Coleman) for
networking, work experience, leadership and guidance.
Finally, a thank you to Louisiana State University and the LSU Board of Regents for
funding/allowing me to achieve this goal in my academic career. I am proud to say I am a
graduate of the prestigious Louisiana State University and Geaux Tigers! While at LSU I was
awarded many great, opportunities, friendships and experiences that allowed me to grow as a
person and as a food scientist.
vi
Table of Contents
Acknowledgments........................................................................................................................... v
List of Tables ............................................................................................................................... viii
List of Figures ................................................................................................................................ ix
Abbreviations .................................................................................................................................. x
Abstract .......................................................................................................................................... xi
Chapter 1. Introduction ................................................................................................................... 1
1.1. Introduction .................................................................................................................. 1
1.2. References .................................................................................................................... 2
Chapter 2. Literature Review .......................................................................................................... 4 2.1. Introduction .................................................................................................................. 4
2.2. Microalgae Species of Interest ..................................................................................... 4 2.3. Growth Optimization ................................................................................................... 7
2.4 Protein in Microalgae .................................................................................................... 9 2.5 Carbohydrates in Microalgae ...................................................................................... 12
2.6 Lipids in Microalgae ................................................................................................... 15 2.7. Algae Industry Applications ..................................................................................... 18 2.8. Conclusion ................................................................................................................. 22
2.9. References .................................................................................................................. 22
Chapter 3. Louisiana Native Co-Culture of Microalgae (Chlorella Vulgaris L.) and
Cyanobacteria (Leptolyngbya sp.) Cultivation ............................................................................. 36 3.1. Introduction ................................................................................................................ 36 3.2. Methods for Growing Algae Co-Cultures.................................................................. 36
3.3. Results and Discussion .............................................................................................. 45 3.4. Conclusion ................................................................................................................. 50 3.5. References .................................................................................................................. 51
Chapter 4. Protein Characterization of Louisiana Native Co-Culture of Microalgae (Chlorella
Vulgaris L.) and Cyanobacteria (Leptolyngbya sp.) ..................................................................... 54 4.1. Introduction ................................................................................................................ 54 4.2. Materials/Experimental Design ................................................................................. 55 4.3. Protein Characterization Methods.............................................................................. 56 4.4. Results and Discussion .............................................................................................. 62 4.5. Conclusion ................................................................................................................ 68 4.6. References .................................................................................................................. 69
vii
Chapter 5. Carbohydrate and Starch Characterization of Louisiana Native Co-Culture of
Microalgae (Chlorella Vulgaris L.) and Cyanobacteria (Leptolyngbya sp.) ................................ 74
5.1. Introduction ................................................................................................................ 74 5.2. Materials/Experimental Design ................................................................................. 75 5.3. Carbohydrate Characterization Methods ................................................................... 76 5.4. Starch Characterization Methods ............................................................................... 78 5.5. Results and Discussion .............................................................................................. 81
5.6. Conclusion ................................................................................................................. 87 5.7. References .................................................................................................................. 87
Chapter 6. Lipid Characterization of Louisiana Native Co-Culture of Microalgae (Chlorella
Vulgaris L.) and Cyanobacteria (Leptolyngbya sp.) ..................................................................... 91
6.1. Introduction ................................................................................................................ 91 6.2. Materials/Experimental Design ................................................................................. 91 6.3. Lipid Characterization Methods ................................................................................ 92
6.4. Results and Discussion .............................................................................................. 95 6.5 Conclusion .................................................................................................................. 99
6.6. References .................................................................................................................. 99
Chapter 7. Summary and Conclusion ......................................................................................... 102
References ................................................................................................................................... 106
Appendix. Supplemental MALDI-TOF-MS Data ...................................................................... 127
Vita .............................................................................................................................................. 137
viii
List of Tables
Table 2.1. Percentage of fatty acid composition of Chlorella species.............................. 16
Table 3.1. CCA Species Ratio Comparison ...................................................................... 47
Table 3.2. Optical Density of CCA ................................................................................... 48
Table 3.3. Average CCA pH ............................................................................................. 49
Table 3.4. Average CCA Temperature ............................................................................. 50
Table 4.1 Total Protein Content of CCA .......................................................................... 63
Table 4.2. Average Amino Acid Content in CCA ............................................................ 68
Table 5.1 Average Total Sugar Content ........................................................................... 82
Table 5.2 Average Monosaccharide Content .................................................................... 83
Table 5.3. Total Starch in CCA ........................................................................................ 83
Table 5.4. Non-Resistant Starch in CCA .......................................................................... 84
Table 5.5. Resistant Starch in CCA .................................................................................. 84
Table 5.6. Amylose/Amylopectin content in CCA Starch ................................................ 85
Table 5.7. Thermal Properties in CCA by DSC................................................................ 85
Table 6.1. Total Lipid Content by Bligh Dyer Method for CCA ..................................... 97
Table 6.2. Total Non-Polar Fat Content by ASE Method for CCA .................................. 97
Table 6.3. Total Fat Content by Fat Hydrolysis for CCA ................................................. 97
Table 6.4. Fatty Acid Profile of CCA ............................................................................... 98
Table 7.1. Summary of CCA Macronutrients Characterized .......................................... 102
ix
List of Figures
Figure 3.1. Experimental design of algae cultivation ....................................................... 44
Figure 3.2. Flow cytometry profiles for CCA................................................................... 46
Figure 3.3. Optical Density of CCA ................................................................................. 48
Figure 3.4. CCA pH vs. Time ........................................................................................... 49
Figure 3.5. CCA Temperature vs. Time ........................................................................... 50
Figure 4.1. SDS-PAGE of Extracted CCA Peptides......................................................... 64
Figure 4.2. Proteins Identified In CCA SDS-PAGE Bands .............................................. 66
Figure 5.1. DSC Curve for CCA Treatment 1 .................................................................. 86
Figure 5.2. DSC Curve for CCA Treatment 2 .................................................................. 86
x
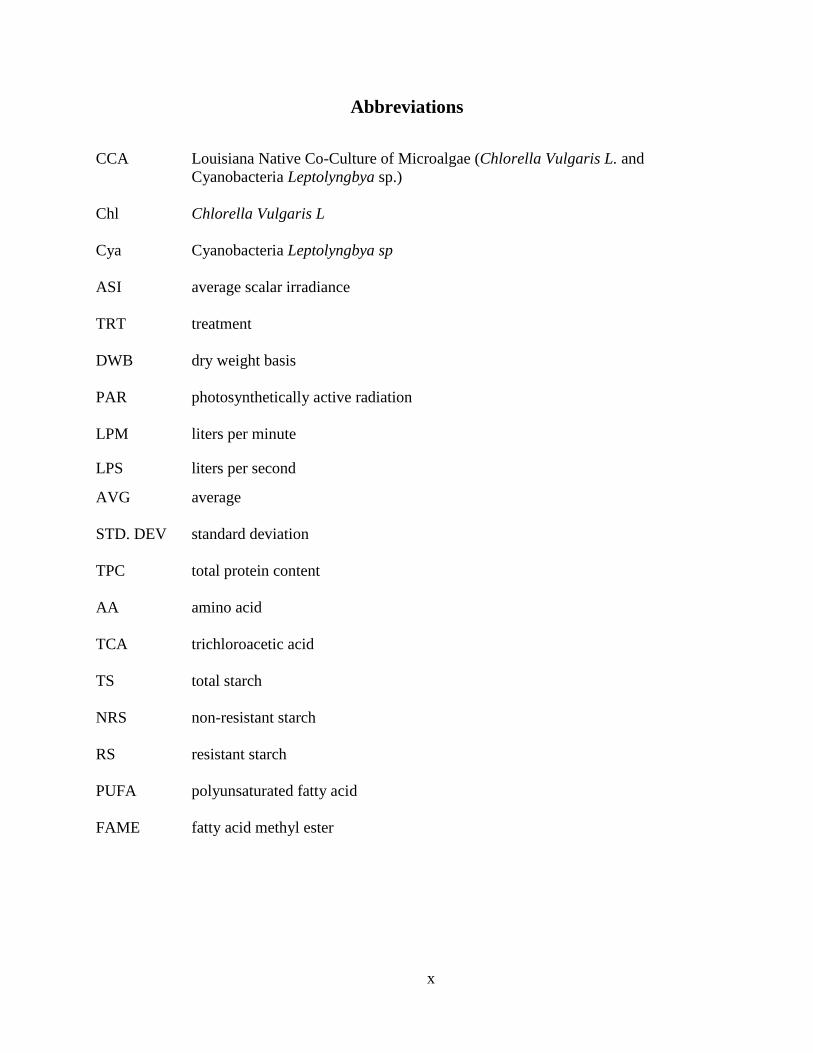
Abbreviations
CCA Louisiana Native Co-Culture of Microalgae (Chlorella Vulgaris L. and
Cyanobacteria Leptolyngbya sp.)
Chl Chlorella Vulgaris L
Cya Cyanobacteria Leptolyngbya sp
ASI average scalar irradiance
TRT treatment
DWB dry weight basis
PAR photosynthetically active radiation
LPM liters per minute
LPS liters per second
AVG average
STD. DEV standard deviation
TPC total protein content
AA amino acid
TCA trichloroacetic acid
TS total starch
NRS non-resistant starch
RS resistant starch
PUFA polyunsaturated fatty acid
FAME fatty acid methyl ester
xi
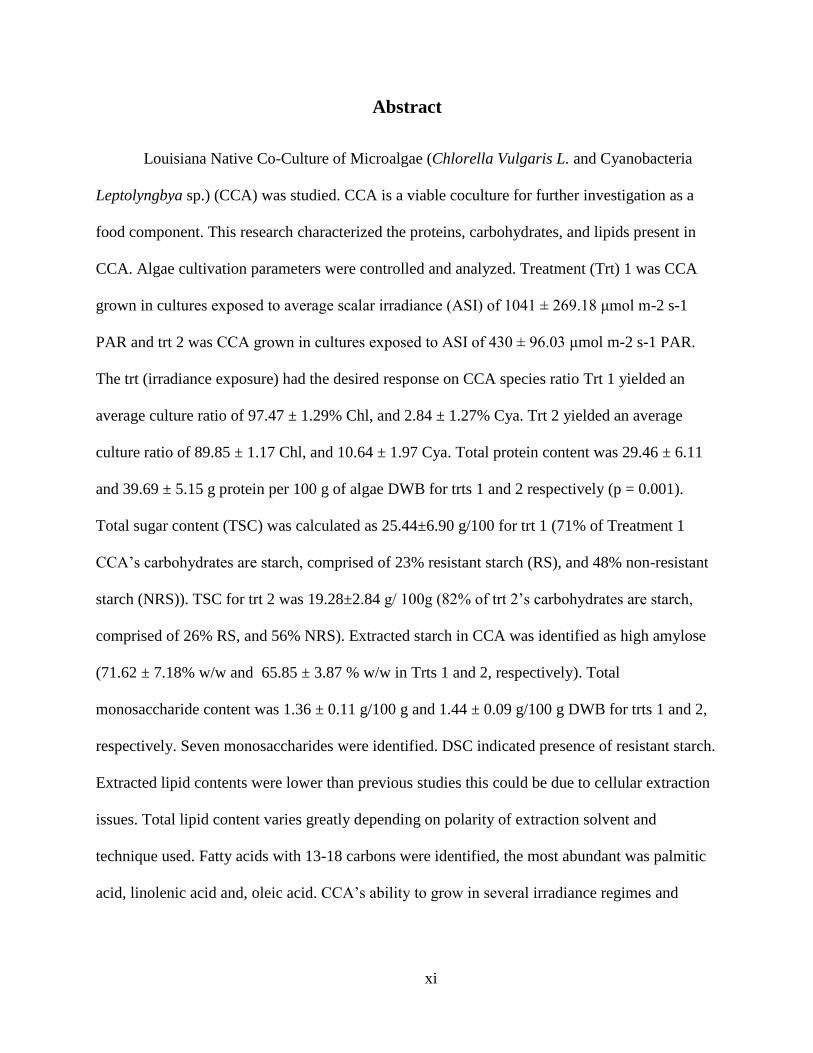
Abstract
Louisiana Native Co-Culture of Microalgae (Chlorella Vulgaris L. and Cyanobacteria
Leptolyngbya sp.) (CCA) was studied. CCA is a viable coculture for further investigation as a
food component. This research characterized the proteins, carbohydrates, and lipids present in
CCA. Algae cultivation parameters were controlled and analyzed. Treatment (Trt) 1 was CCA
grown in cultures exposed to average scalar irradiance (ASI) of 1041 ± 269.18 μmol m-2 s-1
PAR and trt 2 was CCA grown in cultures exposed to ASI of 430 ± 96.03 μmol m-2 s-1 PAR.
The trt (irradiance exposure) had the desired response on CCA species ratio Trt 1 yielded an
average culture ratio of 97.47 ± 1.29% Chl, and 2.84 ± 1.27% Cya. Trt 2 yielded an average
culture ratio of 89.85 ± 1.17 Chl, and 10.64 ± 1.97 Cya. Total protein content was 29.46 ± 6.11
and 39.69 ± 5.15 g protein per 100 g of algae DWB for trts 1 and 2 respectively (p = 0.001).
Total sugar content (TSC) was calculated as 25.44±6.90 g/100 for trt 1 (71% of Treatment 1
CCA’s carbohydrates are starch, comprised of 23% resistant starch (RS), and 48% non-resistant
starch (NRS)). TSC for trt 2 was 19.28±2.84 g/ 100g (82% of trt 2’s carbohydrates are starch,
comprised of 26% RS, and 56% NRS). Extracted starch in CCA was identified as high amylose
(71.62 ± 7.18% w/w and 65.85 ± 3.87 % w/w in Trts 1 and 2, respectively). Total
monosaccharide content was 1.36 ± 0.11 g/100 g and 1.44 ± 0.09 g/100 g DWB for trts 1 and 2,
respectively. Seven monosaccharides were identified. DSC indicated presence of resistant starch.
Extracted lipid contents were lower than previous studies this could be due to cellular extraction
issues. Total lipid content varies greatly depending on polarity of extraction solvent and
technique used. Fatty acids with 13-18 carbons were identified, the most abundant was palmitic
acid, linolenic acid and, oleic acid. CCA’s ability to grow in several irradiance regimes and

xii
create substantial biomass while still accumulating valuable macronutrients make it a promising
source of bioactive compounds.
1
Chapter 1. Introduction
1.1. Introduction
Microalgae contribute at least a quarter of the biomass of the world's vegetation and is the
foundation of the food network by supporting, directly or indirectly, all the species population of
the sea. All microalgae species contribute to atmospheric carbon dioxide capturing as part of
their photosynthetic activities (Aiken and others, 1992; Jeffrey and Mantoura, 1997), and this
helps to counteract green-house gas emission, by removing carbon released to the atmosphere
(Sabine and Feely, 2007).
Microalgae contains substantial levels of polysaccharides, polyunsaturated fatty acids,
pigments, vitamins, enzymes, bioactive peptides, and minerals (Borowitzka 1988; Ötles and Pire
2001 Cuellar-Bermudez and others, 2015). These bioactive compounds make microalgae a
possible vegan source with the added health benefits of the bioactive compounds previously
listed. Nutrient content varies based on algae culture type and growth conditions. Very little is
known about algal chemical properties in cocultures. Algae is a readily available complete
nutrient source meaning it is widely available regardless of growing region, it is a robust crop
that can withstand starvation and extreme temperatures, pH and other environmental factors, no
viable farmland is required to grow algae, and it sequesters CO2 from the environment.
Characterization is necessary to understand the components and properties of algae and
algal products. There is a need for more research on the compounds present in algae strains and
cocultures to encourage their use in food products, and applications such as drug delivery,
biosensors, foam-stabilizers, and emulsifiers (Pereira, 2018). Adding microalgal components to
food and beverage products can add value to current products by increasing vegan sourced

2
proteins, lipids, and carbohydrates. There is a growing demand for healthy, tasty, sustainable,
low impact, plant-based, high-protein foods. Algae fits this consumer demand completely.
Microalgal products need to become more diversified and economically competitive (Spolaore
and others, 2006).
This research studied Chlorella vulgaris L. (Chlorophyta) /Leptolyngbya sp.
(Cyanobacteria) co-culture microalgae (CCA). This information is imperative for application of
these proteins, carbohydrates, and lipids in the future. This research focused on characterizing
the proteins, carbohydrates, starches, and lipids present in Chlorella vulgaris L./Cyanobacteria.
1.2. References
Aiken, G. R., D. M. Mcknight, K. A. Thorn, And E. M. Thurman. (1992). Isolation of
Hydrophilic Organic Acids from Water Using Nonionic Macroporous Resins. Org.
Geochem. 18: 567-573.
Borowitzka, M. A. (1988). Vitamins and fine chemicals from micro-alga. In Microalgal
Biotechnology, eds M. A. Borowitzka & L. Y. Borowitzka. Cambridge University Press,
Cambridge, UK, p. 153"
Cuellar‐Bermudez, S. P., Aguilar‐Hernandez, I., Cardenas‐Chavez, D. L., Ornelas‐Soto, N.,
Romero‐Ogawa, M. A., & Parra‐Saldivar, R. (2015). Extraction and purification of high‐
value metabolites from microalgae: essential lipids, astaxanthin and phycobiliproteins.
Microbial biotechnology, 8(2), 190-209.
Jeffrey SW, Llewellyn CA, Barlow RG, Mantoura RFC (1997). Pigment processes in the sea: a
selected bibliography. In: Jeffrey SW, Mantoura RFC, Wright SW (eds) Phytoplankton
pigments in oceanography. SCOR-UNESCO, Paris, p 167–178
Ötles, S. and Pire, R. 2001. Fatty acid composition of Chlorella and Arthospira microalgae
species. Journal of AOAC International 84: 1708-1714.
Pereira, L. (2018). Biological and therapeutic properties of the seaweed polysaccharides.
International Biology Review, 2(2).
3
Sabine, C. L., & Feely, R. A. (2007). 3 The Oceanic Sink for Carbon Dioxide. Greenhouse Gas
Sinks, 31.
Spolaore, P., Joannis-Cassan, C., Joannis-Cassan, E., Isambert, A., Commercial applications of
microalgae – review. J. Biosci. Bioeng. 2006, 101, 87–96.

4
Chapter 2. Literature Review
2.1. Introduction
Characterizing algal samples called for extensive research into previous studies, and
optimal methods to extract, isolate and purify compounds of interest. The following background
information was relevant to characterizing the proteins, carbohydrates, starches, lipids and fatty
acids present in Chlorella vulgaris L./Cyanobacteria Leptolyngbya. (CCA).
2.2. Microalgae Species of Interest
2.2.1. Chlorella vulgaris L.
Chlorella is single-cell algae, from phylum Chlorophyta. Chlorella uses photosynthesis,
to grow rapidly using CO2, water, light, and minerals to replicate. Chlorella is high in protein
(Becker, 2007). Health claims associated with Chlorella are weight control, cancer prevention,
and immune system support. Chlorella can be a possible food and energy source because its
photosynthetic efficiency can reach 8%, meaning that 8% of the light absorbed by Chlorella is
preserved as chemical energy, this level of efficiency is comparable to highly efficient crops
such as sugar cane (Becker, 1994; Lee and others, 1998; Bewicke and Potter, 2009).
2.2.2. Cyanobacteria Species
Cyanobacteria are single-cell bacteria, they can be free-living or amassed in colonies that
form filaments (Sharma and others, 2013; Cyanobacteria, 2017). Cyanobacteria are extremely
common in fresh water, where they occur as members of both the plankton and the benthos
organism classes. They are also abundant in tide pools, coral reefs, and tidal spray zones. Some
cyanobacteria species inhabit the ocean plankton (Sharma and others, 2013; Blue-Green, 2016).
On land, cyanobacteria are common in soil down to a depth of 1 m (39 inches) or more.

5
Cyanobacteria grow on moist surfaces of rocks and trees, where they form cushions or layers
(Blue-Green, 2016). Shimura and others 2015 found that terrestrial cyanobacteria Leptolyngbya
sp. NIES-2104 has the genetic capacity to produce a mycosporine-like amino acid, mycosporine-
glycine. Mycosporine-glycine has an antioxidant action, which is thought to contribute to
adaptation to terrestrial conditions (Shimura and others, 2015).
Cyanobacteria Leptolyngbya are described as filamentous, solitary or coiled into clusters
and fine mats (which are sometimes up to macroscopic and several cm in diameter), waved or
intensely coiled, iso-polar, thin, fine, and 0.5-3.2 um wide (Komárek,1992). Cyanobacteria
Leptolyngbya has a straight hair like structure containing tube-shaped cells that do not contain
polar gas vacuoles (Anagnostidis and Komárek, 1988; Kim and others, 2015).
2.2.3. Louisiana Native Co-Culture (Chlorella vulgaris L./Cyanobacteria Leptolyngbya sp.)
(CCA)
Louisiana native co-culture of microalgae and cyanobacteria was the sample used for this
study. CCA has shown resistance to changing growth parameters like pH and temperature.
Silaban, (2013) found that CCA has higher growth rates when compared to monocultured
microalgae. CCA shifts species composition from microalgae dominant to cyanobacteria
dominant in low light conditions (Bai 2012, Silaban 2013, Barnett, 2015).
Tate and others (2013) found that gene expression of Chlorella vulgaris L. in a
monoculture compared to that in the co-culture with Leptolyngbya sp. was changed. The co-
culture was beneficial and efficient because the monoculture eventually fell susceptible to fungal
contamination (Tate and others, 2013). This experiment indicated that the co-culture, in which
cyanobacteria was 3-7% of the co-culture, was more robust than the monocultures. Culturing a

6
microalgal polyculture provides increased productivity and reduced contaminants like rotifers,
because of differences in cell size and structure of the polyculture (Kent and others, 2015,
Corcoran and Boeing, 2012).
This co-culture has been found to be resistant to extreme pH and temperature shifts, and
this co-culture has higher growth rates than the microalgae grown in monoculture (Silaban,
2013). Studies have shown co-cultures Chlorella vulgaris with Leptolyngbya sp. grew 20 times
more than Chlorella vulgaris in monoculture (Silaban, 2012). The coculture may be able to
produce lipids in greater quantities when compared to other species (Silaban, 2012).
Augmentation of Chlorella vulgaris L. growth by co-culturing with bacteria has been extensively
studied (de Bashan and others, 2002; Rasmussen and Nilsson, 2003; Park and others, 2008).
Symbiotic relationships between microalgae and cyanobacteria were reported, noting that
cyanobacteria could supply nutrient growth factors while decreasing oxygen concentrations
aiding in nitrogen fixation (Graham and Wilcox 2000; Silaban 2013). At 80 µmol m-2 s -1 (low
light conditions) the co-culture of Chlorella/cyanobacteria shifted from Chlorella dominant to
cyanobacteria dominant (Barnett and others, 2017). In a study by Barnett in 2015 that
investigated the impact of blue, green, red and white light colors on culture growth at 400 µmol
m-2 s -1 PAR, it was found that red light caused the highest growth rate (0.41 d-1) and final
biomass concentration (913 mg L-1). Bai (2012) found that greater lipid productivity at an
irradiance level of 800 µmol m-2 s -1 with 100% N indicated this was the optimal irradiance level
for biomass accumulation of this co-culture. Silaban (2013) found that when Louisiana co-
cultures of Chlorella vulgaris with Leptolyngbya sp. weren’t aerated there was an effect of
irradiance level on the amount of biomass produced, while in aerated cultures there were no
7
differences in biomass levels with changes in irradiance level. Mohtashamian (2012) found that
the greater the system dilution rate the greater the biomass produced by the Louisiana co-culture.
Microalgal polycultures are used in aquaculture systems as nutrition for fish and
crustaceans (Neori, 2011; Dahiya and others, 2012; Kent and others, 2015). There is no
published record of polycultures being cultivated for human nutrition. Supplements are on the
market currently which combine microalgal species in one multi-nutrient supplement to provide
a complete amino acid content and better reflect animal protein.
2.3. Growth Optimization
2.3.1. Light/Irradiance
Previous studies cite that metal halide lights influence the growth of microalgae resulting
in increased rates of growth due to photosynthetic efficiency (irradiance~360-400 µmol s1 m2)
(Benson and Rusch, 2006). Increased light exposure results in greater final algal concentrations.
The effects of irradiance and photoperiod on growth rates, fat/water soluble pigments, total
protein, and fatty acid content of freshwater green algae have been previously researched by
Bouterfas and others (2006), and Barnett and others (2015). The trend in results were that the cell
concentration increased with culture growth in continuous light. Fat-soluble pigments were
significantly different under different light systems; specifically, chlorophyll-a, which decreased
at high irradiance and longer light duration, while β-carotene experienced an inverse trend.
Silban (2013) observed that the greatest biomass and neutral lipid production occurred with 2.94
mM nitrogen and irradiance between 400 – 800 µmol m-2 s -1 in a Louisiana co-culture of
Chlorella vulgaris with Leptolyngbya sp. At this same irradiance level, Bai (2012) found that
aerated Louisiana co-cultures produced about 7 times more lipid that non aerated cultures with
the main fatty acids being C16 and C18 types. Bai (2012) also found that there were no

8
differences in fatty acids at different irradiance levels in these same co-cultures. White light
tended to produce more lipid in co-cultures of Chlorella vulgaris with Leptolyngbya sp., with the
greatest lipid content observed with white light at 1000 µmol m-2 s -1 (Barnett and others,
2015).
2.3.2. Flow Cytometry
Flow cytometry is the measurement of single cells in flowing sample streams (Seckbach,
1999). Flow cytometry is an effective method for screening microalgal cultures (Trask and
others, 1982). Cells suspended in water or liquid media are streamed and go through a pulsed
beam of light (Yentsch and others, 1983; Olson and others, 1985). Optical detectors assemble
scattered light and fluorescent emissions, then use electronics to digitize signals for computer
analysis. The light-scatter data provides information about the algal cells, like size, shape, and
surface characteristics (Morel, 1991; Marie and others, 2005; Green and others, 2003; Barker and
others, 2012). Flow cytometry provides a quantity of event (cells) present in the culture using
fluorescence, and forward scatter channel to size algal cells. Aa ratio of algae composition
(Chlorella to cyanobacteria) can be calculated from gating cells by species. Chlorella cells are
about 7 µm, while cyanobacteria are about 0.5 um. In flow cytometry, Chlorophyll-a absorbs in
the blue -450 nm and red -680 nm spectra range. Fluorescence from chlorophyll-a is usually
emitted in the far red -680-720 nm range. Other chlorophylls and carotenoids capture photons
and pass them to chlorophyll-a (Cunningham, 1993). Phycoerythrin, phycocyanin, and
allophycocyanin absorb blue-green, yellow-orange, and red light, correspondingly. Since algal
species contain different amounts and combinations of pigments, it is possible to use a multi-
station flow cytometer to collect the fluorescence from each pigment separately. This can be
used as an aid to classify phytoplankton from mixed environmental samples (Cunningham, 1993;

9
Davey and Bell, 1996). Another advantage of using flow cytometry to analyze microalgae is the
autofluorescence of naturally occurring intracellular pigments, the pigments can be employed to
distinguish between different species or between microalgae and other microorganisms without
applying toxic fluorescent probes (Sensen and others, 1993; Hyka and others, 2013).
2.4 Protein in Microalgae
Chlorella vulgaris L. is reported to have 51-58% protein and Arthospira platensis
(cyanobacteria sp.) is reported to have 46-63% protein DWB (Becker, 2007). There is a
consumer trend for high-protein foods, and plant-based proteins. Algal proteins could possibly be
used as a source of “green” or vegan proteins and nutraceuticals.
Algal proteins are chiefly enzymatic proteins (Becker, 2007). Protein percent is measured
after algae biomass cell wall hydrolysis. Total nitrogen is an estimate of the protein content. In
algae there is an overcalculation of the actual protein content because there are other non-protein
containing compounds in microalgae such as nucleic acids, amines, glucosamides, and cell wall
components (Becker, 1994). The quantity of non-protein nitrogen content varies by species. Ten
percent is the general amount considered for non-protein nitrogen content in microalgae (Becker,
1994).
Chlorella vulgaris L. was found to contain the amino acids: Ile: 3.8, Leu: 8.8, Val: 5.5,
Lys: 8.4, Phe: 5.0, Tyr: 3.4, Met: 2.2, Cys: 1.4, Try: 2.1, Thr: 4.8, Ala: 7.9, Arg: 6.4, Asp: 9.0,
Glu: 11.6, Gly: 5.8, His: 2.0, Pro: 4.8, Ser: 4.1 all reported in g/100g protein (Guedes et al.,
2015). The protein from microalgae is considered well-balanced because it contains numerous
essential and non-essential amino acids (Becker, 2007). Mohtashamian (2012) observed a range
in protein level from 25.5% (DWB) to 49.7 % (DWB) in co-cultures of Chlorella vulgaris with
10
Leptolyngbya sp, depending on the dilution rate and whether lipid was extracted or not before
protein analysis. Greater protein content was seen in samples that were not lipid extracted.
Common nutritional quality parameters for protein are protein efficiency ratio (PER) that
defined by Becker 2007 as weight gain per unit of protein consumed by the test animal, this is
done in short-term feeding trials (Becker, 2007). Biological value (BV) is defined by Becker
(2007) as a quantity of nitrogen retained for growth/maintenance (Becker, 2007). Digestibility
coefficient (DC) is defined as the digestibility of the tested protein in proportion to the nitrogen
that is captured by the test animal by Becker (2007). Net protein utilization (NPU) is the
“calculation of BV × DC, which is the quantity of the digestibility of the protein and the
biological value of the amino acids absorbed from the food (Becker 2007). Studies (Becker,
2004; Richmond, 2004) found drum dried Chlorella vulgaris L. algae samples yielded the
subsequent results BV: 76.6, DC: 89.0, NPU: 68.0, and PER: 2.00. Becker (2007) found that
algal proteins were comparable to vegetable proteins.
In 1952 Fowden found that in Chlorella hydrolysates accounted for 73.9 % of total
protein nitrogen was -amino nitrogen. There is research to suggest that Chlorella protein
hydrolysate can be used for developing functional foods with immune enhancing activity as
shown in mice (Morris and others, 2007). Furthermore, Ursu and others (2014) found that the
emulsifying capacity and stability of Chlorella vulgaris L. proteins perform as well or
outperform commercial ingredients such as sodium caseinate. Chlorella vulgaris L. proteins are
multifaceted, valuable and competitive in the consumer market.

11
2.4.1. Phycobiliproteins
Phycobiliproteins are fluorescent photosynthetic complexes according to Glazer in 1994.
These proteins can be found in cyanobacteria, red algae and cryptomonads (Glazer, 1989).
Phycobiliprotein complexes are grouped into four major categories based on spectral ranges and
chromophore make ups. The phycoerythrins and phycoerythrocyanins are absorbed in the blue to
green area of 500–565 nm, as well as phycocyanins and allophycocyanins that absorb in the
orange (620 nm) to red areas (655 nm) (Bennett and others 1973; Glazer, 1989; Arteni and
others, 2009). Phycobiliproteins are water soluble (Glazer, 1989; Barsanti and others, 2008).
Phycobiliproteins make up to 40% of the total soluble protein content in algal cells (Chakdar and
Pabbi, 2017). Phycobiliproteins participate in efficient energy transfer in photosynthesis (Róman
and others, 2002). Phycocyanins found in cyanobacteria species such as Arthrospira are used as
dietary supplements due to their pharmacological characteristics (Kissoudi, 2017).
Nair and others (2018) found that phycobiliproteins (phycocyanin and phycoerythrin)
from the red algae, Centroceras clavulatum could be isolated, purified and determined by
spectroscopy. They also identified the molecular weight of the phycobiliproteins found as 110
kDa and 250 kDa (by native-polyacrylamide gel electrophoresis) and polypeptide compositions
as 17 and 21 kDa (by SDS-PAGE). Patel and others (2005) purified and characterized
phycocyanin from cyanobacterial species (Spirulina sp., Phormidium sp. and Lyngbya sp.) and
the molecular weights of phycocyanin from were 112, 131, and 81 kDa, respectively. They also
found two subunits (α and β) of phycocyanin using SDS–PAGE in all cyanobacteria species
studied. Each cyanobacterial species displayed a band at 24.4 kDa for the β subunits. The α
subunit was displayed at different molecular weights 17 kDa Spirulina sp., 19.1 kDa
Phormidium sp., and 15.2 kDa Lyngbya sp. Chen and others (2017) prepared and characterized
12
food grade phycobiliproteins from Porphyra haitanensis then applied these phycobiliproteins in
a liposome-meat system. They found that the phycobiliproteins from Porphyra haitanensis
decreased lipid peroxidation in linoleic acid and the liposome-meat system while providing
nutritional value in essential amino acids.
2.5 Carbohydrates in Microalgae
Carbohydrates play many parts in the process of photosynthesis in microalgae and
cyanobacteria (Raven and Beardall, 2003). Carbohydrate intermediates, and phosphorylated
sugars, affect the photosynthetic carbon reducing process as well as the “photorespiratory carbon
oxidation cycle” according to Raven and Beardall in 2003. Carbohydrates are used by the algae
as an energy supply and for storage. Algae carbohydrates originate in the chloroplasts of
eukaryotes and in the cytosol in prokaryotes (Markou and others, 2012; Safi and others, 2014).
Green algae synthesize polysaccharides that are like amylopectin (Markou and others, 2012).
Storage tasked carbohydrates are characteristically starches (amylose and amylopectin).
Storage carbohydrates allow algae to survive in dark conditions; however, the amount of time a
culture can survive in the dark is species specific (Raven and Beardall, 2003). When microalgae
are under stress structurally tasked carbohydrates like soluble cell wall carbohydrates and
cellulose are accumulated in the cell wall (Domozych and others, 2012; Ho and others, 2013; Al
Abdallah and others, 2016) while starch accumulates in the plastids (Rismani-Yazdi and others,
2011; Ho and others, 2013). Signaling carbohydrates are glycolipids and glycoproteins (Chen
and others, 2013; Safi and others, 2014).
It is proposed that Chlorella’s cell wall consists of polysaccharides attached to phenolic
units, like those in lignin (Chen and others, 2017). High temperature, high pH solutions did not

13
extract polysaccharides (Chen and others, 2017), signifying that attachments with ester bonds
were not present (Sui and others, 2012). Rather, cell-wall polysaccharides may be attached with
phenolics in ether linkages (Sui and others, 2012). The cell wall polysaccharides of C. vulgaris
were found to consist of β-(1,3)-glucans, composed of glucose (de Jesus Raposo and others,
2013). The chemical composition of freshwater C. vulgaris cell wall components were assayed
by Abo-Shady and others (1993), it was found to be 25% hemicellulose, 66.6% rigid wall (alkali
insoluble fraction), 30% saccharides, 2.46% proteins, 15% lipids, and 52.54% unknown
substances.
Ogawa and others (1999) found that C. vulgaris contained 14% uronic acids in
polysaccharides. Glucans, found in Chorella vulgaris (Nomoto and others, 1983) were found to
display several health properties, such as deduction or deterrence of infections and
chemoprotective behavior (Bleicher and Mackin 1995). Ortiz-Tena and others (2013) reported
the monosaccharide content of Chorella vulgaris using HPAED as: glucose: 225.5 mg of
monosaccharide/g of dry biomass sample, galactose as 33.7 mg/g, rhamnose as 9 mg/g, mannose
as 5 mg/g, ribose as 6.3 mg/g, glucuronic acid as 3.9 mg/g, glucosamine as 4.8 mg/g; xylose as
6.4 mg/g; arabinose as 6.4 mg/g, fucose as none determined and total monosaccharides as 294.6
mg/g. The structure of an aldobiouronic acid isolated from the polysaccharides of various
unicellular red algae was evaluated by Geresh and others in 1990. They hydrolyzed and
separated extracted polysaccharides then subjected them to thin layer chromatography and
HPLC. This total hydrolysis revealed xylose, glucose, galactose, glucuronic acid, rhamnose,
arabinose, and 3-O-methylpentose, and 4-O-methylpentose.
Cyanobacteria synthesize glycogen (Nakamura and others, 2005; Markou and others,
2012). Yim and others (2003) and Trabelsi and others (2009) determined that Arthospira A.

14
platensis (a freshwater cyanobacteria species) contained 5-20% sulfate in polysaccharides, and 7-
14.4% uronic acids in polysaccharides (de Jesus Raposo and others, 2013). In cyanobacteria, it is
thought that peptide functional groups, protein functional groups and “deoxy-sugars” (rhamnose
and fucose) cause polysaccharides to exhibit hydrophobic behavior effecting their emulsifying
properties (Flaibani and others, 1989; Shepherd and others, 1995).
2.5.1. Starches in Microalgae
The structure of starch in plants differs from that in bacteria (glycogen) because it
presents itself as branched amylopectin (Manners 1991, Gallant et al. 1997, Thompson 2000,
Nakamura, 2005). The length of the amylopectin structure is usually 90 ± 0.2 nm among plant
species (Jenkins and others, 1993). Another similarity in plant starches is the positioning of the
α-1,6-glucosidic linkages being localized in the amylopectin structure so that α-1,4-glucosidic
side chains are available to form a double helix (Kainuma and French, 1972; Nakamura, 2005),
when the degree of glucose polymerization (DP) of nearby carbohydrate structures reach 10 or
more carbons in length (Gidley and Bulpin 1987; Nakamura, 2005). Amylopectin can be
catalyzed by three classes of enzymes (starch synthase, starch branching enzymes and starch
debranching enzymes), each enzyme is made up of isozymes that effect the amylopectin
structure (Nakamura 2002, Ball and Morell 2003; Nakamura, 2005). This differs compared to
bacteria starch, glycogen, that can be synthesized by the enzyme glycogen synthase. (Nakamura,
2005). A study by Nakamura in 2015 identified that some cyanobacteria synthesize semi-
amylopectin type α-polyglucans in place of glycogen, that is consistent in bacteria. They
contribute this change to evolutionary aspects of cyanobacteria’s rRNA sequences, and
phylogenetic tree.
15
2.6 Lipids in Microalgae
Eukaryotic algae contain a variety of triacyglycerols (TAGs) (Harwood, 1998). Algae
synthesizes lipids most often as membrane lipids that can make up 5-20% of the total dry weight
of the algae cell. The TAGs that are present in the greatest quantity in microalgae are usually
monogalactosyldiacylglycerol (MGDG), digalactosyldiacylglycerol (DGDG),
sulfoquinovosyldiacylglycerol (SQDG) and phosphatidylglycerol (PG). The chloroplast
membrane lipids are mostly glycosylglycerides Phosphoglycerides are also present inside the
cell membrane, cytoplasm, and endoplasmic reticulum of microalgae cells (Guckert and
Cooksey, 1990; Harwood, 1998; Pohl and Zurheide, 1979; Wada and Murata, 1998; Al-Hasan
and others, 1989; Guschina and Harwood 2006). Many of these TAGs are in hypothesized
location is in the thylakoid membranes of microalgae cell’s chloroplasts (Al-Hasan and others,
1989; Harwood, 1998). Trigalactosyldiacylglycerol was found to be present in Chlorella
(Benson and others 1958, Harwood, 1998).
In a study of marine and freshwater algae species, including blue green algae
(cyanobacteria sp.) Lee and Loeblich (1971) polar lipids encompass sphingolipids, glycolipids,
phospholipids and sterols (Lee and Loeblich, 1971; Al-Hasan and others, 1989). The neutral
lipids encompass triglycerides and hydrocarbons. Hydrocarbons can make up to 5% of the total
dry weight while the triglycerides contain C14–C18 fatty acids that are saturated or mono-
unsaturated. (Lee and Loeblich, 1971; Al-Hasan and others, 1989; Aakanksha and others, 2010).
2.6.1 Fatty Acids in Microalgae
Algal lipids are typically made up of fatty acids of the C12-C22 array, the most common
monounsaturated fatty acid is oleic acid (Matos, 2017). Microalgae gather long-chain fatty acids
in the triacylglycerol form of ω-3s specifically α-linoleic acid, eicocosapentanoic acid, and
16
docosahexanoic acid and ω-6s in the form of linoleic acid, γ-linolenic acid, and arachidonic acid
(Armenta and others, 2013; Matos, 2017). These long chain fatty acids have been associated with
positive health benefits (Armenta and others, 2013; Matos, 2017). Studies have found that total
saturated fatty acids increase, while monounsaturated and polyunsaturated fatty acids decrease
when exposed to increasing irradiance and light duration (Benavente-Valdés and others, 2016;
Seyfabadi and others 2011).
Cyanobacteria encompasses small quantities of fatty acids, saturated and
monounsaturated fatty acids, as well as trace amounts of PUFAs, mostly α-linoleic acid (Lang
and others, 2011). In a previous study on irradiance and photoperiod’s effect on fatty acid
percent in C. vulgaris, it was found that the 16:8-h light/dark photoperiod yielded the best results
for fatty acids with those being 28.67% saturated fatty acids, 15.15% monounsaturated fatty
acids, and 25.58% polyunsaturated fatty acids (Seyfabadi and others 2011).
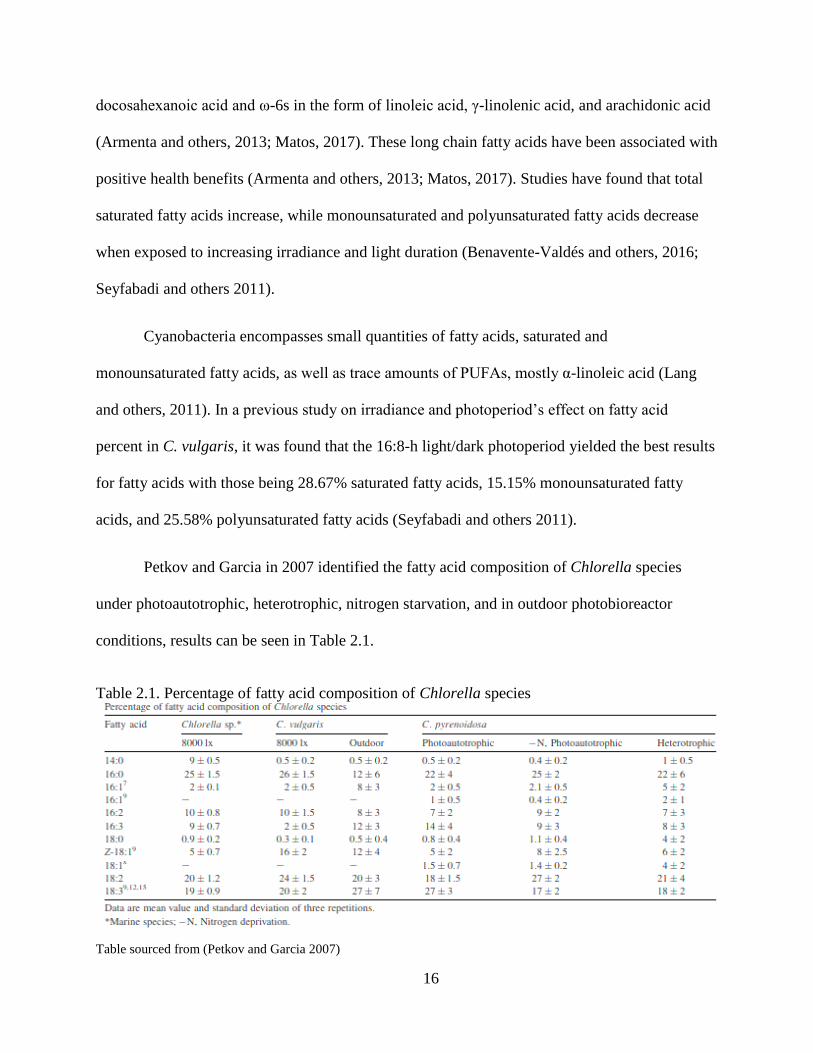
Petkov and Garcia in 2007 identified the fatty acid composition of Chlorella species
under photoautotrophic, heterotrophic, nitrogen starvation, and in outdoor photobioreactor
conditions, results can be seen in Table 2.1.
Table 2.1. Percentage of fatty acid composition of Chlorella species
Table sourced from (Petkov and Garcia 2007)
17
In a study of C. vulgaris lipids cultivated in both organic and inorganic media Murakami
and others (1997) found that there were 2.8% neutral lipids in organic media and 1.88% in
inorganic media. These authors also found was 8.6% phospholipids in organic media and 6.2%
in inorganic media, 5.7% glycolipids in organic and inorganic media, and 1.6% trans-
hexadecanoic acid in organic media and 2.3% in inorganic media (Murakami and others, 1997).
2.6.2 Lipid Soluble Pigments
Chlorophylls are green pigments that contain porphyrin and four pyrrole subunits
(Bonkovsky and others, 2013). Due to porphyrin’s stability, which is caused by its circle-shaped
molecular conformation, it can gain or lose electrons. This plays a role in chlorophyll capturing
sunlight and turning it into energy (Rowan, 1989). There are three chief chlorophylls, the most
prominent being chlorophyll-a. Chlorophyll-a makes photosynthesis possible (Rowan, 1989;
Waggoner and Speer, 1999). Chlorophyll-a passes electrons to molecules that ultimately
manufacture sugars. Algae, cyanobacteria and any photosynthetic plant contain chlorophyll-a.
Chlorophyll-b aids during photosynthesis through absorbing light energy. Chlorophyll-b is more
soluble than chlorophyll-a in polar solvents (Rowan, 1989). Chlorophyll-b can only be found in
green algae and plants. Chlorophyll-c differs from chlorophyll-b in that it is more unsaturated
and doesn’t contain an esterified phytol side chain. Chlorophyll-c is found only in photosynthetic
Chromista and dinoflagellates (Rowan, 1989; Waggoner and Speer, 1999). Chlorophyll-c
pigments are widely distributed among marine and freshwater algae (Rowan, 1989).
Carotenoids are tetraterpenoids (deMan, 1999), they are classified as photosynthetic
accessory pigments (Cogdell, 1978) because they transfer their harvested energy to chlorophyll.
Carotenoids have a role in microalgae’s light collecting. According to Galasso and others (2017)
carotenoids make up to 8–14 % of microalgae DWB biomass. Carotenoids can be carotenes or

18
xanthophylls (Priyadarshani and others, 2012). The carotene carotenoids contain the compounds
β-carotene and lycopene. The xanthophyll carotenoids contain the compounds lutein and
astaxanthin, (Eonseon, and others, 2003; Fassett and Coombes 2011; Henríquez and others,
2016). Carotenoids synthesized in microalgae are classified as primary and secondary
carotenoids (Priyadarshani and others, 2012). Primary carotenoids are crucial to cell life because
they aid in both structural and functional parts of cell photosynthesis. The secondary carotenes
are only collected after exposure to certain environmentally induced factors (Eonseon, and
others, 2003; Henríquez and others, 2016).
2.7. Algae Industry Applications
Macroalgal polysaccharides such as agar, alginates, and carrageenans have been used in
several industrial areas for their gelling and thickening properties (Pulz and Gross, 2004). The
following genera of microalgae are considered GRAS (Generally Regarded as Safe) by the U.S.
Food and Drug Administration and can be consumed as a food source: Arthospira, Chlorella,
Dunaliella, Haematococcus, and the oil of Schizochytrium (Chacón-Lee and González-Mariño
2010). Chlorella is used as an animal feed for larval mollusks and penaeid shrimp (Brennan and
Owende, 2010) and was one of the original microalgae species to be commercialized as a food
for health (Borowitzka, 2013).
2.7.1. Uses of Algae
Microalgal-based biofuel is a renewable resource; the biofuel has no net emissions of
carbon dioxide or sulfur to the atmosphere (Xu and others, 2006). Microalgal biofuels can be
produced on land with low agricultural value and low-quality water. Algae can be grown in
environments not conducive to growth of terrestrial plants (Tate and others, 2013), using saline
19
or brackish water or even wastewater (Ferrell and others, 2010). Algae can provide added
benefits by removing nitrogen and phosphorous from the wastewater (Li and others, 2008).
2.7.2. Algae as a Food and Nutraceutical
Microalgae has been found to be a source of functional ingredients with positive health
effects due to them being high in polyunsaturated fatty acids, polysaccharides, natural pigments,
essential minerals, vitamins, enzymes and bioactive peptides (Cuellar-Bermudez and others,
2015). Algae’s high protein content also makes it a valuable food component, as it can be an
alternative to animal protein for vegetarians and vegans who play an important role in the
consumer market. Freshwater algae total protein content can range anywhere between 50-70%.
It is the highest protein-rich food in the entire plant kingdom and includes all the essential amino
acids making it a complete protein source. Microalgal products need to become more diversified
to be economically competitive (Spolaore and others, 2006).
Processes such as distillation, fermentation, or catalytic conversion are also used to obtain
fatty acids, glycerol, alcohols (Xu and others, 2006), and other high-value components such as β-
carotene, ω-3 fatty acids, and bioplastics (Spolaore and others, 2006) from algae. Large photo-
bioreactors mass-produce algal species for market use so that biomass of the desired algae strains
and their valuable biochemicals can be produced rapidly. Examples of this are, Dunaliella algae
species that is rich in carotenoids and therefore is used as an industrial source of β-carotene (de
Jesus Raposo and others, 2013), and Haematococcus which contains xantophiles specifically,
astaxanthin (Levy, 2001). Both substances are in strong demand in the international marketplace
as pigments and for well-known health benefits. Dunaliella and Haematoccoccus algae are used
as additives for poultry, crustaceans and fish feeds, to provide bright colors in egg yolks, skin,
and fatty tissues due to its pigmenting properties (Sanchez and others, 2008).
20
Macroalgal polysaccharides such as agar, alginates and carrageenans are used in various
fields of industry for their rheological gelling and thickening properties (Pulz and others, 2004).
Arthospira (Cyanobacteria sp.) has a higher amount of protein by weight than red meat
(Fleurence, 1999). Arthospira platensis (Spirulina) is a complete food supplement and is used to
aid in malnutrition in developing countries. A. platensis has been added to many commercials
food systems like soups, sauces, pastas and snacks but the fishy odor of algae must be overcome
to make these products as marketable as possible (Habib, 2008, Cuellar-Bermúdez and others,
2017).
Thrive is the name of an algae oil that is on the market currently created by the algae
company Terravia now called Corbion (Amsterdam, Netherlands). Thrive® Algae Oil is an oil
made from algae that is marketed to consumers currently. Its health claims are for heart health
and they state that one tablespoon provides 13g of monounsaturated fat and that it has 75% less
saturated fat than olive oil. The company markets to the “foodie” trend of a common ingredient
from an uncommon or novel source, and the “green” trend being that the company claims the
oil’s processing has decreased greenhouse emissions. The oil is marketed for use in cooking,
baking, and salad dressings (Thrive, 2017). There was also research that DHA supplementation
from algal oil could reduce serum triglyceride levels and increase low-density lipoprotein
cholesterol, also called "bad" cholesterol) and HDL (high-density lipoprotein cholesterol) in
persons without coronary heart disease (Bernstein and others 2012).
Algae powders were historically marketed as fish food in the U.S. But, algae-based
ingredients offer health and wellness attributes for human food. There is research that algal
powders can boost plant protein levels in cheese crackers or smoothies (Brooks and others,
2010), and they may improve the nutritional profile of an ice cream product. Chlorella vulgaris,
21
a green algae species, can be up to 55% protein and this is marketed as a complete vegetable
protein (Becker, 2007).
Algae supplements in the form of capsules, tablets, and powders are commercially
available currently. Typically, blue green algae supplements are marketed containing Arthospira,
sometimes in combination with other algae such as Chorella or Aphanizomeron flos aquae
(Nicoletti, 2016).
A Chlorella microalgal flour, produced from biomass currently has a patent. It is
comprised of lysed cells in the form of a powder, this powder is 40% protein, 20% of triglyceride
oil, 10% dietary fiber, 20% carbohydrate and 10% or less moisture by dry weight. The flour is
processed by creating micronized microalgal biomass that is emulsified and dried. This flour can
be used in the place of historical flours to increase nutritional content and is gluten free (Brooks
and others, 2010).
A company called Simris World sells a variety of algal products of these teas comprised
of organic traditional herbs and Dunaliella algae the product is called “Flower Power Algae Tea”
and a product called “Sun Candy Algae Tea” and it is marketed as packed with beta-carotene,
with emphasis on its benefits for skin (Hejazi and Wijffels, 2004).
According to the Algae Biomass Organization some U.S. based algal companies are
LanzaTech (Skokie, IL), Qualitas Health Inc (Houston, TX), Triton Algae Innovations (San
Diego, CA), Earthrise Nutritionals LLC (La Jolla, CA), Sapphire Energy (San Diego, CA),
Corbion (Amsterdam, Netherlands), Neste (Espoo, Finland), AstaReal Inc USA (Burlington,
NJ), and the National Center for Marine Algae and Microbiota (NCMA) (East Boothbay, Maine)
(Algae Biomass Organization, 2019).

22
Japan, China, Taiwan, India and, Mexico have been growing algae at the large scale since
the 1960s (Muller-Feuga 1996; Pulz, and Scheibenbogen, 1998, Borowitzka, 1999). In China,
Arthrospira and Chlorella species are used to enhance beverages including health drinks, soft
drinks, teas, beers and spirits (Liang and others, 2004). The largest producer of algae powder is
Hainan Simai (Hainan, China) (Spolaore and others, 2006).
2.8. Conclusion
Microalgae and cyanobacteria were found by previous studies to have various uses across
industries and synthesize several valuable compounds, and the studied species grew well under
controlled conditions. The biological compounds of interest have been researched, theorized and
in some cases proven to aid in their numerous applications, but since algae is such a large plant
family there are more compounds to be discovered and characterized. Nutrient content was found
to vary greatly due to algae species, growth conditions, extraction method, and protocol.
Characterizing nutrients in algae is imperative for application of these compounds in the future.
After reviewing available research, it was decided to pursue commonly used protocols
such as the freeze thaw method, sonication and lyophilization for sample preparation. A
modification of Bold Basal Medium and 400 W metal halide lights were chosen to cultivate
algae. These methods will be further discussed in the following chapter of this dissertation.
Overall the compounds in microalgae show great potential for use as food and in food
applications.
2.9. References
Aakanksha, S., S., Guruprasad, S., Ramachandra T.V., (2010). Diversity of Lipids in Algae.
Paper presented at the Lake 2010: Wetlands, Biodiversity and Climate Change,
Bangalore, India. Conference Abstract retrieved from
http://www.ces.iisc.ernet.in/energy/lake2010/Theme%201/aakanksha.pdf
23
Abo-Shady, A. M., Mohamed, Y. A., & Lasheen, T. (1993). Chemical composition of the cell
wall in some green algae species. Biologia Plantarum, 35(4), 629-632.
Anagnostidis, K. and Komárek, J. (1988) Modern approach to the classification system of
cyanophytes. 3. Oscillatoriales. Arch Hydrobiol Suppl 80, 327–472.
Aiken, G. R., D. M. Mcknight, K. A. Thorn, And E. M. Thurman. (1992). Isolation of
Hydrophilic Organic Acids from Water Using Nonionic Macroporous Resins. Org.
Geochem. 18: 567-573.
Al Abdallah, Q., Nixon, B. T., & Fortwendel, J. R. (2016). The Enzymatic Conversion of Major
Algal and Cyanobacterial Carbohydrates to Bioethanol. Frontiers in Energy Research,
4(36). doi:10.3389/fenrg.2016.00036
Algae Biomass Organization. (2019). Algae Industry Products & Services Directory. available
at: https://algaebiomass.org/resource-center/industry-resources/algae-industry-services-
directory/#bigelow (accessed May 2019).
Al-Hasan, R. H., Ali, A. M., & Radwan, S. S. (1989). Effects of light and dark incubation on the
lipid and fatty acid composition of marine cyanobacteria. Microbiology, 135(4), 865-872.
Armenta, R. E., & Valentine, M. C. (2013). Single-cell oils as a source of omega-3 fatty acids:
an overview of recent advances. Journal of the American Oil Chemists' Society, 90(2),
167-182.
Arteni, A. A., Ajlani, G., & Boekema, E. J. (2009). Structural organisation of phycobilisomes
from Synechocystis sp. strain PCC6803 and their interaction with the membrane.
Biochimica et Biophysica Acta (BBA)-Bioenergetics, 1787(4), 272-279.
Bai, R. (2012). Lipid Production from a Louisiana Native Chlorella vulgaris/Leptolyngbya sp.
Co-culture for Biofuel Applications. Chemical Engineering Commons. LSU Doctoral
Dissertation
Ball, S.G. and Morell, M.K. (2003) From bacterial glycogen to starch: understanding the
biogenesis of the plant starch granule. Annu. Rev. Plant Biol. 54: 207–233.
Barker, J. P., Cattolico, R. A., & Gatza, E. (2012). Multiparametric Analysis of Microalgae for
Biofuels Using Flow Cytometry. White Paper, BD Biosciences.
24
Barnett, J. Z., Foy, J., Malone, R., Rusch, K. A., & Gutierrez‐Wing, M. T. (2017). Impact of
light quality on a native Louisiana Chlorella vulgaris L./Leptolyngbya sp. co‐culture.
Engineering in Life Sciences, 17(6), 678-685.
Barsanti, L., Coltelli, P., Evangelista, V., Frassanito, A. M., Passarelli, V., Vesentini, N., &
Gualtieri, P. (2008). Oddities and curiosities in the algal world. In Algal toxins: nature,
occurrence, effect and detection (pp. 353-391). Springer, Dordrecht.
Becker, E. W. (1994). Microalgae: biotechnology and microbiology (Vol. 10). Cambridge
University Press.
Becker, E. W. (2007). Micro-algae as a source of protein. Biotechnology advances, 25(2), 207-
210.
Benavente-Valdés, J. R., Aguilar, C., Contreras-Esquivel, J. C., Méndez-Zavala, A., &
Montañez, J. (2016). Strategies to enhance the production of photosynthetic pigments and
lipids in chlorophycae species. Biotechnology Reports, 10, 117–125.
http://doi.org/10.1016/j.btre.2016.04.001
Bennett, A. and Bogorad, L. (1973). Complimentary Chromatic Adaptation in a Filamentous
Blue-Green Alga. The Journal of Cell Biology, 58, No. 2, 419.
Benson, A. A., R. Wiser, R. A. Ferrari & J. A. Miller, 1958. Photosynthesis of galactolipids.
Journal of the American Chemical Society 80: 4740.
Benson, B. C., & Rusch, K. A. (2006). Investigation of the light dynamics and their impact on
algal growth rate in a hydraulically integrated serial turbidostat algal reactor (HISTAR).
Aquacultural engineering, 35(2), 122-134.
Bernstein, A. M., Ding, E. L., Willett, W. C., & Rimm, E. B. (2012). A meta-analysis shows that
docosahexaenoic acid from algal oil reduces serum triglycerides and increases HDL-
cholesterol and LDL-cholesterol in persons without coronary heart disease. The Journal
of nutrition, 142(1), 99-104.
Bewicke, D., & Potter, B. A. (2009). Chlorella: The Emerald Food. Ronin Publishing.
Bleicher P, Mackin W (1995) Betafectin PGG-glucan: a novel carbohydrate immunomodulator
with anti-infective properties. J Biotechnol Healthc 2:207–222
25
Bonkovsky, H. L., Guo, J. T., Hou, W., Li, T., Narang, T., & Thapar, M. (2013). Porphyrin and
heme metabolism and the porphyrias. Comprehensive Physiology.
Borowitzka, M. A. (1999). Commercial production of microalgae: ponds, tanks, tubes and
fermenters.
Borowitzka, M. A. (2013). High-value products from microalgae—their development and
commercialisation. Journal of Applied Phycology, 25(3), 743-756.
Bouterfas R, Belkoura M, Dauta A (2006). The effects of irradiance and photoperiod on the
growth rates of three freshwater green algae isolated from a eutrophic lake. Limnetica
25:647–656
Brennan, L., & Owende, P. (2010). Biofuels from microalgae—a review of technologies for
production, processing, and extractions of biofuels and co-products. Renewable and
sustainable energy reviews, 14(2), 557-577.
Brooks, G., Franklin, S., Avila, J., Decker, S. M., Baliu, E., Rakitsky, W., ... & Norris, L. M.
(2010). U.S. Patent Application No. 12/684,893.
Chacón-Lee TL, González-Mariño GE (2010) Microalgae for “healthy” foods – possibilities and
challenges. Compr Rev Food Sci Food 9(6):655–675
Chakdar, H., & Pabbi, S. (2017). Algal pigments for human health and cosmeceuticals. In Algal
Green Chemistry (pp. 171-188). Elsevier.
Chen, X., Wu, M., Yang, Q., & Wang, S. (2017). Preparation, characterization of food grade
phycobiliproteins from Porphyra haitanensis and the application in liposome-meat
system. LWT, 77, 468-474. doi: https://doi.org/10.1016/j.lwt.2016.12.005
Corcoran AA, Boeing WJ. (2012). Biodiversity increases the productivity and stability of
phytoplankton communities. PloS ONE. 7, e49397. pmid:23173059
Cogdell, R. J. (1978). Carotenoids in photosynthesis. Philosophical Transactions of the Royal
Society of London. B, Biological Sciences, 284(1002), 569-579.
doi:10.1098/rstb.1978.0090

26
Cuellar‐Bermudez, S. P., Aguilar‐Hernandez, I., Cardenas‐Chavez, D. L., Ornelas‐Soto, N.,
Romero‐Ogawa, M. A., & Parra‐Saldivar, R. (2015). Extraction and purification of high‐
value metabolites from microalgae: essential lipids, astaxanthin and phycobiliproteins.
Microbial biotechnology, 8(2), 190-209.
Cuellar-Bermúdez, S. P., Barba-Davila, B., Serna-Saldivar, S. O., Parra-Saldivar, R., Rodriguez-
Rodriguez, J., Morales-Davila, S., . . . Chuck-Hernández, C. (2017). Deodorization of
Arthrospira platensis biomass for further scale-up food applications. Journal of the
Science of Food and Agriculture, 97(15), 5123-5130. doi:10.1002/jsfa.8391
Cunningham, A. (1993). Analysis of microalgae and cyanobacteria by flow cytometry. In Flow
Cytometry in Microbiology (pp. 131-142). Springer, London.
Cyanobacteria. (2017). Funk & Wagnalls New World Encyclopedia, 1p. 1.
Davey, H. M., & Kell, D. B. (1996). Flow cytometry and cell sorting of heterogeneous microbial
populations: the importance of single-cell analyses. Microbiological reviews, 60(4), 641-
696.
Dahiya A, Todd J, McInnis A. Wastewater treatment integrated with algae production for
biofuel. In: Gordon R, Seckbach J, editors. The science of algal fuels: cellular origin, life
in extreme habitats and astrobiology. Dordrecht: Springer Netherlands; 2012. pp. 447–
466.
de Jesus Raposo, M. F., de Morais, R. M. S. C., & de Morais, A. M. M. B. (2013). Health
applications of bioactive compounds from marine microalgae. Life Sciences, 93(15),
479-486. doi: https://doi.org/10.1016/j.lfs.2013.08.002
deMan, J. M., & deMan, J. M. (1999). Color. Principles of Food Chemistry, 229-262.
Domozych, D., Ciancia, M., Fangel, J. U., Mikkelsen, M. D., Ulvskov, P., & Willats, W. G.
(2012). The cell walls of green algae: a journey through evolution and diversity. Frontiers
in plant science, 3, 82.
Eonseon, J., Polle, J. E. W., & Lee, H. K. S., M. Hyun, and M. Chang. 2003. Xanthophylls in
microalgae: from biosynthesis to biotechnological mass production and application. J.
Microbiol. Biotechnol, 13(2), 165-174.

27
Fassett R, Coombes J (2011) Astaxanthin: a potential therapeutic agent in cardiovascular disease.
Mar Drugs 9(3):447–465
Ferrell, J., & Sarisky-Reed, V. (2010). National algal biofuels technology roadmap (No.
DOE/EE-0332). EERE Publication and Product Library.
Flaibani A, Olsen Y, Painter TJ (1989) Polysaccharides in desert reclamation: compositions of
exocellular proteoglycan complexes produced by filamentous blue-green and unicellular
green edaphic algae. Carbohydr Res 190(2):235–248
Fleurence, J. (1999). Seaweed proteins: biochemical, nutritional aspects and potential uses.
Trends in food science & technology, 10(1), 25-28.
Food and Agricultural Organization/World Health Organization. (1973). Energy and protein
requirement: Report of a Joint FAO/WHO ad hoc Expert Committee, vol. 52, FAO.
Fowden, L. (1952). The composition of the bulk proteins of Chlorella. Biochemical Journal,
50(3), 355.
Galasso, C., Corinaldesi, C., & Sansone, C. (2017). Carotenoids from Marine Organisms:
Biological Functions and Industrial Applications. Antioxidants, 6(4), 96.
doi:10.3390/antiox6040096
Gallant, D.J., Bouchet, B. and Baldwin, P.M. (1997) Microscopy of starch: evidence of a new
level of granule organization. Carbohydr. Polym. 32: 177–191.
Geresh, S., Dubinsky, O., Arad, S., Christiaen, D., & Glaser, R. (1990). Structure of 3-O- (α-d-
glucopyranosyluronic acid)-l-galactopyranose, an aldobiouronic acid isolated from the
polysaccharides of various unicellular red algae. Carbohydrate Research, 208, 301-305.
doi: https://doi.org/10.1016/0008-6215(90)80116-K
Gidley, M.J. and Bulpin, P.V. (1987) Crystallisation of malto-oligosaccharides as models of the
crystalline forms of starch: minimum chain-length requirement for the formation of
double helices. Carbohydr. Res. 161: 291–300.
Glazer, A. N. (1994). Phycobiliproteins — a family of valuable, widely used fluorophores.
Journal of Applied Phycology, 6(2), 105-112. doi:10.1007/BF02186064
28
Glazer, A.N., 1989. Light guides. Directional energy transfer in a photosynthetic antenna. J. Biol.
Chem. 264:1-4
Graham, L. E., and L. W. Wilcox. 2000. Algae. Upper Saddle River: Prentice Hall.
Green, R. E., Sosik, H. M., Olson, R. J., & DuRand, M. D. (2003). Flow cytometric
determination of size and complex refractive index for marine particles: comparison with
independent and bulk estimates. Applied Optics, 42(3), 526-541.
Guckert, J. B., & Cooksey, K. E. (1990). Triglyceride accumulation and fatty acid profile
changes in Chlorella (Chlorophyta) during high Ph‐induced cell cycle Inhibition 1.
Journal of Phycology, 26(1), 72-79.
Guedes, A.C., Sousa-Pinto, I., Malcata, F.X. (2015). Application of protein of microalgae to
aquafeed in Handbook of Marine Microalgae Biotechnology Advances. Se-Kwan Kim
(ed.). Chp. 8, pp. 93-126.
Guschina, I. A., & Harwood, J. L. (2006). Lipids and lipid metabolism in eukaryotic algae.
Progress in Lipid Research, 45(2), 160-186.
doi:https://doi.org/10.1016/j.plipres.2006.01.001
Habib, M. A. B. (2008). Review on culture, production and use of Spirulina as food for humans
and feeds for domestic animals and fish. FAO Fisheries and Aquaculture Circular. No.
1034. http://www.fao.org/3/i0424e/i0424e00.pdf.
Harwood J.L. (1998) Membrane Lipids in Algae. In: Paul-André S., Norio M. (eds) Lipids in
Photosynthesis: Structure, Function and Genetics. Advances in Photosynthesis and
Respiration, vol 6. Springer, Dordrecht
Hejazi, M. A., & Wijffels, R. H. (2004). Milking of microalgae. Trends Biotechnol, 22(4), 189-
194. doi: 10.1016/j.tibtech.2004.02.009
Henríquez, V., Escobar, C., Galarza, J., & Gimpel, J. (2016). Carotenoids in microalgae
Carotenoids in Nature (pp. 219-237): Springer.
Hyka, P., Lickova, S., Přibyl, P., Melzoch, K., & Kovar, K. (2013). Flow cytometry for the
development of biotechnological processes with microalgae. Biotechnology advances,
31(1), 2-16.

29
Jeffrey SW, Llewellyn CA, Barlow RG, Mantoura RFC (1997). Pigment processes in the sea: a
selected bibliography. In: Jeffrey SW, Mantoura RFC, Wright SW (eds) Phytoplankton
pigments in oceanography. SCOR-UNESCO, Paris, p 167–178
Jenkins, P.J., Cameron, R.E. and Donald, A.M. (1993) A universal feature in the structure of
starch granules from different botanical sources. Starch 45: 417–420.
Kainuma, K. and French, D. (1972) Naegeli amylodextrin and its relationships to starch granule
structure. II. Role of water in crystallization of B-starch. Biopolymers 11: 2241–2250.
Kent, M., Welladsen, H. M., Mangott, A., & Li, Y. (2015). Nutritional evaluation of Australian
microalgae as potential human health supplements. PloS one, 10(2), e0118985.
Kim, J., Choi, W., Jeon, S. , Kim, T. , Park, A. , Kim, J. , Heo, S. , Oh, C. , Shim, W. and Kang,
D. (2015), Isolation and characterization of Leptolyngbya sp. KIOST‐1, a basophilic and
euryhaline filamentous cyanobacterium from an open paddle‐wheel raceway Arthrospira
culture pond in Korea. J Appl Microbiol, 119: 1597-1612. doi:10.1111/jam.12961
Kissoudi, M. Sarakatsianos, I., Samanidou, V. (2018). Isolation and purification of food‐grade C‐
phycocyanin from Arthrospira platensis and its determination in confectionery by HPLC
with diode array detection. J Separation Sci. 41(4): 975-981.
Komárek J. (1992): Diversita a moderní klasifikace sinic (Cyanoprocaryota) [Diversity and
modern classification of Cyanobacteria (Cyanoprokaryota). - inaugural dissertation, not
published
Lang, Imke et al. “Fatty Acid Profiles and Their Distribution Patterns in Microalgae: A
Comprehensive Analysis of More than 2000 Strains from the SAG Culture Collection.”
BMC Plant Biology 11 (2011): 124. PMC. Web. 16 Feb. 2018.
Lee, R. F., & Loeblich III, A. R. (1971). Distribution of 21: 6 hydrocarbon and its relationship to
22: 6 fatty acid in algae. Phytochemistry, 10(3), 593-602.
Lee, W. C. Y., Lee, W. H., & Rosenbaum, M. (1998). Chlorella: McGraw-Hill Education.
Levy, L. W. (2001). U.S. Patent No. 6,191,293. Washington, DC: U.S. Patent and Trademark
Office.

30
Li, Y., Horsman, M., Wu, N., Lan, C. Q., & Dubois‐Calero, N. (2008). Biofuels from
microalgae. Biotechnology progress, 24(4), 815-820.
Liang S., Liu X., Chen F., Chen Z. (2004) Current microalgal health food R & D activities in
China. In: Ang P.O. (eds) Asian Pacific Phycology in the 21st Century: Prospects and
Challenges. Developments in Hydrobiology, vol 173. Springer, Dordrecht
Manners, D.J. (1991) Recent developments in our understanding of glycogen structure.
Carbohydr. Polym. 16: 37–82.
Marie, D., Simon, N., & Vaulot, D. (2005). Phytoplankton cell counting by flow cytometry.
Algal culturing techniques, 1, 253-267.
Markou, G., Angelidaki, I., & Georgakakis, D. (2012). Microalgal carbohydrates: an overview of
the factors influencing carbohydrates production, and of main bioconversion technologies
for production of biofuels. Applied microbiology and biotechnology, 96(3), 631-645.
Matos, Â. P. (2017). The Impact of Microalgae in Food Science and Technology. Journal of the
American Oil Chemists' Society, 94(11), 1333-1350.
Morel, A. (1991). Optics of marine particles and marine optics. In Particle analysis in
oceanography (pp. 141-188). Springer, Berlin, Heidelberg.
Morris, H. J., Carrillo, O., Almarales, A., Bermúdez, R. C., Lebeque, Y., Fontaine, R., ... &
Beltrán, Y. (2007). Immunostimulant activity of an enzymatic protein hydrolysate from
green microalga Chlorella vulgaris L. on undernourished mice. Enzyme and Microbial
Technology, 40(3), 456-460.
Mohtashamian, M.S. 2012. "The Use of a Mixed Chlorella Cyanobacteria Culture as a Protein
Source for Aquaculture". LSU Master's Theses.
Muller-Feuga, A. (1996). Marine microalgae. The stakes of research. French Research Institute
for the Exploitation of the Sea, Plouzané.
Murakami, C., Takahashi, J., Shimpo, K., Maruyama, T., & Niiya, I. (1997). Lipids and fatty
acid compositions of Chlorella. Journal of Japan Oil Chemists' Society, 46(4), 423-427.
31
Nair, D., Krishna, J. G., Panikkar, M. V. N., Nair, B. G., Pai, J. G., & Nair, S. S. (2018).
Identification, purification, biochemical and mass spectrometric characterization of novel
phycobiliproteins from a marine red alga, Centroceras clavulatum. International Journal
of Biological Macromolecules, 114, 679-691. doi:
https://doi.org/10.1016/j.ijbiomac.2018.03.153
Nakamura, Y. (2002) Towards a better understanding of the metabolic system for amylopectin
biosynthesis in plants: rice endosperm as a model tissue. Plant Cell Physiol. 43: 718–725.
Nakamura, Y., Takahashi, J.-i., Sakurai, A., Inaba, Y., Suzuki, E., Nihei, S., . . . Kurano, N.
(2005). Some Cyanobacteria Synthesize Semi-Amylopectin Type α-Polyglucans Instead
of Glycogen. Plant and Cell Physiology, 46(3), 539-545. doi:10.1093/pcp/pci045
Neori A. “Green water” microalgae: the leading sector in world aquaculture. J Appl Phycol.
2011; 23: 143–149.
Nicoletti M. (2016). Microalgae Nutraceuticals. Foods (Basel, Switzerland), 5(3), 54.
doi:10.3390/foods5030054
Nomoto K, Yokokura T, Satoh H, Mutai M (1983) Anti-tumor effect by oral administration of
Chlorella extract, PCM-4 by oral admission (article in Japanese). Gan To Kagaku Zasshi
10:781–785
Ogawa, K., Ikeda, Y., & Kondo, S. (1999). A new trisaccharide, α-D-glucopyranuronosyl-
(1→3)-α-L-rhamnopyranosyl-(1→2)-α-L-rhamnopyranose from Chlorella vulgaris (Vol.
321).
Ogawa, M. A., & Parra‐Saldivar, R. (2015). Extraction and purification of high‐value
metabolites from microalgae: essential lipids, astaxanthin and phycobiliproteins.
Microbial biotechnology, 8(2), 190-209.
Olson, R. J., Vaulot, D., & Chisholm, S. W. (1985). Marine phytoplankton distributions
measured using shipboard flow cytometry. Deep Sea Research Part A. Oceanographic
Research Papers, 32(10), 1273-1280.
Ortiz-Tena, J. G., Rühmann, B., Schieder, D., & Sieber, V. (2016). Revealing the diversity of
algal monosaccharides: fast carbohydrate fingerprinting of microalgae using crude
biomass and showcasing sugar distribution in Chlorella vulgaris L. by biomass
fractionation. Algal Research, 17, 227-235.
32
Park, Y., Je, K.-W., Lee, K., Jung, S.-E., et al., Growth promotion of Chlorella ellipsoidea by co-
inoculation with Brevundimonas sp. isolated from the microalga. Hydrobiologia 2008,
598, 219-228.
Patel, A., Mishra, S., Pawar, R., & Ghosh, P. K. (2005). Purification and characterization of C-
Phycocyanin from cyanobacterial species of marine and freshwater habitat. Protein
Expression and Purification, 40(2), 248-255. doi:
https://doi.org/10.1016/j.pep.2004.10.028
Petkov, G., & Garcia, G. (2007). Which are fatty acids of the green alga Chlorella. Biochemical
Systematics and Ecology, 35(5), 281-285.
Pohl, P. and Zurheide, F. (1979b) Control of fatty acid and lipid formation in Baltic marine algae
by environmental factors. In Advances in the Biochemistry and Physiology of Plant
Lipids (Appelqvist, L.A. and Liljenberg, C., eds). Amsterdam: Elsevier, pp. 427–432.
Priyadarshani I, Biswajit R (2012) Commercial and industrial applications of micro algae – a
review. J Algal Biomass Utln 3(4):89–100
Pulz, O., & Scheibenbogen, K. (1998). Photobioreactors: design and performance with respect to
light energy input. In Bioprocess and algae reactor technology, apoptosis (pp. 123-152).
Springer, Berlin, Heidelberg.
Pulz, O., & Gross, W. (2004). Valuable products from biotechnology of microalgae. Applied
microbiology and biotechnology, 65(6), 635-648.
Rasmussen, U., Nilsson, M., 2003. Cyanobacterial Diversity and Specificity in Plant
Symbioses.Cyanobacteria in Symbiosis, in: Rai, A.N., Bergman, B., Rasmussen, U.
(Eds.). Springer Netherlands, pp. 313-328.
Raven J.A., Beardall J. (2003) Carbohydrate Metabolism and Respiration in Algae. In: Larkum
A.W.D., Douglas S.E., Raven J.A. (eds) Photosynthesis in Algae. Advances in
Photosynthesis and Respiration, vol 14. Springer, Dordrecht
Rismani-Yazdi, H., Haznedaroglu, B. Z., Bibby, K., & Peccia, J. (2011). Transcriptome
sequencing and annotation of the microalgae Dunaliella tertiolecta: pathway description
and gene discovery for production of next-generation biofuels. BMC genomics, 12(1),
148.
33
Rowan, K. S. (1989). Photosynthetic pigments of algae: CUP Archive.
Sabine, C. L., & Feely, R. A. (2007). 3 The Oceanic Sink for Carbon Dioxide. Greenhouse Gas
Sinks, 31.
Safi, C., Zebib, B., Merah, O., Pontalier, P.-Y., & Vaca-Garcia, C. (2014). Morphology,
composition, production, processing and applications of Chlorella vulgaris: A review.
Renewable and Sustainable Energy Reviews, 35, 265-278. doi:
https://doi.org/10.1016/j.rser.2014.04.007
Seckbach, J. (1999). Cellular origin, life in extreme habitats and astrobiology.
Sensen, C. W., Heimann, K., & Melkonian, M. (1993). The production of clonal and axenic
cultures of microalgae using fluorescence-activated cell sorting. European Journal of
Phycology, 28(2), 93-97.
Seo, Y. C., Choi, W. S., Park, J. H., Park, J. O., Jung, K.-H., & Lee, H. Y. (2013). Stable
Isolation of Phycocyanin from Spirulina platensis Associated with High-Pressure
Extraction Process. International Journal of Molecular Sciences, 14(1), 1778-1787.
Seyfabadi, Z. R., Zahra Amini Khoeyi. (2011). Protein, fatty acid, and pigment content of
Chlorella vulgaris L. under different light regimes. Journal of Applied Phycology, 23(4),
721-726. doi:10.1007/s10811-010-9569-8
Sharma, N. K., Rai, A. K., & Stal, L. J. (2013). Cyanobacteria: an economic perspective. John
Wiley & Sons.
Shepherd R, Rockey J, Sutherland IW, Roller S (1995) Novel bioemulsifiers from
microorganisms for use in foods. J Biotechnol 40(3):207–217
Shimura, Y., Hirose, Y., Misawa, N., Osana, Y., Katoh, H., Yamaguchi, H., & Kawachi, M.
(2015). Comparison of the terrestrial cyanobacterium Leptolyngbya sp. NIES-2104 and
the freshwater Leptolyngbya boryana PCC 6306 genomes. DNA Research, 22(6), 403-
412.
Silaban, A. G. (2013). Growth rate and productivity of a Louisiana native
microalgae/cyanobacteria co-culture: Feasibility for use in industrial biotechnology
applications. LSU Master’s Thesis Commons. pp. 202.

34
Spolaore, P., Joannis-Cassan, C., Joannis-Cassan, E., Isambert, A., Commercial applications of
microalgae – review. J. Biosci. Bioeng. 2006, 101, 87–96.
Sui, Z., Gizaw, Y., & BeMiller, J. N. (2012). Extraction of polysaccharides from a species of
Chlorella. Carbohydrate Polymers, 90(1), 1-7. doi:
http://dx.doi.org/10.1016/j.carbpol.2012.03.062
Tate, John Joseph, "Differential Gene Expression in a Louisiana Strain of Microalgae" (2012).
LSU Master's Theses. 3945. https://digitalcommons.lsu.edu/gradschool_theses/3945
Tate, J. J., Gutierrez-Wing, M. T., Rusch, K. A., & Benton, M. G. (2013). Gene expression
analysis of a Louisiana native Chlorella vulgaris L. (Chlorophyta)/Leptolyngbya sp.
(Cyanobacteria) co-culture using suppression subtractive hybridization. Engineering in
Life Sciences, 13(2), 185-193. doi:10.1002/elsc.201200063
Thompson, D.B. (2000) On the non-random nature of amylopectin branching. Carbohydr.
Polym. 43: 223–239
Thrive Algae. (2017). Thrive Algae Oil. Visited 4/16/17. http://www.thrivealgae.com/resources/
Trabelsi L, M’sakni NH, Ouada HB, Bacha H, Roudesli S (2009) Partial characterization of
extracellular polysaccharides produced by cyanobacterium Arthrospira platensis.
Biotechnol Bioprocess Eng 14:27–31
Trask, B. J., Van den Engh, G. J., & Elgershuizen, J. H. B. W. (1982). Analysis of phytoplankton
by flow cytometry. Cytometry: The Journal of the International Society for Analytical
Cytology, 2(4), 258-264.
Ursu, A. V., Marcati, A., Sayd, T., Sante-Lhoutellier, V., Djelveh, G., & Michaud, P. (2014).
Extraction, fractionation and functional properties of proteins from the microalgae
Chlorella vulgaris. Bioresource technology, 157, 134-139.
Wada, H., & Murata, N. (1998). Membrane lipids in cyanobacteria. In Lipids in photosynthesis:
structure, function and genetics (pp. 65-81). Springer, Dordrecht.
Waggoner, B., & Speer, B. R. (1999). Photosynthetic Pigments. Website: http://www. ucmp.
berkeley. edu/glossary/gloss3/pigments. html.
35
Xu, H., Miao, X., Wu, Q., High quality biodiesel production from a microalga Chlorella
protothecoides by heterotrphic growth in fermenters. (2006). J. Biotech. 126, 499–507
Yentsch, C. M., Horan, P. K., Muirhead, K., Dortch, Q., Haugen, E., Legendre, L., ... & Spinrad,
R. W. (1983). Flow cytometry and cell sorting: A technique for analysis and sorting of
aquatic particles1. Limnology and Oceanography, 28(6), 1275-1280.
Yim, J. H., Kim, S. J., Ahn, S. H., & Lee, H. K. (2003). Optimal conditions for the production of
sulfated polysaccharide by marine microalga Gyrodinium impudicum strain KG03.
Biomolecular engineering, 20(4-6), 273-280.
Yu, M. H. and Glazer, N. A., Cyanobacterial Phycobilisomes. Role of the Linker Polypeptides in
the Assembly of Phycocyanin. (1982). The Journal of Biological Chemistry, 257, No. 7,
3429.
36
Chapter 3. Louisiana Native Co-Culture of Microalgae (Chlorella Vulgaris L.)
and Cyanobacteria (Leptolyngbya sp.) Cultivation
3.1. Introduction
Louisiana native co-culture of microalgae (Chlorella vulgaris L.) and cyanobacteria
(Leptolyngbya sp.) (CCA) was provided by Dr. Gutierrez-Wing in the Aquatic Germplasm and
Genetic Resources center of the School of Renewable Natural Resources, LSU Ag Center. To
increase cyanobacteria in a culture it was starved for nitrogen, by feeding CO2 directly, mixing
mechanically (Pulz, 2001; Zhang, 2015). The CCA was cultivated using the growth parameters:
scalar irradiance, pH, temperature, growth media, and aeration. The growth parameters are
discussed in the subsequent sections. Two irradiance treatments were applied to CCA in this
study. The objective of this study was to cultivate 6 CCA cultures, 3 cultures were exposed to
average scalar irradiance (ASI) 1041 ± 269.18 μmol m-2 s-1 PAR and will be referred to as
Treatment 1 and the other 3 cultures were exposed to ASI 430 ± 96.03 μmol m-2 s-1 PAR and will
be referred to as a Treatment 2 . This study’s aim was not to optimize CCA growth, the focus
was creating biomass to compare the previously stated treatments.
3.2. Methods for Growing Algae Co-Cultures
Algae was grown in batch systems. In a batch system culture cells were grown in a
specific volume of nutrient medium under environmental conditions, no dead cells were
removed, and no nutrients were added. Large 120-gallon tanks were used, under 400 W metal
halide lights. Cultures were grown in Bold 1NV Medium which is described later in section
3.2.6. (Bold, 1949; Brown and Bold, 1964; Starr and Zeikus, 1993; UTEX, 2016). Cultures were
continuously aerated at 45 liters per minute (LPM) using ambient air. Carbon dioxide was
injected as needed to provide a carbon source and control the culture pH at around 7.0.

37
Dechlorinated tap water was used in the culture, and 19 L of inoculum at 25°C. Optical density,
pH, temperature and aeration were monitored daily and, flow cytometry was used to determine
the ratio of algae species present in the co-culture every 7 days.
Prior to inoculation, the following preparation protocol was used: the tank was cleaned
with 6% sodium hypochlorite, the tank was filled with a 50ppm sodium hypochlorite-tap water
solution. This solution was aerated for 72 h for disinfection of the water. Sodium thiosulfate (50
ppm) was added to the water with 4 h aeration initially, to remove chlorine. Chlorine was
measured, with indicator testing strips. If the water did not read 0 ppm for chlorine at this time,
sodium thiosulfate was added in 100 mL aliquots and measured, until chlorine was at 0 ppm.
Bold 1NV Medium nutrients (section 3.2.6.) were added and allowed to equilibrate 72 h,
inoculum (section 3.2.8.) was then added, with the previously stated parameters measured daily.
Algae was harvested during stationary phase which is determined as on the first day of
decrease in optical density, using a semi-continuous flow centrifuge at 2L/min. All cultures were
frozen after harvest and stored at 4°C short-term (2 months) or at -20˚C long-term (3-12
months).
3.2.1. Flow Cytometry
3.2.1.1. Sample Preparation
Samples were taken directly from the cultures and sonicated for 3 min at 40% AMP,
pulse 20s on/10s off, on ice (Hyka and others, 2013; Gutierrez-Wing, unpublished work).
Samples were run on the flow cytometer and if the initial cell count was higher than 10,000/µL.
diluted 10x with deionized water.
38
3.2.1.2. System Conditions
In this study cell concentrations (cells μL-1) were measured by flow cytometry with a BD
Accuri™ C6 Flow Cytometer. CCA cells were excited by blue (488nm) and red laser (640nm).
Fluorescence from CCA was captured in filters FL3 (excitation wavelength of 488 nm and
emission of > 670 LP) and FL4 (excitation wavelength of 640 nm and emission of 675 ± 12.5).
Optical channels of forward scatter channel (FSC) 0 ±15 ̊ used to detect cell size and side scatter
channel (SSC) that detects 90 ±15 ̊ with FL3 and FL4 were used to calculate the abundance of
Chlorella and cyanobacteria in CCA. FL3 was used to identify chlorophyll-a and FL4 to identify
phycocyanin. The filters were chosen based on previous studies (Barnett and others, 2017). Data
was analyzed using BD Accuri™ C Flow Plus software. An aliquot of the culture was analyzed
every seven days to ensure culture growth and validate culture species ratio.
The flow cytometry protocol began by checking fluid levels in all bottles, the sample
injection port (SIP) was then cleaned by performing a backflush with sheath fluid 2-3 times to
remove clogs and residue at the base of SIP, dripping sheath fluid was seen coming from the SIP.
The startup protocol was run as follows: an Eppendorf tube with 2 mL of de-ionized water was
placed on the SIP then the cursor was moved to any empty data well in the C Flow software, the
time limit was set for two minutes, nominal flow rate was set to fast (66 ul/min), and the system
was run, deionized water was run first, until number of events was <10/ul. An Eppendorf tube
containing 1 mL of well-mixed culture was then placed on the SIP and ran for 2 mins at a
nominal flow rate: slow (14 ul/min).
The BD Accuri C6 flow cytometer cyanobacteria cell detection range was 101 – 103 RFU
(relative fluorescence units), Chlorella cell range detection limits were 104-106 RFU. The
39
relative concentration of microalgal and cyanobacterial cells was determined by their
autofluorescence due to chlorophyll and phycocyanin.
3.2.2. Scalar Irradiance
Treatment 1 was a culture exposed to average scalar irradiance (ASI) of 1041 ± 269.18
μmol m-2 s-1 PAR. This irradiance was obtained by suspending metal halide (400 W) lamps 10”
above the culture’s surface. Treatment 2 was a culture exposed to ASI of 430 ± 96.03 μmol m-2 s-
1 PAR. This irradiance was obtained by suspending metal halide (400 W) lamps 25” above the
cultures surface, diffusing the light. Previous studies showed that with reduced light a decrease in
Chlorella growth was observed, allowing cyanobacteria ratio to increase (Bai, 2012; Silaban,
2012; Barnett and others, 2015).
A light sensing logger LI-COR 1400 paired with an LI-193 Underwater Spherical
Quantum Sensor was used to evaluate light initial scalar irradiance. Distribution of light in the
tanks varied so a weighted average was taken to determine the initial light intensity. The initial
scalar irradiance was measured in tap water. Each tank was divided into 3 depths (1, 14 and 27”
from surface of the water) and 3 concentric rings. To determine the concentric rings, 4
measurements were taken at each depth, one at the center, 8, 16 and 24 inches away from the
center. Scalar irradiance for each ring was determined by average the light intensity from two
points of the ring multiplied by the surface area of the respected ring. For example, for the center
ring the average scalar irradiance would be average light intensity at the center and 8” multiplied
by the area. For the next ring the average scalar irradiance would be the average light intensity at
8 and 16” multiplied by the surface area of the ring. The summation of each scalar irradiance
determined the weighted sum at a specific depth. The average of all the weighted sums over all
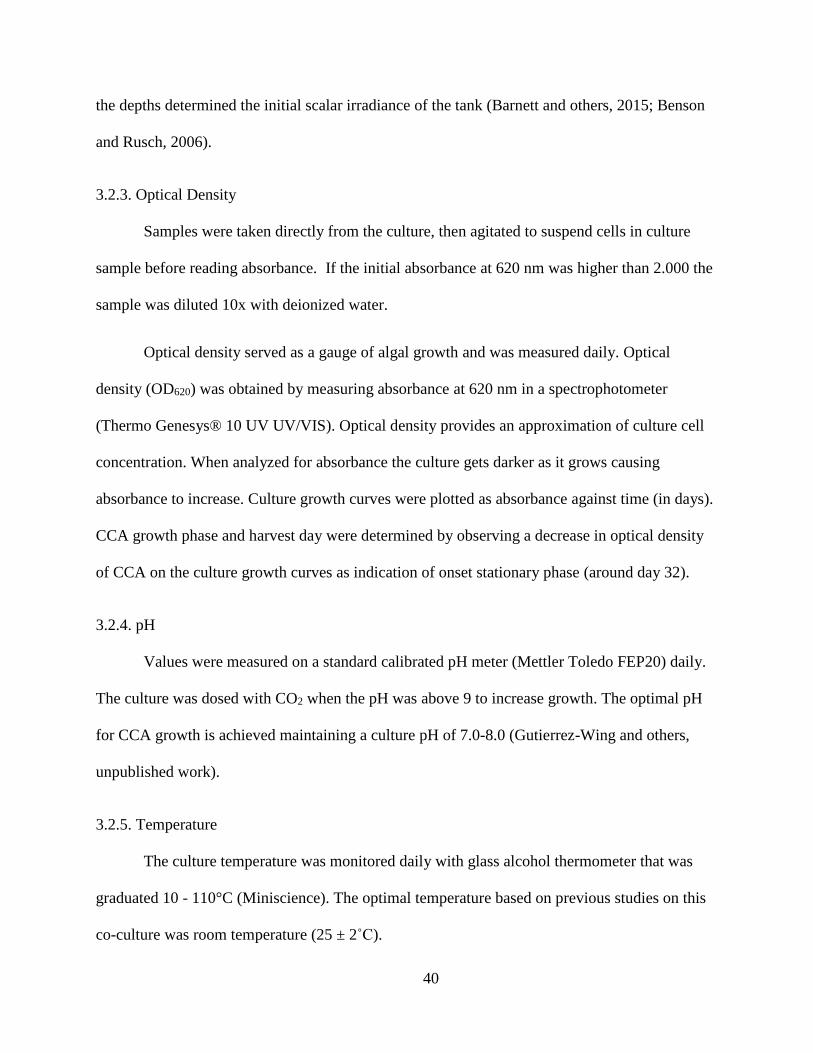
40
the depths determined the initial scalar irradiance of the tank (Barnett and others, 2015; Benson
and Rusch, 2006).
3.2.3. Optical Density
Samples were taken directly from the culture, then agitated to suspend cells in culture
sample before reading absorbance. If the initial absorbance at 620 nm was higher than 2.000 the
sample was diluted 10x with deionized water.
Optical density served as a gauge of algal growth and was measured daily. Optical
density (OD620) was obtained by measuring absorbance at 620 nm in a spectrophotometer
(Thermo Genesys® 10 UV UV/VIS). Optical density provides an approximation of culture cell
concentration. When analyzed for absorbance the culture gets darker as it grows causing
absorbance to increase. Culture growth curves were plotted as absorbance against time (in days).
CCA growth phase and harvest day were determined by observing a decrease in optical density
of CCA on the culture growth curves as indication of onset stationary phase (around day 32).
3.2.4. pH
Values were measured on a standard calibrated pH meter (Mettler Toledo FEP20) daily.
The culture was dosed with CO2 when the pH was above 9 to increase growth. The optimal pH
for CCA growth is achieved maintaining a culture pH of 7.0-8.0 (Gutierrez-Wing and others,
unpublished work).
3.2.5. Temperature
The culture temperature was monitored daily with glass alcohol thermometer that was
graduated 10 - 110°C (Miniscience). The optimal temperature based on previous studies on this
co-culture was room temperature (25 ± 2˚C).
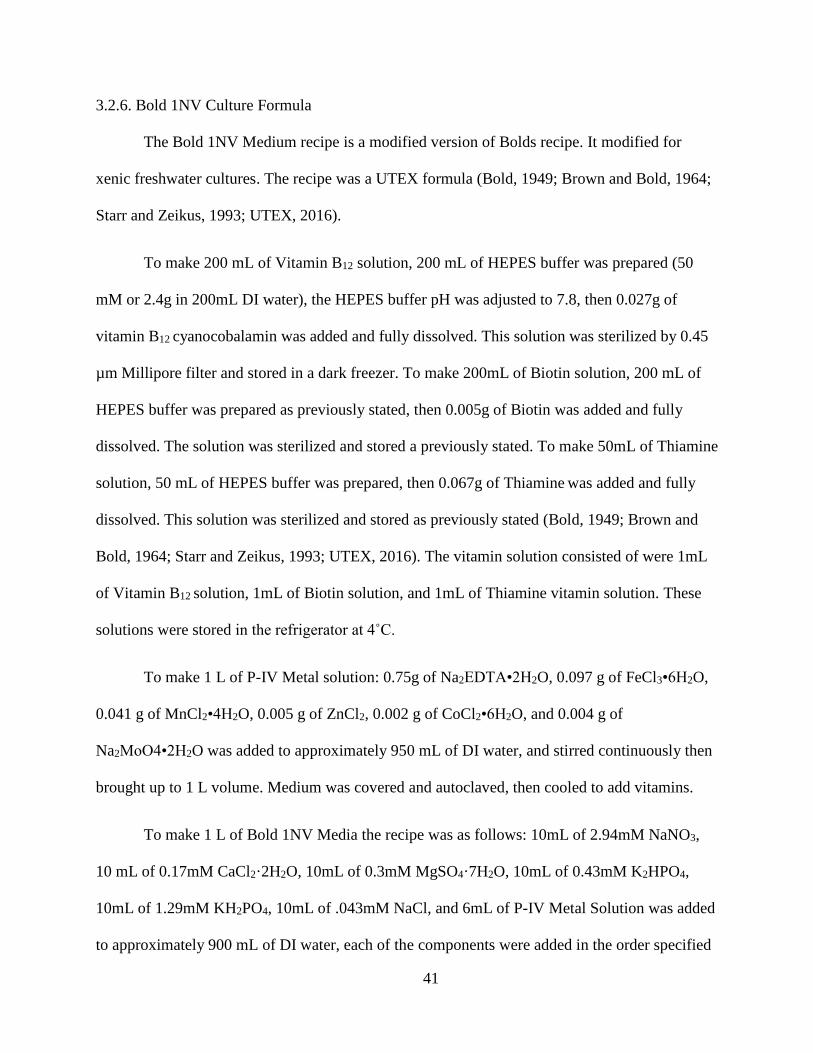
41
3.2.6. Bold 1NV Culture Formula
The Bold 1NV Medium recipe is a modified version of Bolds recipe. It modified for
xenic freshwater cultures. The recipe was a UTEX formula (Bold, 1949; Brown and Bold, 1964;
Starr and Zeikus, 1993; UTEX, 2016).
To make 200 mL of Vitamin B12 solution, 200 mL of HEPES buffer was prepared (50
mM or 2.4g in 200mL DI water), the HEPES buffer pH was adjusted to 7.8, then 0.027g of
vitamin B12 cyanocobalamin was added and fully dissolved. This solution was sterilized by 0.45
µm Millipore filter and stored in a dark freezer. To make 200mL of Biotin solution, 200 mL of
HEPES buffer was prepared as previously stated, then 0.005g of Biotin was added and fully
dissolved. The solution was sterilized and stored a previously stated. To make 50mL of Thiamine
solution, 50 mL of HEPES buffer was prepared, then 0.067g of Thiamine was added and fully
dissolved. This solution was sterilized and stored as previously stated (Bold, 1949; Brown and
Bold, 1964; Starr and Zeikus, 1993; UTEX, 2016). The vitamin solution consisted of were 1mL
of Vitamin B12 solution, 1mL of Biotin solution, and 1mL of Thiamine vitamin solution. These
solutions were stored in the refrigerator at 4˚C.
To make 1 L of P-IV Metal solution: 0.75g of Na2EDTA•2H2O, 0.097 g of FeCl3•6H2O,
0.041 g of MnCl2•4H2O, 0.005 g of ZnCl2, 0.002 g of CoCl2•6H2O, and 0.004 g of
Na2MoO4•2H2O was added to approximately 950 mL of DI water, and stirred continuously then
brought up to 1 L volume. Medium was covered and autoclaved, then cooled to add vitamins.
To make 1 L of Bold 1NV Media the recipe was as follows: 10mL of 2.94mM NaNO3,
10 mL of 0.17mM CaCl2·2H2O, 10mL of 0.3mM MgSO4·7H2O, 10mL of 0.43mM K2HPO4,
10mL of 1.29mM KH2PO4, 10mL of .043mM NaCl, and 6mL of P-IV Metal Solution was added
to approximately 900 mL of DI water, each of the components were added in the order specified

42
(except vitamins) while stirring continuously, the volume was then brought up to 1 L volume.
These solutions were stored in the refrigerator at 4˚C.
3.2.7. Aeration
Aeration was provided from two air pumps (Danner Manufacturing, Inc. Pondmaster
AP100, #04580) connected to tanks by silicone tubing and a distribution manifold submerged
inside the culture. Air flow was measured by water displacement. For the purposes of this study,
water displacement was used as a measure of aeration by being a measure of volume. A cylinder
of known volume was submerged in the culture water upside down, the air hose nozzle was
placed in the cylinder causing air to displace the culture in the cylinder, a timer was running
concurrently as the water was displaced by the air. This process was timed and provided a rate of
volume of air/second. Knowing the amount of time needed to displace the culture and the
volume of the cylinder allows the aeration to be quantified in liters per second (Gutierrez-Wing,
unpublished work).
Aeration in this study served as a physical source of continuous mixing of the cocultures.
The air bubbles allowed algae cells to scatter, and kept the cells suspended in culture. This
allowed cells to cycle to higher/lower irradiance in the tank. The air pump connected to tank 1
had a greater capacity to aerate cultures, when compared to tank 2, as the LPM (liters per
minute) is 42.20 ± 3.60 and 39.92 ± 0.90 LPM respectively. There was no significant difference
between aeration pumps of tank 1 and tank 2 at p<.05 (p= 0.34).
3.2.8. Inoculum Cultivation
Inoculum was grown from CCA that was provided by Dr. Gutierrez-Wing in the Aquatic
Germplasm and Genetic Resources center of the School of Renewable Natural Resources, LSU

43
Ag Center. Inoculum was received in small 250mL cultures, it was grown in 19 L batches under
LED lamps, in Bold 1NV Medium, at ~45 LPM using continuous ambient air, the pH was
maintained at pH 7 – 9 with CO2, the temperature was maintained at room temperature (~25 ±
2°C). Optical density and flow cytometry were observed to identify onset of stationary phase in
the inoculum culture.
3.2.9. Chlorination
Chlorine level was analyzed by chlorine testing strips with 0-200 ppm testing limits
(Precision Laboratories, Cottonwood, AZ). This testing was only necessary after adding tap
water and 6% sodium hypochlorite solution (bleach) to the 120-gallon tank to start a culture and
after cleaning the tanks between cultures. Air flowed into the chlorinated water for several hours
and effectively evaporated chlorine. Sodium thiosulfate was added to ensure that there was no
chlorine present prior to the start of the cultures.
3.2.10. Experimental Design
The experiment was conducted in a completely randomized design (CRD), with no
blocks. Six tanks were chosen at random to contain one of the two treatments, Treatment 1 –
cultures exposed to ASI of 1041 ± 269.18 μmol m-2 s-1 PAR and Treatment 2– cultures exposed
to ASI 430 ± 96.03 μmol m-2 s-1 PAR. The co-culture species ratio (Chlorella: Cyanobacteria)
was the response of the treatments. The experimental and sampling units were the algae tanks.
An illustration of the experimental design can be seen in Figure 3.1. The different analyses are
the dependent variables that were compared between treatment levels.
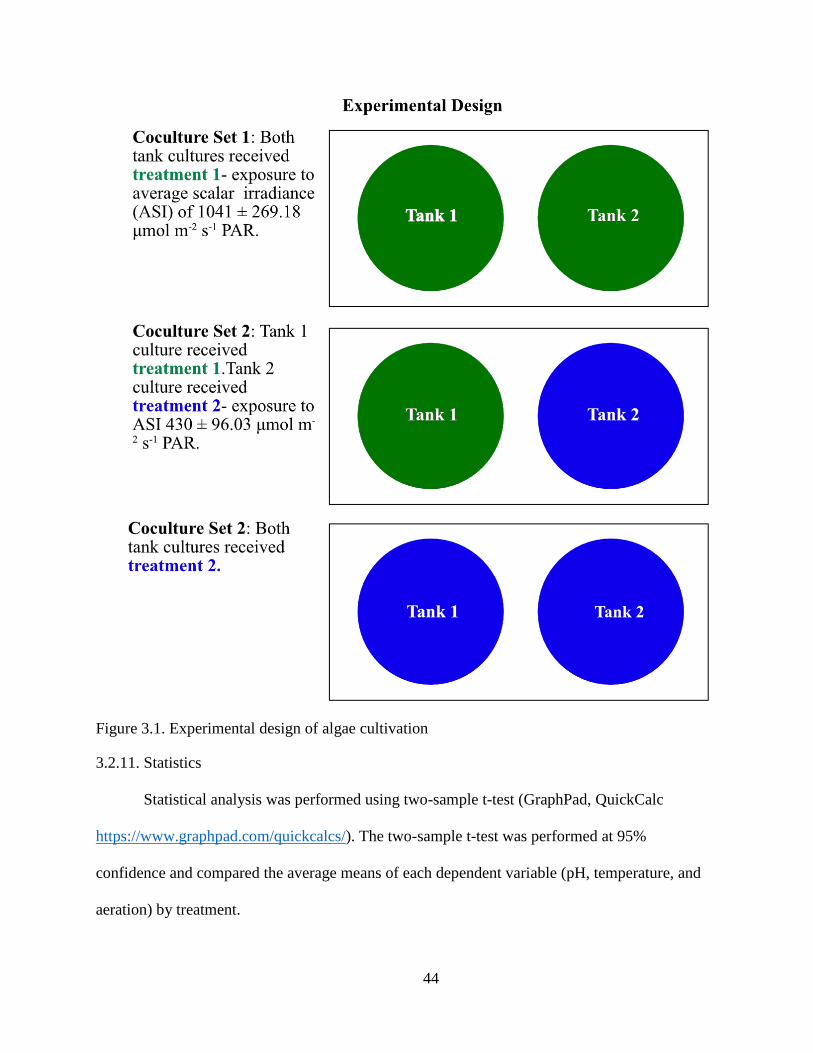
44
Figure 3.1. Experimental design of algae cultivation
3.2.11. Statistics
Statistical analysis was performed using two-sample t-test (GraphPad, QuickCalc
https://www.graphpad.com/quickcalcs/). The two-sample t-test was performed at 95%
confidence and compared the average means of each dependent variable (pH, temperature, and
aeration) by treatment.

45
3.3. Results and Discussion
Biomass wet weight was measured post-harvest from each of the six tanks. They were
found to be 0.76 ± 0.20 g/L or 760 ±200 g/m3 for treatment 1, and 0.71 ± 0.13 g/L or 710±130
g/m3 for treatment 2. There was no significant difference in biomass weight between treatments
at 95% confidence (p = 0.71). The high wet biomass weight is a relative indicator that CCA
responded positively to the treatments applied. Barnett (2015) found that the average volumetric
and areal productivity for the last tank in a continuous flow hydraulically integrated serial
turbidostat algal reactor (HISTAR) system was 25.0 g m-3 d-1 and 13.3 g m-3 d-1 for CCA cultures
exposed to ASI 454 μmol m-2 s-1. Silaban (2013) grew CCA at ASI 550 μmol m-2 s-1 and found
27.0 g m-3 d-1 for flow rate 1 L/min.
3.3.1. Flow Cytometry
The CFlow Plus program provided a table with a quantification of events, this table
displayed cell concentration verification (Table 3.1). The tables showed results of cell counts, in
a sample volume of about 26.6 µL for each tank that grown. The cultures cells μL-1 increased as
the number of days the culture was grown increased.
From the flow cytometer (Figure 3.2 and Table 3.1) it can be determined that Chlorella vulgaris
L. was the dominant species in CCA, when compared to cyanobacteria Leptolyngbya. This was
the expected response from the irradiance levels each treatment was exposed to. Chlorella was
the dominant species present in CCA from starter culture to harvest. Figure 3.2. displays the plot
of flow cytometry when comparing the two treatment levels of species at different ratios. Using
the proper channels FL4-A, and FL3-A determined cyanobacteria (Cya)and Chlorella (Chl).
Two distinct species can be seen in the flow cytometry spectra in Figure 3.2. FSC-A vs. FL3-H
was used to identify the two algae species by sorting by size and pigment respectively. The top
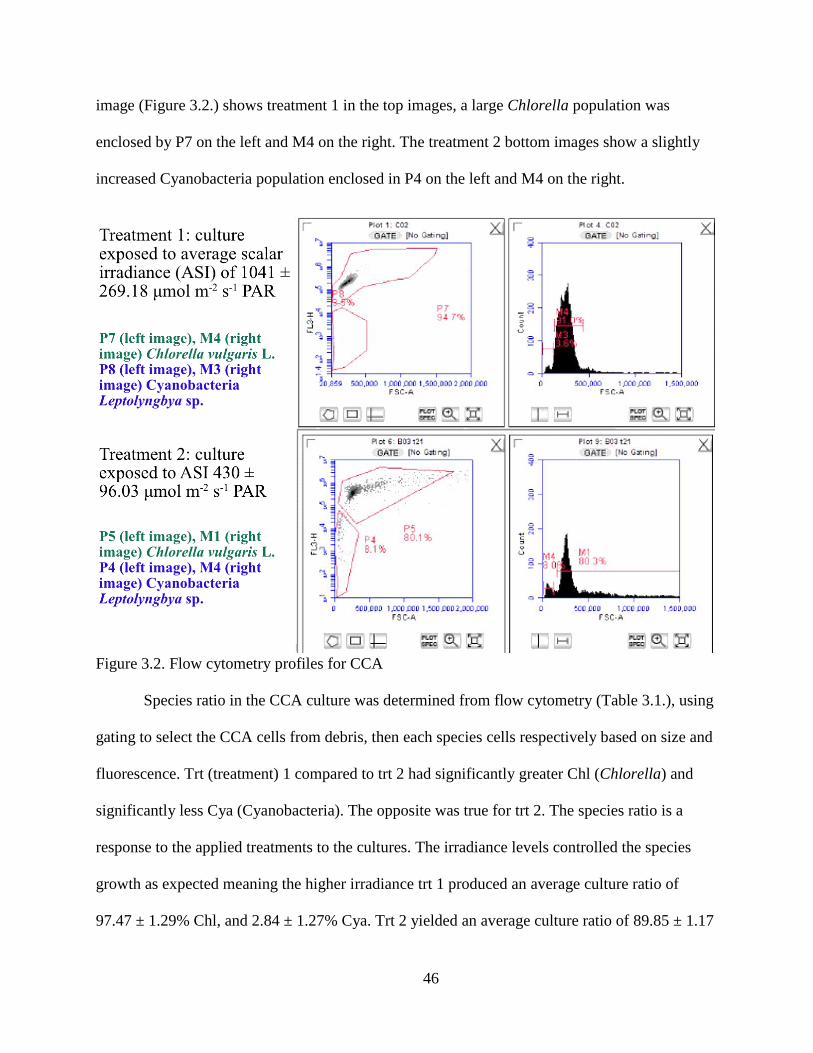
46
image (Figure 3.2.) shows treatment 1 in the top images, a large Chlorella population was
enclosed by P7 on the left and M4 on the right. The treatment 2 bottom images show a slightly
increased Cyanobacteria population enclosed in P4 on the left and M4 on the right.
Figure 3.2. Flow cytometry profiles for CCA
Species ratio in the CCA culture was determined from flow cytometry (Table 3.1.), using
gating to select the CCA cells from debris, then each species cells respectively based on size and
fluorescence. Trt (treatment) 1 compared to trt 2 had significantly greater Chl (Chlorella) and
significantly less Cya (Cyanobacteria). The opposite was true for trt 2. The species ratio is a
response to the applied treatments to the cultures. The irradiance levels controlled the species
growth as expected meaning the higher irradiance trt 1 produced an average culture ratio of
97.47 ± 1.29% Chl, and 2.84 ± 1.27% Cya. Trt 2 yielded an average culture ratio of 89.85 ± 1.17
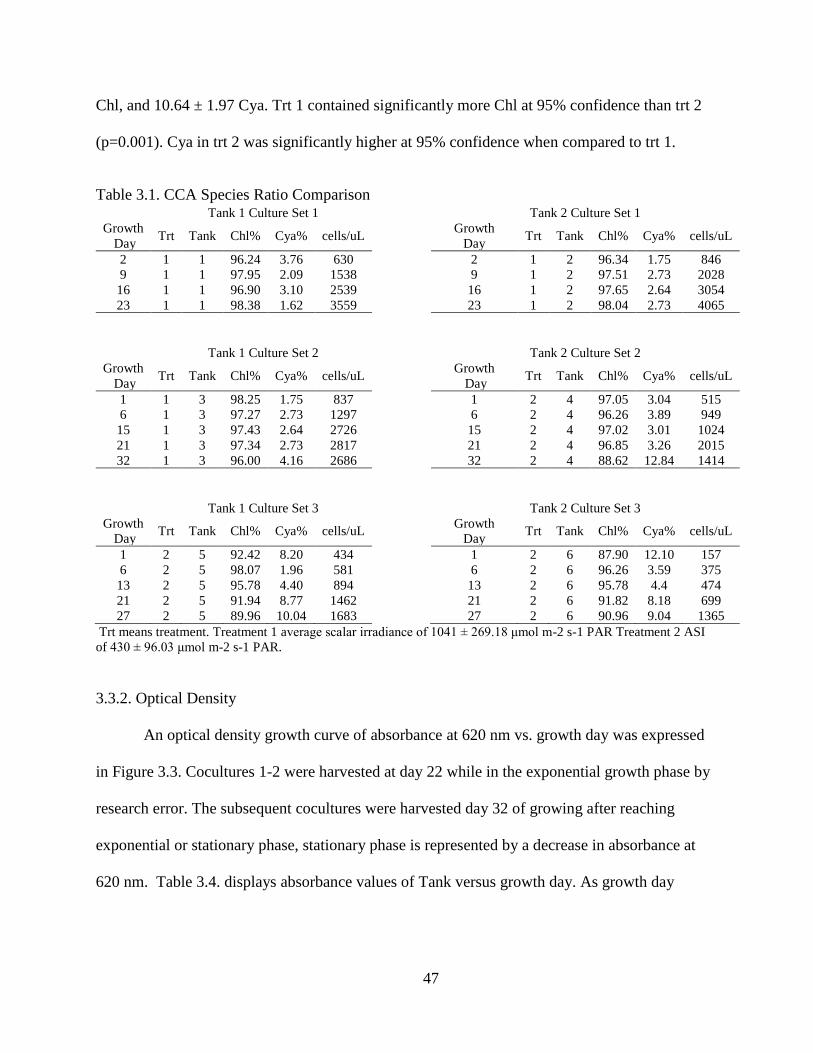
47
Chl, and 10.64 ± 1.97 Cya. Trt 1 contained significantly more Chl at 95% confidence than trt 2
(p=0.001). Cya in trt 2 was significantly higher at 95% confidence when compared to trt 1.
Table 3.1. CCA Species Ratio Comparison Tank 1 Culture Set 1 Tank 2 Culture Set 1
Growth
Day Trt Tank Chl% Cya% cells/uL Growth
Day Trt Tank Chl% Cya% cells/uL
2 1 1 96.24 3.76 630 2 1 2 96.34 1.75 846
9 1 1 97.95 2.09 1538 9 1 2 97.51 2.73 2028
16 1 1 96.90 3.10 2539 16 1 2 97.65 2.64 3054
23 1 1 98.38 1.62 3559 23 1 2 98.04 2.73 4065
Tank 1 Culture Set 2 Tank 2 Culture Set 2
Growth
Day Trt Tank Chl% Cya% cells/uL Growth
Day Trt Tank Chl% Cya% cells/uL
1 1 3 98.25 1.75 837 1 2 4 97.05 3.04 515
6 1 3 97.27 2.73 1297 6 2 4 96.26 3.89 949
15 1 3 97.43 2.64 2726 15 2 4 97.02 3.01 1024
21 1 3 97.34 2.73 2817 21 2 4 96.85 3.26 2015
32 1 3 96.00 4.16 2686 32 2 4 88.62 12.84 1414
Tank 1 Culture Set 3 Tank 2 Culture Set 3
Growth
Day Trt Tank Chl% Cya% cells/uL Growth
Day Trt Tank Chl% Cya% cells/uL
1 2 5 92.42 8.20 434 1 2 6 87.90 12.10 157
6 2 5 98.07 1.96 581 6 2 6 96.26 3.59 375
13 2 5 95.78 4.40 894 13 2 6 95.78 4.4 474
21 2 5 91.94 8.77 1462 21 2 6 91.82 8.18 699
27 2 5 89.96 10.04 1683 27 2 6 90.96 9.04 1365
Trt means treatment. Treatment 1 average scalar irradiance of 1041 ± 269.18 μmol m-2 s-1 PAR Treatment 2 ASI
of 430 ± 96.03 μmol m-2 s-1 PAR.
3.3.2. Optical Density
An optical density growth curve of absorbance at 620 nm vs. growth day was expressed
in Figure 3.3. Cocultures 1-2 were harvested at day 22 while in the exponential growth phase by
research error. The subsequent cocultures were harvested day 32 of growing after reaching
exponential or stationary phase, stationary phase is represented by a decrease in absorbance at
620 nm. Table 3.4. displays absorbance values of Tank versus growth day. As growth day

48
increased absorbance increased. Tank 3: Trt 2 and Tank 6: Trt 2 experienced a decrease in
absorbance at day 32 compared to the other tanks.
Trt means treatment. Treatment 1 average scalar irradiance of 1041 ± 269.18 μmol m-2 s-1 PAR Treatment 2 ASI of
430 ± 96.03 μmol m-2 s-1 PAR. provided optical density for cocultures, displays of absorbance OD620 vs. growth
day.
Figure 3.3. Optical Density of CCA
Table 3.2. Optical Density of CCA
Growth Day 0 7 13 22 25 30 32
Tank 1: Trt 1 0.075 0.100 0.077 0.150 ND ND ND
Tank 2: Trt 1 0.080 0.099 0.083 0.143 ND ND ND
Tank 3: Trt 1 0.067 0.101 0.165 0.363 0.487 0.664 0.278
Tank 4: Trt 2 0.060 0.071 0.080 0.125 0.203 0.333 0.347
Tank 5: Trt 2 0.070 0.079 0.157 0.224 0.263 0.309 0.350
Tank 6: Trt 2 0.068 0.092 0.180 0.247 0.294 0.285 0.241
Trt means treatment. Treatment 1 average scalar irradiance of 1041 ± 269.18 μmol m-2 s-1 PAR Treatment 2 ASI of
430 ± 96.03 μmol m-2 s-1 PAR. expressed in absorbance at 620nm
3.3.4. pH
The cocultures pH fluctuated from 7.0-8.1 during the initial log and exponential growth
phases but as the cells matured the pH increased and required dosing with CO2 as seen in Table
3.3. In previous studies of Chlorella sp., it was found that biomass and lipid productivities were
highest at pH 7.5 by Moheimani (2013). After exponential growth phase cultures maintained a
0.000
0.100
0.200
0.300
0.400
0.500
0.600
0.700
0 7 9 1 3 2 2 2 5 3 0 3 2
Ab
sorb
acn
e at
62
0 n
m
Growth Day
CCA Optical DensityTank 6: Trt 2 Tank 5: Trt 2 Tank 4: Trt 2
Tank 3: Trt 1 Tank 2: Trt 1 Tank 1: Trt 1
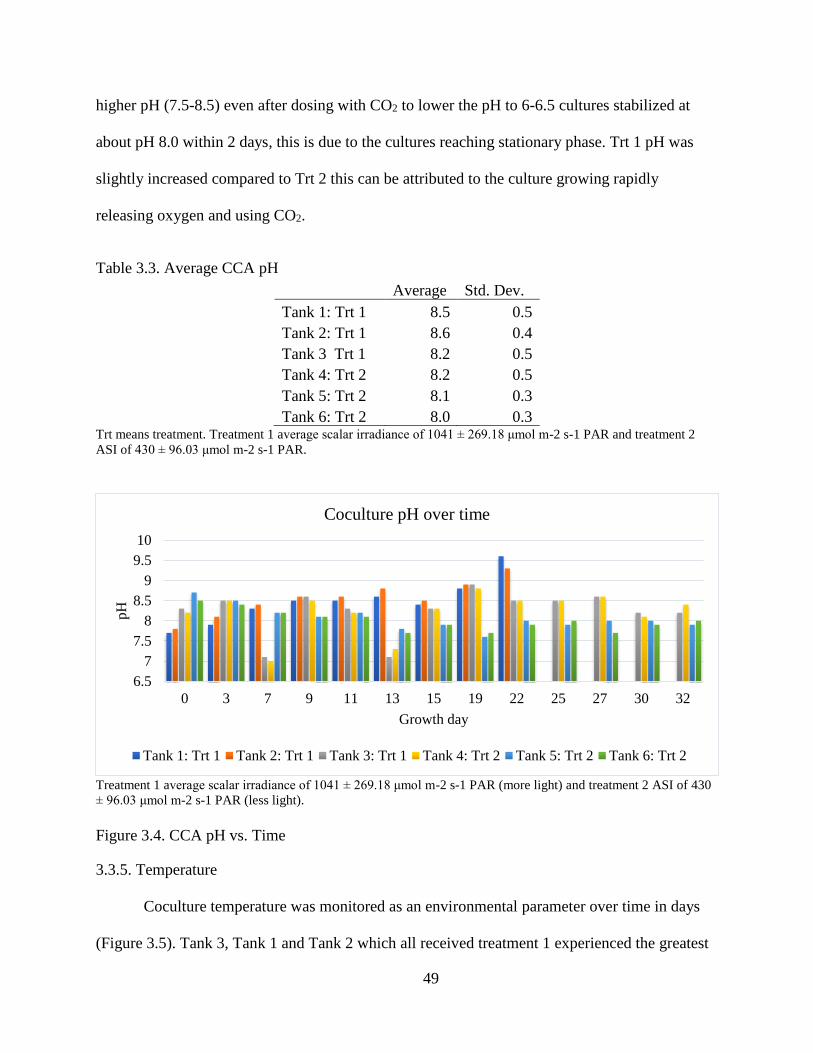
49
higher pH (7.5-8.5) even after dosing with CO2 to lower the pH to 6-6.5 cultures stabilized at
about pH 8.0 within 2 days, this is due to the cultures reaching stationary phase. Trt 1 pH was
slightly increased compared to Trt 2 this can be attributed to the culture growing rapidly
releasing oxygen and using CO2.
Table 3.3. Average CCA pH Average Std. Dev.
Tank 1: Trt 1 8.5 0.5
Tank 2: Trt 1 8.6 0.4
Tank 3 Trt 1 8.2 0.5
Tank 4: Trt 2 8.2 0.5
Tank 5: Trt 2 8.1 0.3
Tank 6: Trt 2 8.0 0.3 Trt means treatment. Treatment 1 average scalar irradiance of 1041 ± 269.18 μmol m-2 s-1 PAR and treatment 2
ASI of 430 ± 96.03 μmol m-2 s-1 PAR.
Treatment 1 average scalar irradiance of 1041 ± 269.18 μmol m-2 s-1 PAR (more light) and treatment 2 ASI of 430
± 96.03 μmol m-2 s-1 PAR (less light).
Figure 3.4. CCA pH vs. Time
3.3.5. Temperature
Coculture temperature was monitored as an environmental parameter over time in days
(Figure 3.5). Tank 3, Tank 1 and Tank 2 which all received treatment 1 experienced the greatest
6.5
7
7.5
8
8.5
9
9.5
10
0 3 7 9 11 13 15 19 22 25 27 30 32
pH
Growth day
Coculture pH over time
Tank 1: Trt 1 Tank 2: Trt 1 Tank 3: Trt 1 Tank 4: Trt 2 Tank 5: Trt 2 Tank 6: Trt 2
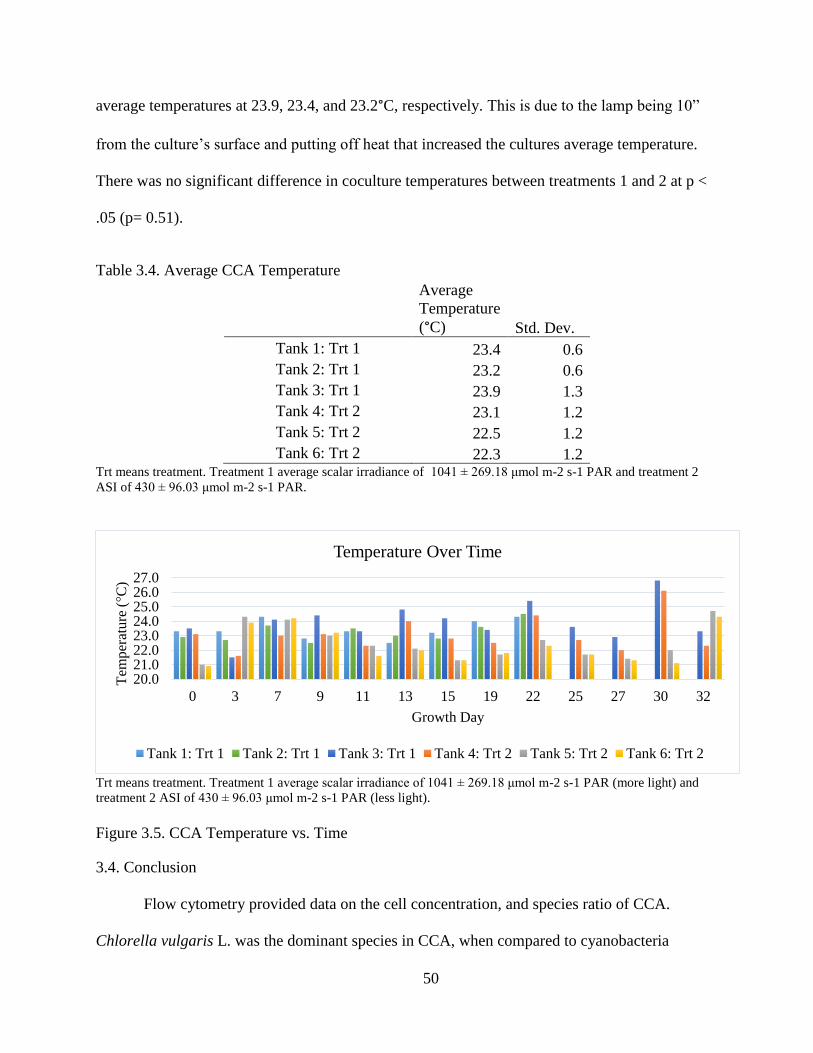
50
average temperatures at 23.9, 23.4, and 23.2°C, respectively. This is due to the lamp being 10”
from the culture’s surface and putting off heat that increased the cultures average temperature.
There was no significant difference in coculture temperatures between treatments 1 and 2 at p <
.05 (p= 0.51).
Table 3.4. Average CCA Temperature
Average
Temperature
(°C) Std. Dev.
Tank 1: Trt 1 23.4 0.6
Tank 2: Trt 1 23.2 0.6
Tank 3: Trt 1 23.9 1.3
Tank 4: Trt 2 23.1 1.2
Tank 5: Trt 2 22.5 1.2
Tank 6: Trt 2 22.3 1.2 Trt means treatment. Treatment 1 average scalar irradiance of 1041 ± 269.18 μmol m-2 s-1 PAR and treatment 2
ASI of 430 ± 96.03 μmol m-2 s-1 PAR.
Trt means treatment. Treatment 1 average scalar irradiance of 1041 ± 269.18 μmol m-2 s-1 PAR (more light) and
treatment 2 ASI of 430 ± 96.03 μmol m-2 s-1 PAR (less light).
Figure 3.5. CCA Temperature vs. Time
3.4. Conclusion
Flow cytometry provided data on the cell concentration, and species ratio of CCA.
Chlorella vulgaris L. was the dominant species in CCA, when compared to cyanobacteria
20.021.022.023.024.025.026.027.0
0 3 7 9 11 13 15 19 22 25 27 30 32
Tem
per
ature
(°C
)
Growth Day
Temperature Over Time
Tank 1: Trt 1 Tank 2: Trt 1 Tank 3: Trt 1 Tank 4: Trt 2 Tank 5: Trt 2 Tank 6: Trt 2
51
Leptolyngbya. This was the expected response from the irradiance levels each treatment
received. CCA grew as expected in the conditioned parameters of pH, temperature, culture
nutrients, aeration, and irradiance. The irradiance treatments applied to influence the Chlorella:
cyanobacteria ratio was successful as the higher irradiance 1041 ± 269.18 μmol m-2 s-1 PAR
(Treatment 1) produced an average culture ratio of 97.47 ± 1.29% Chlorella vulgaris L., and
2.84 ± 1.27% cyanobacteria Leptolyngbya. The lower irradiance 430 ± 96.03 μmol m-2 s-1 PAR
(Treatment 2) produced an average culture ratio of 89.85 ± 1.17 Chlorella vulgaris L, and 10.64
± 1.97 cyanobacteria Leptolyngbya. Trt 1 contained significantly more Chlorella vulgaris L at
95% confidence than trt 2 (p=0.001). Cyanobacteria Leptolyngbya in trt 2 was significantly
higher at 95% confidence when compared to trt 1. It can be concluded from this study that two
irradiance treatments successfully produced biomass with two different Chlorella vulgaris L and
cyanobacteria Leptolyngbya culture ratios for the biomass phase of this study.
Future studies could cultivate isolated, axenic CCA in closed reactors under specific light
regimes, and photoperiods to better assess growth parameters effect on bioactive compounds of
interest like the blue and red photo exposure in Barnett and others (2015) and the irradiance
experiments by Bai (2012) and Silaban (2013).
3.5. References
Bai, R. (2012). Lipid Production from a Louisiana Native Chlorella vulgaris/Leptolyngbya sp.
Co-culture for Biofuel Applications. Chemical Engineering Commons. LSU Doctoral
Dissertation
Barnett, J. Z., Foy, J., Malone, R., Rusch, K. A., & Gutierrez‐Wing, M. T. (2017). Impact of
light quality on a native Louisiana Chlorella vulgaris L./Leptolyngbya sp. co‐culture.
Engineering in Life Sciences, 17(6), 678-685.
52
Benson, B.C., Rusch, K.A. (2006) Investigation of the light dynamics and their impact on algal
growth rate in a hydraulically integrated serial turbidostat algal reactor (HISTAR).
Aquacultural engineering 35, 122-134.
Bold, H.C., 1949. The Morphology of Chlamydomonas Chlamydogama, sp. Nov. Bulletin of the
Torrey Botanical Club, 76(2), pp.101-108.
Brown, R.M., Jr., & Bold, H.C. (1964). Comparative studies of the algal genera Tetracystis and
Chlorococcum. University of Texas Publication No. 6417: 1-213.
Gutierrez-Wing, M.T, (unpublished work). Notes from meetings. Verbal information provided
based on experience. Department of Civil and Environmental Engineering. Louisiana
State University.
Hyka, P., Lickova, S., Přibyl, P., Melzoch, K., & Kovar, K. (2013). Flow cytometry for the
development of biotechnological processes with microalgae. Biotechnology advances,
31(1), 2-16.
Mendoza, H., De la Jara, A., Freijanes, K., Carmona, L., Ramos, A. A., de Sousa Duarte, V., ...
& Carlos, J. (2008). Characterization of Dunaliella salina strains by flow cytometry: a
new approach to select carotenoid hyperproducing strains. Electronic Journal of
Biotechnology, 11(4), 5-6.
Moheimani, N.R. J Appl Phycol (2013) 25: 387. https://doi.org/10.1007/s10811-012-9873-6
Pulz, O. (2001). Photobioreactors: production systems for phototrophic microorganisms. Applied
microbiology and biotechnology, 57(3), 287-293.
Silaban, A. G. (2012). Growth rate and productivity of a Louisiana native
microalgae/cyanobacteria co-culture: Feasibility for use in industrial biotechnology
applications. Louisiana State University Graduate School Digital Commons. Dept of
Civil and Environmental Engineering. Master’s Thesis.
Starr, R. C., & Zeikus, J. A. (1993). Utex—The Culture Collection of Algae at The University of
Texas At Austin 1993 List of Cultures 1. Journal of Phycology, 29, 1-106.
Tate, J. J., Gutierrez-Wing, M. T., Rusch, K. A., & Benton, M. G. (2013). Gene expression
analysis of a Louisiana native Chlorella vulgaris L. (Chlorophyta)/Leptolyngbya sp.
53
(Cyanobacteria) co-culture using suppression subtractive hybridization. Engineering in
Life Sciences, 13(2), 185-193. doi:10.1002/elsc.201200063
UTEX Culture Collection of Algae. (2016). Bold 1NV Medium. Algal Media Recipes.
https://utex.org/products/bold-1nv-medium.
Zhang, X. (2015). Microalgae removal of CO2 from flue gas. Clean coal technology research
reports, April. Retrieved from http://bookshop. iea-coal. org. uk/reports/ccc-250/83697,
244.
54
Chapter 4. Protein Characterization of Louisiana Native Co-Culture of
Microalgae (Chlorella Vulgaris L.) and Cyanobacteria (Leptolyngbya sp.)
4.1. Introduction
Microalgae is a source of functional ingredients with positive health effects due to high
PUFAs, polysaccharides, pigments, minerals, vitamins, enzymes and bioactive peptides (Capelli
and Cysewki, 2010). Algal proteins are chiefly enzymatic proteins (Becker, 2007). Chlorella
vulgaris L. is reported to have 51-58% protein and Arthospira platensis (cyanobacteria sp.) is
reported to have 46-63% protein DWB (Becker, 2007). There is research to suggest that
Chlorella protein hydrolysate has shown immune enhancing activity in mice and can possibly be
used for developing functional foods (Morris and others, 2007). Chlorella vulgaris L. proteins
have emulsifying capabilities (Ursu and others, 2014). Cyanobacteria, red algae and
cryptomonads contain phycobiliproteins that are fluorescent photosynthetic complexes (Glazer,
1989; Glazer in 1994).
Protein content varies based on culture type and growth conditions. Little is known about
algal protein chemical properties. A better understanding of the proteins present in algae strains
is needed if algal proteins are to be applied in food products and medical applications. There is a
consumer trend for high-protein foods and CCA proteins could possibly be used as a source of
“green” or vegan proteins and nutraceuticals. There is a growing demand for healthy, tasty,
sustainable, low impact, high-protein foods. Microalgal products need to become more
diversified and economically competitive. Algal proteins could possibly be used as a source of
“green” or vegan proteins and nutraceuticals. Microalgae proteins are multifaceted, valuable and
competitive in the consumer market. The objective of this study was to characterize proteins in
55
Chlorella vulgaris (Chlorophyta)/Leptolyngbya sp. (Cyanobacteria) co-culture microalgae
(CCA).
4.2. Materials/Experimental Design
Louisiana native co-culture of microalgae (Chlorella vulgaris L.) and cyanobacteria
(Leptolyngbya sp.) (CCA) was provided by Dr. Gutierrez-Wing in the Aquatic Germplasm and
Genetic Resources center of the School of Renewable Natural Resources, LSU Ag Center. The
CCA was cultivated using the growth parameters: scalar irradiance, pH 7-9, temperature 25 ±
2°C, Bold 1NV growth media, and 40 LPM (liters per minute) aeration. Two irradiance
treatments were applied to CCA in this study. CCA was cultivated in 6 cultures, 3 cultures were
exposed to average scalar irradiance (ASI) 1041 ± 269.18 μmol m-2 s-1 PAR and will be referred
to as Treatment 1 and the other 3 cultures were exposed to ASI 430 ± 96.03 μmol m-2 s-1 PAR
and will be referred to as a Treatment 2 .
Algae was harvested during stationary growth phase which is determined as on the first
day of decrease in optical density, using a semi-continuous flow centrifuge at 2L/min. All
cultures were frozen after harvest and stored at 4°C short-term (2 months) or at -20˚C long-term
(3-12 months).
The experiment was conducted in a completely randomized design (CRD), with no
blocks. There were 6 tanks chosen at random to contain one of the two treatment levels,
Treatment 1 – cultures exposed to ASI of 1041 ± 269.18 μmol m-2 s-1 PAR and Treatment 2–
cultures exposed to ASI 430 ± 96.03 μmol m-2 s-1 PAR. The co-culture species ratio (Chlorella:
Cyanobacteria) was the response of the treatments. The experimental and sampling units were
the algae tanks.

56
Statistical analysis was performed using two-sample t-test (GraphPad, QuickCalc)
available at https://www.graphpad.com/quickcalcs/ . The two-sample t-test was performed at
95% confidence to determine the difference in the two treatments, this test compared the average
means of each dependent variable (assay performed).
Lowry and Dumas method provided total protein content, HPLC PDA provided amino
acid profile, SDS-PAGE provided molecular mass of extracted proteins. MALDI-TOF-MS
identified several peptides in CCA.
4.3. Protein Characterization Methods
4.3.1. Lyophilization of Algae Samples
Algae samples were prepared by lyophilization for subsequent assays. This process is
based on sublimation of water occurs that occurs at pressures and temperature below the triple
point of 4.6 mm of Hg and 0.0099 °C (Bhambere and others, 2015). Harvested algae paste (cells
centrifuged to remove culture water) was weighed into plastic weigh boats. Aluminum foils
covered weigh boats and samples. Samples were frozen at -20°C for 12 h, then further frozen at -
80°C for 12 h so that when frozen semi-liquid sublimates would leave only solid, dried
components of the original semi-liquid. The aluminum foil on top of the samples was carefully
perforated with a needle or pin. Samples were placed in the Genesis 35XL pilot lyophilizer
(Stone Ridge, NY), under a vacuum, sublimating the ice directly into water vapor. The freeze
dryer condensed the water vapor for at least 24-48 h depending on the sample weights, and
moisture content of the initial sample. After the ice in the algae sample was completely
sublimated, samples were removed from the machine and machine care and standby protocol
was initiated (Bhambere and others, 2015). Samples were transferred into freezer bags and stored
in a desiccator at -20°C until needed for assays.
57
4.3.2. Total Protein Content
Lyophilized, prepared algae samples were analyzed for protein content using the Lowry
assay, and Dumas method. Lowry method has been previously researched and found to be the
optimal method to quantify algal protein content (Gutierrez and others, unpublished work).
4.3.2.1 Sample Preparation
Slocombe and others (2013) analyzed seven species of microalgae for rapid protein
measurement, they found that hot TCA extraction conditions (24% (w/v) TCA at 95 °C)
enhanced yields for three out of seven strains of algae compared with milder treatments. That
study proposed that this treatment is widely applicable in microalgae. Based on Slocombe and
others (2013) study a 5mg sample of lyophilized algae was added to 0.2 mL 24% (w/v) TCA,
incubated at 95°C for 15 min to cause TCA precipitation. Samples were cooled to room
temperature then 0.6 mL of DI water was added; samples were then centrifuged for 20 min at
4°C. The supernatant was discarded, and the pellet was added to 0.5 mL Lowry reagent D and
vortexed to create an alkaline suspension, this solution was incubated at 55°C for 3h then
centrifuged for 20 min at room temp. The pellet was discarded, and the supernatant was retained
for the protein assay (Price, 1965; Slocombe and others, 2013).
4.3.2.2. Total Protein Content by Lowry Assay
The Lowry solution was prepared fresh, and consisted of Sol A, Sol B and, Sol C in the
following ratio 100:1:1. Solution A was an alkaline solution containing 2.86g NaOH and 14.31g
Na2CO3 in 500mL with DI water. Solution B contained 1.42g of CuSO4·5(H2O) this solution was
in 100mL with DI water. Solution C contained 2.85g of Na2Tartrate·2(H2O) in 100mL with DI
water. This Lowry’s solution was light sensitive, so it was made in the last 5 minutes of sample
incubation and stored in an amber bottle (or foil wrapped bottle). Protein concentrations were
58
quantified with reference to standards of bovine serum albumin (BSA). BSA standards were a
range of 1 to 100 µg protein to a volume of 1 ml. The samples were added to water in a 16 ×
125–mm test tube to yield a final volume of 1 ml. Two separate tubes containing water were
included for water blanks. Buffer blanks were also used. Five milliliters of the freshly prepared
Lowry solution were added to each tube and thoroughly vortexed. Tubes were then incubated for
10 min at room temperature, then 0.5 ml of diluted Folin-Ciocalteu reagent was added to each
tube and vortexed immediately. Tubes were incubated an additional 30 min at room temperature
and the absorbance was read at 750nm. A standard curve was created using data from the
standard protein. The concentration of unknown algae sample protein was calculated from the
standard curve equation (Lowry and others, 1951; Neilson, 2010).
4.3.2.3. Total Protein Content by Dumas Method
A algae sample of about 1 g was placed in a ceramic crucible. The crucible was placed in
a furnace (1050 ◦C) with an atmosphere of oxygen. The algae sample was burned, and the
organic elements were oxidized. The combustion gases were collected and passed through
several traps. All gases were disregarded except nitrogen and nitrogen oxides. An aliquot (10 ml)
of that gas was carried by helium gas over a copper catalyst to convert the nitrogen oxides. The
mixture was then carried into a thermal-conductivity cell that produced an electrical signal
relative to the nitrogen content. The result was calculated from a calibration curve plotted using
known glycine standards and expressed as a percentage of the initial sample weight (Saint-Denis
and others, 2004). The conversion factor of various species of algae was previously determined
by López and others (2010) and further validated by Lourenço and others (2012); for this project,
a conversion factor of 5.35 was used (Neilson, 2010).
59
4.3.3. Protein Profile by SDS-PAGE
4.3.3.1. Sample Preparation
Lyophilized CCA was dispersed in DI water to create a suspension (10% w/w dry mass).
The algae suspension was sonicated on ice for 15 min pulsing 15 secs resting 10 secs to limit
protein damage during extraction. The CCA suspensions were centrifuged at 4°C, 5000 RPM for
30 min. The supernatants containing proteins were used for further SDS-PAGE analysis (Ursu
and others, 2014).
4.3.3.2. SDS-PAGE Methodology
Electrophoresis was used to separate and visualize proteins. In sodium dodecyl sulfate-
polyacrylamide gel electrophoresis (SDS-PAGE), proteins were separated based on size. Protein
extracts were applied to gels. The visualization of the proteins made it possible to distinguish
between different types of algae since most algal species have a distinguishing protein pattern
(Nielson, 2010).
In this experiment, proteins were extracted with 2.5% SDS, in serial dilutions (1, 10, 100
and 1000) proteins bonded to SDS becoming highly negatively charged and moved through the
gel matrix toward the anode at a rate based on size. The molecular mass of protein subunits was
estimated by comparing its mobility with protein standards. The molecular mass of extracted
proteins was determined under denaturing conditions SDS–PAGE according to Schägger and
von Jagow, (1987). For one-dimensional electrophoresis Novex™ Sharp pre-stained standards
(Thermo Fisher) were used with a range of 3.5-200 kDa (Nielsen, 2010).
4.3.4. Amino Acid Sequencing by MALDI-TOF MS
MALDI-TOF-MS analysis was used to determine the amino acid sequence of peptide
fragments present in solubilized CCA algae proteins. Protein extracts were prepared from SDS-

60
PAGE gel bands of interest. MALDI consisted of nanoscale liquid chromatography coupled with
a collector that deposited micro-fractions on a MALDI plate, a mass spectrometer analyzed the
fractions. For the MS analysis, a sample solution was prepared by adding 10 µL 0.1%
trifluoroacetic acid (TFA) in water /acetonitrile (50/50, v/v) to each of the protein gel band
samples. A saturated solution of α-cyano-4-hydroxycinnamic acid (CHCA; Sigma-Aldrich, St.
Louis, MO, USA) was dissolved in a mixture of 50/50 (v/v) acetonitrile and 0.1% TFA in water,
and this solution was used as the matrix. A sample solution of 0.5 µL was deposited onto the
MALDI plate followed by 0.5 µL matrix deposition above it and this was mixed before the
drying of the components. The thin layer of matrix absorbs energy and then the sample is
analyzed to produce an ordered array of mass spectra, each containing m/z values (Caprioli and
others, 1997). MALDI-TOF MS measurements were performed on a commercial instrument
(Ultraflextreme, Bruker Daltonics, Billerica, MA, USA). Mass spectra was recorded in positive
ion reflectron mode with an accelerating voltage of 25 kV and analyzed in the mass range of
500–4500 Da. The spectra were acquired after calibration of the instrument with a peptide
standard (Peptide Calibration Standard II, Bruker Daltonics, MA, USA). A minimum of 500
laser shots per sample was used to generate each mass spectrum (Barbano and others, 2015).
4.3.5. Amino Acid Determination by HPLC PDA
Amino acids were identified by HPLC PDA. Tryptophan, Methionine, and Cysteine
degrade at the extraction temperature. Ammonia content was considered for hydrolyzed products
of glutamate and asparagine (glutamic acid, and aspartic acid) (Mossé 1990; Yeoh and Truong
1996).
61
4.3.5.1. Sample Preparation
About 25 mg of lyophilized algae sample was weighed into a hydrolysis tube and 0.8 ml
of 6N HCl containing 0.25% phenol was added. The sample was frozen under vacuum for 2 min
then thawed, this was repeated 3 times. This step occurred in the hydrolysis tube, the tube was
connected to a vacuum tube/spicket to remove oxygen from the tube headspace and sample. The
tube was placed in a small amount of liquid nitrogen for 2 min, the tube and sample were then
allowed to thaw; this lysed the algae cell wall. The tube was placed on a heating block to further
hydrolyze for 24 h at 110 °C. The hydrolysate was transferred and washed into a 5 mL volumetric
flask and brought up to volume. Then 200 µl of this solution was mixed with 20 ul of 2.5 umol/ml
norleucine (internal standard) then dried. Then 100 ul PITC solution (EtOH: water: PITC:
triethylamine = 7:1:1:1) was added to the residue and mixed for 30 min. The sample was then
freeze dried using the method outlined previously in sample preparation using a Genesis 35XL
pilot lyophilizer (Stone Ridge, NY) (Lourenço and others 2002). The derivatized residue was
dissolved in 2 ml of buffer (140 mM sodium acetate, 0.05% triethylamine, titrated to pH 6.40 with
glacial acetic acid with the addition of 60 ml/L acetonitrile) and filtered with 0.2 um filter to obtain
the injection sample (Barbarino, and Lourenço, 2005). Samples are not commonly purified for
amino acid hydrolysis, they are derivatized.
4.3.5.2. System Conditions
The amino acid analysis was performed with a Dionex Ultimate-3000 system, which
included a Dionex Ultimate 3000 Pump, Ultimate 3000 Autosampler, Ultimate 3000 Column
Compartment, and Ultimate 3000 Photodiode Detector. Chromeleon 6.8 software was used to
control the system and process data. The sample was separated on a Waters Pico-Tag C18
column (4um, 3.9 x 150 mm) with Nova-Pak guard column (4 µm, 3.9 x 20 mm) maintained at

62
38 °C. The mobile phase consisted of eluent A (140 mM sodium acetate, 0.05% triethylamine,
titrated to pH 6.40 with glacial acetic acid with the addition of 60 ml/L acetonitrile) and eluent B
(60% acetonitrile in water). The detected wavelength was set at 254 nm. Injection volume was
20 ul. Amino Acid determination followed the steps outlined by Dhillon and others in 2014.
4.3.5.3. Standard Curve
Standard amino acids were purchased from Thermo Scientific, with 2.5 µmol/ml for each
amino acid in 0.1 N HCl (alanine, arginine, aspartic acid, glutamic acid, glycine, histidine,
isoleucine, leucine, lysine, methionine, phenylalanine, proline, serine, threonine, tyrosine, and
valine) and 1.25 µmol /ml for cystine. Norleucine was the internal standard and purchased from
Sigma. The stock solution of amino acid standards was prepared as 200 µmol/ml (cystine was 100
nmol/ml) because cystine is an oxidized dimer of 2 cysteine molecules that are connected through
a disulfide bond. The amino acid standard was diluted as a series of solutions at 100, 50, and 25
nmol/ml. They were run to make a calibration curve (Barbarino, and Lourenço, 2005).
4.4. Results and Discussion
4.4.1. Total Protein Content
The Lowry Assay found that Treatment 1 contained 29.46 ± 6.11 g protein per 100 g of
algae and Treatment 2 contained 39.67 ± 5.15 g protein per 100 g of algae (Table 4.1.).
Treatment 2 contained significantly more protein at 95% confidence (p = 0.001). This result was
expected since Treatment 2 CCA contained more cyanobacteria that is protein rich (Kim and
others, 2015) compared to Chlorella.
The Dumas Assay found that Treatment 1 was 34.63 ± 1.54 g protein/ 100 g algae DWB
by and treatment 2 was 34.65 ± 6.63 g protein/ 100 g algae DWB. There was no significant
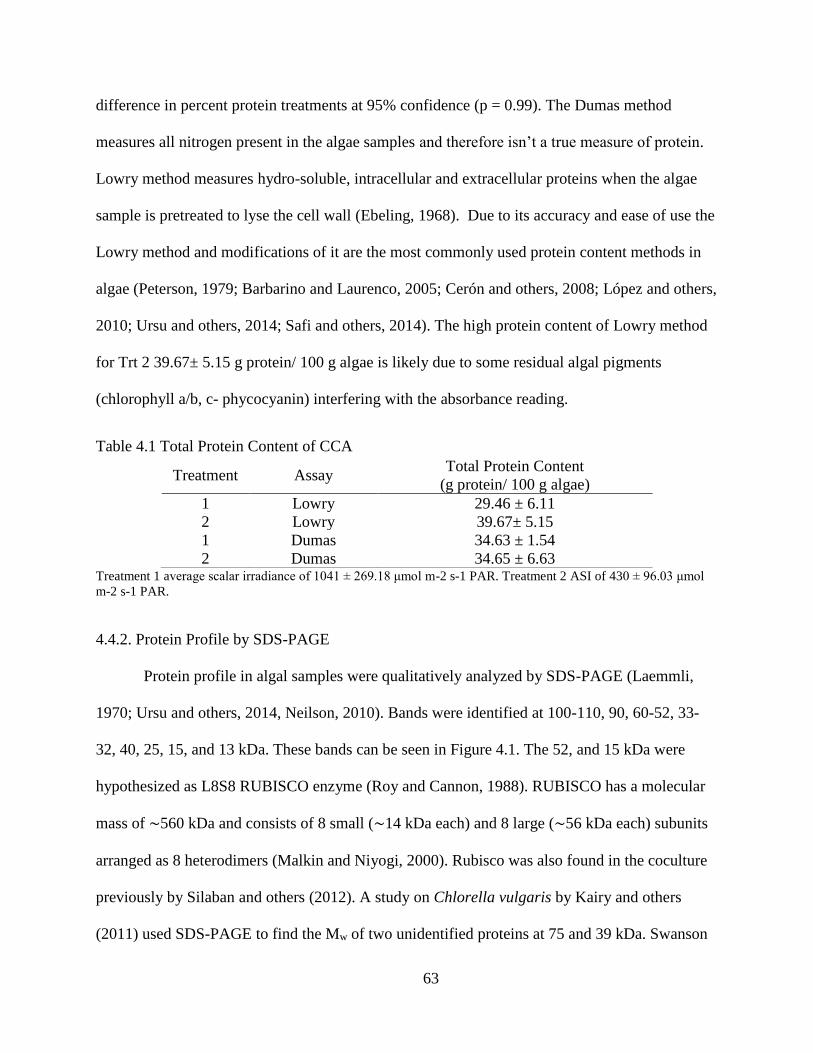
63
difference in percent protein treatments at 95% confidence (p = 0.99). The Dumas method
measures all nitrogen present in the algae samples and therefore isn’t a true measure of protein.
Lowry method measures hydro-soluble, intracellular and extracellular proteins when the algae
sample is pretreated to lyse the cell wall (Ebeling, 1968). Due to its accuracy and ease of use the
Lowry method and modifications of it are the most commonly used protein content methods in
algae (Peterson, 1979; Barbarino and Laurenco, 2005; Cerón and others, 2008; López and others,
2010; Ursu and others, 2014; Safi and others, 2014). The high protein content of Lowry method
for Trt 2 39.67± 5.15 g protein/ 100 g algae is likely due to some residual algal pigments
(chlorophyll a/b, c- phycocyanin) interfering with the absorbance reading.
Table 4.1 Total Protein Content of CCA
Treatment Assay Total Protein Content
(g protein/ 100 g algae)
1 Lowry 29.46 ± 6.11
2 Lowry 39.67± 5.15
1 Dumas 34.63 ± 1.54
2 Dumas 34.65 ± 6.63 Treatment 1 average scalar irradiance of 1041 ± 269.18 μmol m-2 s-1 PAR. Treatment 2 ASI of 430 ± 96.03 μmol
m-2 s-1 PAR.
4.4.2. Protein Profile by SDS-PAGE
Protein profile in algal samples were qualitatively analyzed by SDS-PAGE (Laemmli,
1970; Ursu and others, 2014, Neilson, 2010). Bands were identified at 100-110, 90, 60-52, 33-
32, 40, 25, 15, and 13 kDa. These bands can be seen in Figure 4.1. The 52, and 15 kDa were
hypothesized as L8S8 RUBISCO enzyme (Roy and Cannon, 1988). RUBISCO has a molecular
mass of ∼560 kDa and consists of 8 small (∼14 kDa each) and 8 large (∼56 kDa each) subunits
arranged as 8 heterodimers (Malkin and Niyogi, 2000). Rubisco was also found in the coculture
previously by Silaban and others (2012). A study on Chlorella vulgaris by Kairy and others
(2011) used SDS-PAGE to find the Mw of two unidentified proteins at 75 and 39 kDa. Swanson
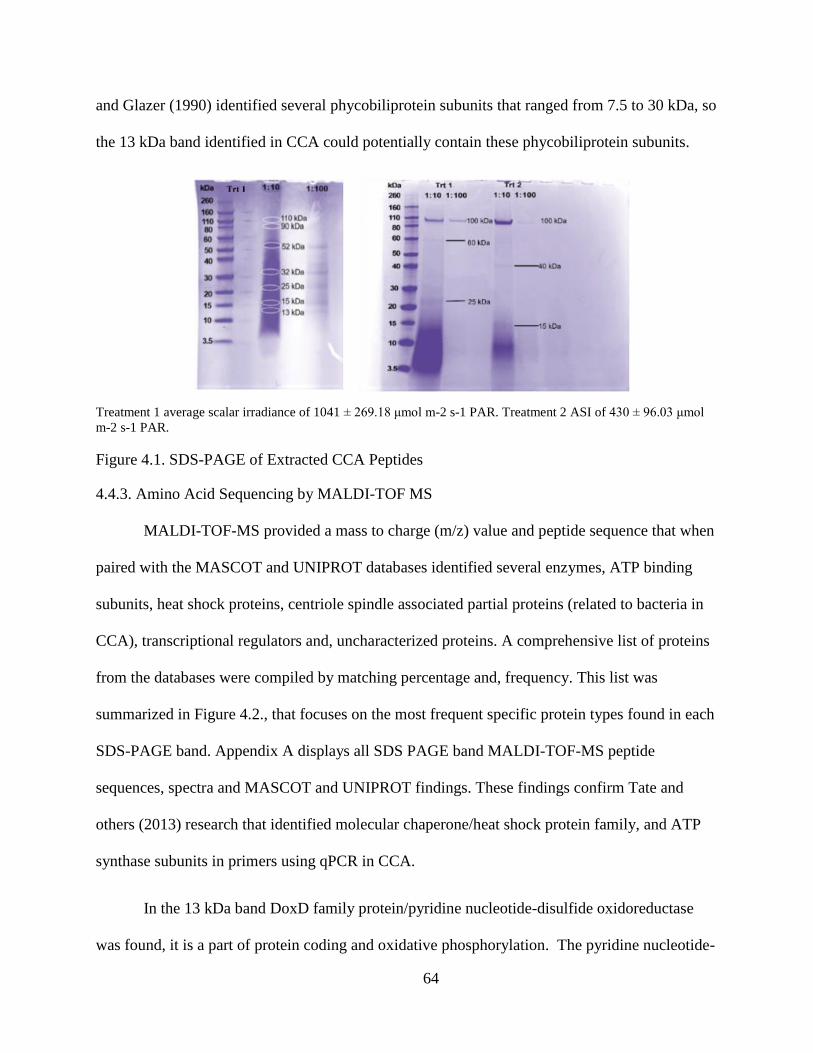
64
and Glazer (1990) identified several phycobiliprotein subunits that ranged from 7.5 to 30 kDa, so
the 13 kDa band identified in CCA could potentially contain these phycobiliprotein subunits.
Treatment 1 average scalar irradiance of 1041 ± 269.18 μmol m-2 s-1 PAR. Treatment 2 ASI of 430 ± 96.03 μmol
m-2 s-1 PAR.
Figure 4.1. SDS-PAGE of Extracted CCA Peptides
4.4.3. Amino Acid Sequencing by MALDI-TOF MS
MALDI-TOF-MS provided a mass to charge (m/z) value and peptide sequence that when
paired with the MASCOT and UNIPROT databases identified several enzymes, ATP binding
subunits, heat shock proteins, centriole spindle associated partial proteins (related to bacteria in
CCA), transcriptional regulators and, uncharacterized proteins. A comprehensive list of proteins
from the databases were compiled by matching percentage and, frequency. This list was
summarized in Figure 4.2., that focuses on the most frequent specific protein types found in each
SDS-PAGE band. Appendix A displays all SDS PAGE band MALDI-TOF-MS peptide
sequences, spectra and MASCOT and UNIPROT findings. These findings confirm Tate and
others (2013) research that identified molecular chaperone/heat shock protein family, and ATP
synthase subunits in primers using qPCR in CCA.
In the 13 kDa band DoxD family protein/pyridine nucleotide-disulfide oxidoreductase
was found, it is a part of protein coding and oxidative phosphorylation. The pyridine nucleotide-

65
disulphide oxidoreductases are FAD (flavin adenine dinucleotide) flavoproteins which contain
two redox-active cysteines (Kuriyan and others, 1991). In the 15 kDa band LysR transcriptional
regulators were identified, they control genes involved in virulence, metabolism, quorum sensing
and motility (Maddocks and Oyston, 2008).
In the 32 kDa band Tryptophan synthase alpha chain (EC 4.2.1.20) was identified. This
synthase is required for tryptophan biosynthesis and verifies that tryptophan is present in CCA
even though the amino acid determination didn’t quantify Tryptophan due to the temperature
used during extraction and hydrolysis. His Kinase A (Phospho-acceptor) domain-containing
protein is a membrane bound signal transducer, and is used to sense environmental stimuli, they
regulate cellular response in bacteria (Stock and others, 2000). 2Fe-2S ferredoxin is found in
chloroplast membranes and functions as an electron carrier in the photosynthesis electron
transport chain, 2Fe-2S ferredoxin also donates electrons to other cellular proteins (Rypniewski
and others, 1991). This indicates the CCA proteins are active and regulating cellular responses
during cultivation. These peptides are components of the photosynthesis process, identifying
them in CCA may aid in understanding biosynthesis of valuable compounds.
Raven and Beardall (2003) hypothesized that algae contain alternative oxidase, and
cytochrome oxidases. Tang and Satoh (1985) identified oxidoreductase in cyanobacteria, they
found that core complexes have a corresponding oxygen producing polypeptide at 33 kDa. In
this study oxidoreductase was identified in the 13 kDa and 25 kDa SDS-PAGE band of CCA.
Two other membrane related proteins found in higher plants and Chlorella are 23 kDa, and 16
kDa and they have a role in the oxygen optimizing capacity of the organisms they are found in
(Kuwabara and Murata, 1979Åkerlund, 1982; Bricker and others, 1988; Bricker and Frankel,
1998; 2002; Burnap and others, 1992; Wydrzynski and Satoh, 2005).
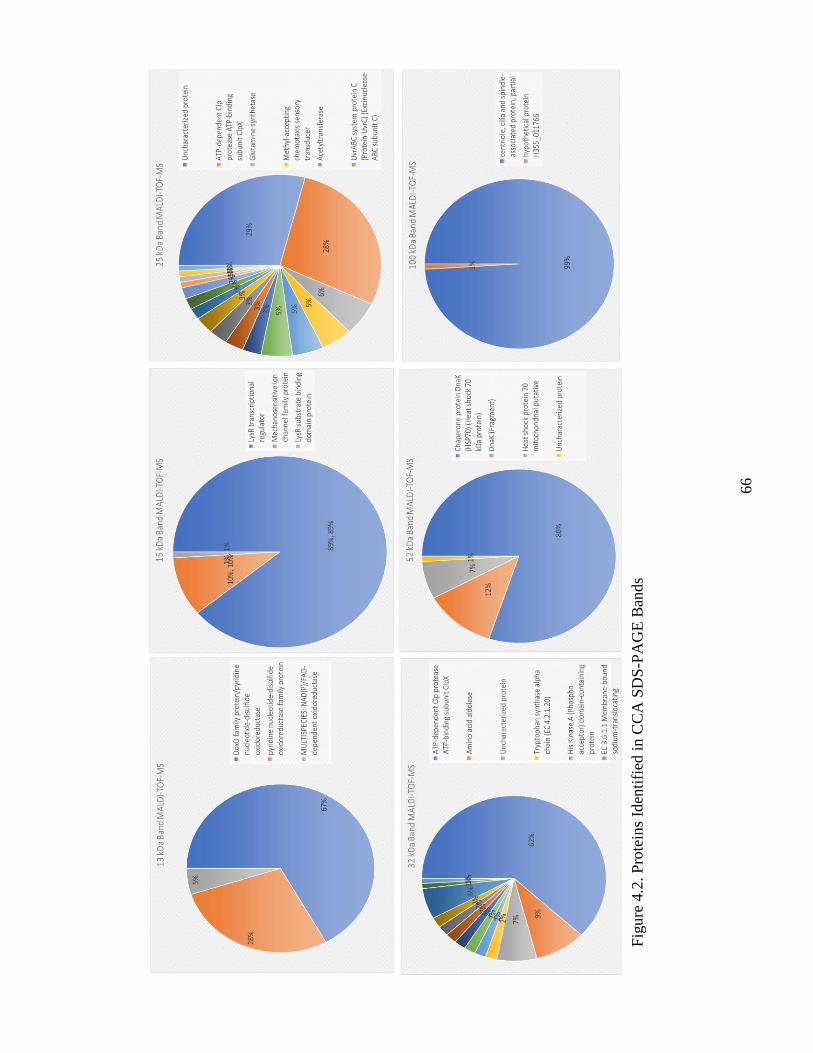
66
Figure 4.2. Proteins identified in CCA SDS-PAGE band 13 kDa
66
Fig
ure
4.2
. P
rote
ins
Iden
tifi
ed i
n C
CA
SD
S-P
AG
E B
and
s
67
4.4.4. Amino Acid Determination by HPLC PDA
Seventeen out of 21 amino acids (AA) were detected in each treatment of CCA. CCA
contained all the essential AA making it a complete protein. Treatment 1 contained 29.41 ± 1.20
g total amino acids per 100 g of algae DWB, and 30.28 ± 2.80 g total AA per 100 g of algae
DWB for treatment 2 seen in Table 4.2. The most prevalent AA were Alanine (Ala), Glutamine
as Glutamic Acid (Glx) and Asparagine as Aspartic Acid (Asx) respectively in Trt 1 and Glx,
Asx, and Ala respectively in Trt 2. There was no significant difference in amino acid content
between treatments at 95% confidence (p = 0.66). Tryptophan was not measured because it
degrades at the extraction temperature used, but tryptophan has been identified in Chlorella and
Cyanobacteria sp. separately based on previous studies (Ursu and others, 2014; Kim and others,
2015).
Mohtashamian (2012) found very similar AA profile in CCA grown at ASI 400 μmol s-1
m-2, they compared culture dilution rates of 0.360 0.459 0.558 d-1, and pre-/post- lipid extraction
effect on amino acid content of CCA. Mohtashamian found that CCA contained 27.4 - 46.1 g/
100g of amino acids. The amino acid content found was comparable to that of Kim and others
(2015) where they found Cyanobacteria Leptolyngbya sp. contained 33.44 g AA per 100 g of
algae, the most prevalent being Glutamic acid, Aspartic acid, and Alanine. In order to obtain the
quantity of AAs in total protein content (TPC) research on the association between the contents
was necessary. A study on the complete amino acid profile of beef found that the AA profile
amounted to 91% of protein based on total nitrogen (Hall and Schönfeldt, 2013). This data
follows that tendency as well when comparing total AA content to Lowry total protein content of
CCA. Through HPLC-PDA amino acid content provides 80-90% of the TPC of CCA. In this
study it can be estimated amino acids that weren’t quantified or were under quantified are
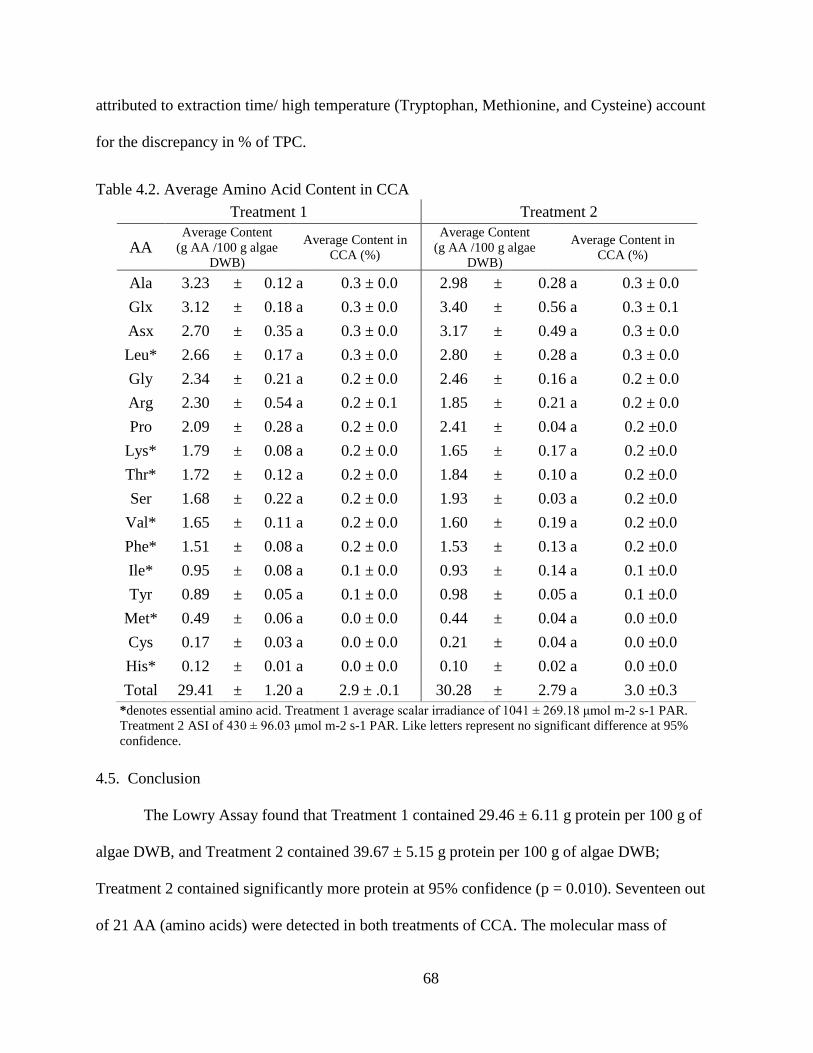
68
attributed to extraction time/ high temperature (Tryptophan, Methionine, and Cysteine) account
for the discrepancy in % of TPC.
Table 4.2. Average Amino Acid Content in CCA
Treatment 1 Treatment 2
AA Average Content
(g AA /100 g algae
DWB)
Average Content in
CCA (%)
Average Content
(g AA /100 g algae
DWB)
Average Content in
CCA (%)
Ala 3.23 ± 0.12 a 0.3 ± 0.0 2.98 ± 0.28 a 0.3 ± 0.0
Glx 3.12 ± 0.18 a 0.3 ± 0.0 3.40 ± 0.56 a 0.3 ± 0.1
Asx 2.70 ± 0.35 a 0.3 ± 0.0 3.17 ± 0.49 a 0.3 ± 0.0
Leu* 2.66 ± 0.17 a 0.3 ± 0.0 2.80 ± 0.28 a 0.3 ± 0.0
Gly 2.34 ± 0.21 a 0.2 ± 0.0 2.46 ± 0.16 a 0.2 ± 0.0
Arg 2.30 ± 0.54 a 0.2 ± 0.1 1.85 ± 0.21 a 0.2 ± 0.0
Pro 2.09 ± 0.28 a 0.2 ± 0.0 2.41 ± 0.04 a 0.2 ±0.0
Lys* 1.79 ± 0.08 a 0.2 ± 0.0 1.65 ± 0.17 a 0.2 ±0.0
Thr* 1.72 ± 0.12 a 0.2 ± 0.0 1.84 ± 0.10 a 0.2 ±0.0
Ser 1.68 ± 0.22 a 0.2 ± 0.0 1.93 ± 0.03 a 0.2 ±0.0
Val* 1.65 ± 0.11 a 0.2 ± 0.0 1.60 ± 0.19 a 0.2 ±0.0
Phe* 1.51 ± 0.08 a 0.2 ± 0.0 1.53 ± 0.13 a 0.2 ±0.0
Ile* 0.95 ± 0.08 a 0.1 ± 0.0 0.93 ± 0.14 a 0.1 ±0.0
Tyr 0.89 ± 0.05 a 0.1 ± 0.0 0.98 ± 0.05 a 0.1 ±0.0
Met* 0.49 ± 0.06 a 0.0 ± 0.0 0.44 ± 0.04 a 0.0 ±0.0
Cys 0.17 ± 0.03 a 0.0 ± 0.0 0.21 ± 0.04 a 0.0 ±0.0
His* 0.12 ± 0.01 a 0.0 ± 0.0 0.10 ± 0.02 a 0.0 ±0.0
Total 29.41 ± 1.20 a 2.9 ± .0.1 30.28 ± 2.79 a 3.0 ±0.3
*denotes essential amino acid. Treatment 1 average scalar irradiance of 1041 ± 269.18 μmol m-2 s-1 PAR.
Treatment 2 ASI of 430 ± 96.03 μmol m-2 s-1 PAR. Like letters represent no significant difference at 95%
confidence.
4.5. Conclusion
The Lowry Assay found that Treatment 1 contained 29.46 ± 6.11 g protein per 100 g of
algae DWB, and Treatment 2 contained 39.67 ± 5.15 g protein per 100 g of algae DWB;
Treatment 2 contained significantly more protein at 95% confidence (p = 0.010). Seventeen out
of 21 AA (amino acids) were detected in both treatments of CCA. The molecular mass of
69
extracted proteins was determined under denaturing conditions by SDS–PAGE; bands were
identified at 100-110, 90, 52, 33-32, 25, 15, and 13 kDa. The 52 and 15 kDa peptides are
proposed subunits of the L8S8 Rubisco enzyme and phycobiliprotein. MALDI-TOF-MS
identified several enzymes, ATP binding subunits, heat shock proteins, centriole spindle
associated partial proteins, transcriptional regulators and, uncharacterized proteins from the SDS-
PAGE gel bands. CCA had a complete protein, containing all the essential AAs. The biomass
from treatment 1 contained 29.41 ± 1.20 g total amino acids per 100 g of algae DWB, and 30.28
± 2.80 g total amino acids per 100 g of algae DWB for treatment 2. There was no significant
difference in amino acid content between treatments at 95% confidence (p= 0.66). This indicates
that the treatments do not significantly change amino acid abundance in CCA.
Algal chemical composition and bioactivity levels are species and sample specific.
These co-culture algal proteins could be used as a source of “green” or vegan proteins and
nutraceuticals. CCA may also be used as a supplemented dietary protein in fishmeal. Protein
content recovered varies greatly depending on cell wall breakdown, sample preparation, and
extraction method. Washing the cells after harvesting is suggested to avoid culture nitrogen from
causing protein overestimation. Future studies could focus on identifying texture related proteins
in CCA and exploring rheological properties in them since algal proteins can be emulsifiers, and
texture aids.
4.6. References
Åkerlund, H. E., Jansson, C., & Andersson, B. (1982). Reconstitution of photosynthetic water
splitting in inside-out thylakoid vesicles and identification of a participating polypeptide.
Barbarino, E., & Lourenço, S. O. (2005). An evaluation of methods for extraction and
quantification of protein from marine macro-and microalgae. Journal of Applied
Phycology, 17(5), 447-460.
70
Bhambere, D., A. Gaidhani, K., Harwalkar, M., & S. Nirgude, P. (2015). Lyophilization / Freeze
Drying – A Review (Vol. 4).
Bricker, T. M., & Frankel, L. K. (2002). The structure and function of CP47 and CP43 in
photosystem II. Photosynthesis research, 72(2), 131.
Bricker, T. M., Morvant, J., Masri, N., Sutton, H. M., & Frankel, L. K. (1998). Isolation of a
highly active photosystem II preparation from Synechocystis 6803 using a histidine-
tagged mutant of CP 47. Biochimica et Biophysica Acta (BBA)-Bioenergetics, 1409(1),
50-57.
Bricker, T. M., Odom, W. R., & Queirolo, C. B. (1988). Close association of the 33 kDa
extrinsic protein with the apoprotein of CPa1 in photosystem II. FEBS letters, 231(1),
111-117.
Burnap, R. L., Shen, J. R., Jursinic, P. A., Inoue, Y., & Sherman, L. A. (1992). Oxygen yield and
thermoluminescence characteristics of a cyanobacterium lacking the manganese-
stabilizing protein of photosystem II. Biochemistry, 31(32), 7404-7410.
Capelli, B., & Cysewski, G. R. (2010). Potential health benefits of spirulina
microalgae. Nutrafoods, 9(2), 19-26.
Caprioli, R. M., Farmer, T. B., & Gile, J. (1997). Molecular imaging of biological samples:
localization of peptides and proteins using MALDI-TOF MS. Analytical chemistry,
69(23), 4751-4760.
Cerón, M.C., Campos, I., Sánchez, J.F., Acién, F.G., Molina, E., Fernández-Sevilla, J.M., 2008.
Recovery of lutein from microalgae biomass: development of a process for Scenedesmus
almeriensis biomass. J. Agric. Food Chem. 56, 11761–11766.
Dhillon, M. K., Kumar, S., & Gujar, G. T. (2014). A common HPLC-PDA method for amino
acid analysis in insects and plants. http://nopr.niscair.res.in/handle/123456789/25161
Ebeling, M. E. (1968). The Dumas method for nitrogen in feeds. Journal of the Association of
Official Analytical Chemists, 51, 766-770.
Fowden L. (1952). The composition of the bulk proteins of Chlorella. The Biochemical journal,
50(3), 355–358.
71
Gutierrez-Wing, M.T, (unpublished work). Notes from meetings. Verbal information provided
based on experience. Department of Civil and Environmental Engineering. Louisiana
State University.
Hall, N. G., & Schönfeldt, H. C. (2013). Total nitrogen vs. amino-acid profile as indicator of
protein content of beef. Food Chemistry, 140(3), 608-612. doi:
https://doi.org/10.1016/j.foodchem.2012.08.046
Khairy, H. M., Ali, E. M., & Dowidar, S. M. (2011). Comparative effects of autotrophic and
heterotrophic growth on some vitamins, 2, 2-diphenyl-1-picrylhydrazyl (DPPH) free
radical scavenging activity, amino acids and protein profile of Chlorella vulgaris
Beijerinck. African Journal of Biotechnology, 10(62), 13514-13519.
Kim, J. H., Choi, W., Jeon, S.-M., Kim, T., Park, A., Kim, J., . . . Kang, D.-H. (2015). Isolation
and characterization of Leptolyngbya sp. KIOST-1, a basophilic and euryhaline
filamentous cyanobacterium from an open paddle-wheel raceway Arthrospira culture
pond in Korea. Journal of Applied Microbiology, 119(6), 1597-1612.
doi:10.1111/jam.12961
Kuriyan, J., Krishna, T. S. R., Wong, L., Guenther, B., Pahler, A., Williams, C. H., & Model, P.
(1991). Convergent evolution of similar function in two structurally divergent enzymes.
Nature, 352(6331), 172-174. doi:10.1038/352172a0
Kuwabara, T., & Murata, N. (1979). Purification and characterization of 33 kilodalton protein of
spinach chloroplasts. Biochimica et Biophysica Acta (BBA)-Protein Structure, 581(2),
228-236.
Laemmli, U.K. (1970). Cleavage of structural proteins during the assembly of the head of
bacteriophage T4. Nature, London 227, 680-685.
López, C. V. G., García, M. D. C. C., Fernández, F. G. A., Bustos, C. S., Chisti, Y., & Sevilla, J.
M. F. (2010). Protein measurements of microalgal and cyanobacterial biomass.
Bioresource technology, 101(19), 7587-7591.
Lourenço, S. O., Barbarino, E., De‐Paula, J. C., Pereira, L. O. D. S., & Marquez, U. M. L.
(2002). Amino acid composition, protein content and calculation of nitrogen‐to‐protein
conversion factors for 19 tropical seaweeds. Phycological Research, 50(3), 233-241.
Lowry, O. H., Rosebrough, N. J., Farr, A. L., & Randall, R. J. (1951). Protein measurement with
the Folin phenol reagent. Journal of biological chemistry, 193(1), 265-275.

72
Maddocks, S. E., & Oyston, P. C. (2008). Structure and function of the LysR-type transcriptional
regulator (LTTR) family proteins. Microbiology, 154(Pt 12), 3609-3623.
doi:10.1099/mic.0.2008/022772-0
Malkin, R., & Niyogi, K. (2000). Biochemistry and molecular biology of plants. Rockville, MD,
USA: American Society of Plant Physiologists, 568-628.
Mohtashamian, Marjan Sadat, "The Use of a Mixed Chlorella Cyanobacteria Culture as a Protein
Source for Aquaculture" (2012). LSU Master's Theses. 4288.
https://digitalcommons.lsu.edu/gradschool_theses/4288
Mossé, J. 1990. Nitrogen to protein conversion factor for ten cereals and six legumes or oilseeds.
A reappraisal of its definition and determination. Variation according to species and to
seed proteic content. J. Agric. Food Chem. 38: 18–24.
Nielsen S.S., (2010). Food Analysis Laboratory Manual, 2nd ed., Springer US, New York.
Price, C. A. (1965). A membrane method for determination of total protein in dilute algal
suspensions. Analytical biochemistry, 12(2), 213-218.
Roy, H., & Cannon, S. (1988). Ribulose bisphosphate carboxylase assembly: what is the role of
the large subunit binding protein. Trends in biochemical sciences, 13(5), 163-165.
Rypniewski, W. R., Breiter, D. R., Benning, M. M., Wesenberg, G., Oh, B. H., Markley, J. L., . .
. Holden, H. M. (1991). Crystallization and structure determination of 2.5-.ANG.
resolution of the oxidized iron-sulfur [2Fe-2S] ferredoxin isolated from Anabaena 7120.
Biochemistry, 30(17), 4126-4131. doi:10.1021/bi00231a003
Safi, C., Charton, M., Ursu, A. V., Laroche, C., Zebib, B., Pontalier, P. Y., & Vaca-Garcia, C.
(2014). Release of hydro-soluble microalgal proteins using mechanical and chemical
treatments. Algal research, 3, 55-60.
Schägger, H., & Von Jagow, G. (1987). Tricine-sodium dodecyl sulfate-polyacrylamide gel
electrophoresis for the separation of proteins in the range from 1 to 100 kDa. Analytical
biochemistry, 166(2), 368-379.
Silaban, A. G. (2012). Growth rate and productivity of a Louisiana native
microalgae/cyanobacteria co-culture: Feasibility for use in industrial biotechnology

73
applications. Louisiana State University Graduate School Digital Commons. Dept of
Civil and Environmental Engineering. Master’s Thesis.
Slocombe, S. P., Ross, M., Thomas, N., McNeill, S., & Stanley, M. S. (2013). A rapid and
general method for measurement of protein in micro-algal biomass. Bioresource
technology, 129, 51-57.
Stock, A. M., Robinson, V. L., & Goudreau, P. N. (2000). Two-Component Signal Transduction.
Annual Review of Biochemistry, 69(1), 183-215. doi: 10.1146/annurev.biochem.69.1.183
Swanson, R. V., & Glazer, A. N. (1990). Separation of phycobiliprotein subunits by reverse-
phase high-pressure liquid chromatography. Analytical Biochemistry, 188(2), 295-299.
doi: https://doi.org/10.1016/0003-2697(90)90609-D
Tang, X. S., & Satoh, K. (1985). The oxygen-evolving photosystem II core complex. FEBS
letters, 179(1), 60-64.
Ursu, A. V., Marcati, A., Sayd, T., Sante-Lhoutellier, V., Djelveh, G., & Michaud, P. (2014).
Extraction, fractionation and functional properties of proteins from the microalgae
Chlorella vulgaris. Bioresource technology, 157, 134-139.
Wydrzynski, T. J., & Satoh, K. (2005). Photosystem II: The light-driven water: plastoquinone
oxidoreductase. Dordrecht: Springer.
Yeoh, H. H. and Truong, V. D. 1996. Protein contents, amino acid compositions and nitrogen-to-
protein conversion factors for cassava roots. J. Sci. Food Agric. 70: 51–4.
74
Chapter 5. Carbohydrate and Starch Characterization of Louisiana Native
Co-Culture of Microalgae (Chlorella Vulgaris L.) and Cyanobacteria
(Leptolyngbya sp.)
5.1. Introduction
Microalgae is a robust source of functional ingredients with positive health effects due to
high PUFAs, polysaccharides, pigments, essential minerals, vitamins, enzymes and bioactive
peptides. Better understanding of the carbohydrates present in algae strains encourages use in
food products, and food applications. Carbohydrate levels in Arthrospira platensis (16%) and
Chlorella species (22%) have been previously determined by Kim and others (2015) but
carbohydrate content varies based on algae culture type and growth conditions. There is limited
info available on algal carbohydrate chemical properties in co-cultures. Polysaccharides from
plants have applications in food, pharmaceutical, biofuel, bioethanol and biomedical industries
because of their compatibility, biodegradability, and non-toxicity (Guzman and others, 2003;
Vertes and others, 2008; Zhang and others, 2008; Trabelsi and others, 2009; Goo and others,
2013). Cell wall polysaccharides and starch can be converted into fermentable sugars for
bioethanol production by microbial fermentation (Wang and others, 2011). Previous studies
have described algae’s bioactive compounds and suggested they be used to develop new drugs
and health foods (Nagai & Yukimoto, 2003; Zhang and others, 2010).
Algae polysaccharides are made up of many monosaccharides connected with glycosidic
bonds. These polysaccharides were researched by others and found to possess immunological
properties like stimulating the immune system, being anti-tumor, anti-viral, having antioxidant
and anti-mutagenic properties (Bohn and BeMiller, 1995; Kennedy and White, 1983; Kennedy,
1989; Zhang and others, 2010). The objective of this study was characterization of Louisiana
native co-culture of microalgae (Chlorella vulgaris L.) and cyanobacteria (Leptolyngbya sp.)
75
(CCA) carbohydrates and starches, information that is imperative for application of these
carbohydrates and starches in the future.
5.2. Materials/Experimental Design
Louisiana native co-culture of microalgae (Chlorella vulgaris L.) and cyanobacteria
(Leptolyngbya sp.) (CCA) was provided by Dr. Gutierrez-Wing in the Aquatic Germplasm and
Genetic Resources center of the School of Renewable Natural Resources, LSU Ag Center. The
CCA was cultivated using the growth parameters: scalar irradiance, pH 7-9, temperature 25 ±
2°C, Bold 1NV growth media, and 40 LPM (liters per minute) aeration. Two irradiance
treatments were applied to CCA in this study. CCA was cultivated in 6 cultures, 3 cultures were
exposed to average scalar irradiance (ASI) 1041 ± 269.18 μmol m-2 s-1 PAR and will be referred
to as Treatment 1 and the other 3 cultures were exposed to ASI 430 ± 96.03 μmol m-2 s-1 PAR
and will be referred to as a Treatment 2 .
Algae was harvested during stationary growth phase which is determined as on the first
day of decrease in optical density, using a semi-continuous flow centrifuge at 2L/min. All
cultures were frozen after harvest and stored at 4°C short-term (2 months) or at -20˚C long-term
(3-12 months).
The experiment was conducted in a completely randomized design (CRD), with no
blocks. There were 6 tanks chosen at random to contain one of the two treatment levels,
Treatment 1 – cultures exposed to ASI of 1041 ± 269.18 μmol m-2 s-1 PAR and Treatment 2–
cultures exposed to ASI 430 ± 96.03 μmol m-2 s-1 PAR. The co-culture species ratio (Chlorella:
Cyanobacteria) was the response of the treatments. The experimental and sampling units were
the algae tanks.
76
Statistical analysis was performed using two-sample t-test (GraphPad, QuickCalc)
available at https://www.graphpad.com/quickcalcs/ . The two-sample t-test was performed at
95% confidence to determine the difference in the two treatments, this test compared the average
means of each dependent variable (assay performed).
Phenol sulfuric method gave total sugar content. Megazyme Starch kits provided resistant
starch, total starch, and amylose/amylopectin ratio of CCA. DSC provided thermal properties of
CCA starch. GC-MS assayed total monosaccharide content.
5.3. Carbohydrate Characterization Methods
5.3.1. Total Carbohydrate Content
The phenol-sulfuric acid method was used to find the total sugar content, the phenol-
sulfuric acid method is a colorimetric method used to determine total classes of carbohydrates,
including mono-, di-, oligo-, and polysaccharides in samples. Algae products are high in hexose
sugars therefore glucose was used as a standard curve for this sample, at absorbance 490nm
(Nielson, 2010).
5.3.1.1. Sample Preparation
Microalgae co-culture was defatted (lipid removed) with ethanol (Li and others, 2014).
Defatting was also done with the Bligh and Dyer (1959) method, before acquiring the total
monosaccharide content. After defatting, algal biomass was hydrolyzed in a two-stages: one hour
at 30°C in 72% sulfuric acid, then one hour at 121°C in 4% sulfuric acid (Templeton and others,
2012). After hydrolysis, the insoluble residue was filtered and separated from the hydrolysate
(Templeton and others, 2012).

77
5.3.1.2. Phenol-Sulfuric Methodology
Glucose standard serial dilutions and the prepped algae samples tested contained 20–100
mg glucose/2 ml. Defatted algae samples were placed into separate Eppendorf tubes, 300 µL of
stock H2SO4 was added, then 60 µL of 5% phenol was added. Tubes were placed in a 90˚C water
bath for 5 minutes. All standard and samples were transferred to a microplate in triplicate and
read at 490 nm with 0 µg glucose/2 mL read as the blank (Neilson, 2010).
5.3.2. Identifying Monosaccharides by GC-MS
5.3.2.1. Sample Preparation
Algae samples (10mg) were hydrolyzed in 0.9 mL of 2N TFA and incubated for 1 hour at
121˚C, samples were cooled and spiked with internal standard myo-inositol at 100ppm
concentration. Hydrolysates were filtered through a PES filter, and the TFA was evaporated off
using a vacuum evaporator at 80˚C. To reduce monosaccharides to alditols, dried hydrolysates
were dissolved in 1 mL of 2% sodium borohydride solution, then heated to 40˚C for 90 min.
After reduction and cooling to room temperature, 100 uL of glacial acetic acid was added to
decompose sodium borohydride. To acetylate alditols, 0.2 mL of 1-methylimidazole (catalyst)
and 2 mL of acetic anhydride (acetylator) were added to the samples. Five mL of DI water was
added to decompose acetic anhydride (Templeton and others, 2012). Then 1 mL of
dichloromethane (DCM) was added, vortexed, then centrifuged (10 min 4500 rpm). Water was
the supernatant and was removed using a Pasteur pipette, the lower DCM and monosaccharide
layer was collected for GC analysis, this solution was diluted, if necessary, depending on the
sensitivity of the GC-MS used (Koh and others, 2018).
78
5.3.2.2. System Conditions
DCM monosaccharide algae samples (3 uL) were run on the Thermo Scientific Trace GC
Ultra, TriPlus Autosampler, and TSQ Quantum XLS System (Waltham, MA). Program details
were as follows: oven initial temp 160°C increasing by 4 deg/min to 250°C, the max temp was
set at 350°C, the run time was 50 min. The following settings were used, split flow was set to 10
mL/min, solvent valve temperature was 100°C, surge pressure was 0.50 psi, transfer rate: 14.5
deg/sec, transfer temp: 200°C, inject time: 0.5 min, transfer time: 1 min (Koh and others, 2018).
5.4. Starch Characterization Methods
5.4.1. Total Starch Content
The Megazyme total starch HK analysis procedure was used to quantify total starch in
defatted algae samples. Starch was solubilized by incubating the lipid and protein removed
freeze dried algae samples at 100°C with thermostable α-amylase. Thermostable α-amylase
hydrolyzed starch into soluble branched and unbranched maltodextrins (3,000 U/mL α-amylase,
pH 5.0, 100°C) (Megazyme, 2017; Neilson, 2010). Resistant starch in the sample was dissolved
by mixing the sample with 2 M KOH at 4°C, followed by neutralization with sodium acetate
buffer and hydrolysis with α-amylase. According to Megazyme, (2017) and McCleary and others
(1997), amyloglucosidase broke maltodextrins down to D-glucose. D-Glucose was
phosphorylated by the enzyme hexokinase and adenosine-5’-triphosphate to glucose-6-phosphate
(G-6-P) forming adenosine-5’-diphosphate. In the presence of the enzyme G-6-P was oxidized
by nicotinamide-adenine dinucleotide phosphate (NADP+) to gluconate-6-phosphate with the
formation of reduced nicotinamide-adenine dinucleotide phosphate (NADPH). The amount of
NADPH formed in this reaction was stoichiometric to the amount of D-glucose. NADPH was
79
measured by the increase in absorbance at 340 nm (McCleary and others, 1997; Megazyme,
2017).
5.4.2. Resistant Starch Content
Resistant starch content of all lipid and protein removed freeze dried algae samples was
determined by the Megazyme procedure (Megazyme International Ireland Limited, Bray,
Ireland). This method is approved by AOAC method 2002.02 and AACC method 32-40. All
reagents and enzymes used were analytical grade. Absorbances of all samples were read at 510
nm against the reagent blank. This method allowed the measurement of resistant starch,
solubilized starch, and total starch content of samples. Samples were incubated in a stirring water
bath with pancreatic α-amylase and amyloglucosidase (AMG) for 16 h at 37°C, non-resistant
starch was solubilized and hydrolyzed to D-glucose by the enzymes. This reaction was stopped
by adding an equal volume of ethanol, the resistant starch was recovered as a pellet after
centrifugation. This pellet was washed two times with 50% ethanol, then centrifuged again, the
supernatant was removed. Resistant starch in the pellet was then dissolved in 2 M KOH while
stirring in an ice-water bath. This solution was neutralized with acetate buffer and the starch was
further hydrolyzed to D-Glucose with AMG. D-Glucose was measured with glucose
oxidase/peroxidase reagent (GOPOD) which was a measure of the resistant starch content of the
sample. Non-resistant starch (solubilized starch) was determined by combining the supernatants,
adjusting the volume, then measuring D-glucose content with GOPOD (Megazyme, 2015).
5.4.3. Amylose/Amylopectin Content
Lipid and protein removed freeze dried algae samples were dissolved by heating in
dimethyl sulfoxide (DMSO). Lipids were removed by precipitating the starch in ethanol and
collecting the starch precipitate. After dissolving the sample precipitate in an acetate or salt
80
solution, amylopectin was precipitated by the addition of lectin concanavalin A (Con A) then
isolated by centrifugation. The amylose (supernatant) was hydrolyzed by an enzyme to D-
glucose, which was then evaluated using glucose oxidase/peroxidase reagent (GOPOD). The
total starch, in a separate aliquot of the acetate/salt solution, was hydrolyzed to D-glucose and
measured colorimetrically by GOPOD. The concentration of amylose in the starch sample was
the ratio of GOPOD absorbance at 510 nm of the supernatant of the Con A sample after
precipitation to that of the total starch sample (Megazyme, 2016). Amylose/amylopectin ratios
effect gelation, solubility, and resistant starch content. Starches with high levels of branched
chains are less likely to crystallize after processing (Chang, 2012). The ratio and structure of
these components affect how digestible starch is. High-amylose starch is more resistant to
digestion than low-amylose starch (Khawas and Deka, 2017). The Megazyme
amylose/amylopectin method is a modified version of the Con A method developed by Yun and
Matheson (1990).
5.4.4. Thermal Properties of CCA Starch
To purify starch, freeze dried algae (0.5 g) was resuspended in 10 mL of 10 mM Tris
acetate, pH 7.5, 1 mM EDTA. Algal suspensions were disrupted by sonication for 15 min with
10s pulse/rest intervals on ice. A crude starch extract was obtained by centrifuging the lysate
(sonicated cells) (10,000g for 15 min). The pellet obtained was resuspended in 1 mL of 90%
Percoll. The gradient was formed by centrifugation (10,000g for 30 min) this was done 2 times.
The purified starch pellet was rinsed in DI water, centrifuged (10,000g for 10 min), and kept dry
at 4°C (Ball and others, 1991; Delrue and others., 1992; Zeeman and others, 1998; Ral and
others 2004).
81
To separate starch polysaccharides, 10mg of starch was solubilized in 0.5 ml DMSO at
100⁰C for 30 min, 99.5ml of DI water was added. This solution was eluted with 0.01M NaOH at
a flow rate of 10ml/min on a Sepharose CL2B column (1.6 x 145 cm), 3ml fractions were
collected and lyophilized (Izumo and others, 2007; Shi and others, 2007).
Isolated algae starches were analyzed for thermal properties using a differential scanning
calorimeter (DSC) (TA Q100, TA Instruments, Newcastle, DE) in duplicate. Ten mg of isolated
algae starch was weighed into a steel high volume DSC pan. Then 20 µl of DI water was placed
into the starch in the DSC pan. The pan was sealed and stored at 25°C overnight to allow starch
hydration creating a starch paste. The pans were heated in the DSC from 25 °C to 140 °C at a
rate of 5 °C /min. Another pan containing 20 µl DI water was used as a reference to compare
heat capacity. The run time was 30 mins per sample. The thermal transition parameters,
including change in enthalpy (J/g), onset temperature and peak temperature were determined
using Universal Analysis 2000 (TA Q100, TA Instruments, Newcastle, DE) (Jiang, 2013). The
DSC was calibrated using an indium standard.
5.5. Results and Discussion
5.5.1. Total Sugar Content by Phenol Sulfuric Method
Total sugar content was calculated as 25.44±6.90g /100g of CCA for treatment 1, and
19.28±2.84g /100g of CCA for treatment 2 (Table 5.1.). There was no significant difference at
95% confidence between treatments (p=0.10). These findings coincide with previous studies
finding where sugars were calculated as 20-25% of Leptolyngbya sp. KIOST-1 and Chorella
(DWB) (Kim and others, 2015; Kumar and others, 2016).

82
Table 5.1 Average Total Sugar Content
Avg Carb
(g sugar/100g of algae DWB)
Treatment 1 25.44 ± 6.90 a
Treatment 2 19.28 ± 2.84 a Like lettering represents no significant difference among treatments at 95% confidence. Treatment 1 average scalar
irradiance of 1041 ± 269.18 μmol m-2 s-1 PAR. Treatment 2 ASI of 430 ± 96.03 μmol m-2 s-1 PAR. n = 6.
5.5.2. Identifying Monosaccharides by GC-MS
Total monosaccharide content for treatment 1 was identified as 1.36 ± 0.11g per 100 g of
algae DWB, and treatment 1 was 1.44 ± 0.09 g per 100 g of algae DWB. Table 5.2. displays the
monosaccharide composition for both treatments. Mannose, Glucose and Galactose were the
most prevalent monosaccharides in CCA. These monosaccharides were identified and quantified
by GC-MS standard curve quantification with monosaccharide standards. There was no
significant difference between treatments 1 and 2 for total monosaccharides at 95% confidence
(p=0.101). None of the individual monosaccharides were significantly different across treatments
except for fucose that was significantly higher in treatment 1 (p=0.23). Ho and others (2013)
studied C. vulgaris and noted that glucose was the dominant sugar component in microalgae-
based carbohydrates, they found the rest of the sugar components were xylose, galactose,
arabinose, and rhamnose. Kim and others (2015) studied Cyanobacteria Leptolyngbya sp.
KIOST-1 and noted that glucose was the dominant sugar, followed by galactose, mannose, and
fucose, rhamnose, xylose, and arabinose.
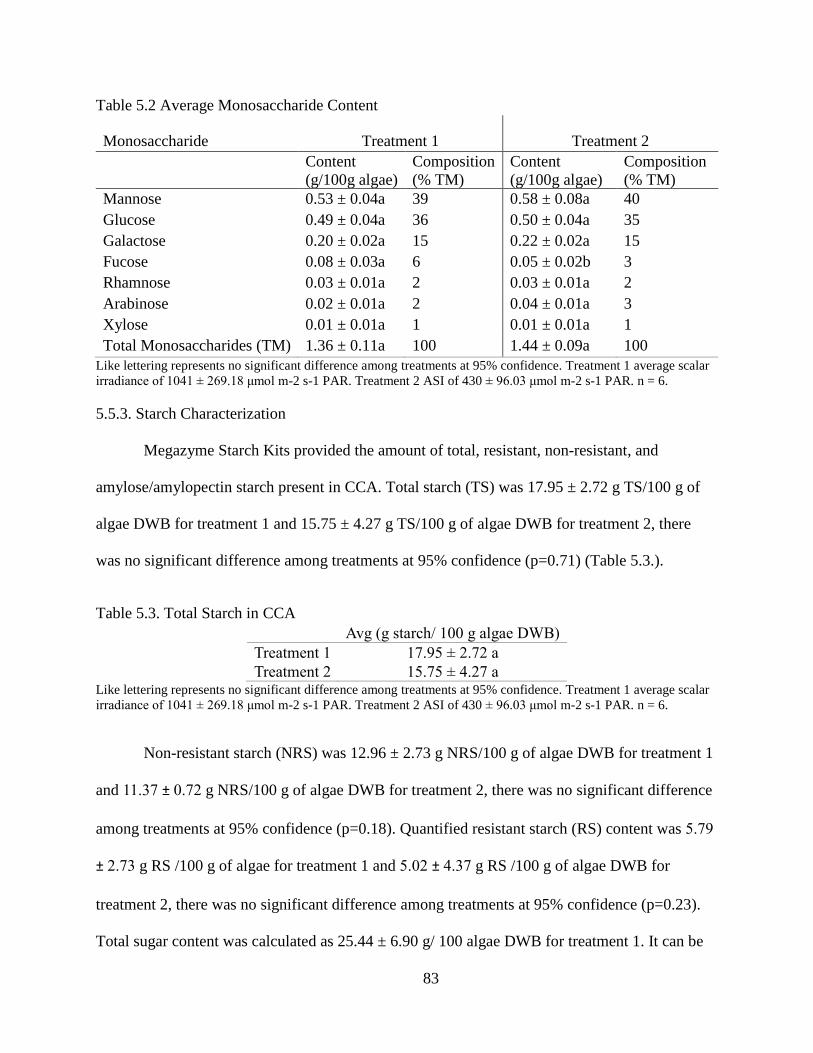
83
Table 5.2 Average Monosaccharide Content
Monosaccharide Treatment 1 Treatment 2
Content
(g/100g algae)
Composition
(% TM)
Content
(g/100g algae)
Composition
(% TM)
Mannose 0.53 ± 0.04a 39 0.58 ± 0.08a 40
Glucose 0.49 ± 0.04a 36 0.50 ± 0.04a 35
Galactose 0.20 ± 0.02a 15 0.22 ± 0.02a 15
Fucose 0.08 ± 0.03a 6 0.05 ± 0.02b 3
Rhamnose 0.03 ± 0.01a 2 0.03 ± 0.01a 2
Arabinose 0.02 ± 0.01a 2 0.04 ± 0.01a 3
Xylose 0.01 ± 0.01a 1 0.01 ± 0.01a 1
Total Monosaccharides (TM) 1.36 ± 0.11a 100 1.44 ± 0.09a 100
Like lettering represents no significant difference among treatments at 95% confidence. Treatment 1 average scalar
irradiance of 1041 ± 269.18 μmol m-2 s-1 PAR. Treatment 2 ASI of 430 ± 96.03 μmol m-2 s-1 PAR. n = 6.
5.5.3. Starch Characterization
Megazyme Starch Kits provided the amount of total, resistant, non-resistant, and
amylose/amylopectin starch present in CCA. Total starch (TS) was 17.95 ± 2.72 g TS/100 g of
algae DWB for treatment 1 and 15.75 ± 4.27 g TS/100 g of algae DWB for treatment 2, there
was no significant difference among treatments at 95% confidence (p=0.71) (Table 5.3.).
Table 5.3. Total Starch in CCA
Avg (g starch/ 100 g algae DWB)
Treatment 1 17.95 ± 2.72 a
Treatment 2 15.75 ± 4.27 a Like lettering represents no significant difference among treatments at 95% confidence. Treatment 1 average scalar
irradiance of 1041 ± 269.18 μmol m-2 s-1 PAR. Treatment 2 ASI of 430 ± 96.03 μmol m-2 s-1 PAR. n = 6.
Non-resistant starch (NRS) was 12.96 ± 2.73 g NRS/100 g of algae DWB for treatment 1
and 11.37 ± 0.72 g NRS/100 g of algae DWB for treatment 2, there was no significant difference
among treatments at 95% confidence (p=0.18). Quantified resistant starch (RS) content was 5.79
± 2.73 g RS /100 g of algae for treatment 1 and 5.02 ± 4.37 g RS /100 g of algae DWB for
treatment 2, there was no significant difference among treatments at 95% confidence (p=0.23).
Total sugar content was calculated as 25.44 ± 6.90 g/ 100 algae DWB for treatment 1. It can be
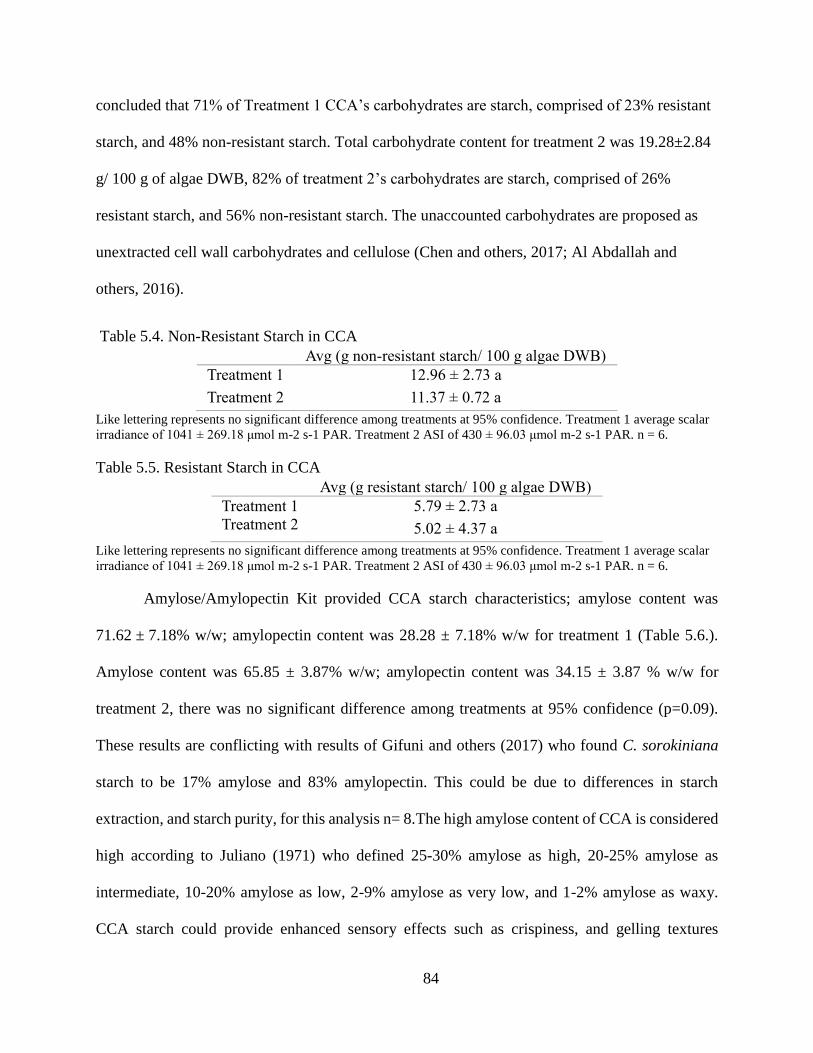
84
concluded that 71% of Treatment 1 CCA’s carbohydrates are starch, comprised of 23% resistant
starch, and 48% non-resistant starch. Total carbohydrate content for treatment 2 was 19.28±2.84
g/ 100 g of algae DWB, 82% of treatment 2’s carbohydrates are starch, comprised of 26%
resistant starch, and 56% non-resistant starch. The unaccounted carbohydrates are proposed as
unextracted cell wall carbohydrates and cellulose (Chen and others, 2017; Al Abdallah and
others, 2016).
Table 5.4. Non-Resistant Starch in CCA
Avg (g non-resistant starch/ 100 g algae DWB)
Treatment 1 12.96 ± 2.73 a
Treatment 2 11.37 ± 0.72 a
Like lettering represents no significant difference among treatments at 95% confidence. Treatment 1 average scalar
irradiance of 1041 ± 269.18 μmol m-2 s-1 PAR. Treatment 2 ASI of 430 ± 96.03 μmol m-2 s-1 PAR. n = 6.
Table 5.5. Resistant Starch in CCA
Avg (g resistant starch/ 100 g algae DWB)
Treatment 1 5.79 ± 2.73 a
Treatment 2 5.02 ± 4.37 a
Like lettering represents no significant difference among treatments at 95% confidence. Treatment 1 average scalar
irradiance of 1041 ± 269.18 μmol m-2 s-1 PAR. Treatment 2 ASI of 430 ± 96.03 μmol m-2 s-1 PAR. n = 6.
Amylose/Amylopectin Kit provided CCA starch characteristics; amylose content was
71.62 ± 7.18% w/w; amylopectin content was 28.28 ± 7.18% w/w for treatment 1 (Table 5.6.).
Amylose content was 65.85 ± 3.87% w/w; amylopectin content was 34.15 ± 3.87 % w/w for
treatment 2, there was no significant difference among treatments at 95% confidence (p=0.09).
These results are conflicting with results of Gifuni and others (2017) who found C. sorokiniana
starch to be 17% amylose and 83% amylopectin. This could be due to differences in starch
extraction, and starch purity, for this analysis n= 8.The high amylose content of CCA is considered
high according to Juliano (1971) who defined 25-30% amylose as high, 20-25% amylose as
intermediate, 10-20% amylose as low, 2-9% amylose as very low, and 1-2% amylose as waxy.
CCA starch could provide enhanced sensory effects such as crispiness, and gelling textures
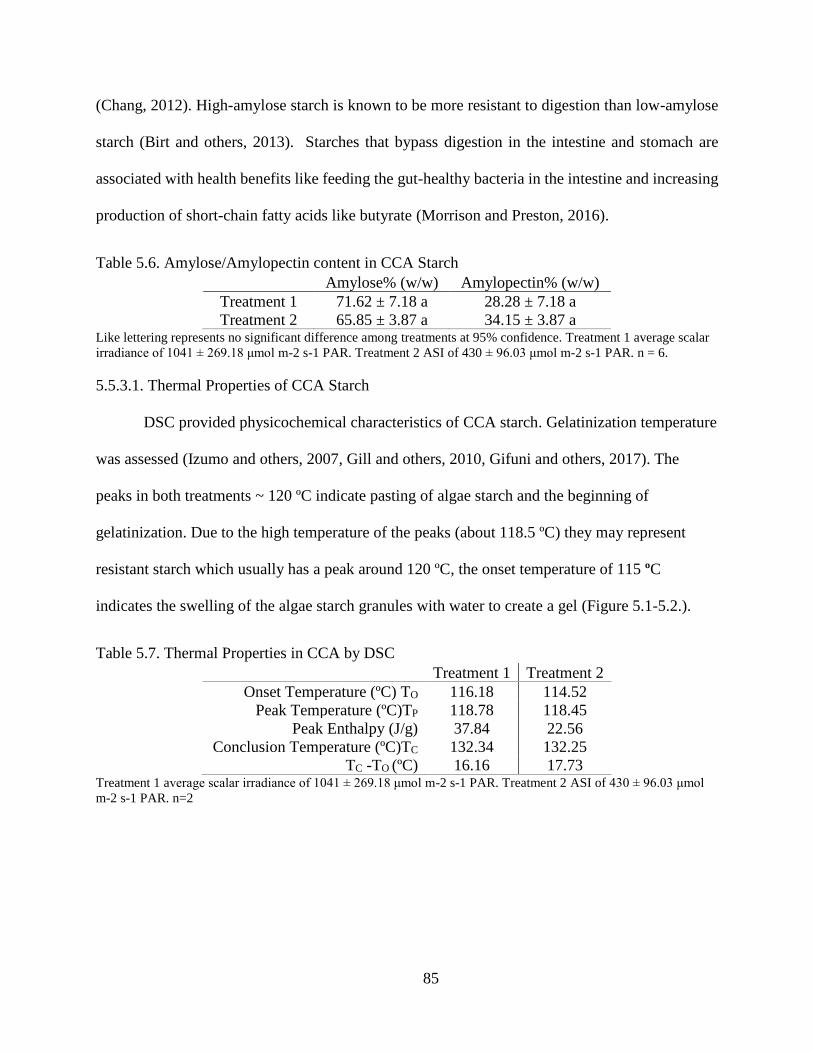
85
(Chang, 2012). High-amylose starch is known to be more resistant to digestion than low-amylose
starch (Birt and others, 2013). Starches that bypass digestion in the intestine and stomach are
associated with health benefits like feeding the gut-healthy bacteria in the intestine and increasing
production of short-chain fatty acids like butyrate (Morrison and Preston, 2016).
Table 5.6. Amylose/Amylopectin content in CCA Starch Amylose% (w/w) Amylopectin% (w/w)
Treatment 1 71.62 ± 7.18 a 28.28 ± 7.18 a
Treatment 2 65.85 ± 3.87 a 34.15 ± 3.87 a Like lettering represents no significant difference among treatments at 95% confidence. Treatment 1 average scalar
irradiance of 1041 ± 269.18 μmol m-2 s-1 PAR. Treatment 2 ASI of 430 ± 96.03 μmol m-2 s-1 PAR. n = 6.
5.5.3.1. Thermal Properties of CCA Starch
DSC provided physicochemical characteristics of CCA starch. Gelatinization temperature
was assessed (Izumo and others, 2007, Gill and others, 2010, Gifuni and others, 2017). The
peaks in both treatments ~ 120 ºC indicate pasting of algae starch and the beginning of
gelatinization. Due to the high temperature of the peaks (about 118.5 ºC) they may represent
resistant starch which usually has a peak around 120 ºC, the onset temperature of 115 ºC
indicates the swelling of the algae starch granules with water to create a gel (Figure 5.1-5.2.).
Table 5.7. Thermal Properties in CCA by DSC Treatment 1 Treatment 2
Onset Temperature (ºC) TO 116.18 114.52
Peak Temperature (ºC)TP 118.78 118.45
Peak Enthalpy (J/g) 37.84 22.56
Conclusion Temperature (ºC)TC 132.34 132.25
TC -TO (ºC) 16.16 17.73 Treatment 1 average scalar irradiance of 1041 ± 269.18 μmol m-2 s-1 PAR. Treatment 2 ASI of 430 ± 96.03 μmol
m-2 s-1 PAR. n=2
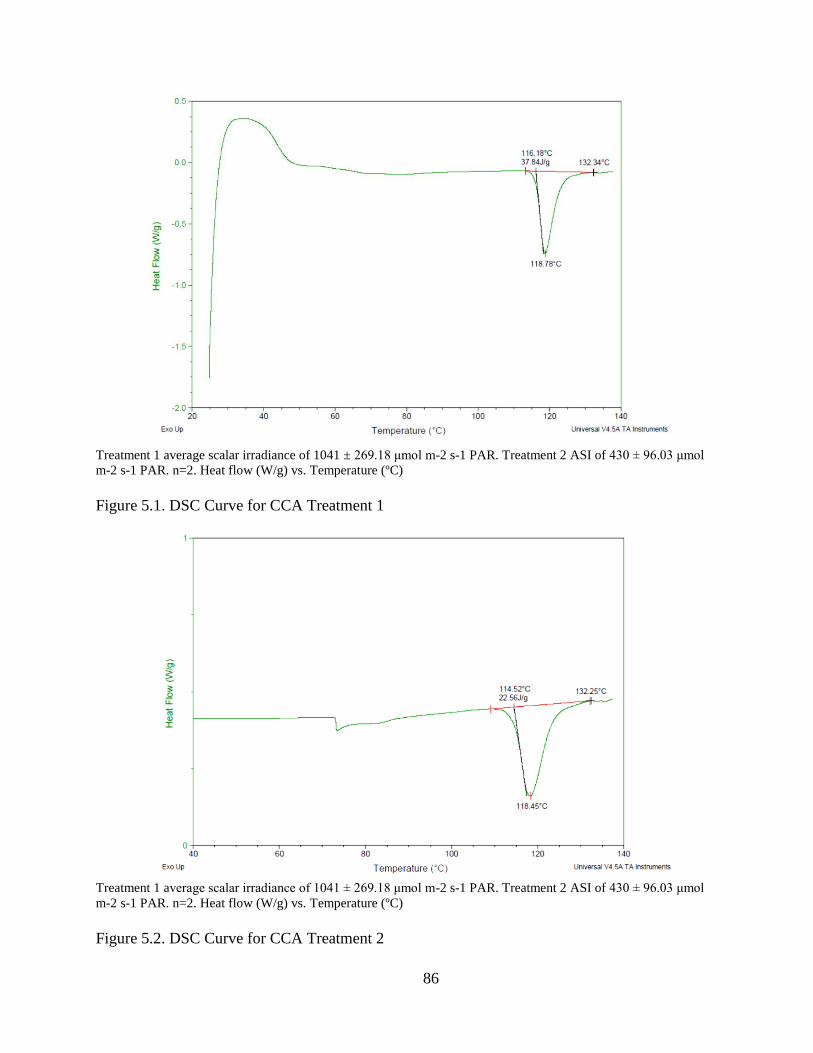
86
Treatment 1 average scalar irradiance of 1041 ± 269.18 μmol m-2 s-1 PAR. Treatment 2 ASI of 430 ± 96.03 μmol
m-2 s-1 PAR. n=2. Heat flow (W/g) vs. Temperature (ºC)
Figure 5.1. DSC Curve for CCA Treatment 1
Treatment 1 average scalar irradiance of 1041 ± 269.18 μmol m-2 s-1 PAR. Treatment 2 ASI of 430 ± 96.03 μmol
m-2 s-1 PAR. n=2. Heat flow (W/g) vs. Temperature (ºC)
Figure 5.2. DSC Curve for CCA Treatment 2

87
5.6. Conclusion
Carbohydrates are the second largest macronutrient in CCA. The phenol sulfuric method
indicated total sugar content as 25.44±6.90g/ 100g of CCA for treatment 1, and
19.28±2.84g/100g of CCA for treatment 2. Seven monosaccharides were identified and
quantified from CCA, the greatest of which were mannose, glucose and galactose. Total
monosaccharide content for treatment 1 was identified as 1.36 ± 0.11g per 100 g of CCA, and
treatment 2 was 1.44 ± 0.09 g per 100 g of CCA. Amylose/amylopectin results conflicted with
previous trends that found that green algae (Chlorella) species synthesize polysaccharides that
are like amylopectin (Markou and others., 2012). Total sugar content was calculated as
25.44±6.90g/ 100g of CCA for treatment 1 (71% of Treatment 1 CCA’s carbohydrates are
starch, comprised of 23% resistant starch, and 48% non-resistant starch). Total sugar content for
treatment 2 was 19.28±2.84g/100g of CCA (82% of treatment 2’s carbohydrates are starch,
comprised of 26% resistant starch, and 56% non-resistant starch). DSC results indicated CCA
extracted starch had an increased thermodynamic range when compared to corn starch as its
peaks at around 120ºC, indicating resistant starch presence. There was no significant difference
found between treatments 1 and 2 for all carbohydrate analysis, this indicated that the CCA
growing parameters (irradiance) can vary without significantly changing the carbohydrate
produced in CCA. These co-culture algal carbohydrates could possibly be used as a source of
“green” or vegan carbohydrates and nutraceuticals.
5.7. References
Ball S, Marianne T, Dirick L, Fresnoy M, Delrue B, Decq AA (1991). Chlamydomonas
reinhardtii low-starch mutant is defective for 3-phosphoglycerate activation and
orthophosphate inhibition of ADP-glucose pyrophosphorylase. Planta 185: 17–26.
88
Birt D., Boylston, T., Hendrich, S., Jane, J., Hollis, J., Li, L., McClelland, J., Moore, S., Phillips,
G., Rowling, M., Schalinske, K., Scott, M., Whitley, E. (2013). Resistant Starch: Promise
for Improving Human Health. Advances in Nutrition, 4, 587-601.
Bligh, E. G., & Dyer, W. J. (1959). A rapid method of total lipid extraction and purification.
Canadian journal of biochemistry and physiology, 37(8), 911-917.
Chang, Chuan. (2012). Carbohydrates- Comprehensive Studies on Glycobiology and
Glycotechnology. InTech. 290-316.
Delrue B, Fontaine T, Routier F, Decq A, Wieruszeski J-M, Van den Koornhuyse N, Maddelein
ML, Fournet B, Ball S (1992) Waxy Chlamydomonas reinhardtii: monocellular algal
mutants defective in amylose biosynthesis and granule-bound starch synthase activity
accumulate a structurally modified amylopectin. J Bacteriol 174: 3612–3620.
Domozych, D., Ciancia, M., Fangel, J. U., Mikkelsen, M. D., Ulvskov, P., & Willats, W. G.
(2012). The cell walls of green algae: a journey through evolution and diversity. Frontiers
in plant science, 3, 82.
Gifuni, I., Olivieri, G., Krauss, I. R., D'Errico, G., Pollio, A., & Marzocchella, A. (2017).
Microalgae as new sources of starch: isolation and characterization of microalgal starch
granules. Chemical Engineering Transactions, 57, 1423-1428.
Gill, P., Tohidu Moghadam, T., Ranjbar, B. (2010). Differential Scanning Calorimetry
Techniques: Applications in Biology and Nanoscience. Biomolecular Techniques. 21,
167-193.
Goo, B. G., Baek, G., Choi, D. J., Park, Y. I., Synytsya, A., Bleha, R., ... & Park, J. K. (2013).
Characterization of a renewable extracellular polysaccharide from defatted microalgae
Dunaliella tertiolecta. Bioresource technology, 129, 343-350.
Guzman, S., Gato, A., Lamela, M., Freire‐Garabal, M., & Calleja, J. M. (2003). Anti‐
inflammatory and immunomodulatory activities of polysaccharide from Chlorella
stigmatophora and Phaeodactylum tricornutum. Phytotherapy Research, 17(6), 665-670.
Hall, N. G., & Schönfeldt, H. C. (2013). Total nitrogen vs. amino-acid profile as indicator of
protein content of beef. Food Chemistry, 140(3), 608-612. doi:
https://doi.org/10.1016/j.foodchem.2012.08.046

89
Ho, S.-H., Huang, S.-W., Chen, C.-Y., Hasunuma, T., Kondo, A., & Chang, J.-S. (2013).
Characterization and optimization of carbohydrate production from an indigenous
microalga Chlorella vulgaris FSP-E. Bioresource Technology, 135(Supplement C), 157-
165. doi: https://doi.org/10.1016/j.biortech.2012.10.100
Jiang, Yu, "Effects of Amino Acids and Fatty Acids on Rice Starch Properties: Thermal, Pasting,
Resistant Starch and Structural Characterization" (2013). LSU Doctoral Dissertations.
1943. https://digitalcommons.lsu.edu/gradschool_dissertations/1943
Juliano, B. (1971). A simplified assay for milled-rice amylose. Cereal Sci. Today, 16, 334-360.
Karkacier, M., Erbas, M., Uslu, M. K., & Aksu, M. (2003). Comparison of different extraction
and detection methods for sugars using amino-bonded phase HPLC. Journal of
chromatographic science, 41(6), 331-333.
Kim, J. H., Choi, W., Jeon, S.-M., Kim, T., Park, A., Kim, J., . . . Kang, D.-H. (2015). Isolation
and characterization of Leptolyngbya sp. KIOST-1, a basophilic and euryhaline
filamentous cyanobacterium from an open paddle-wheel raceway Arthrospira culture
pond in Korea. Journal of Applied Microbiology, 119(6), 1597-1612.
doi:10.1111/jam.12961
Koh, J., Xu, Z. and Wicker, L. (2018), Blueberry Pectin Extraction Methods Influence Physico‐
Chemical Properties. Journal of Food Science, 83: 2954-2962. doi:10.1111/1750-
3841.14380
Li, Y., Ghasemi Naghdi, F., Garg, S., Adarme-Vega, T. C., Thurecht, K. J., Ghafor, W. A., …
Schenk, P. M. (2014). A comparative study: the impact of different lipid extraction
methods on current microalgal lipid research. Microbial Cell Factories, 13, 14.
http://doi.org/10.1186/1475-2859-13-14
Monsur, H. A., Jaswir, I., Simsek, S., Amid, A., & Alam, Z. (2017). Chemical structure of
sulfated polysaccharides from brown seaweed (Turbinaria turbinata). International
Journal of Food Properties, 20(7), 1457-1469. doi:10.1080/10942912.2016.1211144
Morrison, D. J., & Preston, T. (). Formation of short chain fatty acids by the gut microbiota and
their impact on human metabolism. Gut microbes, 7(3), 189–200.
doi:10.1080/19490976.2015.1134082
Nielsen S.S., (2010). Food Analysis Laboratory Manual, 2nd ed., Springer US, New York.

90
Ortiz-Tena, J. G., Rühmann, B., Schieder, D., & Sieber, V. (2016). Revealing the diversity of
algal monosaccharides: Fast carbohydrate fingerprinting of microalgae using crude
biomass and showcasing sugar distribution in Chlorella vulgaris by biomass
fractionation. Algal Research, 17, 227-235. doi:
https://doi.org/10.1016/j.algal.2016.05.008
Ral, J.-P., Derelle, E., Ferraz, C., Wattebled, F., Farinas, B., Corellou, F., . . . Ball, S. (2004).
Starch Division and Partitioning. A Mechanism for Granule Propagation and
Maintenance in the Picophytoplanktonic Green Alga <em>Ostreococcus
tauri</em>. Plant Physiology, 136(2), 3333. doi:10.1104/pp.104.044131
Ringuette, C. The Development of a Reduced Glycemic Load/High Fiber Pasta Using Pulses.
(2016). LSU Master's Theses. 2707.
https://digitalcommons.lsu.edu/gradschool_theses/2707
Rioux, L. E., Turgeon, S. L., & Beaulieu, M. (2007). Characterization of polysaccharides
extracted from brown seaweeds. Carbohydrate polymers, 69(3), 530-537.
Shi, Y. J. Yang, S.F. Hu, Q. (2007). Purification and identification of polysaccharide derived
from Chlorella pyrenoidosa. Food Chemistry, 103 (2007) 101–105.
doi:10.1016/j.foodchem.2006.07.028
Sichina, W. J. (2000). Use of DSC for the Characterization of Starches. PerkinElmer
Instruments.
Trabelsi L, M’sakni NH, Ben Ouada H, Bacha H, Roudesli S. 2009. Partial characterization of
extracellular polysaccharides from the CyanobacteriumArthrospira platensis. Biotech
Biop Eng.;14:27–31.
Vertes, A.A., Inui, M., Yukawa, H., 2008. Technological options for biological fuel ethanol. J.
Mol. Microbiol. Biotechnol. 15, 16–30.
Wang, X., Liu, X.H., Wang, G.Y., 2011. Two-stage hydrolysis of invasive algal feedstock for
ethanol fermentation. J. Integr. Plant. Biol. 53 (3),246–252.
Zeeman S, Northrop F, Smith AM, ap Rees T (1998) A starch-accumulating mutant of
Arabidopsis thaliana deficient in a chloroplastic starch hydrolyzing enzyme. Plant J 15:
357–365.
91
Chapter 6. Lipid Characterization of Louisiana Native Co-Culture of
Microalgae (Chlorella Vulgaris L.) and Cyanobacteria (Leptolyngbya sp.)
6.1. Introduction
Microalgae contain triacylglycerol and membrane lipids (Araki, 1991; Harwood, 1998;
Aakanksha and others, 2010; Bai, 2012). Algal lipids serve as energy reserves in the microalgal
cell (Nakamura and Li-Beisson, 2016). Microalgal and biofuel industries, are interested in using
the high value market lipids (Halim and others, 2012). Microalgae has gained commercial
industrial attention due to its ability to synthesize high levels of long-chain PUFAs (14 or more
carbons) when exposed to environmental factors such as stress (Yao and others, 2015). The
composition and fatty acid profile of lipids extracted from algae is affected by the cultivation
methods, temperature, irradiance, ratio of light/dark cycle and, aeration rate. During
photosynthesis microalgae accumulate neutral lipids as triacylglycerols, these triacylglycerols
can then be trans-esterified into fatty acid methyl esters (Zhu and others, 2016). The lipid content
of microalgae varies for different species. This study’s objective is to characterize total lipids,
and fatty acids in Chlorella vulgaris (Chlorophyta)/Leptolyngbya sp. (Cyanobacteria) co-culture
(CCA).
6.2. Materials/Experimental Design
Louisiana native co-culture of microalgae (Chlorella vulgaris L.) and cyanobacteria
(Leptolyngbya sp.) (CCA) was provided by Dr. Gutierrez-Wing in the Aquatic Germplasm and
Genetic Resources center of the School of Renewable Natural Resources, LSU Ag Center. The
CCA was cultivated using the growth parameters: scalar irradiance, pH 7-9, temperature 25 ±
2°C, Bold 1NV growth media, and 40 LPM (liters per minute) aeration. Two irradiance
treatments were applied to CCA in this study. CCA was cultivated in 6 cultures, 3 cultures were
92
exposed to average scalar irradiance (ASI) 1041 ± 269.18 μmol m-2 s-1 PAR and will be referred
to as Treatment 1 and the other 3 cultures were exposed to ASI 430 ± 96.03 μmol m-2 s-1 PAR
and will be referred to as a Treatment 2 .
Algae was harvested during stationary growth phase which is determined as on the first
day of decrease in optical density, using a semi-continuous flow centrifuge at 2L/min. All
cultures were frozen after harvest and stored at 4°C short-term (2 months) or at -20˚C long-term
(3-12 months).
The experiment was conducted in a completely randomized design (CRD), with no
blocks. There were 6 tanks chosen at random to contain one of the two treatment levels,
Treatment 1 – cultures exposed to ASI of 1041 ± 269.18 μmol m-2 s-1 PAR and Treatment 2–
cultures exposed to ASI 430 ± 96.03 μmol m-2 s-1 PAR. The co-culture species ratio (Chlorella:
Cyanobacteria) was the response of the treatments. The experimental and sampling units were
the algae tanks.
Statistical analysis was performed using two-sample t-test (GraphPad, QuickCalc)
available at https://www.graphpad.com/quickcalcs/ . The two-sample t-test was performed at
95% confidence to determine the difference in the two treatments, this test compared the average
means of each dependent variable (assay performed). Bligh Dyer, fat hydrolysis and hexane
extraction by ASE provided total lipid content. GC-FID provided the fatty acid profile of CCA.
6.3. Lipid Characterization Methods
6.3.1. Sample Preparation by Modified Bligh Dyer Method
The Bligh and Dyer method is the standard method for the determination of total lipids in
biological compounds. Freeze-dried algae (100 mg) was extracted in 10 mL of 2:1:1 methanol,

93
chloroform and water. This sample was freeze thawed three times (-20 ̊C for 4 h, then room temp
for 2 h to lyse cells), this solution was shaken at 110 RPM for 20 mins and centrifuged 10 min
4000 RPM) after phase separation, lipids were collected/quantified in the chloroform phase,
chloroform was evaporated off using a nitrogen stream (Bligh and Dyer, 1959, Halim and others,
2012).
6.3.2. Total Lipid Content Methods
6.3.2.1. Modified Bligh Dyer Method
The above sample preparation method was used to quantify total lipids by using equation
6.1 from Bligh and Dyer (1959) where the volume of the chloroform layer (mL) is subtracted
from the weight of liquid aliquot (mg) then divided by the volume of the aliquot (mL) Total lipid
is expressed as mg/g of algae then converted to g/ 100 g of algae.
Equation 6.1 Total Fat Equation
Total Lipid =(Weight of Lipid Aliquot − Volume of Chloroform Layer)
Volume of Aliquot
6.3.2.2. Fat Hydrolysis by Soxhlet Apparatus
Method AOAC 922.06 was used to determine fat content by fat hydrolysis. Three grams
of lyophilized algae sample was weighed and placed in a beaker. Ten grams of celite (SiO2) was
added and the weight was recorded. This mixture was filtered (HYDROTHERM C. Gerhardt
#1004092) into a collection funnel then refluxed with 15% hydrochloric acid (w/v). Samples
were dried for 30 minutes at 100°C then placed into cellulose thimble for extraction. The initial
beaker weights and thimbles weights were recorded. Thimbles were placed in corresponding
beakers and 90 mL of petroleum ether was added to the beaker and samples were extracted on
the Soxhlet apparatus (SOXTHERM) (Königswinter, Germany). After 3 h, thimbles were

94
removed, and the beakers were dried for 30 minutes at 100°C. The final beaker weights were
recorded.
6.3.2.3. Non-Polar Fat Content by ASE
Three grams of freeze-dried algae was mixed with 10 g of diatomaceous earth (activated
charcoal) and packed into an extraction receptacle topped off with diatomaceous earth. This
sample was weighed then refluxed on a Dionex ASE 350 (Thermo Scientific) with hexane
extraction temperature range of 75-125 ℃, extraction time 15 min, extraction cycle was run 3
times. Extraction parameters were as follows set as 50% of flush volume and 80s of purge time
for microalgal lipid extraction. The final microalgal lipid quantity extracted for ASE operation
was expressed as lipid % based on algal dry weight. mass of lipid remaining is measured (Mlipid).
The percentage of lipid in the initial sample (Msample) can then be calculated:
Equation 6.2 Total Lipid Percent
%Lipid =𝑀lipid
𝑀sample𝑥 100
6.2.3.3. Fatty Acid Profile by GC-FID
One gram of lyophilized CCA was lipid extracted in 20mL of chloroform: methanol (2:1
v/v) for 1 h, shaken at 110 RPM. The methanol was extracted of using a nitrogen stream. About
10 mL of lipid chloroform extract was ascertained. Aliquots of this oil extract was used for
FAME assay.
Official method AOCS Ce 2-66vwas used to prepare methyl esters using the following
protocol: 500 milligrams of CCA lipid extract was added to 8 mL of 0.5 N Methanolic sodium
hydroxide 12%, in a boiling flask this was refluxed 5 min. Nine milliliters of 12% v/v Boron
trifluoride BF3 – in methanol was added through the condenser and further boiled 2 min. Five ml
95
of hexane was added through the condenser and boiled 1 min. Boiling was stopped and 15 ml of
saturated NaCl was added to the flask which stoppered and vortexed. Saturated NaCl was used to
float the lipid to the top of the flask where it was extracted by Pasteur pipette. , (Petkov and
Garcia, 2007). After fatty acids were esterified into methyl esters the internal standard (1ml of
10mg/ml methyl tridecanoate in hexane) was added (Petkov and Garcia, 2007; Van Wychen, and
Laurens, 2013). One hundred microliters of the upper FAME containing layer was assayed by
gas chromatography (GC) using an Agilent 7820 GC with a 30 m long Supelcowax-10 capillary
column at 95 °C and flame ionization detector (FID). FID settings were 280°C, 450 mL/min zero
air, 40 mL/min H2, 30 mL/min helium. This method was adapted from AOAC Method 969.33
modified with Petkov and Garcia’s (2007) and Van Wychen, and Laurens (2013) protocol for
microalgae. Fatty acids were identified using GLC reference substances. FAME were expressed
as % in total fatty acids of CCA of total fat, then % FA in Total FA (w/w).
6.4. Results and Discussion
6.4.1. Total Lipid Content
Total lipid gravimetric analyses were extracted in organic solvents that removed
hydrophilic cellular components like carbohydrates, and proteins. Extracted lipids in organic
solvents were dried down with nitrogen gas. An estimation of total lipid content was determined
by dry weight accounting for the weight of all solvent soluble components (fatty acids,
glycerolipids, sphingolipids, triterpenoids and chlorophyll or other pigments, as well as non-lipid
contaminants) (Grima and others, 1994). Total lipid content by Bligh Dyer extraction yield the
lowest lipid contents (0.47 and 0.74g fat/ 100g algae DWB for treatment 1 and 2 respectively),
while hexane extraction with Accelerated Solid Extraction (ASE) had the highest total lipid yield
for CCA (8.20 ± 1.20 and 12.70 ± 2.50g/ 100g algae for treatment 1 and 2).
96
Similar results for cyanobacteria (cya) have been reported, 11.4 ± 0.5% lipids by Kim
and others (2015). Chlorella vulgaris (Chl) lipids are reported as 5-12% DWB (Al-Safaar and
others, 2016). The lipid fractions extracted from CCA lipid content changed according to the
solvent polarity used for extraction (Grima and others, 1999; D’Oca and others, 2011). The
methods and appropriate solvents for the disruption of the cell wall are imperative to increase the
extraction efficiency.
For all lipid analyses Treatment 1 had less lipids than treatment 2. For Bligh and Dyer
method the difference was significant at 95% confidence (p= 0.05), for ASE method there was
no significant difference among treatments (p= 0.16), for fat hydrolysis differences were
significantly different at 95% confidence (p= 0.007). This is at odds with data that suggests
cyanobacteria has low lipid content when compared to Chl. It is possible that the species ratio
shifted throughout the 32-day culture growth allowing lipids to accumulate for treatment 2 than
treatment 1. In a study on lipid characterization of Leptolyngbya sp. ISTCY101 lipid content
was reported as 16–21 % dry weight biomass. This study used the growth parameters: BG-11
medium, a semi continuous incubator, cultures were maintained at 30 °C, under continuous
fluorescent light (50 μE s−1 m−2) (Singh and Thakur, 2014). This study is reported as evidence
that cyanobacteria can accumulate high amounts of lipids like their microalgae counterparts. The
use future use of a sequential solvent extraction method like that of Andersen and Markham
(2006) where extraction was performed first with n‐hexane to extract non polar lipids, then ethyl
acetate to obtain less polar compounds, and finally methanol was used eventually for more polar
compounds (Kokabi, and others 2019) is suggested for future studies. This method could
increase lipid yield and provide more clear results of CCA lipids in trt 1 and 2.
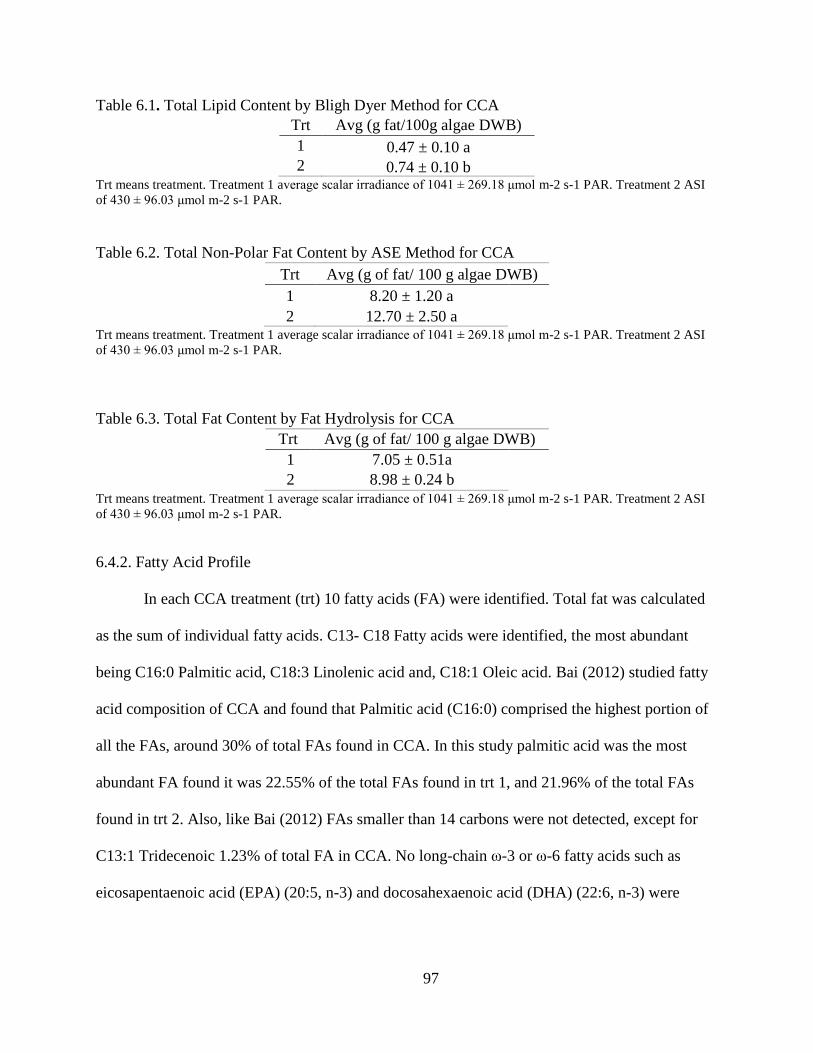
97
Table 6.1. Total Lipid Content by Bligh Dyer Method for CCA
Trt Avg (g fat/100g algae DWB)
1 0.47 ± 0.10 a
2 0.74 ± 0.10 b Trt means treatment. Treatment 1 average scalar irradiance of 1041 ± 269.18 μmol m-2 s-1 PAR. Treatment 2 ASI
of 430 ± 96.03 μmol m-2 s-1 PAR.
Table 6.2. Total Non-Polar Fat Content by ASE Method for CCA
Trt Avg (g of fat/ 100 g algae DWB)
1 8.20 ± 1.20 a
2 12.70 ± 2.50 a Trt means treatment. Treatment 1 average scalar irradiance of 1041 ± 269.18 μmol m-2 s-1 PAR. Treatment 2 ASI
of 430 ± 96.03 μmol m-2 s-1 PAR.
Table 6.3. Total Fat Content by Fat Hydrolysis for CCA
Trt Avg (g of fat/ 100 g algae DWB)
1 7.05 ± 0.51a
2 8.98 ± 0.24 b
Trt means treatment. Treatment 1 average scalar irradiance of 1041 ± 269.18 μmol m-2 s-1 PAR. Treatment 2 ASI
of 430 ± 96.03 μmol m-2 s-1 PAR.
6.4.2. Fatty Acid Profile
In each CCA treatment (trt) 10 fatty acids (FA) were identified. Total fat was calculated
as the sum of individual fatty acids. C13- C18 Fatty acids were identified, the most abundant
being C16:0 Palmitic acid, C18:3 Linolenic acid and, C18:1 Oleic acid. Bai (2012) studied fatty
acid composition of CCA and found that Palmitic acid (C16:0) comprised the highest portion of
all the FAs, around 30% of total FAs found in CCA. In this study palmitic acid was the most
abundant FA found it was 22.55% of the total FAs found in trt 1, and 21.96% of the total FAs
found in trt 2. Also, like Bai (2012) FAs smaller than 14 carbons were not detected, except for
C13:1 Tridecenoic 1.23% of total FA in CCA. No long-chain ω-3 or ω-6 fatty acids such as
eicosapentaenoic acid (EPA) (20:5, n-3) and docosahexaenoic acid (DHA) (22:6, n-3) were

98
identified in CCA. C18:3 Linolenic acid was the only ω-3 found in both treatments. C16:0
Palmitic acid and C18:0 Stearic acid were the only saturated FAs found.
This coincides with previous studies of Chlorella Vulgaris L. and freshwater algae
species contained fatty acids C14 – C18 (Liem and Laur, 1977; Harwood and Moore, 1989; Lang
and others, 2011; Armenta and others, 2013; Guschina and Harwood, 2016; Matos, 2017;
Fernández-Linares and others, 2017). Linoleic acid was found to be present in both Chlorella
and Cyanobacteria species at relatively high percentages of fatty acids previously (Armenta and
others, 2013; Matos, 2017), but was not the dominant fatty acid in CCA.
Benavente-Valdés and others, (2016) and Seyfabadi and others (2011) suggest that
saturated fatty acids increase, while monounsaturated and polyunsaturated fatty acids decrease
when exposed to increasing irradiance and light duration like that of treatment 1 at 1041 ± 269.18
μmol m-2 s-1 PAR This study found the opposite effect in CCA fatty acids except for C17:1
Margaroleic acid which is monounsaturated and decreased by 0.11% DWB when light exposure
decreased in treatment 2 to 430 ± 96.03 μmol m-2 s-1 PAR.
Table 6.4. Fatty Acid Profile of CCA
Fatty Acid Treatment 1
(g FA/ 100g algae)
Trt 1 (% FA
in TFA (w/w)
Treatment 2
(g FA/ 100g algae)
Trt 2 (% FA
in TFA (w/w)
C13:1 Tridecenoic 0.000 0.00 0.022 1.23
C14:1 Myristoleic 0.026 1.84 0.040 2.23
C16:0 Palmitic 0.318 22.55 0.394 21.96
C16:1 Palmitoleic 0.072 5.11 0.074 4.12
C17:1 Margaroleic 0.064 4.54 0.042 2.34
C18:0 Stearic 0.000 0.00 0.014 0.78
C18:1 Oleic 0.252 17.87 0.348 19.40
C18:2 Linoleic 0.218 15.46 0.126 7.02
C18:3 Linolenic 0.280 19.86 0.358 19.96
C18:4 Octadecatetraenoic 0.030 2.13 0.064 3.57
Other Fatty Acids 0.150 10.64 0.312 17.39
Total (TFA) 1.410 100 1.794 100 Trt means treatment. Treatment 1 average scalar irradiance of 1041 ± 269.18 μmol m-2 s-1 PAR. Treatment 2 ASI
of 430 ± 96.03 μmol m-2 s-1 PAR.
99
6.5. Conclusion
In each CCA treatment (trt) 10 fatty acids (FA) were identified. Total fat was calculated
as the sum of individual fatty acids. C13- C18 Fatty acids were identified, the most abundant
being C16:0 Palmitic acid, C18:3 Linolenic acid and, C18:1 Oleic acid. Palmitic acid was the
most abundant FA found it was 22.55% of the total FAs found in trt 1, and 21.96% of the total
FAs found in trt 2. FAs smaller than 14 carbons were not detected, except for C13:1 Tridecenoic
was 1.23% of total FA in CCA trt 2. No long-chain ω-3 or ω-6 fatty acids such as
eicosapentaenoic acid (EPA) (20:5, n-3) and docosahexaenoic acid (DHA) (22:6, n-3) were
identified in CCA. C18:3 Linolenic acid was the only ω-3 found in both treatments. C16:0
Palmitic acid and C18:0 Stearic acid were the only saturated FAs found. Extracted lipid contents
were lower than previous studies this could be due to cellular extraction issues. Total lipid
content varies greatly depending on polarity of extraction solvent and technique used. C13- C18
Fatty acids were identified, the most abundant being C16:0 Palmitic acid, C18:3 Linolenic acid
and, C18:1 Oleic acid. CCA lipids are a viable option for biofuels and creating nutritional and
medicinal products due to their ability to accumulate lipids under stress and their plant-like fatty-
acid composition.
6.6. References
Al-Safaar, A. T., Al-Rubiaee, G. H., & Salman, S. K. (2016). Effect of pHCondition on the
Growth and Lipid Content of Microalgae Chlorella vulgaris&Chroococcus minor. Journal
of Scientific & Engineering Research, 7(11), 1139.
Andersen, O. M. and Markham, K. R. 2006. Flavonoids: Chemistry, Biochemistry and
Applications. CRC Press Taylor & Francis Group 6000 Broken Sound Parkway NW,
Suite 300 Boca Raton, FL.
100
Araki, S., Eichenberger, W., Sakurai, T., & Sato, N. (1991). Distribution of
diacylglycerylhydroxymethyltrimethyl-β-alanine (DGTA) and phosphatidylcholine in
brown algae. Plant and cell physiology, 32(5), 623-628.
Bai, R., Gutierrez‐Wing, M.T., Negulescu, I.I., Rusch, K.A. (2013) Effect of organic carbon,
C:N ratio and light on the growth and lipid productivity of microalgae/cyanobacteria
coculture.Engineering in Life Sciences.
Bligh, E. G., & Dyer, W. J. (1959). A rapid method of total lipid extraction and purification.
Canadian journal of biochemistry and physiology, 37(8), 911-917.
Fernández-Linares, L. C., Guerrero Barajas, C., Durán Páramo, E., & Badillo Corona, J. A.
(2017). Assessment of Chlorella vulgaris and indigenous microalgae biomass with
treated wastewater as growth culture medium. Bioresource Technology, 244, 400-406.
doi: https://doi.org/10.1016/j.biortech.2017.07.141
Grima, M.E. Medina, R.A., Giménez, G.A. (1999). Recovery of algal PUFAs. Z. Cohen (Ed.),
Chemicals from microalgae, Taylor & Francis, London. pp. 108-144.
Guschina, I. A., & Harwood, J. L. (2009). Algal lipids and effect of the environment on their
biochemistry. In Lipids in aquatic ecosystems (pp. 1-24). Springer, New York, NY.
Halim, R., Danquah, M. K., & Webley, P. A. (2012). Extraction of oil from microalgae for
biodiesel production: A review. Biotechnology Advances, 30(3), 709-732. doi:
https://doi.org/10.1016/j.biotechadv.2012.01.001
Harwood, J., & Moore Jr, T. S. (1989). Lipid metabolism in plants. Critical reviews in plant
sciences, 8(1), 1-43.
Kiran, B., Pathak, K., Kumar, R., Deshmukh, D., & Rani, N. (2016). Influence of varying
nitrogen levels on lipid accumulation in Chlorella sp. International journal of
environmental science and technology, 13(7), 1823-1832.
Kokabi, M., Yousefzadi, M., Soltani, M., & Arman, M. (2019). Effects of different UV radiation
on photoprotective pigments and antioxidant activity of the hot‐spring cyanobacterium
Leptolyngbya cf. fragilis. Phycological Research.
101
Lang, Imke. Fatty Acid Profiles and Their Distribution Patterns in Microalgae: A Comprehensive
Analysis of More than 2000 Strains from the SAG Culture Collection. BMC Plant
Biology 11 (2011): 124. PMC.
Nakamura, Y., & Li-Beisson, Y. (Eds.). (2016). Lipids in plant and algae development. Springer
International Publishing.
Petkov, G., & Garcia, G. (2007). Which are fatty acids of the green alga Chlorella. Biochemical
Systematics and Ecology, 35(5), 281-285.
Ramírez-López, C., Chairez, I., & Fernández-Linares, L. (2016). A novel culture medium
designed for the simultaneous enhancement of biomass and lipid production by Chlorella
vulgaris UTEX 26. Bioresource technology, 212, 207-216.
Singh, J., Tripathi, R., & Thakur, I. S. (2014). Characterization of endolithic cyanobacterial
strain, Leptolyngbya sp. ISTCY101, for prospective recycling of CO2 and biodiesel
production. Bioresource Technology, 166, 345-352.
doi:https://doi.org/10.1016/j.biortech.2014.05.055
Van Wychen, S., & Laurens, L. M. L. (2013). Determination of total lipids as fatty acid methyl
esters (FAME) by in situ transesterification. Contract, 303, 375-300.
Yao, L., Gerde, J. A., Lee, S.-L., Wang, T., & Harrata, K. A. (2015). Microalgae Lipid
Characterization. Journal of Agricultural and Food Chemistry, 63(6), 1773-1787.
doi:10.1021/jf5050603
Zhu, L. D., Li, Z. H., & Hiltunen, E. (2016). Strategies for Lipid Production Improvement in
Microalgae as a Biodiesel Feedstock. BioMed Research International, 2016, 8.
doi:10.1155/2016/8792548

102
Chapter 7. Summary and Conclusion
A thorough review of bioactive compounds present in the species present in Louisiana
Native Co-Culture of Microalgae (Chlorella Vulgaris L. and Cyanobacteria Leptolyngbya sp.)
(CCA) was reported. CCA is a viable polyculture for further investigation as a source of food
components. This research explored growth parameters that include irradiance, flow cytometry,
optical density, pH monitoring, temperature monitoring, growth medium, aeration, and
chlorination. Treatment 1 was CCA grown in cultures exposed to average scalar irradiance (ASI)
of 1041 ± 269.18 μmol m-2 s-1 PAR and treatment 2 was CCA grown in cultures exposed to ASI
of 430 ± 96.03 μmol m-2 s-1 PAR. The treatments (irradiance exposure) had the desired response
on the CCA species ratio as Trt 1 yielded an average culture ratio of 97.47 ± 1.29% Chlorella,
and 2.84 ± 1.27% Cyanobacteria. Trt 2 yielded an average culture ratio of 89.85 ± 1.17
Chlorella, and 10.64 ± 1.97 Cyanobacteria.
Table 7.1. Summary of CCA Macronutrients Characterized
Macronutrient
(g/ 100g algae DWB) Trt 1 Trt 2
Protein 29.46 ± 6.11 39.67 ± 5.15
Carbohydrates 25.44 ± 6.90 19.28 ± 2.84
Lipids 8.20 ± 1.20 12.70 ± 2.50
Other 36.90* 28.35*
*Estimation of uncharacterized CCA components. Trt means treatment. Treatment 1 average scalar irradiance of
1041 ± 269.18 μmol m-2 s-1 PAR. Treatment 2 ASI of 430 ± 96.03 μmol m-2 s-1 PAR.
Proteins are the largest macronutrient in CCA. The Lowry Assay identified Treatment 1
contained 29.46 ± 6.11 g protein per 100 g of algae DWB and Treatment 2 contained 39.67 ±
5.15 g protein per 100 g of algae DWB; Treatment 2 contained significantly more protein at 95%
confidence. Seventeen out of 21 amino acids (AA) were detected in both treatments of CCA.
CCA is a complete protein, containing all the essential AA there was no significant difference in
amino acid content between treatments at 95% confidence. The molecular mass of extracted
103
proteins was determined under denaturing conditions by SDS–PAGE bands were identified at
100-110, 90, 52, 33-32, 25, 15, and 13 kDa from these and RUBISCO and phycobiliprotein
subunits were hypothesized to be present. MALDI-TOF-MS identified several proteins in CCA
with various cellular function such as enzymes, molecular chaperoning, heat shock, protein
coding and transcriptional regulators.
Carbohydrates are the second largest macronutrient in CCA. Total sugar content was
calculated as 25.44±6.90g/ 100 of algae DWB for treatment 1 (71% of Treatment 1 CCA’s
carbohydrates are starch, comprised of 23% resistant starch, and 48% non-resistant starch). Total
sugar content for treatment 2 was 19.28±2.84 g/ 100 of algae (82% of treatment 2’s
carbohydrates are starch, comprised of 26% resistant starch, and 56% non-resistant starch).
Amylose/amylopectin results conflicted with previous trends that Chlorella species synthesize
polysaccharides that are mainly hypothesized as amylopectin. Amylose content was
71.62 ± 7.18% w/w and amylopectin content were 28.28 ± 7.18% w/w for treatment 1. Amylose
content was 65.85 ± 3.87 % w/w and amylopectin content were 34.15 ± 3.87 % w/w for
treatment 2, there was no significant difference among treatments at 95% confidence (p=0.09).
Seven monosaccharides were identified and quantified from CCA, the greatest of which were
mannose, glucose and galactose. Total monosaccharide content for treatment 1 was identified as
1.36 ± 0.11 g monosaccharide per 100 g of algae DWB, and treatment 2 was 1.44 ± 0.09 g
monosaccharide per 100 g of algae DWB. DSC measured the thermal characteristics and
enthalpy in CCA extracted starch, it was found to have an increased thermodynamic range when
compared to corn starch as it peaks at around 120ºC, indicating the presence of resistant starch.
There was no difference between treatments at 95% confidence for any carbohydrate method,
this indicates the treatments (irradiance exposure at ASI 1041 ± 269.18 μmol m-2 s-1 PAR [Trt
104
1] and ASI of 430 ± 96.03 μmol m-2 s-1 PAR [Trt 2] ) did not significantly change carbohydrate
growth, expression in CCA. The ASI range was relatively high at 1310.18-333.97 μmol m-2 s-1
PAR, this could be why no difference in carbohydrates was observed. It is known that in less
light (ASI 80 μmol m-2 s-1 PAR) Chlorella growth decrease and cyanobacteria continue to grow
and store energy in carbohydrates.
Extracted lipid contents were lower than previous studies this could be due to cellular
extraction issues. It was found that total lipid content varies greatly depending on polarity of
extraction solvent and technique used. Total lipid content by Bligh Dyer extraction yield the
lowest lipid contents (0.47 and 0.74 g fat/ 100 g algae DWB for treatment 1 and 2 respectively),
while hexane extraction with Accelerated Solid Extraction (ASE) had the highest total lipid yield
for CCA (8.20 ± 1.20 and 12.70 ± 2.50% DWB for treatment 1 and 2).
Fatty acids with 13-18 carbons were identified, the most abundant being C16:0 Palmitic
acid, C18:3 Linolenic acid and, C18:1 Oleic acid. In each CCA treatment (trt) 10 fatty acids (FA)
were identified. Total fat was calculated as the sum of individual fatty acids. Palmitic acid was
the most abundant FA found it was 22.55% of the total FAs found in trt 1, and 21.96% of the
total FAs found in trt 2. FAs smaller than 14 carbons were not detected, except for C13:1
Tridecenoic was 1.23% of total FA in CCA trt 2. No long-chain ω-3 or ω-6 fatty acids such as
eicosapentaenoic acid (EPA) (20:5, n-3) and docosahexaenoic acid (DHA) (22:6, n-3) were
identified in CCA. C18:3 Linolenic acid was the only ω-3 found in both treatments. C16:0
Palmitic acid and C18:0 Stearic acid were the only saturated FAs found. CCA lipids are a viable
option for biofuels and creating nutritional and medicinal products due to their ability to
accumulate lipids under stress and their plant-like fatty-acid composition.
105
In conclusion CCA’s ability to grow in several irradiance regimes and create substantial
biomass while still accumulating valuable macronutrients make it a promising source of
bioactive compounds that can be applied in food, feed, nutraceutical, and pharmacological
industries. CCA shows promising amounts of amylose that can be applied in food systems as
dietary fiber (resistant to digestion).
106
References
Aakanksha, S.S., Guruprasad, S., Ramachandra T.V., (2010). Diversity of Lipids in Algae. Paper
presented at the Lake 2010: Wetlands, Biodiversity and Climate Change, Bangalore,
India. Conference Abstract retrieved from a
Abo-Shady, A. M., Mohamed, Y. A., & Lasheen, T. (1993). Chemical composition of the cell
wall in some green algae species. Biologia Plantarum, 35(4), 629-632.
Aiken, G. R., D. M. Mcknight, K. A. Thorn, And E. M. Thurman. (1992). Isolation of
Hydrophilic Organic Acids from Water Using Nonionic Macroporous Resins. Org.
Geochem. 18: 567-573.
Åkerlund, H. E., Jansson, C., & Andersson, B. (1982). Reconstitution of photosynthetic water
splitting in inside-out thylakoid vesicles and identification of a participating polypeptide.
Biochimica et Biophysica Acta (BBA)-Bioenergetics, 681(1), 1-10.
Al Abdallah, Q., Nixon, B. T., & Fortwendel, J. R. (2016). The Enzymatic Conversion of Major
Algal and Cyanobacterial Carbohydrates to Bioethanol. Frontiers in Energy Research,
4(36). doi:10.3389/fenrg.2016.00036
Algae Biomass Organization. (2019). Algae Industry Products & Services Directory. available
at: https://algaebiomass.org/resource-center/industry-resources/algae-industry-services-
directory/#bigelow (accessed May 2019).
Al-Hasan, R. H., Ali, A. M., & Radwan, S. S. (1989). Effects of light and dark incubation on the
lipid and fatty acid composition of marine cyanobacteria. Microbiology, 135(4), 865-872.
Al-Safaar, A. T., Al-Rubiaee, G. H., & Salman, S. K. (2016). Effect of pHCondition on the
Growth and Lipid Content of Microalgae Chlorella vulgaris&Chroococcus minor. Journal
of Scientific & Engineering Research, 7(11), 1139.
Anagnostidis, K. and Komárek, J. (1988) Modern approach to the classification system of
cyanophytes. 3. Oscillatoriales. Arch Hydrobiol Suppl 80, 327–472.
Andersen, O. M. and Markham, K. R. 2006. Flavonoids: Chemistry, Biochemistry and
Applications. CRC Press Taylor & Francis Group 6000 Broken Sound Parkway NW,
Suite 300 Boca Raton, FL.
107
Araki, S., Eichenberger, W., Sakurai, T., & Sato, N. (1991). Distribution of
diacylglycerylhydroxymethyltrimethyl-β-alanine (DGTA) and phosphatidylcholine in
brown algae. Plant and cell physiology, 32(5), 623-628.
Armenta, R. E., & Valentine, M. C. (2013). Single-cell oils as a source of omega-3 fatty acids:
an overview of recent advances. Journal of the American Oil Chemists' Society, 90(2),
167-182.
Arteni, A. A., Ajlani, G., & Boekema, E. J. (2009). Structural organisation of phycobilisomes
from Synechocystis sp. strain PCC6803 and their interaction with the membrane.
Biochimica et Biophysica Acta (BBA)-Bioenergetics, 1787(4), 272-279.
Bai, R. (2012). Lipid Production from a Louisiana Native Chlorella vulgaris/Leptolyngbya sp.
Co-culture for Biofuel Applications. Chemical Engineering Commons. LSU Doctoral
Dissertation
Bai, R., Gutierrez‐Wing, M.T., Negulescu, I.I., Rusch, K.A. (2013) Effect of organic carbon,
C:N ratio and light on the growth and lipid productivity of microalgae/cyanobacteria
coculture.Engineering in Life Sciences.
Ball S, Marianne T, Dirick L, Fresnoy M, Delrue B, Decq AA (1991). Chlamydomonas
reinhardtii low-starch mutant is defective for 3-phosphoglycerate activation and
orthophosphate inhibition of ADP-glucose pyrophosphorylase. Planta 185: 17–26.
Ball, S.G. and Morell, M.K. (2003) From bacterial glycogen to starch: understanding the
biogenesis of the plant starch granule. Annu. Rev. Plant Biol. 54: 207–233.
Barbarino, E., & Lourenço, S. O. (2005). An evaluation of methods for extraction and
quantification of protein from marine macro-and microalgae. Journal of Applied
Phycology, 17(5), 447-460.
Barker, J. P., Cattolico, R. A., & Gatza, E. (2012). Multiparametric Analysis of Microalgae for
Biofuels Using Flow Cytometry. White Paper, BD Biosciences.
Barnett, J. Z., Foy, J., Malone, R., Rusch, K. A., & Gutierrez‐Wing, M. T. (2017). Impact of
light quality on a native Louisiana Chlorella vulgaris L./Leptolyngbya sp. co‐culture.
Engineering in Life Sciences, 17(6), 678-685.
108
Barsanti, L., Coltelli, P., Evangelista, V., Frassanito, A. M., Passarelli, V., Vesentini, N., &
Gualtieri, P. (2008). Oddities and curiosities in the algal world. In Algal toxins: nature,
occurrence, effect and detection (pp. 353-391). Springer, Dordrecht.
Becker, E. W. (1994). Microalgae: biotechnology and microbiology (Vol. 10). Cambridge
University Press.
Becker, E. W. (2007). Micro-algae as a source of protein. Biotechnology advances, 25(2), 207-
210.
Benavente-Valdés, J. R., Aguilar, C., Contreras-Esquivel, J. C., Méndez-Zavala, A., &
Montañez, J. (2016). Strategies to enhance the production of photosynthetic pigments and
lipids in chlorophycae species. Biotechnology Reports, 10, 117–125.
http://doi.org/10.1016/j.btre.2016.04.001
Bennett, A. and Bogorad, L. (1973). Complimentary Chromatic Adaptation in a Filamentous
Blue-Green Alga. The Journal of Cell Biology, 58, No. 2, 419.
Benson, A. A., R. Wiser, R. A. Ferrari & J. A. Miller, 1958. Photosynthesis of galactolipids.
Journal of the American Chemical Society 80: 4740.
Benson, B. C., & Rusch, K. A. (2006). Investigation of the light dynamics and their impact on
algal growth rate in a hydraulically integrated serial turbidostat algal reactor (HISTAR).
Aquacultural engineering, 35(2), 122-134.
Bernstein, A. M., Ding, E. L., Willett, W. C., & Rimm, E. B. (2012). A meta-analysis shows that
docosahexaenoic acid from algal oil reduces serum triglycerides and increases HDL-
cholesterol and LDL-cholesterol in persons without coronary heart disease. The Journal
of nutrition, 142(1), 99-104.
Bewicke, D., & Potter, B. A. (2009). Chlorella: The Emerald Food. Ronin Publishing.
Bhambere, D., A. Gaidhani, K., Harwalkar, M., & S. Nirgude, P. (2015). Lyophilization / Freeze
Drying – A Review (Vol. 4).
Birt D., Boylston, T., Hendrich, S., Jane, J., Hollis, J., Li, L., McClelland, J., Moore, S., Phillips,
G., Rowling, M., Schalinske, K., Scott, M., Whitley, E. (2013). Resistant Starch: Promise
for Improving Human Health. Advances in Nutrition, 4, 587-601.
109
Bleicher P, Mackin W (1995) Betafectin PGG-glucan: a novel carbohydrate immunomodulator
with anti-infective properties. J Biotechnol Healthc 2:207–222
Bligh, E. G., & Dyer, W. J. (1959). A rapid method of total lipid extraction and purification.
Canadian journal of biochemistry and physiology, 37(8), 911-917.
Bold, H.C., 1949. The Morphology of Chlamydomonas Chlamydogama, sp. Nov. Bulletin of the
Torrey Botanical Club, 76(2), pp.101-108.
Bonkovsky, H. L., Guo, J. T., Hou, W., Li, T., Narang, T., & Thapar, M. (2013). Porphyrin and
heme metabolism and the porphyrias. Comprehensive Physiology.
Borowitzka, M. A. (1999). Commercial production of microalgae: ponds, tanks, tubes and
fermenters.
Borowitzka, M. A. (2013). High-value products from microalgae—their development and
commercialisation. Journal of Applied Phycology, 25(3), 743-756.
Bouterfas R, Belkoura M, Dauta A (2006). The effects of irradiance and photoperiod on the
growth rates of three freshwater green algae isolated from a eutrophic lake. Limnetica
25:647–656
Brennan, L., & Owende, P. (2010). Biofuels from microalgae—a review of technologies for
production, processing, and extractions of biofuels and co-products. Renewable and
sustainable energy reviews, 14(2), 557-577.
Bricker, T. M., & Frankel, L. K. (2002). The structure and function of CP47 and CP43 in
photosystem II. Photosynthesis research, 72(2), 131.
Bricker, T. M., Morvant, J., Masri, N., Sutton, H. M., & Frankel, L. K. (1998). Isolation of a
highly active photosystem II preparation from Synechocystis 6803 using a histidine-
tagged mutant of CP 47. Biochimica et Biophysica Acta (BBA)-Bioenergetics, 1409(1),
50-57.
Bricker, T. M., Odom, W. R., & Queirolo, C. B. (1988). Close association of the 33 kDa
extrinsic protein with the apoprotein of CPa1 in photosystem II. FEBS letters, 231(1),
111-117.

110
Brooks, G., Franklin, S., Avila, J., Decker, S. M., Baliu, E., Rakitsky, W., ... & Norris, L. M.
(2010). U.S. Patent Application No. 12/684,893.
Brown, R.M., Jr., & Bold, H.C. (1964). Comparative studies of the algal genera Tetracystis and
Chlorococcum. University of Texas Publication No. 6417: 1-213.
Burnap, R. L., Shen, J. R., Jursinic, P. A., Inoue, Y., & Sherman, L. A. (1992). Oxygen yield and
thermoluminescence characteristics of a cyanobacterium lacking the manganese-
stabilizing protein of photosystem II. Biochemistry, 31(32), 7404-7410.
Capelli, B., & Cysewski, G. R. (2010). Potential health benefits of spirulina
microalgae. Nutrafoods, 9(2), 19-26.
Caprioli, R. M., Farmer, T. B., & Gile, J. (1997). Molecular imaging of biological samples:
localization of peptides and proteins using MALDI-TOF MS. Analytical chemistry,
69(23), 4751-4760.
Cerón, M.C., Campos, I., Sánchez, J.F., Acién, F.G., Molina, E., Fernández-Sevilla, J.M., 2008.
Recovery of lutein from microalgae biomass: development of a process for Scenedesmus
almeriensis biomass. J. Agric. Food Chem. 56, 11761–11766.
Chacón-Lee TL, González-Mariño GE (2010) Microalgae for “healthy” foods – possibilities and
challenges. Compr Rev Food Sci Food 9(6):655–675
Chakdar, H., & Pabbi, S. (2017). Algal pigments for human health and cosmeceuticals. In Algal
Green Chemistry (pp. 171-188). Elsevier.
Chang, Chuan. (2012). Carbohydrates- Comprehensive Studies on Glycobiology and
Glycotechnology. InTech. 290-316.
Chen, X., Wu, M., Yang, Q., & Wang, S. (2017). Preparation, characterization of food grade
phycobiliproteins from Porphyra haitanensis and the application in liposome-meat
system. LWT, 77, 468-474. doi: https://doi.org/10.1016/j.lwt.2016.12.005
Cogdell, R. J. (1978). Carotenoids in photosynthesis. Philosophical Transactions of the Royal
Society of London. B, Biological Sciences, 284(1002), 569-579.
doi:10.1098/rstb.1978.0090
111
Corcoran AA, Boeing WJ. (2012). Biodiversity increases the productivity and stability of
phytoplankton communities. PloS ONE. 7, e49397. pmid:23173059
Cuellar‐Bermudez, S. P., Aguilar‐Hernandez, I., Cardenas‐Chavez, D. L., Ornelas‐Soto, N.,
Romero‐Ogawa, M. A., & Parra‐Saldivar, R. (2015). Extraction and purification of high‐
value metabolites from microalgae: essential lipids, astaxanthin and phycobiliproteins.
Microbial biotechnology, 8(2), 190-209.
Cuellar-Bermúdez, S. P., Barba-Davila, B., Serna-Saldivar, S. O., Parra-Saldivar, R., Rodriguez-
Rodriguez, J., Morales-Davila, S., . . . Chuck-Hernández, C. (2017). Deodorization of
Arthrospira platensis biomass for further scale-up food applications. Journal of the
Science of Food and Agriculture, 97(15), 5123-5130. doi:10.1002/jsfa.8391
Cunningham, A. (1993). Analysis of microalgae and cyanobacteria by flow cytometry. In Flow
Cytometry in Microbiology (pp. 131-142). Springer, London.
Cyanobacteria. (2017). Funk & Wagnalls New World Encyclopedia, 1p. 1.
Dahiya A, Todd J, McInnis A. Wastewater treatment integrated with algae production for
biofuel. In: Gordon R, Seckbach J, editors. The science of algal fuels: cellular origin, life
in extreme habitats and astrobiology. Dordrecht: Springer Netherlands; 2012. pp. 447–
466.
Davey, H. M., & Kell, D. B. (1996). Flow cytometry and cell sorting of heterogeneous microbial
populations: the importance of single-cell analyses. Microbiological reviews, 60(4), 641-
696.
de Jesus Raposo, M. F., de Morais, R. M. S. C., & de Morais, A. M. M. B. (2013). Health
applications of bioactive compounds from marine microalgae. Life Sciences, 93(15),
479-486. doi: https://doi.org/10.1016/j.lfs.2013.08.002
Delrue B, Fontaine T, Routier F, Decq A, Wieruszeski J-M, Van den Koornhuyse N, Maddelein
ML, Fournet B, Ball S (1992) Waxy Chlamydomonas reinhardtii: monocellular algal
mutants defective in amylose biosynthesis and granule-bound starch synthase activity
accumulate a structurally modified amylopectin. J Bacteriol 174: 3612–3620.
deMan, J. M., & deMan, J. M. (1999). Color. Principles of Food Chemistry, 229-262.
112
Dhillon, M. K., Kumar, S., & Gujar, G. T. (2014). A common HPLC-PDA method for amino
acid analysis in insects and plants. http://nopr.niscair.res.in/handle/123456789/25161
Domozych, D., Ciancia, M., Fangel, J. U., Mikkelsen, M. D., Ulvskov, P., & Willats, W. G.
(2012). The cell walls of green algae: a journey through evolution and diversity. Frontiers
in plant science, 3, 82.
Ebeling, M. E. (1968). The Dumas method for nitrogen in feeds. Journal of the Association of
Official Analytical Chemists, 51, 766-770.
Eonseon, J., Polle, J. E. W., & Lee, H. K. S., M. Hyun, and M. Chang. 2003. Xanthophylls in
microalgae: from biosynthesis to biotechnological mass production and application. J.
Microbiol. Biotechnol, 13(2), 165-174.
Fassett R, Coombes J (2011) Astaxanthin: a potential therapeutic agent in cardiovascular disease.
Mar Drugs 9(3):447–465
Fernández-Linares, L. C., Guerrero Barajas, C., Durán Páramo, E., & Badillo Corona, J. A.
(2017). Assessment of Chlorella vulgaris and indigenous microalgae biomass with
treated wastewater as growth culture medium. Bioresource Technology, 244, 400-406.
doi: https://doi.org/10.1016/j.biortech.2017.07.141
Ferrell, J., & Sarisky-Reed, V. (2010). National algal biofuels technology roadmap (No.
DOE/EE-0332). EERE Publication and Product Library.
Flaibani A, Olsen Y, Painter TJ (1989) Polysaccharides in desert reclamation: compositions of
exocellular proteoglycan complexes produced by filamentous blue-green and unicellular
green edaphic algae. Carbohydr Res 190(2):235–248
Fleurence, J. (1999). Seaweed proteins: biochemical, nutritional aspects and potential uses.
Trends in food science & technology, 10(1), 25-28.
Food and Agricultural Organization/World Health Organization. (1973). Energy and protein
requirement: Report of a Joint FAO/WHO ad hoc Expert Committee, vol. 52, FAO.
Fowden, L. (1952). The composition of the bulk proteins of Chlorella. Biochemical Journal,
50(3), 355.
113
Galasso, C., Corinaldesi, C., & Sansone, C. (2017). Carotenoids from Marine Organisms:
Biological Functions and Industrial Applications. Antioxidants, 6(4), 96.
doi:10.3390/antiox6040096
Gallant, D.J., Bouchet, B. and Baldwin, P.M. (1997) Microscopy of starch: evidence of a new
level of granule organization. Carbohydr. Polym. 32: 177–191.
Geresh, S., Dubinsky, O., Arad, S., Christiaen, D., & Glaser, R. (1990). Structure of 3-O- (α-d-
glucopyranosyluronic acid)-l-galactopyranose, an aldobiouronic acid isolated from the
polysaccharides of various unicellular red algae. Carbohydrate Research, 208, 301-305.
doi: https://doi.org/10.1016/0008-6215(90)80116-K
Gidley, M.J. and Bulpin, P.V. (1987) Crystallisation of malto-oligosaccharides as models of the
crystalline forms of starch: minimum chain-length requirement for the formation of
double helices. Carbohydr. Res. 161: 291–300.
Gifuni, I., Olivieri, G., Krauss, I. R., D'Errico, G., Pollio, A., & Marzocchella, A. (2017).
Microalgae as new sources of starch: isolation and characterization of microalgal starch
granules. Chemical Engineering Transactions, 57, 1423-1428.
Gill, P., Tohidu Moghadam, T., Ranjbar, B. (2010). Differential Scanning Calorimetry
Techniques: Applications in Biology and Nanoscience. Biomolecular Techniques. 21,
167-193.
Glazer, A. N. (1994). Phycobiliproteins — a family of valuable, widely used fluorophores.
Journal of Applied Phycology, 6(2), 105-112. doi:10.1007/BF02186064
Glazer, A.N., 1989. Light guides. Directional energy transfer in a photosynthetic antenna. J. Biol.
Chem. 264:1-4
Goo, B. G., Baek, G., Choi, D. J., Park, Y. I., Synytsya, A., Bleha, R., ... & Park, J. K. (2013).
Characterization of a renewable extracellular polysaccharide from defatted microalgae
Dunaliella tertiolecta. Bioresource technology, 129, 343-350.
Graham, L. E., and L. W. Wilcox. 2000. Algae. Upper Saddle River: Prentice Hall.
Green, R. E., Sosik, H. M., Olson, R. J., & DuRand, M. D. (2003). Flow cytometric
determination of size and complex refractive index for marine particles: comparison with
independent and bulk estimates. Applied Optics, 42(3), 526-541.
114
Grima, M.E. Medina, R.A., Giménez, G.A. (1999). Recovery of algal PUFAs. Z. Cohen (Ed.),
Chemicals from microalgae, Taylor & Francis, London. pp. 108-144.
Guckert, J. B., & Cooksey, K. E. (1990). Triglyceride accumulation and fatty acid profile
changes in Chlorella (Chlorophyta) during high Ph‐induced cell cycle Inhibition 1.
Journal of Phycology, 26(1), 72-79.
Guedes, A.C., Sousa-Pinto, I., Malcata, F.X. (2015). Application of protein of microalgae to
aquafeed in Handbook of Marine Microalgae Biotechnology Advances. Se-Kwan Kim
(ed.). Chp. 8, pp. 93-126.
Guschina, I. A., & Harwood, J. L. (2006). Lipids and lipid metabolism in eukaryotic algae.
Progress in Lipid Research, 45(2), 160-186.
doi:https://doi.org/10.1016/j.plipres.2006.01.001
Guschina, I. A., & Harwood, J. L. (2009). Algal lipids and effect of the environment on their
biochemistry. In Lipids in aquatic ecosystems (pp. 1-24). Springer, New York, NY.
Gutierrez-Wing, M.T, (unpublished work). Notes from meetings. Verbal information provided
based on experience. Department of Civil and Environmental Engineering. Louisiana
State University.
Guzman, S., Gato, A., Lamela, M., Freire‐Garabal, M., & Calleja, J. M. (2003). Anti‐
inflammatory and immunomodulatory activities of polysaccharide from Chlorella
stigmatophora and Phaeodactylum tricornutum. Phytotherapy Research, 17(6), 665-670.
Habib, M. A. B. (2008). Review on culture, production and use of Spirulina as food for humans
and feeds for domestic animals and fish. FAO Fisheries and Aquaculture Circular. No.
1034. http://www.fao.org/3/i0424e/i0424e00.pdf.
Halim, R., Danquah, M. K., & Webley, P. A. (2012). Extraction of oil from microalgae for
biodiesel production: A review. Biotechnology Advances, 30(3), 709-732. doi:
https://doi.org/10.1016/j.biotechadv.2012.01.001
Hall, N. G., & Schönfeldt, H. C. (2013). Total nitrogen vs. amino-acid profile as indicator of
protein content of beef. Food Chemistry, 140(3), 608-612. doi:
https://doi.org/10.1016/j.foodchem.2012.08.046
115
Harwood J.L. (1998) Membrane Lipids in Algae. In: Paul-André S., Norio M. (eds) Lipids in
Photosynthesis: Structure, Function and Genetics. Advances in Photosynthesis and
Respiration, vol 6. Springer, Dordrecht
Harwood, J., & Moore Jr, T. S. (1989). Lipid metabolism in plants. Critical reviews in plant
sciences, 8(1), 1-43.
Hejazi, M. A., & Wijffels, R. H. (2004). Milking of microalgae. Trends Biotechnol, 22(4), 189-
194. doi: 10.1016/j.tibtech.2004.02.009
Henríquez, V., Escobar, C., Galarza, J., & Gimpel, J. (2016). Carotenoids in microalgae
Carotenoids in Nature (pp. 219-237): Springer.
Ho, S.-H., Huang, S.-W., Chen, C.-Y., Hasunuma, T., Kondo, A., & Chang, J.-S. (2013).
Characterization and optimization of carbohydrate production from an indigenous
microalga Chlorella vulgaris FSP-E. Bioresource Technology, 135(Supplement C), 157-
165. doi: https://doi.org/10.1016/j.biortech.2012.10.100
Hyka, P., Lickova, S., Přibyl, P., Melzoch, K., & Kovar, K. (2013). Flow cytometry for the
development of biotechnological processes with microalgae. Biotechnology advances,
31(1), 2-16.
Jeffrey SW, Llewellyn CA, Barlow RG, Mantoura RFC (1997). Pigment processes in the sea: a
selected bibliography. In: Jeffrey SW, Mantoura RFC, Wright SW (eds) Phytoplankton
pigments in oceanography. SCOR-UNESCO, Paris, p 167–178
Jenkins, P.J., Cameron, R.E. and Donald, A.M. (1993) A universal feature in the structure of
starch granules from different botanical sources. Starch 45: 417–420.
Jiang, Yu, "Effects of Amino Acids and Fatty Acids on Rice Starch Properties: Thermal, Pasting,
Resistant Starch and Structural Characterization" (2013). LSU Doctoral Dissertations.
1943. https://digitalcommons.lsu.edu/gradschool_dissertations/1943
Juliano, B. (1971). A simplified assay for milled-rice amylose. Cereal Sci. Today, 16, 334-360.
Kainuma, K. and French, D. (1972) Naegeli amylodextrin and its relationships to starch granule
structure. II. Role of water in crystallization of B-starch. Biopolymers 11: 2241–2250.

116
Karkacier, M., Erbas, M., Uslu, M. K., & Aksu, M. (2003). Comparison of different extraction
and detection methods for sugars using amino-bonded phase HPLC. Journal of
chromatographic science, 41(6), 331-333.
Kent, M., Welladsen, H. M., Mangott, A., & Li, Y. (2015). Nutritional evaluation of Australian
microalgae as potential human health supplements. PloS one, 10(2), e0118985.
Khairy, H. M., Ali, E. M., & Dowidar, S. M. (2011). Comparative effects of autotrophic and
heterotrophic growth on some vitamins, 2, 2-diphenyl-1-picrylhydrazyl (DPPH) free
radical scavenging activity, amino acids and protein profile of Chlorella vulgaris
Beijerinck. African Journal of Biotechnology, 10(62), 13514-13519.
Kim, J., Choi, W., Jeon, S. , Kim, T. , Park, A. , Kim, J. , Heo, S. , Oh, C. , Shim, W. and Kang,
D. (2015), Isolation and characterization of Leptolyngbya sp. KIOST‐1, a basophilic and
euryhaline filamentous cyanobacterium from an open paddle‐wheel raceway Arthrospira
culture pond in Korea. J Appl Microbiol, 119: 1597-1612. doi:10.1111/jam.12961
Kiran, B., Pathak, K., Kumar, R., Deshmukh, D., & Rani, N. (2016). Influence of varying
nitrogen levels on lipid accumulation in Chlorella sp. International journal of
environmental science and technology, 13(7), 1823-1832.
Kissoudi, M. Sarakatsianos, I., Samanidou, V. (2018). Isolation and purification of food‐grade C‐
phycocyanin from Arthrospira platensis and its determination in confectionery by HPLC
with diode array detection. J Separation Sci. 41(4): 975-981.
Koh, J., Xu, Z. and Wicker, L. (2018), Blueberry Pectin Extraction Methods Influence Physico‐
Chemical Properties. Journal of Food Science, 83: 2954-2962. doi:10.1111/1750-
3841.14380
Kokabi, M., Yousefzadi, M., Soltani, M., & Arman, M. (2019). Effects of different UV radiation
on photoprotective pigments and antioxidant activity of the hot‐spring cyanobacterium
Leptolyngbya cf. fragilis. Phycological Research.
Komárek J. (1992): Diversita a moderní klasifikace sinic (Cyanoprocaryota) [Diversity and
modern classification of Cyanobacteria (Cyanoprokaryota). - inaugural dissertation, not
published
Kuriyan, J., Krishna, T. S. R., Wong, L., Guenther, B., Pahler, A., Williams, C. H., & Model, P.
(1991). Convergent evolution of similar function in two structurally divergent enzymes.
Nature, 352(6331), 172-174. doi:10.1038/352172a0
117
Kuwabara, T., & Murata, N. (1979). Purification and characterization of 33 kilodalton protein of
spinach chloroplasts. Biochimica et Biophysica Acta (BBA)-Protein Structure, 581(2),
228-236.
Laemmli, U.K. (1970). Cleavage of structural proteins during the assembly of the head of
bacteriophage T4. Nature, London 227, 680-685.
Lang, Imke. Fatty Acid Profiles and Their Distribution Patterns in Microalgae: A Comprehensive
Analysis of More than 2000 Strains from the SAG Culture Collection. BMC Plant
Biology 11 (2011): 124. PMC.
Lee, R. F., & Loeblich III, A. R. (1971). Distribution of 21: 6 hydrocarbon and its relationship to
22: 6 fatty acid in algae. Phytochemistry, 10(3), 593-602.
Lee, W. C. Y., Lee, W. H., & Rosenbaum, M. (1998). Chlorella: McGraw-Hill Education.
Levy, L. W. (2001). U.S. Patent No. 6,191,293. Washington, DC: U.S. Patent and Trademark
Office.
Li, Y., Ghasemi Naghdi, F., Garg, S., Adarme-Vega, T. C., Thurecht, K. J., Ghafor, W. A., …
Schenk, P. M. (2014). A comparative study: the impact of different lipid extraction
methods on current microalgal lipid research. Microbial Cell Factories, 13, 14.
http://doi.org/10.1186/1475-2859-13-14
Li, Y., Horsman, M., Wu, N., Lan, C. Q., & Dubois‐Calero, N. (2008). Biofuels from
microalgae. Biotechnology progress, 24(4), 815-820.
Liang S., Liu X., Chen F., Chen Z. (2004) Current microalgal health food R & D activities in
China. In: Ang P.O. (eds) Asian Pacific Phycology in the 21st Century: Prospects and
Challenges. Developments in Hydrobiology, vol 173. Springer, Dordrecht
Liem, P. Q., & Laur, M. H. (1977). Structures, teneurs et compositions des esters sulfuriques,
sulfoniques, phosphoriques des glycosyldiglycérides de trois fucacées. Biochimie, 58(11-
12), 1367-1380.
López, C. V. G., García, M. D. C. C., Fernández, F. G. A., Bustos, C. S., Chisti, Y., & Sevilla, J.
M. F. (2010). Protein measurements of microalgal and cyanobacterial biomass.
Bioresource technology, 101(19), 7587-7591.

118
Lourenço, S. O., Barbarino, E., De‐Paula, J. C., Pereira, L. O. D. S., & Marquez, U. M. L.
(2002). Amino acid composition, protein content and calculation of nitrogen‐to‐protein
conversion factors for 19 tropical seaweeds. Phycological Research, 50(3), 233-241.
Lowry, O. H., Rosebrough, N. J., Farr, A. L., & Randall, R. J. (1951). Protein measurement with
the Folin phenol reagent. Journal of biological chemistry, 193(1), 265-275.
Maddocks, S. E., & Oyston, P. C. (2008). Structure and function of the LysR-type transcriptional
regulator (LTTR) family proteins. Microbiology, 154(Pt 12), 3609-3623.
doi:10.1099/mic.0.2008/022772-0
Malkin, R., & Niyogi, K. (2000). Biochemistry and molecular biology of plants. Rockville, MD,
USA: American Society of Plant Physiologists, 568-628.
Manners, D.J. (1991) Recent developments in our understanding of glycogen structure.
Carbohydr. Polym. 16: 37–82.
Marie, D., Simon, N., & Vaulot, D. (2005). Phytoplankton cell counting by flow cytometry.
Algal culturing techniques, 1, 253-267.
Markou, G., Angelidaki, I., & Georgakakis, D. (2012). Microalgal carbohydrates: an overview of
the factors influencing carbohydrates production, and of main bioconversion technologies
for production of biofuels. Applied microbiology and biotechnology, 96(3), 631-645.
Matos, Â. P. (2017). The Impact of Microalgae in Food Science and Technology. Journal of the
American Oil Chemists' Society, 94(11), 1333-1350.
Mendoza, H., De la Jara, A., Freijanes, K., Carmona, L., Ramos, A. A., de Sousa Duarte, V., ...
& Carlos, J. (2008). Characterization of Dunaliella salina strains by flow cytometry: a
new approach to select carotenoid hyperproducing strains. Electronic Journal of
Biotechnology, 11(4), 5-6.
Moheimani, N.R. J Appl Phycol (2013) 25: 387. https://doi.org/10.1007/s10811-012-9873-6
Mohtashamian, Marjan Sadat, "The Use of a Mixed Chlorella Cyanobacteria Culture as a Protein
Source for Aquaculture" (2012). LSU Master's Theses. 4288.
https://digitalcommons.lsu.edu/gradschool_theses/4288
119
Monsur, H. A., Jaswir, I., Simsek, S., Amid, A., & Alam, Z. (2017). Chemical structure of
sulfated polysaccharides from brown seaweed (Turbinaria turbinata). International
Journal of Food Properties, 20(7), 1457-1469. doi:10.1080/10942912.2016.1211144
Morel, A. (1991). Optics of marine particles and marine optics. In Particle analysis in
oceanography (pp. 141-188). Springer, Berlin, Heidelberg.
Morris, H. J., Carrillo, O., Almarales, A., Bermúdez, R. C., Lebeque, Y., Fontaine, R., ... &
Beltrán, Y. (2007). Immunostimulant activity of an enzymatic protein hydrolysate from
green microalga Chlorella vulgaris L. on undernourished mice. Enzyme and Microbial
Technology, 40(3), 456-460.
Morrison, D. J., & Preston, T. (). Formation of short chain fatty acids by the gut microbiota and
their impact on human metabolism. Gut microbes, 7(3), 189–200.
doi:10.1080/19490976.2015.1134082
Mossé, J. 1990. Nitrogen to protein conversion factor for ten cereals and six legumes or oilseeds.
A reappraisal of its definition and determination. Variation according to species and to
seed proteic content. J. Agric. Food Chem. 38: 18–24.
Muller-Feuga, A. (1996). Marine microalgae. The stakes of research. French Research Institute
for the Exploitation of the Sea, Plouzané.
Murakami, C., Takahashi, J., Shimpo, K., Maruyama, T., & Niiya, I. (1997). Lipids and fatty
acid compositions of Chlorella. Journal of Japan Oil Chemists' Society, 46(4), 423-427.
Nair, D., Krishna, J. G., Panikkar, M. V. N., Nair, B. G., Pai, J. G., & Nair, S. S. (2018).
Identification, purification, biochemical and mass spectrometric characterization of novel
phycobiliproteins from a marine red alga, Centroceras clavulatum. International Journal
of Biological Macromolecules, 114, 679-691. doi:
https://doi.org/10.1016/j.ijbiomac.2018.03.153
Nakamura, Y. (2002) Towards a better understanding of the metabolic system for amylopectin
biosynthesis in plants: rice endosperm as a model tissue. Plant Cell Physiol. 43: 718–725.
Nakamura, Y., & Li-Beisson, Y. (Eds.). (2016). Lipids in plant and algae development. Springer
International Publishing.
120
Nakamura, Y., Takahashi, J.-i., Sakurai, A., Inaba, Y., Suzuki, E., Nihei, S., . . . Kurano, N.
(2005). Some Cyanobacteria Synthesize Semi-Amylopectin Type α-Polyglucans Instead
of Glycogen. Plant and Cell Physiology, 46(3), 539-545. doi:10.1093/pcp/pci045
Neori A. “Green water” microalgae: the leading sector in world aquaculture. J Appl Phycol.
2011; 23: 143–149.
Nicoletti M. (2016). Microalgae Nutraceuticals. Foods (Basel, Switzerland), 5(3), 54.
doi:10.3390/foods5030054
Nielsen S.S., (2010). Food Analysis Laboratory Manual, 2nd ed., Springer US, New York.
Nomoto K, Yokokura T, Satoh H, Mutai M (1983) Anti-tumor effect by oral administration of
Chlorella extract, PCM-4 by oral admission (article in Japanese). Gan To Kagaku Zasshi
10:781–785
Ogawa, K., Ikeda, Y., & Kondo, S. (1999). A new trisaccharide, α-D-glucopyranuronosyl-
(1→3)-α-L-rhamnopyranosyl-(1→2)-α-L-rhamnopyranose from Chlorella vulgaris (Vol.
321).
Ogawa, M. A., & Parra‐Saldivar, R. (2015). Extraction and purification of high‐value
metabolites from microalgae: essential lipids, astaxanthin and phycobiliproteins.
Microbial biotechnology, 8(2), 190-209.
Olson, R. J., Vaulot, D., & Chisholm, S. W. (1985). Marine phytoplankton distributions
measured using shipboard flow cytometry. Deep Sea Research Part A. Oceanographic
Research Papers, 32(10), 1273-1280.
Ortiz-Tena, J. G., Rühmann, B., Schieder, D., & Sieber, V. (2016). Revealing the diversity of
algal monosaccharides: Fast carbohydrate fingerprinting of microalgae using crude
biomass and showcasing sugar distribution in Chlorella vulgaris by biomass
fractionation. Algal Research, 17, 227-235. doi:
https://doi.org/10.1016/j.algal.2016.05.008
Park, Y., Je, K.-W., Lee, K., Jung, S.-E., et al., Growth promotion of Chlorella ellipsoidea by co-
inoculation with Brevundimonas sp. isolated from the microalga. Hydrobiologia 2008,
598, 219-228.
121
Patel, A., Mishra, S., Pawar, R., & Ghosh, P. K. (2005). Purification and characterization of C-
Phycocyanin from cyanobacterial species of marine and freshwater habitat. Protein
Expression and Purification, 40(2), 248-255. doi:
https://doi.org/10.1016/j.pep.2004.10.028
Petkov, G., & Garcia, G. (2007). Which are fatty acids of the green alga Chlorella. Biochemical
Systematics and Ecology, 35(5), 281-285.
Pohl, P. and Zurheide, F. (1979b) Control of fatty acid and lipid formation in Baltic marine algae
by environmental factors. In Advances in the Biochemistry and Physiology of Plant
Lipids (Appelqvist, L.A. and Liljenberg, C., eds). Amsterdam: Elsevier, pp. 427–432.
Price, C. A. (1965). A membrane method for determination of total protein in dilute algal
suspensions. Analytical biochemistry, 12(2), 213-218.
Priyadarshani I, Biswajit R (2012) Commercial and industrial applications of micro algae – a
review. J Algal Biomass Utln 3(4):89–100
Pulz, O. (2001). Photobioreactors: production systems for phototrophic microorganisms. Applied
microbiology and biotechnology, 57(3), 287-293.
Pulz, O., & Gross, W. (2004). Valuable products from biotechnology of microalgae. Applied
microbiology and biotechnology, 65(6), 635-648.
Ral, J.-P., Derelle, E., Ferraz, C., Wattebled, F., Farinas, B., Corellou, F., . . . Ball, S. (2004).
Starch Division and Partitioning. A Mechanism for Granule Propagation and
Maintenance in the Picophytoplanktonic Green Alga <em>Ostreococcus
tauri</em>. Plant Physiology, 136(2), 3333. doi:10.1104/pp.104.044131
Ramírez-López, C., Chairez, I., & Fernández-Linares, L. (2016). A novel culture medium
designed for the simultaneous enhancement of biomass and lipid production by Chlorella
vulgaris UTEX 26. Bioresource technology, 212, 207-216.
Rasmussen, U., Nilsson, M., 2003. Cyanobacterial Diversity and Specificity in Plant
Symbioses.Cyanobacteria in Symbiosis, in: Rai, A.N., Bergman, B., Rasmussen, U.
(Eds.). Springer Netherlands, pp. 313-328.

122
Raven J.A., Beardall J. (2003) Carbohydrate Metabolism and Respiration in Algae. In: Larkum
A.W.D., Douglas S.E., Raven J.A. (eds) Photosynthesis in Algae. Advances in
Photosynthesis and Respiration, vol 14. Springer, Dordrecht
Rioux, L. E., Turgeon, S. L., & Beaulieu, M. (2007). Characterization of polysaccharides
extracted from brown seaweeds. Carbohydrate polymers, 69(3), 530-537.
Rismani-Yazdi, H., Haznedaroglu, B. Z., Bibby, K., & Peccia, J. (2011). Transcriptome
sequencing and annotation of the microalgae Dunaliella tertiolecta: pathway description
and gene discovery for production of next-generation biofuels. BMC genomics, 12(1),
148.
Román, R. B., Alvarez-Pez, J. M., Fernández, F. A., & Grima, E. M. (2002). Recovery of pure
B-phycoerythrin from the microalga Porphyridium cruentum. Journal of Biotechnology,
93(1), 73-85.
Rowan, K. S. (1989). Photosynthetic pigments of algae: CUP Archive.
Roy, H., & Cannon, S. (1988). Ribulose bisphosphate carboxylase assembly: what is the role of
the large subunit binding protein. Trends in biochemical sciences, 13(5), 163-165.
Rypniewski, W. R., Breiter, D. R., Benning, M. M., Wesenberg, G., Oh, B. H., Markley, J. L., . .
. Holden, H. M. (1991). Crystallization and structure determination of 2.5-.ANG.
resolution of the oxidized iron-sulfur [2Fe-2S] ferredoxin isolated from Anabaena 7120.
Biochemistry, 30(17), 4126-4131. doi:10.1021/bi00231a003
Sabine, C. L., & Feely, R. A. (2007). 3 The Oceanic Sink for Carbon Dioxide. Greenhouse Gas
Sinks, 31.
Safi, C., Zebib, B., Merah, O., Pontalier, P.-Y., & Vaca-Garcia, C. (2014). Morphology,
composition, production, processing and applications of Chlorella vulgaris: A review.
Renewable and Sustainable Energy Reviews, 35, 265-278. doi:
https://doi.org/10.1016/j.rser.2014.04.007
Schägger, H., & Von Jagow, G. (1987). Tricine-sodium dodecyl sulfate-polyacrylamide gel
electrophoresis for the separation of proteins in the range from 1 to 100 kDa. Analytical
biochemistry, 166(2), 368-379.
Seckbach, J. (1999). Cellular origin, life in extreme habitats and astrobiology.

123
Sensen, C. W., Heimann, K., & Melkonian, M. (1993). The production of clonal and axenic
cultures of microalgae using fluorescence-activated cell sorting. European Journal of
Phycology, 28(2), 93-97.
Seo, Y. C., Choi, W. S., Park, J. H., Park, J. O., Jung, K.-H., & Lee, H. Y. (2013). Stable
Isolation of Phycocyanin from Spirulina platensis Associated with High-Pressure
Extraction Process. International Journal of Molecular Sciences, 14(1), 1778-1787.
Seyfabadi, Z. R., Zahra Amini Khoeyi. (2011). Protein, fatty acid, and pigment content of
Chlorella vulgaris L. under different light regimes. Journal of Applied Phycology, 23(4),
721-726. doi:10.1007/s10811-010-9569-8
Sharma, N. K., Rai, A. K., & Stal, L. J. (2013). Cyanobacteria: an economic perspective. John
Wiley & Sons.
Shepherd R, Rockey J, Sutherland IW, Roller S (1995) Novel bioemulsifiers from
microorganisms for use in foods. J Biotechnol 40(3):207–217
Shi, Y. J. Yang, S.F. Hu, Q. (2007). Purification and identification of polysaccharide derived
from Chlorella pyrenoidosa. Food Chemistry, 103 (2007) 101–105.
doi:10.1016/j.foodchem.2006.07.028
Shimura, Y., Hirose, Y., Misawa, N., Osana, Y., Katoh, H., Yamaguchi, H., & Kawachi, M.
(2015). Comparison of the terrestrial cyanobacterium Leptolyngbya sp. NIES-2104 and
the freshwater Leptolyngbya boryana PCC 6306 genomes. DNA Research, 22(6), 403-
412.
Sichina, W. J. (2000). Use of DSC for the Characterization of Starches. PerkinElmer
Instruments.
Silaban, A. G. (2012). Growth rate and productivity of a Louisiana native
microalgae/cyanobacteria co-culture: Feasibility for use in industrial biotechnology
applications. Louisiana State University Graduate School Digital Commons. Dept of
Civil and Environmental Engineering. Master’s Thesis.
Silaban, A. G. (2013). Growth rate and productivity of a Louisiana native
microalgae/cyanobacteria co-culture: Feasibility for use in industrial biotechnology
applications. LSU Master’s Thesis Commons. pp. 202.
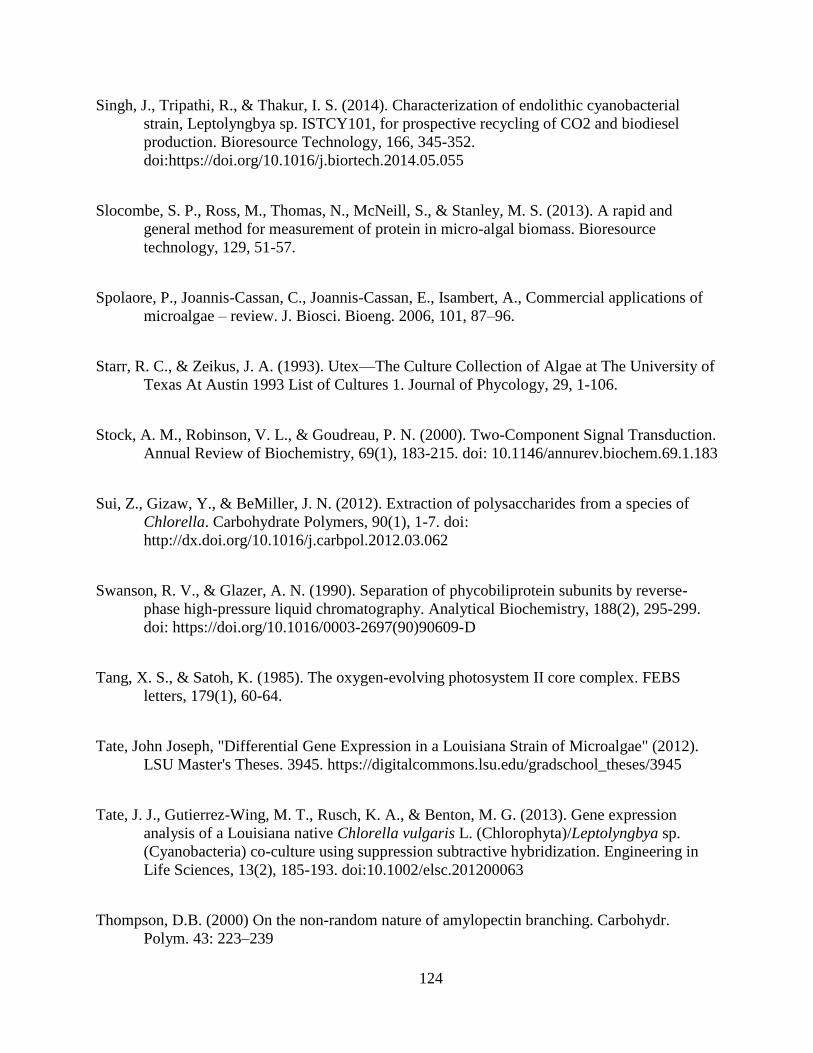
124
Singh, J., Tripathi, R., & Thakur, I. S. (2014). Characterization of endolithic cyanobacterial
strain, Leptolyngbya sp. ISTCY101, for prospective recycling of CO2 and biodiesel
production. Bioresource Technology, 166, 345-352.
doi:https://doi.org/10.1016/j.biortech.2014.05.055
Slocombe, S. P., Ross, M., Thomas, N., McNeill, S., & Stanley, M. S. (2013). A rapid and
general method for measurement of protein in micro-algal biomass. Bioresource
technology, 129, 51-57.
Spolaore, P., Joannis-Cassan, C., Joannis-Cassan, E., Isambert, A., Commercial applications of
microalgae – review. J. Biosci. Bioeng. 2006, 101, 87–96.
Starr, R. C., & Zeikus, J. A. (1993). Utex—The Culture Collection of Algae at The University of
Texas At Austin 1993 List of Cultures 1. Journal of Phycology, 29, 1-106.
Stock, A. M., Robinson, V. L., & Goudreau, P. N. (2000). Two-Component Signal Transduction.
Annual Review of Biochemistry, 69(1), 183-215. doi: 10.1146/annurev.biochem.69.1.183
Sui, Z., Gizaw, Y., & BeMiller, J. N. (2012). Extraction of polysaccharides from a species of
Chlorella. Carbohydrate Polymers, 90(1), 1-7. doi:
http://dx.doi.org/10.1016/j.carbpol.2012.03.062
Swanson, R. V., & Glazer, A. N. (1990). Separation of phycobiliprotein subunits by reverse-
phase high-pressure liquid chromatography. Analytical Biochemistry, 188(2), 295-299.
doi: https://doi.org/10.1016/0003-2697(90)90609-D
Tang, X. S., & Satoh, K. (1985). The oxygen-evolving photosystem II core complex. FEBS
letters, 179(1), 60-64.
Tate, John Joseph, "Differential Gene Expression in a Louisiana Strain of Microalgae" (2012).
LSU Master's Theses. 3945. https://digitalcommons.lsu.edu/gradschool_theses/3945
Tate, J. J., Gutierrez-Wing, M. T., Rusch, K. A., & Benton, M. G. (2013). Gene expression
analysis of a Louisiana native Chlorella vulgaris L. (Chlorophyta)/Leptolyngbya sp.
(Cyanobacteria) co-culture using suppression subtractive hybridization. Engineering in
Life Sciences, 13(2), 185-193. doi:10.1002/elsc.201200063
Thompson, D.B. (2000) On the non-random nature of amylopectin branching. Carbohydr.
Polym. 43: 223–239
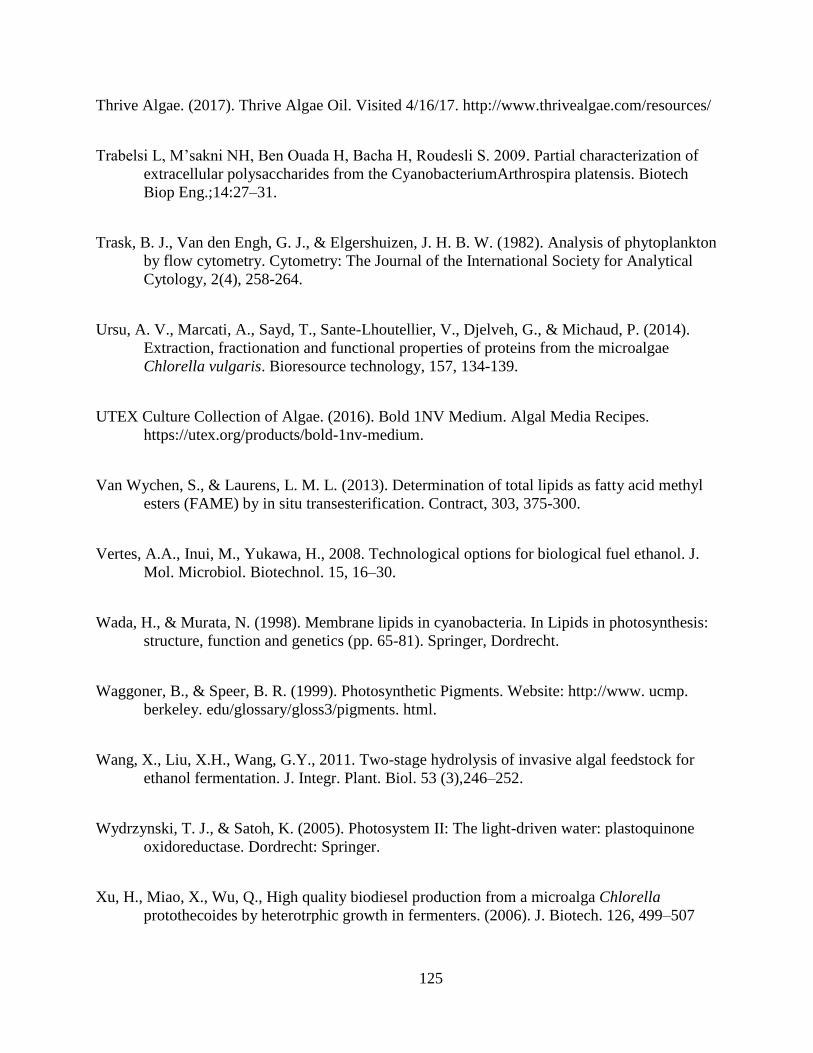
125
Thrive Algae. (2017). Thrive Algae Oil. Visited 4/16/17. http://www.thrivealgae.com/resources/
Trabelsi L, M’sakni NH, Ben Ouada H, Bacha H, Roudesli S. 2009. Partial characterization of
extracellular polysaccharides from the CyanobacteriumArthrospira platensis. Biotech
Biop Eng.;14:27–31.
Trask, B. J., Van den Engh, G. J., & Elgershuizen, J. H. B. W. (1982). Analysis of phytoplankton
by flow cytometry. Cytometry: The Journal of the International Society for Analytical
Cytology, 2(4), 258-264.
Ursu, A. V., Marcati, A., Sayd, T., Sante-Lhoutellier, V., Djelveh, G., & Michaud, P. (2014).
Extraction, fractionation and functional properties of proteins from the microalgae
Chlorella vulgaris. Bioresource technology, 157, 134-139.
UTEX Culture Collection of Algae. (2016). Bold 1NV Medium. Algal Media Recipes.
https://utex.org/products/bold-1nv-medium.
Van Wychen, S., & Laurens, L. M. L. (2013). Determination of total lipids as fatty acid methyl
esters (FAME) by in situ transesterification. Contract, 303, 375-300.
Vertes, A.A., Inui, M., Yukawa, H., 2008. Technological options for biological fuel ethanol. J.
Mol. Microbiol. Biotechnol. 15, 16–30.
Wada, H., & Murata, N. (1998). Membrane lipids in cyanobacteria. In Lipids in photosynthesis:
structure, function and genetics (pp. 65-81). Springer, Dordrecht.
Waggoner, B., & Speer, B. R. (1999). Photosynthetic Pigments. Website: http://www. ucmp.
berkeley. edu/glossary/gloss3/pigments. html.
Wang, X., Liu, X.H., Wang, G.Y., 2011. Two-stage hydrolysis of invasive algal feedstock for
ethanol fermentation. J. Integr. Plant. Biol. 53 (3),246–252.
Wydrzynski, T. J., & Satoh, K. (2005). Photosystem II: The light-driven water: plastoquinone
oxidoreductase. Dordrecht: Springer.
Xu, H., Miao, X., Wu, Q., High quality biodiesel production from a microalga Chlorella
protothecoides by heterotrphic growth in fermenters. (2006). J. Biotech. 126, 499–507

126
Yao, L., Gerde, J. A., Lee, S.-L., Wang, T., & Harrata, K. A. (2015). Microalgae Lipid
Characterization. Journal of Agricultural and Food Chemistry, 63(6), 1773-1787.
doi:10.1021/jf5050603
Yentsch, C. M., Horan, P. K., Muirhead, K., Dortch, Q., Haugen, E., Legendre, L., ... & Spinrad,
R. W. (1983). Flow cytometry and cell sorting: A technique for analysis and sorting of
aquatic particles1. Limnology and Oceanography, 28(6), 1275-1280.
Yeoh, H. H. and Truong, V. D. 1996. Protein contents, amino acid compositions and nitrogen-to-
protein conversion factors for cassava roots. J. Sci. Food Agric. 70: 51–4.
Yim, J. H., Kim, S. J., Ahn, S. H., & Lee, H. K. (2003). Optimal conditions for the production of
sulfated polysaccharide by marine microalga Gyrodinium impudicum strain KG03.
Biomolecular engineering, 20(4-6), 273-280.
Yu, M. H. and Glazer, N. A., Cyanobacterial Phycobilisomes. Role of the Linker Polypeptides in
the Assembly of Phycocyanin. (1982). The Journal of Biological Chemistry, 257, No. 7,
3429.
Zeeman S, Northrop F, Smith AM, ap Rees T (1998) A starch-accumulating mutant of
Arabidopsis thaliana deficient in a chloroplastic starch hydrolyzing enzyme. Plant J 15:
357–365.
Zhang, X. (2015). Microalgae removal of CO2 from flue gas. Clean coal technology research
reports, April. Retrieved from http://bookshop. iea-coal. org. uk/reports/ccc-250/83697,
244.
Zhu, L. D., Li, Z. H., & Hiltunen, E. (2016). Strategies for Lipid Production Improvement in
Microalgae as a Biodiesel Feedstock. BioMed Research International, 2016, 8.
doi:10.1155/2016/8792548
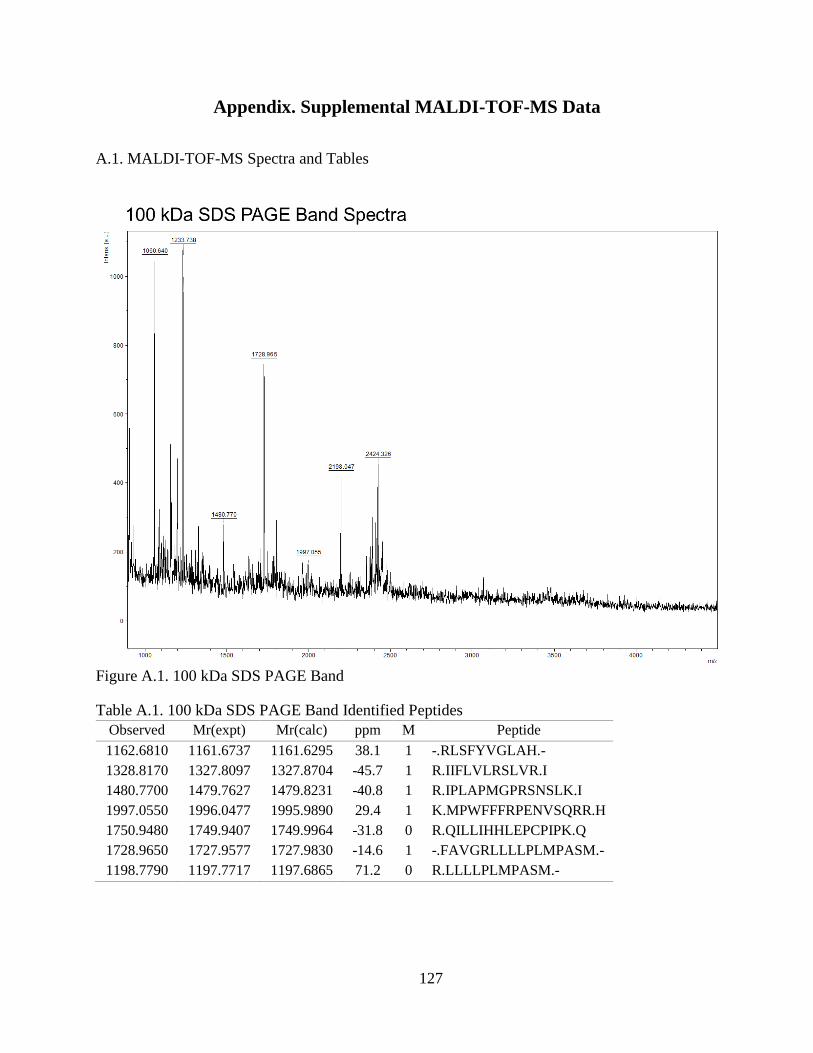
127
Appendix. Supplemental MALDI-TOF-MS Data
A.1. MALDI-TOF-MS Spectra and Tables
Figure A.1. 100 kDa SDS PAGE Band
Table A.1. 100 kDa SDS PAGE Band Identified Peptides
Observed Mr(expt) Mr(calc) ppm M Peptide
1162.6810 1161.6737 1161.6295 38.1 1 -.RLSFYVGLAH.-
1328.8170 1327.8097 1327.8704 -45.7 1 R.IIFLVLRSLVR.I
1480.7700 1479.7627 1479.8231 -40.8 1 R.IPLAPMGPRSNSLK.I
1997.0550 1996.0477 1995.9890 29.4 1 K.MPWFFFRPENVSQRR.H
1750.9480 1749.9407 1749.9964 -31.8 0 R.QILLIHHLEPCPIPK.Q
1728.9650 1727.9577 1727.9830 -14.6 1 -.FAVGRLLLLPLMPASM.-
1198.7790 1197.7717 1197.6865 71.2 0 R.LLLLPLMPASM.-
128
Figure A.2. 52 kDa SDS PAGE Band
Table A.2. 52 kDa SDS PAGE Band Identified Peptides
Observed Mr(expt) Mr(calc) ppm M Peptide
1351.6680 1350.6607 1350.6667 -4.40 1 K.KDAEEYLGGEIK.R
1997.1260 1996.1187 1995.9836 67.7 1 R.AVITCPAYFNDAQRQATK.E
3079.4620 3078.4547 3078.6634 -67.8 1 R.KPIEQALSDAKLKPEDIDEIILVGGMTR.V
2969.4780 2968.4707 2968.6129 -47.9 1 K.LKPEDIDEIILVGGMTRVPMIQNFIK.E
3003.4550 3002.4477 3002.6818 -77.9 1 R.VFQGERPIAADNILLGSFRLVGIPPAPR.G
2897.7050 2896.6977 2896.4819 74.5 1 R.GVPQIEVTFDIDSDGIVHVSAKDLGTGK.E
1321.6550 1320.6477 1320.6197 21.2 1 K.EYGDKIPQDEK.Q
1309.6200 1308.6127 1308.6384 -19.6 1 K.MLFDELEREK.T
1114.5510 1113.5437 1113.6070 -56.8 1 K.TKIGEYIYK.Q
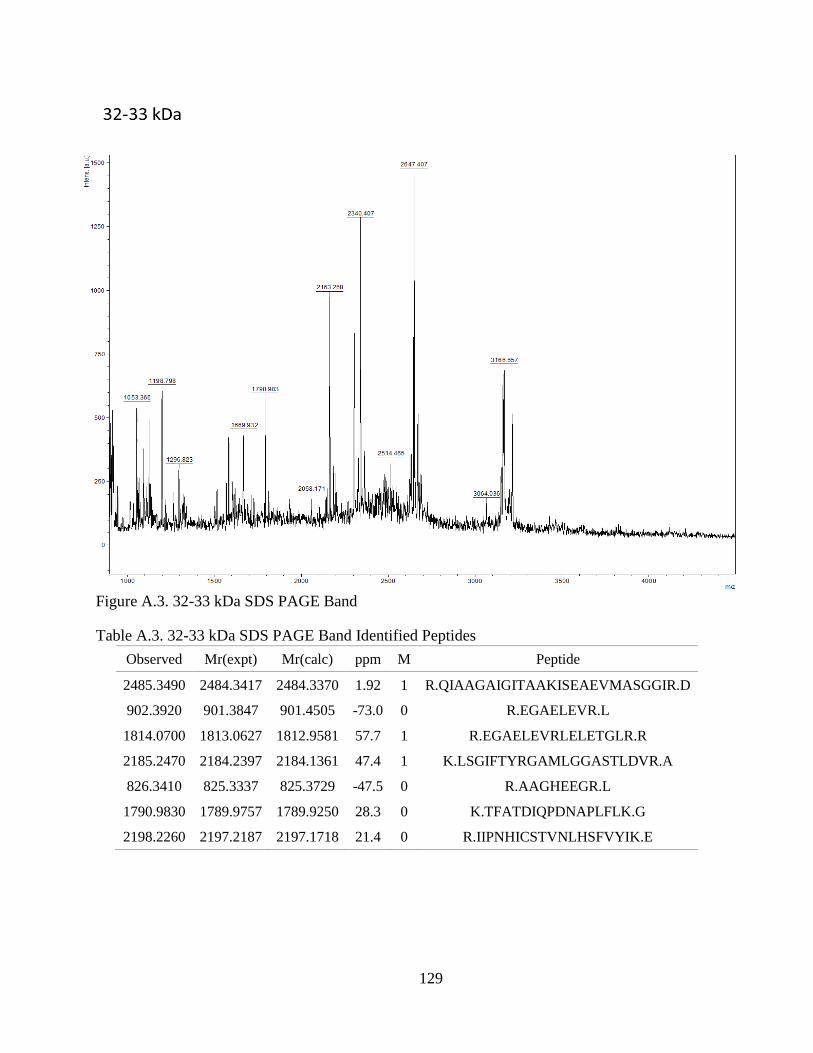
129
Figure A.3. 32-33 kDa SDS PAGE Band
Table A.3. 32-33 kDa SDS PAGE Band Identified Peptides
Observed Mr(expt) Mr(calc) ppm M Peptide
2485.3490 2484.3417 2484.3370 1.92 1 R.QIAAGAIGITAAKISEAEVMASGGIR.D
902.3920 901.3847 901.4505 -73.0 0 R.EGAELEVR.L
1814.0700 1813.0627 1812.9581 57.7 1 R.EGAELEVRLELETGLR.R
2185.2470 2184.2397 2184.1361 47.4 1 K.LSGIFTYRGAMLGGASTLDVR.A
826.3410 825.3337 825.3729 -47.5 0 R.AAGHEEGR.L
1790.9830 1789.9757 1789.9250 28.3 0 K.TFATDIQPDNAPLFLK.G
2198.2260 2197.2187 2197.1718 21.4 0 R.IIPNHICSTVNLHSFVYIK.E
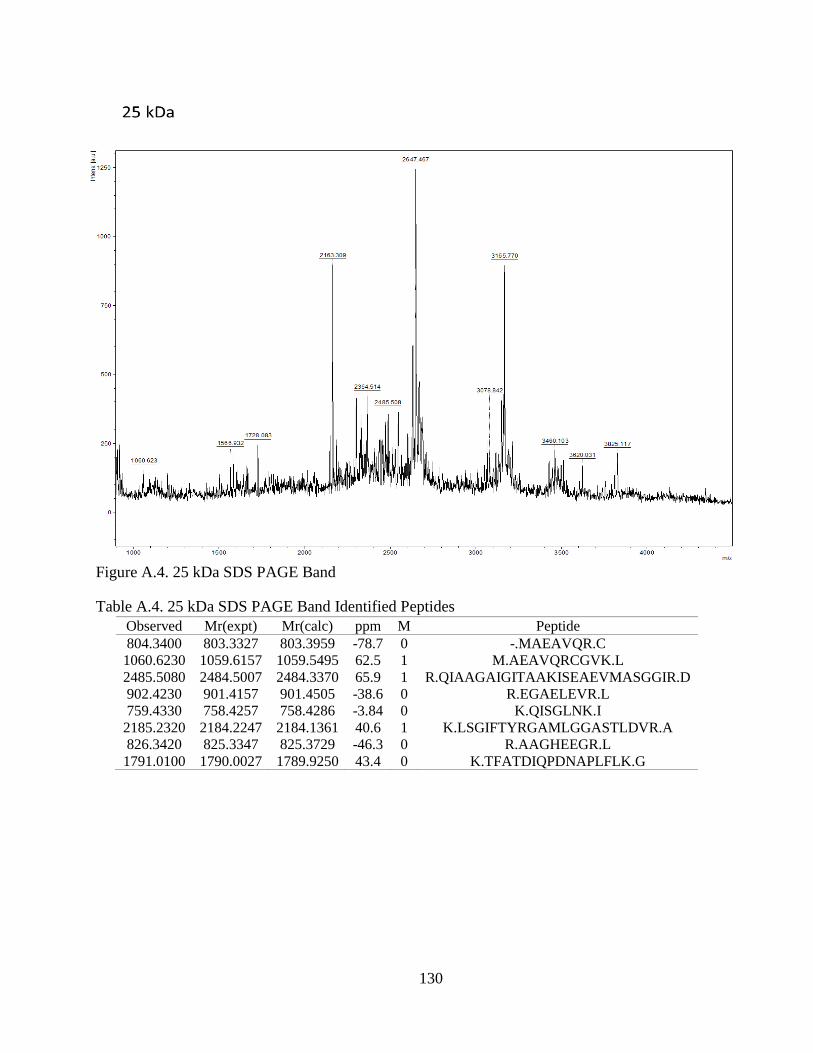
130
Figure A.4. 25 kDa SDS PAGE Band
Table A.4. 25 kDa SDS PAGE Band Identified Peptides
Observed Mr(expt) Mr(calc) ppm M Peptide
804.3400 803.3327 803.3959 -78.7 0 -.MAEAVQR.C
1060.6230 1059.6157 1059.5495 62.5 1 M.AEAVQRCGVK.L
2485.5080 2484.5007 2484.3370 65.9 1 R.QIAAGAIGITAAKISEAEVMASGGIR.D
902.4230 901.4157 901.4505 -38.6 0 R.EGAELEVR.L
759.4330 758.4257 758.4286 -3.84 0 K.QISGLNK.I
2185.2320 2184.2247 2184.1361 40.6 1 K.LSGIFTYRGAMLGGASTLDVR.A
826.3420 825.3347 825.3729 -46.3 0 R.AAGHEEGR.L
1791.0100 1790.0027 1789.9250 43.4 0 K.TFATDIQPDNAPLFLK.G
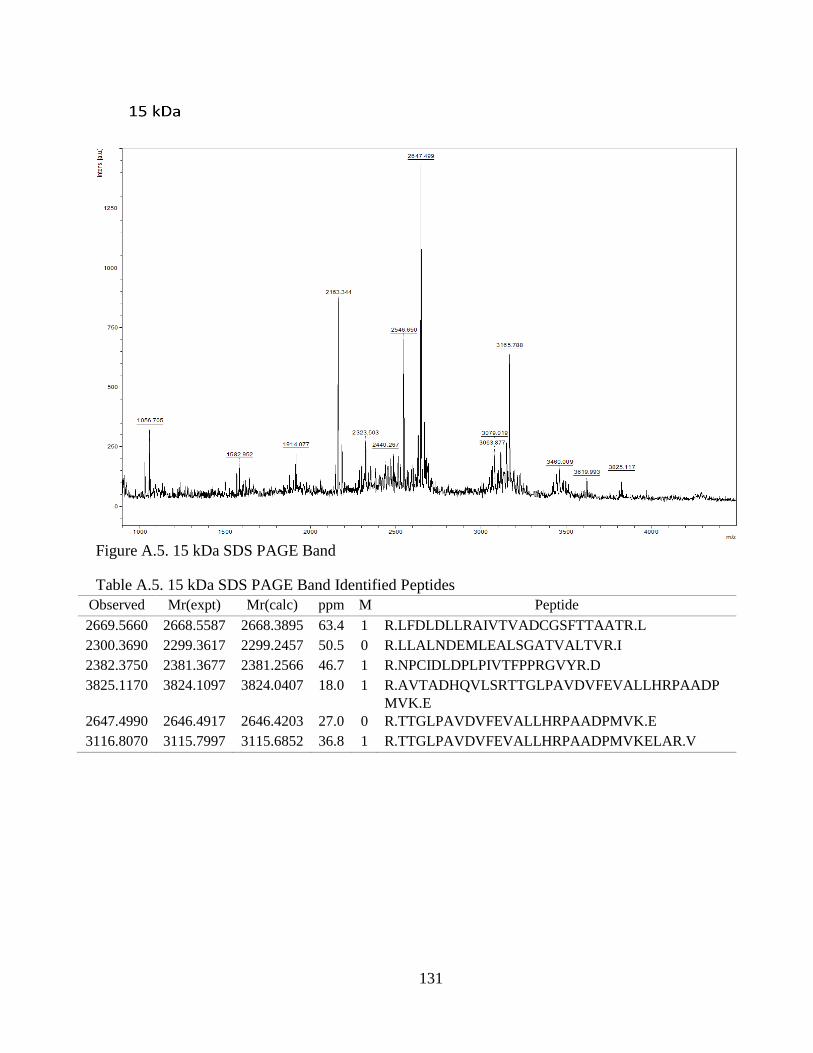
131
Figure A.5. 15 kDa SDS PAGE Band
Table A.5. 15 kDa SDS PAGE Band Identified Peptides
Observed Mr(expt) Mr(calc) ppm M Peptide
2669.5660 2668.5587 2668.3895 63.4 1 R.LFDLDLLRAIVTVADCGSFTTAATR.L
2300.3690 2299.3617 2299.2457 50.5 0 R.LLALNDEMLEALSGATVALTVR.I
2382.3750 2381.3677 2381.2566 46.7 1 R.NPCIDLDPLPIVTFPPRGVYR.D
3825.1170 3824.1097 3824.0407 18.0 1 R.AVTADHQVLSRTTGLPAVDVFEVALLHRPAADP
MVK.E
2647.4990 2646.4917 2646.4203 27.0 0 R.TTGLPAVDVFEVALLHRPAADPMVK.E
3116.8070 3115.7997 3115.6852 36.8 1 R.TTGLPAVDVFEVALLHRPAADPMVKELAR.V
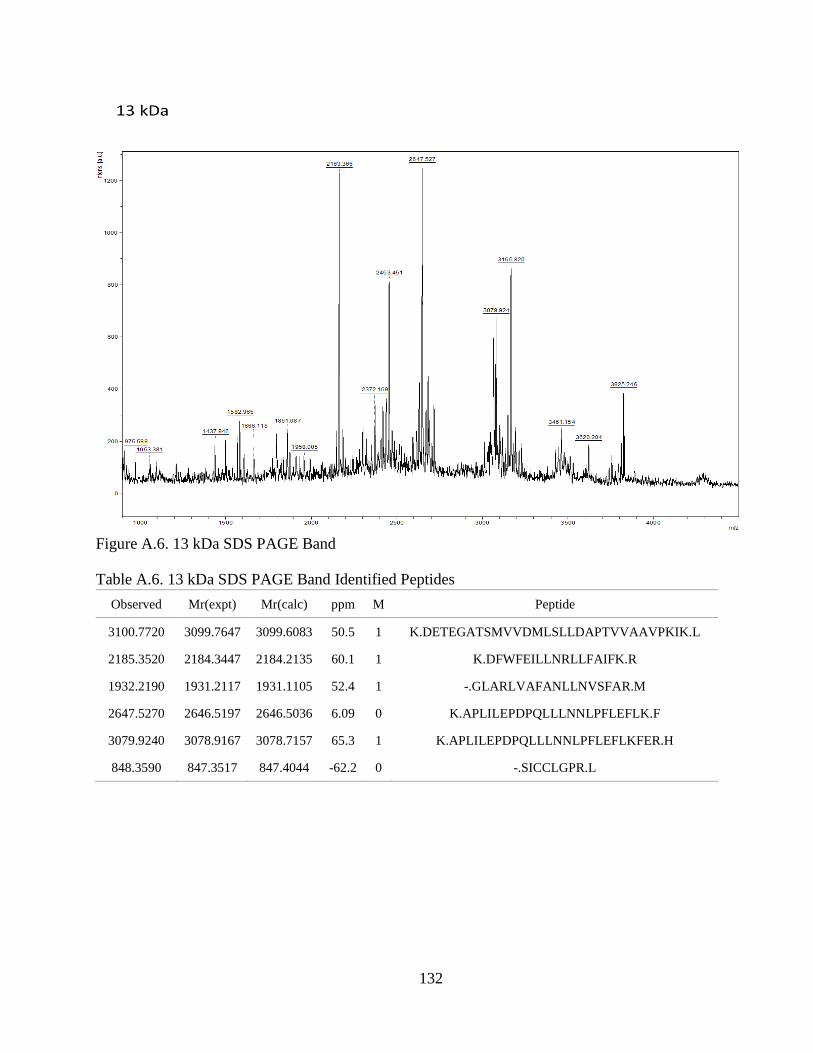
132
Figure A.6. 13 kDa SDS PAGE Band
Table A.6. 13 kDa SDS PAGE Band Identified Peptides
Observed Mr(expt) Mr(calc) ppm M Peptide
3100.7720 3099.7647 3099.6083 50.5 1 K.DETEGATSMVVDMLSLLDAPTVVAAVPKIK.L
2185.3520 2184.3447 2184.2135 60.1 1 K.DFWFEILLNRLLFAIFK.R
1932.2190 1931.2117 1931.1105 52.4 1 -.GLARLVAFANLLNVSFAR.M
2647.5270 2646.5197 2646.5036 6.09 0 K.APLILEPDPQLLLNNLPFLEFLK.F
3079.9240 3078.9167 3078.7157 65.3 1 K.APLILEPDPQLLLNNLPFLEFLKFER.H
848.3590 847.3517 847.4044 -62.2 0 -.SICCLGPR.L
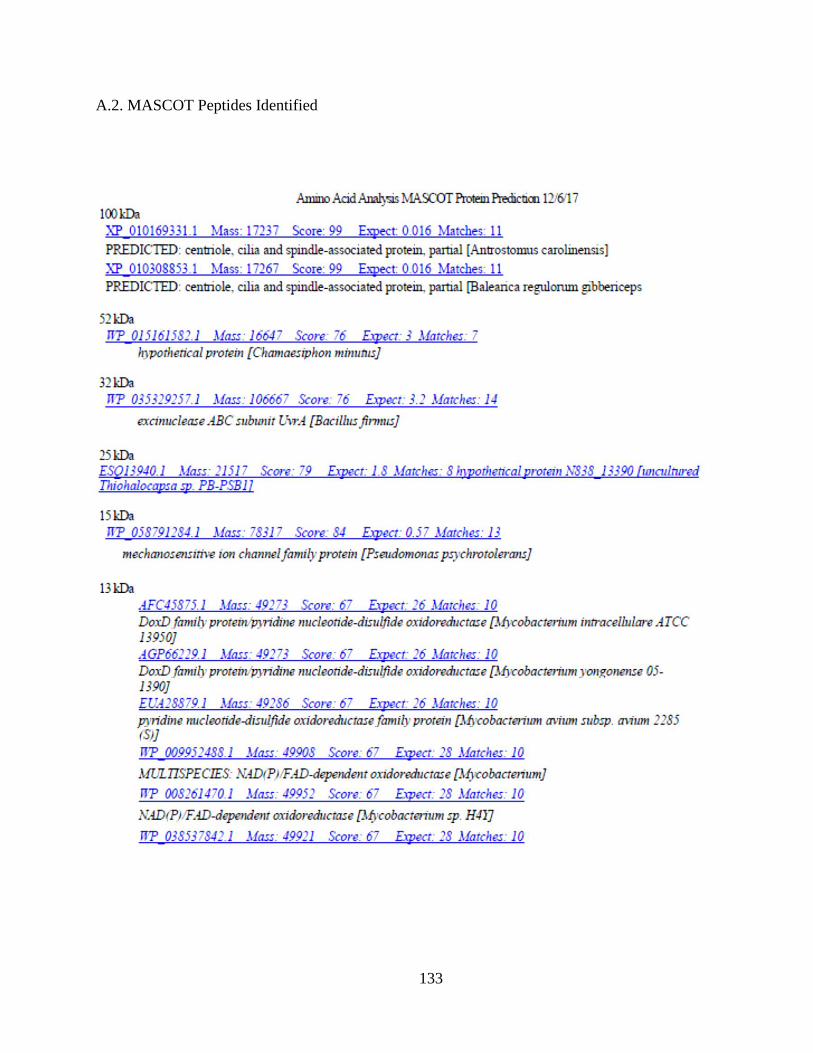
133
A.2. MASCOT Peptides Identified
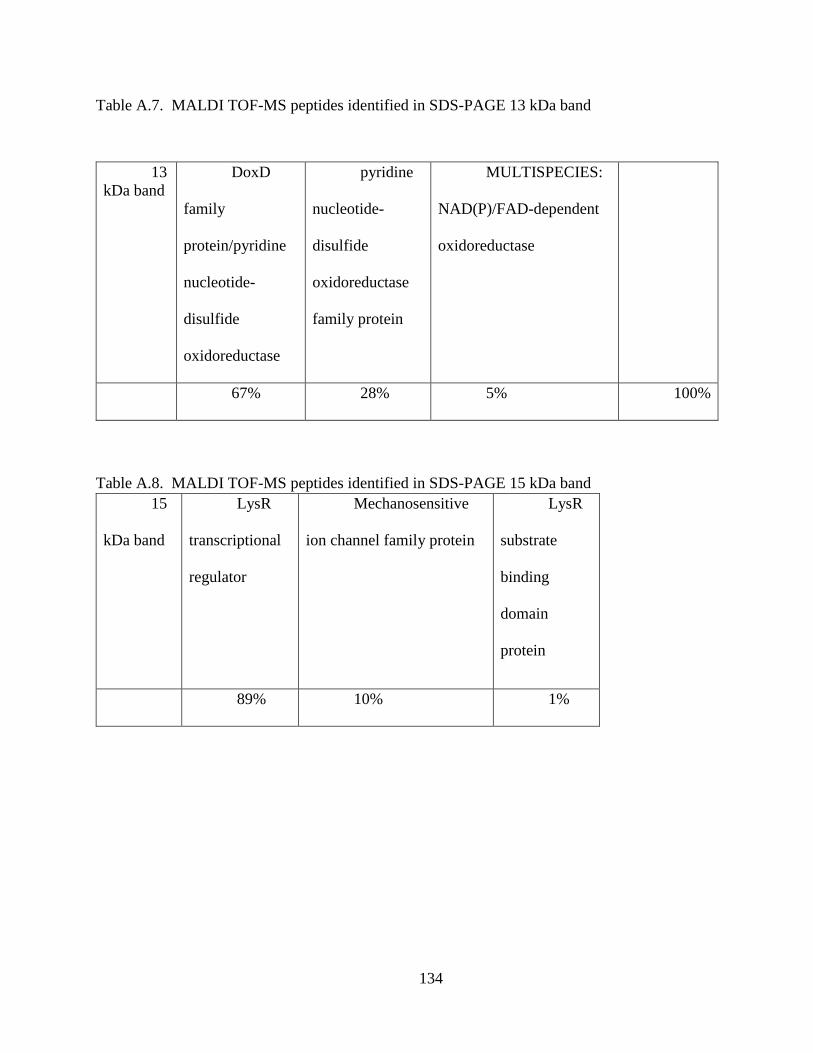
134
Table A.7. MALDI TOF-MS peptides identified in SDS-PAGE 13 kDa band
13
kDa band
DoxD
family
protein/pyridine
nucleotide-
disulfide
oxidoreductase
pyridine
nucleotide-
disulfide
oxidoreductase
family protein
MULTISPECIES:
NAD(P)/FAD-dependent
oxidoreductase
67% 28% 5% 100%
Table A.8. MALDI TOF-MS peptides identified in SDS-PAGE 15 kDa band
15
kDa band
LysR
transcriptional
regulator
Mechanosensitive
ion channel family protein
LysR
substrate
binding
domain
protein
89% 10% 1%

135
Table A.9. MALDI TOF-MS peptides identified in SDS-PAGE 15 kDa band
Table A.8. MALDI TOF-MS peptides identified in SDS-PAGE 32 kDa band
32 kDa band
ATP-
depende
nt Clp
protease
ATP-
binding
subunit
ClpX
Amino
acid
aldolase
Unchara
cterized
protein
Tryptop
han
synthase
alpha
chain
(EC
4.2.1.20)
His
Kinase
A
(Phosph
o-
acceptor
) domain-
containin
g protein
EC
3.6.1.1
Membra
ne-
bound
sodium-
transloca
ting
pyropho
sphatase
D-serine
deamina
se-like
pyridoxa
l
phosphat
e-
depende
nt
protein
2Fe-2S
ferredox
in
Low-
specificit
y D-
threonin
e
aldolase Catalytic
Ferredo
xin-
NADP
reductas
e
Acetate--
CoA
ligase
Ferredo
xin 1
62% 9% 7% 2% 2% 2% 2% 2% 2% 2% 6% 1% 1%
25 kDa band
Unchara
cterized
protein
ATP-
depende
nt Clp
protease
ATP-
binding
subunit
ClpX
Glutamin
e
syntheta
se
Methyl-
acceptin
g
chemota
xis
sensory
transduc
er
Acetyltr
ansferas
e
UvrABC
system
protein
C
(Protein
UvrC)
(Excinuc
lease
ABC
subunit
C)
2-
dehydro-
3-
deoxyglu
conokina
se
Amino
acid
aldolase
GTPase
Era
Oxidore
ductase
RNA-
binding
transcrip
tional
accessor
y protein
Tex-like
protein
N-
terminal
domain
protein
Type I-C
CRISPR-
associat
ed
protein
Cas8c/C
sd1
Alpha/be
ta
hydrolas
e
Cell
division
protein
Histidin
e kinase
N-
ethylam
meline
chlorohy
drolase
29% 28% 6% 5% 5% 5% 3% 3% 3% 3% 2% 2% 2% 1% 1% 1% 1%

136
Table A.10. MALDI TOF-MS peptides identified in SDS-PAGE 52 kDa band
52 kDa
band
Chaperone
protein
DnaK
(HSP70)
(Heat
shock 70
kDa
protein)
DnaK
(Fragment)
Heat shock
protein 70
mitochondrial
putative
Uncharacterized
protein
80% 12% 7% 1%
Table A.11. MALDI TOF-MS peptides identified in SDS-PAGE 100 kDa band
100 kDa band
centriole, cilia and spindle-associated protein,
partial
hypothetical protein
H355_011766
99% 1%
137
Vita
Chelsea Tyus is an only child from St. Louis, MO. She graduated high school from
Lutheran High School North in St. Louis, MO in 2005. She received a Bachelor of Science from
Alabama A&M University in Food Science and Technology in 2009. In 2014, Chelsea received a
Master of Science from University of Missouri in Food Science with emphasis in Food
Chemistry. Chelsea worked as a pharmacy technician, executive assistant, quality assurance
technician, regulatory affairs specialist, teaching/research assistant while in school. In 2019,
Chelsea graduated from Louisiana State University with a Doctorate in Food Science. She
specializes in macronutrient extraction, macronutrient characterization and chromatography. She
has researched grape pomace, sweet potato, microalgae, rice flour, and sorghum flour. Chelsea
has presented poster’s at IFT National Conference (2018, 2019), ABO Summit (2018, 2019), and
AOCS National Conference (2019). Chelsea is working on several publications for the Journal of
Algae Research and the Journal of Food Science. Chelsea’s personal goal is to help the public
understand and, as a result, consume healthy and safe food. Chelsea is endeavoring to obtain an
instructor position at a university or scientist position in a food/chemical company. Chelsea
enjoys traveling, reading yoga in her spare time.