Embed Size (px)
Citation preview
Metabolism
Do We Have Enough Energy?
• Nutrients and regulation of appetite
• Carbohydrate metabolism
• Lipid and protein metabolism
• Metabolic states
Nutritious and Delicious• Nutrient
– An ingested chemical that is used for growth, repair, and maintenance of the body
– Two categories• Macronutrients
– Must consume in large quantities– Water, carbohydrates, lipids , and proteins
• Micronutrients– Small quantities needed– Minerals and vitamins
• Calories– Kcal– Measure of the capacity to do work
Regulation of Appetite• Short-term regulators
– Ghrelin – produces sensation of hunger– Peptide YY (PYY) – sensation of satisfaction– CCK – sensory stimulus of vagus nerve (suppressor)
• Long-term regulators (adiposity signals)– Leptin– Insulin
• Arcuate nucleus of hypothalamus– NPY - stimulator– Melanocortin - suppressor
Carbohydrate Metabolism• dietary carbohydrate burned as fuel within
hours of absorption• all oxidative carbohydrate consumption is
essentially a matter of glucose catabolism
C6H12O6 + 6O2 6CO2 + 6H2O
• function of this reaction is to transfers energy from glucose to ATP– not to produce carbon dioxide and water
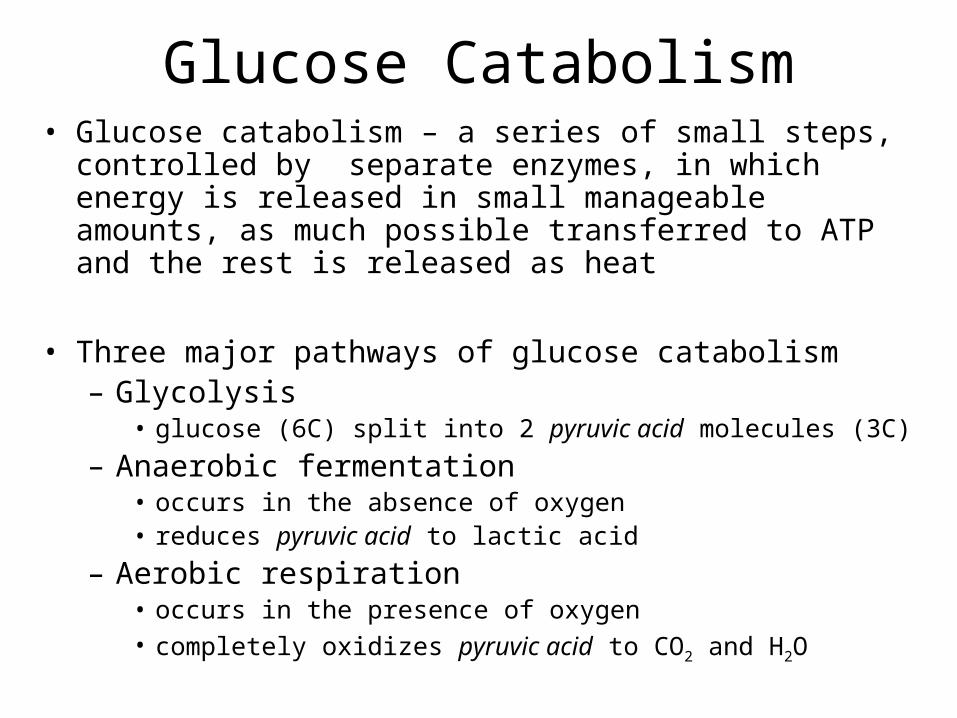
Glucose Catabolism• Glucose catabolism – a series of small steps, controlled by
separate enzymes, in which energy is released in small manageable amounts, as much possible transferred to ATP and the rest is released as heat
• Three major pathways of glucose catabolism– Glycolysis
• glucose (6C) split into 2 pyruvic acid molecules (3C)– Anaerobic fermentation
• occurs in the absence of oxygen• reduces pyruvic acid to lactic acid
– Aerobic respiration• occurs in the presence of oxygen• completely oxidizes pyruvic acid to CO2 and H2O
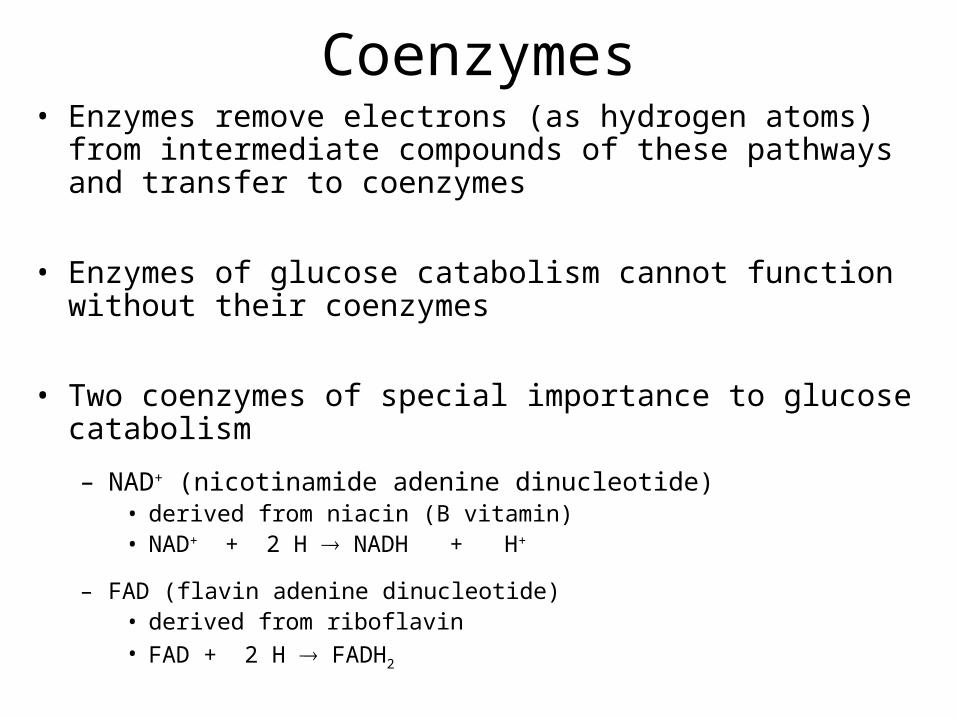
Coenzymes• Enzymes remove electrons (as hydrogen atoms) from
intermediate compounds of these pathways and transfer to coenzymes
• Enzymes of glucose catabolism cannot function without their coenzymes
• Two coenzymes of special importance to glucose catabolism
– NAD+ (nicotinamide adenine dinucleotide)• derived from niacin (B vitamin)• NAD+ + 2 H NADH + H+
– FAD (flavin adenine dinucleotide)• derived from riboflavin• FAD + 2 H FADH2
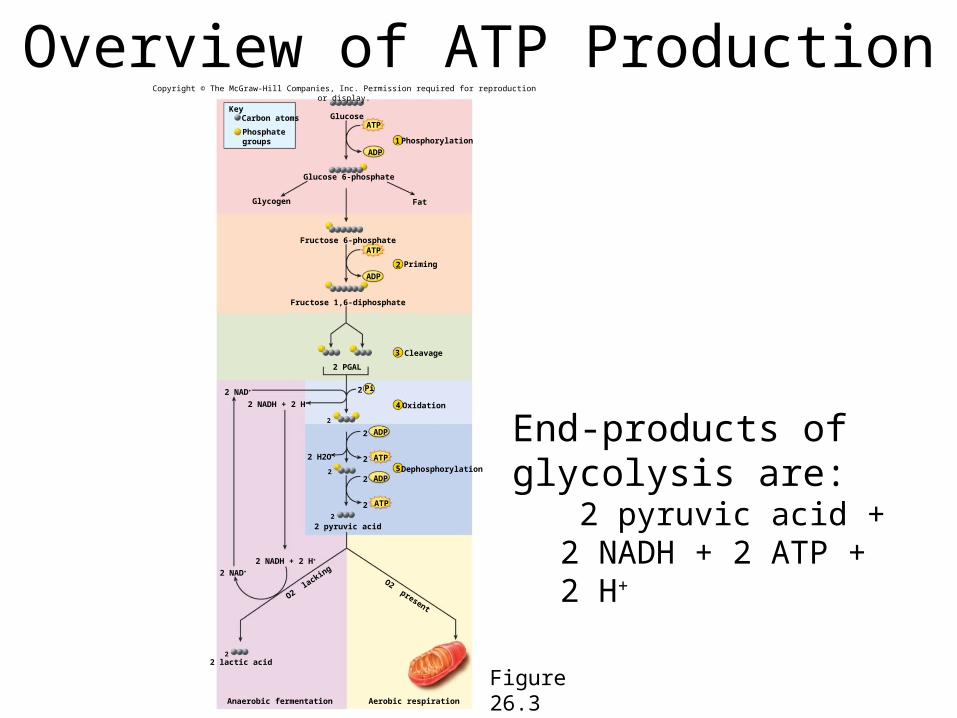
Overview of ATP Production
Figure 26.3
Glucose
Glucose 6-phosphate
Glycogen Fat
Fructose 6-phosphate
Fructose 1,6-diphosphate
2 PGAL
22 NAD+
2 NADH + 2 H+
2
2 H2O
2
2
2 pyruvic acid
2 NADH + 2 H+
2 NAD+
O2 lacking
O2 present
22 lactic acid
2
2
Aerobic respirationAnaerobic fermentation
5 Dephosphorylation
1 Phosphorylation
2 Priming
3 Cleavage
4 Oxidation
Pi
ATP
ATP
ATP
2 ATP
ADP
ADP
ADP
2 ADP
KeyCarbon atoms
Phosphategroups
Copyright © The McGraw-Hill Companies, Inc. Permission required for reproduction or display.
End-products of glycolysis are:
2 pyruvic acid + 2 NADH + 2 ATP + 2 H+
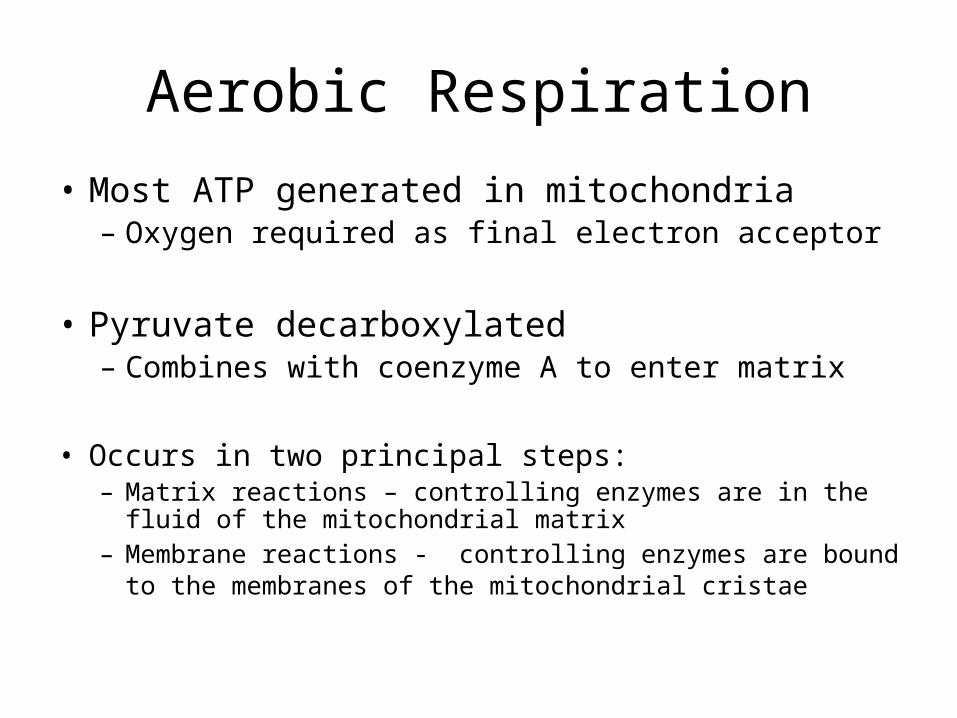
Aerobic Respiration
• Most ATP generated in mitochondria– Oxygen required as final electron acceptor
• Pyruvate decarboxylated– Combines with coenzyme A to enter matrix
• Occurs in two principal steps:– Matrix reactions – controlling enzymes are in the fluid of the
mitochondrial matrix– Membrane reactions - controlling enzymes are bound to the
membranes of the mitochondrial cristae
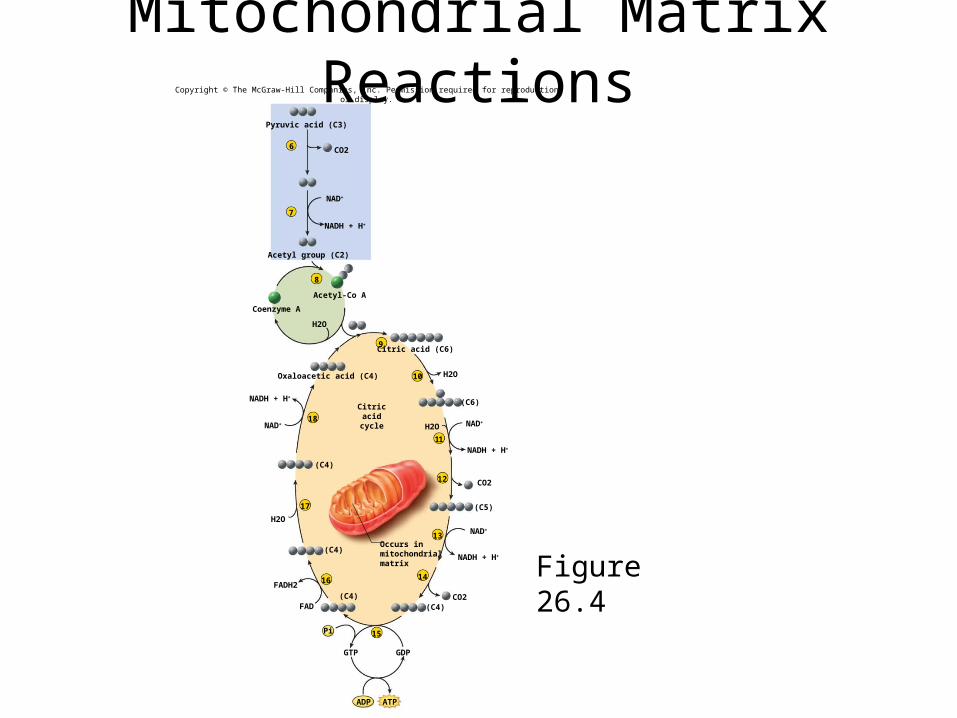
Mitochondrial Matrix Reactions
Figure 26.4
10
7
6
Pyruvic acid (C3)
CO2
NAD+
NADH + H+
Acetyl group (C2)
Acetyl-Co A
Coenzyme A
H2O
Citric acid (C6)
Oxaloacetic acid (C4) H2O
(C6)
CO2
FAD
FADH2
H2O
NADH + H+
NAD+
11
14
15
17
18
GTP GDP
12
13
16
Occurs inmitochondrialmatrix
ADP
9
8
Pi
Citricacidcycle H2O NAD+
NADH + H+
(C4)
(C5)
NAD+
NADH + H+
CO2(C4)
(C4)
(C4)
Copyright © The McGraw-Hill Companies, Inc. Permission required for reproduction or display.
ATP
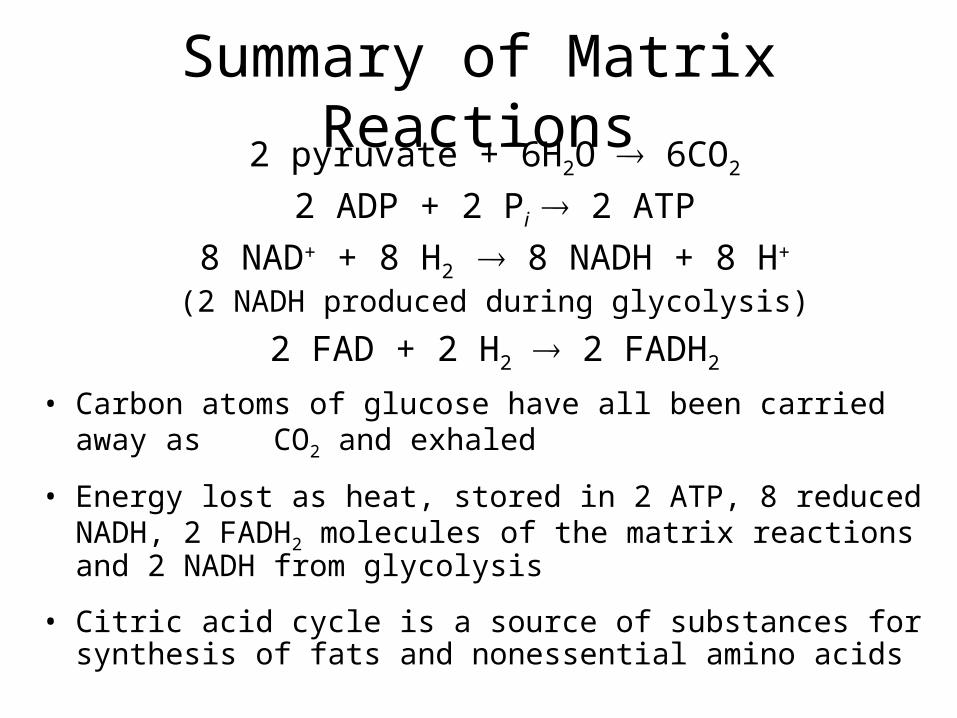
Summary of Matrix Reactions2 pyruvate + 6H2O 6CO2
2 ADP + 2 Pi 2 ATP8 NAD+ + 8 H2
8 NADH + 8 H+
(2 NADH produced during glycolysis)
2 FAD + 2 H2 2 FADH2
• Carbon atoms of glucose have all been carried away as CO2 and exhaled
• Energy lost as heat, stored in 2 ATP, 8 reduced NADH, 2 FADH2 molecules of the matrix reactions and 2 NADH from glycolysis
• Citric acid cycle is a source of substances for synthesis of fats and nonessential amino acids
Membrane Reactions• Membrane reactions have two purposes:
– to further oxidize NADH and FADH2 and transfer their energy to ATP
– to regenerate NAD+ and FAD and make them available again to earlier reaction steps
• Mitochondrial electron-transport chain – series of compounds that carry out this series of membrane reactions
Members of the Transport Chain• Flavin mononucleotide (FMN) – derivative of riboflavin similar
to FAD– bound to a membrane protein FMN accepts electrons from NADH
• Iron-sulfur (Fe-S) centers – complexes of iron and sulfur atoms bound to membrane proteins
• Coenzyme Q (CoQ) – accepts electrons from FADH2
– small mobile molecule that moves about in the membrane
• Copper (Cu) ions – bound to two membrane proteins
• Cytochromes – five enzymes with iron cofactors– brightly colored in pure form– in order of participation in the chain, b, c1, c, a, a3
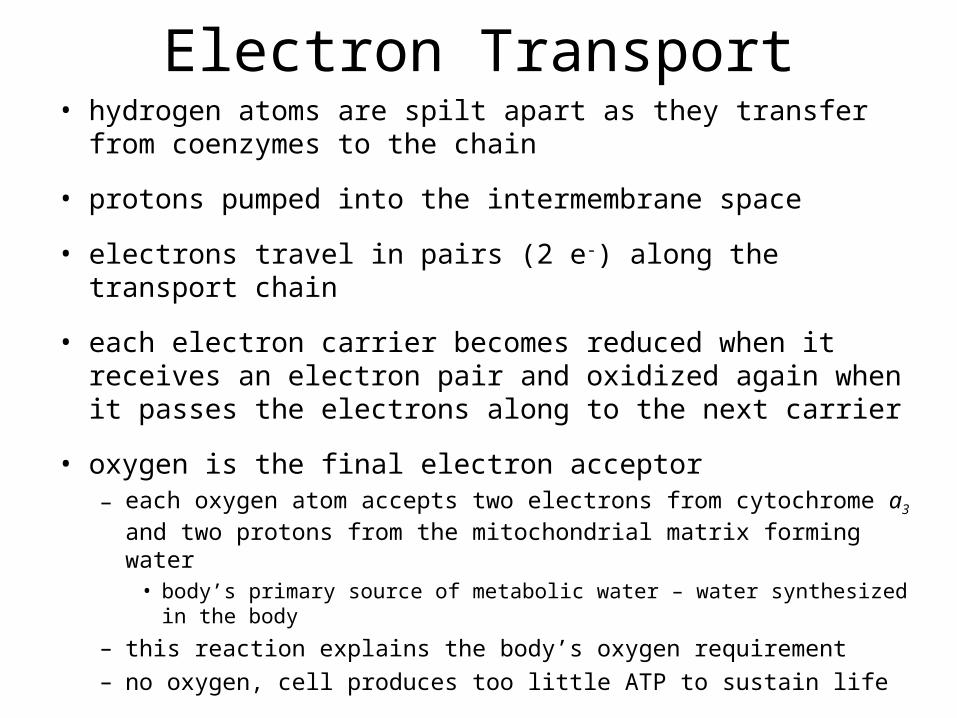
Electron Transport• hydrogen atoms are spilt apart as they transfer from
coenzymes to the chain
• protons pumped into the intermembrane space
• electrons travel in pairs (2 e-) along the transport chain
• each electron carrier becomes reduced when it receives an electron pair and oxidized again when it passes the electrons along to the next carrier
• oxygen is the final electron acceptor– each oxygen atom accepts two electrons from cytochrome a3 and two
protons from the mitochondrial matrix forming water• body’s primary source of metabolic water – water synthesized in the body
– this reaction explains the body’s oxygen requirement– no oxygen, cell produces too little ATP to sustain life
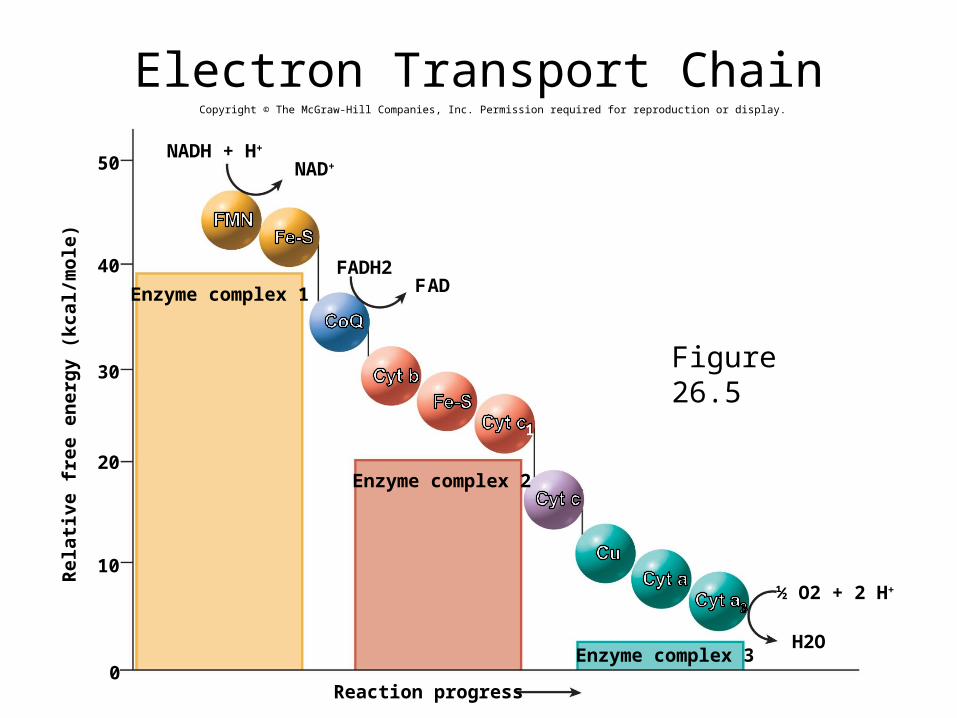
50
40
30
20
10
Enzyme complex 1
Rela
tive
free
ene
rgy
(kca
l/m
ole)
0
NADH + H+
NAD+
FADH2F AD
Enzyme complex 2
Reaction progress
Enzyme complex 3
½ O2 + 2 H+
H2O
1
Copyright © The McGraw-Hill Companies, Inc. Permission required for reproduction or display.
Electron Transport Chain
Figure 26.5
Chemiosmotic Mechanism• electron transport chain energy fuels respiratory
enzyme complexes – pump protons from matrix into space between inner and
outer mitochondrial membranes– creates steep electrochemical gradient for H+ across inner
mitochondrial membrane
• inner membrane is permeable to H+ at channel proteins called ATP synthase
• chemiosmotic mechanism - H+ current rushing back through these ATP synthase channels drives ATP synthesis
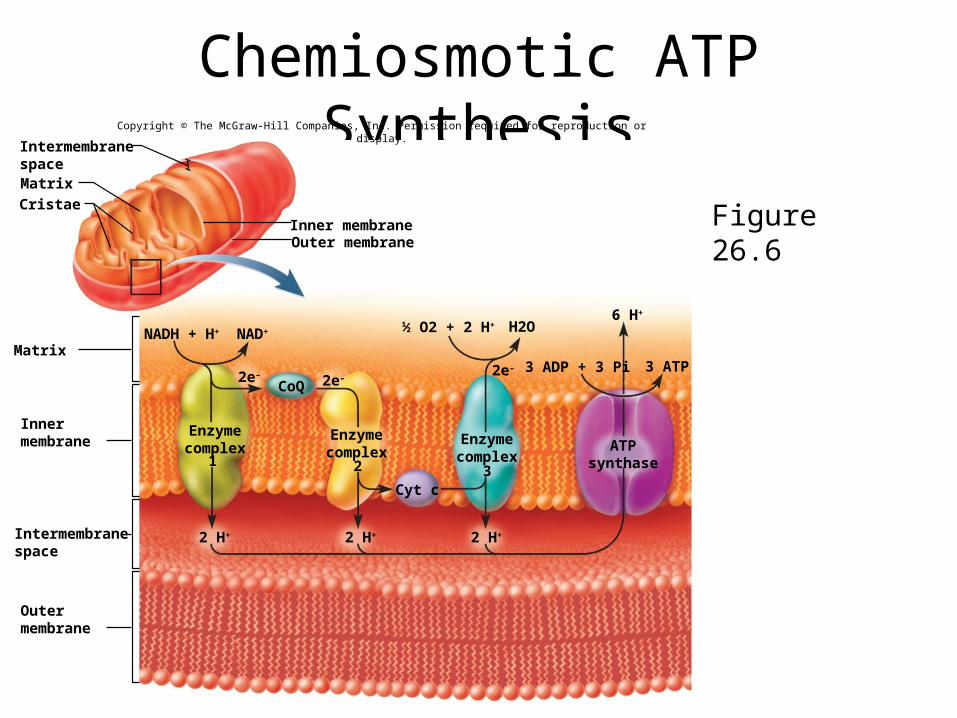
Chemiosmotic ATP Synthesis
Figure 26.6
Matrix
Inner membrane
NADH + H+ NAD+
2 H+
H2O
3 ADP + 3 Pi
6 H+
2e–
2e–2e–
MatrixCristae
Outer membrane
CoQ
Cyt c
ATPsynthase2 3
Enzymecomplex
1
Intermembranespace
Innermembrane
Intermembranespace
Outermembrane
2 H+ 2 H+
Enzymecomplex
Enzymecomplex
½ O2 + 2 H+
Copyright © The McGraw-Hill Companies, Inc. Permission required for reproduction or display.
3 ATP
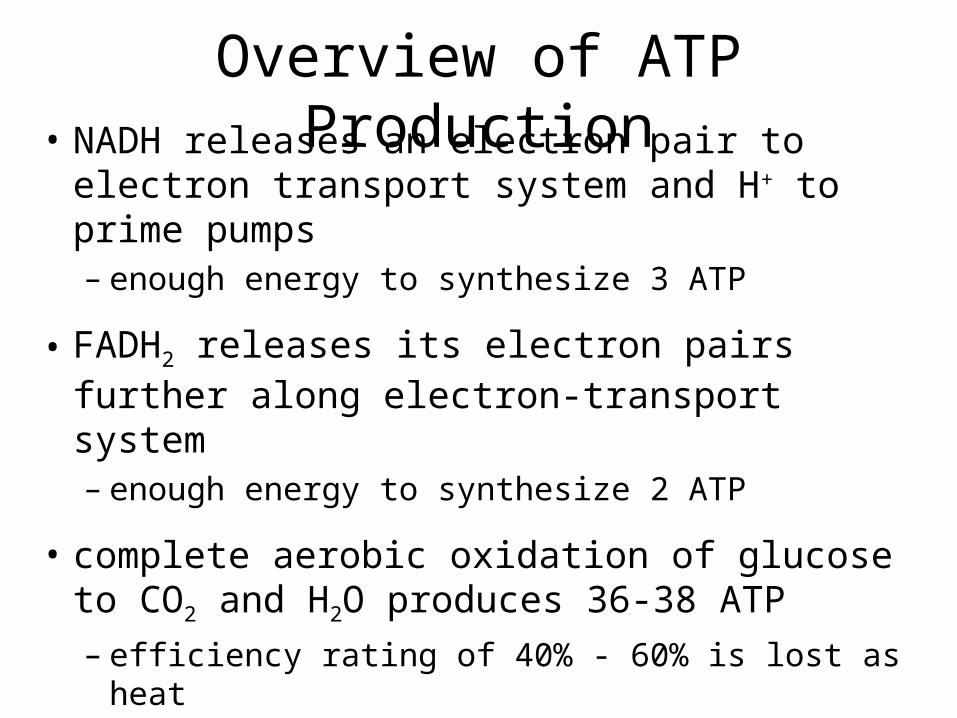
Overview of ATP Production• NADH releases an electron pair to electron
transport system and H+ to prime pumps– enough energy to synthesize 3 ATP
• FADH2 releases its electron pairs further along electron-transport system – enough energy to synthesize 2 ATP
• complete aerobic oxidation of glucose to CO2 and H2O produces 36-38 ATP– efficiency rating of 40% - 60% is lost as heat
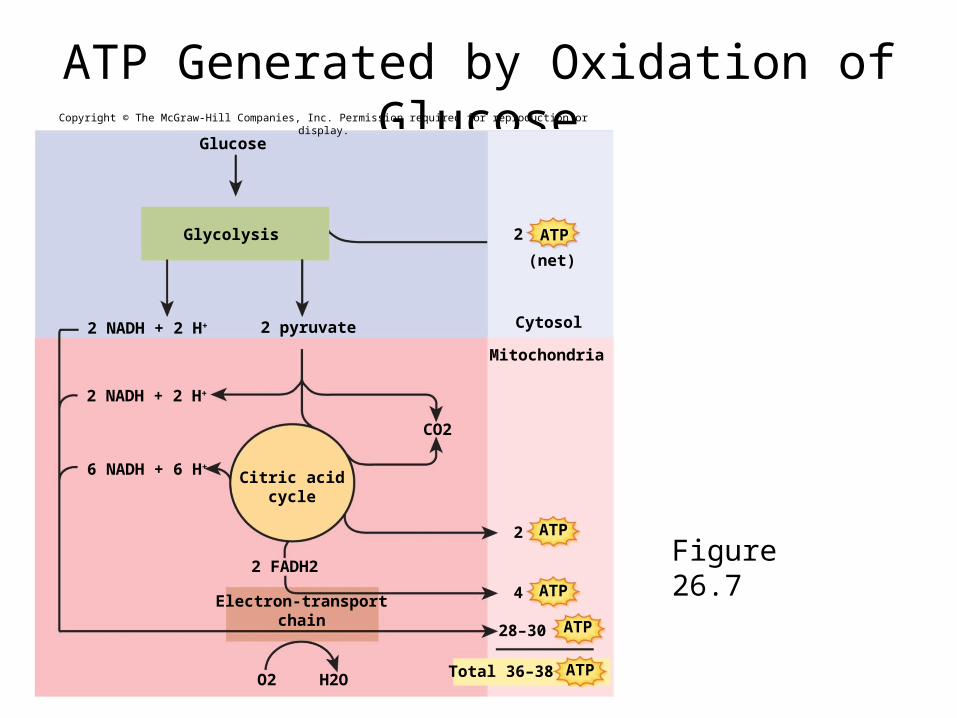
ATP Generated by Oxidation of Glucose
Figure 26.7
2 NADH + 2 H+ 2 pyruvate Cytosol
Mitochondria
Glucose
2 NADH + 2 H+
6 NADH + 6 H+Citric acid
cycle
2 FADH2
Electron-transportchain
H2OO2
Glycolysis
Total 36–38
ATP2
ATP2
4
(net)
28–30
CO2
Copyright © The McGraw-Hill Companies, Inc. Permission required for reproduction or display.
ATP
ATP
ATP
26-20
Glycogen Metabolism• ATP is quickly used after it is formed
– it is an energy transfer molecule, not an energy storage molecule– converts the extra glucose to other compounds better suited for energy
storage (glycogen and fat)
• glycogenesis - synthesis of glycogen– stimulated by insulin– chains glucose monomers together
• glycogenolysis – hydrolysis of glycogen– releases glucose between meals– stimulated by glucagon and epinephrine– only liver cells can release glucose back into blood
• gluconeogenesis - synthesis of glucose from noncarbohydrates, such as glycerol and amino acids– occurs chiefly in the liver and later, kidneys if necessary
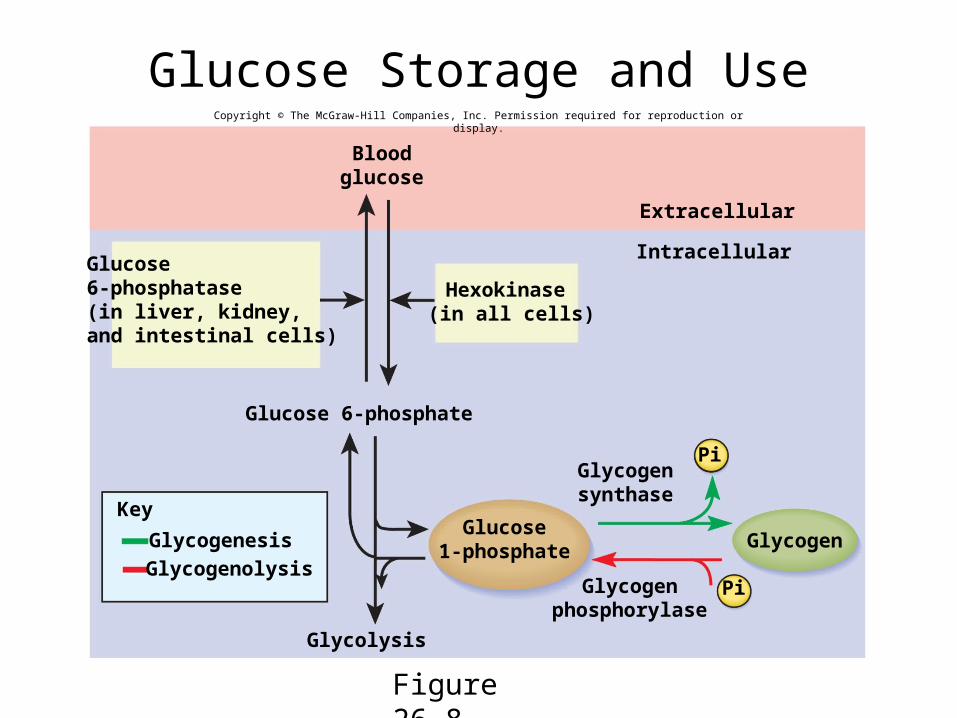
Glucose Storage and Use
Figure 26.8
Extracellular
Intracellular
Glucose 6-phosphate
Glycolysis
Key
GlycogenesisGlycogenolysis
Glycogensynthase
Glycogenphosphorylase
Pi
Glycogen
Glucose6-phosphatase(in liver, kidney,and intestinal cells)
Bloodglucose
Hexokinase (in all cells)
Glucose1-phosphate
Pi
Copyright © The McGraw-Hill Companies, Inc. Permission required for reproduction or display.
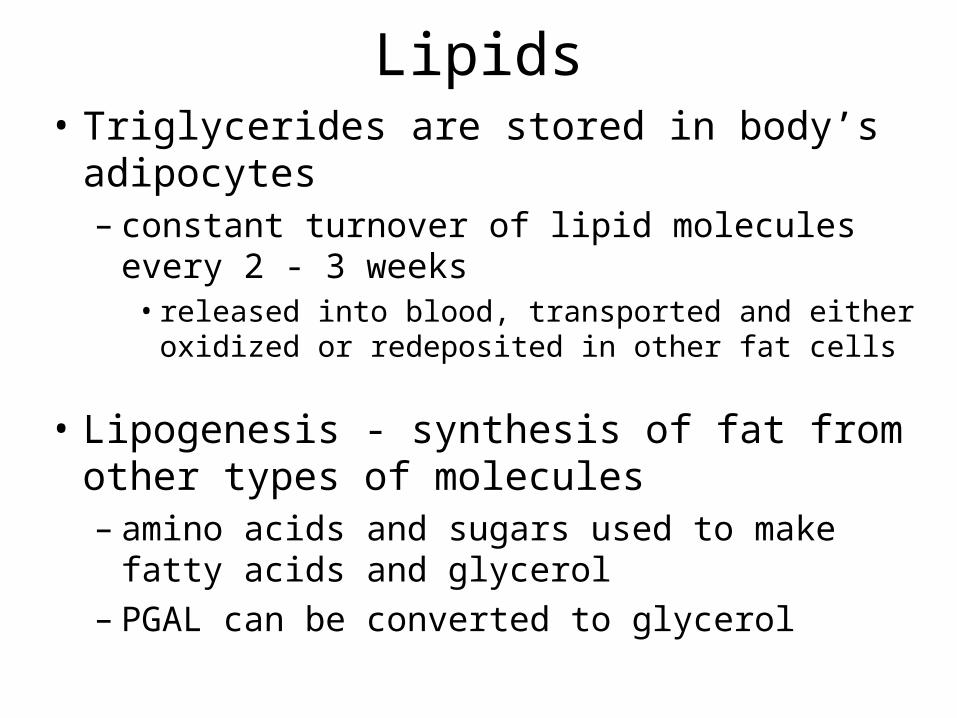
Lipids• Triglycerides are stored in body’s adipocytes
– constant turnover of lipid molecules every 2 - 3 weeks
• released into blood, transported and either oxidized or redeposited in other fat cells
• Lipogenesis - synthesis of fat from other types of molecules– amino acids and sugars used to make fatty acids and
glycerol– PGAL can be converted to glycerol
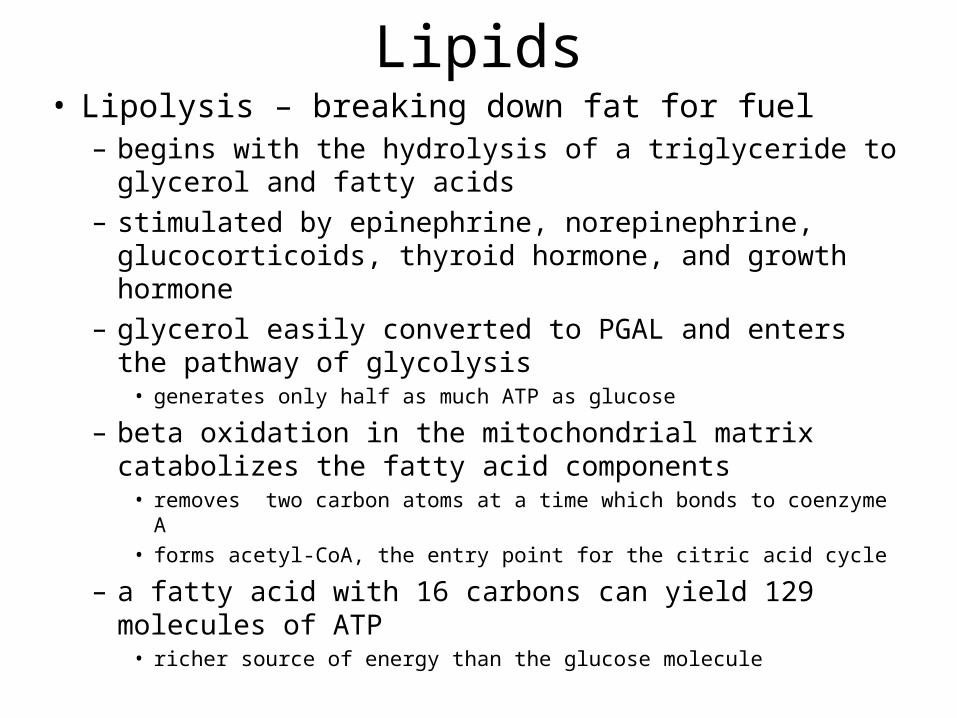
Lipids• Lipolysis – breaking down fat for fuel
– begins with the hydrolysis of a triglyceride to glycerol and fatty acids
– stimulated by epinephrine, norepinephrine, glucocorticoids, thyroid hormone, and growth hormone
– glycerol easily converted to PGAL and enters the pathway of glycolysis
• generates only half as much ATP as glucose
– beta oxidation in the mitochondrial matrix catabolizes the fatty acid components
• removes two carbon atoms at a time which bonds to coenzyme A• forms acetyl-CoA, the entry point for the citric acid cycle
– a fatty acid with 16 carbons can yield 129 molecules of ATP• richer source of energy than the glucose molecule
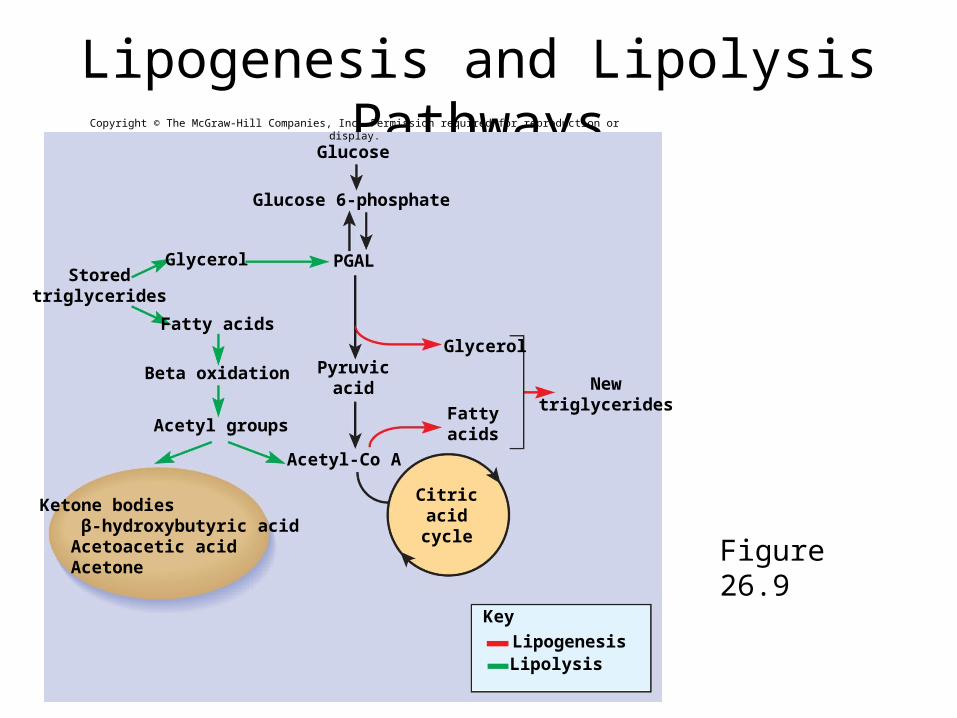
Lipogenesis and Lipolysis Pathways
Figure 26.9
Glucose
PGAL
Glucose 6-phosphate
KeyLipogenesisLipolysis
Glycerol
Fatty acidsGlycerol
Beta oxidation
Acetyl-Co A
Storedtriglycerides
Ketone bodies β-hydroxybutyric acid Acetoacetic acid Acetone
Acetyl groups
Citricacidcycle
Pyruvicacid
Fattyacids
Newtriglycerides
Copyright © The McGraw-Hill Companies, Inc. Permission required for reproduction or display.
Proteins• amino acid pool - dietary amino acids plus 100 g of
tissue protein broken down each day into free amino acids
• may be used to synthesize new proteins– fastest rate of cell division is epithelial cells of intestinal
mucosa
• of all the amino acids absorbed by the small intestine:
– 50% comes from the diet– 25% from dead epithelial cells– 25% from enzymes that have digested each other
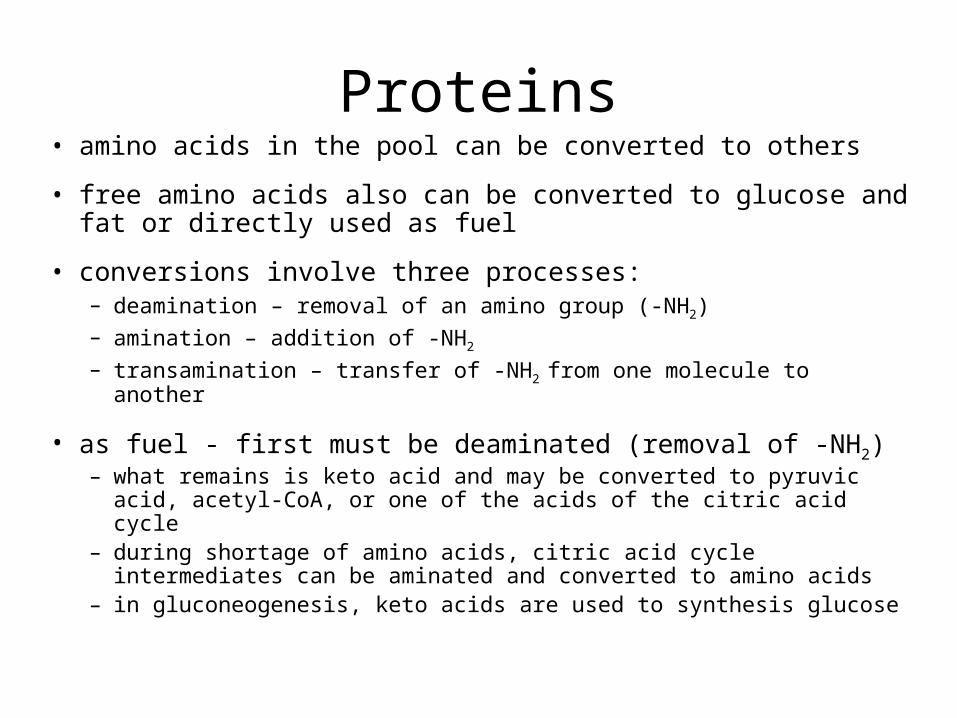
Proteins• amino acids in the pool can be converted to others
• free amino acids also can be converted to glucose and fat or directly used as fuel
• conversions involve three processes:– deamination – removal of an amino group (-NH2)– amination – addition of -NH2
– transamination – transfer of -NH2 from one molecule to another
• as fuel - first must be deaminated (removal of -NH2)– what remains is keto acid and may be converted to pyruvic acid, acetyl-
CoA, or one of the acids of the citric acid cycle– during shortage of amino acids, citric acid cycle intermediates can be
aminated and converted to amino acids– in gluconeogenesis, keto acids are used to synthesis glucose
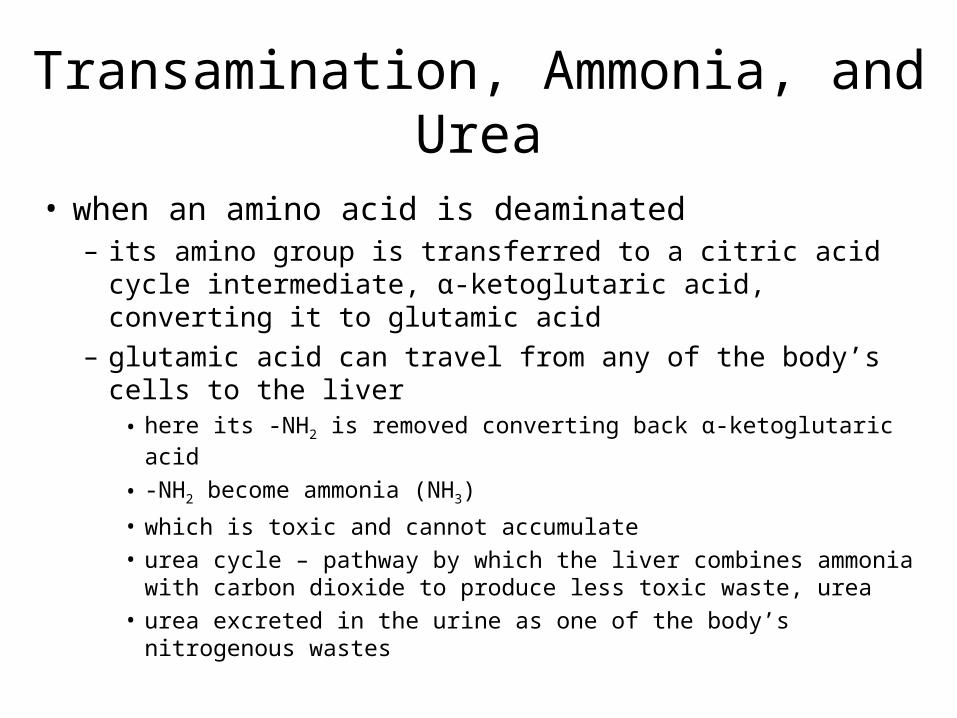
Transamination, Ammonia, and Urea
• when an amino acid is deaminated– its amino group is transferred to a citric acid cycle
intermediate, α-ketoglutaric acid, converting it to glutamic acid
– glutamic acid can travel from any of the body’s cells to the liver
• here its -NH2 is removed converting back α-ketoglutaric acid
• -NH2 become ammonia (NH3)
• which is toxic and cannot accumulate• urea cycle – pathway by which the liver combines ammonia with
carbon dioxide to produce less toxic waste, urea• urea excreted in the urine as one of the body’s nitrogenous wastes
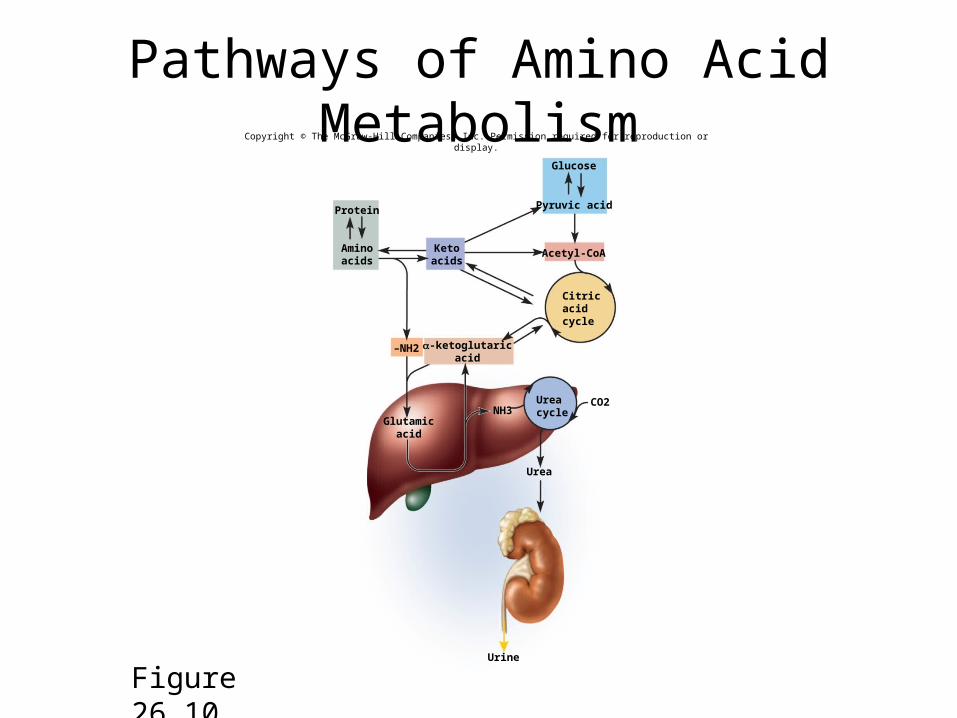
Pathways of Amino Acid Metabolism
Figure 26.10
Glucose
Pyruvic acid
Acetyl-CoA
NH3
Protein
Citricacidcycle
Glutamicacid
Urea
Urine
–NH2
CO2
-ketoglutaricacid
Aminoacids
Ketoacids
Copyright © The McGraw-Hill Companies, Inc. Permission required for reproduction or display.
Ureacycle
Liver Functions in Metabolism• wide variety of roles in carbohydrate, lipid, and
protein metabolism
• overwhelming majority of its functions are nondigestive
• hepatocytes perform all functions, except phagocytosis
• See table 26.6
Metabolic States
• Metabolic rate– Amount of energy liberated in the body per unit time
• Absorptive state– Nutrients are being absorbed and my be used
immediately to meet needs
• Postabsorptive state– Stomach and small intestines empty, energy needs
met from stored fuel