Embed Size (px)
Citation preview
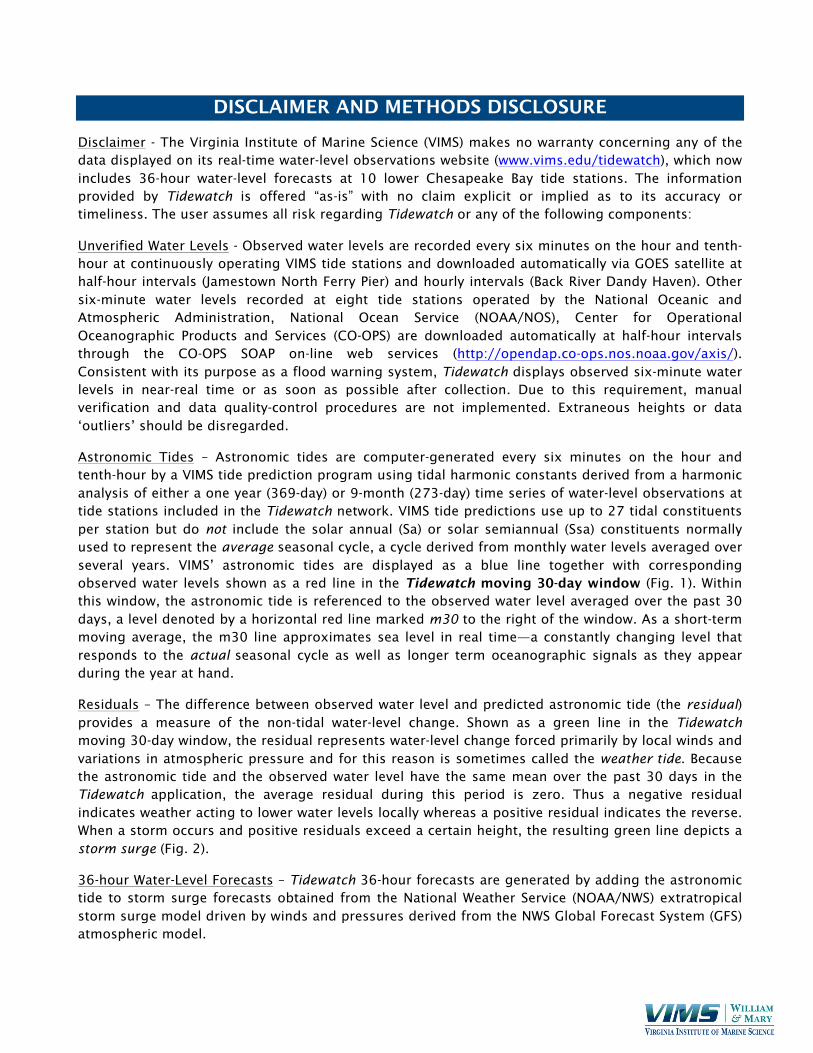
DISCLAIMER AND METHODS DISCLOSURE
Disclaimer - The Virginia Institute of Marine Science (VIMS) makes no warranty concerning any of the data displayed on its real-time water-level observations website (www.vims.edu/tidewatch), which now includes 36-hour water-level forecasts at 10 lower Chesapeake Bay tide stations. The information provided by Tidewatch is offered “as-is” with no claim explicit or implied as to its accuracy or timeliness. The user assumes all risk regarding Tidewatch or any of the following components:
Unverified Water Levels - Observed water levels are recorded every six minutes on the hour and tenth-hour at continuously operating VIMS tide stations and downloaded automatically via GOES satellite at half-hour intervals (Jamestown North Ferry Pier) and hourly intervals (Back River Dandy Haven). Other six-minute water levels recorded at eight tide stations operated by the National Oceanic and Atmospheric Administration, National Ocean Service (NOAA/NOS), Center for Operational Oceanographic Products and Services (CO-OPS) are downloaded automatically at half-hour intervals through the CO-OPS SOAP on-line web services (http://opendap.co-ops.nos.noaa.gov/axis/). Consistent with its purpose as a flood warning system, Tidewatch displays observed six-minute water levels in near-real time or as soon as possible after collection. Due to this requirement, manual verification and data quality-control procedures are not implemented. Extraneous heights or data ‘outliers’ should be disregarded.
Astronomic Tides – Astronomic tides are computer-generated every six minutes on the hour and tenth-hour by a VIMS tide prediction program using tidal harmonic constants derived from a harmonic analysis of either a one year (369-day) or 9-month (273-day) time series of water-level observations at tide stations included in the Tidewatch network. VIMS tide predictions use up to 27 tidal constituents per station but do not include the solar annual (Sa) or solar semiannual (Ssa) constituents normally used to represent the average seasonal cycle, a cycle derived from monthly water levels averaged over several years. VIMS’ astronomic tides are displayed as a blue line together with corresponding observed water levels shown as a red line in the Tidewatch moving 30-day window (Fig. 1). Within this window, the astronomic tide is referenced to the observed water level averaged over the past 30 days, a level denoted by a horizontal red line marked m30 to the right of the window. As a short-term moving average, the m30 line approximates sea level in real time—a constantly changing level that responds to the actual seasonal cycle as well as longer term oceanographic signals as they appear during the year at hand.
Residuals – The difference between observed water level and predicted astronomic tide (the residual) provides a measure of the non-tidal water-level change. Shown as a green line in the Tidewatch moving 30-day window, the residual represents water-level change forced primarily by local winds and variations in atmospheric pressure and for this reason is sometimes called the weather tide. Because the astronomic tide and the observed water level have the same mean over the past 30 days in the Tidewatch application, the average residual during this period is zero. Thus a negative residual indicates weather acting to lower water levels locally whereas a positive residual indicates the reverse. When a storm occurs and positive residuals exceed a certain height, the resulting green line depicts a storm surge (Fig. 2).
36-hour Water-Level Forecasts – Tidewatch 36-hour forecasts are generated by adding the astronomic tide to storm surge forecasts obtained from the National Weather Service (NOAA/NWS) extratropical storm surge model driven by winds and pressures derived from the NWS Global Forecast System (GFS) atmospheric model.
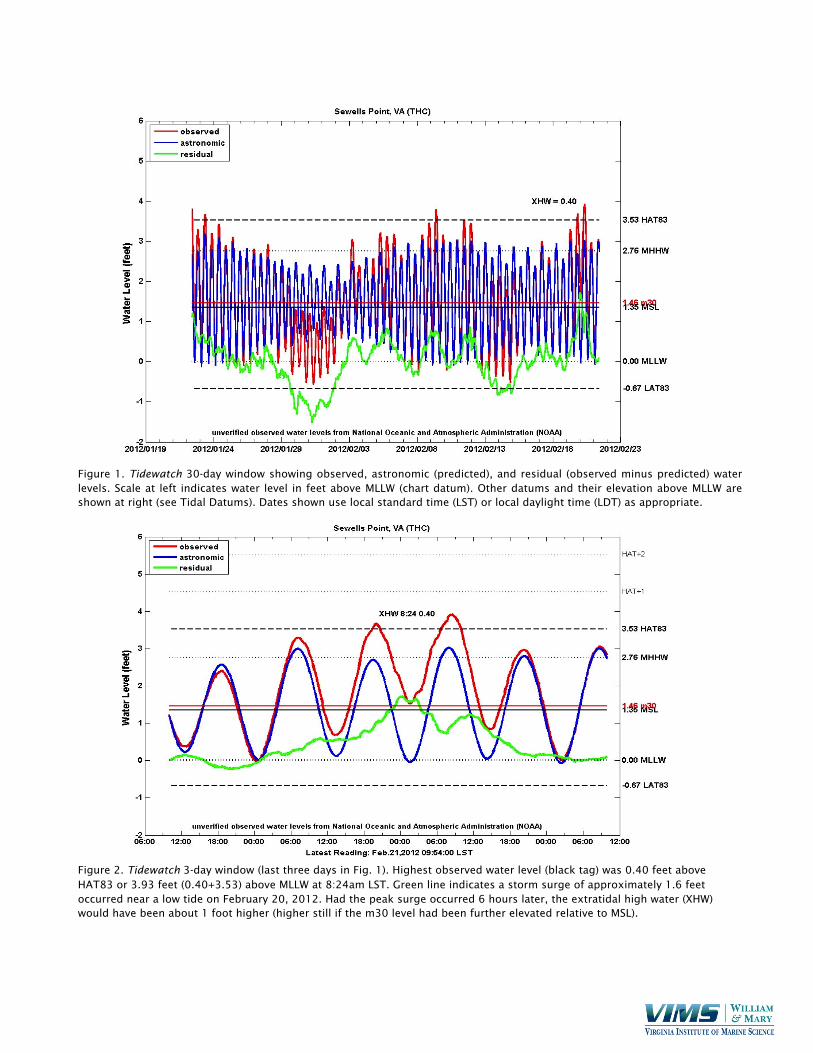
Figure 1. Tidewatch 30-day window showing observed, astronomic (predicted), and residual (observed minus predicted) water levels. Scale at left indicates water level in feet above MLLW (chart datum). Other datums and their elevation above MLLW are shown at right (see Tidal Datums). Dates shown use local standard time (LST) or local daylight time (LDT) as appropriate.
Figure 2. Tidewatch 3-day window (last three days in Fig. 1). Highest observed water level (black tag) was 0.40 feet above HAT83 or 3.93 feet (0.40+3.53) above MLLW at 8:24am LST. Green line indicates a storm surge of approximately 1.6 feet occurred near a low tide on February 20, 2012. Had the peak surge occurred 6 hours later, the extratidal high water (XHW) would have been about 1 foot higher (higher still if the m30 level had been further elevated relative to MSL).
36-hour Water-Level Forecasts (continued)
The NWS extratropical storm surge (ET-SURGE) model differs from similar hydrodynamic models by not including the astronomic tide or other types of oceanographic forcing broadly categorized as a sea-level anomaly. A water-level forecast similar to Tidewatch is generated by the NWS Meteorological Development Laboratory (MDL) for extratropical storms according to the following formula: forecast = tide + surge + anomaly (see http://www.nws.noaa.gov/mdl/etsurge/). While NOAA tide predictions reference a fixed tidal datum (see Tidal Datums section below), Tidewatch includes the anomaly in its tidal predictions by referencing the tide to a dynamic datum (m30) and so uses tide + surge as its formula.
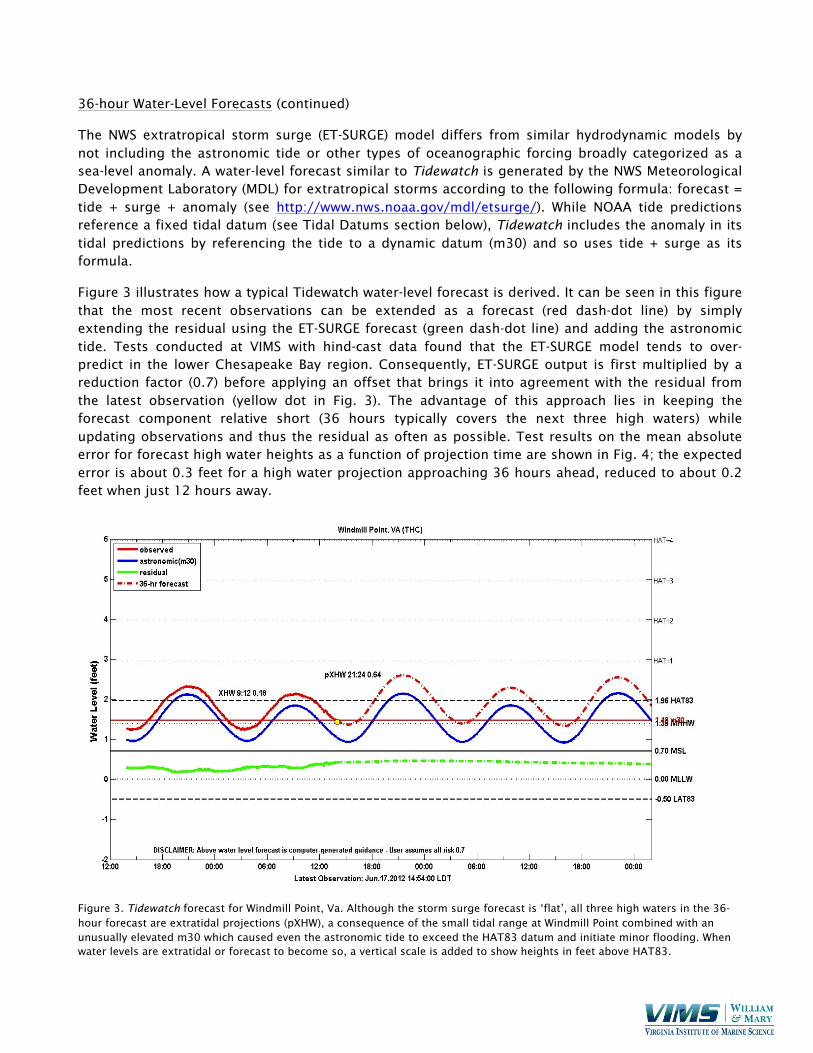
Figure 3 illustrates how a typical Tidewatch water-level forecast is derived. It can be seen in this figure that the most recent observations can be extended as a forecast (red dash-dot line) by simply extending the residual using the ET-SURGE forecast (green dash-dot line) and adding the astronomic tide. Tests conducted at VIMS with hind-cast data found that the ET-SURGE model tends to over-predict in the lower Chesapeake Bay region. Consequently, ET-SURGE output is first multiplied by a reduction factor (0.7) before applying an offset that brings it into agreement with the residual from the latest observation (yellow dot in Fig. 3). The advantage of this approach lies in keeping the forecast component relative short (36 hours typically covers the next three high waters) while updating observations and thus the residual as often as possible. Test results on the mean absolute error for forecast high water heights as a function of projection time are shown in Fig. 4; the expected error is about 0.3 feet for a high water projection approaching 36 hours ahead, reduced to about 0.2 feet when just 12 hours away.
Figure 3. Tidewatch forecast for Windmill Point, Va. Although the storm surge forecast is ‘flat’, all three high waters in the 36-hour forecast are extratidal projections (pXHW), a consequence of the small tidal range at Windmill Point combined with an unusually elevated m30 which caused even the astronomic tide to exceed the HAT83 datum and initiate minor flooding. When water levels are extratidal or forecast to become so, a vertical scale is added to show heights in feet above HAT83.
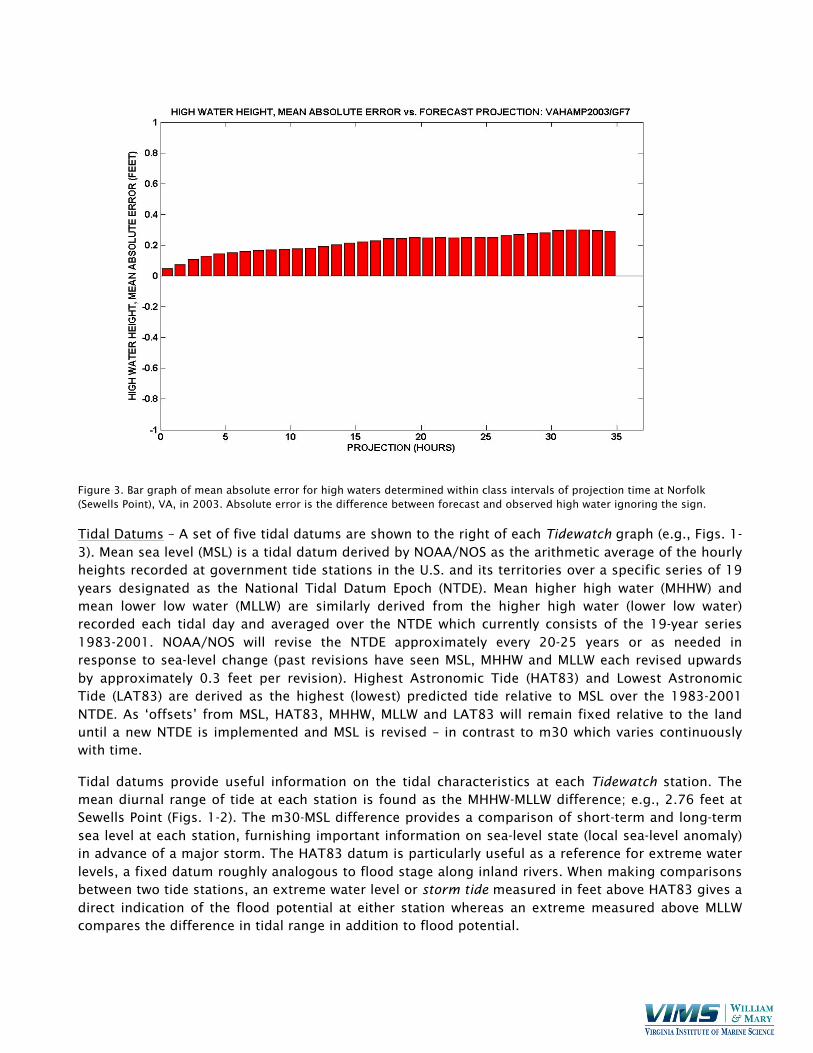
Figure 3. Bar graph of mean absolute error for high waters determined within class intervals of projection time at Norfolk (Sewells Point), VA, in 2003. Absolute error is the difference between forecast and observed high water ignoring the sign.
Tidal Datums – A set of five tidal datums are shown to the right of each Tidewatch graph (e.g., Figs. 1-3). Mean sea level (MSL) is a tidal datum derived by NOAA/NOS as the arithmetic average of the hourly heights recorded at government tide stations in the U.S. and its territories over a specific series of 19 years designated as the National Tidal Datum Epoch (NTDE). Mean higher high water (MHHW) and mean lower low water (MLLW) are similarly derived from the higher high water (lower low water) recorded each tidal day and averaged over the NTDE which currently consists of the 19-year series 1983-2001. NOAA/NOS will revise the NTDE approximately every 20-25 years or as needed in response to sea-level change (past revisions have seen MSL, MHHW and MLLW each revised upwards by approximately 0.3 feet per revision). Highest Astronomic Tide (HAT83) and Lowest Astronomic Tide (LAT83) are derived as the highest (lowest) predicted tide relative to MSL over the 1983-2001 NTDE. As ‘offsets’ from MSL, HAT83, MHHW, MLLW and LAT83 will remain fixed relative to the land until a new NTDE is implemented and MSL is revised – in contrast to m30 which varies continuously with time.
Tidal datums provide useful information on the tidal characteristics at each Tidewatch station. The mean diurnal range of tide at each station is found as the MHHW-MLLW difference; e.g., 2.76 feet at Sewells Point (Figs. 1-2). The m30-MSL difference provides a comparison of short-term and long-term sea level at each station, furnishing important information on sea-level state (local sea-level anomaly) in advance of a major storm. The HAT83 datum is particularly useful as a reference for extreme water levels, a fixed datum roughly analogous to flood stage along inland rivers. When making comparisons between two tide stations, an extreme water level or storm tide measured in feet above HAT83 gives a direct indication of the flood potential at either station whereas an extreme measured above MLLW compares the difference in tidal range in addition to flood potential.