Embed Size (px)
Citation preview

저 시-비 리- 경 지 2.0 한민
는 아래 조건 르는 경 에 한하여 게
l 저 물 복제, 포, 전송, 전시, 공연 송할 수 습니다.
다 과 같 조건 라야 합니다:
l 하는, 저 물 나 포 경 , 저 물에 적 된 허락조건 명확하게 나타내어야 합니다.
l 저 터 허가를 면 러한 조건들 적 되지 않습니다.
저 에 른 리는 내 에 하여 향 지 않습니다.
것 허락규약(Legal Code) 해하 쉽게 약한 것 니다.
Disclaimer
저 시. 하는 원저 를 시하여야 합니다.
비 리. 하는 저 물 리 목적 할 수 없습니다.
경 지. 하는 저 물 개 , 형 또는 가공할 수 없습니다.

박사학위논문
Baicalein suppresses stem cell-likecharacteristics of resistant human breast
cancer cells MDA-MB-231 by up-regulationof interferon-induced protein with
tetratricopeptide repeats 2
제주대학교 대학원
차세대융복합과학기술협동과정
고 소 예
2019년 8월
CONTENTS
1. Abstract………………………………………………………….…… 1
2. Introduction………………………………………………………….. 2
2.1. Breast cancer
2.2. Cancer stem cells
2.3. Epithelial to mesenchymal transition
2.4. Invasion and metastasis
2.5. Phytochemicals
2.6. Baicalein
2.7. Interferon-induced proteins with tetratricopeptide repeat 2
2.8. Transcriptomic analysis
2.9. Summary
3. Materials and methods………………………………………....…… 9
3.1. Reagents
3.2. Cell culture and resistant cell generation
3.3. Cell viability
3.4. Cell morphology
3.5. Clonogenic assay
3.6. Mammosphere
3.7. RNA extraction, cDNA synthesis, and Realtime PCR
3.8. Wound healing assay
3.9. Invasion assay
3.10. Flow cytometry
3.11. Western blot
3.12. Transcriptomic analysis
3.13. Pathway analysis
3.14. Gene expression analysis
3.15. Statistical analyses
4. Results………………………………………..…………….….……. 16
4.1. MDA-MB-231/IR cells developed radio-resistance
4.2. MDA-MB-231/IR cells developed chemo-resistance
4.3. Chemo- resistance of MDA-MB-231/IR cells evaluated by Annexin V/PI assay
4.4. MDA-MB-231/IR cells exhibited epithelial to mesenchymal morphology
compared to parental cells
4.5. MDA-MB-231/IR cells exhibited enhanced migration and invasion ability
compared to parental cells
4.6. Mammosphere forming ability and expression levels of stem cell-like markers
were enhanced in MDA-MB-231/IR cells than those of parental cells
4.7. MDA-MB-231/IR cells exhibited stem cell-like characters compared to its
parental cells
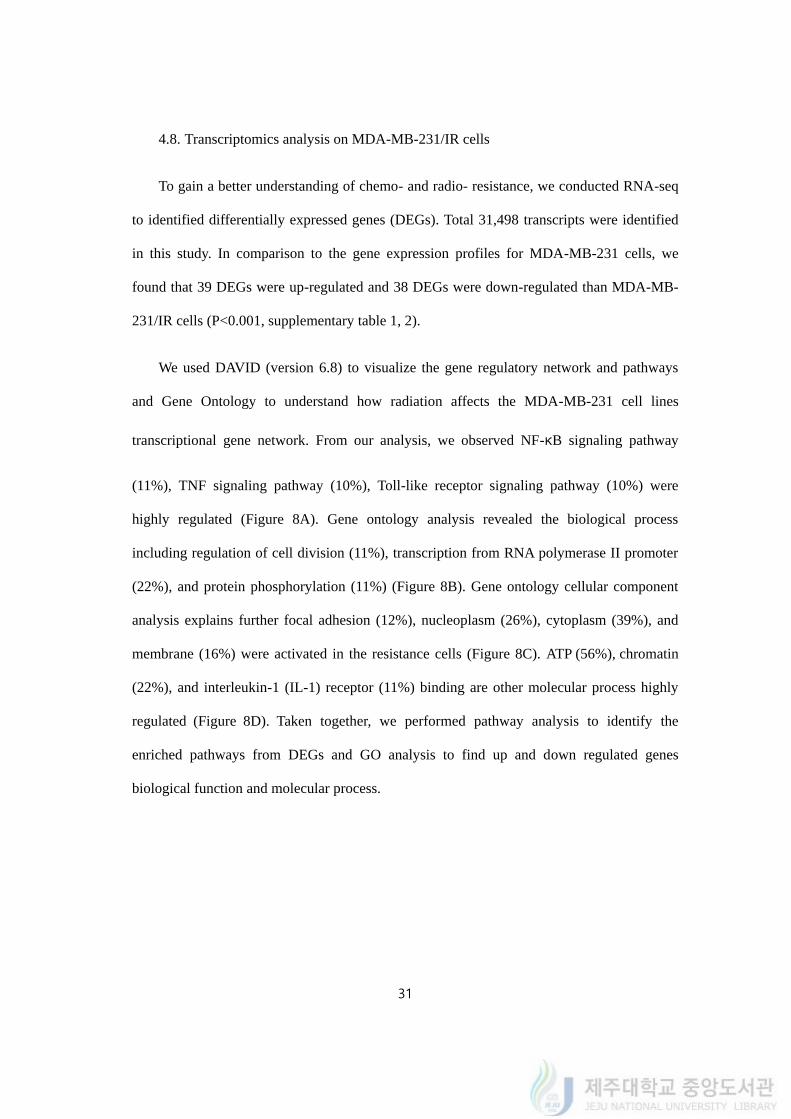
4.8. Transcriptomics analysis on MDA-MB-231/IR cells
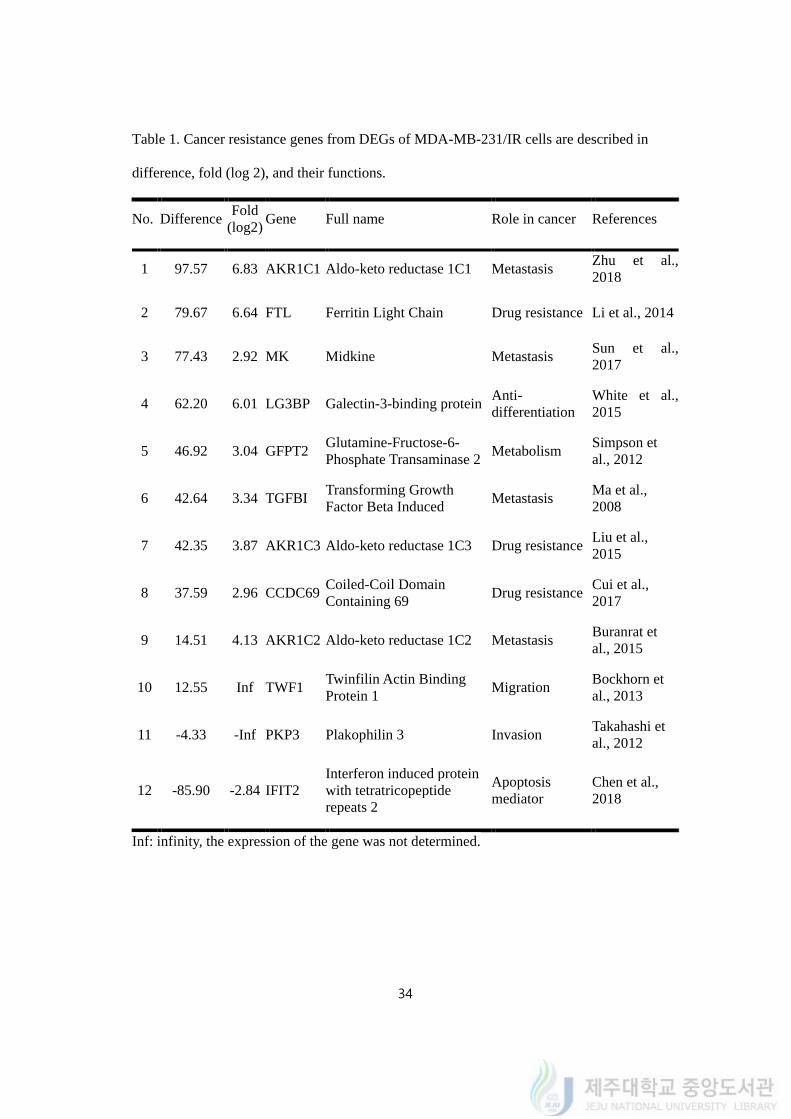
4.9. Cancer resistance was reported in 12 DEGs of MDA-MB-231/IR
4.10. Baicalein effectively targeted chemo- and radio-resistance MDA-MB-231/IR
cells
4.11. Baicalein reversed expression of IFIT2 in MDA-MB-231/IR
4.12. Baicalein reduced protein expression level of Slug
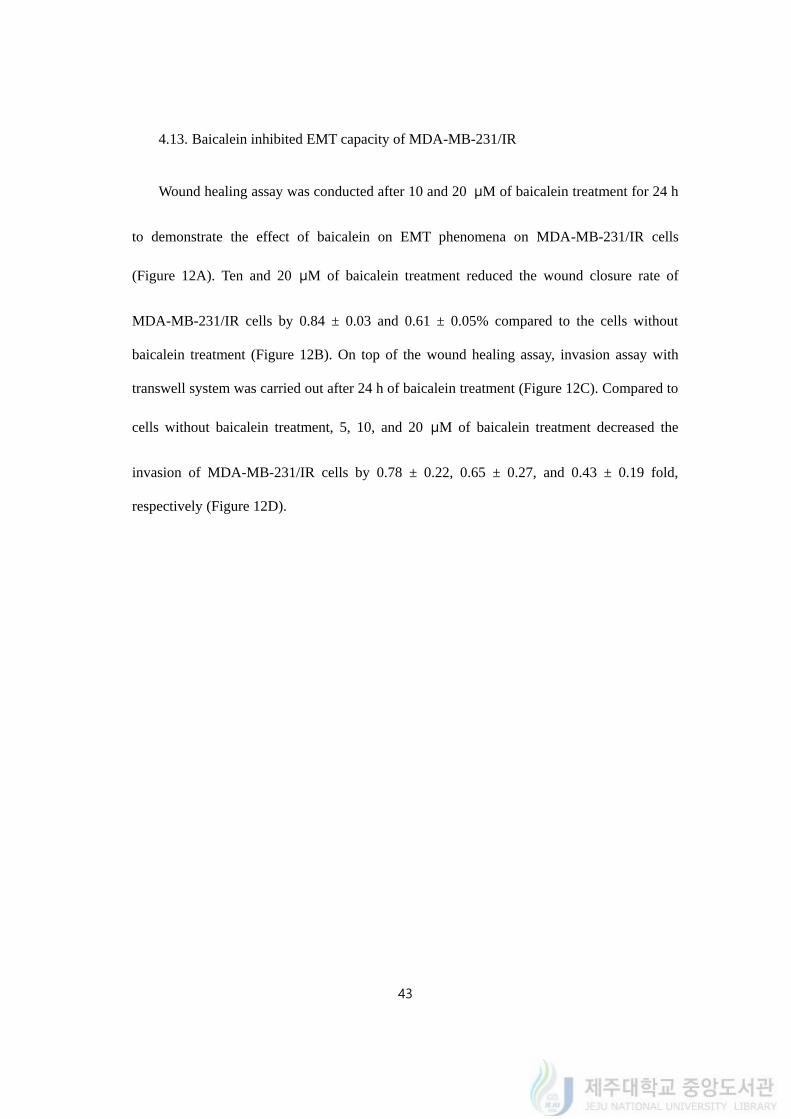
4.13. Baicalein inhibited EMT capacity of MDA-MB-231/IR
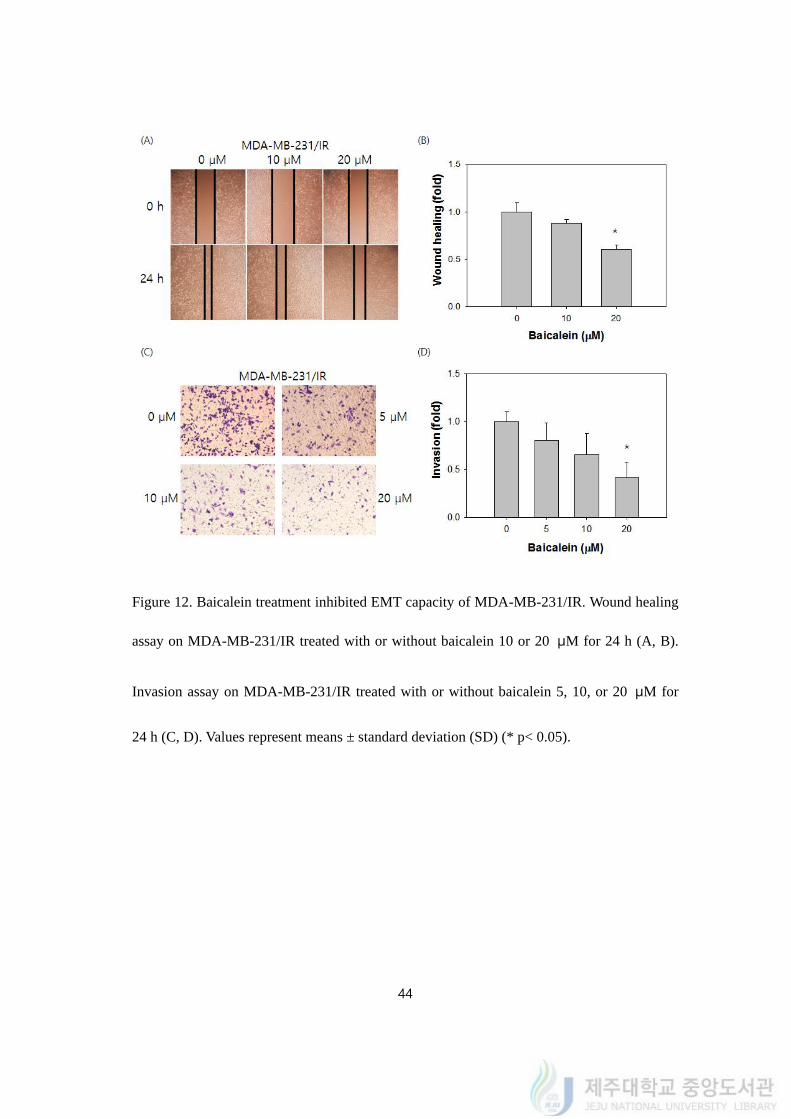
4.14. Baicalein diminished the mammosphere formation and expression of marker
proteins in MDA-MB-231/IR
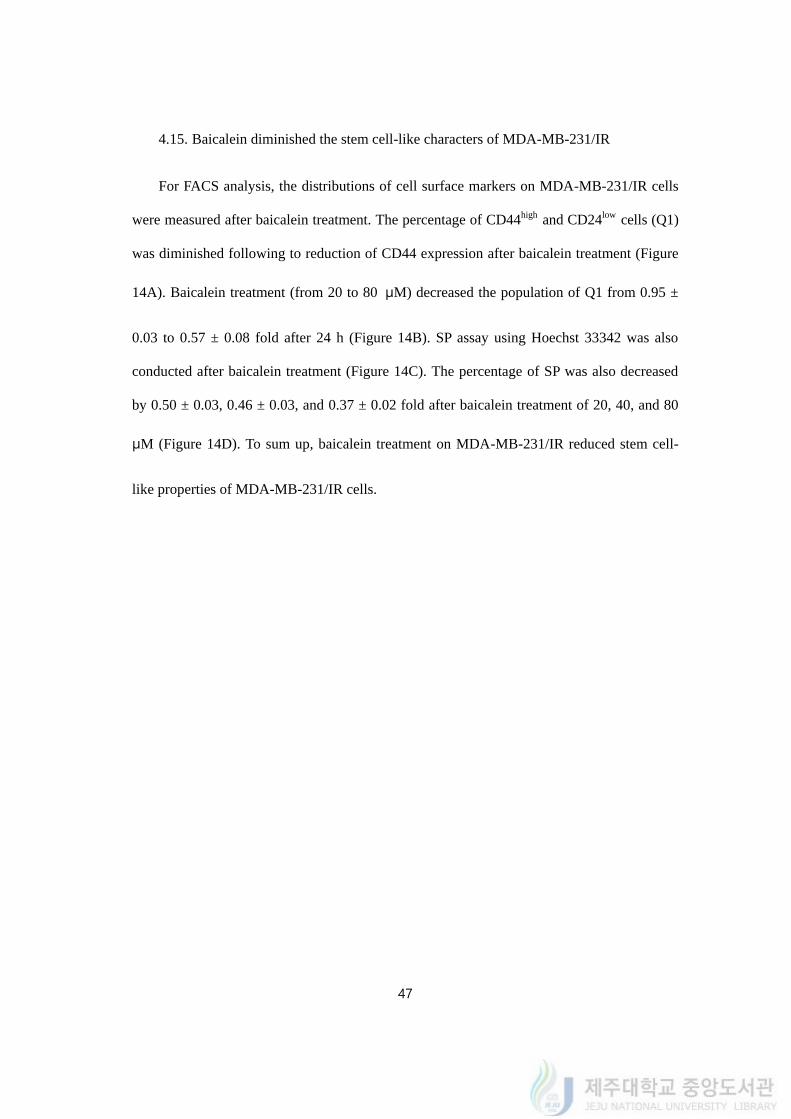
4.15. Baicalein diminished the stem cell-like characters of MDA-MB-231/IR
4.16. Baicalein increased expression levels of apoptosis-related proteins on MDA-
MB-231/IR
4.17. Baicalein induces apotosis on MDA-MB-231/IR cells
4.18. Baicalein co-treatment reversed radio- resistance in MDA-MB-231/IR
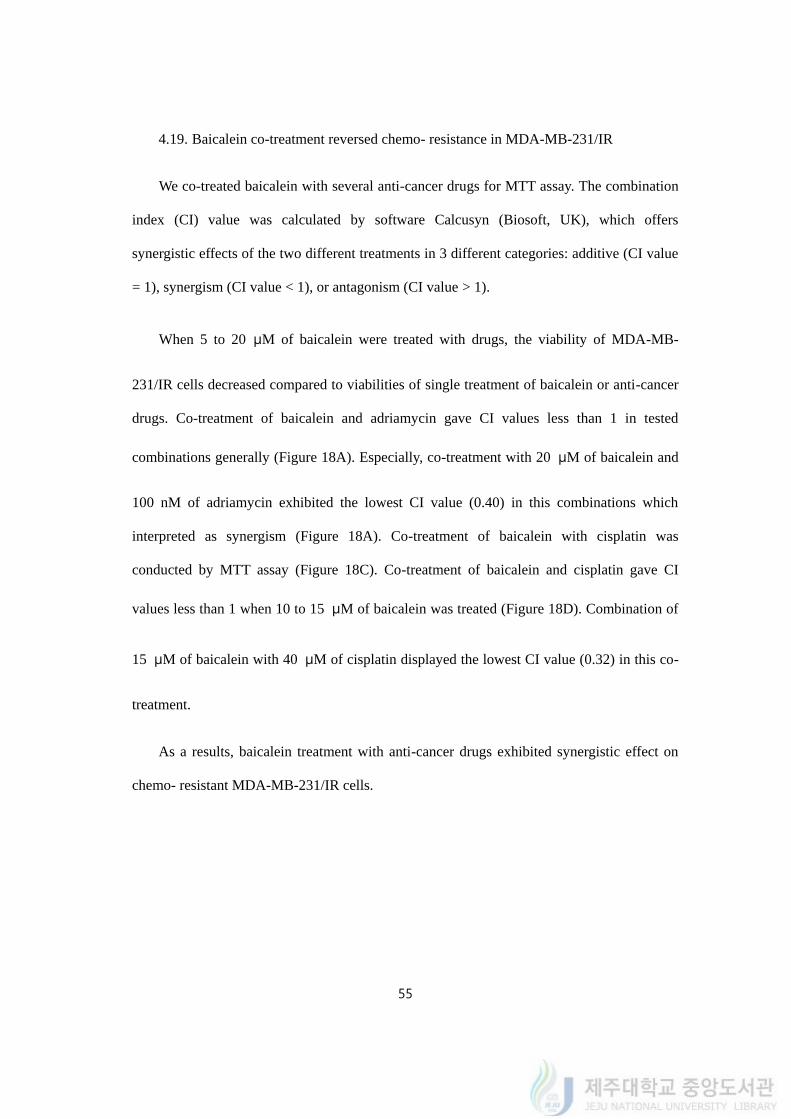
4.19. Baicalein co-treatment reversed chemo- resistance in MDA-MB-231/IR
4.20. The expression of IFIT2 affects survival in patients

5. Discussion………………………………………………………...…. 59
6. References…………………………………………………………... 70
1
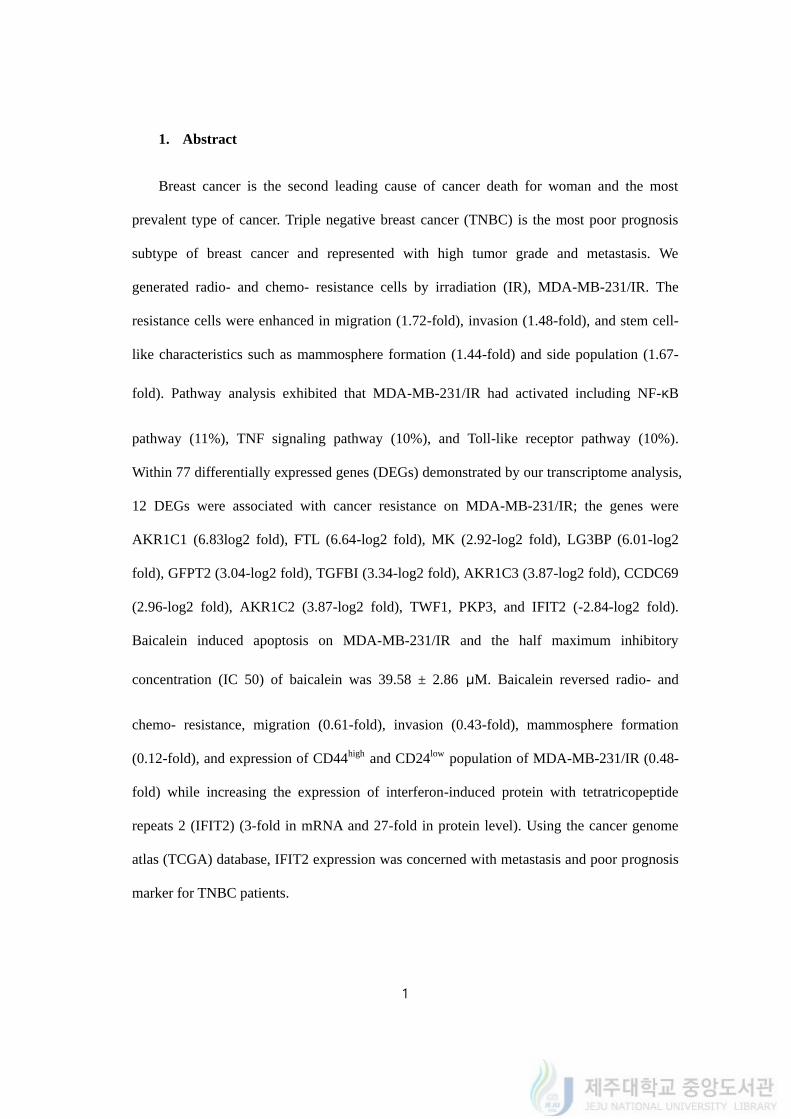
1. Abstract
Breast cancer is the second leading cause of cancer death for woman and the most
prevalent type of cancer. Triple negative breast cancer (TNBC) is the most poor prognosis
subtype of breast cancer and represented with high tumor grade and metastasis. We
generated radio- and chemo- resistance cells by irradiation (IR), MDA-MB-231/IR. The
resistance cells were enhanced in migration (1.72-fold), invasion (1.48-fold), and stem cell-
like characteristics such as mammosphere formation (1.44-fold) and side population (1.67-
fold). Pathway analysis exhibited that MDA-MB-231/IR had activated including NF-κB
pathway (11%), TNF signaling pathway (10%), and Toll-like receptor pathway (10%).
Within 77 differentially expressed genes (DEGs) demonstrated by our transcriptome analysis,
12 DEGs were associated with cancer resistance on MDA-MB-231/IR; the genes were
AKR1C1 (6.83log2 fold), FTL (6.64-log2 fold), MK (2.92-log2 fold), LG3BP (6.01-log2
fold), GFPT2 (3.04-log2 fold), TGFBI (3.34-log2 fold), AKR1C3 (3.87-log2 fold), CCDC69
(2.96-log2 fold), AKR1C2 (3.87-log2 fold), TWF1, PKP3, and IFIT2 (-2.84-log2 fold).
Baicalein induced apoptosis on MDA-MB-231/IR and the half maximum inhibitory
concentration (IC 50) of baicalein was 39.58 ± 2.86 μM. Baicalein reversed radio- and
chemo- resistance, migration (0.61-fold), invasion (0.43-fold), mammosphere formation
(0.12-fold), and expression of CD44high and CD24low population of MDA-MB-231/IR (0.48-
fold) while increasing the expression of interferon-induced protein with tetratricopeptide
repeats 2 (IFIT2) (3-fold in mRNA and 27-fold in protein level). Using the cancer genome
atlas (TCGA) database, IFIT2 expression was concerned with metastasis and poor prognosis
marker for TNBC patients.
2
2. Introduction
2.1. Breast cancer
Breast cancer is the most prevalent type of cancer and the second leading cause of
cancer death for women worldwide. Also it is expected to account for 29% of all new cancer
diagnoses (Siegel et al., 2016). Breast cancer has been divided into subtypes differentiated by
the expression of receptors: HR-positive (luminal), HER2-amplification, and TNBC (triple
negative breast cancer). Hormone receptor (HR)- positive cancer is the most common
subtype of breast cancer, in which approximately 70% of breast cancer patients are
diagnosed. The HR-positive cancer can be classified to three subtypes in detail: 1)ER/PR-
positive/ HER2-negative/ Ki67-negative, 2)ER/PR-positive/ HER2-negative/ Ki67- positive,
3)ER/PR-positive/ HER2-positive/ Ki67-positive. The HR is a receptor expressed in the
nucleus and when HR is activated by estrogen PI3K/Akt pathway and MAP kinase pathways
are followed (Levin et al., 2008).
While only 15-20% of breast cancer patients are classified to triple-negative breast
cancer (TNBC) which is lack of ER, PR and HER2 over-expression, however the TNBC
patients represents poor prognosis with unfavorable features in histologic grades, tumor sizes,
and metastasis (Haffty et al., 2006; Dent et al., 2007). It is a challenge to the TNBC patients
which hormone therapy or receptor targeting drugs are not responding to them in despite of
advances in chemical or hormonal therapies. Moreover, heterogeneity of TNBC indicates the
higher probability survival from chemotherapy. The heterogenous character of TNBC leads
to application of novel agents that are targeting specific molecules or circumventing innate
resistant to chemotherapy which could provide a protective effect against radiation (Oakman
et al., 2010; Bianchini et al., 2016; Luzhna et al., 2015).
3
2.2. Cancer stem cells (CSCs)
Cancer stem cells also called tumor initiating cells (TICs), are a particular subpopulation of
cells in cancers, including breast cancer, that are capable of self-renew and differentiate into
the heterogeneous lineages of cancer cells that compose the tumor (Lapidot et al., 1994).
CSCs are illustrated to be positioned at the top of the tumor hierarchy and considered to
develop therapeutic resistance, recurrence and metastasis (Zhou et al., 2009; Meacham et al.,
2013). TNBC subtype is reported to contain higher CSCs which represented as therapy
resistance. There are several ways to identify CSCs from cancer cells but the expression of
cell surface markers and some membrane transporters are used for identification (Schatton et
al., 2009; Dean et al., 2005). It has been reported that the cells with expressions of CD44,
CD24, and CD133 on their surfaces are considered to breast CSCs (Al-Hajj et al., 2003; Liu
et al., 2013). Furthermore, embryonic regulators, like Oct4 and Twist, and cell membrane
adenosine triphosphate-binding cassette transporters, for example, MRP1, ABCG2, and
MDR1, are overexpressed in the CSCs of breast cancer (Scharenberg et al., 2002). Side
population assays are one of the well-known techniques to detect CSCs by effusion activity
of ABC transporters with Hoechst 33342 (Scharenberg et al., 2002).
2.3. Epithelial to mesenchymal transition (EMT)
Epithelial to mesenchymal transition is a fundamental process of development of
embryo but a crucial event for malignancy in cancer. Mutations in Wnt, Notch and Hedgehog
pathways are considered deviate normal stem cell from regulation signals (Beachy et al.,
2004). The progression of EMT process is correlated with aggressive cancer development
and tumor malignancy (Thiery, 2003). Moreover, CSCs present this morphological change
4
that includes the loss of cell-cell adhesion and acquisition of migration and invasion abilities
(Hemavathy et al., 2000; Blanco et al., 2002). In adherens junctions, membranous E-
cadherin is a hallmark of EMT and gene repressors such as Slug, Snail, or ZEB1/2,
transcriptionally regulates its expression (Conacci-Sorrell, M. et al. 2003).
2.4. Invasion and metastasis
Invasion and metastasis are characteristics of CSCs that those cells are penetrating extra-
cellular matrix (ECM), basement membranes, and endothelial walls to migrate and colonize
distant organs (Fidler, 2003). The invasion events include the changes in cell-cell adhesion,
cell-ECM adhesion, protease activities, and chemo-sensing receptors (Friedl, 2011). These
incidents are considered to detriment by causing dissemination of tumor and cancer
progression (Jang et al., 2015). Twenty to fifty percent of primary breast cancer patients
would end up with metastatic disease although only up to 6 % of the breast cancer patients
were initially diagnosed to have metastasis (Lu et al., 2009). Therefore it is urgent to seek
therapies that could target both migration and invasion in breast cancer.
2.5. Phytochemicals
Plants have been used for medicinal or clinical substances from ancients and anti-cancer
drugs created in modern times were also based on structures of natural chemicals (Cragg et
al., 2013): more than 50% of novel anti-cancer drugs were obtained or based on chemical
structures from natural sources, especially herbs (Amin et al., 2009). The importance of plant
derived chemicals lies here. On top of that, researchers have found and highlighted the
5
importance of understanding the biological characteristics of active compounds of herbal
remedies such as polyphenols, not only because of their effect but also economical
accessability (Nowak et al., 2013; Bahmani et al., 2016). Phenolic compounds are a kind of
secondary metabolites of plants which is abundantly distributed (Mocanu et al., 2015). The
phenolic compounds have more than one of aromatic ring with one or more hydroxyl groups
and are expected to have anti-cancer activities (Crozier et al., 2009).
Flavonoids are one of the widely found substances from plants like fruits and vegetables,
and they are widely investigated for efficacy of human health. The skeleton of flavonoids
consist a C6-C3-C6 ring (also described as A-C-B ring), which is called benzopyran, and the
locations of hydroxyl groups in different rings determine subclasses of flavonoid (Choi et al.,
2012; Kanadaswami et al., 2005; Oracz et al., 2015).
Flavone is one the flavonoid with ketone group on C3 ring (C ring) in the basal structure
and most well-known natural flavones include luteolin, apigenin, and baicalein for their
activities on anti-oxidant, anti-cancer, anti-proliferative and kinase inhibiting effects
(Kanadaswami et al., 2005). The influence of flavones on cancer was reported that they
could interfere progressive phenomena of cancer (Ravishankar et al., 2013). Flavonols have
a hydroxyl group on the 3-position of the C3 ring and previous studies have concluded that
the intake of flavonols along with flavones decreased a risk breast cancer (Hui et al., 2013).
Quercetin, kaempferol, myricetin, and rutin are the main representatives of flavonols and
they are reported to have a role in preventing carcinogenesis (Choi et al., 2018; Kim et al.,
2008, Iriti et al., 2017).
2.6. Baicalein
6
Baicalein is one of active compound of the roots of Scutellaria baicalensis Georgi
which is a traditional herb in East Asia (Kim et al., 2001). The phytochemical is
demonstrated for its biological benefits on reducing tumor progression, inflammation,
fibrosis and also on targeting the tumor microenvironment (Bie et al., 2017; Wang et al.,
2015; Wu et al., 2011). Only few studies demonstrated the anti-cancer effects of baicalein in
TNBC and most of them were focused in suppression of migration and invasion. Baicalein
can target TNBC cells by increasing ER stress or lowering mitochondrial membrane
potential through induction of intra-cellular reactive oxygen species (ROS) in caspase
dependent pathway (Lee et al., 2008) or by down-regulating SATB1 and Wnt/β-catenin
pathway (Ma et al., 2016). However, the effect of baicalein on therapy resistance TNBC cells
was still not studied.
2.7. Interferon-induced proteins with tetratricopeptide repeat 2 (IFIT2)
IFIT2 is a protein of 54 kDa (472 amino acids) and it is one of the members of IFITs in
human. The family is induced by interferons or through Toll-like receptors, RIG-1-like
receptors. They are considered to play a role in immune response by recognizing structures
of viral RNA and inhibiting mRNA translation (Pichlmair et al., 2011; Zhou et al., 2013).
Expression of IFIT2 is negatively co-expressed by Wnt/β-catenin signaling and in colorectal
cancer cells (Ohsugi et al., 2017), and IFIT2 especially induces apoptosis in cervical cancer
cells via mitochondria pathway (Stawowczyk et al., 2011). Few researchers have focused on
the correlation of IFIT2 and prognosis in patients in oral cancer and gastric cancer (Lai et al.,
2008; Chen et al., 2018), but studies regarding their roles in breast cancer have been limited.
7
2.8. Transcriptomic analysis
Transcriptomics analysis is the large-scaled study using the high-throughput techniques
to examine RNA molecules of cells (Velculescu et al., 1997; Carninci et al., 2005; Cies lik et
al., 2017). Unlikely to DNA, the transcripted RNA gives information of cells including cell
types, regulation mechanisms, and morphological features (Hughes et al., 2000). Thesedays,
transcriptomics is often applied to identify biological processes of cancer for novel clinical
application. Cancer cells are distinguished from normal cells by altered gene expression and
protein function, so that understanding transcriptome of cancer cells gives better information
underlying mechanisms such as resistance and pathogenesis (Chang et al., 2003; Staunton et
al., 2001). The development of sequencing techniques like next-generation sequencing (NGS)
methodology and shotgun sequencing enabled researchers to apply transcriptomic analysis
on their works and to store the results of microarray and RNA-seq to database, for example,
The Cancer Genome Atlas (TCGA), the Human Protein Atlas, the Encyclopedia of DNA
Elements (ENCODE), and the Cancer Cell Line Encyclopedia (CCLE). With those databases,
researchers can approach to elucidate the structure of global gene expression by
bioinformatics and computational biology.
2.9. Summary
In this paper, we focused in the effects of baicalein on therapy resistance TNBC cells
which were generated by irradiation. Comparing normal TNBC cells with resistant
counterparts, chemo- and radio-resistant TNBC cells increased migrating and invasive ability
as well as stem cell-like character phenomena. Baicalein was the most effective
phytochemical among we tested. Transcriptome analysis revealed 12 genes that were

8
reported with cancer resistance, and one of the genes, IFIT2 was found to reverse its
transcriptional expression after baicalein treatment. Kaplan-Meier plot of TNBC patients
indicated that poor prognosis was related to low IFIT2 expression.
9
3. Materials and Methods
3.1. Reagents
DMEM medium, trypsin/EDTA, TRIzol, FBS, BSA, bFGF, insulin, EGF, B-27
supplement were purchased from Invitrogen Inc. (Carlsbad, CA, USA). Baicalein, myricetin,
luteolin, kaempherol, quercetin, rutin, HEPES, adriamycin (doxorubicin), RNase A, Hoechst
33342 dye, propidium iodide (PI), 2'7'-dichlorofluorescin diacetate (H2DCF-DA) were
obtained from Sigma chemical Co. (St. Louis, MO, USA). Matrigel matrix, Mitoscreen (JC-
1) kit and Annexin V-FITC Apoptosis detection kit were obtained from BD Bioscience
(Franklin Lakes, NJ, USA). From Santa Cruz Biotechnology (Dallas, TX, USA), cisplatin
was purchased. Dimethyl sulfoxide (DMSO) and 3-(4,5-Dimethylthiazol-2-yl)-2,5-diphenyl-
tetrazolium bromide (MTT) were purchased from Amresco (Solon, OH, USA). PVDF
membrane was purchased from Pierce Protein Biology (Rockford, IL, USA) and BCA
protein assay kit was obtained from Millipore Ltd. (Billerica, MA, USA). Phosphate buffered
saline (PBS) and BS ECL Plus kit were obtained from Biosesang (Gyeonggi, Korea).
3.2. Cell culture and resistant cell generation
MDA-MB-231 and its derived cells were cultured in DMEM medium supplemented
with 10% of FBS and 1% of antibiotics, and incubated at 37 ℃ in a humidified incubator
with 5% of CO2. After subculture, when the cell's confluency arrived at 70-80%, irradiation
of 2 Gy was performed. The irradiation was performed using a 60CO Theatron-780 tele-
therapy unit (dose rate: 1.52 Gy/min) at Applied Radiological Science Institute in Jeju
National University. Two gray of radiation was irradiated once a day, 5 days in a row, for 5
10
weeks. Subculture to new dish was done after 5 times of irradiation and medium was
changed to new medium twice a week. Twenty-five times of irradiations were performed in 5
weeks and the radiated cells were cultured for a month before starting following assays.
3.3. Cell viability
The cell viability was determined by MTT assay after sample treatment. Using the
conversion MTT to formazan crystals by mitochondrial dehydrogenases, the percentage of
live cells can be calculated. Briefly, cells plated in 96-well plates at a density of 1x 10⁴
cells/mL were treated with indicated samples diluted in DMEM medium with various
concentrations. When radiation was treated, 1x 10⁴ of cells were directly radiated and seeded
for 4 extra days. After that, the medium was suctioned and 100 μL of MTT solution (solved
in distilled water, final concentration of 1 mg/mL) was added. After 3-4 h of incubation, the
media were aspirated and the formazan was dissolved in DMSO (150 μL). Absorbance (at
570 nm) was detected by Tecan microplate reader (Salzbrug, Austria).
3.4. Cell morphology
Cell morphology was observed under an Olympus light or fluorescence microscope
(Essex, UK). Cells were checked before subculture under the light to check confluency of
dishes. Cell's morphology was envisaged under the light microscope and captured by
program.
11
3.5. Clonogenic assay
To calculate the surviving fraction after radiation, colony forming assay was carried out.
1x 10⁴ of cells was prepared by counting after trypsinization and irradiation were conducted.
Irradiation was performed with 0, 2, 4, 6, 8 Gy of γ-ray. After radiation, cells were directly
seeded on 12-well plate for 5 days. Colonies were washed and fixed by cold methanol for 10
min. The methanol was aspirated and crystal violet was used for dyeing. Colonies were
counted by software program NIST's integrated colony enumerator (NICE; Choi et al., 2018;
ftp://ftp.nist.gov/pub/physics/mlclarke/NICE).
3.6. Mammosphere
To form mammosphere, DMEM was supplemented with 1 μM insulin, 1% of BSA, 20
ng/mL EGF, 10 ng/mL bFGF and B-27 supplement. Cells were washed before seeded at a
density of 2x 10² in non-coating 24-well plate with the described media. After incubation for
a week, mammospheres comprised of at least 50 cells were counted.
3.7. RNA extraction, cDNA synthesis, and Realtime PCR
Cells were prepared for 24 h before RNA extraction following to manufacturer's
protocol. cDNA was synthesized using Promega reverse transcription kit (Madison, WI,
USA), using 1 μg of RNA. To confirm the quality of cDNA synthesis, glyceraldehyde 3-
phosphate dehydrogenase (GAPDH) was used as a control. Quantitative realtime PCR was
12
initiated by incubating at 95 ℃ for 15 min and 40-50 cycles of denaturation, annealing and
elongation steps were set. The relative levels of gene expression were calculated by the
following method.
The relative level of gene expression = 2 -ΔΔCt; Ct is cycle threshold.
ΔCt = Ctgene - Ctreference ; reference is GAPDH.
ΔΔCt = (ΔCtgene of MDA-MB-231/IR) - (ΔCtgene of MDA-MB-231)
3.8. Wound healing assay
Cells were counted at 1x 10⁵ cells per well and incubated to be confluent on the 6-well
plate for 24 h in mono-layer. With sterilized 1000-μL tip of pipette, scratch was made in a
shape of cross. After the scratching, the plate was washed with PBS and refilled with new
media. The width of gap was measured just after scratch (0 h) and 24 h after scratch by
image capturing program. The width was measured and the rate of migration was calculated
as the following formula.
Wound healing (%) = {1-(width of 24 h after scratch)/(width of 0 h after scratch)}x100
3.9. Invasion assay
One hundred μL of 10% Matrigel solution was filled in the upper well of transwell
13
system before performing assay. Cells were prepared and transferred to the upper well with
DMEM media. In the bottom well, 600 μL of 2% FBS-DMEM media were filled. Using
cotton swaps, cells were removed from the insert after 24 h incubation, fixed with fixative
(1:1 acetone/methanol) and dyed with crystal violet. The colored invading cells were
captured under microscope and the number of cells was counted by Image J and the invasive
rate of the cells were compared.
3.10. Flow cytometry
To detect cell cycle, the treated cells were washed and fixed in 70% ethanol. Two hours
before analysis, RNase A and PI were diluted in 2 mM EDTA-PBS and treated at 37 ℃. The
intensities of fluorescence were measured by FACSCalibur (BD Bioscience). The
intracellular reactive oxygen species (ROS) levels were measured using 10 μM of H2DCF-
DA. Cells were prepared and incubated with the dye for 15 min and resuspended for analysis.
To detect apoptosis, Annexin V-FITC was utilized following the manufacturer's protocol.
Briefly, cells were mixed with Annexin V-FITC and PI for 15 min at room temperature. To
detect cell surface markers, CD44-FITC and CD24-PE conjugated dye were incubated with
cells for 20 min. Side population was observed using Hoechst 33342. After detaching, cells
were diluted with the mix of DMEM buffered with 1 mM HEPES, 5 mM Hoechst 33342 and
2% of FBS for 2 h. The Mitoscreen kit was utilized following to the manufacturer's protocol.
JC-1 dye was diluted with cells for 15 min and washed, centrifuged and resuspensed in PBS.
14
3.11. Western blot
Cells were prepared at a density of 1x10⁵ on 60 mm plate. Cells were lysed with RIPA
buffer supplemented with protease inhibitor cocktail and phenylmethylsulfonyl fluoride and
centrifuged for 20 min. Only supernatant was collected and diluted after BCA protein assay.
The lysates were separated on 10-12% SDS-PAGE and transferred to PVDF membranes.
Primary and secondary antibodies were incubated with the membrane after blocking with 5%
of non-fat dried milk in TTBS. Protein bands were detected by BS ECL kit.
3.12. Transcriptomic analysis
Total RNA was extracted using TRIzol and one μg of the RNA was utilized to construct
a library using Illumina TruSeq kit (Illumina Inc., San Diego, CA, USA). Poly-T oligo-
attached magnetic beads were used for purification. RNA-seq was performed according to
the manufacturer's instructions by Macrogen Inc. (Seoul, Korea). Abundance of the
transcriptome was determined differentially expressed genes (DEGs) with statistical
significance (P < 0.001 and at least 2 fold changes) using EdgeR.
3.13. Pathway analysis
We utilized the different modules of the Database for Annotation, Visualization and
Integrated Discovery (DAVID, Ver. 6.8) for prediction of pathways and Gene Ontology (GO)
associated with MDA-MB-231/IR.
15
3.14. Gene expression analysis
The cancer genome atlas (TCGA), KM plotter and Xena browser was used for analyze.
The relapse free survival of TNBC patients with high or low expression of the gene was
detected. The correlation of genes' expression was compared by R program. Gene
expressions according to cancer sample types were also analyzed.
3.15. Statistical analyses
Statistical analyses were performed using a one-way analysis of variance and t-test by
SPSS (IBM Corp., NY, USA). The p-value less than 0.05 was considered to be significant.
16
4. Results
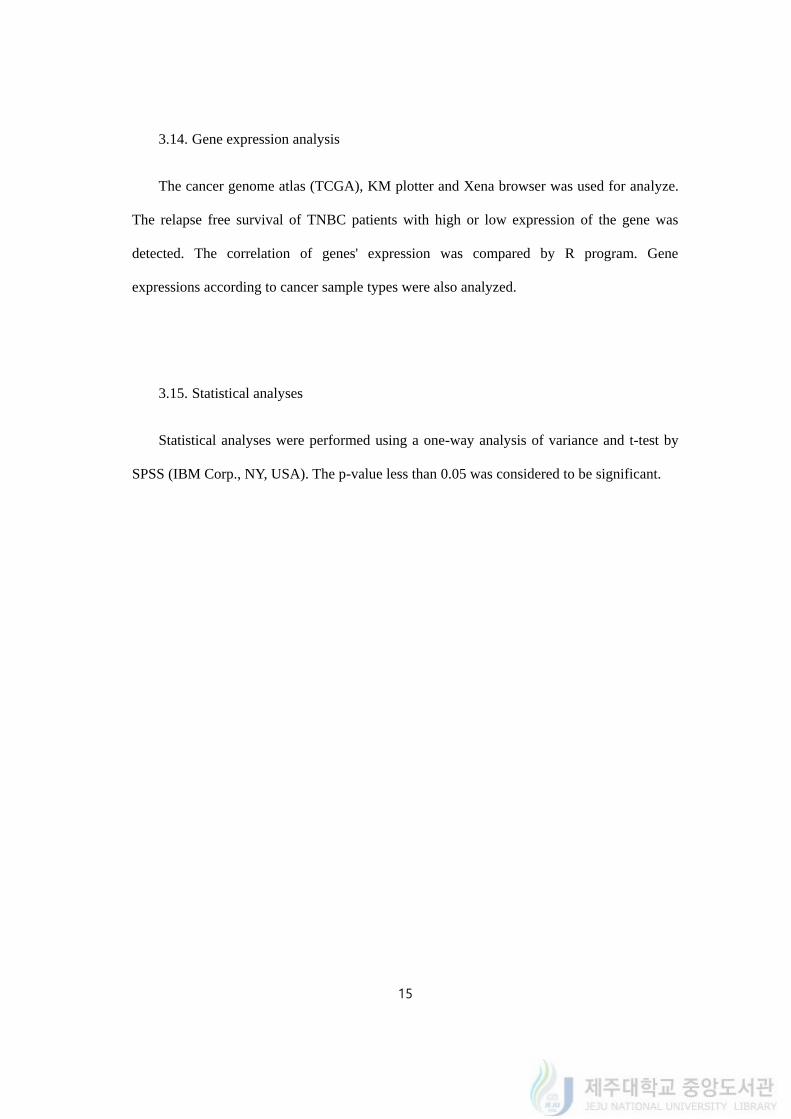
4.1. MDA-MB-231/IR cells developed radio-resistance
To gain a better understanding of mechanism of acquired radio- and chemo-resistance in
breast cancer, we designed and generated the resistant cancer cells by repetitive 2 Gy
irradiations up to total 50 Gy. We named the survived cells MDA-MB-231/IR.
As MDA-MB-231/IR cells had survived from radiation, surviving fraction and cell
viability were measured in MDA-MB-231 and its derivative resistant cell MDA-MB-231/IR
cells to validate radio-resistance in MDA-MB-231/IR. Cells were exposed to a range of
single radiation doses (2–8 Gy) and surviving fraction was calculated using the clonogenic
assay. The survival fraction of MDA-MB-231/IR cells was higher than the survival fraction
of MDA-MB-231 cells, showing that acquired radio-resistance in MDA-MB-231/IR cells
after irradiation. Cell viability assay was also conducted with MTT assay to confirm the
radio-resistance of MDA-MB-231/IR after irradiation. The results showed at Figure 1C and
we compared the viability with the concept of LD 50 (50 % Lethal dose of gamma ray)
which is the estimated dose of radiation expected to kill 50 percent of an exposed population
(Hunter N.R., et al, 2013) or IC 50 (Lee H-J., et al., 2013). The LD 50 value of irradiation on
MDA-MB-231 cells was 3.48 ± 0.13 Gy, whereas the LD 50 value of irradiation on MDA-
MB-231/IR cells was 7.11 ± 0.16 Gy. MDA-MB-231/IR showed much higher surviving
ability compared to MDA-MB-231 after irradiation doses we tested.
17
Figure 1. MDA-MB-231/IR developed resistance to irradiation compared to its parental cell,
MDA-MB-231. Clonogenic assay of MDA-MB-231 and MDA-MB-231/IR was evaluated 5
days after irradiation of the indicated dose of gray (Gy) (A). Colonies were counted by
NIST's integrated colony enumerator (NICE) for survivng fraction (B). MTT assay of MDA-
MB-231 and MDA-MB-231/IR was evaluated 4 days after irradiation of indicated doses of
gray (C). Values represent means ± standard deviation (SD) (n= 3) (* p < 0.05).
18
4.2. MDA-MB-231/IR cells developed chemo-resistance
It is acceptable that one resistant mechanism could be shared with several stimuli, so
that we tested if radiation resistant cell MDA-MB-231/IR cells have chemo-resistance.
Among many anticancer drugs, adriamycin, paclitaxel, or cisplatin are the most frequently
used drugs for breast cancer therapy, especially for metastatic breast cancer. Adriamycin
works by intercalating in DNA and inhibiting topoisomerase. Cisplatin is another anti-cancer
drug, which has a different mechanism from adriamycin. Cisplatin belongs to the platinum-
based drugs and it binds to guanine of DNA and inhibits DNA replication. So we picked the
two different anti-cancer drugs, adriamycin and cisplatin, that mainly used in TNBC for
further experiments.
To test the idea of multiple resistances by sharing resistance mechanism, anti-cancer
drugs were treated to MDA-MB-231 and MDA-MB-231/IR cells and cell viability was
detected by MTT assay. Adriamycin treatment significantly decreased the cell viability of
MDA-MB-231 in a dose dependent manner. Adriamycin was treated with a range of
concentration from 50 to 800 nM and reduced viability of MDA-MB-231 cells from 82.35 ±
1.59% to 26.98 ± 2.33%. IC 50 value of adriamycin on MDA-MB-231 was 393.33 ± 9.43
nM (Figure 2A). With same range of concentration of adriamycin only diminished MDA-
MB-231/IR cells from 104.32 ± 3.43% to 58.29 ± 2.04% and IC 50 value on MDA-MB-
231/IR was above 800 nM (Figure 2A). Cisplatin affected both MDA-MB-231 and MDA-
MB-231/IR cells dose-dependently. Cisplatin was treated with a range of concentration from
6.25 to 100 μM and reduced viability of MDA-MB-231 cells from 81.07 ± 3.52% to 6.51
±1.28%. IC 50 value of cisplatin on MDA-MB-231 was 22.39 ± 1.61 μM (Figure 2B). With
same range of concentration of cisplatin decreased MDA-MB-231/IR cells from 98.41 ±
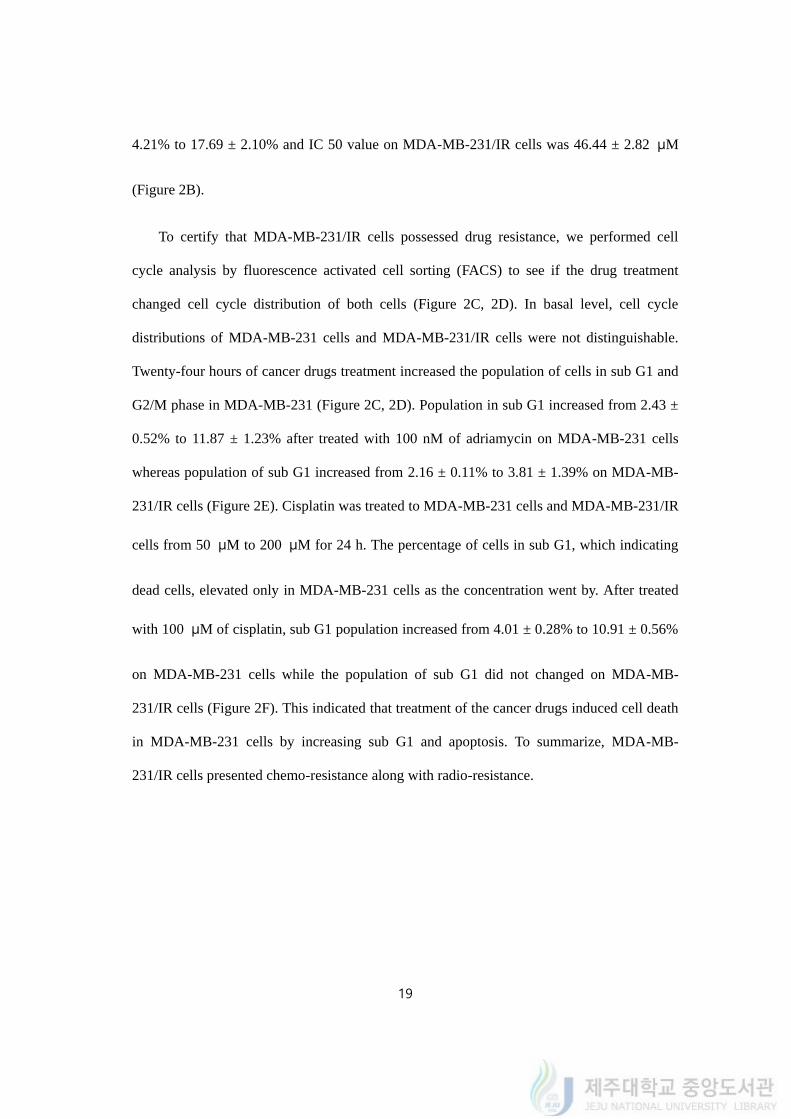
19
4.21% to 17.69 ± 2.10% and IC 50 value on MDA-MB-231/IR cells was 46.44 ± 2.82 μM
(Figure 2B).
To certify that MDA-MB-231/IR cells possessed drug resistance, we performed cell
cycle analysis by fluorescence activated cell sorting (FACS) to see if the drug treatment
changed cell cycle distribution of both cells (Figure 2C, 2D). In basal level, cell cycle
distributions of MDA-MB-231 cells and MDA-MB-231/IR cells were not distinguishable.
Twenty-four hours of cancer drugs treatment increased the population of cells in sub G1 and
G2/M phase in MDA-MB-231 (Figure 2C, 2D). Population in sub G1 increased from 2.43 ±
0.52% to 11.87 ± 1.23% after treated with 100 nM of adriamycin on MDA-MB-231 cells
whereas population of sub G1 increased from 2.16 ± 0.11% to 3.81 ± 1.39% on MDA-MB-
231/IR cells (Figure 2E). Cisplatin was treated to MDA-MB-231 cells and MDA-MB-231/IR
cells from 50 μM to 200 μM for 24 h. The percentage of cells in sub G1, which indicating
dead cells, elevated only in MDA-MB-231 cells as the concentration went by. After treated
with 100 μM of cisplatin, sub G1 population increased from 4.01 ± 0.28% to 10.91 ± 0.56%
on MDA-MB-231 cells while the population of sub G1 did not changed on MDA-MB-
231/IR cells (Figure 2F). This indicated that treatment of the cancer drugs induced cell death
in MDA-MB-231 cells by increasing sub G1 and apoptosis. To summarize, MDA-MB-
231/IR cells presented chemo-resistance along with radio-resistance.
20
Figure 2. MDA-MB-231/IR developed chemo-resistance compared to parental cell MDA-
MB-231. MTT assay of MDA-MB-231 and MDA-MB-231/IR cells treated with adriamycin
(50- 800 nM, A) and cisplatin (6.25- 100 μM, B) for 24 h. Cell cycle distribution (diagonal
bars: MDA-MB-231, plain bars: MDA-MB-231/IR) and Sub G1 were measured by FACS
after adriamycin (C, E) and cisplatin (D, F) treatment for 24 h using PI staining. Values
represent means ± standard deviation (SD) (* p< 0.05).
21
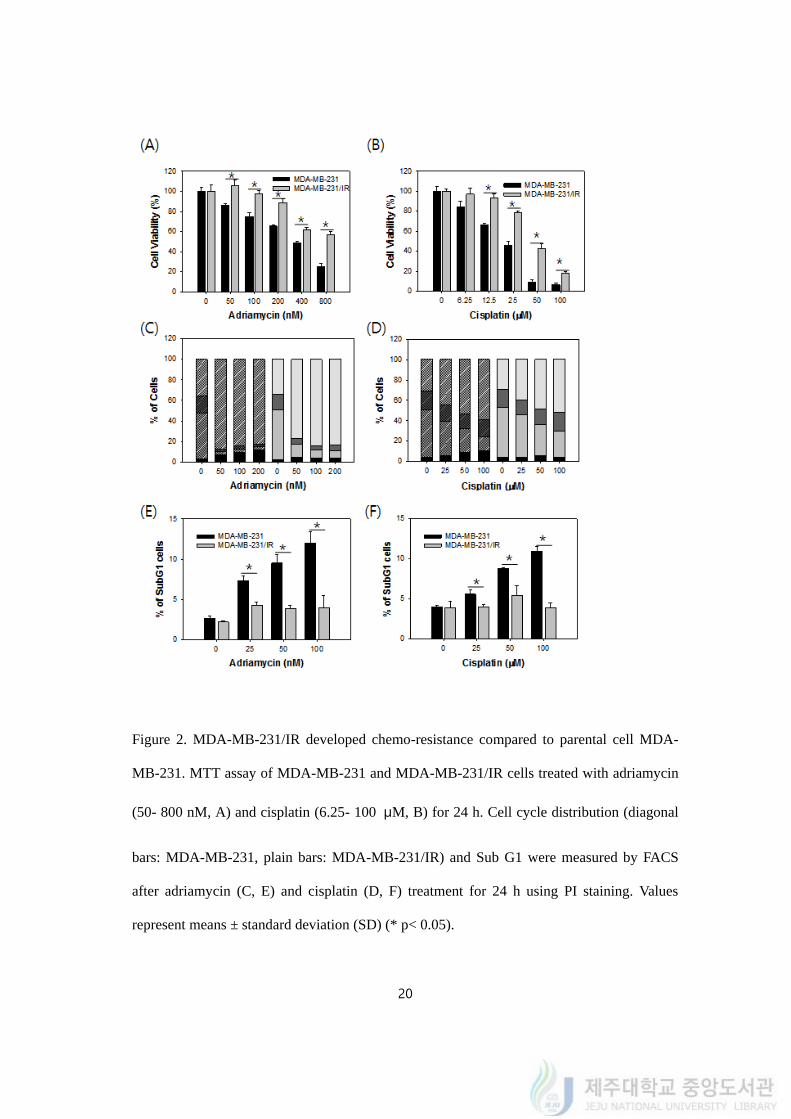
4.3. Chemo- resistance of MDA-MB-231/IR cells evaluated by Annexin V/PI assay
To confirm the chemo-resistance of MDA-MB-231/IR cells, Annexin V/PI assay was
performed to detect apoptosis using flow cytometry (Figure 3). Annexin V/PI assay indicates
apoptotic cells by detecting fluorescence of antigens binds to annexin V and DNA fragment.
The percentage of cells classified as apoptosis increased after treatment of adriamycin and
cisplatin in MDA-MB-231 cells following to the increasing concentration.
MDA-MB-231 and MDA-MB-231/IR cells were treated with adriamycin in a range of
concentration from 62.5 to 250 nM (Figure 3A, 3B). Percentage of apoptotic cells increased
from 7.32 ± 1.25% to 37.81 ± 6.55% in MDA-MB-231 while the percentage increased from
6.51 ± 1.57% to 24.16 ± 3.81% in MDA-MB-231/IR.
Cells were treated with cisplatin in a range of concentration from 50 to 200 μM (Figure
3C, 3D). Percentage of apoptotic cells increased from 4.29 ± 0.33% to 16.93 ± 4.32% in
MDA-MB-231 whereas no statistical change was exhibited in percentage of apoptotic cells
on MDA-MB-231/IR (from 4.52 ± 1.35% to 5.32 ± 1.22%). This indicated that adriamycin
and cisplatin did not induced apoptosis on MDA-MB-231/IR cells as much as MDA-MB-
231 cells. To sum up the results, MDA-MB-231/IR cells had chemo-resistance in adriamycin
and cisplatin as well as radio-resistance.
22
Figure 3. Annexin V/PI assay was performed to investigate chemo- resistance of MDA-MB-
231/IR cells. MDA-MB-231 and MDA-MB-231/IR was treated with adriamycin (A, B) and
cisplatin (C, D) for 24 h (black bars: MDA-MB-231, gray bars: MDA-MB-231/IR). Values
represent means ± standard deviation (SD) (* p< 0.05).
23
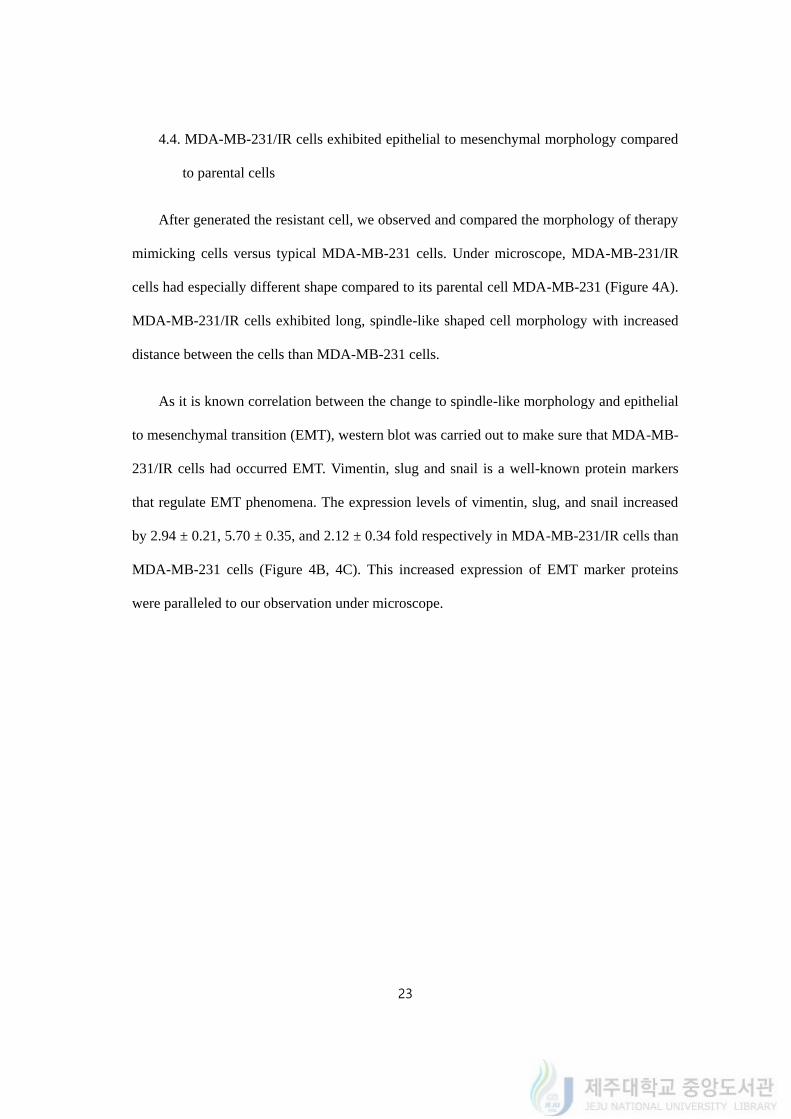
4.4. MDA-MB-231/IR cells exhibited epithelial to mesenchymal morphology compared
to parental cells
After generated the resistant cell, we observed and compared the morphology of therapy
mimicking cells versus typical MDA-MB-231 cells. Under microscope, MDA-MB-231/IR
cells had especially different shape compared to its parental cell MDA-MB-231 (Figure 4A).
MDA-MB-231/IR cells exhibited long, spindle-like shaped cell morphology with increased
distance between the cells than MDA-MB-231 cells.
As it is known correlation between the change to spindle-like morphology and epithelial
to mesenchymal transition (EMT), western blot was carried out to make sure that MDA-MB-
231/IR cells had occurred EMT. Vimentin, slug and snail is a well-known protein markers
that regulate EMT phenomena. The expression levels of vimentin, slug, and snail increased
by 2.94 ± 0.21, 5.70 ± 0.35, and 2.12 ± 0.34 fold respectively in MDA-MB-231/IR cells than
MDA-MB-231 cells (Figure 4B, 4C). This increased expression of EMT marker proteins
were paralleled to our observation under microscope.
24
Figure 4. Comparision of MDA-MB-231 and MDA-MB-231/IR cells in morphology and
expression of EMT marker proteins. The morphology of MDA-MB-231 and MDA-MB-
231/IR was pictured under light microscope (A). Expression levels of EMT-related proteins
were analyzed by western blot. As an internal control, glyceraldehyde 3-phosphate
dehydrogenase (GAPDH) was used (B). The band intensities were quantified using ImageJ
software (C). Values represent means ± standard deviation (SD) (* p < 0.05).
25
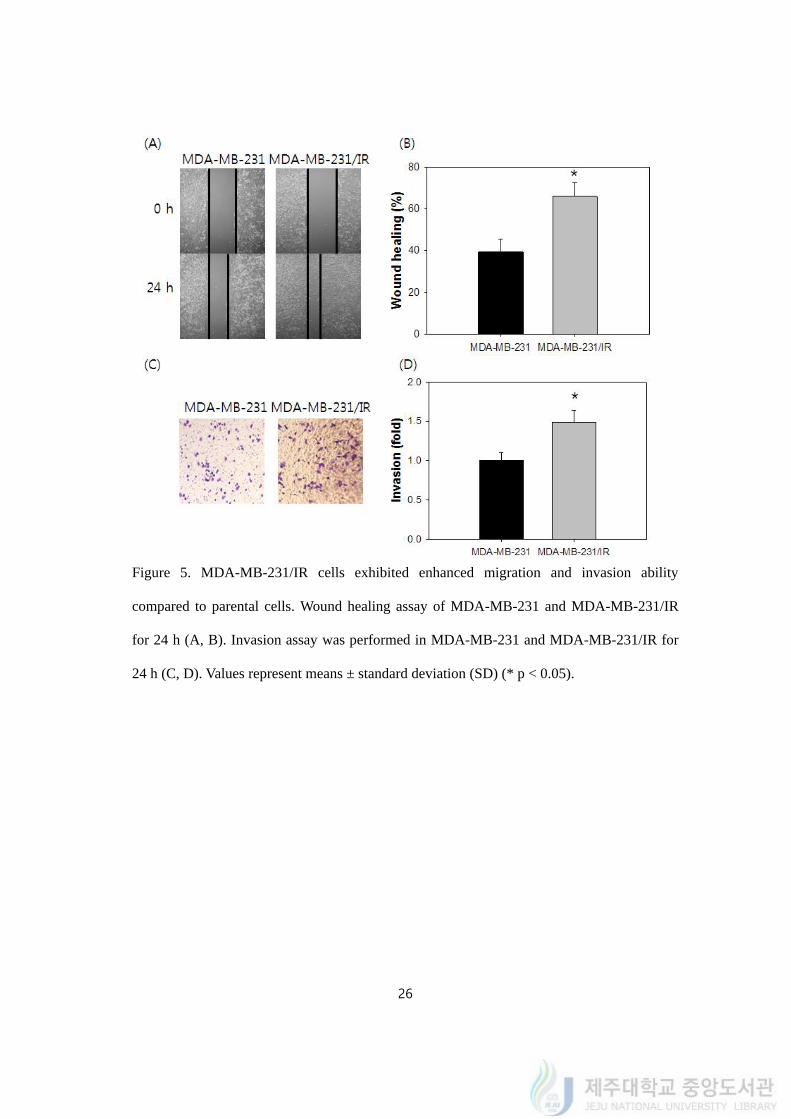
4.5. MDA-MB-231/IR cells exhibited enhanced migration and invasion ability
compared to parental cells
Next, we tested whether MDA-MB-231/IR cells had migration ability by wound healing
assay to determine that MDA-MB-231/IR cells gained EMT phenotype by 50 Gy of
repetitive irradiation. The gap filling rate was determined for 24 h. The 39.55 ± 2.81% of the
gap was closed in MDA-MB-231 cells while 65.85 ± 3.11% of gap was closed in MDA-MB-
231/IR cells (Figure 5A, 5B). The result definitely supported increased spreading and
migrating ability of MDA-MB-231/IR cells than MDA-MB-231 cells.
On top of the migration, invasion assay using transwell system was carried out. Only
invaded cells to other side of chamber’s membrane was collected, fixed and dyed with
crystal violet. Compared to MDA-MB-231 cells, 1.48 ± 0.13 fold more MDA-MB-231/IR
cells moved through the pores of membrane (Figure 5C, 5D). Migration and invasion assays
indicated the metastatic ability has increased in MDA-MB-231/IR cells compared to parental
cells.
26
Figure 5. MDA-MB-231/IR cells exhibited enhanced migration and invasion ability
compared to parental cells. Wound healing assay of MDA-MB-231 and MDA-MB-231/IR
for 24 h (A, B). Invasion assay was performed in MDA-MB-231 and MDA-MB-231/IR for
24 h (C, D). Values represent means ± standard deviation (SD) (* p < 0.05).
27
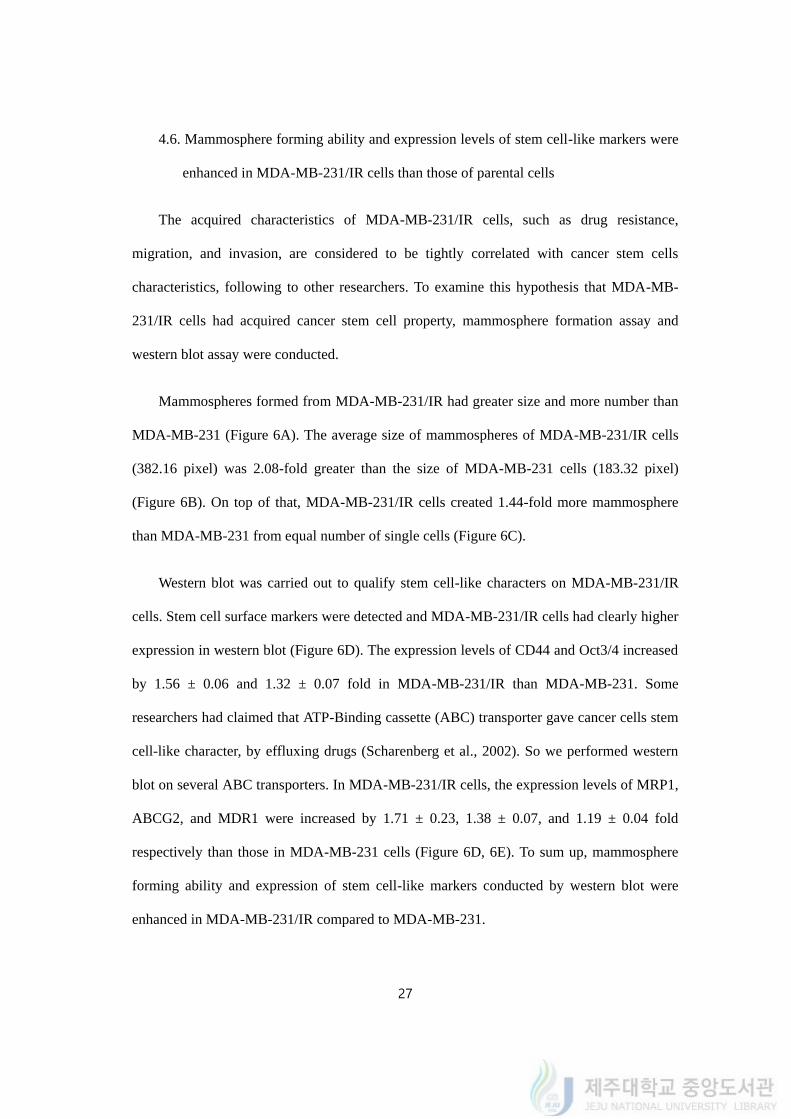
4.6. Mammosphere forming ability and expression levels of stem cell-like markers were
enhanced in MDA-MB-231/IR cells than those of parental cells
The acquired characteristics of MDA-MB-231/IR cells, such as drug resistance,
migration, and invasion, are considered to be tightly correlated with cancer stem cells
characteristics, following to other researchers. To examine this hypothesis that MDA-MB-
231/IR cells had acquired cancer stem cell property, mammosphere formation assay and
western blot assay were conducted.
Mammospheres formed from MDA-MB-231/IR had greater size and more number than
MDA-MB-231 (Figure 6A). The average size of mammospheres of MDA-MB-231/IR cells
(382.16 pixel) was 2.08-fold greater than the size of MDA-MB-231 cells (183.32 pixel)
(Figure 6B). On top of that, MDA-MB-231/IR cells created 1.44-fold more mammosphere
than MDA-MB-231 from equal number of single cells (Figure 6C).
Western blot was carried out to qualify stem cell-like characters on MDA-MB-231/IR
cells. Stem cell surface markers were detected and MDA-MB-231/IR cells had clearly higher
expression in western blot (Figure 6D). The expression levels of CD44 and Oct3/4 increased
by 1.56 ± 0.06 and 1.32 ± 0.07 fold in MDA-MB-231/IR than MDA-MB-231. Some
researchers had claimed that ATP-Binding cassette (ABC) transporter gave cancer cells stem
cell-like character, by effluxing drugs (Scharenberg et al., 2002). So we performed western
blot on several ABC transporters. In MDA-MB-231/IR cells, the expression levels of MRP1,
ABCG2, and MDR1 were increased by 1.71 ± 0.23, 1.38 ± 0.07, and 1.19 ± 0.04 fold
respectively than those in MDA-MB-231 cells (Figure 6D, 6E). To sum up, mammosphere
forming ability and expression of stem cell-like markers conducted by western blot were
enhanced in MDA-MB-231/IR compared to MDA-MB-231.
28
Figure 6. Mammospheres forming ability and expression levels of stem cell-like markers on
MDA-MB-231/IR compared to MDA-MB-231. Representative images were captured under
light microscope (20x and 100x, A). Size of mammospheres (B) and number of
mammospheres (C) were measured by ImageJ software. Western blot was performed for
stem cell-like markers (D). The band intensities were quantified using ImageJ software (E).
Values represent means ± standard deviation (SD) (* p < 0.05).
29
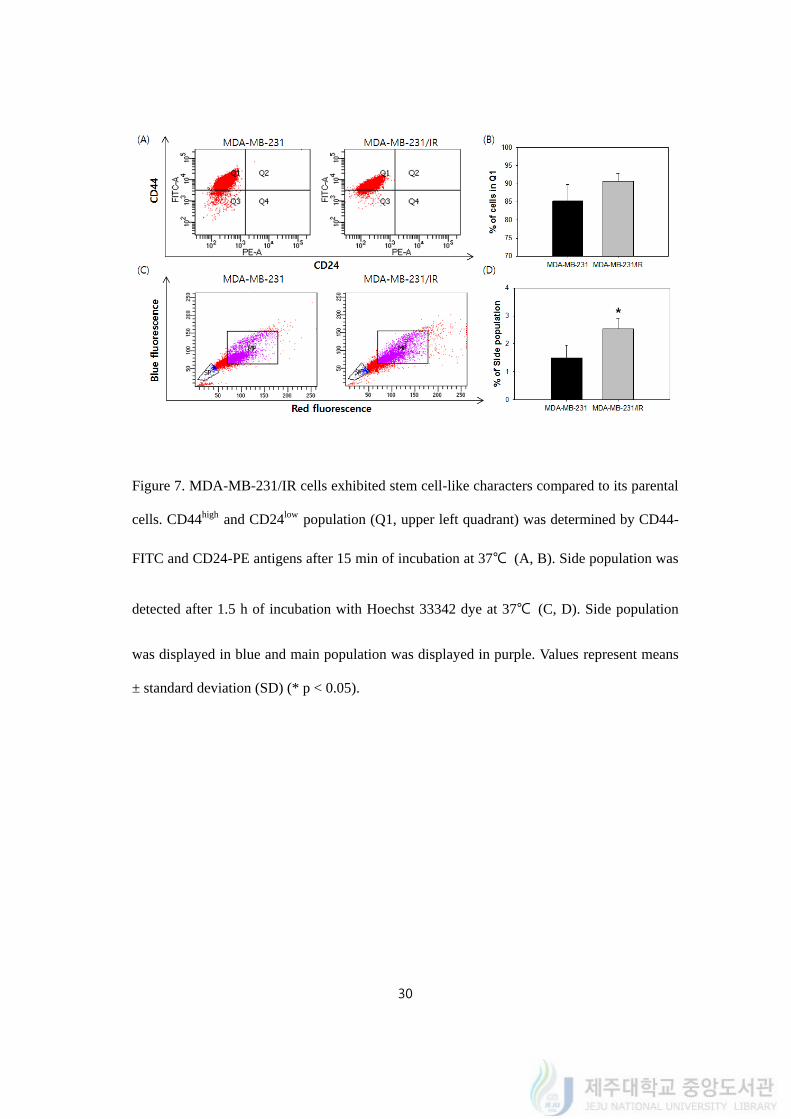
4.7. MDA-MB-231/IR cells exhibited stem cell-like characters compared to its parental
cells
To scrutinize on the aspect of stem cell-like property, FACS was utilized to detect the
expression of cell surface markers of CD44 and CD24 conjugated with FITC and PE. MDA-
MB-231 cells have been reported to have higher CD44high and CD24low cell population (Q1)
among breast cancer cells. According to Li et al., MDA-MB-231 had 99.1% of cells in Q1
while MCF7 had 0.9% of cells in Q1. The Q1 populations of SK-BR-3 and MDA-MB-468
cells were also measured, however, no cell was observed in Q1 (Li et al., 2017). MDA-MB-
231/IR cells showed slightly higher Q1 population compared to their parental cells (Figure
7A, 7B). The percent of cells in Q1 population was 90.05 ± 2.35% in MDA-MB-231/IR
whereas 84.98 ± 4.72% in MDA-MB-231. This result explained that both MDA-MB-231
and MDA-MB-231/IR cells had high percentage of CD44high and CD24low population.
It is also reported that cells classified as side population (SP) could be regarded as stem
cells, so that we carried out an assay to detect side population by using Hoechst 33342. SP
assay is using one of the characters of stem cell is the ability to pump out materials including
drugs and dyes. The percentages of SP in MDA-MB-231 cells and MDA-MB-231/IR cells
were 1.52 ± 0.43% and 2.62 ± 0.38%, respectively (Figure 7C, 7D). It revealed that the
percentage of SP in MDA-MB-231/IR cells increased by 1.72 ± 1.13 fold compared to
parental MDA-MB-231 cells. In conclusion, the results illustrated that MDA-MB-231/IR
cells gained more stem-like property than the parental cells while repetitive radiations as
well as drug- and radio-resistance.
30
Figure 7. MDA-MB-231/IR cells exhibited stem cell-like characters compared to its parental
cells. CD44high and CD24low population (Q1, upper left quadrant) was determined by CD44-
FITC and CD24-PE antigens after 15 min of incubation at 37℃ (A, B). Side population was
detected after 1.5 h of incubation with Hoechst 33342 dye at 37℃ (C, D). Side population
was displayed in blue and main population was displayed in purple. Values represent means
± standard deviation (SD) (* p < 0.05).
31
4.8. Transcriptomics analysis on MDA-MB-231/IR cells
To gain a better understanding of chemo- and radio- resistance, we conducted RNA-seq
to identified differentially expressed genes (DEGs). Total 31,498 transcripts were identified
in this study. In comparison to the gene expression profiles for MDA-MB-231 cells, we
found that 39 DEGs were up-regulated and 38 DEGs were down-regulated than MDA-MB-
231/IR cells (P<0.001, supplementary table 1, 2).
We used DAVID (version 6.8) to visualize the gene regulatory network and pathways
and Gene Ontology to understand how radiation affects the MDA-MB-231 cell lines
transcriptional gene network. From our analysis, we observed NF-κB signaling pathway
(11%), TNF signaling pathway (10%), Toll-like receptor signaling pathway (10%) were
highly regulated (Figure 8A). Gene ontology analysis revealed the biological process
including regulation of cell division (11%), transcription from RNA polymerase II promoter
(22%), and protein phosphorylation (11%) (Figure 8B). Gene ontology cellular component
analysis explains further focal adhesion (12%), nucleoplasm (26%), cytoplasm (39%), and
membrane (16%) were activated in the resistance cells (Figure 8C). ATP (56%), chromatin
(22%), and interleukin-1 (IL-1) receptor (11%) binding are other molecular process highly
regulated (Figure 8D). Taken together, we performed pathway analysis to identify the
enriched pathways from DEGs and GO analysis to find up and down regulated genes
biological function and molecular process.
32
Figure 8. Pathway and Gene Ontology analysis with differentially expressed genes (DEGs)
of MDA-MB-231/IR cells compared to MDA-MB-231 cells. Pathway analysis (A) and Gene
ontology (GO) analysis (B, C, and D) of DEGs of MDA-MB-231/IR cells compared to
MDA-MB-231.
33
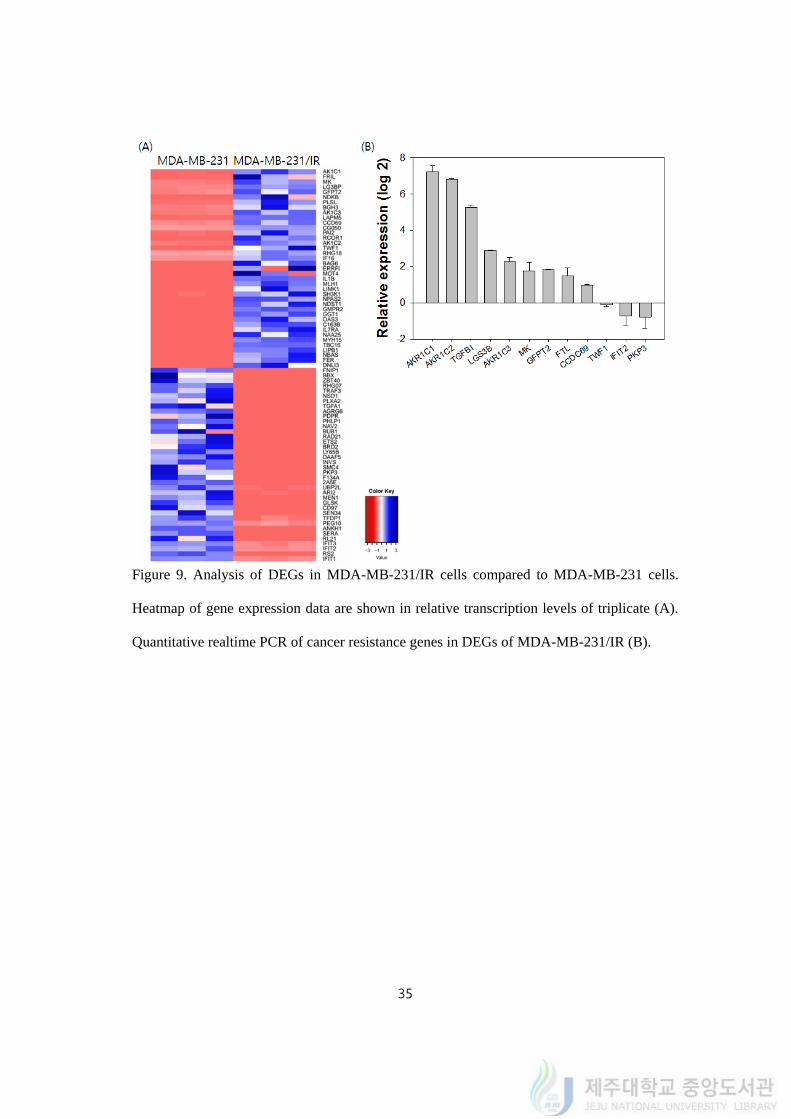
4.9. Cancer resistance was reported in 12 DEGs of MDA-MB-231/IR
To identify roles of those genes in cancer resistance, a literature search was carried out
and 24 genes were identified to be associated with cancer resistance according to previous
reports. Twelve genes that met our standard (difference >10 in up-regulated genes and
difference <(-4) in down-regulated genes) were selected: AKR1C1, FTL, MK, LG3BP,
GFPT2, TGFBI, AKR1C3, CCDC69, AKR1C2, TWF1, PKP3, and IFIT2. We named the 12
genes as cancer resistance genes. The difference in expression levels and fold change of the
genes are shown in Table 1 and their expressions were confirmed by quantitative realtime
PCR in figure 9. The expression levels of genes quantified by realtime PCR were different
from fold changes in transcriptomic analysis. The expression levels of AKR1C1, AKR1C2,
TGFBI, LGS3B, AKR1C3, MK, GFPT2, FTL, CCDC69, TWF1, IFIT2 and PKP3 were
described in log2 fold change (Figure 9B).
34
Table 1. Cancer resistance genes from DEGs of MDA-MB-231/IR cells are described in
difference, fold (log 2), and their functions.
No. Difference Fold
(log2) Gene Full name Role in cancer References
1 97.57 6.83 AKR1C1 Aldo-keto reductase 1C1 Metastasis Zhu et al.,
2018
2 79.67 6.64 FTL Ferritin Light Chain Drug resistance Li et al., 2014
3 77.43 2.92 MK Midkine Metastasis Sun et al.,
2017
4 62.20 6.01 LG3BP Galectin-3-binding protein Anti-
differentiation
White et al.,
2015
5 46.92 3.04 GFPT2 Glutamine-Fructose-6-
Phosphate Transaminase 2 Metabolism
Simpson et
al., 2012
6 42.64 3.34 TGFBI Transforming Growth
Factor Beta Induced Metastasis
Ma et al.,
2008
7 42.35 3.87 AKR1C3 Aldo-keto reductase 1C3 Drug resistance Liu et al.,
2015
8 37.59 2.96 CCDC69 Coiled-Coil Domain
Containing 69 Drug resistance
Cui et al.,
2017
9 14.51 4.13 AKR1C2 Aldo-keto reductase 1C2 Metastasis Buranrat et
al., 2015
10 12.55 Inf TWF1 Twinfilin Actin Binding
Protein 1 Migration
Bockhorn et
al., 2013
11 -4.33 -Inf PKP3 Plakophilin 3 Invasion Takahashi et
al., 2012
12 -85.90 -2.84 IFIT2
Interferon induced protein
with tetratricopeptide
repeats 2
Apoptosis
mediator
Chen et al.,
2018
Inf: infinity, the expression of the gene was not determined.
35
Figure 9. Analysis of DEGs in MDA-MB-231/IR cells compared to MDA-MB-231 cells.
Heatmap of gene expression data are shown in relative transcription levels of triplicate (A).
Quantitative realtime PCR of cancer resistance genes in DEGs of MDA-MB-231/IR (B).
36
4.10. Baicalein effectively targeted chemo- and radio-resistance MDA-MB-231/IR cells
Researchers look for another ways to kill the cancer cells beyond conventional therapy
to target therapy-resistant breast cancer (Hui et al., 2013). Phytochemicals are chemicals
from plants and many of those are known to be benevolent to human health, including anti-
cancer effect. We conducted a research to narrow groups of phytochemicals that have anti-
cancer effect in breast cancer. There were compelling researches that polyphenols and
flavonoids, including flavones and flavonols, are reported to be active chemicals against
breast cancer cells. We searched for phytochemicals that were reported to have effects on
breast cancer cells, and 3 phenolics, 3 flavones, and 4 flavonols were found (Bauer et al.,
2017; Wang et al., 2010; Lee et al., 2005; Kim et al., 2008; Rodgers et al., 1998; Iriti et al.,
2017; Lakshmi et al., 2014; Choi et al., 2018; Yin et al., 2009). Those phytochemicals were
tested for cell viability assay to target therapy resistance MDA-MB-231/IR cells as well as
MDA-MB-231 cells.
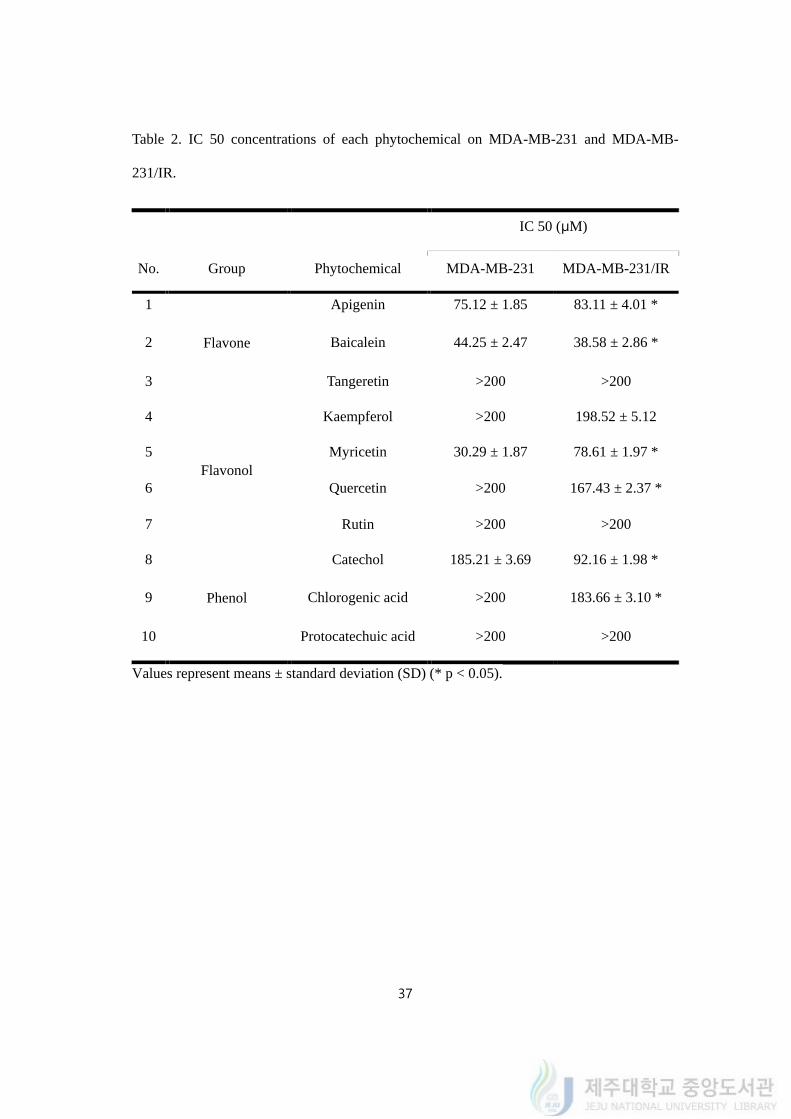
We conducted MTT assay for the test cytotoxic effect of 10 phytochemicals that were
available (Table 2). Among the phytochemicals we tested, apigenin, baicalein, catechol, and
myricetin were found to have IC 50 values in both cells within the tested concentration (0 -
200 μM). IC 50 values of apigenin, baicalein, catechol, and myricetin on MDA-MB-231
cells were 75.12 ± 1.85, 44.25 ± 2.47, 185.21 ± 3.69, and 30.29 ± 1.87 μM, respectively. IC
50 values of the phytochemicals on MDA-MB-231/IR cells were 83.11 ± 4.01, 38.58 ± 2.86,
92.16 ± 1.98, and 78.61 ± 1.97 μM, respectively. Phytochemicals without IC 50 values on
both cells were ejected for further experiment. As baicalein could efficiently target the both
cells with lowest concentration within the compounds we tested, we recruited baicalein for
further experiments.
37
Table 2. IC 50 concentrations of each phytochemical on MDA-MB-231 and MDA-MB-
231/IR.
No. Group Phytochemical
IC 50 (μM)
MDA-MB-231 MDA-MB-231/IR
1
Flavone
Apigenin 75.12 ± 1.85 83.11 ± 4.01 *
2 Baicalein 44.25 ± 2.47 38.58 ± 2.86 *
3 Tangeretin >200 >200
4
Flavonol
Kaempferol >200 198.52 ± 5.12
5 Myricetin 30.29 ± 1.87 78.61 ± 1.97 *
6 Quercetin >200 167.43 ± 2.37 *
7 Rutin >200 >200
8
Phenol
Catechol 185.21 ± 3.69 92.16 ± 1.98 *
9 Chlorogenic acid >200 183.66 ± 3.10 *
10 Protocatechuic acid >200 >200
Values represent means ± standard deviation (SD) (* p < 0.05).
38
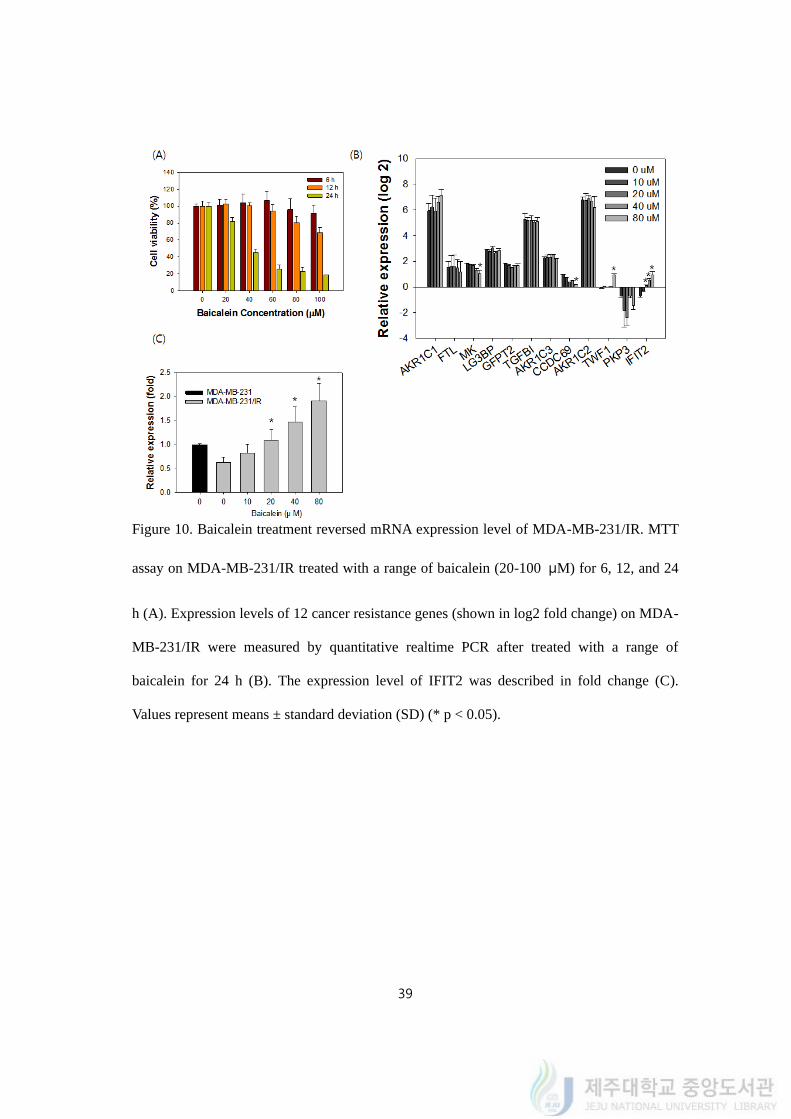
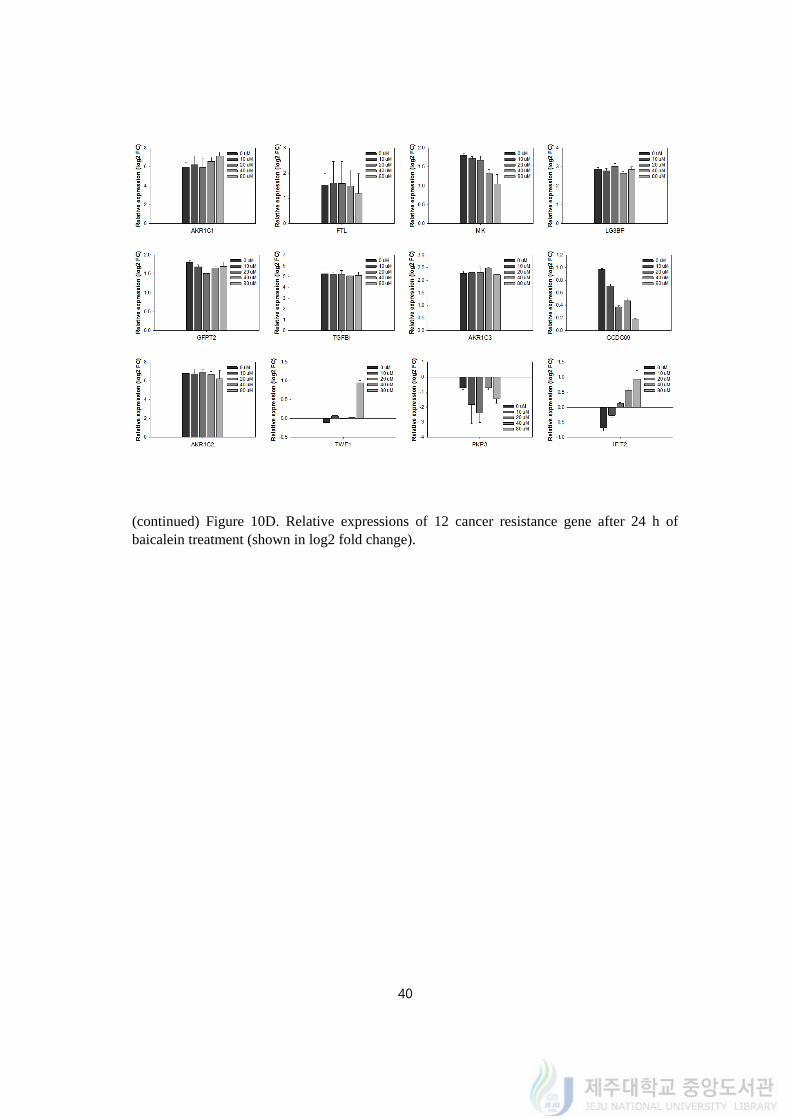
4.11. Baicalein reversed expression of IFIT2 in MDA-MB-231/IR
As baicalein was found to be a competitive phytochemical which could target breast
cancer cells MDA-MB-231/IR, time- and dose- dependent viability assay on MDA-MB-
231/IR cells after baicalein treatment was carried out. As the concentration or the treatment
time went by, the viability of MDA-MB-231/IR significantly decreased (Figure 10A). Cell
viability of MDA-MB-231/IR decreased from 78.24 ± 2.54 to 16.72 ± 0.11% after 24 h of
baicalein treatment (20-100 μM). Cell viabilities of MDA-MB-231/IR were diminished by
102.11 ± 9.82, 98.03 ± 2.28, and 43.25 ± 3.93% after treated with 40 μM of baicalein for 6,
12, and 24 h. We hypothesized that baicalein can kill MDA-MB-231/IR cell by targeting
cancer resistance genes that were detected by transcriptomics analysis. With 12 of cancer
resistance genes we identified from transcriptomic analysis, we performed realtime-PCR to
figure out if baicalein could reverse the expression within the genes. Since their expression is
tightly connected to cancer resistance, we thought that baicalein could also convert the gene
expression level compared to the level of MDA-MB-231 cells, from higher to lower level or
vice versa. The expression levels of cancer resistance genes were measured by quantitative
realtime PCR with or without a range of baicalein treatment (10- 80 μM) (Figure 10B).
Only the expression of IFIT2 has changed among 12 cancer resistance genes; the expression
was lower (0.63 ± 0.09 fold) than MDA-MB-231 in the condition without baicalein
treatment but it has risen to 1.86-fold after 80 μM of baicalein treatment (1.82 ± 0.39 fold)
(Figure 10C). The mRNA expression of IFIT2 increased baicalein treatment dose-
dependently. Taken together, baicalein target MDA-MB-231/IR cells while reversing the
expression of one of the cancer resistance genes, IFIT2.
39
Figure 10. Baicalein treatment reversed mRNA expression level of MDA-MB-231/IR. MTT
assay on MDA-MB-231/IR treated with a range of baicalein (20-100 μM) for 6, 12, and 24
h (A). Expression levels of 12 cancer resistance genes (shown in log2 fold change) on MDA-
MB-231/IR were measured by quantitative realtime PCR after treated with a range of
baicalein for 24 h (B). The expression level of IFIT2 was described in fold change (C).
Values represent means ± standard deviation (SD) (* p < 0.05).
40
(continued) Figure 10D. Relative expressions of 12 cancer resistance gene after 24 h of
baicalein treatment (shown in log2 fold change).
41
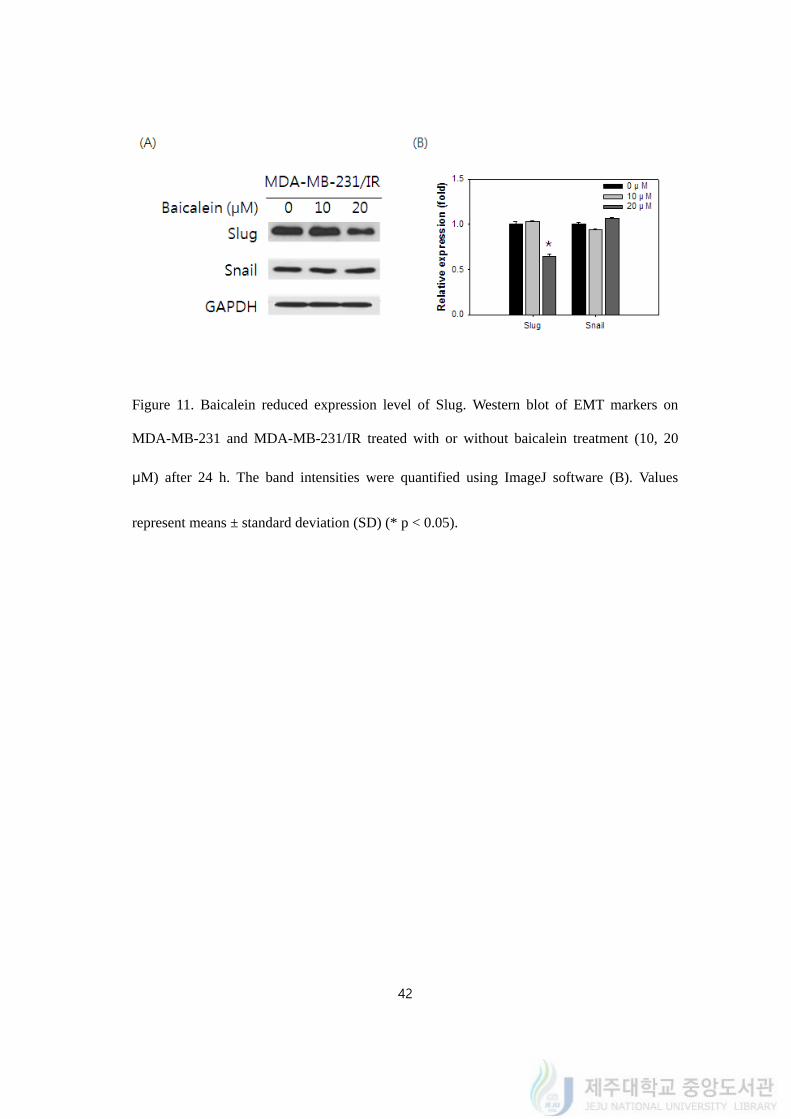
4.12. Baicalein reduced protein expression level of Slug
It is confirmed that baicalein treatment on MDA-MB-231/IR, we tried to find that the
baicalein treatment could reverse the characters of MDA-MB-231/IR cells. As we tested
above, MDA-MB-231/IR cells have been shown EMT characteristics higher than its original
cells. After treating different concentration of baicalein, we tested whether the treatment
could change them.
To figure out the change of phenotype to EMT of MDA-MB-231/IR cells, western blot
of EMT markers was carried out after baicalein treatment (10, 20 μM) (Figure 11A). The
protein expressions of Slug and Snail on MDA-MB-231/IR were higher compared to those
of MDA-MB-231 cells. While the protein expression of Snail did not changed after 10 and
20 μM of baicalein treatment, the expression of Slug was greatly changed following to
baicalein treatment. Twenty μM of baicalein diminished the expression level of Slug by 0.65
± 0.02 fold after 24 h (Figure 11B). The reduced expression level of Slug indicated the
possibility of diminished EMT phenomena.
42
Figure 11. Baicalein reduced expression level of Slug. Western blot of EMT markers on
MDA-MB-231 and MDA-MB-231/IR treated with or without baicalein treatment (10, 20
μM) after 24 h. The band intensities were quantified using ImageJ software (B). Values
represent means ± standard deviation (SD) (* p < 0.05).
43
4.13. Baicalein inhibited EMT capacity of MDA-MB-231/IR
Wound healing assay was conducted after 10 and 20 μM of baicalein treatment for 24 h
to demonstrate the effect of baicalein on EMT phenomena on MDA-MB-231/IR cells
(Figure 12A). Ten and 20 μM of baicalein treatment reduced the wound closure rate of
MDA-MB-231/IR cells by 0.84 ± 0.03 and 0.61 ± 0.05% compared to the cells without
baicalein treatment (Figure 12B). On top of the wound healing assay, invasion assay with
transwell system was carried out after 24 h of baicalein treatment (Figure 12C). Compared to
cells without baicalein treatment, 5, 10, and 20 μM of baicalein treatment decreased the
invasion of MDA-MB-231/IR cells by 0.78 ± 0.22, 0.65 ± 0.27, and 0.43 ± 0.19 fold,
respectively (Figure 12D).
44
Figure 12. Baicalein treatment inhibited EMT capacity of MDA-MB-231/IR. Wound healing
assay on MDA-MB-231/IR treated with or without baicalein 10 or 20 μM for 24 h (A, B).
Invasion assay on MDA-MB-231/IR treated with or without baicalein 5, 10, or 20 μM for
24 h (C, D). Values represent means ± standard deviation (SD) (* p< 0.05).
45
4.14. Baicalein diminished the mammosphere formation and expression of marker
proteins in MDA-MB-231/IR
Stem cell-like characters are one of the characteristic features of MDA-MB-231/IR cells
in comparison with MDA-MB-231 cells. Mammosphere formation was used to examine the
stem cell markers of MDA-MB-231/IR cells after baicalein treatment. The size of the
mammospheres of MDA-MB-231/IR cells shrunk as baicalein concentration increased
(Figure 13A). The number of mammosphere was also reduce from 56.24 ± 2.56% to 12.27 ±
6.31% by 5 to 20 μM of baicalein treatment (Figure 13B).
To examine the stem cell-like character with or without baicalein treatment, western blot
was performed. The expression of stem cell-like character markers, ABCG2 and Oct3/4,
which were highly expressed in MDA-MB-231/IR decreased after 20 to 80 μM of baicalein
treatment (Figure 13C). The expression levels of Oct3/4 and ABCG2 diminished from 0.52 ±
0.04 to 0.19 ± 0.02 fold and from 0.94 ± 0.07 to 0.46 ± 0.03 fold after baicalein treatment (40
to 80 μM) (Figure 13D). Baicalein inhibited stem cell-like characteristics of MDA-MB-
231/IR.
46
Figure 13. Baicalein treatment diminished mammosphere formation and expression of stem
cell-like marker proteins in MDA-MB-231/IR. Mammosphere formation of MDA-MB-
231/IR after 24 h of baicalein treatment (5 to 20 μM) (A). The number of mammosphere
was measured by ImageJ software (B). Expressions of Oct3/4 and ABCG2 after 24h of
baicalein treatment (20 to 80 μM) (C). The band intensities were quantified using ImageJ
software (D). Values represent means ± standard deviation (SD) (* p < 0.05).
47
4.15. Baicalein diminished the stem cell-like characters of MDA-MB-231/IR
For FACS analysis, the distributions of cell surface markers on MDA-MB-231/IR cells
were measured after baicalein treatment. The percentage of CD44high and CD24low cells (Q1)
was diminished following to reduction of CD44 expression after baicalein treatment (Figure
14A). Baicalein treatment (from 20 to 80 μM) decreased the population of Q1 from 0.95 ±
0.03 to 0.57 ± 0.08 fold after 24 h (Figure 14B). SP assay using Hoechst 33342 was also
conducted after baicalein treatment (Figure 14C). The percentage of SP was also decreased
by 0.50 ± 0.03, 0.46 ± 0.03, and 0.37 ± 0.02 fold after baicalein treatment of 20, 40, and 80
μM (Figure 14D). To sum up, baicalein treatment on MDA-MB-231/IR reduced stem cell-
like properties of MDA-MB-231/IR cells.
48
Figure 14. Baicalein diminished stem cell-like characters of MDA-MB-231/IR. CD44high and
CD24low population (Q1, upper left quadrant) was determined by CD44-FITC and CD24-PE
antigens after 15 min of incubation at 37℃ (A, B). Side population was detected after 1.5 h
of incubation with Hoechst 33342 dye at 37℃ (C, D). Side population was displayed in blue
and main population was displayed in purple. Values represent means ± standard deviation
(SD) (* p < 0.05).
49
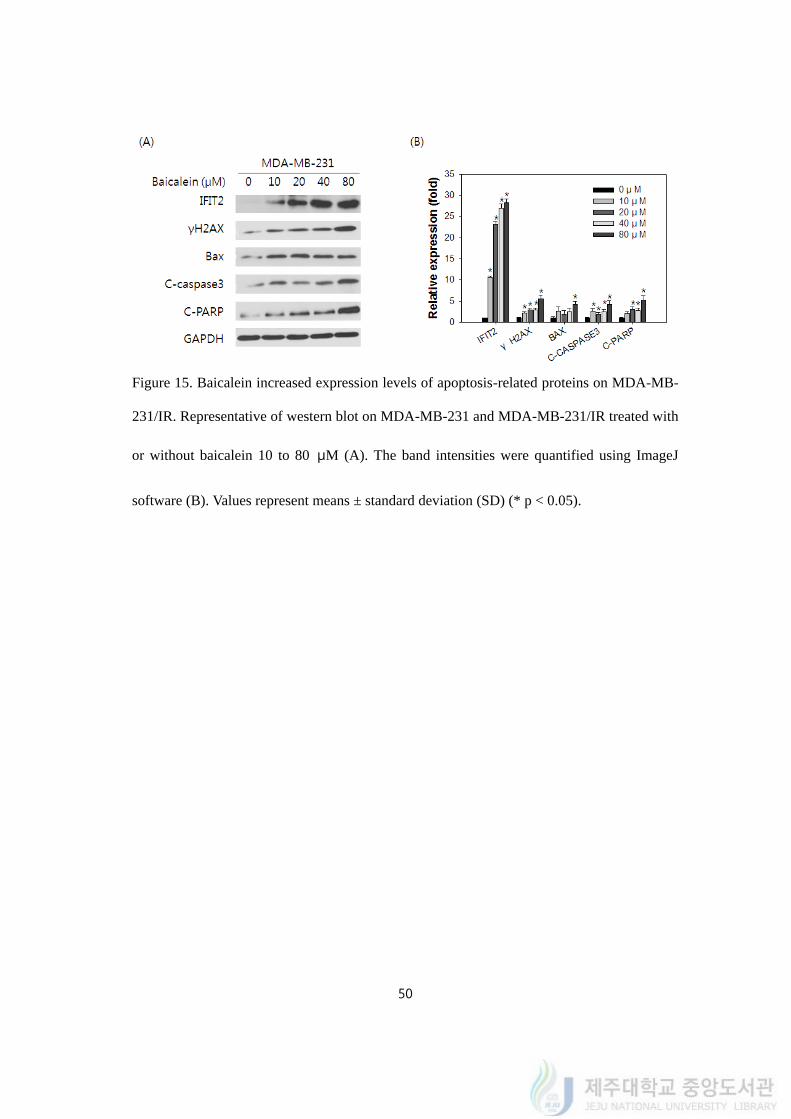
4.16. Baicalein increased expression levels of apoptosis-related proteins on MDA-MB-
231/IR
Baicalein was known to kill cancer cells through apoptosis, so we carried out several
experiments to confirm that MDA-MB-231/IR cells could be affected by baicalein in
apoptosis. We prepared western blot to detect apoptosis markers when baicalein was treated
on MDA-MB-231/IR. The expression of IFIT2 and several apoptosis-related antigens were
utilized. For apoptosis, the expression of γ-H2A histone family member X (γ-H2AX), Bax,
cleaved (C) - caspase 3 and cleaved (C) - poly (ADP-ribose) polymerase (PARP) were
detected by western blot. DNA damage was measured using gamma-H2AX, proapoptotic
marker Bax, and activation of apoptosis indicators caspase 3 and PARP were evaluated by
the analysis. Protein expressions of IFIT2 and apoptosis markers have increased by baicalein
treatment in dose dependent manners (Figure 15A). Baicalein treatment from 10 to 80 μM
increased the expression level of IFIT2 (~28.24 ± 0.90 fold), gamma-H2AX (~5.47 ± 0.91
fold), Bax (~4.20 ± 0.67 fold), C-caspase3 (~4.20 ± 0.90 fold), and C-PARP (~5.23 ± 0.95
fold) (Figure 15B).
50
Figure 15. Baicalein increased expression levels of apoptosis-related proteins on MDA-MB-
231/IR. Representative of western blot on MDA-MB-231 and MDA-MB-231/IR treated with
or without baicalein 10 to 80 μM (A). The band intensities were quantified using ImageJ
software (B). Values represent means ± standard deviation (SD) (* p < 0.05).
51
4.17. Baicalein induces apotosis on MDA-MB-231/IR cells
The results of Annexin V/PI binding assay demonstrated that baicalein induced
apoptosis following to its concentration went by (Figure 16A). Percent of cells in apoptosis
had elevated from 7.48 ± 3.42 % to 22.53 ± 5.21% times after 24 h baicalein treatment from
20 to 80 μM (Figure 16B). Cell cycle analysis also indicated that baicalein treatment from
20 to 80 μM increased sub G1 population from 4.58 ± 1.53 to 14.28 ± 0.41% (Figure 16C).
To scrutinize the apoptosis occurred in MDA-MB-231/IR cells, JC-1 staining was
performed by FACS analysis to investigate changes of mitochondrial membrane potential. As
concentration of baicalein increased from 10 to 80 μM, we observed a shift from red to
green fluorescence, indicating the mitochondrial membrane depolarization. The ratio green
versus red fluorescence increased from 8.32 ± 3.51% to 23.24 ± 4.81% (Figure 16D). This
result indicates that baicalein kills MDA-MB-231/IR cells in apoptosis by decreasing
membrane potential of mitochondria. According to previous reports (Stawowczyk et al.,
2011), IFIT2 is also reported to induce apoptosis through lowering mitochondrial membrane
potential and we hypothesized that baicalein- induced apoptosis through intrinsic pathway
has mediated through increasing the protein expression of IFIT2.
52
Figure 16. Baicalein induces apotosis on MDA-MB-231/IR cells. Annexin V/PI assay on
MDA-MB-231/IR treated with or without baicalein 20 to 80 μM for 24 h (A, B). Population
in sub G1 on MDA-MB-231/IR with or without baicalein 20 to 80 μM for 24 h (C). JC-1
assay on MDA-MB-231/IR with or without baicalein 10 to 80 μM for 24 h (D). Values
represent means ± standard deviation (SD) (* p < 0.05).
53
4.18. Baicalein co-treatment reversed radio- resistance in MDA-MB-231/IR
As baicalein treatment killed the radio- resistance cells and increased the transcriptional
and protein expressions of IFIT2, we performed assays to find if this phytochemical can
reverse resistance property of cells.
Combination treatment of baicalein with radiation was performed by clonogenic assay.
Ten μM of baicalein treatment decreased colony formation of MDA-MB-231/IR cells
(Figure 17A). After 2 and 4 Gy of irradiation, 10 μM of baicalein reduced the surviving
fraction from 0.94 to 0.54 and from 0.67 to 0.18 (Figure 17B).
In conclusion, baicalein treatment with irradiation exhibited that the combined treatment
increased the effects of radiation treatments on radio- resistant MDA-MB-231/IR cells.
54
Figure 17. Baicalein co-treatment reversed radio- resistance in MDA-MB-231/IR cells.
Representative image of clonogenic assay on MDA-MB-231/IR after 2 and 4 Gy of
irradiation with or without 10 μM of baicalein treatment (A). Surviving fraction calculated
from numbers of colonies on Figure 17A counted by NICE (B). Values represent means ±
standard deviation (SD) (* p < 0.05).
55
4.19. Baicalein co-treatment reversed chemo- resistance in MDA-MB-231/IR
We co-treated baicalein with several anti-cancer drugs for MTT assay. The combination
index (CI) value was calculated by software Calcusyn (Biosoft, UK), which offers
synergistic effects of the two different treatments in 3 different categories: additive (CI value
= 1), synergism (CI value < 1), or antagonism (CI value > 1).
When 5 to 20 μM of baicalein were treated with drugs, the viability of MDA-MB-
231/IR cells decreased compared to viabilities of single treatment of baicalein or anti-cancer
drugs. Co-treatment of baicalein and adriamycin gave CI values less than 1 in tested
combinations generally (Figure 18A). Especially, co-treatment with 20 μM of baicalein and
100 nM of adriamycin exhibited the lowest CI value (0.40) in this combinations which
interpreted as synergism (Figure 18A). Co-treatment of baicalein with cisplatin was
conducted by MTT assay (Figure 18C). Co-treatment of baicalein and cisplatin gave CI
values less than 1 when 10 to 15 μM of baicalein was treated (Figure 18D). Combination of
15 μM of baicalein with 40 μM of cisplatin displayed the lowest CI value (0.32) in this co-
treatment.
As a results, baicalein treatment with anti-cancer drugs exhibited synergistic effect on
chemo- resistant MDA-MB-231/IR cells.
56
Figure 18. Baicalein co-treatment reversed chemo- resistance in MDA-MB-231/IR cells.
Adriamycin (12.5 to 100 nM) was treated on MDA-MB-231/IR with baicalein (10, 20 μM)
for 24 h (A). Combination index (CI) value of adriamycin with baicalein was calculated by
Calcusyn software (B). Cisplatin (5 to 40 μM) was treated on MDA-MB-231/IR with
baicalein (5, 10, 150 μM) for 24 h (C). CI value of cisplatin with baicalein was calculated
(D). Values represent means ± standard deviation (SD) (* p < 0.05).
57
4.20. The expression of IFIT2 affects survival in patients
To figure out the importance of IFIT2, we compared the relationship of the IFIT2 and
related genes expression to survival rate of triple negative breast cancer (TNBC) patients by
Kaplan-Meier plotter (www.kmplot.com). Using publicly available database, relapse free
survival graphs were analyzed by genes expression. To begin with, we performed to create
curves that were interpreted as lower IFIT2 expressing patients were related to poor
prognosis by lower relapse free survival (RFS), compared to higher expressing TNBC
patients (n = 618, Log rank p-value = 0.014, HR = 0.72, probe id: 217502_at; Figure 19A).
We also utilized UCSC Xena (https://xenabrowser.net/) and with the cohort of TCGA
Breast Cancer from open database, the expression of IFIT2 was decreased in the metastatic
type of breast cancer rather than primary tumor or normal tissue (n = 1247, ANOVA One-
way, p value = 0.0014, f = 6.593; Figure 19B).
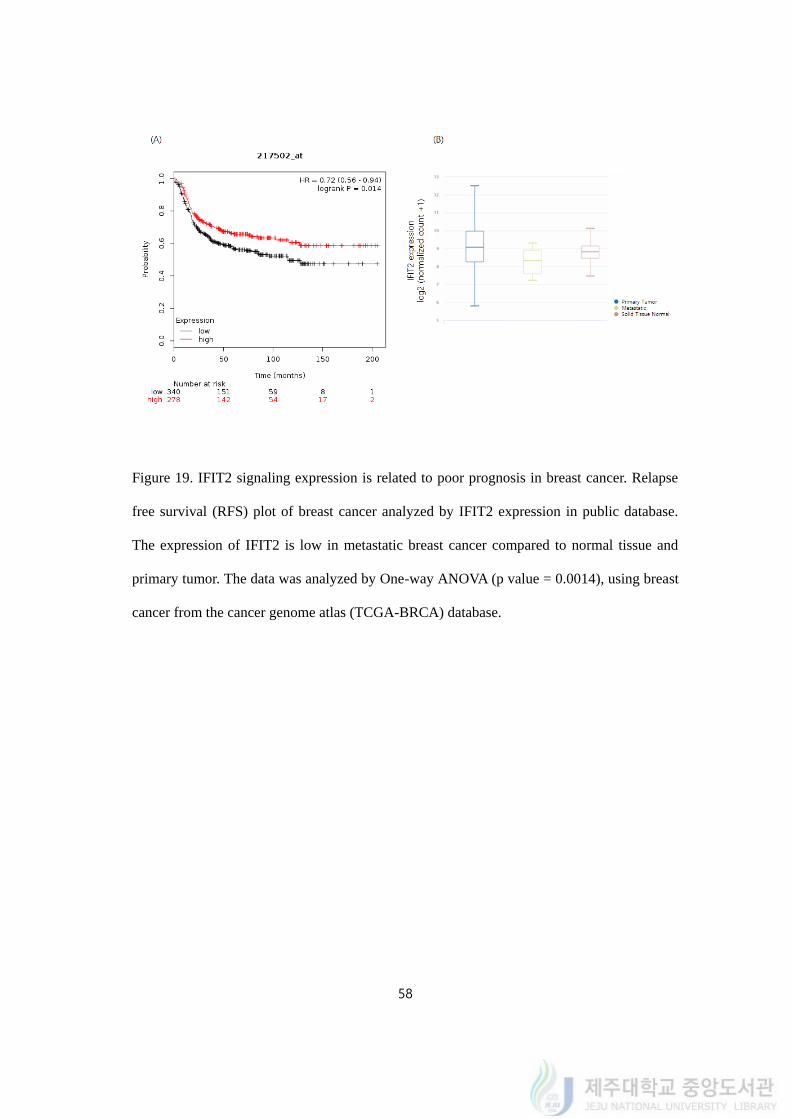
58
Figure 19. IFIT2 signaling expression is related to poor prognosis in breast cancer. Relapse
free survival (RFS) plot of breast cancer analyzed by IFIT2 expression in public database.
The expression of IFIT2 is low in metastatic breast cancer compared to normal tissue and
primary tumor. The data was analyzed by One-way ANOVA (p value = 0.0014), using breast
cancer from the cancer genome atlas (TCGA-BRCA) database.
59
5. Discussion
Treating breast cancer is still a challenge in spite of the advance in various treatments
including surgery, chemotherapy, and radiotherapy. TNBC is a type of breast cancer that
characterized by absence of ER, PR, and HER2 which could be target molecules of chemo-
or hormone- therapy. Since TNBC is the most malignant subtype with heterogeneous
composition of cells, there have been trials to induce TNBC cell death with a treatment of
phytochemicals.
Phytochemicals are compounds found in nature, for example, plants or fruits.
Flavonoids are one of the subclass of polyphenols of phytochemicals and they are well-
known to be beneficent for human health including anti-cancer effect. Flavonols have a
hydroxyl group on the 3-position of the C3 ring and previous studies have concluded that the
intake of flavonols along with flavones decreased a risk breast cancer (Hui et al., 2013).
We used 10 phytochemicals (3 phenolics, 3 flavones, and 4 flavonols) to test viability on
MDA-MB-231/IR. For phenolics, catechol, chlorogenic acid, and protocatechuic acid were
used. Apigenin, baicalein, and tangeretin included flavones while kaempferol, myricetin,
quercetin, and rutin were belonged to flavonols. Catechol inhibited Stat3/IL-6 signaling
pathway and reduced mammosphere formation of breast cancer stem cell derived from
MDA-MB-231 (Choi et al., 2018). Chlorogenic acid, along with caffeic acid, partially
inhibited the promoter region methylation of RARb gene on MCF-7 and MDA-MB-231 cells
(Lee et al., 2005). Protocatechuic acid treatment lowered the levels of IL-6 and IL-8 and
VEGF production on MCF-7 as well as A549, HeLa, and HepG2 cells (Yin et al., 2009).
Apigenin targeted TNFα/IL-1α-induced CCL2 release by inhibiting IKBK-ε signaling in
MDA-MB-231 breast cancer cells (Bauer et al., 2017). Tangeretin exhibited anti-tumorigenic
effects (Lakshmi et al., 2014). Kaempferol induced apoptosis inhibiting ERK activation
60
under 3D culture environment and conventional 2D condition on breast cancer (Kim et al.,
2008). Myricetin induced apoptosis through ERK1/2 and p38 MAPK on breast cancer cells
(Knickle et al., 2018). Quercetin down-regulated ALDH1A1, CXCR4, MUC1, and EpCAM
and inhibited breast cancer cells (Wang et al., 2018). Baicalein is the main flavone from the
roots of Scutellaria baicalensis Georgi and is a widely used medicine. We expected that this
compound could be one of potential chemicals targeting TNBC cells.
In this study, we found that baicalein shows effects on resistant TNBC cells which we
generated from repetitive irradiation, MDA-MB-231/IR. Baicalein reversed not only chemo-
and radio- resistance, but also migration, invasion, and stem cell-like properties of the
resistant breast cancer cells. While inducing apoptosis on the resistance cells, baicalein also
increased the mRNA expression and protein expression of one of cancer resistance genes we
identified from transcriptomics analysis of MDA-MB-231/IR cells. The gene is IFIT2 and it
has been reported that the expression of IFIT2 induces apoptosis by disturbing mitochondria
membrane potential. We confirmed the previous reports of apoptosis induction through
conducting Annexin V/PI, JC-1, and cell cycle analysis after treatment of baicalein.
Interferon- induced protein with tetratricopeptide repeats 2 (IFIT2), also called
interferon- stimulated gene 54 (ISG54), is one of the four proteins in human characterized by
a helix-turn-helix motif (Blatch et al., 1999). IFIT1 and IFIT2 had reported to inhibit mRNA
translation and viral mRNA structure by recognizing the lacking O-methylation by
interacting with eukaryotic initiation factor 3 (eIF3) (Pichlmair et al., 2011; Zhou et al.,
2013). Besides, IFIT2 expression has also been reported to inhibit growth and migration of
cancer cells. The increase of IFIT2 expression is reported to happen simultaneously to the
induction of apoptosis different stimuli, such as interferon, LncRNAs, miRNAs, and
cisplatin, in oral cancer cells, gastric cancer cells, colorectal cancer cells, and osteosarcoma
61
cells (Jia et al., 2016; Wang et al., 2016; Feng et al., 2014). IFIT2 can also interact with β-
tubulin or cytokeratin 18, and regulate cell mitosis or cell motility (Lai et al., 2008; Saha et
al., 2006).
Among DEGs which were reported to cancer resistance, only IFIT2 expression was
changed after baicalein treatment, which was the most effective phytochemical that we used
to kill MDA-MB-231/IR cells. We carried out gene correlation analysis between IFIT2 and
genes associated with EMT, stem cell-like character and apoptosis with breast cancer (BRCA)
sample in the cancer genome atlas (TCGA). We started with several genes related to
migration. Among genes we tested, CXCL10 and VIM were significantly correlated to IFIT2.
CXCL10 is chemokine interferon-gamma inducible protein 10 kDa, a member of the CXC
chemokine family. CXCL10 is related to inflammation, tumor development, apoptosis and
metastasis. The protein is reported to significantly increase apoptotic rate of cancer cells and
associated with inhibit migration by regulating JAK2/STAT3 signaling. Vimentin is a
structural protein encoded by the VIM gene, and is expressed in mesenchymal cells. This
gene is used as a EMT marker during metastatic progression. With 1,075 TCGA-BRCA
samples, we performed Pearson analysis and calculated p-value. The results are described on
supplementary table 3. The expression of CXCL10 was correlated with IFIT2 (Pearson:
0.3523, P-value: 9.10E-33) while expression of VIM was negatively correlated with the gene
(Pearson: -0.0674, P-value: 2.70E-02).
Next, we checked the expression of apoptosis genes with IFIT2. Most of the CASP
genes which encode caspases proteins were positively expressed with IFIT2, which
confirmed the previous reports that the expression of IFIT2 is associated with apoptosis
phenomena (CASP1, CASP5, CASP4, CASP8, CASP7 and CASP3). Also, we performed
the analysis with Bcl-2 family proteins, however, only BAK was correlated with IFIT2
62
within significant p-value.
To sum up, we summarized that IFIT2 is one of the genes of highly annotated pathway
of the therapy resistant cell, which is MDA-MB-231/IR, and the expression of IFIT2 was
confirmed to be co-expressed with the signaling in breast cancer database from the patients.
The expression of IFIT2 is negatively related to cancer migration and invasion whereas it is
positively co-expressed with apoptosis signaling in TCGA analysis. Collectively, our data
indicated that IFIT2 could be utilized as a prognostic marker in breast cancer.
Upon pathway analysis, to scrutinize the signal that regulates mRNA expression of
IFIT2, we utilized opened data from TCGA (the cancer genome atlas, NIH) and compared
correlations between IFIT2 and other genes to test if IFIT2 can represent resistance
properties of MDA-MB-231/IR. Since it is reported that the mRNA expression of IFIT2 is
regulated by JAK/STAT signaling and Wnt/β-catenin signaling, we tested if the increased
IFIT2 expression after baicalein treatment was regulated by JAK/STAT signaling or Wnt/β-
catenin signaling. We performed Pearson correlation analysis between IFIT2 and those
signaling molecules on supplementary table 3.
JAK/STAT signaling is one of the signaling that stimulated by IFNs (interferons). The
correlation with IFIT2 and STATs were very significantly correlated; STAT1, STAT2, STAT3,
STAT4, and STAT5A were positively expressed according to IFIT2. Especially, STAT1 and
STAT2 were highly correlated with IFIT2, which confirming previous researches that IFIT2
is transcriptionally regulated with those genes. IFNs stimulate JAKs and STATs and lead to
dimer of STATs and go into nucleus for transcription. Meanwhile, IRFs are known to bind to
STATs-dimer; for example, IRF9 is known to bind STAT1-STAT2 dimers and form ISGF3
(interferon stimulated gene factor 3) complex to bind to the ISRE (interferon stimulated
63
response element) promoter to induce ISGs (interferon stimulated genes) which include
IFIT2. Since, we also performed comparisons of IRFs with IFIT2. Although IRF9 is well
known factor, IRF7, IRF1, IRF2, and IRF5 were also co-expressed with the expression of
IFIT2, which supporting that other IRFs can transcript ISRE-containing genes. One of genes
that were transcript by STATs is SOCS (suppressor of cytokine signaling, also called CIS;
cytokine induced STAT inhibitor) which gives feedback to JAK/STAT signaling. Both
SOCS1 and SOCS3 are reported to contain JAK kinase inhibitory region (KIR) and inhibits
JAK to phosphorylate STATs. The expressions of SOCS1 and IFIT2 are the downstream
genes of STAT1 and STAT2, the two genes were positively correlated. Within the genes
belongs to Wnt/β-catenin signaling, DVL1, DVL2, and DVL3 were correlated to IFIT2 at p-
value<0.05. The role of DVLs (the human homolog of the Drosophila gene, dishevelled; Dsh)
is inhibiting APC/AXIN/GSK3-β from degradation of β-catenin by Wnt signaling. On
TCGA-BRCA (breast cancer) samples, IFIT2 was negatively correlated with DVL1 or DLV2,
which means that Wnt/β-catenin signaling and the expression of IFIT2 were negatively
regulated. Once β-catenin is activated, it is reported that it transcripts downstream genes that
are often expressed in stem cell. Using Kaplan-Meier plotter, we confirmed
IFN/JAK/STAT/IFIT2 signaling in TNBC patients (Supplementary figure 1). The lower
expressions of IFNB (Log rank p value = 0.00023, HR = 0.6), JAK1 (Log rank p value =
0.01, HR = 0.65), JAK2 (Log rank p value = 0.0013, HR = 0.66), STAT1 (Log rank p value
= 4.2e-10, HR = 0.44), and STAT2 (Log rank p value = 1.2e-05, HR = 0.57) had
accompanied with poor prognosis in TNBC patients.
Here we investigated whether baicalein could change the expression of IFIT2 and it
reversed the expression of IFIT2 in mRNA level and protein level. Also baicalein treatment
64
which inversed the IFIT2 expression changed malignant characters of MDA-MB-231/IR
cells for example, migration, invasion, and stem cell-like properties. TCGA data analysis
revealed that metastatic samples showed lower IFIT2 expressions than primary tumor or
normal tissue. KM plots in TNBC patients presented that the patients with low IFIT2
expression level had higher possibility of relapse. In conclusion, baicalein treatment reduced
the survival of malignant cancer cells and reverse resistance, migration, invasion, and stem
cell-like characteristics of chemo- and radio- resistance cells by increasing IFIT2 expression.
65
Supplementary table 1. Up-regulated gene list
‘ Difference Gene name Difference Gene name
97.57 AKR1C1 6.18 ERRFI
79.67 FTL 6.03 MOT4
77.43 MK 5.48 IL1B
62.20 LG3BP 4.75 MLH1
46.92 GFPT2 4.07 LIMK1
44.88 NDKB 2.87 NPAS2
44.02 PLSL 2.52 NDST1
42.64 TGFBI 1.93 GMPR2
42.35 AKR1C3 1.78 GGT1
37.77 LAPM5 1.75 OAS3
37.59 CCDC69 1.73 C163B
25.18 CG050 1.67 IL7RA
22.98 PAI2 1.44 NAA25
14.93 RCOR1 1.27 MYH15
14.51 AKR1C2 1.23 TBC16
12.55 TWF1 1.22 LIPB1
8.89 RHG18 1.19 NBAS
7.54 IF16 1.10 FER
6.52 BAG6 0.90 DNLI3
66
Supplementary table 2. Down-regulated gene list
Difference Gene name Difference Gene name
-0.52 FNIP1 -4.33 PKP3
-1.21 BBX -4.34 F134A
-1.23 ZBT40 -5.35 2A5E
-1.33 RHG07 -6.38 UBP2L
-1.43 TRAF3 -6.69 ARI2
-1.52 NSD1 -6.69 MEN1
-1.71 PLXA2 -8.91 GLSK
-1.87 TGFA1 -9.733 CD97
-1.95 AGRG6 -10.27 SEN34
-2.06 PDPR -11.11 TFDP1
-2.22 PHLP1 -13.52 PEG10
-2.29 NAV2 -16.66 ANKH1
-2.41 BUB1 -34.69 SERA
-2.55 RAD21 -69.86 RL21
-2.85 ETS2 -71.11 IFIT3
-3.06 BRD2 -85.89 IFIT2
-3.18 LY65B -167.432 RS2
-3.51 DAAF5 -210.53 IFIT1
-4.27 SMC4
67
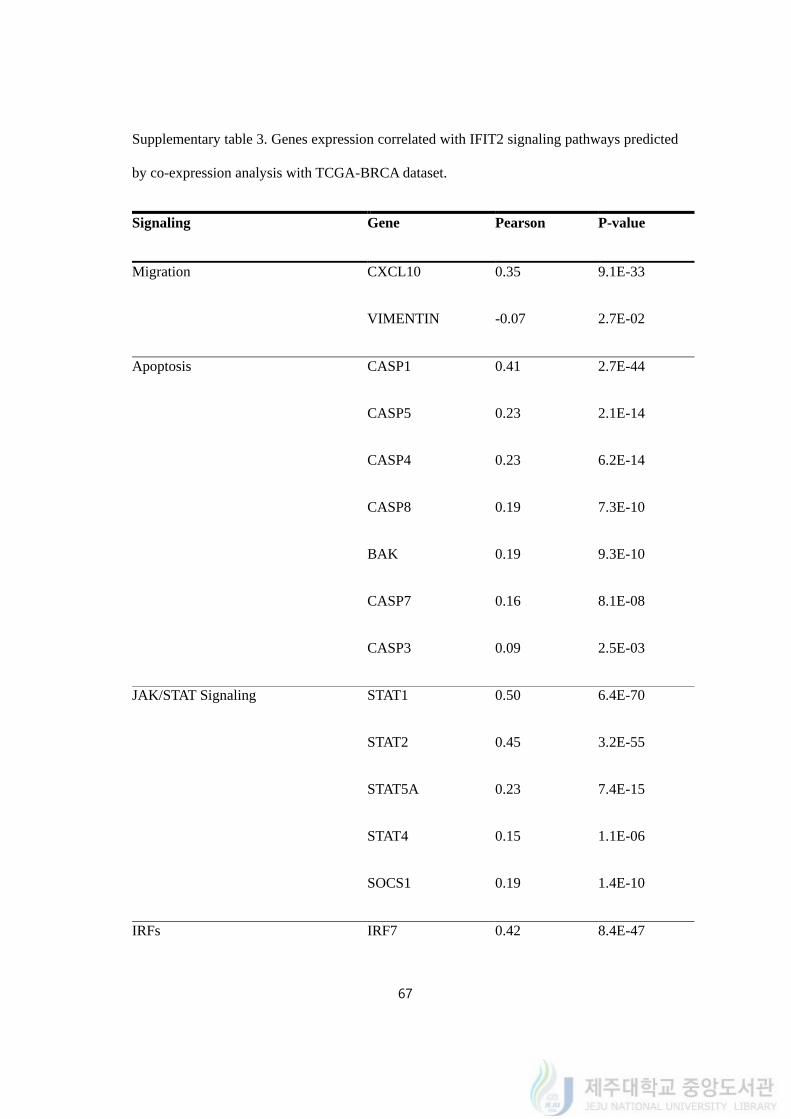
Supplementary table 3. Genes expression correlated with IFIT2 signaling pathways predicted
by co-expression analysis with TCGA-BRCA dataset.
Signaling Gene Pearson P-value
Migration CXCL10 0.35 9.1E-33
VIMENTIN -0.07 2.7E-02
Apoptosis CASP1 0.41 2.7E-44
CASP5 0.23 2.1E-14
CASP4 0.23 6.2E-14
CASP8 0.19 7.3E-10
BAK 0.19 9.3E-10
CASP7 0.16 8.1E-08
CASP3 0.09 2.5E-03
JAK/STAT Signaling STAT1 0.50 6.4E-70
STAT2 0.45 3.2E-55
STAT5A 0.23 7.4E-15
STAT4 0.15 1.1E-06
SOCS1 0.19 1.4E-10
IRFs IRF7 0.42 8.4E-47
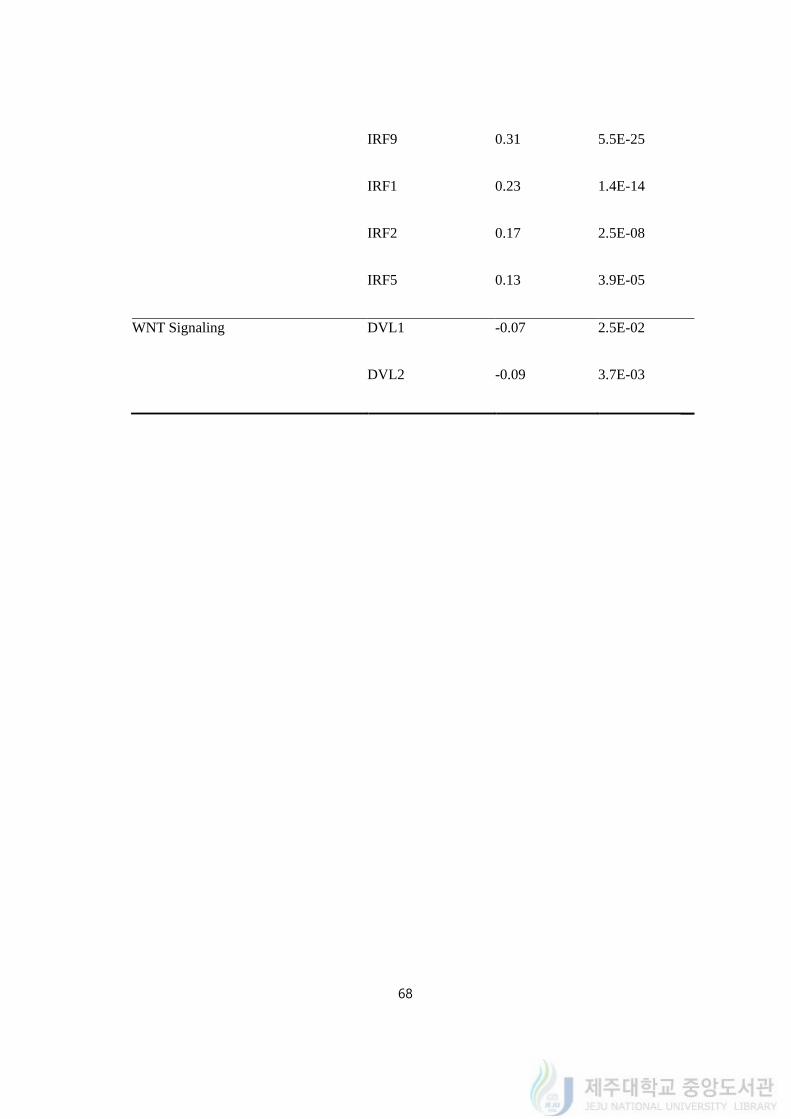
68
IRF9 0.31 5.5E-25
IRF1 0.23 1.4E-14
IRF2 0.17 2.5E-08
IRF5 0.13 3.9E-05
WNT Signaling DVL1 -0.07 2.5E-02
DVL2 -0.09 3.7E-03
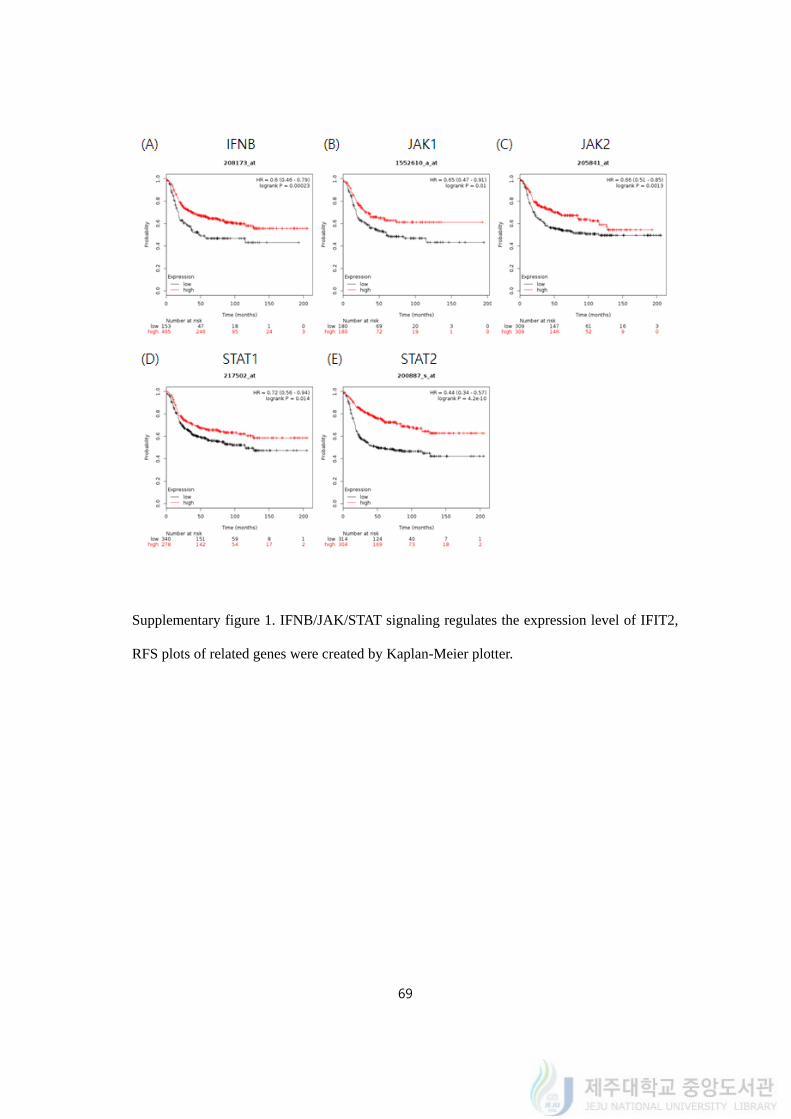
69
Supplementary figure 1. IFNB/JAK/STAT signaling regulates the expression level of IFIT2,
RFS plots of related genes were created by Kaplan-Meier plotter.

70
6. References
Al-Hajj et al., 2003, Prospective identification of tumorigenic breast cancer cells
Amin et al., 2009, Perspectives for Cancer Prevention With Natural Compounds
Bahmani et al., 2016, Cancer Phytotherapy: Recent Views on the Role of Antioxidant
and Angiogenesis Activities
Bauer et al., 2017, Apigenin inhibits TNFα/IL-1α-induced CCL2 release through IKBK-
epsilon signaling in MDA-MB-231 human breast cancer cells.
Beachy et al., 2004, Tissue repair and stem cell renewal in carcinogenesis
Bianchini et al., 2016, Triple-negative breast cancer: challenges and opportunities of a
heterogeneous disease
Bie et al., 2017, Baicalein, a Natural Anti-Cancer Compound, Alters MicroRNA
Expression Profiles in Bel-7402 Human Hepatocellular Carcinoma Cells
Blanco et al., 2002, Correlation of Snail expression with histological grade and lymph
node status in breast carcinomas
Blatch et al., 1999, The tetratricopeptide repeat: a structural motif mediating protein-
protein interactions.
Bockhorn et al., 2013, MicroRNA-30c inhibits human breast tumour chemotherapy
resistance by regulating TWF1 and IL-11.
Buranrat et al., 2015, Cytoprotective effects of ferritin on doxorubicin-induced breast
cancer cell death

71
Carninci et al., 2005, The transcriptional landscape of the mammalian genome
Chang et al., 2003, Gene expression profiling for the prediction of therapeutic response
to docetaxel in patients with breast cancer
Chen et al., 2018, Decreased IFIT2 Expression Promotes Gastric Cancer Progression
and Predicts Poor Prognosis of the Patients
Choi et al., 2012, Evaluation of the anticancer activities of thioflavanone and
thioflavone in human breast cancer cell lines
Choi et al., 2018, Catechol derived from aronia juice through lactic acid bacteria
fermentation inhibits breast cancer stem cell formation via modulation Stat3/IL-6
signaling pathway
Cies lik et al., 2017, Cancer transcriptome profiling at the juncture of clinical translation
Conacci-Sorrell et al. 2003, Autoregulation of E-cadherin expression by cadherin-
cadherin interactions: the roles of beta-catenin signaling, Slug, and MAPK.
Conacci-Sorrell, M. et al., 2003, Autoregulation of E-cadherin expression by cadherin–
cadherin interactions: the roles of β-catenin signalling, Slug, and MAPK
Cragg et al., 2013, Natural products: A continuing source of novel drug leads
Crozier et al., 2009, Dietary phenolics: Chemistry, bioavailability and effects on health
Cui et al., 2017, Inhibition of coiled coil domain containing protein 69 enhances
platinum- induced apoptosis in ovarian cancer cells
Dean et al., 2005, Tumour stem cells and drug resistance.

72
Dent et al., 2007, Triple-negative breast cancer: clinical features and patterns of
recurrence
Doherty M.R. et al., 2017, Interferon-beta represses cancer stem cell properties in triple-
negative breast cancer
Feng et al., 2014, MicroRNA-645, up-regulated in human adencarcinoma of gastric
esophageal junction, inhibits apoptosis by targeting tumor suppressor IFIT2
Fidler, 2003, The pathogenesis of cancer metastasis: the 'seed and soil' hypothesis
revisited.
Friedl, 2011, Cancer Invasion and the Microenvironment: Plasticity and Reciprocity
Haffty et al., 2006, Locoregional relapse and distant metastasis in conservatively
managed triple negative early-stage breast cancer
Hemavathy et al., 2000, Snail/Slug family of repressors: slowly going into the fast lane
of development and cancer
Huang et al., 2009, Bioinformatics enrichment tools: paths toward the comprehensive
functional analysis of large gene lists.
Hui et al., 2013, Flavonoids, Flavonoid Subclasses and Breast Cancer Risk: A Meta-
Analysis of Epidemiologic Studies
Hunter N.R. et al., 2013, Mitigation and treatment of radiation-induced thoracic injury
with a cyclooxygenase-2 inhibitor, celecoxib
Hughes et al., 2000, Functional discovery via a compendium of expression profiles
Iriti et al., 2017, Rutin, a Quercetin Glycoside, Restores Chemosensitivity in Human
73
Breast Cancer Cells
Jang et al., 2015, Blockade of Wnt/β-catenin signaling suppresses breast cancer
metastasis by inhibiting CSC-like phenotype.
Jia et al., 2016, The LIM protein AJUBA promotes colorectal cancer cell survival
through suppression of JAK1/STAT1/IFIT2 network
Kanadaswami et al., 2005, The antitumor activities of flavonoids
Kim et al., 2008, Sustained ERK activation is involved in the kaempferol-induced
apoptosis of breast cancer cells and is more evident under 3-D culture condition
Knickle et al., 2018, Myricetin-induced apoptosis of triple-negative breast cancer cells is
mediated by the iron-dependent generation of reactive oxygen species from hydrogen
peroxide
Lai et al., 2008, IFN-induced protein with tetratricopeptide repeats 2 inhibits migration
activity and increases survival of oral squamous cell carcinoma
Lai et al., 2016, Blocking TNF-α inhibits angiogenesis and growth of IFIT2-depleted
metastatic oral squamous cell carcinoma cells.
Lakshmi et al., 2014, Chemotherapeutic effect of tangeretin, a polymethoxylated
flavones studied in 7,12–dimethylbenz(α)anthracene induced rat mammary in
experimental rats.
Lapidot et al., 1994, A cell initiating human acute myeloid leukaemia after
transplantation into SCID mice.
74
Lee et al., 2005, Inhibition of DNA methylation by caffeic acid and chlorogenic acid,
two common catechol-containing coffee polyphenols
Lee et al., 2008, The Role of Ca2+ in Baicalein-induced Apoptosis in Human Breast
MDA-MB-231 Cancer Cells through Mitochondria- and Caspase-3-dependent Pathway
Lee H.-J. et al., 2013, Combining PARP-1 Inhibition and Radiation in Ewing Sarcoma
Results in Lethal DNA Damage
Levin et al., 2008, Estrogen receptors outside the nucleus in breast cancer
Li et al., 2014, AEG-1 Promotes Metastasis Through Downstream AKR1C2 and NF1 in
Liver Cancer.
Li et al., 2017, Unraveling the roles of CD44/CD24 and ALDH1 as cancer stem cell
markers in tumorigenesis and metastasis
Liu et al., 2013, CD133+ cells with cancer stem cell characteristics associates with
vasculogenic mimicry in triple-negative breast cancer
Liu et al., 2015, Intracrine Androgens and AKR1C3 Activation Confer Resistance to
Enzalutamide in Prostate Cancer
Liu T. J. et al., 2013, CD133+ cells with cancer stem cell characteristics associates with
vasculogenic mimicry in triple-negative breast cancer
Lu et al., 2009, Breast Cancer Metastasis: Challenges and Opportunities
Luzhna et al., 2015, Altered radiation responses of breast cancer cells resistant to
hormonal therapy
Ma et al., 2008, Extracellular matrix protein βig-h3/TGFBI promotes metastasis of

75
colon cancer by enhancing cell extravasation
Ma et al., 2016, Baicalein suppresses metastasis of breast cancer cells by inhibiting
EMT via downregulation of SATB1 and Wnt/β-catenin pathway
Meacham et al., 2013, Tumor heterogeneity and cancer cell plasticity
Mocanu et al., 2015, Chemoprevention of breast cancer by dietary polyphenols
Nowak et al., 2013, Plant Polyphenols as Chemopreventive Agents
Oakman et al., 2010, Management of triple negative breast cancer
Ohsugi et al., 2017, Decreased expression of interferon-induced protein 2 (IFIT2) by
Wnt/β-catenin signaling confers anti-apoptotic properties to colorectal cancer cells.
Oracz et al., 2015, The Content of Polyphenolic Compounds in Cocoa Beans
(Theobroma cacao L.), Depending on Variety, Growing Region, and Processing
Operations: A Review
Pichlmair et al., 2011, IFIT1 is an antiviral protein that recognizes 5'-triphosphate RNA.
Ravishankar et al., 2013, Flavonoids as prospective compounds for anti-cancer therapy
Rodgers et al., 1998, The effect of the flavonoids, quercetin, myricetin and epicatechin
on the growth and enzyme activities of MCF7 human breast cancer cells
Saha et al., 2006, Identification of Japanese encephalitis virus-inducible genes in mouse
brain and characterization of GARG39/IFIT2 as a microtubule-associated protein.
Scharenberg C. W. et al., 2002, The ABCG2 transporter is an efficient Hoechst 33342
efflux pump and is preferentially expressed by immature human hematopoietic
76
progenitors
Schatton et al., 2009, Identification and targeting of cancer stem cells.
Siegel et al., 2016, Cancer statistics, 2016
Simpson et al., 2012, An in vitro investigation of metabolically sensitive biomarkers in
breast cancer progression
Staunton et al., 2001, Chemosensitivity prediction by transcriptional profiling
Stawowczyk et al., 2011, The interferon stimulated gene 54 promotes apoptosis
Sun et al., 2017, Midkine promotes hepatocellular carcinoma metastasis by elevating
anoikis resistance of circulating tumor cells
Takahashi et al., 2012, Up-regulation of plakophilin-2 and Down-regulation of
plakophilin-3 are correlated with invasiveness in bladder cancer
Thiery, J. P., 2003, Epithelial–mesenchymal transitions in development and pathologies
Velculescu et al., 1997; Characterization of the yeast transcriptome
Wang et al., 2010, Flavonoid baicalein suppresses adhesion, migration and invasion of
MDA-MB-231 human breast cancer cells
Wang et al., 2015, Baicalein attenuates renal fibrosis by inhibiting inflammation via
down-regulating NF-κB and MAPK signal pathways
Wang et al., 2016, Long non-coding RNA LINC00161 sensitises osteosarcoma cells to
cisplatin-induced apoptosis by regulating the miR-645-IFIT2 axis
77
Wang et al., 2018, Quercetin Inhibits Breast Cancer Stem Cells via Downregulation of
Aldehyde Dehydrogenase 1A1 (ALDH1A1), Chemokine Receptor Type 4 (CXCR4),
Mucin 1 (MUC1), and Epithelial Cell Adhesion Molecule (EpCAM)
White et al., 2015, Galectin-3 Binding Protein Secreted by Breast Cancer Cells Inhibits
Monocyte-Derived Fibrocyte Differentiation.
Wu et al., 2011, Baicalein mediates inhibition of migration and invasiveness of skin
carcinoma through Ezrin in A431 cells
Yang et al., 2018, Molecular identification and transcriptional regulation of porcine
IFIT2 gene
Yin et al., 2009, Apoptotic Effects of Protocatechuic Acid in Human Breast, Lung, Liver,
Cervix, and Prostate Cancer Cells: Potential Mechanisms of Action
Zhou et al., 2009, Tumour-initiating cells: challenges and opportunities for anticancer
drug discovery.
Zhou et al., 2013, Interferon induced IFIT family genes in host antiviral defense.
Zhu et al., 2018, AKR1C1 Activates STAT3 to Promote the Metastasis of Non-Small
Cell Lung Cancer.


![Index [182.160.97.198:8080]](https://img.pdfslide.us/doc/110x75/618107c6ef86d83c916e82c4/index-182160971988080.jpg)

![INDEX [shodh.inflibnet.ac.in:8080]](https://img.pdfslide.us/doc/110x75/617729fad5903d63bd1810b7/index-shodh-.jpg)