Embed Size (px)
Citation preview
i
ii
iii

iv
ACKNOWLEDGEMENT
The completion of any project brings with it a sense of satisfaction, but it is never complete
without thanking those people who made it possible and whose constant support has crowned our
efforts with success.
One cannot even imagine the power of the force that guides us all and neither can we succeed
without acknowledging it. Our deepest gratitude to Almighty God for holding our hands and
guiding us throughout our lives.
I would also like to express our gratitude to Dr. SHARANABASAVA .C PILLI, Principal of
AIT and also Dr. MAHESHA, Dean of AIT.
I would also like to express our gratitude to our HOD Dr. PROF. G. NIJAGUNA Department
of Management Studies and internal guide PROF. SWARUPA RANJAN PANIGRAHI,
Acharya institute of technology Bangalore.
I am extremely happy to acknowledge and express our sincere gratitude to our parents for their
constant support and encouragement & last but not least, friends and well wishers for their help
and cooperation &solutions problems during the course of the project.
Bikram Sharma
USN: 1IA16MBA11
v
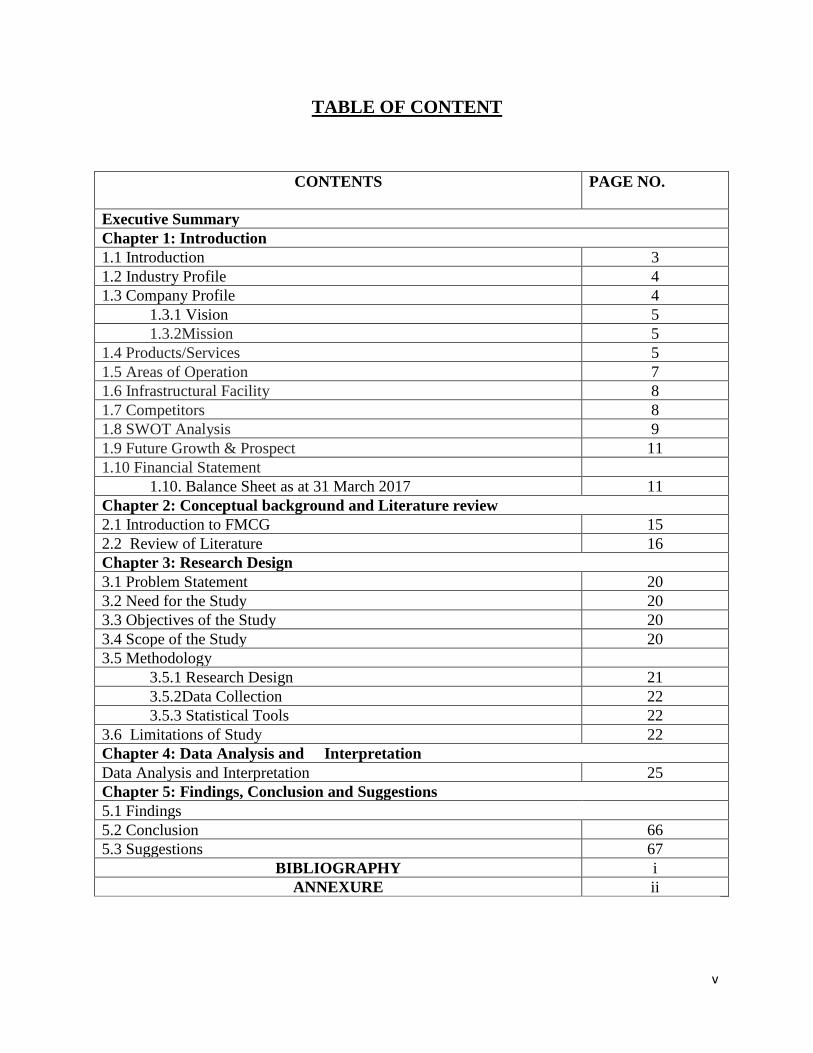
TABLE OF CONTENT
CONTENTS
PAGE NO.
Executive Summary
Chapter 1: Introduction
1.1 Introduction 3
1.2 Industry Profile 4
1.3 Company Profile 4
1.3.1 Vision 5
1.3.2Mission 5
1.4 Products/Services 5
1.5 Areas of Operation 7
1.6 Infrastructural Facility 8
1.7 Competitors 8
1.8 SWOT Analysis 9
1.9 Future Growth & Prospect 11
1.10 Financial Statement
1.10. Balance Sheet as at 31 March 2017 11
Chapter 2: Conceptual background and Literature review
2.1 Introduction to FMCG 15
2.2 Review of Literature 16
Chapter 3: Research Design
3.1 Problem Statement 20
3.2 Need for the Study 20
3.3 Objectives of the Study 20
3.4 Scope of the Study 20
3.5 Methodology
3.5.1 Research Design 21
3.5.2Data Collection 22
3.5.3 Statistical Tools 22
3.6 Limitations of Study 22
Chapter 4: Data Analysis and Interpretation
Data Analysis and Interpretation 25
Chapter 5: Findings, Conclusion and Suggestions
5.1 Findings
5.2 Conclusion 66
5.3 Suggestions 67
BIBLIOGRAPHY i
ANNEXURE ii
vi
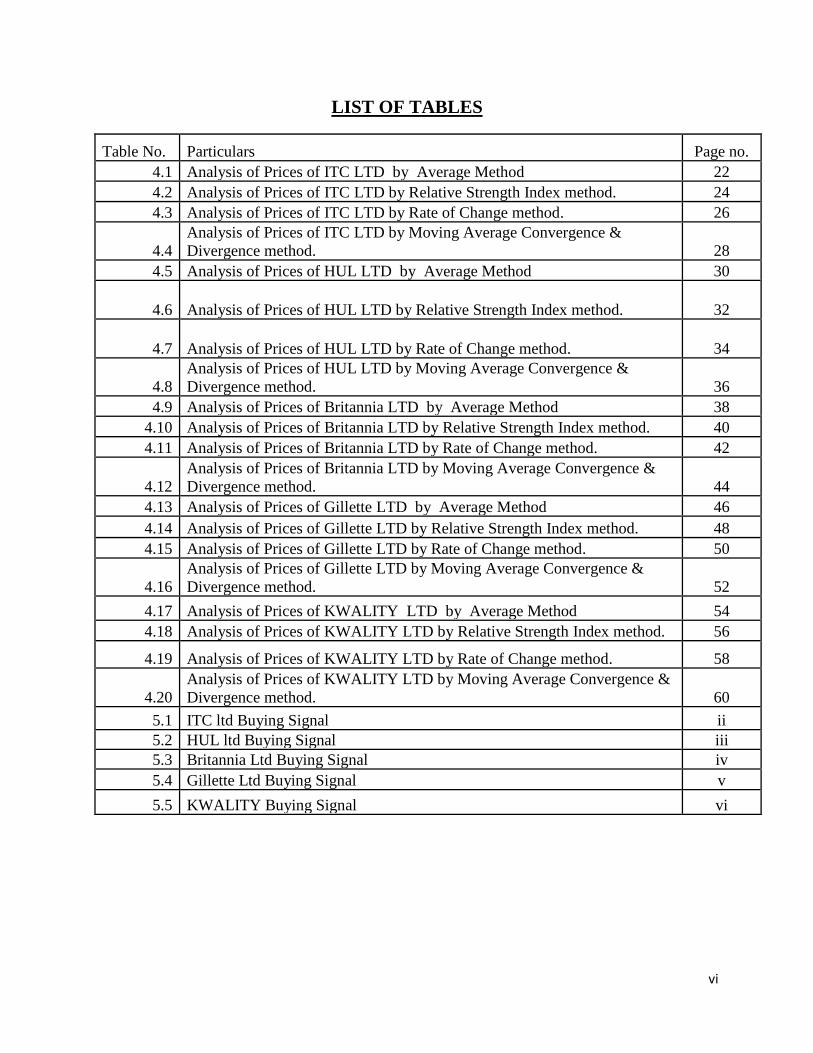
LIST OF TABLES
Table No. Particulars Page no.
4.1 Analysis of Prices of ITC LTD by Average Method 22
4.2 Analysis of Prices of ITC LTD by Relative Strength Index method. 24
4.3 Analysis of Prices of ITC LTD by Rate of Change method. 26
4.4
Analysis of Prices of ITC LTD by Moving Average Convergence &
Divergence method. 28
4.5 Analysis of Prices of HUL LTD by Average Method 30
4.6 Analysis of Prices of HUL LTD by Relative Strength Index method. 32
4.7 Analysis of Prices of HUL LTD by Rate of Change method. 34
4.8
Analysis of Prices of HUL LTD by Moving Average Convergence &
Divergence method. 36
4.9 Analysis of Prices of Britannia LTD by Average Method 38
4.10 Analysis of Prices of Britannia LTD by Relative Strength Index method. 40
4.11 Analysis of Prices of Britannia LTD by Rate of Change method. 42
4.12
Analysis of Prices of Britannia LTD by Moving Average Convergence &
Divergence method. 44
4.13 Analysis of Prices of Gillette LTD by Average Method 46
4.14 Analysis of Prices of Gillette LTD by Relative Strength Index method. 48
4.15 Analysis of Prices of Gillette LTD by Rate of Change method. 50
4.16
Analysis of Prices of Gillette LTD by Moving Average Convergence &
Divergence method. 52
4.17 Analysis of Prices of KWALITY LTD by Average Method 54
4.18 Analysis of Prices of KWALITY LTD by Relative Strength Index method. 56
4.19 Analysis of Prices of KWALITY LTD by Rate of Change method. 58
4.20
Analysis of Prices of KWALITY LTD by Moving Average Convergence &
Divergence method. 60
5.1 ITC ltd Buying Signal ii
5.2 HUL ltd Buying Signal iii
5.3 Britannia Ltd Buying Signal iv
5.4 Gillette Ltd Buying Signal v
5.5 KWALITY Buying Signal vi
vii
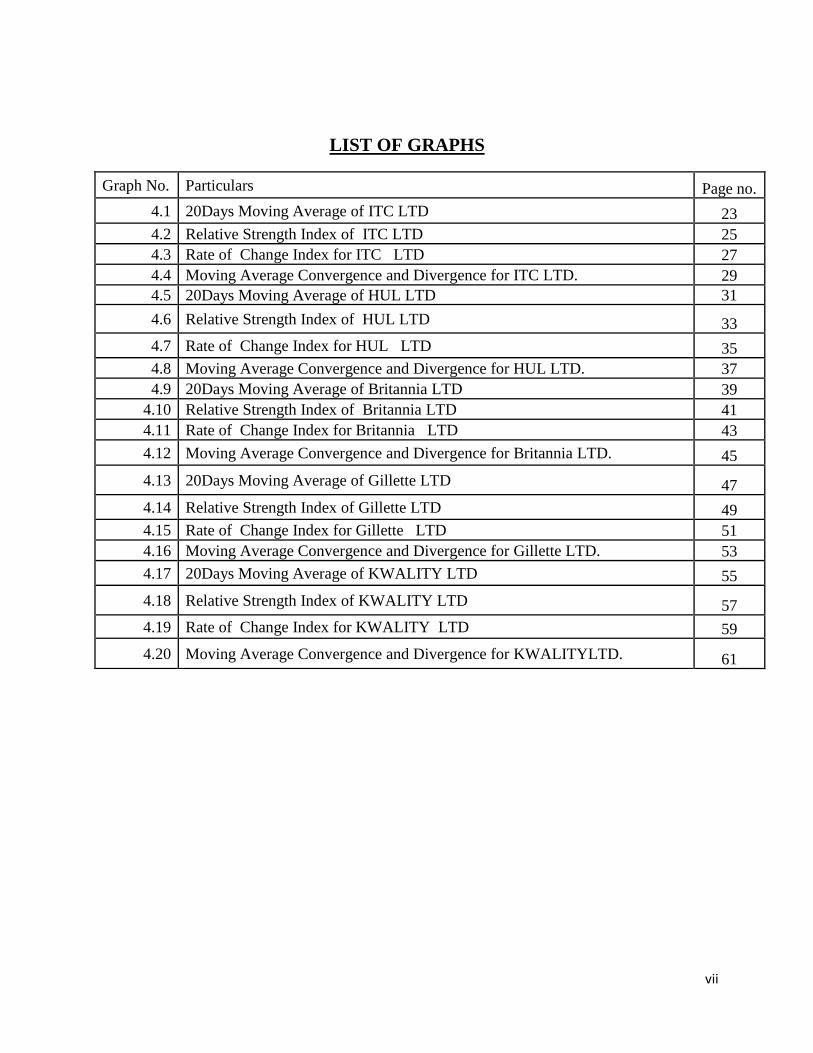
LIST OF GRAPHS
Graph No. Particulars Page no.
4.1 20Days Moving Average of ITC LTD 23
4.2 Relative Strength Index of ITC LTD 25
4.3 Rate of Change Index for ITC LTD 27
4.4 Moving Average Convergence and Divergence for ITC LTD. 29
4.5 20Days Moving Average of HUL LTD 31
4.6 Relative Strength Index of HUL LTD 33
4.7 Rate of Change Index for HUL LTD 35
4.8 Moving Average Convergence and Divergence for HUL LTD. 37
4.9 20Days Moving Average of Britannia LTD 39
4.10 Relative Strength Index of Britannia LTD 41
4.11 Rate of Change Index for Britannia LTD 43
4.12 Moving Average Convergence and Divergence for Britannia LTD. 45
4.13 20Days Moving Average of Gillette LTD 47
4.14 Relative Strength Index of Gillette LTD 49
4.15 Rate of Change Index for Gillette LTD 51
4.16 Moving Average Convergence and Divergence for Gillette LTD. 53
4.17 20Days Moving Average of KWALITY LTD 55
4.18 Relative Strength Index of KWALITY LTD 57
4.19 Rate of Change Index for KWALITY LTD 59
4.20 Moving Average Convergence and Divergence for KWALITYLTD. 61
EXECUTIVE SUMMARY
As part of the study curriculum it is necessary to conduct a research project. It provides us an
opportunity to understand the particular topic in depth. The title for the project is A Study on
Technical Analysis of selected FMCG Market. Through this project a great deal of knowledge is
gained about FMCG sector and its various segments.
The report covers the FMCG sector and its segment, scope and its future prospects. The report
concentrates on the top four players in FMCG sectors and accordingly the idea is collected and
analyzed. Tools utilized for analyzing the data are ratio analysis, relative strength index (RSI),
moving average convergence and divergence (MACD).
In the technical analysis, the movement of corresponding graphs are studied to give a clear
picture of the company and its corresponding sector, draw conclusions and make suggestions or
recommendations.
INTRODUCTION
1.1 INTRODUCTION
The topic of the study revolves only around FMCG sector stocks, the introduction FMCG
industry has been listed below.
The FMCG sector, in view of the economy of India, has got a considerably rapid growth. It takes
up the 4th spot in terms of the various sectors that contribute to the economy of India. The FMCG
market was estimated at US $ 30 billion in the year 2011 and the market is expected to grow to
us $ 74 billion by 2018. The FMCG sect comprises of a large line of product range among
which the food category occupies a staggering 43% of the total share of the FMCG market.
Personal care then comes next with a total market share of 22% and the fabric sector occupying
12%.
FMCG are products which are also known as consumer goods due to the fact that the consumer
buy them frequently and at regular intervals. Some examples of FMCG goods are soap,
shampoo, detergents, tooth paste, food products, beverages and soft drinks like Coca-cola,
Pepsi, sprite etc. House hold accessories and some electronic items are also included under
the umbrella of FMCG products. The above items are a list of few products that are frequently
used by the consumers. The contribution of rural areas in the development of FMCG sector
in the country is very prominent. They are accountable for direct distribution of the
products to the different part of the country and population of the rural area constantly
consume FMCG products in an attempt to improve their living standard. In the current
scenario, FMCG companies are showing keen interest in producing products that target the
rural population, as they assist in the direct distribution of the FMCG products.
Government also plays an important role and provides help by providing loans. This in turn
reduces the unemployment in the rural area resulting in increase in self-employment which in
turn leads to an increase in the purchasing power of the general public
3
1.2 INDUSTRY PROFILE
A Stock Market also known as Equity Market or as Share Market is the aggregate of all buyers
and sellers (not necessarily a physical facility or discrete entity, but a loose network of economic
transactions) of stocks (also called shares), which denote ownership claims on businesses. The
claims may incorporate securities that are mentioned in the stock exchange and also those stocks
that are traded only privately. A stock exchange, can be a place where, or an organization via
which, people and firms can transact stocks for trade purpose. There are a large number of
companies that have their stock listed on a stock exchange. This results in making the stock
liquid in nature which makes it extremely lucrative for investors. Stocks can also be considered
as a settlement guarantor. Other stocks options that are present are ones which may be traded
"over the counter" (OTC), per se, via a dealer. There are many large firms that have their stock
listed on more than one exchange which ranges over different nations. This also acts as a lure to
attract investors who invest on an international scale. Stock exchanges also cover various other
types of security, such as fixed interest securities (bonds) or (less frequently) derivatives, which
are more likely to be, traded OTC.
Majority of the Indian stock market trading happens on either of its two stock exchanges: the
Bombay Stock Exchange (BSE) and the National Stock Exchange (NSE). The BSE came into
being in the year 1875. The NSE, on the other hand, came into being in the year 1992 and
commenced trading activities only in the year 1994. Surprisingly, settlement process, trading
mechanism, trading hours, etc, followed by both the exchanges are the same. According to the
latest count, BSE had 4,700 firms listed, while that of NSE stood at 1,200. Of all the firms that
are listed on the BSE, only about 500 firms make up for more than 90% of the total market
capitalization; the rest of the listed firms mainly consist of highly illiquid shares.
4
1.3 COMPANY PROFILE
SUNNESS CAPITAL INDIA
PRIVATE LIMITED (SCIPL),
was founded in the year 2009. It
is an active capital firm
specializing in investments. SCIPL has its headquarter in Bengaluru, and has a branch office in
Mangalore. SCIPL is a firm that specializes in investment management, maximizing return on
investment by providing the stakeholders with a unique mix of risk-controlled high return on
investment. Their approach to equities continues to be through value-orientation, fundamental
research and disciplined portfolio management.
1.3.1 VISION
"To provide world-class Wealth Management Services by arranging all conceivable financial
services under one-roof at affordable costs through cost effective delivery systems, and to
achieve organic growth in business by adding newer lines of business, with the help of self-
motivated and aggressive team of young professionals"
1.3.2 MISSION
“Providing long-term value addition to clients, while maintaining the highest standards of
excellence, ethics and professionalism.” They believe their success is related to the belief in
their guiding principles.
Business Security Issue
Status Indian Non-Government Company
Founded India, 2009
Headquarters Bangalore, Mangalore
Key people Pramod.B.K : Regional Head
Website www.sunness.in
5
1.4 PRODUCTS/ SERVICES
1. Equity
Investment in shares and stock market is undoubtedly considered the easiest way to
accumulate long-term wealth. Sunness Capital India Pvt. Ltd acts as a guide and shows the
thrilling world of stock market by giving appropriate solutions for trading and value-added
tools and services to enhance the experiences of trading.
2.Organization services
Online Trading:
Sunness Capital India Pvt. Ltd provides an array of online products which are specifically
custom made for investors & traders.
They have tailored mono-screen Market Watch systems that enable multiple exchanges,
MCX & NCDEX with BSE,NSE &MCX-SX.
Streaming quotes.
Real-time rates.
Flash news & intra-day Research reports
Intra-day & historical charts with technical tools
Online research
Quality Research:
Wide range of daily, weekly and special Research reports
Expert Sector Analysts with professional industry experience
Advisory:
Real-time market information with News updates
6
Investment Advisory services
Dedicated Relationship Managers
3. The Derivative
The derivative sector is a highly attractive market that provides the investors with a chance to
make superlative profits (or losses) on payment of a nominal margin amount. A recent trend of
Future & Options segment has come up as a very well known media for financial market trade. It
provides opportunities for contracts that can be carried in the future on various options such as
Indices, Currency, Equity and Commodity. As Sunness is a member of the Trading and Clearing
Member of NSE F&O Segment and BSE Derivatives Segment, it acts as a gateway to the
thrilling world of the market of derivatives.
This very potential of the commodities market has been harnessed by Sunness which then aims
to provide a simple yet well working interface, knowledge and research.
SERVICES
• Provides IPO forms.
• Experienced professionals guide to new IPO’s
• HNI funding facility.
• Immediate Demat account opening for IPO investors
• Information through SMS about allotment in Demat a/c
• Demat balance telephonic inquiry
7
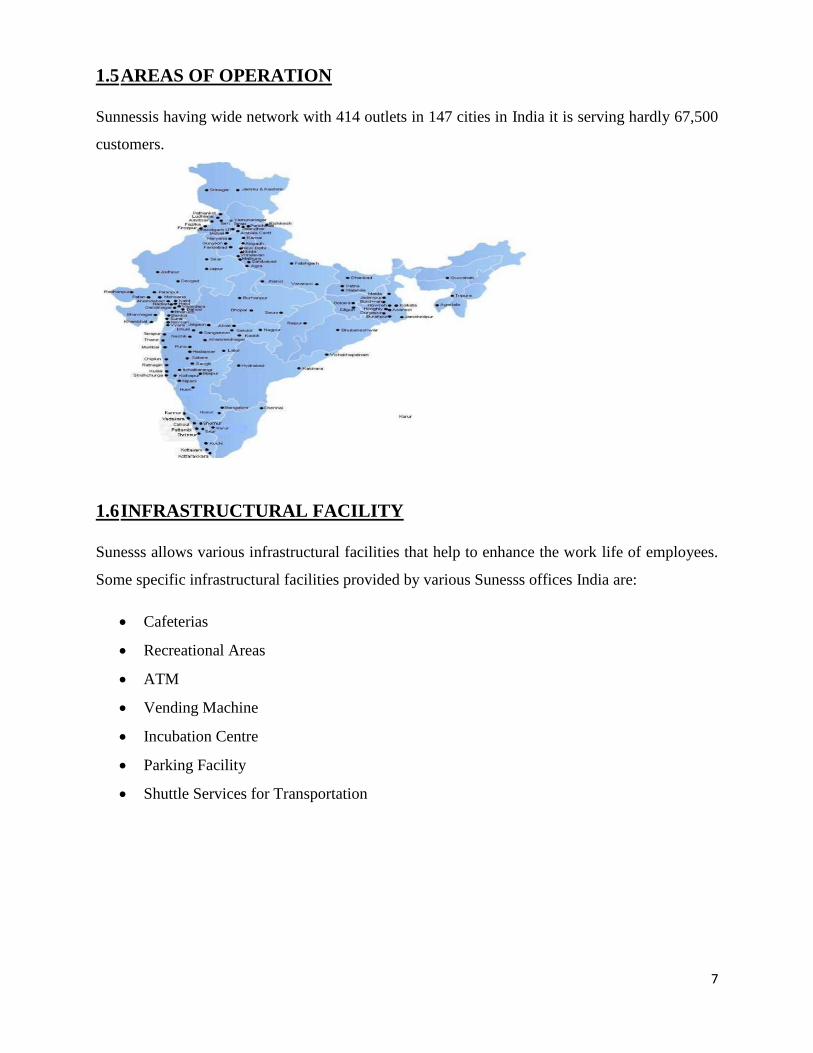
1.5 AREAS OF OPERATION
Sunnessis having wide network with 414 outlets in 147 cities in India it is serving hardly 67,500
customers.
1.6 INFRASTRUCTURAL FACILITY
Sunesss allows various infrastructural facilities that help to enhance the work life of employees.
Some specific infrastructural facilities provided by various Sunesss offices India are:
• Cafeterias
• Recreational Areas
• ATM
• Vending Machine
• Incubation Centre
• Parking Facility
• Shuttle Services for Transportation
8
1.7 COMPETITORS
1.Sharekhan
Sharekhan, a retail breakage of Citi Venture, has been effectively running since 1922 in India. It
provides its clients with an extensive range of value related administrations which includes
exchange execution on BSE, NSE, Derivatives, store administrations, web exchanging, venture
guidance and so forth.
2.Angel Broking Limited
Angel Broking, Ltd. provides personal financial services for retail sector in India. The company
offers portfolio management, e-broking, private client group, mutual fund, investment advisory,
commodities broking, IPO, wealth management, and depository services. It was founded in the
year 1987 and is headquartered in Mumbai, India.
3.Karvy Stock Broking Limited
Karvy Stock Broking Limited gives stock broking and research admonitory administrations in
India. Services such as portfolio investigation, safe member, and money related arranging and
administration administrations for people and institutional customers are offered by the
company. It was established in the year 1990 and is situated in Hyderabad, India.
4. MotilalOswal Securities Ltd
MotilalOswalSecurities is a major research and counselling firm of India. MotilalOswal
Securities guides broking activities for both values and subsidiaries, portfolio management
services (PMS), e-broking, store administrations, items exchanging, IPO and mutual fund
speculation consultative administrations.
5. VLS Finance Ltd
VLS Group is a monetary administration firm with significant approach in almost all aspects
of money related administrations.
9
1.8 SWOT ANALYSIS
Strengths:
• Brand name: SUNNESS has been constantly attributed to its brand name owing to
its prominent services and the big clients which it holds under its belt. Owing to
its 66 years of prolonged excellent services to the clients it has been able to keep
up its brand name.
• Original research: Sunness conducts different researches, study and analysis based
on theories, facts, and ideas that remain new and untouched as a subject for
review by experts.
• The company prides its integrated technology: It provides focused solution to the
problems related to system and technology.
• One stop shop: The company provides the customers with all they need facility
under the same roof of one shop.
• A team of dedicated research team looks after the options to invest and to sell.
• The balance sheet analysis depicts a growing turnover and profitability.
• Sound financial condition gives the advantage over the competitors as they have
high profits and turnover as compared to other firms.
• It also a group of highly satisfied clients basis.
• It is also known for meeting up the client requirement in time.
• Innovation & creative in advertisement segment.
• Quality in advertisement.
• Efficient team work environment.
• Expertise and experienced workforce.
Weaknesses:
• Market share is limited due to many competitors
• Geographic penetration is also limited
• Turnover of employees: The high employee attrition rate is also a major weakness
of the company.
10
• High cost structure in IT department: Investment on costly software’s and
programming devices increases the cost for the company.
• Lack of usage and insufficient telephone devices to communicate with the
customer and clients.
Opportunities:
• Decentralized decision making is helpful as local marketing needs vary from one
region to another
• Global market opportunities to attract global clients
• Dissatisfied customers of competitors
• Market growth for the firm’s main product and services
• Economy is expected to increase by 8% next year.
• Well-equipped meet the ever changing challenges and esteemed clients give a
constant endeavor for the company.
Threats.
• New or increased competition is one of the major threats to the company because
of free government policies and regulations make other firms to enter into the
market.
• Adverse government policies: The change in economic and political policies or
laws affects the Brokerage adversely, which results the negative outcome of
financial condition.
• Increasing lawsuits due to sheer negligence in preparation of ads
• Recession may hit the industry as cut is primarily on marketing budget of
corporate
• Cut-throat competition offered by other players in the industry
1.9 FUTURE GROWTH & PROSPECT
In an always advancing business sector, they continually look for worth for their customers and
they mean to add more administrations to their current Investment Banking bunch and be the
11
favored decision for customers for their raising support and counseling needs. Some of their
arrangements include:
• Value-based proactive Portfolio Management Services (PMS) to Resident and Nonresident
Indians.
• Significant piece of the overall industry in Commodities Futures Trading Segment in India.
• Value based Global Portfolio and Asset Allocation access to Resident Indians.
• Clearing, execution and caretaker administrations for Non-Resident Indians, Foreign
Institutional Investors and Overseas Corporate Bodies.
• Debt market exchanging both Retail and Whole-deal portion for inhabitant financial specialists
and also abroad bodies.
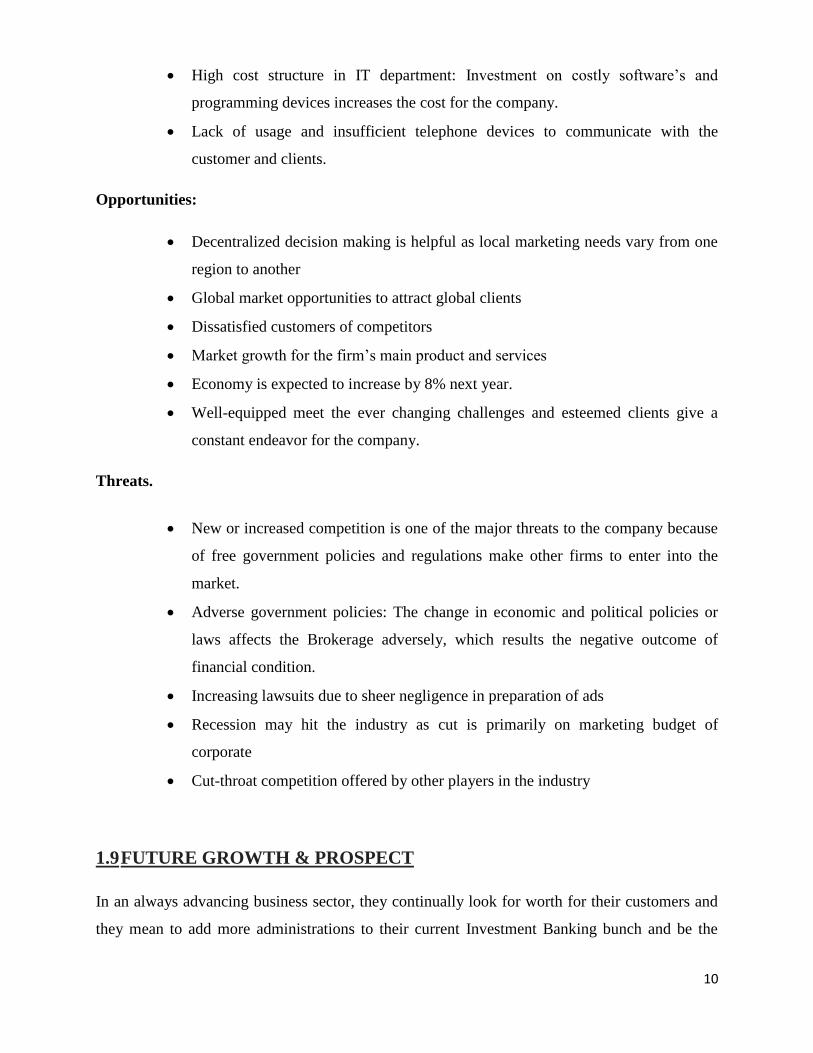
1.10 FINANCIAL STATEMENT
Balance Sheet as at 31 March 2017
Y/e 31 Mar ( In .Cr)
Mar-
2015 Mar-2014
Mar-
2013
Mar-
2012
Equity capital 35.30 35.30 35.30 35.30
Preference capital 51 51 51 51
Reserves 876 698 597 486
Net worth 962 785 683 572
Minority interest
Debt 360 424 335 335
12
Y/e 31 Mar ( In .Cr)
Mar-
2015 Mar-2014
Mar-
2013
Mar-
2012
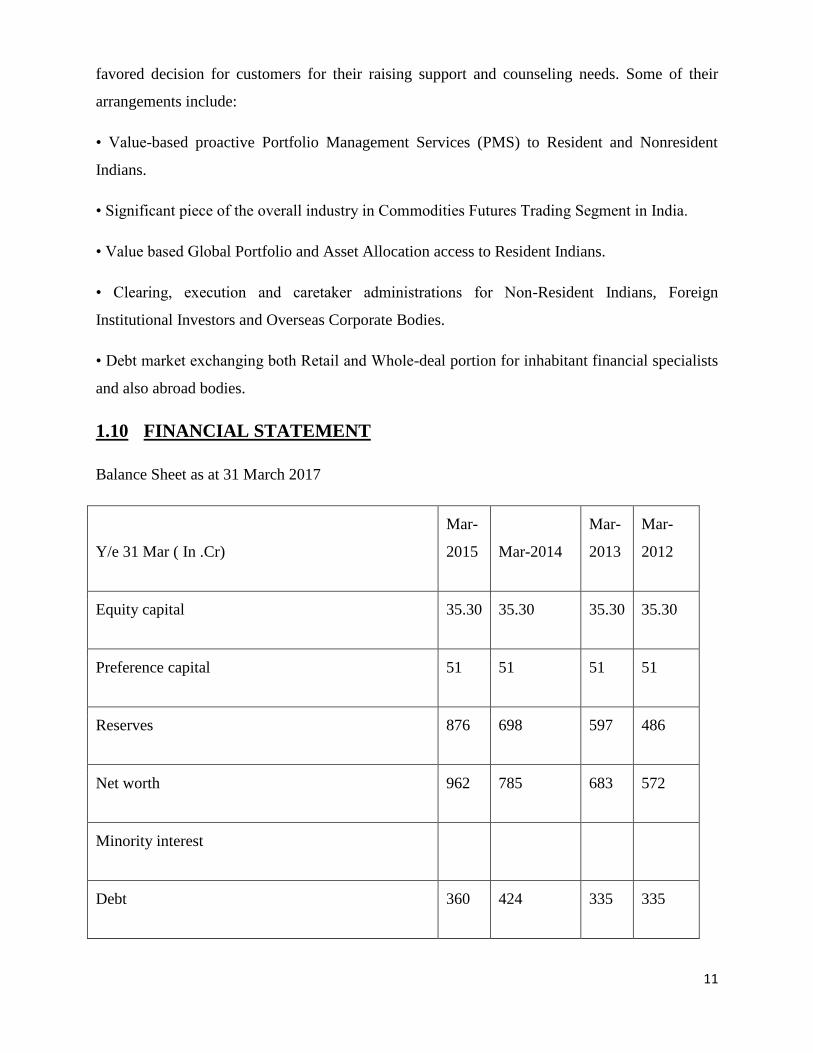
Deferred tax liabilities (net) 0.50 0.90 1.40 1.40
Total liabilities 1,323 1,210 1,019 909
Fixed assets 81 92 100 109
Intangible assets
Investments 38 151 50.60 62.50
Deferred tax asset (net) 15 17.40 15.10 12.10
Net working capital 559 430 109 291
Inventories 240 264 266 661
Inventory Days -- -- -- --
Sundry debtors 217 118 191 318
Debtor days -- -- -- --
Other current assets 793 751 253 77.10
Sundry creditors (578) (607) (482) (691)
13
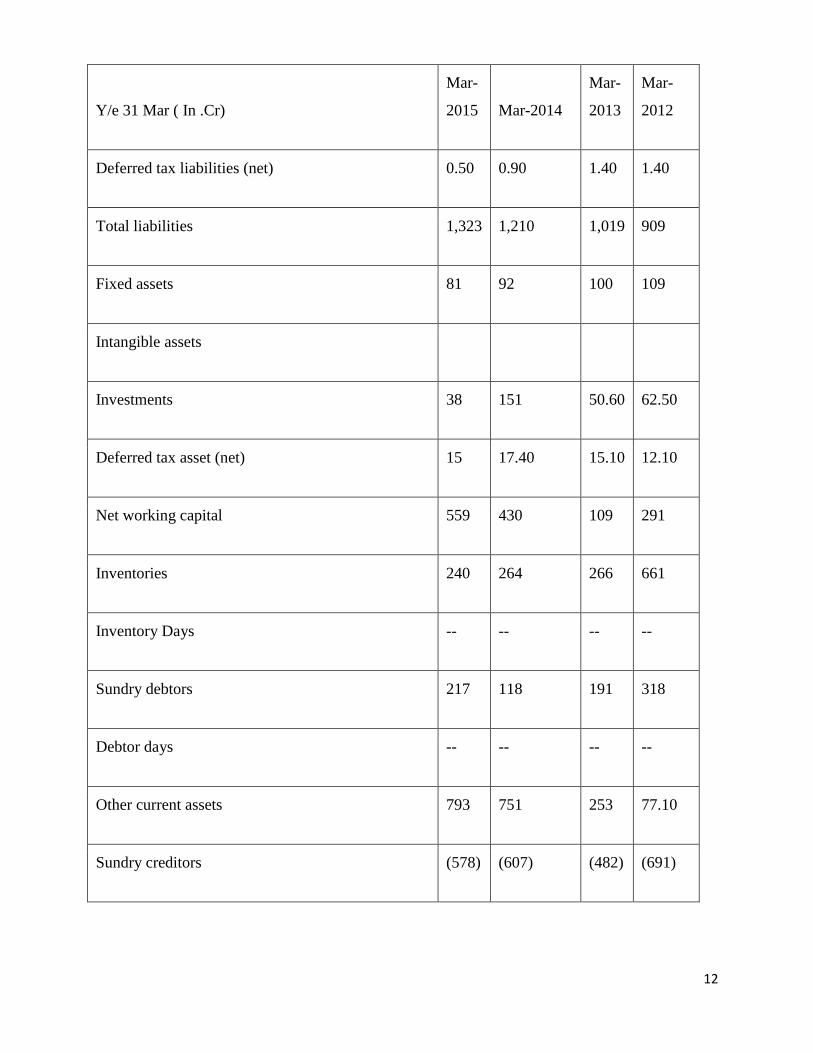
Y/e 31 Mar ( In .Cr)
Mar-
2015 Mar-2014
Mar-
2013
Mar-
2012
Creditor days -- -- -- --
Other current liabilities (113) (95) (118) (74)
Cash 630 521 745 435
Total assets 1,323 1,210 1,019 909
14
2. CONCEPTUAL BACKGROUND & LITERATURE REVIEW
2.1 INTRODUCTION TO FMCG
FMCG are products which are also known as consumer goods due to the fact that the consumer
buy them frequently and at regular intervals. Some examples of FMCG goods are soap,
shampoo, detergents, tooth paste, food products, beverages and soft drinks like Coca-cola,
Pepsi, sprite etc. House hold accessories and some electronic items are also included under
the umbrella of FMCG products.
The contribution of rural areas in the development of FMCG sector in the country is very
prominent. They are accountable for direct distribution of the products to the different part
of the country and population of the rural area constantly consume FMCG products in an
attempt to improve their living standard. In the current scenario, FMCG companies are
showing keen interest in producing products that target the rural population, as they assist
in the direct distribution of the FMCG products. Government also plays an important role
and provides help by providing loans. This in turn reduces the unemployment in the rural area
resulting in increase in self-employment which in turn leads to an increase in the purchasing
power of the general public
The population belonging to the mid – high income groups of the urban areas constantly shift
their preference to premium products which resulted in firms increasing their range of the
premium products line. A recent research conducted on 2000 people, revealed that people
in the age group between 18-24 are more likely to spend more. The research also revealed that
they always purchase products that are recommended and this group gives importance to
convenience over huge products. Accordingly it can attributed, that the current generation value
fast, smart, and well-packaged goods.
FMCG companies have to prioritize research and development, as it aids in finding
consumers insight and also predict the future trend or let the company know what the
generation expects in order to produce the products according to the changing needs, wants
and preferences of the consumers.
15
FOR FURTHER ANALYSIS, SELECTED FMCG COMPANIES
ARE AS FOLLOWS
2.2 REVIEW OF LITERATURE
Khanifar, Hussein (2012): He conducted “A Study on Technical Analysis”.The study mainly
concentrated on the factors that influence an investor’s decision. The factors were investigated
by considering economy, industry as well as the firm itself. The research was conducted at a
broking firm, Tehran Stock trade. The study demonstrated that EPS, net revenue, P/E ratio, have
most elevated significance in examiners choice took after by economy related component and
industry related variable.
V. Ariram and Ms. J. Hema (2011): Conducted “Technical study with special reference to
pharmaceutical companies listed in NSE”.The examination on securities exchange led to the
identification of two principle methods to be specifically specialized in the investigation. This
study focuses on basic study of pharmaceutical companies that were listed in the National Stock
Exchange (NSE). The key findings comprise of three 3 sections viz. monetary examination,
industry examination and organization examination.
Ms. Apurva A. Chauhan (2014): Conducted “A Study on Technical Analysis of FMCG
Companies with Reference to the Selected Companies”.Requisite research is the procedure for
finding the approximation of the stock which considers economic system overall then considers
the industry and after that execution of the arrangement for finding the assessment of its stock. It
makes use of start to finish method for the determination of the stock estimation. Major
evaluation considers various aspects such as overall advancement of the economic condition,
16
growth in business, yesteryear exposition of organization, and future plans of the firm for
forecasting the responsibilities of the company.
Ms. Apurva A. Chauhan (2013): She conducted a research on “A Study on Technical Analysis
of with Reference to the Selected Companies.” In the study a centralized scientific investigation
was performed for four automobile division firms in relation to the price development of their
shares. The findings articulated that financial veterans are engaged in forecasting the
performance of securities exchange. The unsettled deals of the organization are equally
important for the investigation of data.
Dr. ManjulaShastri (2014), She conducted a research on “An Empirical Study of FMCG sector
in India”. The Pharma Industry of India is majorly run and guarded by prevailing foreign
organizations which have ancillaries in India owing to the modest work accessibility in India at
frugal cost. The cost of maintaining and running these Indian Pharma associations is
predominantly small. In the year of 2002 alone, over 20,000 registered drug makers in India
transacted $9 billion worth of prescriptions and mass medications. Over 85% of these project
transactions were made in India while 60% and above of the mass medications were transacted,
generally to the US and Russia.
Venkates CK, Dr. MadhuTyagi, Dr.Ganesh L (2012): They conducted a research paper
entitled “Technical analysis and stock returns". This paper research brought out the relationship
between bookkeeping data and stock returns of selected Indian stocks associated Information
Technology, Banking and Pharmacy segments in recent era specifically the era from 2001 to
2010. In this exploratory work, money score is directly related and expected to capture short
term differences in the working effectiveness of the company, profitability and financial
approach. Examining accounting data and stock returns is a method received in initial scrutiny,
and is extremely helpful in estimating future stock returns and for explaining the forces affecting
the costs of stock.
17
Suresh A. S. (2013): He conducted the research titled “A Study of Technical analysis. It was a
one of a kind of capital business sector whose nature could be depicted using instruments that
strengthened financial veterans to depend devotedly on important variables in their choice
estimation. These elemental units establish with the common economy, a specific industry, or
association. The implementation of the securities that talk about the firms can be said to depend
upon the carrying out of the firm itself. Nonetheless, as firms are a portion of modern and
business part, which in turn are pieces of common economy, so the venture choice can be
influenced even by the financial and industry elements. The acceptance of a venture initiates
with principal scrutiny. Important investigation considers the monetary environment, industry
execution and organization implementation afore accepting a venture selection.
Pankaj Soni (2015): He conducted a research titled“Technical Analysis of FMCG Sector”. The
paper speaks regarding the core investigation of solid division. The basic investigation relies on
Economic, Industry and Company (EIC) Analysis. The paper also builds up a Multi-Regression
Model for forecasting Cement Company's offer costs (Dependent Variable) via four criteria that
is SENSEX, IIP, CPI and Realty Index (Independent Variable). For conducting the research,
validation on month-to-month offer costs and different variables was done and the most recent
(10 years) inputs were tried.
Micko Tanaka Ya mawakiet. Al., (2007) have conducted a study on “Adaptive use of
Technical Indicators for predicting the Intra-Day price movements”. The researcher has proposed
a system to select the best combination of technical indicators and their parameter values
adaptively by learning the patterns from the tick wise financial data. In this paper, the researcher
has shown that this system gives good predictions on the directors of motion with the hitting rate
at 10 ticks ahead of the decision point as high as 70% for foreign exchange rates (FX) in five
years from kl1996 to 2000 and 8 different stock prices in NYSE market in 1993 The study
concludes that the tick-wise price time series carry a long memory of the order of at least a few
minutes, which is equivalent to 10 ticks.
18
3. RESEARCH DESIGN
3.1PROBLEM STATEMENT
To analyze the price movement signal on selected stocks, which has been undertaken
for comparison by using some of technical analysis indicators available for analyzing 1
year trend or price pattern.
3.2 NEED FOR THE STUDY
• To understand what are ways to “time” your trades.
• To understand the patterns and then trade them, using history as a guide and the current
price as a catalyst.
• To understand the Price movement trends
3.3 OBJECTIVES OF THE STUDY
• To represent the price fluctuations based on a year.
• To discover the backing and resistant levels of individuals stocks with the help of
past prices.
• To recognize the purchase and offer circumstances from different analysis.
• To suggest the investor based on minor trend changes.
3.4 SCOPE OF THE STUDY
• The research is based upon the prices of 5 FMCG companies, i.e. ITC, KWALITY
DIARIES, HUL, GILLETTE, and BRITANNIA.
• The research is based upon the oscillators, tools for technical analysis and involves the
calculation of four oscillators that are MA, ROC, RSI& MACD.
• The research data includes weekly closing prices quoted on “The National Stock
Exchange”.
• Moving Average is been taken from 20 days average in each month.
• RSI & ROC is calculated on 12 months.
• MACD, Convergence is taken for 12 days and Divergence is been taken for 26 days.
19
3.5RESEARCH METHODOLOGY
3.5.1RESEARCH DESIGN
The Research for the present study covers the plan of analysis by following certain tools for the
analysis based on 1 year (2017) such as,
MOVING AVERAGE
Moving average is the method to analyze data points by creating series of average of
subsets of the full data sets.
Moving average = (sum of the closing price of n period)/ n period.
MACD (Moving Average Convergence and Divergence)
MACD is used to predict movements in the market. An analyst is generally in dilemma whether
to use long-term moving average or short term moving average.
MACD = Short period moving average – Long term moving average
RSI (Relative Strength Index)
The Relative Strength Index (RSI) is a trading indicator in the technical analysis of financial
markets. It is intended to indicate the current and historical strength or weakness of a market
based on the closing prices of completed trading periods.
RSI = 100 – [100/(1+RS)]
Where,
RS = Average gain per day / Average loss per day
RATE OF CHANGE (ROC)

20
In calculating ROC, current day’s market price is divided by the price, which is prevailed a few
days ago for shares. The value achieved so is identified as the ‘Rate of Change’ indicating
whether the prices at present are moving upward or downward as compared with the prices that
prevailed a few days ago.
3.5.2 DATA COLLECTION
Primary Sources:-
• Discussion with the superior.
• Discussion with the office members.
• Discussion with some speculators, investors, brokers.
Secondary Sources:-
• From the various websites like lkpsecurities.com, moneycontrol.com, NSE
INDIA.com, BSEINDIA.com, Googlesearch.com, Investopedia.com.
• Various financial journals, newspapers, books.
• Reports by administrators, specialists, researchers etc.
3.5.3 STATISTICAL TOOLS
• Use of technical tools like moving average, relative strength index,moving average convergence
and divergence.
• Identification of patterns and trends in the stock price movements.
• Putting the charts that are line charts disclosing the value and volume of the stock.
3.6 LIMITATIONS OF STUDY
The study is also having some limitations which restricts the study to some extent
• Could not collect exact or accurate primary data as some information could not
disclosed by company.
• The trends may not hold true in circumstances involving profit taking, short selling or
any other scams.

21
• Only five companies from the same sector were taken for study purpose.
• As technical analysis is not accurate recommendation made may not be perfect.
22
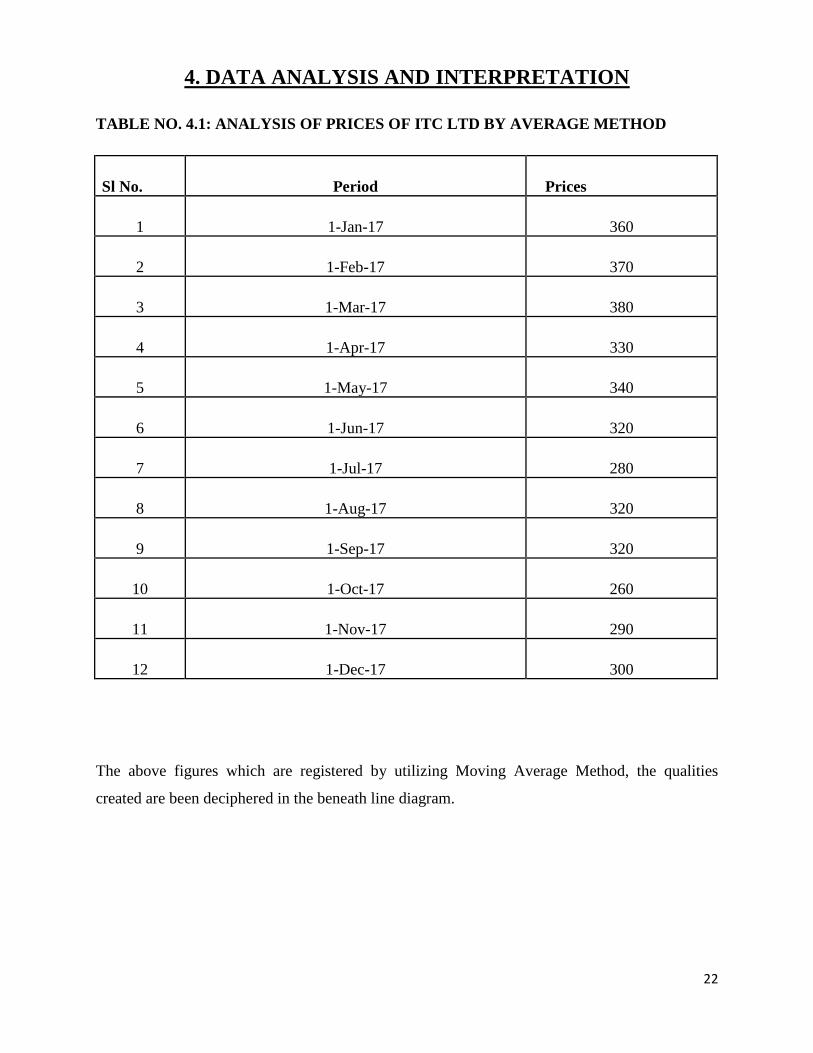
4. DATA ANALYSIS AND INTERPRETATION
TABLE NO. 4.1: ANALYSIS OF PRICES OF ITC LTD BY AVERAGE METHOD
Sl No. Period Prices
1 1-Jan-17 360
2 1-Feb-17 370
3 1-Mar-17 380
4 1-Apr-17 330
5 1-May-17 340
6 1-Jun-17 320
7 1-Jul-17 280
8 1-Aug-17 320
9 1-Sep-17 320
10 1-Oct-17 260
11 1-Nov-17 290
12 1-Dec-17 300
The above figures which are registered by utilizing Moving Average Method, the qualities
created are been deciphered in the beneath line diagram.
23
Interpretation of data :-
CHART NO. 4.1: 20DAYS MOVING AVEARGE OF ITC LTD
Here in the below chart horizontal axis shows dates and vertical axis shows the price and
the blue line inside the chart represents moving average.
According to the above outline moving normal that touched the most elevated cost in March,
which shows overbought circumstance inferring offering signal, and in July and October the
costs touched the least point demonstrating that it had been oversold so it recommends
purchasing.
0
50
100
150
200
250
300
350
400
Pri
ce
period
Price Fluctuation
24
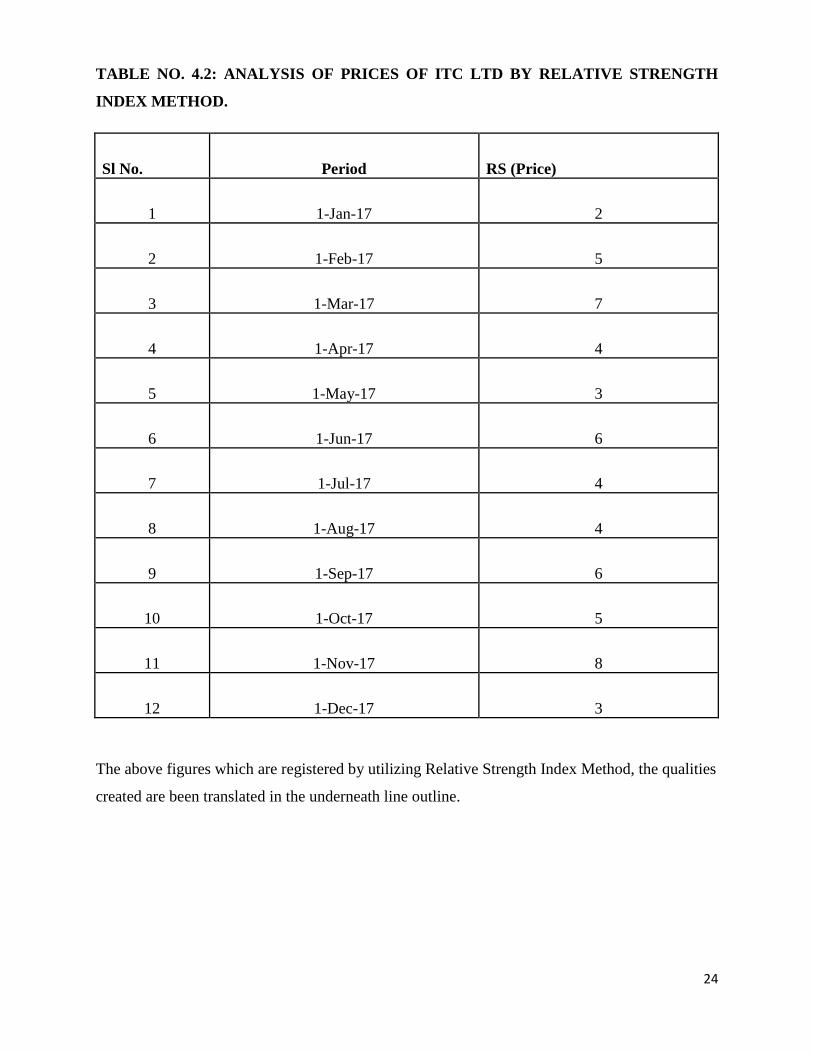
TABLE NO. 4.2: ANALYSIS OF PRICES OF ITC LTD BY RELATIVE STRENGTH
INDEX METHOD.
Sl No. Period RS (Price)
1 1-Jan-17 2
2 1-Feb-17 5
3 1-Mar-17 7
4 1-Apr-17 4
5 1-May-17 3
6 1-Jun-17 6
7 1-Jul-17 4
8 1-Aug-17 4
9 1-Sep-17 6
10 1-Oct-17 5
11 1-Nov-17 8
12 1-Dec-17 3
The above figures which are registered by utilizing Relative Strength Index Method, the qualities
created are been translated in the underneath line outline.
25
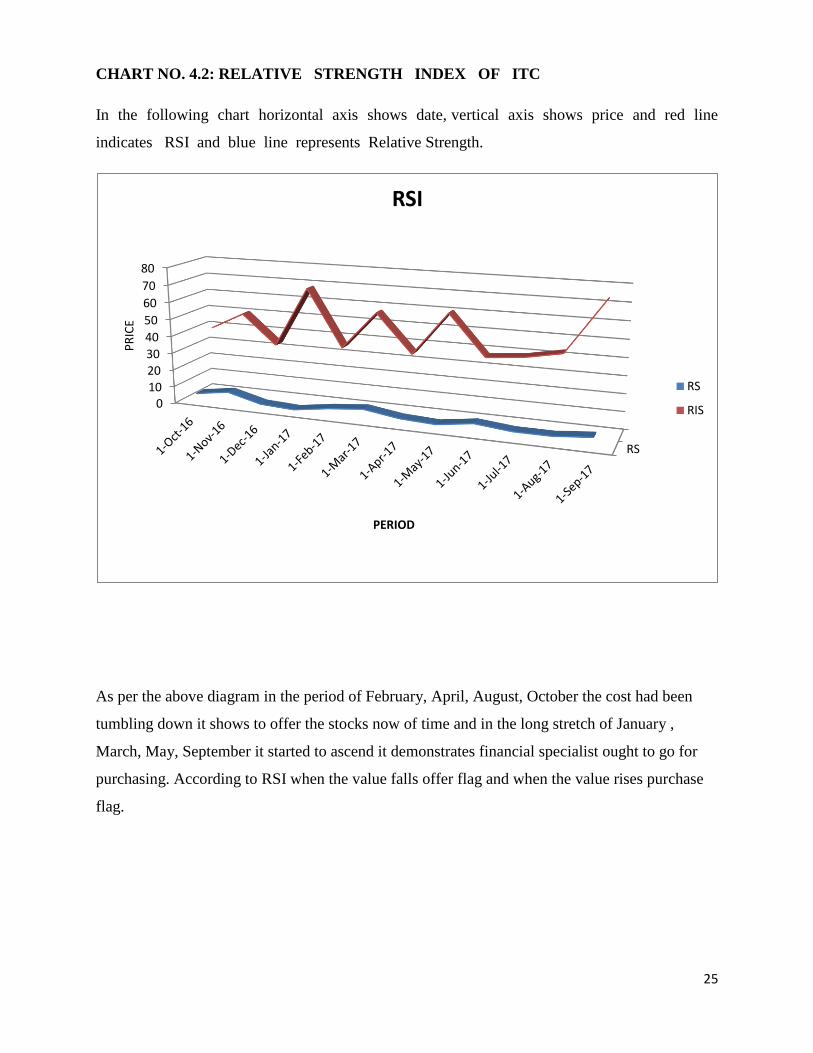
CHART NO. 4.2: RELATIVE STRENGTH INDEX OF ITC
In the following chart horizontal axis shows date, vertical axis shows price and red line
indicates RSI and blue line represents Relative Strength.
As per the above diagram in the period of February, April, August, October the cost had been
tumbling down it shows to offer the stocks now of time and in the long stretch of January ,
March, May, September it started to ascend it demonstrates financial specialist ought to go for
purchasing. According to RSI when the value falls offer flag and when the value rises purchase
flag.
RS
01020
30
40
50
60
70
80
PR
ICE
PERIOD
RSI
RS
RIS
26
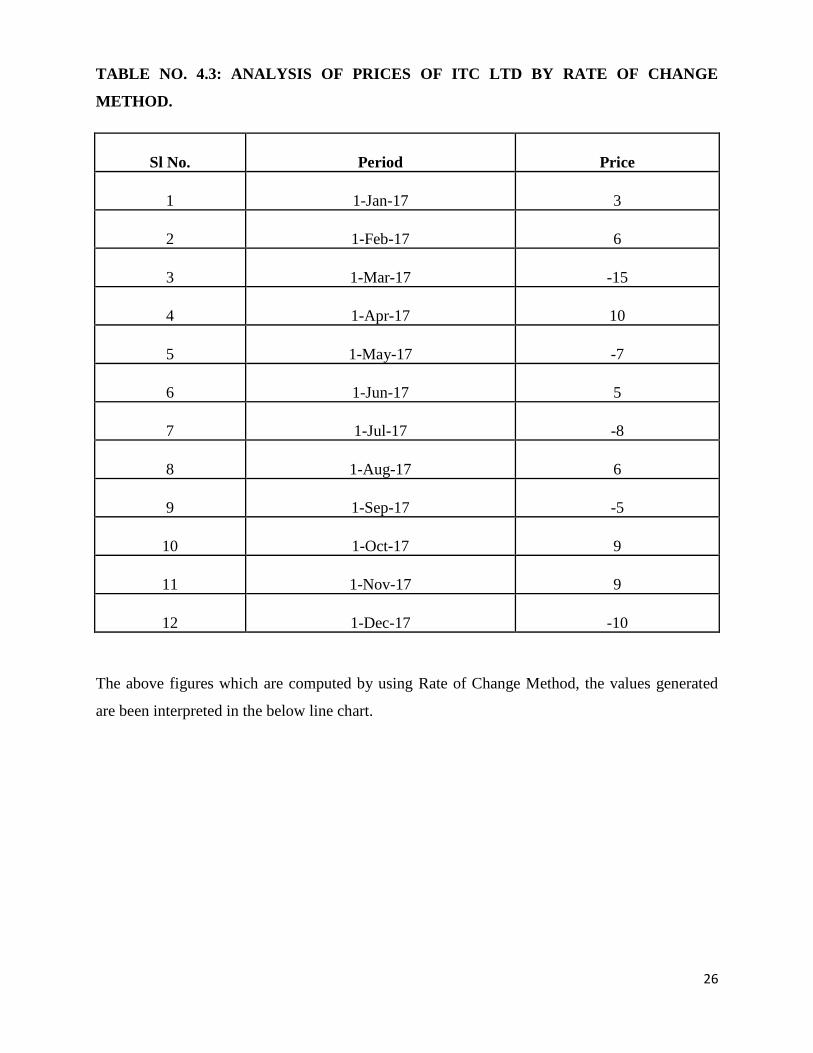
TABLE NO. 4.3: ANALYSIS OF PRICES OF ITC LTD BY RATE OF CHANGE
METHOD.
Sl No. Period Price
1 1-Jan-17 3
2 1-Feb-17 6
3 1-Mar-17 -15
4 1-Apr-17 10
5 1-May-17 -7
6 1-Jun-17 5
7 1-Jul-17 -8
8 1-Aug-17 6
9 1-Sep-17 -5
10 1-Oct-17 9
11 1-Nov-17 9
12 1-Dec-17 -10
The above figures which are computed by using Rate of Change Method, the values generated
are been interpreted in the below line chart.
27
CHART NO. 4.3: RATE OF CHANGE INDEX FOR ITC LTD
Rate of change Index of ITC ltd
In the above chart horizontal chart indicates date, vertical axis indicate price
Here if the ROC is beneath zero the cost is falling and if the ROC is over zero line the cost is
rising. The rising cost demonstrates bullish market and the falling cost shows bearish market . in
the long stretch of February , April, October the ROC achieved most noteworthy cost
demonstrates bullish markets which gives offer flag that implies it has over brought. In the long
stretch of walk, July, December the ROC is underneath zero line its shows bearish market
demonstrating oversold circumstance offers flag to purchase.
-20
-15
-10
-5
0
5
10
15
ROC
ROC
28
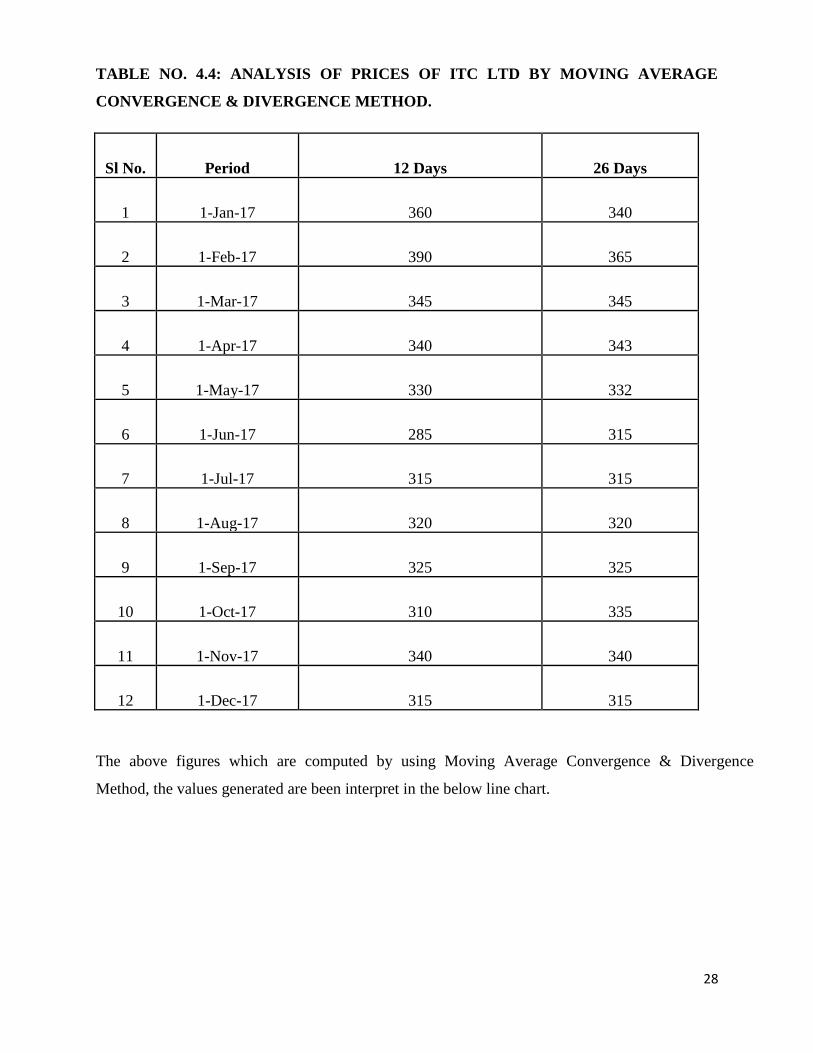
TABLE NO. 4.4: ANALYSIS OF PRICES OF ITC LTD BY MOVING AVERAGE
CONVERGENCE & DIVERGENCE METHOD.
Sl No. Period 12 Days 26 Days
1 1-Jan-17 360 340
2 1-Feb-17 390 365
3 1-Mar-17 345 345
4 1-Apr-17 340 343
5 1-May-17 330 332
6 1-Jun-17 285 315
7 1-Jul-17 315 315
8 1-Aug-17 320 320
9 1-Sep-17 325 325
10 1-Oct-17 310 335
11 1-Nov-17 340 340
12 1-Dec-17 315 315
The above figures which are computed by using Moving Average Convergence & Divergence
Method, the values generated are been interpret in the below line chart.
29
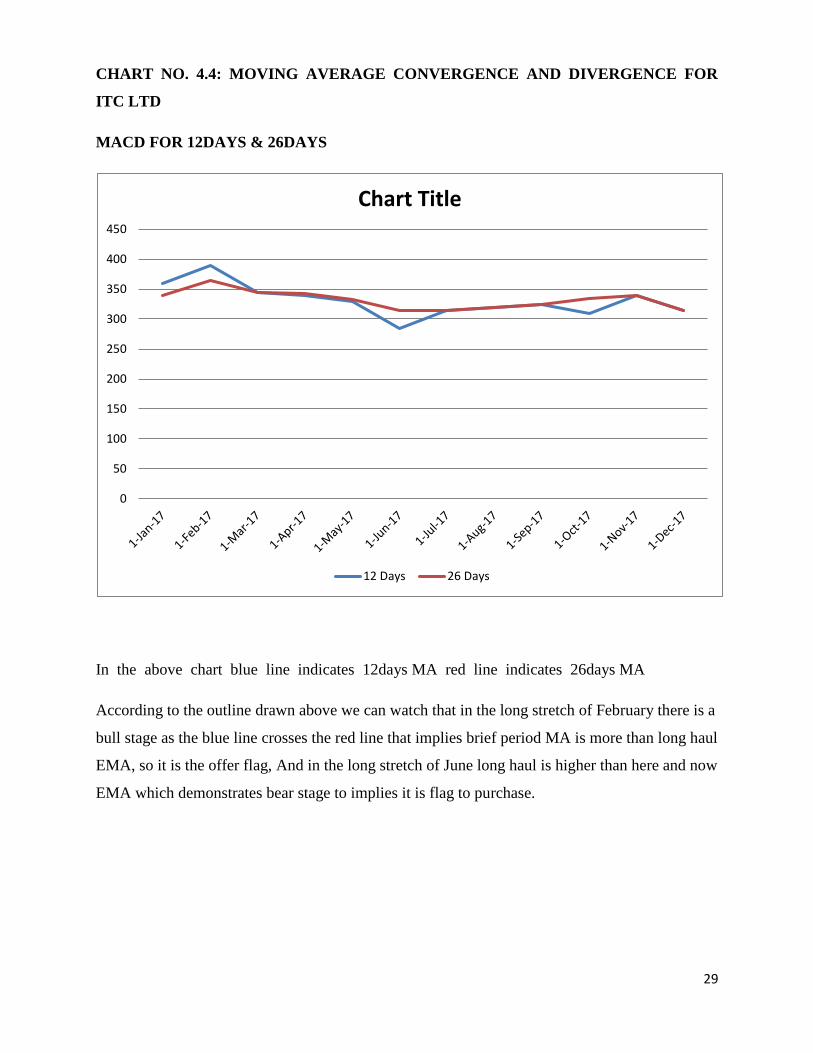
CHART NO. 4.4: MOVING AVERAGE CONVERGENCE AND DIVERGENCE FOR
ITC LTD
MACD FOR 12DAYS & 26DAYS
In the above chart blue line indicates 12days MA red line indicates 26days MA
According to the outline drawn above we can watch that in the long stretch of February there is a
bull stage as the blue line crosses the red line that implies brief period MA is more than long haul
EMA, so it is the offer flag, And in the long stretch of June long haul is higher than here and now
EMA which demonstrates bear stage to implies it is flag to purchase.
0
50
100
150
200
250
300
350
400
450
Chart Title
12 Days 26 Days
30
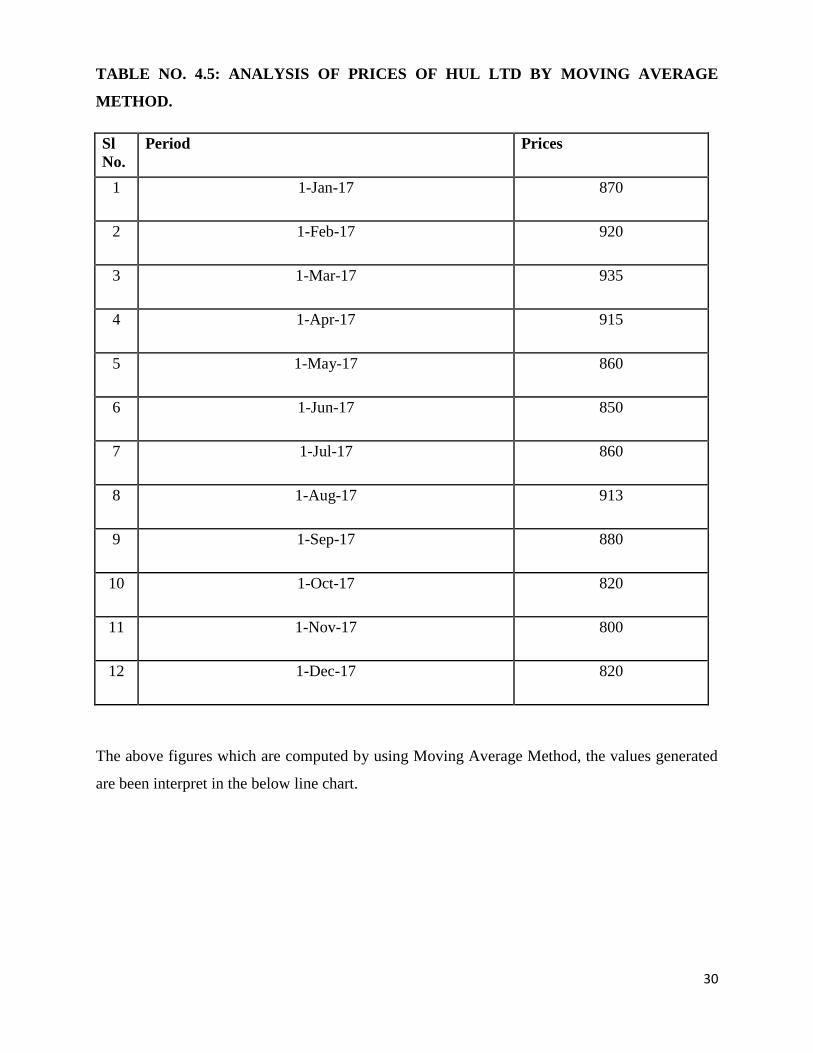
TABLE NO. 4.5: ANALYSIS OF PRICES OF HUL LTD BY MOVING AVERAGE
METHOD.
Sl
No.
Period Prices
1 1-Jan-17 870
2 1-Feb-17 920
3 1-Mar-17 935
4 1-Apr-17 915
5 1-May-17 860
6 1-Jun-17 850
7 1-Jul-17 860
8 1-Aug-17 913
9 1-Sep-17 880
10 1-Oct-17 820
11 1-Nov-17 800
12 1-Dec-17 820
The above figures which are computed by using Moving Average Method, the values generated
are been interpret in the below line chart.
31
CHART NO. 4.5: 20 DAYS MOVING AVERAGE OF HUL
Horizontal axis indicates date and vertical axis indicates price in the below chart
20days Moving average of HUL
Here in the above graph the cost achieved most elevated in the long stretch of January, walk, and
August which demonstrates over brought which implies financial specialist ought to go for offering
choice and in the month October and November it has come down to the minimum which shows
oversold which recommend to go for purchasing.
700
750
800
850
900
950
Pri
ce
Period
MA
32
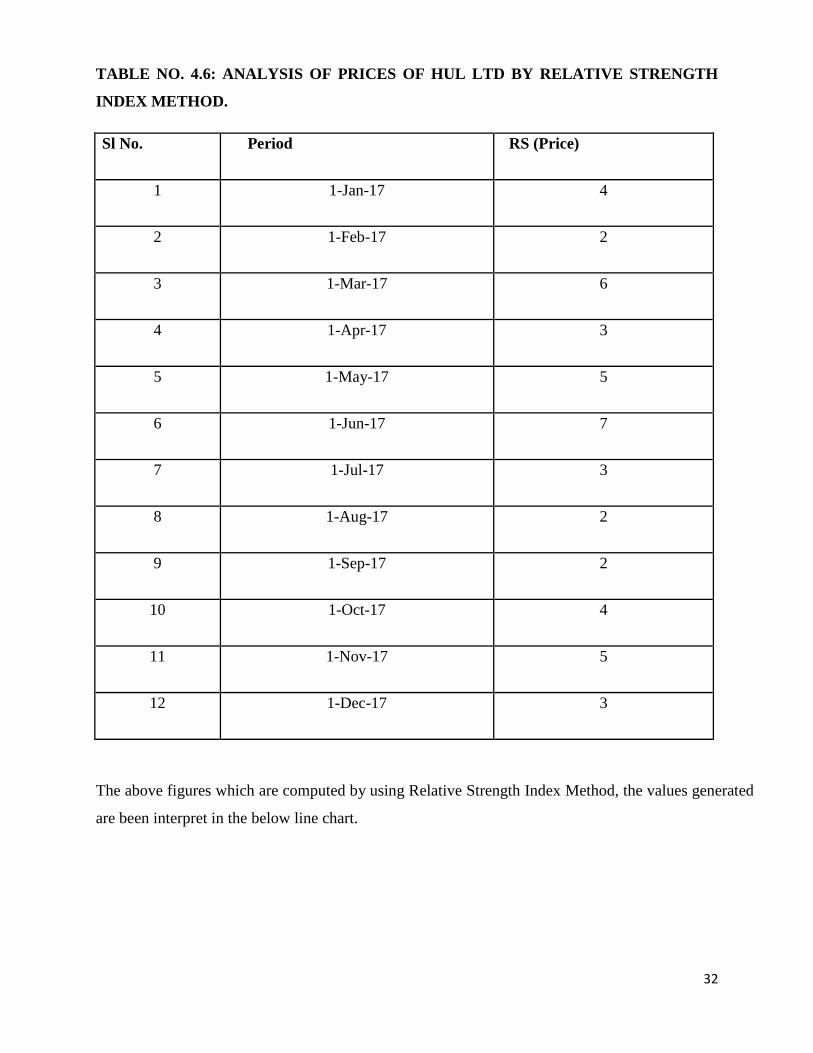
TABLE NO. 4.6: ANALYSIS OF PRICES OF HUL LTD BY RELATIVE STRENGTH
INDEX METHOD.
Sl No. Period RS (Price)
1 1-Jan-17 4
2 1-Feb-17 2
3 1-Mar-17 6
4 1-Apr-17 3
5 1-May-17 5
6 1-Jun-17 7
7 1-Jul-17 3
8 1-Aug-17 2
9 1-Sep-17 2
10 1-Oct-17 4
11 1-Nov-17 5
12 1-Dec-17 3
The above figures which are computed by using Relative Strength Index Method, the values generated
are been interpret in the below line chart.
33
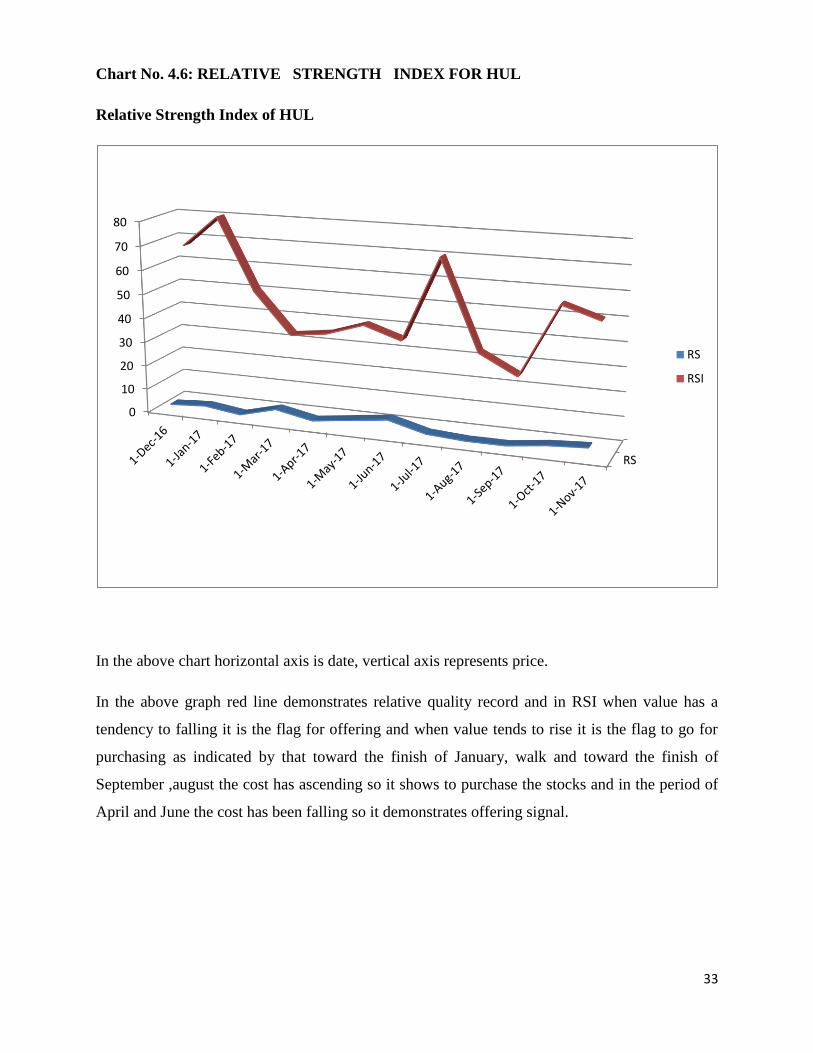
Chart No. 4.6: RELATIVE STRENGTH INDEX FOR HUL
Relative Strength Index of HUL
In the above chart horizontal axis is date, vertical axis represents price.
In the above graph red line demonstrates relative quality record and in RSI when value has a
tendency to falling it is the flag for offering and when value tends to rise it is the flag to go for
purchasing as indicated by that toward the finish of January, walk and toward the finish of
September ,august the cost has ascending so it shows to purchase the stocks and in the period of
April and June the cost has been falling so it demonstrates offering signal.
RS
0
10
20
30
40
50
60
70
80
RS
RSI
34
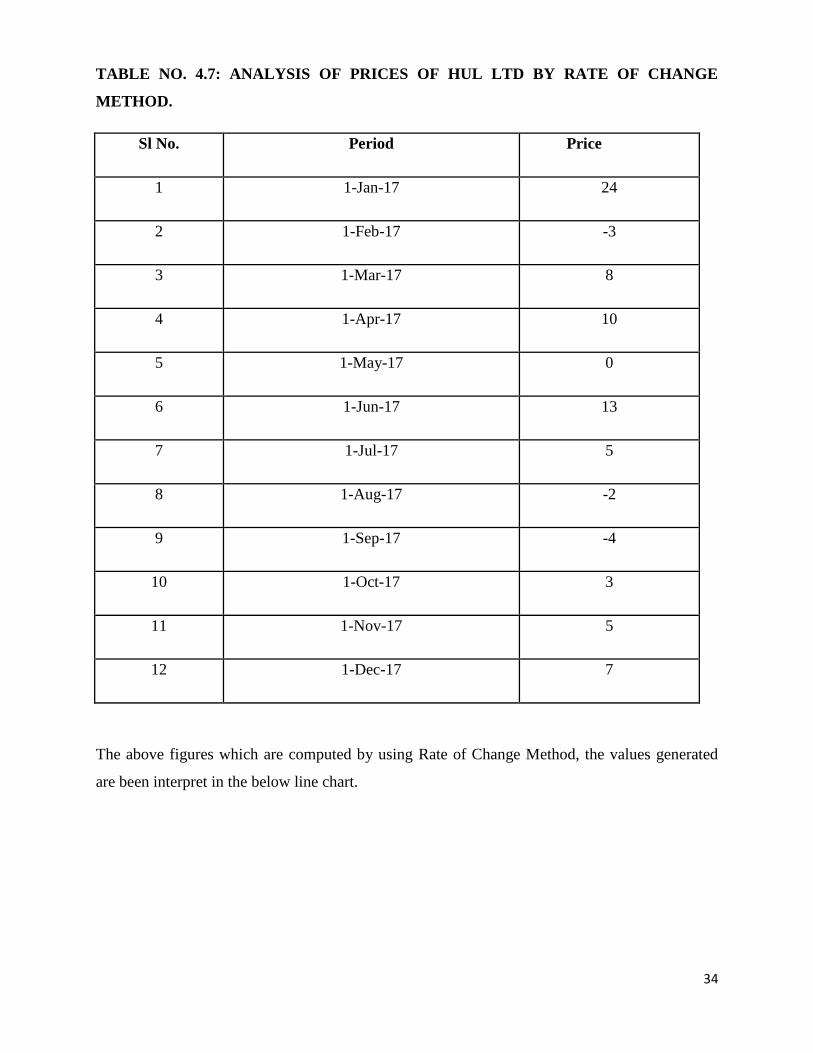
TABLE NO. 4.7: ANALYSIS OF PRICES OF HUL LTD BY RATE OF CHANGE
METHOD.
Sl No. Period Price
1 1-Jan-17 24
2 1-Feb-17 -3
3 1-Mar-17 8
4 1-Apr-17 10
5 1-May-17 0
6 1-Jun-17 13
7 1-Jul-17 5
8 1-Aug-17 -2
9 1-Sep-17 -4
10 1-Oct-17 3
11 1-Nov-17 5
12 1-Dec-17 7
The above figures which are computed by using Rate of Change Method, the values generated
are been interpret in the below line chart.
35
CHART NO. 4.7: RATE OF CHANGE INDEX FOR HUL
In the above chart horizontal axis indicates date, vertical axis indicates price.
As per ROC (rate of progress) the cost over zero line implies cost is rising it demonstrates bullish
market and cost beneath zero line implies cost is tumbling down which shows bearish market. In
the above diagram in the long stretch of January , April, and toward the finish of June the cost
has come to most astounding point which implies it is the flag for offering the stocks and toward
the finish of February and end of September the cost has tumbled down to its least point which
implies it's smarter to go for purchasing at that development.
-10
-5
0
5
10
15
20
25
30
ROC
ROC
36
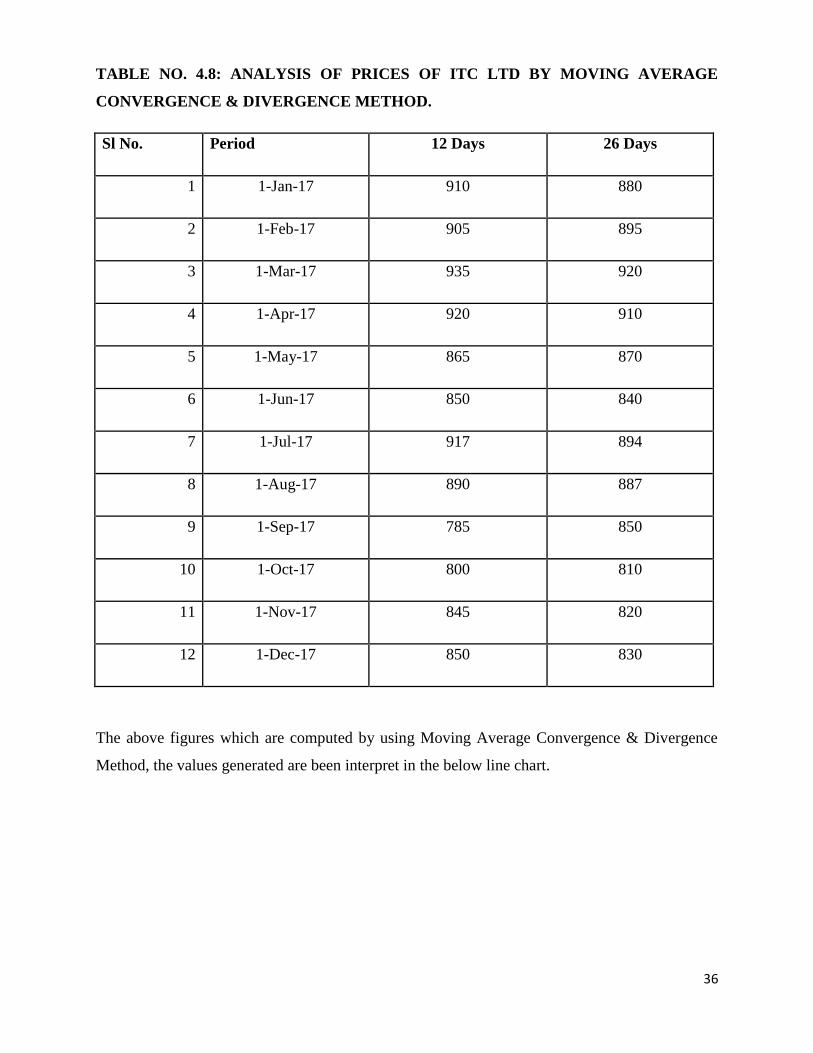
TABLE NO. 4.8: ANALYSIS OF PRICES OF ITC LTD BY MOVING AVERAGE
CONVERGENCE & DIVERGENCE METHOD.
Sl No. Period 12 Days 26 Days
1 1-Jan-17 910 880
2 1-Feb-17 905 895
3 1-Mar-17 935 920
4 1-Apr-17 920 910
5 1-May-17 865 870
6 1-Jun-17 850 840
7 1-Jul-17 917 894
8 1-Aug-17 890 887
9 1-Sep-17 785 850
10 1-Oct-17 800 810
11 1-Nov-17 845 820
12 1-Dec-17 850 830
The above figures which are computed by using Moving Average Convergence & Divergence
Method, the values generated are been interpret in the below line chart.
37
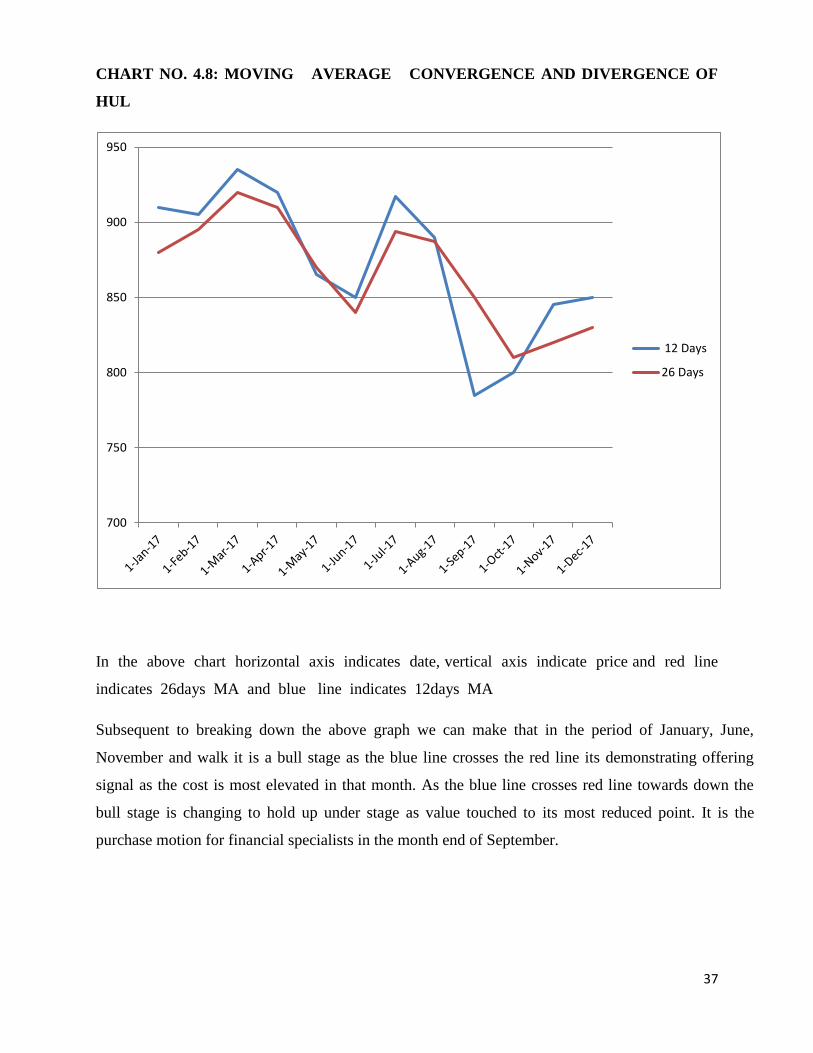
CHART NO. 4.8: MOVING AVERAGE CONVERGENCE AND DIVERGENCE OF
HUL
In the above chart horizontal axis indicates date, vertical axis indicate price and red line
indicates 26days MA and blue line indicates 12days MA
Subsequent to breaking down the above graph we can make that in the period of January, June,
November and walk it is a bull stage as the blue line crosses the red line its demonstrating offering
signal as the cost is most elevated in that month. As the blue line crosses red line towards down the
bull stage is changing to hold up under stage as value touched to its most reduced point. It is the
purchase motion for financial specialists in the month end of September.
700
750
800
850
900
950
12 Days
26 Days
38
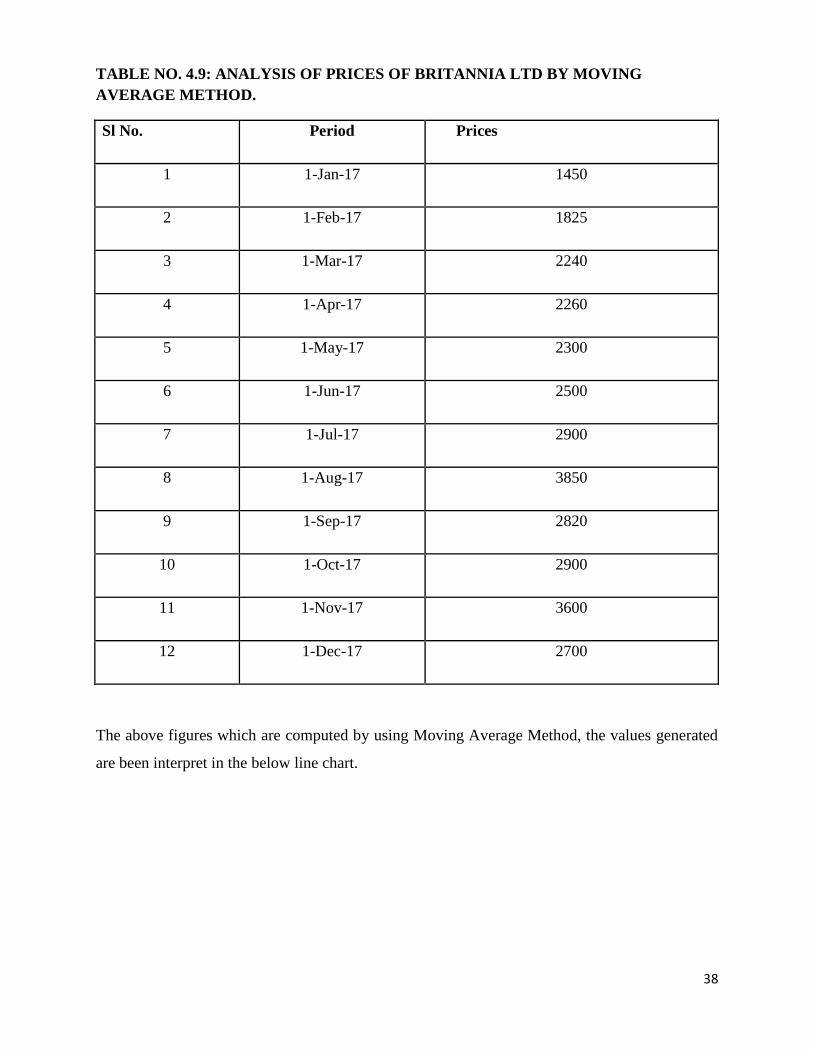
TABLE NO. 4.9: ANALYSIS OF PRICES OF BRITANNIA LTD BY MOVING
AVERAGE METHOD.
Sl No. Period Prices
1 1-Jan-17 1450
2 1-Feb-17 1825
3 1-Mar-17 2240
4 1-Apr-17 2260
5 1-May-17 2300
6 1-Jun-17 2500
7 1-Jul-17 2900
8 1-Aug-17 3850
9 1-Sep-17 2820
10 1-Oct-17 2900
11 1-Nov-17 3600
12 1-Dec-17 2700
The above figures which are computed by using Moving Average Method, the values generated
are been interpret in the below line chart.
39
Chart No. 4.9: 20DAYS MOVING AVERAGE OF BRITANNIA
According to come about appeared in the above graph the cost has achieved most astounding point
toward the finish of august and in November which shows stocks are over conveyed which propose to
offer right now and cost has come to the least cost in January which demonstrates the stocks were over
sold its recommend to purchase the stocks as of right now.
0
500
1000
1500
2000
2500
3000
3500
4000
4500P
rice
Period
MA
40
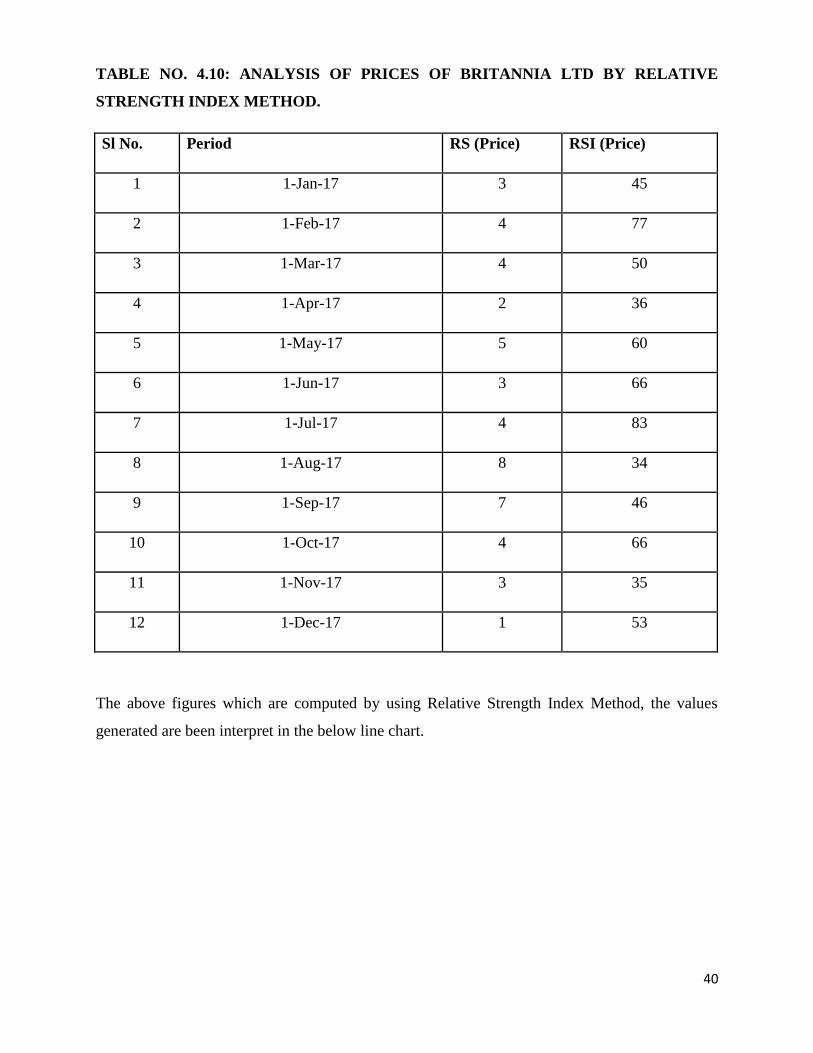
TABLE NO. 4.10: ANALYSIS OF PRICES OF BRITANNIA LTD BY RELATIVE
STRENGTH INDEX METHOD.
Sl No. Period RS (Price) RSI (Price)
1 1-Jan-17 3 45
2 1-Feb-17 4 77
3 1-Mar-17 4 50
4 1-Apr-17 2 36
5 1-May-17 5 60
6 1-Jun-17 3 66
7 1-Jul-17 4 83
8 1-Aug-17 8 34
9 1-Sep-17 7 46
10 1-Oct-17 4 66
11 1-Nov-17 3 35
12 1-Dec-17 1 53
The above figures which are computed by using Relative Strength Index Method, the values
generated are been interpret in the below line chart.
41
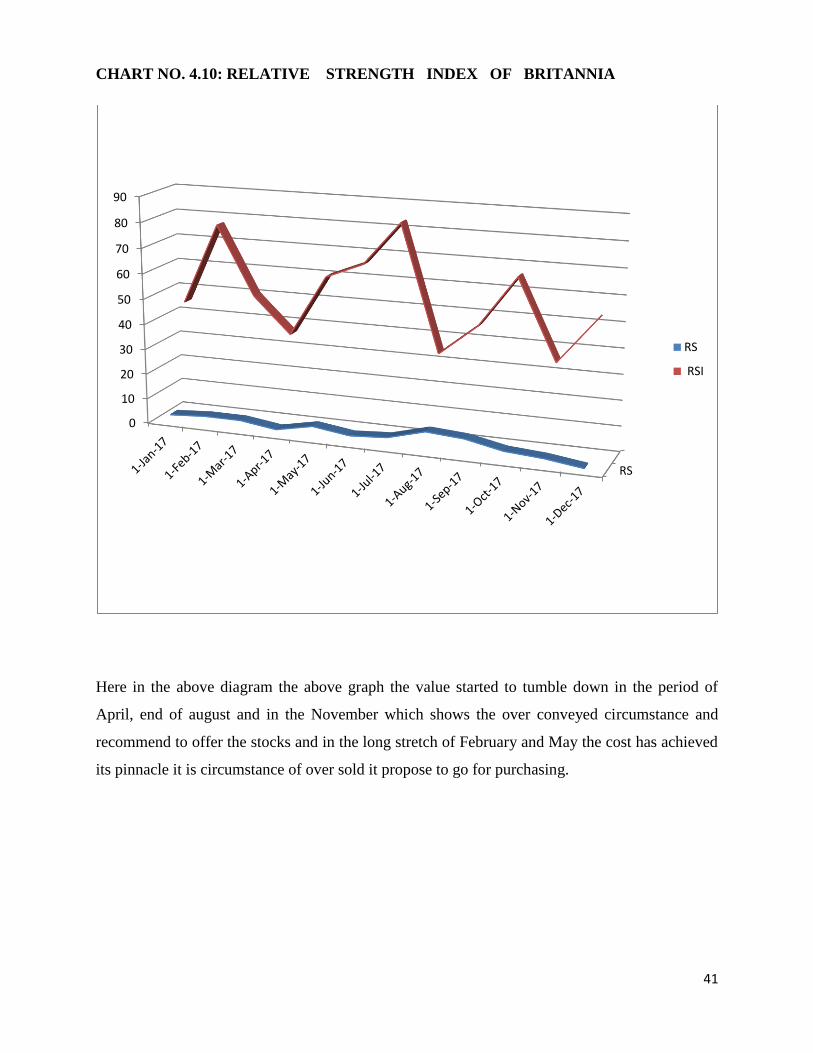
CHART NO. 4.10: RELATIVE STRENGTH INDEX OF BRITANNIA
Here in the above diagram the above graph the value started to tumble down in the period of
April, end of august and in the November which shows the over conveyed circumstance and
recommend to offer the stocks and in the long stretch of February and May the cost has achieved
its pinnacle it is circumstance of over sold it propose to go for purchasing.
RS
0
10
20
30
40
50
60
70
80
90
RS
RSI
42
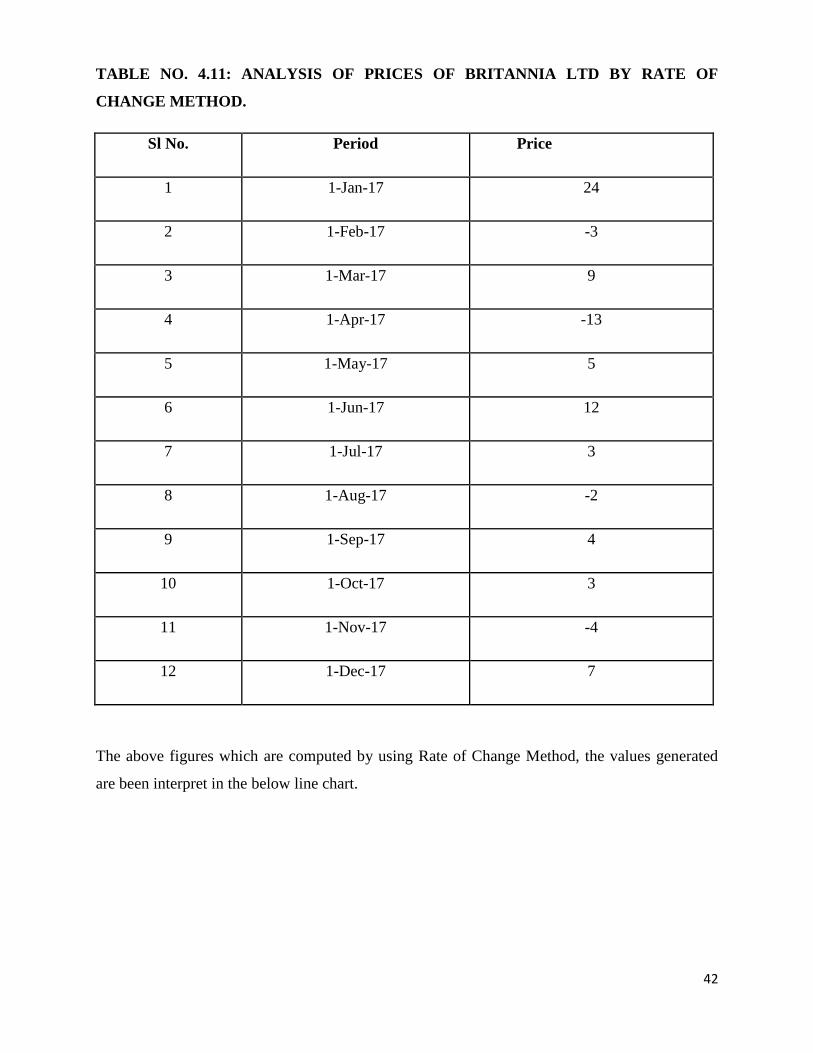
TABLE NO. 4.11: ANALYSIS OF PRICES OF BRITANNIA LTD BY RATE OF
CHANGE METHOD.
Sl No. Period Price
1 1-Jan-17 24
2 1-Feb-17 -3
3 1-Mar-17 9
4 1-Apr-17 -13
5 1-May-17 5
6 1-Jun-17 12
7 1-Jul-17 3
8 1-Aug-17 -2
9 1-Sep-17 4
10 1-Oct-17 3
11 1-Nov-17 -4
12 1-Dec-17 7
The above figures which are computed by using Rate of Change Method, the values generated
are been interpret in the below line chart.
43
CHART NO.4.11: RATE OF CHANGE OF BRITANNIA INDUSTRY
In the above chart horizontal axis represents date, vertical axis represents price.
In ROC the cost over zero line implies value tends to rise and demonstrates bullish market and
cost underneath zero line implies value tends to fall and it shows bearish market the cost has
achieved most elevated in the long stretch of January and toward the finish of June which
demonstrates offer signs due to over brought of securities however in the period of November
and toward the finish of April cost has tumbled down to least which show to purchase the
securities.
-15
-10
-5
0
5
10
15
20
25
30
ROC
ROC

44
TABLE NO. 4.12: ANALYSIS OF PRICES OF BRITANNIA LTD BY MOVING
AVERAGE CONVERGENCE & DIVERGENCE METHOD.
Sl No. Period 12 Days 26 Days
1 1-Jan-17 1980 1980
2 1-Feb-17 2065 1900
3 1-Mar-17 2200 2100
4 1-Apr-17 2175 2175
5 1-May-17 2550 2430
6 1-Jun-17 2760 2620
7 1-Jul-17 3000 2860
8 1-Aug-17 3200 2600
9 1-Sep-17 2690 2700
10 1-Oct-17 3240 3190
11 1-Nov-17 3200 3400
12 1-Dec-17 2964 3000
The above figures which are computed by using Moving Average Convergence & Divergence
Method, the values generated are been interpret in the below line chart.
45
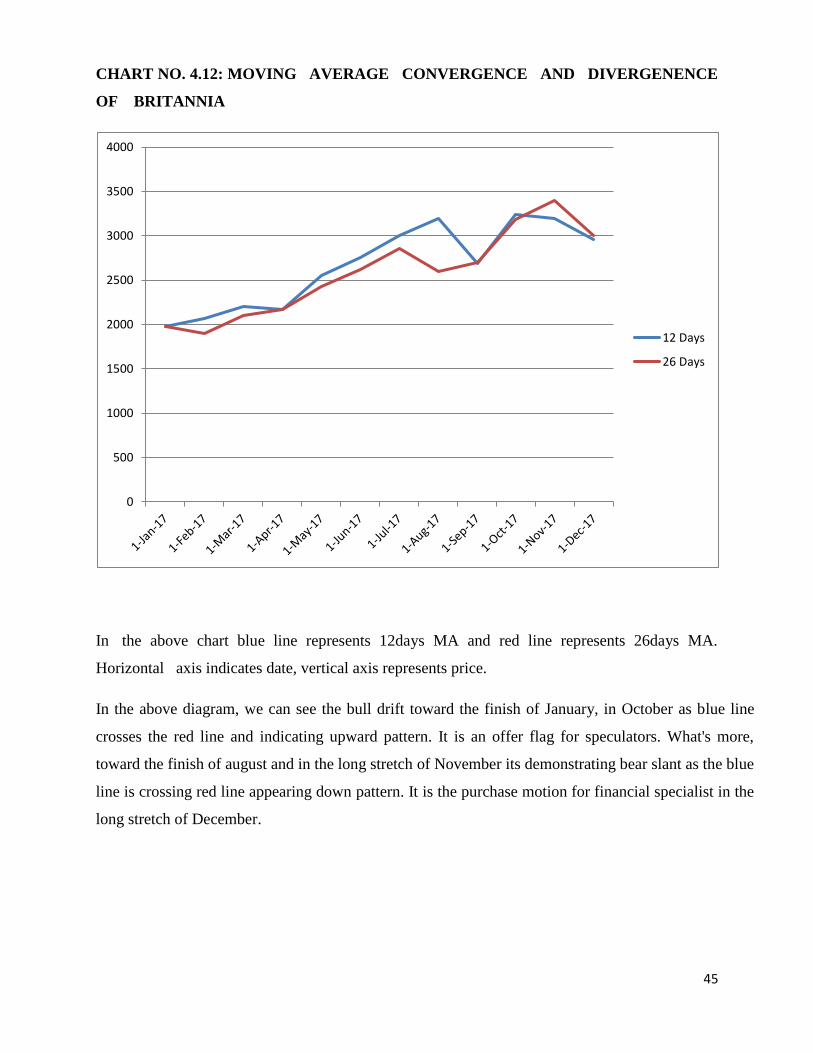
CHART NO. 4.12: MOVING AVERAGE CONVERGENCE AND DIVERGENENCE
OF BRITANNIA
In the above chart blue line represents 12days MA and red line represents 26days MA.
Horizontal axis indicates date, vertical axis represents price.
In the above diagram, we can see the bull drift toward the finish of January, in October as blue line
crosses the red line and indicating upward pattern. It is an offer flag for speculators. What's more,
toward the finish of august and in the long stretch of November its demonstrating bear slant as the blue
line is crossing red line appearing down pattern. It is the purchase motion for financial specialist in the
long stretch of December.
0
500
1000
1500
2000
2500
3000
3500
4000
12 Days
26 Days
46
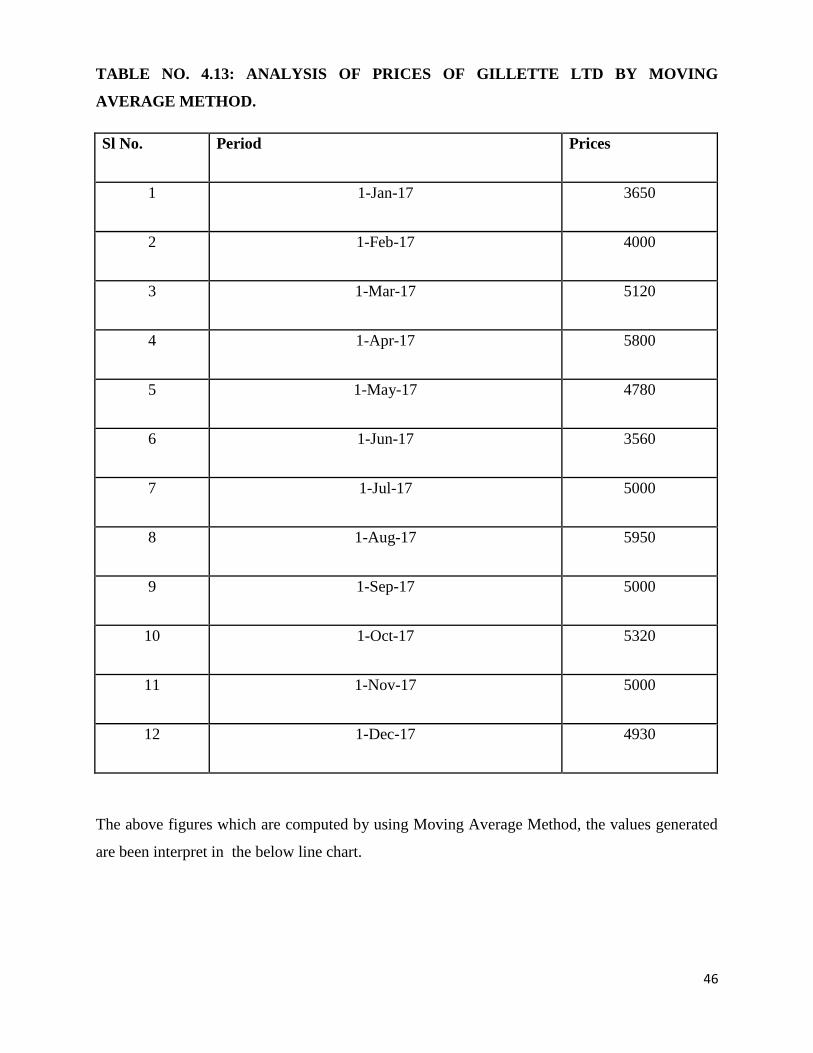
TABLE NO. 4.13: ANALYSIS OF PRICES OF GILLETTE LTD BY MOVING
AVERAGE METHOD.
Sl No. Period Prices
1 1-Jan-17 3650
2 1-Feb-17 4000
3 1-Mar-17 5120
4 1-Apr-17 5800
5 1-May-17 4780
6 1-Jun-17 3560
7 1-Jul-17 5000
8 1-Aug-17 5950
9 1-Sep-17 5000
10 1-Oct-17 5320
11 1-Nov-17 5000
12 1-Dec-17 4930
The above figures which are computed by using Moving Average Method, the values generated
are been interpret in the below line chart.
47
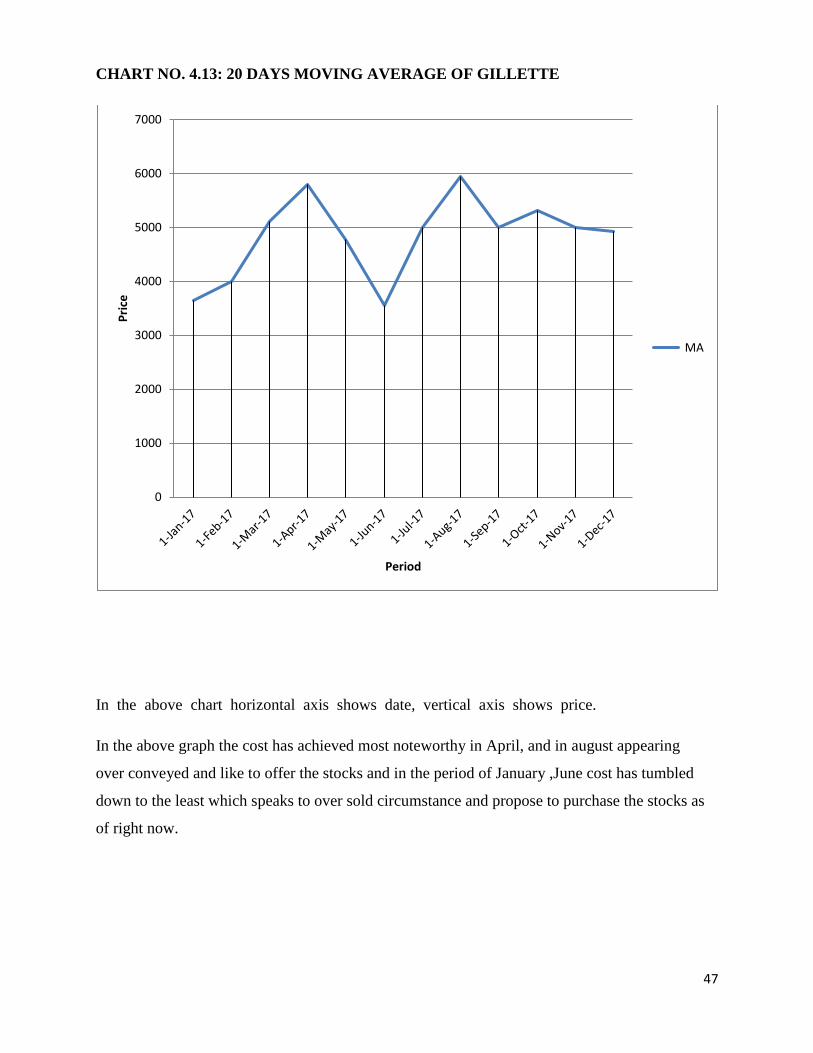
CHART NO. 4.13: 20 DAYS MOVING AVERAGE OF GILLETTE
In the above chart horizontal axis shows date, vertical axis shows price.
In the above graph the cost has achieved most noteworthy in April, and in august appearing
over conveyed and like to offer the stocks and in the period of January ,June cost has tumbled
down to the least which speaks to over sold circumstance and propose to purchase the stocks as
of right now.
0
1000
2000
3000
4000
5000
6000
7000P
rice
Period
MA
48
TABLE NO. 4.14: ANALYSIS OF PRICES OF GILLETTE LTD BY RELATIVE
STRENGTH INDEX METHOD.
Sl No. Period RS (Price)
1 1-Jan-17 8
2 1-Feb-17 5
3 1-Mar-17 3
4 1-Apr-17 3
5 1-May-17 4
6 1-Jun-17 6
7 1-Jul-17 4
8 1-Aug-17 4
9 1-Sep-17 6
10 1-Oct-17 5
11 1-Nov-17 4
12 1-Dec-17 2
The above figures which are computed by using Relative Strength Index Method, the values
generated are been interpret in the below line chart.
49
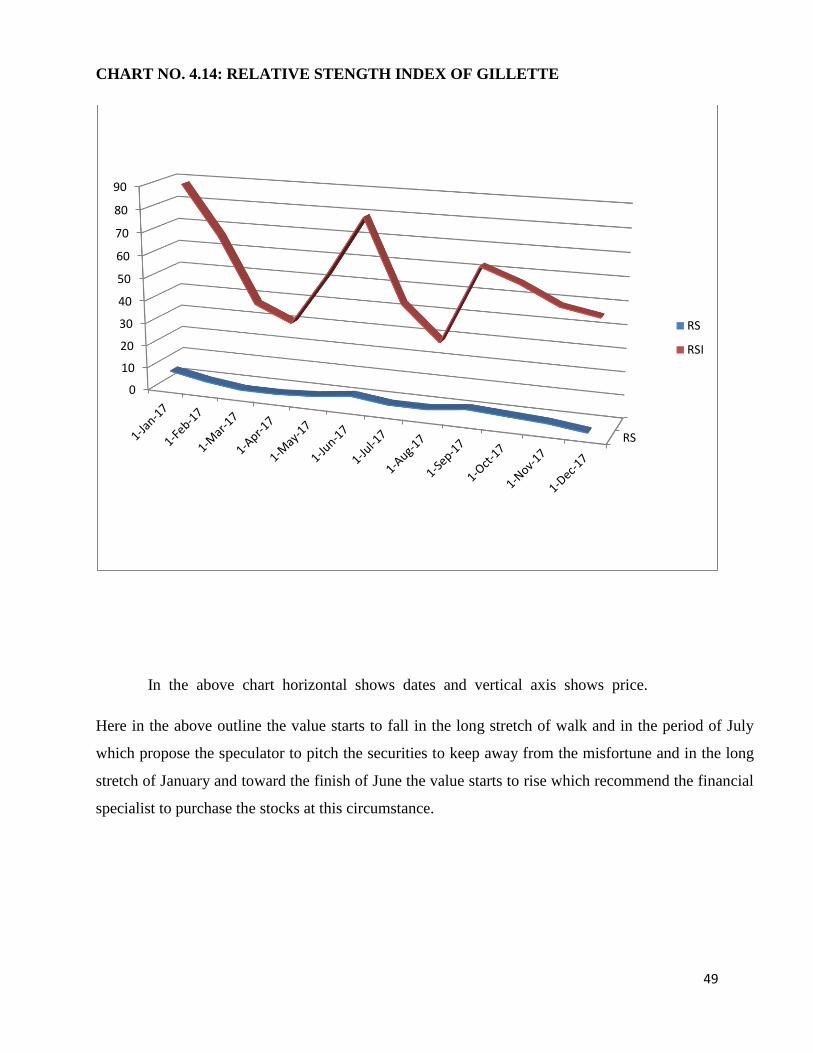
CHART NO. 4.14: RELATIVE STENGTH INDEX OF GILLETTE
In the above chart horizontal shows dates and vertical axis shows price.
Here in the above outline the value starts to fall in the long stretch of walk and in the period of July
which propose the speculator to pitch the securities to keep away from the misfortune and in the long
stretch of January and toward the finish of June the value starts to rise which recommend the financial
specialist to purchase the stocks at this circumstance.
RS
0
10
20
30
40
50
60
70
80
90
RS
RSI
50
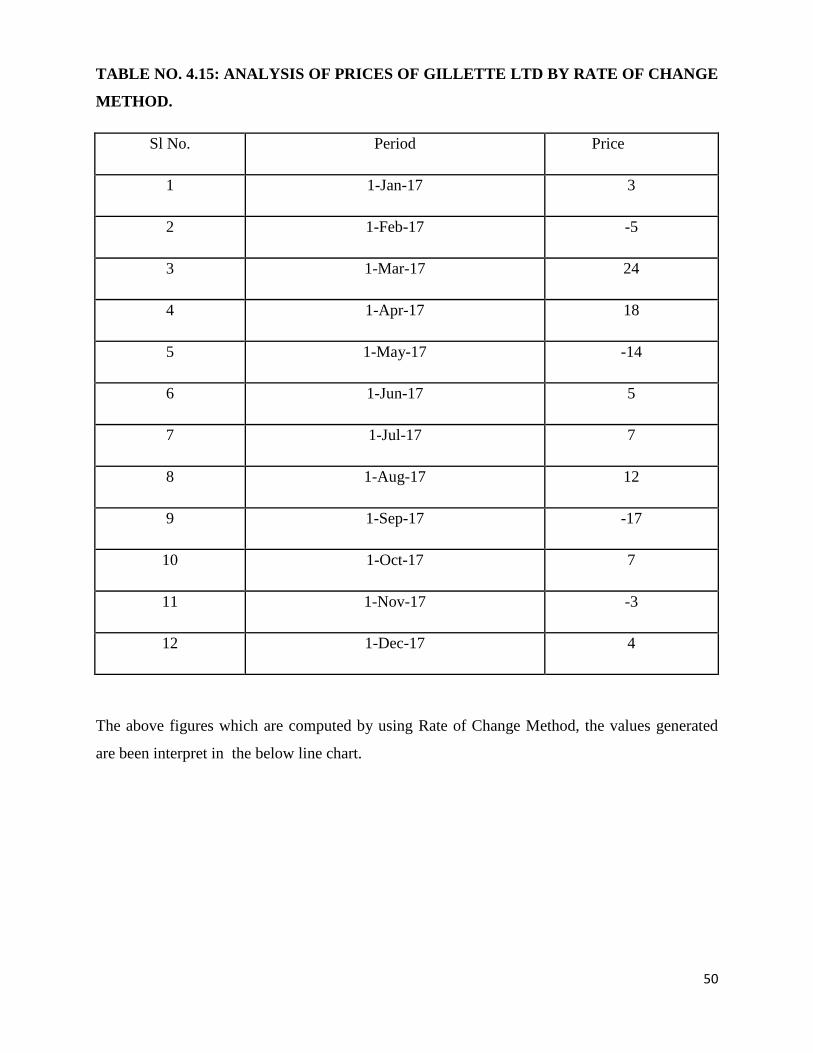
TABLE NO. 4.15: ANALYSIS OF PRICES OF GILLETTE LTD BY RATE OF CHANGE
METHOD.
Sl No. Period Price
1 1-Jan-17 3
2 1-Feb-17 -5
3 1-Mar-17 24
4 1-Apr-17 18
5 1-May-17 -14
6 1-Jun-17 5
7 1-Jul-17 7
8 1-Aug-17 12
9 1-Sep-17 -17
10 1-Oct-17 7
11 1-Nov-17 -3
12 1-Dec-17 4
The above figures which are computed by using Rate of Change Method, the values generated
are been interpret in the below line chart.
51
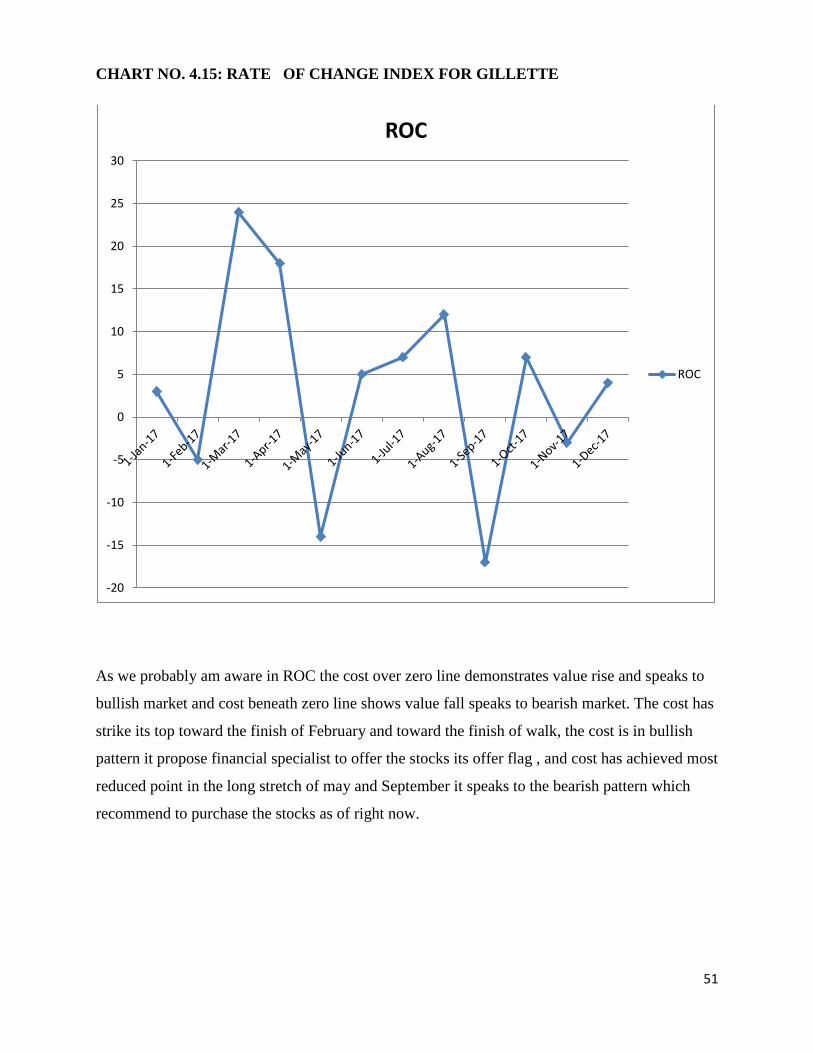
CHART NO. 4.15: RATE OF CHANGE INDEX FOR GILLETTE
As we probably am aware in ROC the cost over zero line demonstrates value rise and speaks to
bullish market and cost beneath zero line shows value fall speaks to bearish market. The cost has
strike its top toward the finish of February and toward the finish of walk, the cost is in bullish
pattern it propose financial specialist to offer the stocks its offer flag , and cost has achieved most
reduced point in the long stretch of may and September it speaks to the bearish pattern which
recommend to purchase the stocks as of right now.
-20
-15
-10
-5
0
5
10
15
20
25
30
ROC
ROC
52
TABLE NO. 4.17: ANALYSIS OF PRICES OF GILLETTE LTD BY MOVING
AVERAGE CONVERGENCE & DIVERGENCE METHOD.
Sl No. Period 12 Days
1 1-Jan-17 3380
2 1-Feb-17 4500
3 1-Mar-17 4400
4 1-Apr-17 4600
5 1-May-17 4500
6 1-Jun-17 4350
7 1-Jul-17 5000
8 1-Aug-17 5120
9 1-Sep-17 4500
10 1-Oct-17 4780
11 1-Nov-17 4930
12 1-Dec-17 4500
The above figures which are computed by using Moving Average Convergence & Divergence
Method, the values generated are been interpret in the below line chart.
53
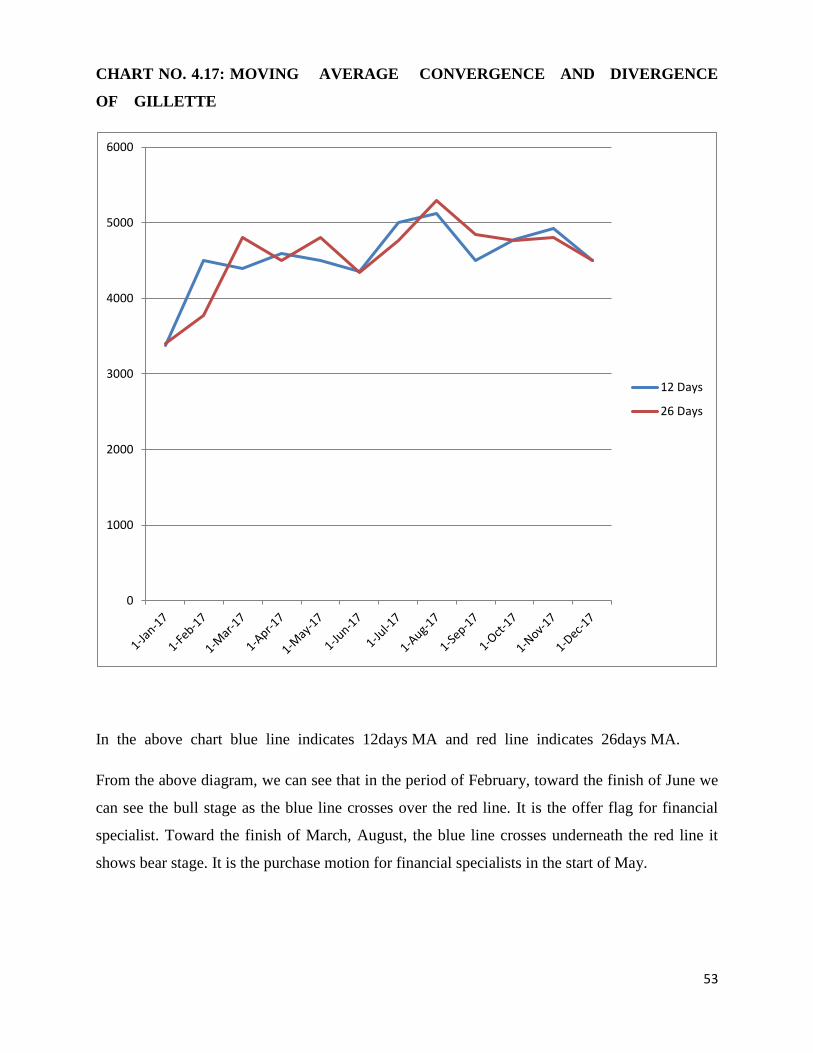
CHART NO. 4.17: MOVING AVERAGE CONVERGENCE AND DIVERGENCE
OF GILLETTE
In the above chart blue line indicates 12days MA and red line indicates 26days MA.
From the above diagram, we can see that in the period of February, toward the finish of June we
can see the bull stage as the blue line crosses over the red line. It is the offer flag for financial
specialist. Toward the finish of March, August, the blue line crosses underneath the red line it
shows bear stage. It is the purchase motion for financial specialists in the start of May.
0
1000
2000
3000
4000
5000
6000
12 Days
26 Days
54
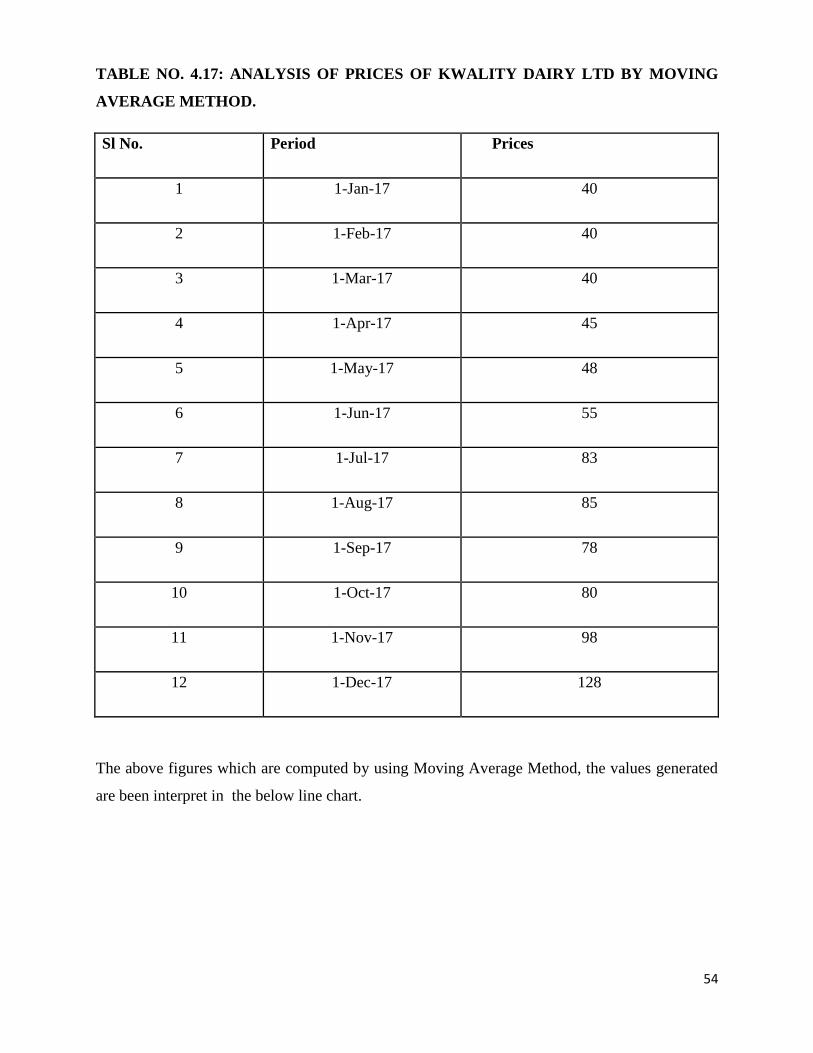
TABLE NO. 4.17: ANALYSIS OF PRICES OF KWALITY DAIRY LTD BY MOVING
AVERAGE METHOD.
Sl No. Period Prices
1 1-Jan-17 40
2 1-Feb-17 40
3 1-Mar-17 40
4 1-Apr-17 45
5 1-May-17 48
6 1-Jun-17 55
7 1-Jul-17 83
8 1-Aug-17 85
9 1-Sep-17 78
10 1-Oct-17 80
11 1-Nov-17 98
12 1-Dec-17 128
The above figures which are computed by using Moving Average Method, the values generated
are been interpret in the below line chart.
55
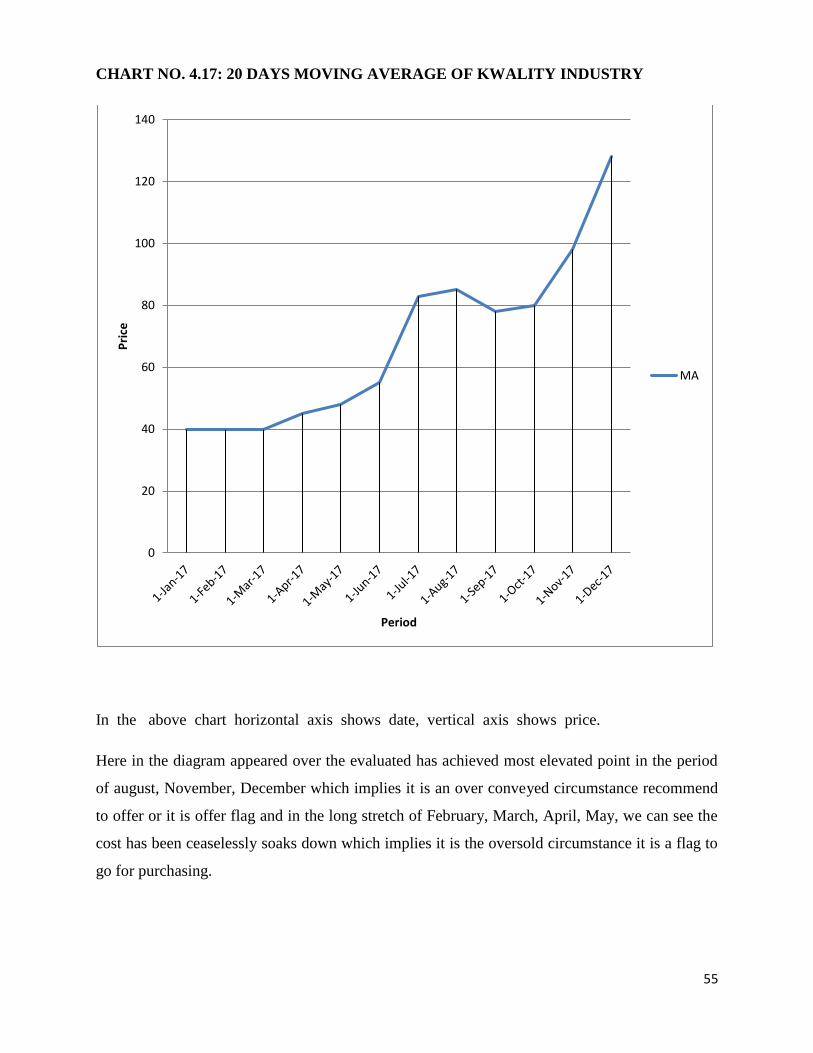
CHART NO. 4.17: 20 DAYS MOVING AVERAGE OF KWALITY INDUSTRY
In the above chart horizontal axis shows date, vertical axis shows price.
Here in the diagram appeared over the evaluated has achieved most elevated point in the period
of august, November, December which implies it is an over conveyed circumstance recommend
to offer or it is offer flag and in the long stretch of February, March, April, May, we can see the
cost has been ceaselessly soaks down which implies it is the oversold circumstance it is a flag to
go for purchasing.
0
20
40
60
80
100
120
140P
rice
Period
MA
56
TABLE NO. 4.18: ANALYSIS OF PRICES OF KKWALITY DIARY LTD BY
RELATIVE STRENGTH INDEX METHOD.
Sl No. Period RS (Price)
1 1-Jan-17 3
2 1-Feb-17 3
3 1-Mar-17 2
4 1-Apr-17 3
5 1-May-17 4
6 1-Jun-17 6
7 1-Jul-17 8
8 1-Aug-17 3
9 1-Sep-17 4
10 1-Oct-17 4
11 1-Nov-17 3
12 1-Dec-17 2
The above figures which are computed by using Relative Strength Index Method, the values
generated are been interpret in the below line chart.
57
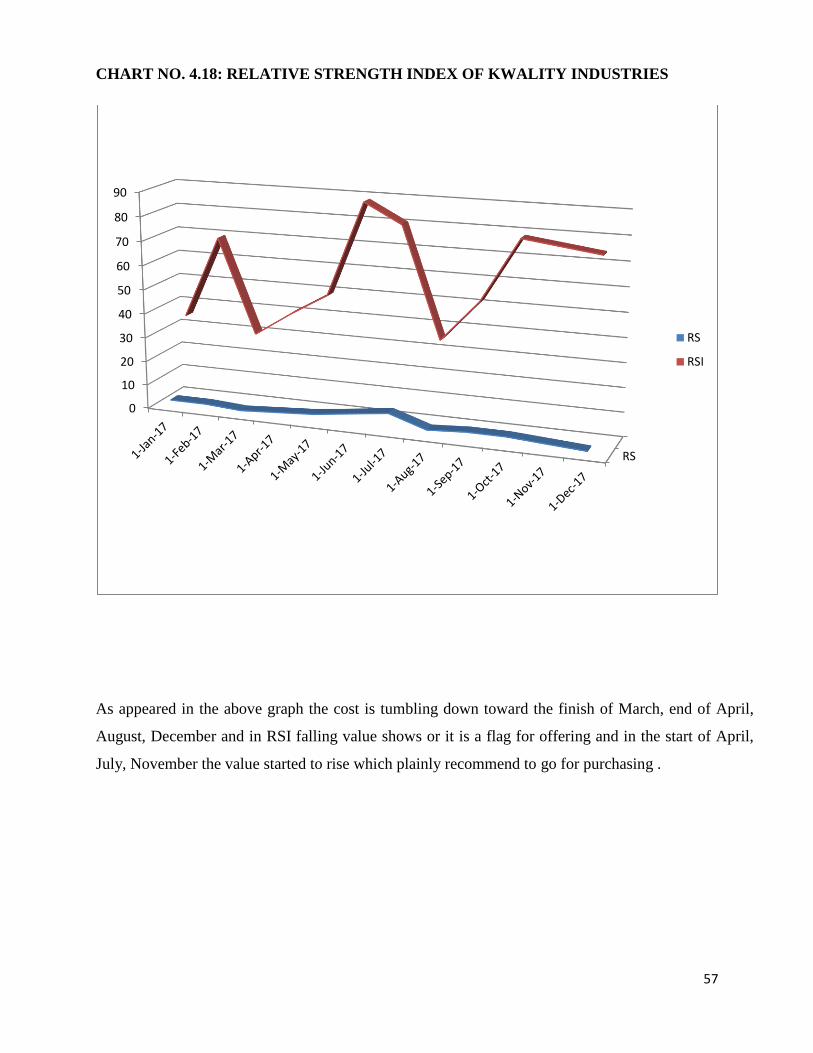
CHART NO. 4.18: RELATIVE STRENGTH INDEX OF KWALITY INDUSTRIES
As appeared in the above graph the cost is tumbling down toward the finish of March, end of April,
August, December and in RSI falling value shows or it is a flag for offering and in the start of April,
July, November the value started to rise which plainly recommend to go for purchasing .
RS
0
10
20
30
40
50
60
70
80
90
RS
RSI
58
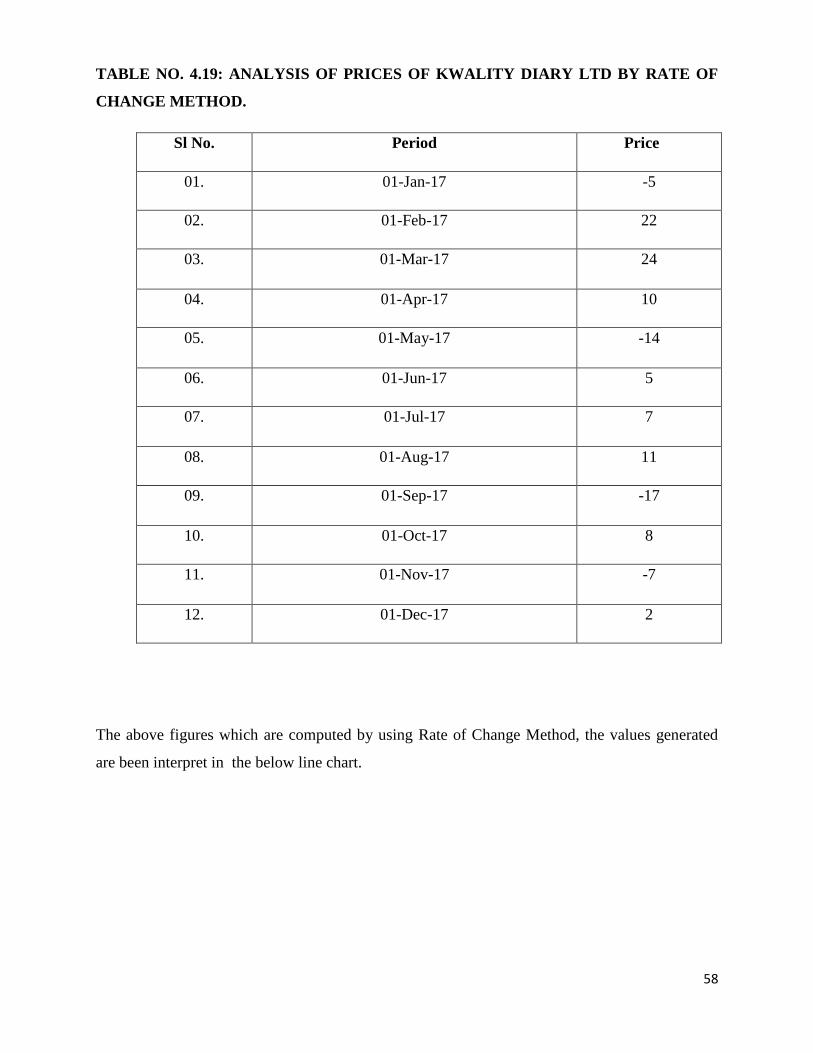
TABLE NO. 4.19: ANALYSIS OF PRICES OF KWALITY DIARY LTD BY RATE OF
CHANGE METHOD.
Sl No. Period Price
01. 01-Jan-17 -5
02. 01-Feb-17 22
03. 01-Mar-17 24
04. 01-Apr-17 10
05. 01-May-17 -14
06. 01-Jun-17 5
07. 01-Jul-17 7
08. 01-Aug-17 11
09. 01-Sep-17 -17
10. 01-Oct-17 8
11. 01-Nov-17 -7
12. 01-Dec-17 2
The above figures which are computed by using Rate of Change Method, the values generated
are been interpret in the below line chart.
59
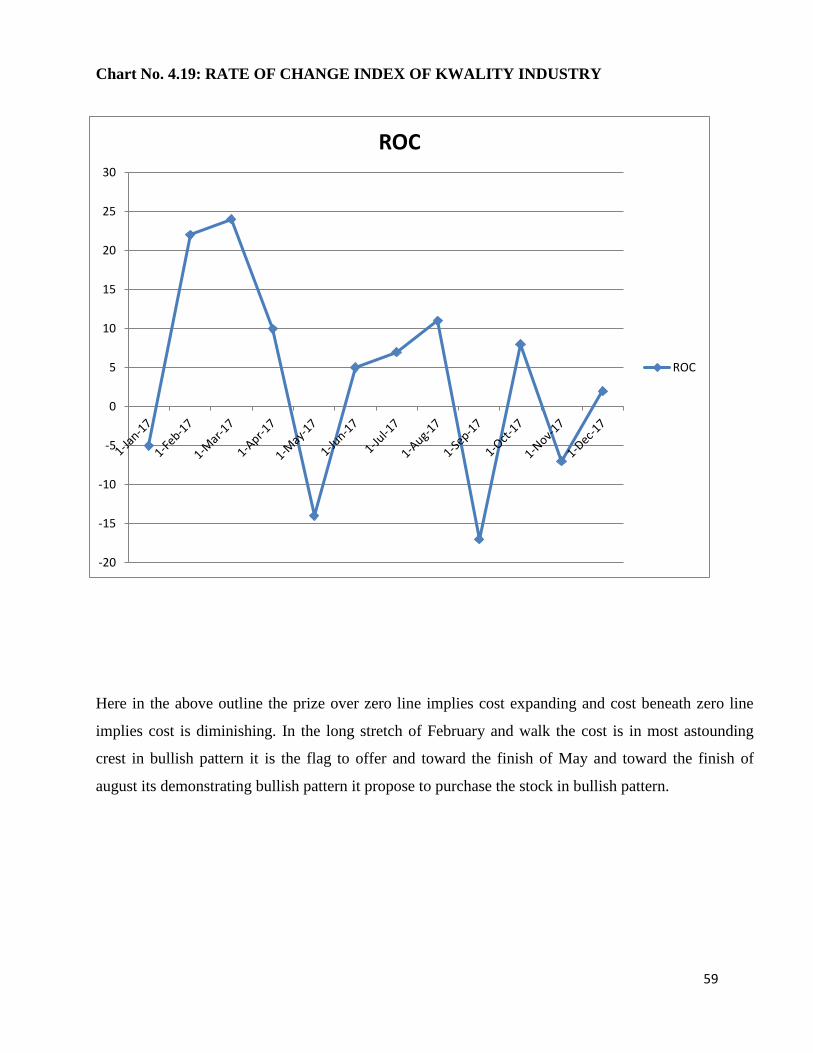
Chart No. 4.19: RATE OF CHANGE INDEX OF KWALITY INDUSTRY
Here in the above outline the prize over zero line implies cost expanding and cost beneath zero line
implies cost is diminishing. In the long stretch of February and walk the cost is in most astounding
crest in bullish pattern it is the flag to offer and toward the finish of May and toward the finish of
august its demonstrating bullish pattern it propose to purchase the stock in bullish pattern.
-20
-15
-10
-5
0
5
10
15
20
25
30
ROC
ROC
60
TABLE NO. 3.20: ANALYSIS OF PRICES OF KWALITY DIARY LTD BY MOVING
AVERAGE CONVERGENCE & DIVERGENCE METHOD.
Sl No. Period 12 Days 26 Days
01. 01-Jan-17 1900 1900
02. 01-Feb-17 1950 1940
03. 01-Mar-17 2200 2000
04. 01-Apr-17 2280 2190
05. 01-May-17 2400 2200
06. 01-Jun-17 2560 2440
07. 01-Jul-17 2890 2850
08. 01-Aug-17 3250 3600
09. 01-Sep-17 2870 3200
10. 01-Oct-17 3500 3190
11. 01-Nov-17 2840 2980
12. 01-Dec-17 2800 3000
The above figures which are computed by using Moving Average Convergence & Divergence
Method, the values generated are been interpret in the below line chart.
61
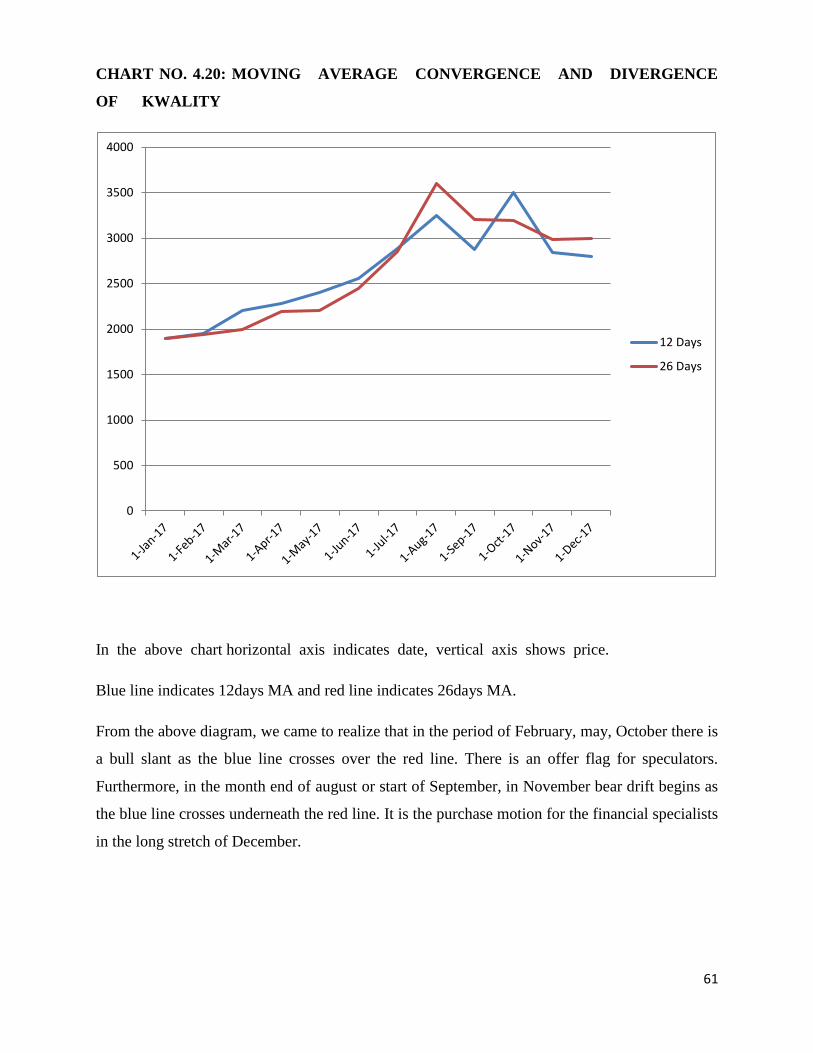
CHART NO. 4.20: MOVING AVERAGE CONVERGENCE AND DIVERGENCE
OF KWALITY
In the above chart horizontal axis indicates date, vertical axis shows price.
Blue line indicates 12days MA and red line indicates 26days MA.
From the above diagram, we came to realize that in the period of February, may, October there is
a bull slant as the blue line crosses over the red line. There is an offer flag for speculators.
Furthermore, in the month end of august or start of September, in November bear drift begins as
the blue line crosses underneath the red line. It is the purchase motion for the financial specialists
in the long stretch of December.
0
500
1000
1500
2000
2500
3000
3500
4000
12 Days
26 Days
62
5: FINDINGS, CONCLUSION AND SUGGESTIONS
5.1: FINDINGS:-
For the investigation reason I have chosen 5 organizations from FMCG area despite the fact that
all organizations has a place with a similar industry we can think about their execution of each
organization, where financial specialist dependably needs to look at between the organizations
previously exchanging.
Some of them are stated as below;
1. There are distinctive strategies we can use for specialized investigation and every
technique will have its own uniqueness in giving the outcome so despite the fact that
the information use for every one of the techniques is same they will give some novel
outcomes and elucidation. Choosing the strategy for count is relies upon the
inclination of financial specialist and his exchanging style. Every method has its
own pros and cons so every method will give different kind of interpretation.
2. Line outline has been utilized for this examination since it can be comprehend by
everyone and rather than get into difficulty by utilizing troublesome and diverse
strategies it's smarter to stick to one graph write which is straightforward and translate
and we should learn to understand and interpret the signals in that chart
properly.
3. The analysis satisfies both the individual investor and the company side by side.
4. It helps in taking major decisions on buying or selling by factoring internal & external
forces.
5. Interpretation, designing is purely based on the past price movements and with those
findings future trend is been anticipated.
6. Suggests investor to buy or sell immediately in a future period that could sometimes
benefit him and sometimes do not.
63
5.2: CONCLUSION:-
As we as a whole realize that specialized investigation is so imperative to break down or assess
the future cost and it likewise helps in speculation choice. Subsequent to concentrate the four
techniques which connected for 5 organization's of FMCG area , we came to realize that
distinctive strategy will give diverse elucidation like in moving normal when the cost achieves
high it is the offer flag, when it achieves bring down value it the purchase flag however in RSI
when value tends to fall it is the offer flag and keeping in mind that value rising it is the flag to
purchase, similar to shrewd in MACD when the fleeting EMA line crosses above long haul EMA
which achieves high cost in bullish market it is the flag to offer and the other way around
determining results of the similar industries with different output designed to comfort
preferences of differently scattered investors for better future decisions for reducing risk for
some level and providing liquidity on economic gain.
In the event that both essential and specialized examination utilizes together it will give more
proper outcome despite the fact that it won't give 100% outcome yet it gives relatively ideal
answers. As the distinctive techniques gives various types of result and diverse understanding
financial specialist ought to know about how to translate the outcome, diagram and chart or else
it will give false explanation. It isn't that these techniques will give correct recommendation to
purchase or offer the stocks it gives cautioning about the future patterns that is it basic leadership
will rely upon the financial specialist.
There are parcel of techniques to do specialized examination however the financial specialist
pick adaptable strategy and should settle with that specific strategy or else he will get mistake for
the investigation. On the off chance that specialized examination utilizes disgracefully it will
give false flag for purchasing or offering, so appropriate and correct data ought to be use with
any strategy speculator is alright with to get attractive outcomes. All examiners and
representatives utilize this specialized investigation with the major examination to foresee the
future patterns or future value, volume of the stocks. Despite the fact that the value changes
routinely and hard to assess correct pattern at any rate we can know surmised result and prepare
for the future circumstance.
64
5.3: SUGGESTIONS:
Specialized examination takes fundamental part in making with respect to the stocks, in the share
trading system. It is additionally simple to get the required data or information, which we use, in
specialized examination. The investor should be aware of marketing terms so it is easy to
analyze and earn profit.
If the financial specialist is new section for money markets he ought to precisely consider
the past execution, outlines, charts of the stocks.
➢ Investor ought to have information with respect to techniques that utilization
generally for specialized investigation.
➢ Investor should know how to break down the outlines and charts since
understanding is diverse for various strategies.
➢ Different examination speaks to various yield that is been customized to fulfill
distinctive class of customers or speculators.
➢ Typical Technical Analysis couldn't set up the correct precise outcomes as the
investigation depends on past execution of the cost and also expectations.
➢ The report proposes the purchasing and pitching signs or conduct so as to manage
a financial specialist whether could be existing or new participants to facilitate the
choices on making different speculations.
➢ As the examination itself recommends that financial specialist gets a knowledge
of future exchanging then the proportion of the hazard is exceptionally connected
with the arrival.
➢ In current situation the investigation is profiting the greater part of the theorists,
agents and financial specialists to know about value developments.
➢ Line graphs are particularly utilized as a part of request to get a reasonable photo
of the value variances as in the present market the same is been utilized.
➢ Investor who is thinking about pattern investigation should remember that the
information displayed with a specific end goal to get the value development could
even be from false sources keeping in mind the end goal to get individuals
purchasing stocks.
65
➢ Only gives around speculative result from the estimations made by various
oscillators according to the venture made or the inclination of the customer.
➢ Technical investigation is extremely normal with a specific end goal to get the
value minutes and influence anybody to comprehend the fluctuating
circumstances utilizing helps like outlines, charts, and so on.
➢ The principle capacity of the examination is to propose the financial specialist the
correct time to purchase or offer the securities that could keep away from an
immense measure of hazard taken without investigation.
➢ The oscillators or instruments utilized as a part of this investigation are extremely
normal and effectively reasonable in nature, just to demonstrate that the
examination yield for similar organizations varies from each other.
➢ Technical Analysis doesn't portray the correct future circumstance as it is
altogether in view of expectation and past value execution for some period.
➢ Accuracy of the examination relies upon the exactness of the information to
translate the diagram.

i
BIBLIOGRAPHY
Books & Journals Referred
Sl No. Name of the book Author
Edition &
place of
publication
Publication
House
01. INVESTMENT
MANAGEMENT PREETHI SINGH
2005
(13TH Edition)
New Delhi
HIMALAYA
PUBLISHING
HOUSE
02.
SECURITY ANALYSIS
& PORTFOLIO
MANAGEMENT
SHASHI.K
GUPTA
&
ROSY JOSHI
2014
(4th Edition)
New Delhi
KALYANI
PUBLISHERS
03.
ADVANCED
FINANCIAL
MANAGEMENT
PREETHI SINGH
2005
(13TH Edition)
Bangalore
HIMALAYA
PUBLISHING
HOUSE
04. FINANCIAL
MANAGEMENT CHANDRA
1999
(6th Edition)
Chennai
TATA MC
GRAW HILL
PUBLISSHING
CO. LTD
05. PORTFOLIO
MANAGEMENT MARIAPPA
2012
(5th Edition)
Chennai
VISION
PUBLISHING
HOUSE
06. FINANCE INDIA J.D AGARWAL
Vol.3
Sep 2017
New Delhi
Quarterly
Journal of
Indian Institute
of Finance
Websites Referred:
• http://www.lkpsec.com/Static/aboutus.aspx
• https://index.investopedia.com/index/?q=technical%20analysis&o=40186&qo=inves
topediaSiteSearch
• https://www.google.co.in/?gfe_rd=cr&ei=w-PUWLa-Ienx8Aehoa6QDA&gws_rd=ssl
• http://www.moneycontrol.com/stocksmarketsindia/
• http://www.bseindia.com/#markets_eq
• https://www.nseindia.com/ChartApp/install/charts/mainpage.jsp
• http://stockfetcher.com/?gclid=CKyYmtTs7tICFYIsvQod-BcCkQ
ii
ANNEXURE
DATA SHOWING BUYING & SELLING SIGNALS FROM DIFFERENT METHODS
OF ANALYSIS
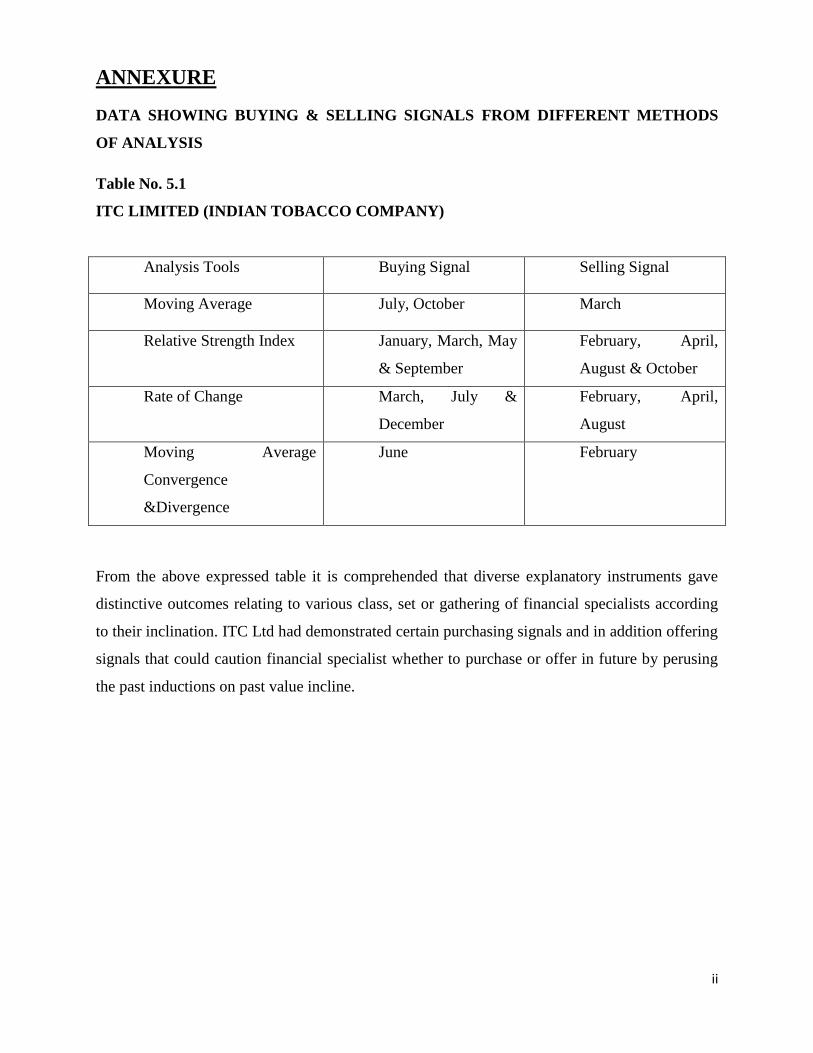
Table No. 5.1
ITC LIMITED (INDIAN TOBACCO COMPANY)
Analysis Tools Buying Signal Selling Signal
Moving Average July, October March
Relative Strength Index January, March, May
& September
February, April,
August & October
Rate of Change March, July &
December
February, April,
August
Moving Average
Convergence
&Divergence
June February
From the above expressed table it is comprehended that diverse explanatory instruments gave
distinctive outcomes relating to various class, set or gathering of financial specialists according
to their inclination. ITC Ltd had demonstrated certain purchasing signals and in addition offering
signals that could caution financial specialist whether to purchase or offer in future by perusing
the past inductions on past value incline.
iii
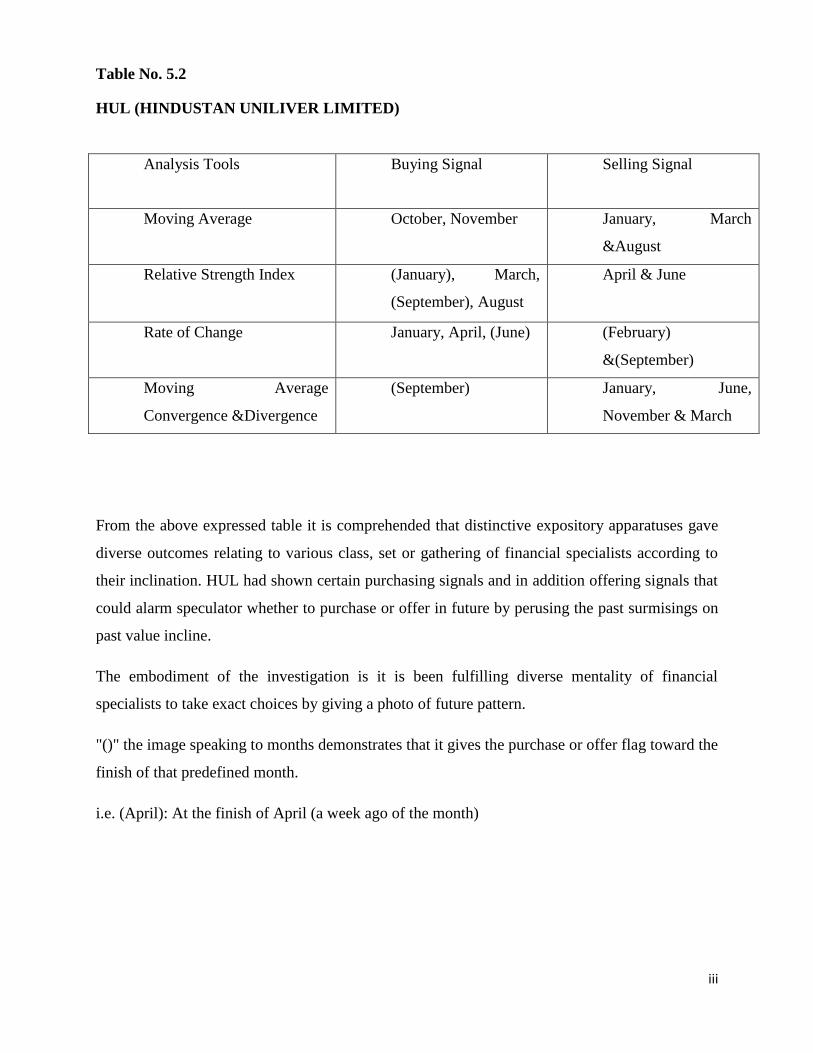
Table No. 5.2
HUL (HINDUSTAN UNILIVER LIMITED)
Analysis Tools Buying Signal Selling Signal
Moving Average October, November January, March
&August
Relative Strength Index (January), March,
(September), August
April & June
Rate of Change January, April, (June) (February)
&(September)
Moving Average
Convergence &Divergence
(September) January, June,
November & March
From the above expressed table it is comprehended that distinctive expository apparatuses gave
diverse outcomes relating to various class, set or gathering of financial specialists according to
their inclination. HUL had shown certain purchasing signals and in addition offering signals that
could alarm speculator whether to purchase or offer in future by perusing the past surmisings on
past value incline.
The embodiment of the investigation is it is been fulfilling diverse mentality of financial
specialists to take exact choices by giving a photo of future pattern.
"()" the image speaking to months demonstrates that it gives the purchase or offer flag toward the
finish of that predefined month.
i.e. (April): At the finish of April (a week ago of the month)
iv
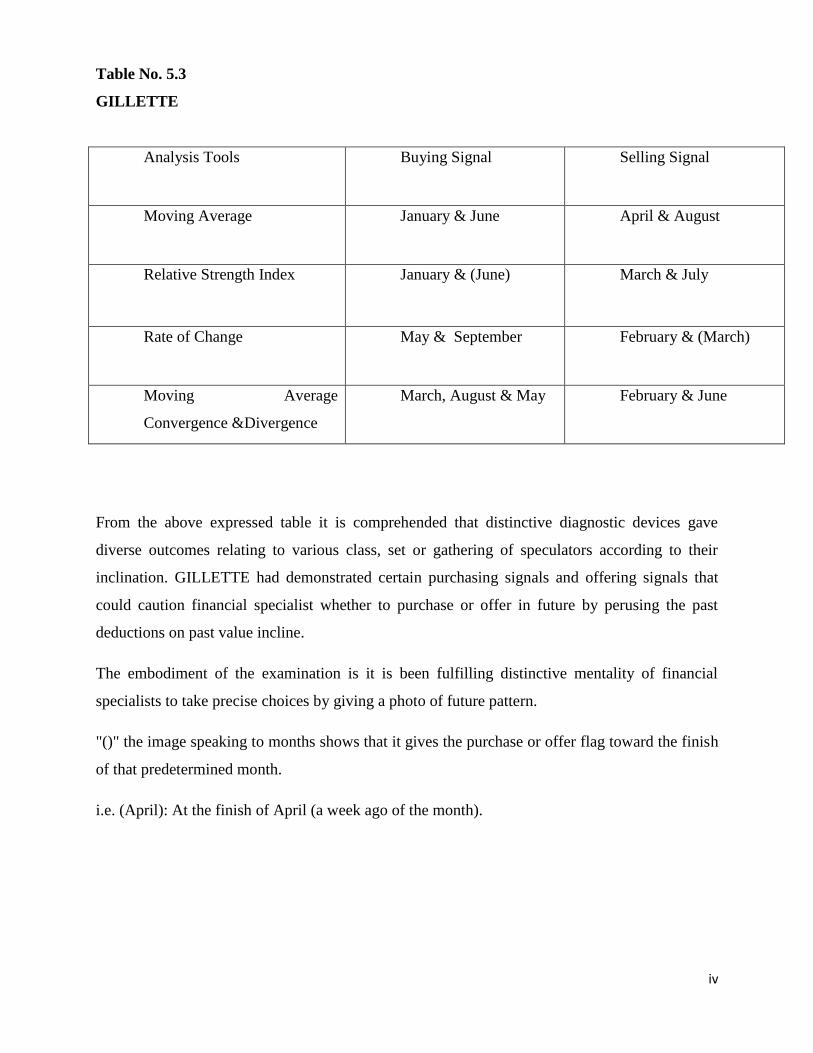
Table No. 5.3
GILLETTE
Analysis Tools Buying Signal Selling Signal
Moving Average January & June April & August
Relative Strength Index January & (June) March & July
Rate of Change May & September February & (March)
Moving Average
Convergence &Divergence
March, August & May February & June
From the above expressed table it is comprehended that distinctive diagnostic devices gave
diverse outcomes relating to various class, set or gathering of speculators according to their
inclination. GILLETTE had demonstrated certain purchasing signals and offering signals that
could caution financial specialist whether to purchase or offer in future by perusing the past
deductions on past value incline.
The embodiment of the examination is it is been fulfilling distinctive mentality of financial
specialists to take precise choices by giving a photo of future pattern.
"()" the image speaking to months shows that it gives the purchase or offer flag toward the finish
of that predetermined month.
i.e. (April): At the finish of April (a week ago of the month).
v
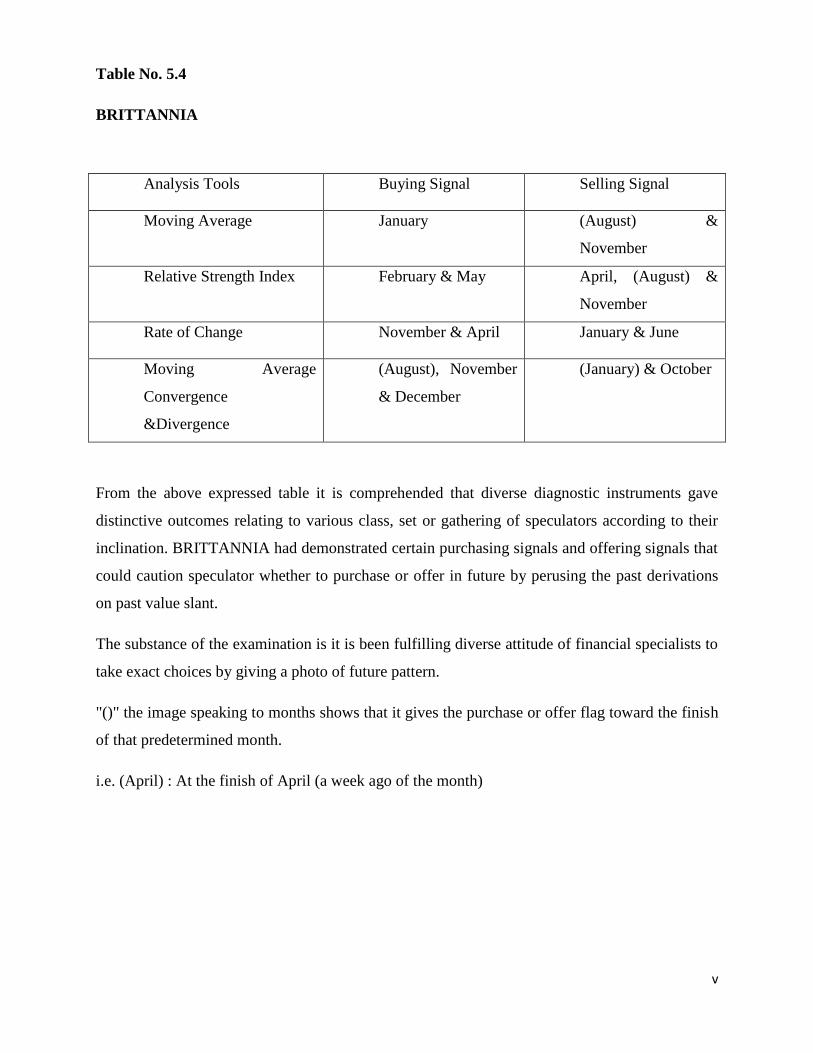
Table No. 5.4
BRITTANNIA
Analysis Tools Buying Signal Selling Signal
Moving Average January (August) &
November
Relative Strength Index February & May April, (August) &
November
Rate of Change November & April January & June
Moving Average
Convergence
&Divergence
(August), November
& December
(January) & October
From the above expressed table it is comprehended that diverse diagnostic instruments gave
distinctive outcomes relating to various class, set or gathering of speculators according to their
inclination. BRITTANNIA had demonstrated certain purchasing signals and offering signals that
could caution speculator whether to purchase or offer in future by perusing the past derivations
on past value slant.
The substance of the examination is it is been fulfilling diverse attitude of financial specialists to
take exact choices by giving a photo of future pattern.
"()" the image speaking to months shows that it gives the purchase or offer flag toward the finish
of that predetermined month.
i.e. (April) : At the finish of April (a week ago of the month)
vi
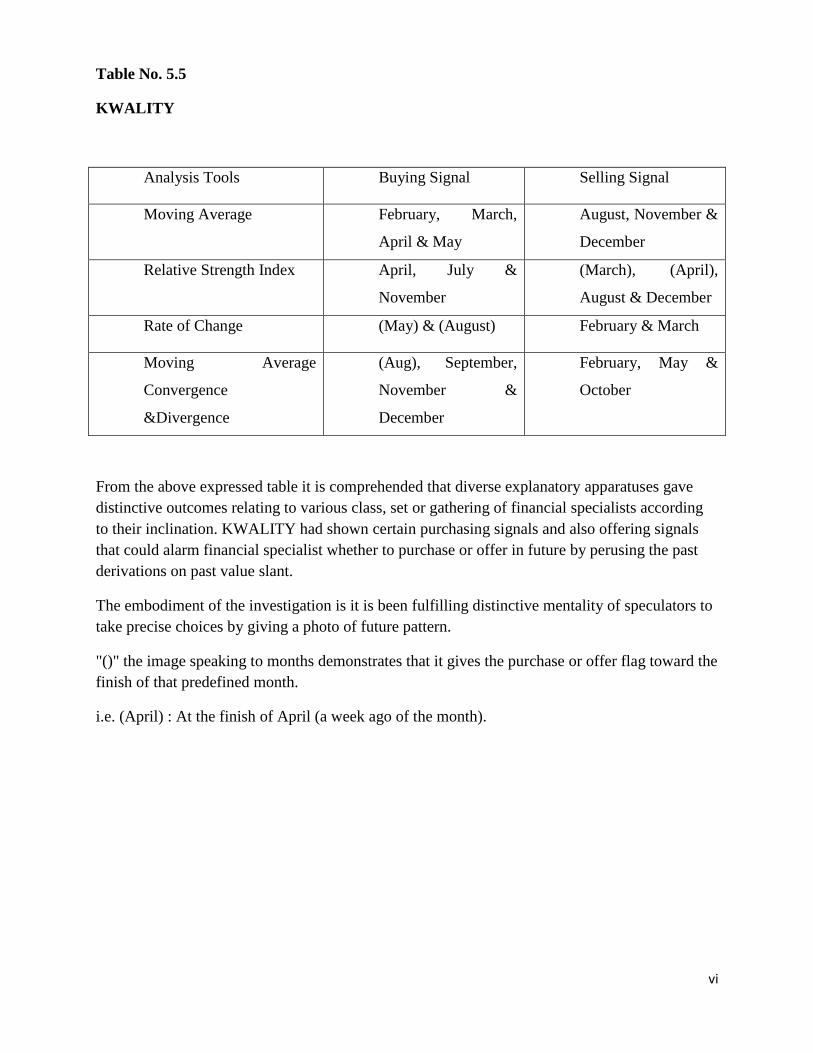
Table No. 5.5
KWALITY
Analysis Tools Buying Signal Selling Signal
Moving Average February, March,
April & May
August, November &
December
Relative Strength Index April, July &
November
(March), (April),
August & December
Rate of Change (May) & (August) February & March
Moving Average
Convergence
&Divergence
(Aug), September,
November &
December
February, May &
October
From the above expressed table it is comprehended that diverse explanatory apparatuses gave
distinctive outcomes relating to various class, set or gathering of financial specialists according
to their inclination. KWALITY had shown certain purchasing signals and also offering signals
that could alarm financial specialist whether to purchase or offer in future by perusing the past
derivations on past value slant.
The embodiment of the investigation is it is been fulfilling distinctive mentality of speculators to
take precise choices by giving a photo of future pattern.
"()" the image speaking to months demonstrates that it gives the purchase or offer flag toward the
finish of that predefined month.
i.e. (April) : At the finish of April (a week ago of the month).
vii

viii

ix


![8080/8085 - Bill's Ham Radio Web Server [nj7p.info/nj7p.org] · FPAL extends the capabilities of programs written for the 8080 and 8085 ... ISIS-II 808018085 Assembler Operator's](https://img.pdfslide.us/doc/110x75/5b4d49857f8b9a414e8b5204/80808085-bills-ham-radio-web-server-nj7pinfonj7porg-fpal-extends-the.jpg)