Embed Size (px)
Citation preview
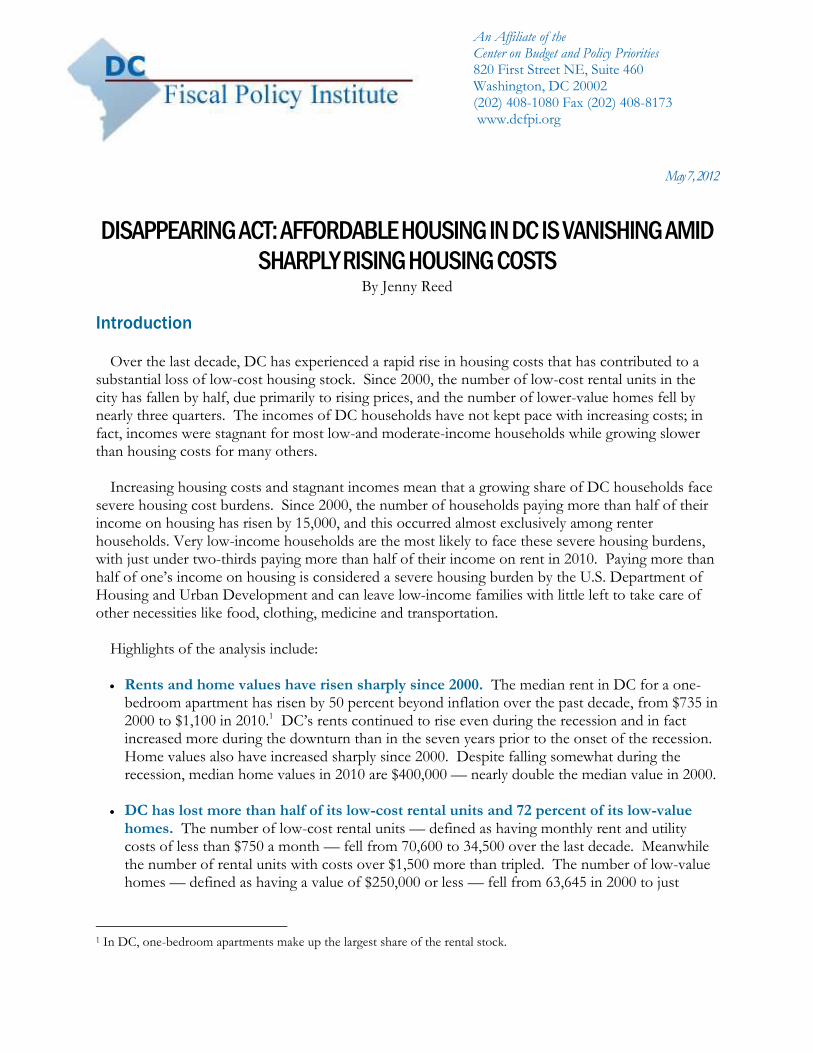
An Affiliate of the Center on Budget and Policy Priorities 820 First Street NE, Suite 460 Washington, DC 20002 (202) 408-1080 Fax (202) 408-8173 www.dcfpi.org
May 7, 2012
DISAPPEARING ACT: AFFORDABLE HOUSING IN DC IS VANISHING AMID
SHARPLY RISING HOUSING COSTS By Jenny Reed
Introduction
Over the last decade, DC has experienced a rapid rise in housing costs that has contributed to a substantial loss of low-cost housing stock. Since 2000, the number of low-cost rental units in the city has fallen by half, due primarily to rising prices, and the number of lower-value homes fell by nearly three quarters. The incomes of DC households have not kept pace with increasing costs; in fact, incomes were stagnant for most low-and moderate-income households while growing slower than housing costs for many others.
Increasing housing costs and stagnant incomes mean that a growing share of DC households face
severe housing cost burdens. Since 2000, the number of households paying more than half of their income on housing has risen by 15,000, and this occurred almost exclusively among renter households. Very low-income households are the most likely to face these severe housing burdens, with just under two-thirds paying more than half of their income on rent in 2010. Paying more than half of one’s income on housing is considered a severe housing burden by the U.S. Department of Housing and Urban Development and can leave low-income families with little left to take care of other necessities like food, clothing, medicine and transportation.
Highlights of the analysis include:
Rents and home values have risen sharply since 2000. The median rent in DC for a one-
bedroom apartment has risen by 50 percent beyond inflation over the past decade, from $735 in 2000 to $1,100 in 2010.1 DC’s rents continued to rise even during the recession and in fact increased more during the downturn than in the seven years prior to the onset of the recession. Home values also have increased sharply since 2000. Despite falling somewhat during the recession, median home values in 2010 are $400,000 — nearly double the median value in 2000.
DC has lost more than half of its low-cost rental units and 72 percent of its low-value
homes. The number of low-cost rental units — defined as having monthly rent and utility costs of less than $750 a month — fell from 70,600 to 34,500 over the last decade. Meanwhile the number of rental units with costs over $1,500 more than tripled. The number of low-value homes — defined as having a value of $250,000 or less — fell from 63,645 in 2000 to just
1 In DC, one-bedroom apartments make up the largest share of the rental stock.
2
17,640 in 2010, while the number of homes valued over $500,000 more than doubled.
Household incomes have not kept
pace with the rise in housing costs. Incomes for the bottom 40 percent of DC households have not increased since 2000, while incomes for the others rose less than 25 percent, still lower than the rise in home costs.
A growing share of DC households pays more than half of their income towards their housing costs. By 2010, roughly 1 in 5 DC households — 51,150 — had a severe housing burden, an increase of 40 percent since 2000. Very low-income households are most likely to be faced with severe housing burdens. In 2010, just under two-thirds of households with incomes below 30 percent of area median income, or $31,050 for a family of four, paid more than half of their income on housing. The majority of households with severe housing burdens work at least part-time, and the largest group is singles without children.
Housing Costs Continue to Grow Rapidly in the District
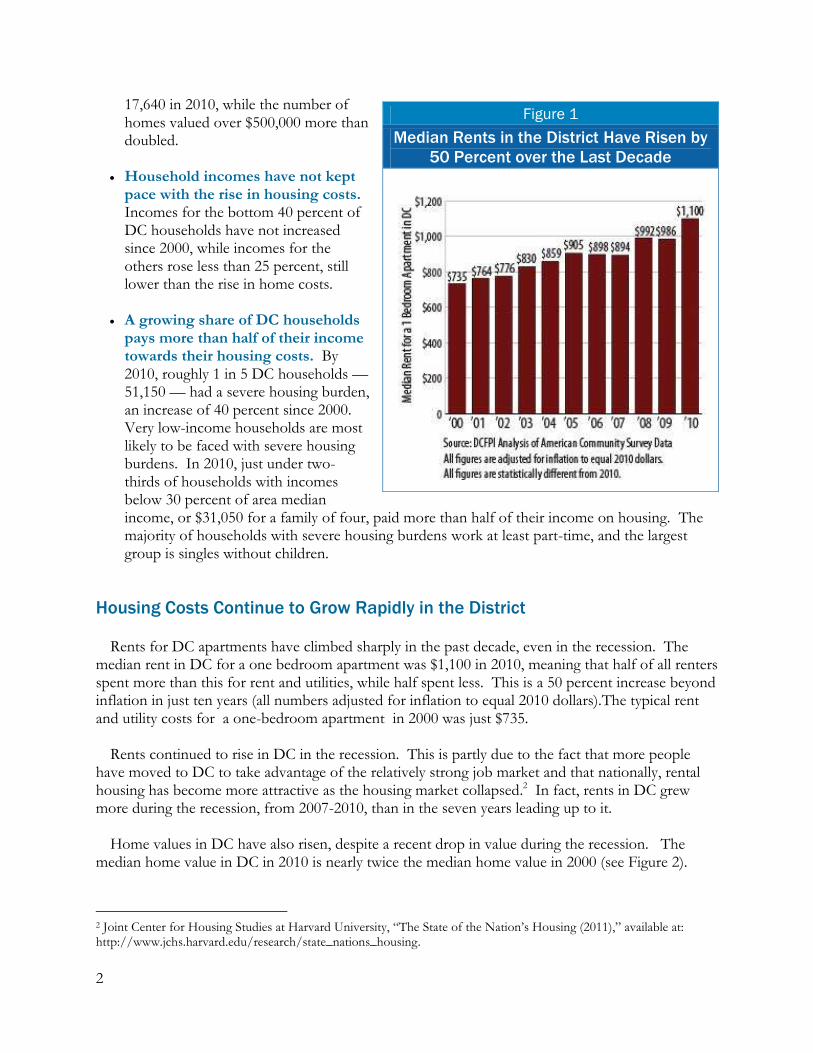
Rents for DC apartments have climbed sharply in the past decade, even in the recession. The median rent in DC for a one bedroom apartment was $1,100 in 2010, meaning that half of all renters spent more than this for rent and utilities, while half spent less. This is a 50 percent increase beyond inflation in just ten years (all numbers adjusted for inflation to equal 2010 dollars).The typical rent and utility costs for a one-bedroom apartment in 2000 was just $735.
Rents continued to rise in DC in the recession. This is partly due to the fact that more people have moved to DC to take advantage of the relatively strong job market and that nationally, rental housing has become more attractive as the housing market collapsed.2 In fact, rents in DC grew more during the recession, from 2007-2010, than in the seven years leading up to it.
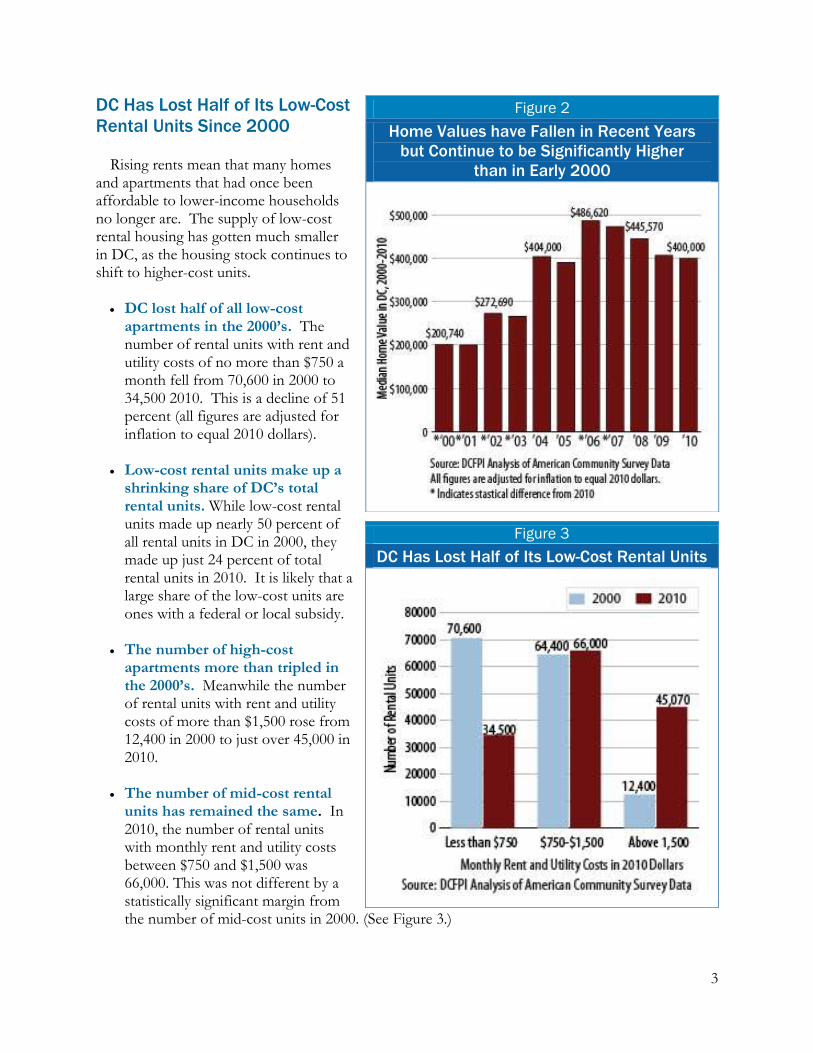
Home values in DC have also risen, despite a recent drop in value during the recession. The
median home value in DC in 2010 is nearly twice the median home value in 2000 (see Figure 2).
2 Joint Center for Housing Studies at Harvard University, “The State of the Nation’s Housing (2011),” available at: http://www.jchs.harvard.edu/research/state_nations_housing.
Figure 1
Median Rents in the District Have Risen by
50 Percent over the Last Decade
3
DC Has Lost Half of Its Low-Cost
Rental Units Since 2000
Rising rents mean that many homes and apartments that had once been affordable to lower-income households no longer are. The supply of low-cost rental housing has gotten much smaller in DC, as the housing stock continues to shift to higher-cost units.
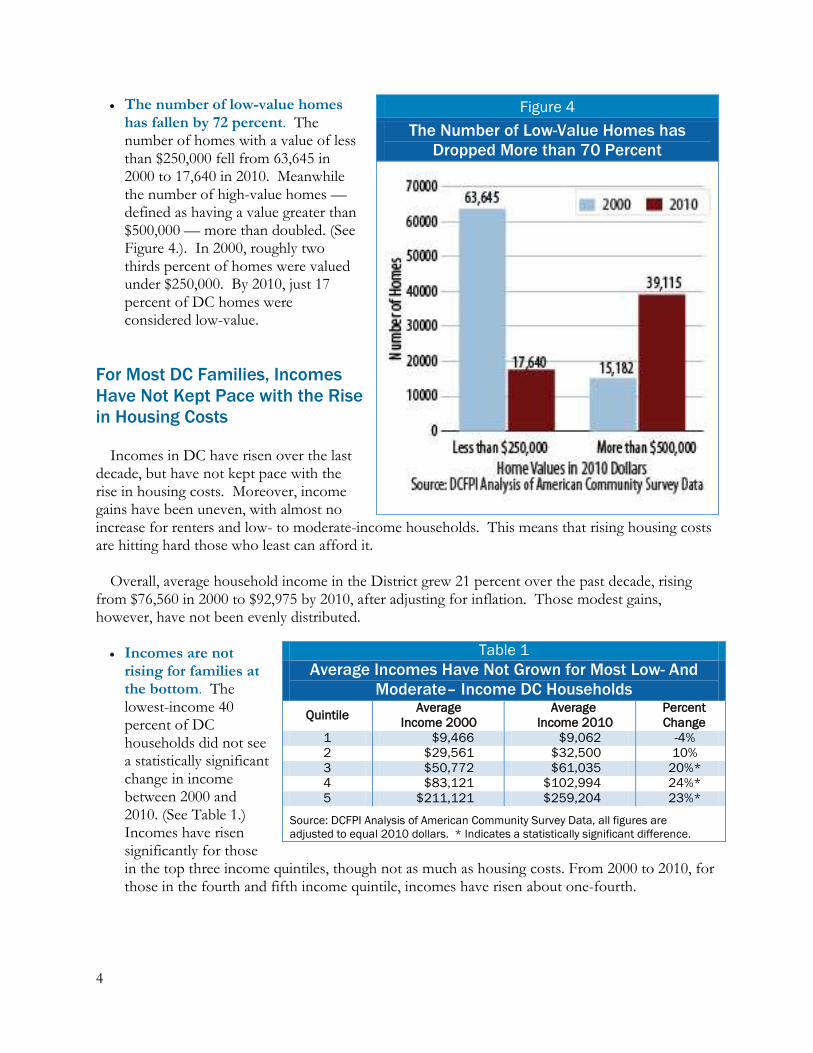
DC lost half of all low-cost apartments in the 2000’s. The number of rental units with rent and utility costs of no more than $750 a month fell from 70,600 in 2000 to 34,500 2010. This is a decline of 51 percent (all figures are adjusted for inflation to equal 2010 dollars).
Low-cost rental units make up a
shrinking share of DC’s total rental units. While low-cost rental units made up nearly 50 percent of all rental units in DC in 2000, they made up just 24 percent of total rental units in 2010. It is likely that a large share of the low-cost units are ones with a federal or local subsidy.
The number of high-cost
apartments more than tripled in the 2000’s. Meanwhile the number of rental units with rent and utility costs of more than $1,500 rose from 12,400 in 2000 to just over 45,000 in 2010.
The number of mid-cost rental units has remained the same. In 2010, the number of rental units with monthly rent and utility costs between $750 and $1,500 was 66,000. This was not different by a statistically significant margin from the number of mid-cost units in 2000. (See Figure 3.)
Figure 2
Home Values have Fallen in Recent Years
but Continue to be Significantly Higher
than in Early 2000
Figure 3
DC Has Lost Half of Its Low-Cost Rental Units
4
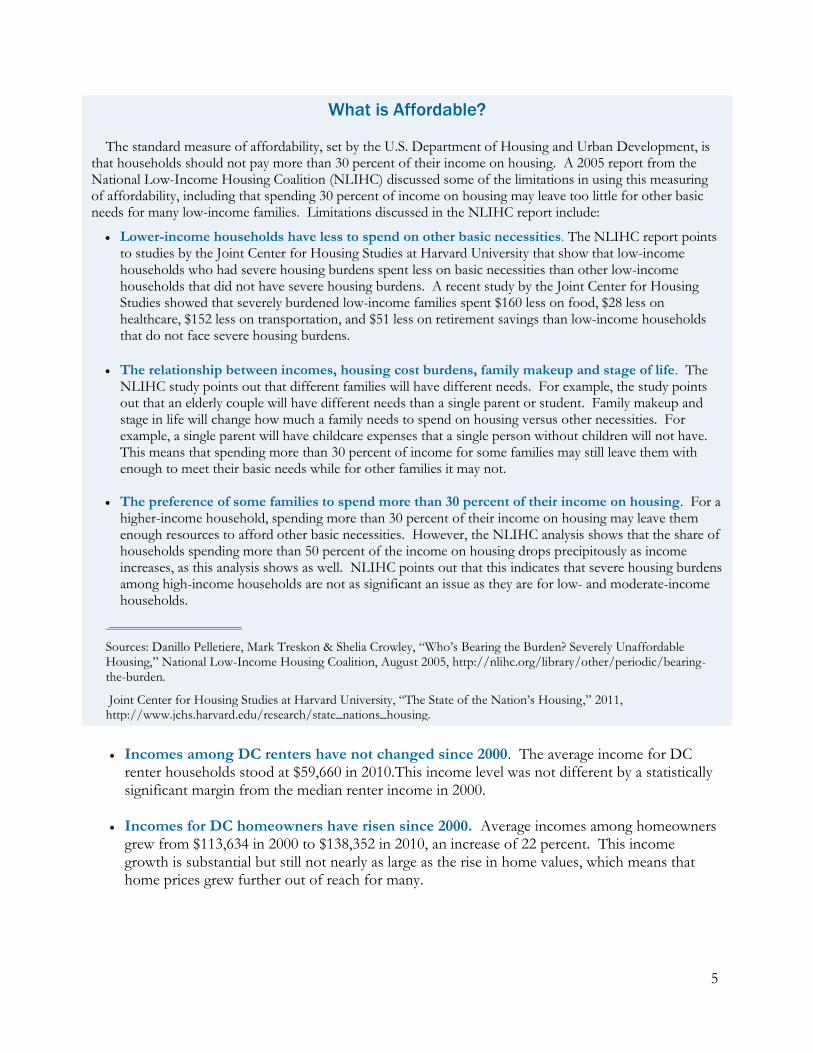
The number of low-value homes has fallen by 72 percent. The number of homes with a value of less than $250,000 fell from 63,645 in 2000 to 17,640 in 2010. Meanwhile the number of high-value homes — defined as having a value greater than $500,000 — more than doubled. (See Figure 4.). In 2000, roughly two thirds percent of homes were valued under $250,000. By 2010, just 17 percent of DC homes were considered low-value.
For Most DC Families, Incomes
Have Not Kept Pace with the Rise
in Housing Costs
Incomes in DC have risen over the last decade, but have not kept pace with the rise in housing costs. Moreover, income gains have been uneven, with almost no increase for renters and low- to moderate-income households. This means that rising housing costs are hitting hard those who least can afford it.
Overall, average household income in the District grew 21 percent over the past decade, rising
from $76,560 in 2000 to $92,975 by 2010, after adjusting for inflation. Those modest gains, however, have not been evenly distributed.
Incomes are not rising for families at the bottom. The lowest-income 40 percent of DC households did not see a statistically significant change in income between 2000 and 2010. (See Table 1.) Incomes have risen significantly for those in the top three income quintiles, though not as much as housing costs. From 2000 to 2010, for those in the fourth and fifth income quintile, incomes have risen about one-fourth.
Figure 4
The Number of Low-Value Homes has
Dropped More than 70 Percent
Table 1
Average Incomes Have Not Grown for Most Low- And
Moderate– Income DC Households
Quintile Average
Income 2000
Average
Income 2010
Percent
Change
1 $9,466 $9,062 -4%
2 $29,561 $32,500 10%
3 $50,772 $61,035 20%*
4 $83,121 $102,994 24%*
5 $211,121 $259,204 23%*
Source: DCFPI Analysis of American Community Survey Data, all figures are
adjusted to equal 2010 dollars. * Indicates a statistically significant difference.
5
Incomes among DC renters have not changed since 2000. The average income for DC renter households stood at $59,660 in 2010.This income level was not different by a statistically significant margin from the median renter income in 2000.
Incomes for DC homeowners have risen since 2000. Average incomes among homeowners
grew from $113,634 in 2000 to $138,352 in 2010, an increase of 22 percent. This income growth is substantial but still not nearly as large as the rise in home values, which means that home prices grew further out of reach for many.
What is Affordable?
The standard measure of affordability, set by the U.S. Department of Housing and Urban Development, is that households should not pay more than 30 percent of their income on housing. A 2005 report from the National Low-Income Housing Coalition (NLIHC) discussed some of the limitations in using this measuring of affordability, including that spending 30 percent of income on housing may leave too little for other basic needs for many low-income families. Limitations discussed in the NLIHC report include:
Lower-income households have less to spend on other basic necessities. The NLIHC report points to studies by the Joint Center for Housing Studies at Harvard University that show that low-income households who had severe housing burdens spent less on basic necessities than other low-income households that did not have severe housing burdens. A recent study by the Joint Center for Housing Studies showed that severely burdened low-income families spent $160 less on food, $28 less on healthcare, $152 less on transportation, and $51 less on retirement savings than low-income households that do not face severe housing burdens.
The relationship between incomes, housing cost burdens, family makeup and stage of life. The
NLIHC study points out that different families will have different needs. For example, the study points out that an elderly couple will have different needs than a single parent or student. Family makeup and stage in life will change how much a family needs to spend on housing versus other necessities. For example, a single parent will have childcare expenses that a single person without children will not have. This means that spending more than 30 percent of income for some families may still leave them with enough to meet their basic needs while for other families it may not.
The preference of some families to spend more than 30 percent of their income on housing. For a
higher-income household, spending more than 30 percent of their income on housing may leave them enough resources to afford other basic necessities. However, the NLIHC analysis shows that the share of households spending more than 50 percent of the income on housing drops precipitously as income increases, as this analysis shows as well. NLIHC points out that this indicates that severe housing burdens among high-income households are not as significant an issue as they are for low- and moderate-income households.
____________________
Sources: Danillo Pelletiere, Mark Treskon & Shelia Crowley, “Who’s Bearing the Burden? Severely Unaffordable Housing,” National Low-Income Housing Coalition, August 2005, http://nlihc.org/library/other/periodic/bearing-the-burden.
Joint Center for Housing Studies at Harvard University, “The State of the Nation’s Housing,” 2011, http://www.jchs.harvard.edu/research/state_nations_housing.
6
More DC Families Face Severe Housing Burdens
The rapid rise in housing costs and slow growth in incomes means that more and more DC residents face severe housing cost burdens, defined by the U.S. Department of Housing and Urban Development as paying more than half of one’s income on housing. Severe housing cost burdens limit the amount of money that families have left over to meet other basic needs like food, clothing, medicine and transportation and puts low-income families at greater risk for being one economic shock (such as a layoff or illness, for example) away from not being able to pay the rent or mortgage. The rising burdens are especially concentrated on DC’s very low-income residents. At the same time, there has also been a large increase in housing affordability challenges for moderate-income DC families since 2000.
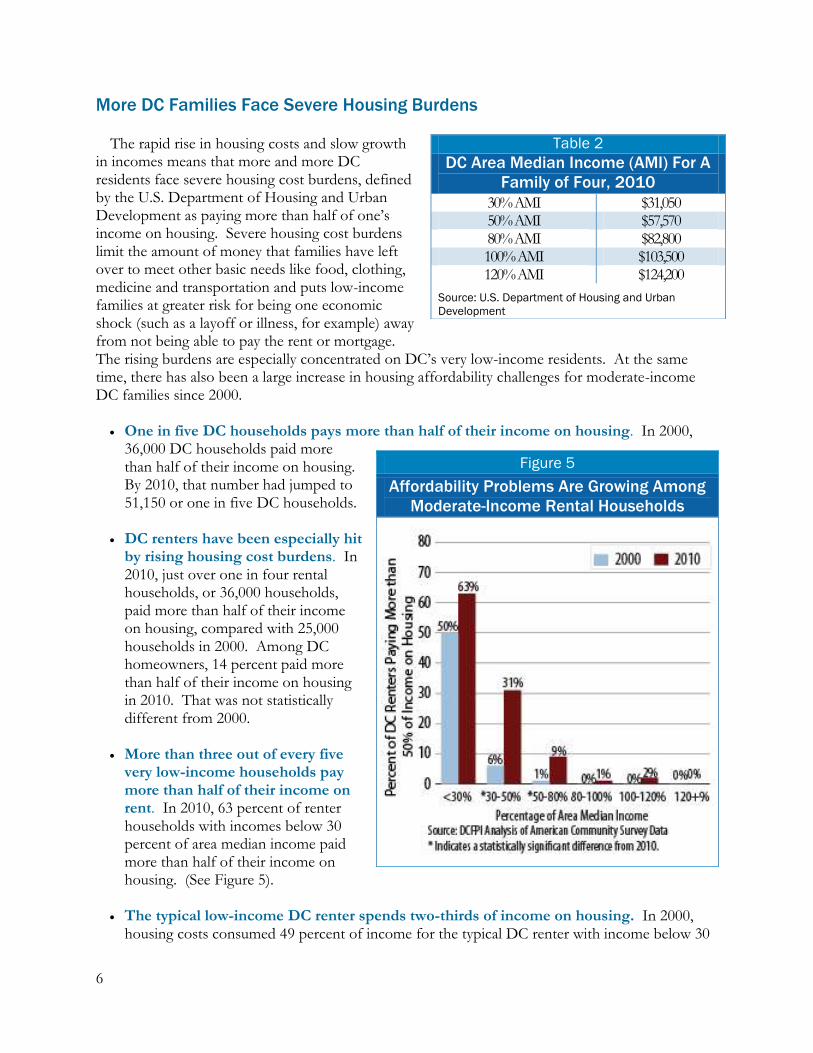
One in five DC households pays more than half of their income on housing. In 2000, 36,000 DC households paid more than half of their income on housing. By 2010, that number had jumped to 51,150 or one in five DC households.
DC renters have been especially hit by rising housing cost burdens. In 2010, just over one in four rental households, or 36,000 households, paid more than half of their income on housing, compared with 25,000 households in 2000. Among DC homeowners, 14 percent paid more than half of their income on housing in 2010. That was not statistically different from 2000.
More than three out of every five very low-income households pay more than half of their income on rent. In 2010, 63 percent of renter households with incomes below 30 percent of area median income paid more than half of their income on housing. (See Figure 5).
The typical low-income DC renter spends two-thirds of income on housing. In 2000,
housing costs consumed 49 percent of income for the typical DC renter with income below 30
Figure 5
Affordability Problems Are Growing Among
Moderate-Income Rental Households
Table 2
DC Area Median Income (AMI) For A
Family of Four, 2010
30% AMI $31,050 50% AMI $57,570 80% AMI $82,800 100% AMI $103,500 120% AMI $124,200
Source: U.S. Department of Housing and Urban
Development
7
percent of area median income. By 2010, the typical low-income rental household spent 69 percent of income on housing.
The likelihood of having severe housing burdens is growing among moderate income
households. In 2000, just over six percent of renter households, who earned between 30 percent and 50 percent of area median income — $30,686 to $51,143 for a family of four in 2010 — paid more than half of their income on rent. By 2010 that number had risen to 31 percent.
For rental households with income between 50 percent and 80 percent of area median income — $57,570 to $82,800 for a family of four in 2010 — the number has risen from less than one percent with severe housing cost burdens in 2000 to nine percent in 2010.
The share of severely burdened homeowner households has risen dramatically for low-
to moderate-income households. Among homeowners who earned between 30 percent and 50 percent of area median income, the share that paid more than half of their income on mortgage and related expenses rose from 18 percent in 2000 to 42 percent in 2010. Homeowners with incomes below 30 percent of area median income however still have the largest share of households with severe housing burdens. In 2010, nearly 70 percent of homeowners with incomes below 30 percent of area median income paid more than half of their income on their mortgage and mortgage related expenses.
Which groups of DC Households Have Severe Housing Cost Burdens?
A severe housing burden particularly impacts low-income families’ abilities to pay for other basic necessities such as clothing, food, and transportation. A report from the Joint Center for Housing Studies of Harvard University found that households in the bottom income quintile who had severe housing burdens spent $160 less on food, $28 less on health care, $152 less on transportation, and $51 less on retirement savings than unburdened households.3
Which groups make up the largest share of the households who pay more than half of their income on housing in DC? An examination of Census data reveals the following for renter households who pay more than 50 percent of their income on housing:
3 Joint Center for Housing Studies at Harvard University, “The State of the Nation’s Housing (2011),”2011, http://www.jchs.harvard.edu/research/state_nations_housing.
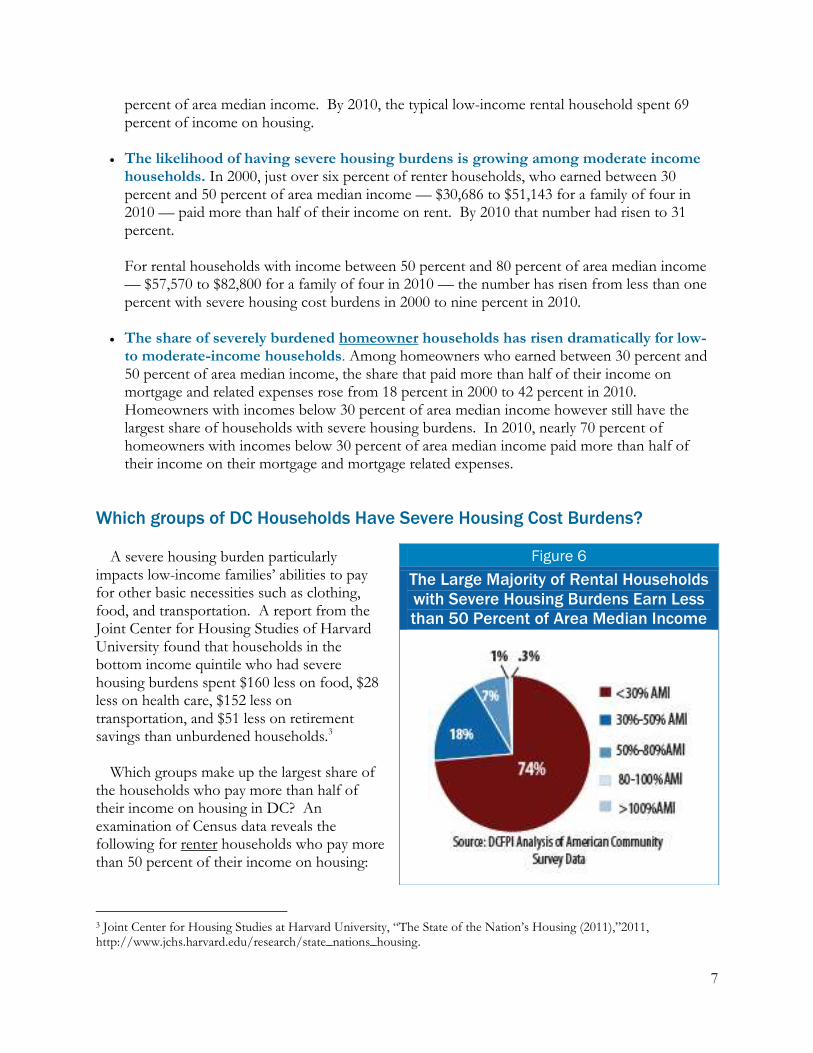
Figure 6
The Large Majority of Rental Households
with Severe Housing Burdens Earn Less
than 50 Percent of Area Median Income
8
The large majority of renter households with severe housing burdens have incomes below 50 percent of area median income. More than 90 percent had incomes below 50 percent of area median income, with the large majority earning less than 30 percent of area median income (see Figure 6).
The large majority of renter households with severe housing burdens are headed by
non-elderly adults. More than four-fifths of householders were between the ages of 18 and 64.
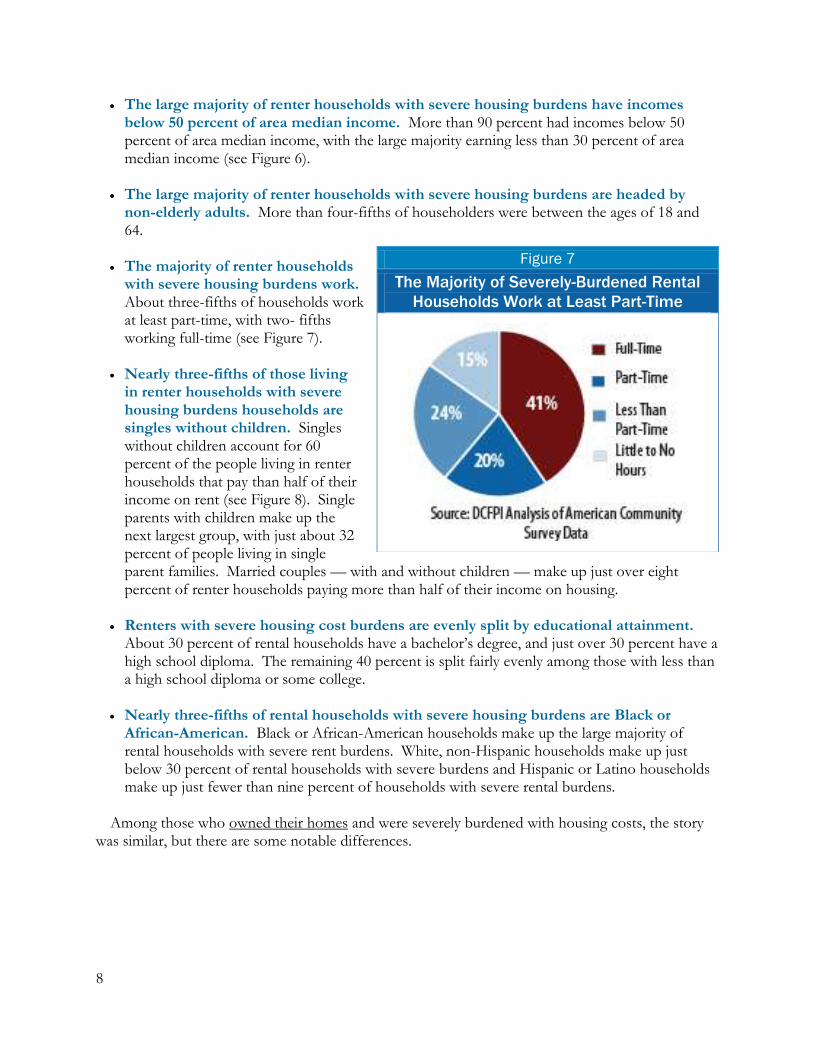
The majority of renter households
with severe housing burdens work. About three-fifths of households work at least part-time, with two- fifths working full-time (see Figure 7).
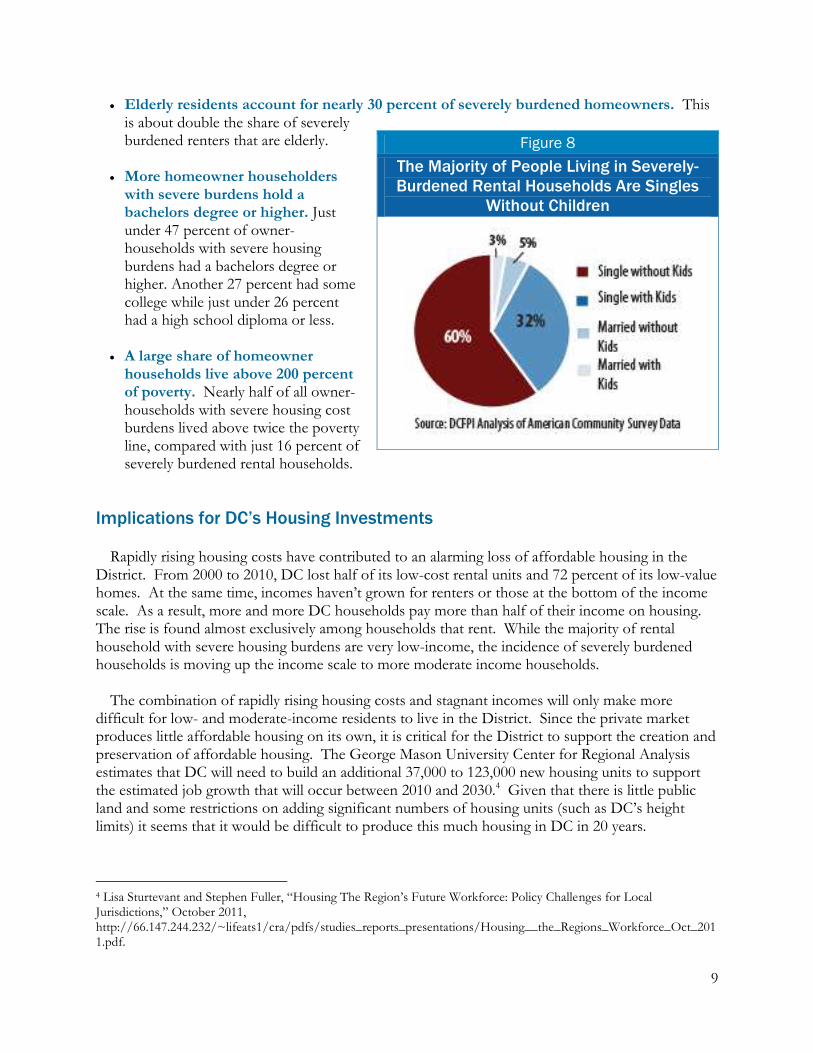
Nearly three-fifths of those living
in renter households with severe housing burdens households are singles without children. Singles without children account for 60 percent of the people living in renter households that pay than half of their income on rent (see Figure 8). Single parents with children make up the next largest group, with just about 32 percent of people living in single parent families. Married couples — with and without children — make up just over eight percent of renter households paying more than half of their income on housing.
Renters with severe housing cost burdens are evenly split by educational attainment. About 30 percent of rental households have a bachelor’s degree, and just over 30 percent have a high school diploma. The remaining 40 percent is split fairly evenly among those with less than a high school diploma or some college.
Nearly three-fifths of rental households with severe housing burdens are Black or African-American. Black or African-American households make up the large majority of rental households with severe rent burdens. White, non-Hispanic households make up just below 30 percent of rental households with severe burdens and Hispanic or Latino households make up just fewer than nine percent of households with severe rental burdens.
Among those who owned their homes and were severely burdened with housing costs, the story was similar, but there are some notable differences.
Figure 7
The Majority of Severely-Burdened Rental
Households Work at Least Part-Time
9
Elderly residents account for nearly 30 percent of severely burdened homeowners. This is about double the share of severely burdened renters that are elderly.
More homeowner householders with severe burdens hold a bachelors degree or higher. Just under 47 percent of owner-households with severe housing burdens had a bachelors degree or higher. Another 27 percent had some college while just under 26 percent had a high school diploma or less.
A large share of homeowner
households live above 200 percent of poverty. Nearly half of all owner-households with severe housing cost burdens lived above twice the poverty line, compared with just 16 percent of severely burdened rental households.
Implications for DC’s Housing Investments
Rapidly rising housing costs have contributed to an alarming loss of affordable housing in the District. From 2000 to 2010, DC lost half of its low-cost rental units and 72 percent of its low-value homes. At the same time, incomes haven’t grown for renters or those at the bottom of the income scale. As a result, more and more DC households pay more than half of their income on housing. The rise is found almost exclusively among households that rent. While the majority of rental household with severe housing burdens are very low-income, the incidence of severely burdened households is moving up the income scale to more moderate income households.
The combination of rapidly rising housing costs and stagnant incomes will only make more
difficult for low- and moderate-income residents to live in the District. Since the private market produces little affordable housing on its own, it is critical for the District to support the creation and preservation of affordable housing. The George Mason University Center for Regional Analysis estimates that DC will need to build an additional 37,000 to 123,000 new housing units to support the estimated job growth that will occur between 2010 and 2030.4 Given that there is little public land and some restrictions on adding significant numbers of housing units (such as DC’s height limits) it seems that it would be difficult to produce this much housing in DC in 20 years.
4 Lisa Sturtevant and Stephen Fuller, “Housing The Region’s Future Workforce: Policy Challenges for Local Jurisdictions,” October 2011, http://66.147.244.232/~lifeats1/cra/pdfs/studies_reports_presentations/Housing__the_Regions_Workforce_Oct_2011.pdf.
Figure 8
The Majority of People Living in Severely-
Burdened Rental Households Are Singles
Without Children
10
This is likely to put even greater pressure on housing prices. The District will need to address the rapidly rising housing costs in DC if it is going to be able to produce the housing that is in-line with the needs of the District’s current, and future, workforce to slow the rise in severely burdened households.
There are several steps the District can take to address the need for more affordable housing. The
following recommendations mirror many of the recommendation made in a 2006 report by the District’s Comprehensive Housing Strategy Task Force (CHSTF). The CHSTF laid out a 15- year housing strategy blueprint for the District, with a specific emphasis on addressing DC’s affordable housing crisis.5 A new housing strategy task force was established early in 2012, and its work is expected to be completed this fall. The new task force should consider the following recommendations:
Increase the Production of Affordable Housing. Since the private market produces little affordable housing on its own, it is critical for the District to support the creation of affordable housing. The Housing Production Trust Fund — supported by a portion of deed recordation and deed transfer taxes — is DC’s main source to build, acquire, and renovate housing that is affordable to people with low and moderate-incomes. It is also the main source of funding for tenants who wish to exercise their first right of purchase and buy their buildings when their landlord puts them up for sale. However, the recession led to a precipitous drop in deed and transfer tax collections. Revenues into the HPTF fell from a high of $76 million fiscal year 2008, the last year before the recession began to impact DC’s finances, to a low of just $14 million by fiscal year 2010 — an 80 percent drop in just two years. Resources began to pick up in fiscal year 2011 however, the fiscal year 2012 budget cut the HPTF’s resources by $18 million and the proposed budget for fiscal year 2013 also includes a $20 million funding cut. The drop in revenue, in combination with recent funding cuts, has constrained the District’s ability to produce large increases in affordable housing production. The District should increase its investment in the HPTF in order to support the production of more affordable housing.
The Local Rent Supplement Program (LRSP) and Permanent Supportive Housing (PSH) programs help to create housing that is affordable to people with very low-incomes, below 30 percent of area median income, and for chronically homeless individuals and families, respectively. Many of the units created by these programs also provide supportive services. Funding for both of these programs has been fairly flat in recent years. The 2006 Comprehensive Housing Strategy Task Force had recommended the creation of approximately 15,000 rent supplement units. To date, funding has supported the creation of about 1,700 units. The District should increase its investments in both programs to help produce housing affordable to people with very low-incomes.
The District can also leverage another one of its resources, public land, to produce affordable housing. When public land is given to private developers to build residential housing, the land can be sold to developers at below market-rate costs to help cover the costs of setting aside a
5 The complete report, “Homes for an Inclusive City: A Comprehensive Housing Strategy for Washington, DC” can be found here: http://www.brookings.edu/reports/2006/04cities.aspx.
11
percentage of the total units as affordable. Parcels of land governed under the former Anacostia Waterfront Corporation require a certain percentage of land to be set-aside for affordable housing. The District should extend similar requirements to other parcels of public land.
Support the Preservation of Affordable Housing. One of the main ways the District can
keep from losing its affordable housing stock is to preserve current affordable housing units. One program where preservation is particularly important is the project-based section 8 program. Under this program that began in 1974, private landlords contract with the US Department of Housing and Urban Development for periods between 20 and 40 years to provide housing affordable to residents with very low-incomes. There are approximately 11,190 units under this program in DC6.
In some cases, building owners renew their contracts for short periods of time, one to two years, when their contracts expire or let the buildings fall in disrepair in order to try and get out of their contract and sell their building.7 Once the contracts expire, the subsidy disappears. They cannot be re-allocated somewhere else. It is critical that the District monitor these contracts and devote resources to preserve the units as affordable if the contracts are set to expire. Another program that is critical to preservation is the tenant purchase program. Under current law in the District, tenants have the first right to purchase when their buildings are offered up for sale. The tenant purchase program provides low-interest loans to qualified low-income tenants who want to purchase their building. Funds for the tenant purchase program largely come from the Housing Production Trust Fund which has been reduced in recent years due to budget cuts and a weak economy in the wake of the Great Recession. This has limited the amount of funds that are available for assistance for this program. The District should invest additional resources into the tenant purchase program to help preserve more affordable housing.
Support Affordable Homeownership. Home values in DC have nearly doubled over the last decade and are out of reach for many low- and moderate-income households. DC has a Home Purchase Assistance Program (HPAP) that helps low- and moderate income first-time homebuyers purchase a home. Yet funding for the program has been reduced in recent years and the maximum loan payment has been reduced from $70,000 to $40,000 to try and help serve more people with fewer dollars. The District should invest in HPAP to help more eligible first-time homebuyers purchase a home in the District.
Increase Overall Funding for Affordable Housing. The District has a number of tools at its disposal that it can use to increase and preserve the stock of affordable housing. These include new financing mechanisms to help build, preserve, and create affordable housing opportunities for very low-income residents and residents with special needs as well zoning and land-use
6 Data from DC Preservation Catalog compiled by NeighborhoodInfo DC.
7 Comprehensive Housing Strategy Task Force, “Homes for an Inclusive City: A Comprehensive Housing Strategy for Washington, DC,” April 2006, http://www.brookings.edu/reports/2006/04cities.aspx.
12
regulation changes that could encourage more housing — including affordable housing — development citywide.
But as a result of the Great Recession, the city’s affordable housing financing tools have been largely dormant and funding has been used to maintain most programs at their prior-year levels which means that progress on creating more affordable housing has largely stalled.8 In the last year before the recession began to impact DC’s revenue collections, the District allocated $135 million to affordable housing programs9. In fiscal year 2013, the Mayor’s proposed budget would allocate $90 million, a drop of one-third in total resources. As the District recovers from the recession, the District should work to re-invest in the programs that are the District’s main source for affordable housing preservation and development.
As noted, the District established a new Comprehensive Housing Strategy Task Force in 2012 and
charged it with making updated recommendations that lead to the creation of increased affordable housing for DC residents; including an examination of the funding, regulatory environment, and new tools for housing development. As this analysis has shown, it is critical that that the Comprehensive Housing Strategy Task Force addresses the tremendous and growing needs to produce and preserve additional affordable housing in the District.
8 DC Fiscal Policy Institute, “What’s In the FY 2012 Budget for Affordable Housing?”2011, http://www.dcfpi.org/wp-content/uploads/2011/04/FY12-Housing-Toolkit-Final2-7-19-11.pdf.
9 This includes general funds for: the Department of Housing and Community Development, the Housing Production Trust Fund (HPTF), the DC Housing Authority subsidy, the Department of Mental Health bridge subsidy program and the Permanent Supportive Housing Program. This figure also includes a $30 million one-time allocation made to the HPTF from the FY 2008 Supplemental Appropriations Temporary Act of 2008 (B17-447).