Embed Size (px)
Citation preview

Federal Reserve Bank of Atlanta
Director’s Guide to Credit


This guide was created by the Supervision and Regulation Division of the Federal Reserve Bank of Atlanta, 1000 Peachtree Street NE, Atlanta, Georgia 30309
To request a copy of the guide, please contact Sheila Colvin at [email protected] or 404-498-7319.
This guide was created to help bank directors assess credit proposals. It is designed to be used as a quick-reference tool. Directors should not rely on it as the only tool when evaluating credit.
Directors are encouraged to seek out other resources and opportunities to enhance their credit knowledge and skills. Such resources could include the American Bankers Association, the American Banker magazine, the Bank Administration Institute, or the Risk Management Association. The website of the Federal Reserve Board of Governors at www.federalreserve.gov is also a useful reference tool.
INSIDE THIS GUIDE Common Financial Ratios ............................................................................................2Credit Memo Considerations ........................................................................................4Commercial and Industrial Considerations ...................................................................6Early Warning Signs of Potential Problem Loans............................................................8
1
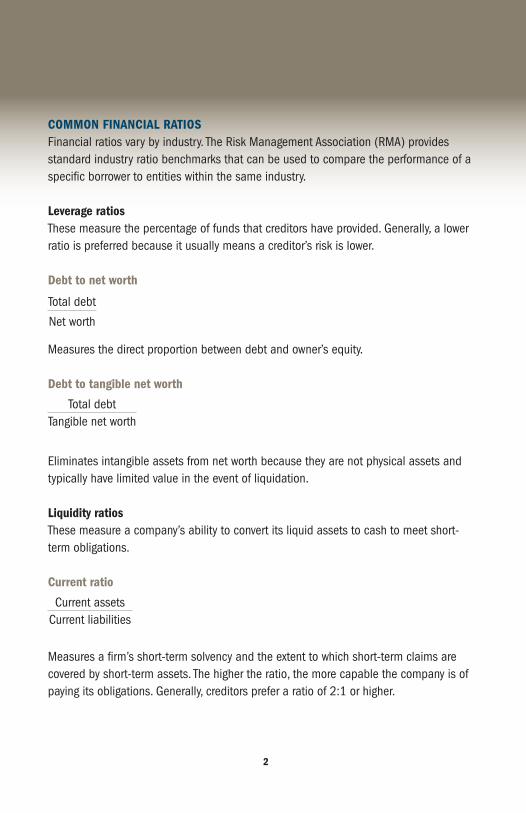
COMMON FINANCIAL RATIOS Financial ratios vary by industry. The Risk Management Association (RMA) provides standard industry ratio benchmarks that can be used to compare the performance of a specific borrower to entities within the same industry.
Leverage ratios These measure the percentage of funds that creditors have provided. Generally, a lower ratio is preferred because it usually means a creditor’s risk is lower.
Debt to net worth
Measures the direct proportion between debt and owner’s equity.
Debt to tangible net worth
Eliminates intangible assets from net worth because they are not physical assets and typically have limited value in the event of liquidation.
Liquidity ratiosThese measure a company’s ability to convert its liquid assets to cash to meet short-term obligations.
Current ratio
Measures a firm’s short-term solvency and the extent to which short-term claims are covered by short-term assets. The higher the ratio, the more capable the company is of paying its obligations. Generally, creditors prefer a ratio of 2:1 or higher.
2
Total debt
Net worth
Total debtTangible net worth
Current assetsCurrent liabilities

Quick ratio
Measures a firm’s ability to pay off short-term claims without relying on the sale of inventory. Generally, creditors prefer a ratio of 1.2:1 or higher.
Coverage margin ratiosFixed charge coverage ratio
Measurement of a firm’s ability to satisfy fixed financing expenses, such as interest and leases. A ratio over 1.0 indicates that the company is able to pay its fixed charges without incurring additional debt. Interest coverage
Ratio used to determine how easily a company can pay interest on outstanding debt. Typically, a ratio of 1.5 or higher indicates that the company is able to meet interest expenses. The lower the ratio, the more the company is burdened by debt expense. Efficiency ratiosThese measure a company’s ability to manage and control assets.
Inventory days on hand(Inventory/Cost of goods sold [COGS]) x 365
Measures the level of efficiency in managing inventory. Generally, low or declining days on hand (DOH) means greater operating efficiency than does the reverse. An increase may indi-cate a deliberate management decision to make a bulk purchase in anticipation of a sales surge or a disruption in the supply of raw materials. Raw materials and finished goods are easily liquidated. Work in process is more difficult to sell if liquidation becomes necessary.
3
Cash + marketable securities + net accounts receivablesCurrent liabilities
Earnings before interest and tax (EBIT) + lease and rental expense interestLease and rental expense + current portion of long-term debt (CPLTD)
EBITInterest expense

Accounts receivable days on hand (Net accounts receivables/Net sales) x 365
Measures collection and credit screening abilities. Generally, low or declining DOH means greater operating efficiency than high or increasing DOH. Receivables should be reviewed for any concentrations (accounts representing more than 10 percent or more of total receivables), which represent a higher degree of risk, even with a low DOH ratio. The accounts receivables aging schedule should be reviewed for receivables past due 90–120 days or more, which present a greater likelihood of charge-off.
Accounts payable days on hand(Accounts payable/COGS) x 365
Measures trade creditor financing of inventory and indicates paying habits. Increasing DOH can indicate cash flow problems. Generally, a firm with cash flow problems leans on its trade creditors first.
CREDIT MEMO CONSIDERATIONS All creditsMemos should clearly explain the transaction, risks, repayment capacity of the borrower and additional support provided by collateral and guarantor(s).
Overview of offering • Cause of borrowing need• Terms and sources of repayment• Collateral values/Date of valuation• Loan to value/loan to cost calculations
Residential single-family construction loans Builder history • Tenure, experience, and stability of builder• Success or failure of past projects• Credit history with suppliers, the bank, and other lenders
4

Management information• Depth and experience of management• Length of time in business• Ownership structure• Age and level of unsold inventory
The current project • Feasibility—that is, price points of houses, location, recent sales in the area,
marketing strategies, strength of market• Borrower’s equity in the project• Speculative/sold ratio for this and all projects• Appraisal for projects greater than $250M; evaluation for projects less than $250M• Environmental audits, property surveys, or soil tests if applicable• Exit strategy
Commercial and industrial loans Market conditions• Industry trends and overview• Nature and form of competition• Future outlook
Financial performance• Identification and interpretation of trends in sales, gross profit, and net
profit (last three years)• Leverage• Debt service coverage calculation/Trends in cash flow• Equity infusion• Credit history with bank and other lenders• Guarantor support
Asset-based loansMarket conditions• Industry trends and overview• Nature and form of competition• Future outlook
5

6
Financial performance• Identification and interpretation of trends in sales, gross profit, and net profit
(last three years)• Leverage• Debt service coverage/Trends in cash flow• Credit history• Status with suppliers and tax authorities• Guarantor support
Risk controls• Typical advance rates for eligible accounts receivable of 75 to 80 percent• Typical advance rates for eligible inventory of 50 to 60 percent• Monthly accounts receivables aging reports• Monthly inventory and payables aging reports and borrowing base and covenant
compliance certificates• Accounts receivables concentration limits• Field audits prior to origination, at renewal, and as needed after. Site visits quarterly
COMMERCIAL AND INDUSTRIAL LENDING CONSIDERATIONS Typical borrowing causes • Short-term lending to support fluctuations in accounts receivables and inventory—
that is, line of credit• Long-term lending to purchase assets that will generate revenue and income over a
long period of time
Short-term lending (line of credit)
Line amount Source of repayment Terms
• Modest growth—Sum of previous year’s highest three months’ sales figures
• High growth—Sum of highest three months of projected sales
• Conversion of assets to cash (see below)
• Should coincide with cash-conversion cycle
• Generally not to exceed 12 months

7
Long-term lending (equipment purchase)
Line amount Source of repayment Terms
• Based on a percentage of cost
• Cash flow from operations (see the calculations below)
• Based on the useful life of the asset
Cash conversion cycle (h3)
Debt service coverage ratio calculations Traditional debt service calculation
This calculation does not take into consideration any changes in key balance sheet items such as accounts receivables, inventory, and accounts payables. As a result, the ratio may be over- or understated based on the level of cash these items may be either generating or consuming.
CASH
PurchasesCollections
Sales
Production
AccountsReceivable
MaterialsInventory
Accounts Payable
Finished Inventory
Net income + Depreciation + Interest expensePrincipal and interest payments
8
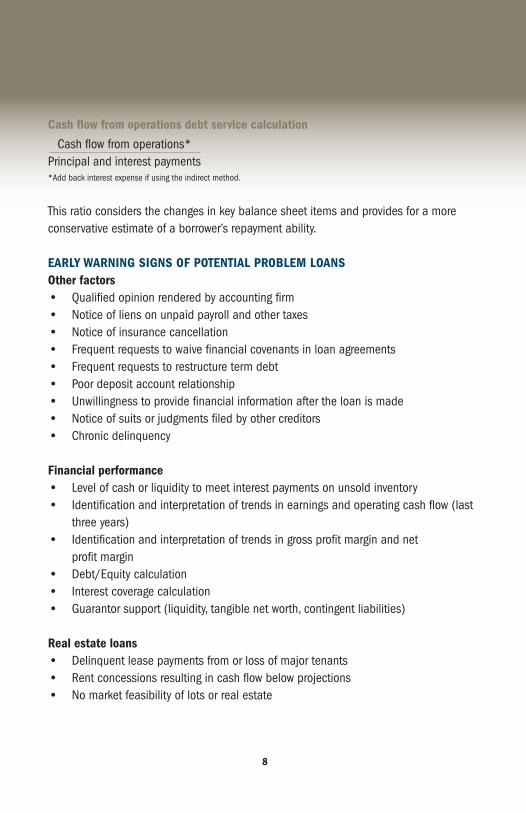
Cash flow from operations debt service calculation
*Add back interest expense if using the indirect method.
This ratio considers the changes in key balance sheet items and provides for a more conservative estimate of a borrower’s repayment ability.
EARLY WARNING SIGNS OF POTENTIAL PROBLEM LOANSOther factors• Qualified opinion rendered by accounting firm• Notice of liens on unpaid payroll and other taxes• Notice of insurance cancellation• Frequent requests to waive financial covenants in loan agreements• Frequent requests to restructure term debt• Poor deposit account relationship• Unwillingness to provide financial information after the loan is made• Notice of suits or judgments filed by other creditors• Chronic delinquency
Financial performance• Level of cash or liquidity to meet interest payments on unsold inventory• Identification and interpretation of trends in earnings and operating cash flow (last
three years)• Identification and interpretation of trends in gross profit margin and net
profit margin • Debt/Equity calculation• Interest coverage calculation• Guarantor support (liquidity, tangible net worth, contingent liabilities)
Real estate loans• Delinquent lease payments from or loss of major tenants• Rent concessions resulting in cash flow below projections• No market feasibility of lots or real estate
Cash flow from operations*Principal and interest payments
9
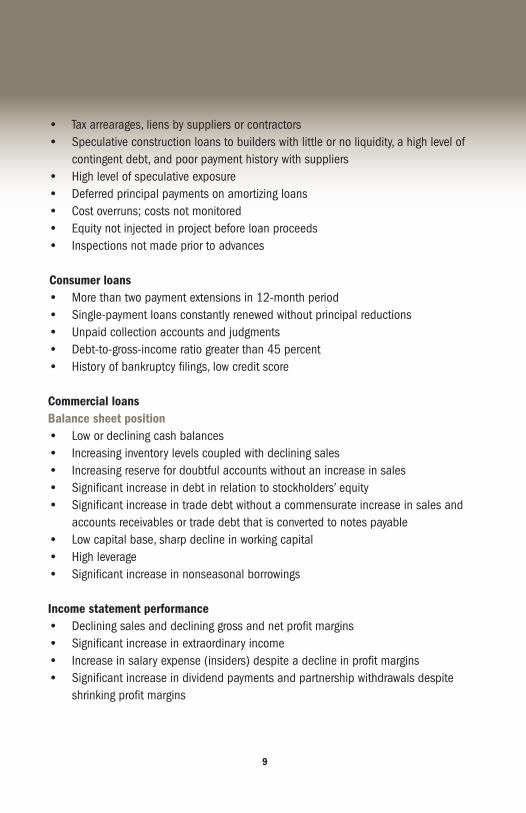
• Tax arrearages, liens by suppliers or contractors• Speculative construction loans to builders with little or no liquidity, a high level of
contingent debt, and poor payment history with suppliers• High level of speculative exposure• Deferred principal payments on amortizing loans• Cost overruns; costs not monitored• Equity not injected in project before loan proceeds• Inspections not made prior to advances
Consumer loans• More than two payment extensions in 12-month period• Single-payment loans constantly renewed without principal reductions• Unpaid collection accounts and judgments• Debt-to-gross-income ratio greater than 45 percent• History of bankruptcy filings, low credit score
Commercial loansBalance sheet position• Low or declining cash balances• Increasing inventory levels coupled with declining sales• Increasing reserve for doubtful accounts without an increase in sales• Significant increase in debt in relation to stockholders’ equity• Significant increase in trade debt without a commensurate increase in sales and
accounts receivables or trade debt that is converted to notes payable• Low capital base, sharp decline in working capital• High leverage• Significant increase in nonseasonal borrowings
Income statement performance• Declining sales and declining gross and net profit margins• Significant increase in extraordinary income• Increase in salary expense (insiders) despite a decline in profit margins• Significant increase in dividend payments and partnership withdrawals despite
shrinking profit margins

10
Business fundamentals• Borrower operates at a competitive disadvantage• Dependency on major customers, major suppliers• Ill-conceived or no business plan• Negative outlook for industry or market• Heavy growth without sufficient capital• Inadequate management depth and expertise; recurring loss of key officers• Minimal length of time in business• Poorly maintained equipment or facilities• Litigation against company or owner

11
What Directors Need to Know to Control Credit RiskLoan policy: Directors who approve loans should have a sound working knowledge of the loan policy and standard operating procedures for the institution.
Risk ratings: Directors should understand regulatory and institutional credit risk rating definitions, the reasons that ratings move up or down, and the effect that ratings have on the overall financial performance of the institution.
Troubled debt restructure (TDR): Directors should understand the definition of TDR and its potential impact on asset quality.
Allowance for loan and lease losses (ALLL): Directors should have a working knowl-edge of the ALLL and the financial impact the ALLL has on the institution.
Loan review: Directors should understand the importance of loan review, timing and scope of reviews, and the impact of loan review results.

frbatlanta.org
For more banking information and resources visit


This Guide was created by the Supervision and Regulation Division of the Federal Reserve Bank of Atlanta
1000 Peachtree Street, N.E., Atlanta, Georgia 30309