Embed Size (px)
Citation preview
Atmos. Meas. Tech., 3, 507–521, 2010www.atmos-meas-tech.net/3/507/2010/doi:10.5194/amt-3-507-2010© Author(s) 2010. CC Attribution 3.0 License.
AtmosphericMeasurement
Techniques
µDirac: an autonomous instrument for halocarbon measurements
B. Gostlow1, A. D. Robinson1, N. R. P. Harris1, L. M. O’Brien 1, D. E. Oram2, G. P. Mills2, H. M. Newton2, S. E. Yong3,and J. A Pyle1,4
1Centre for Atmospheric Science, Department of Chemistry, University of Cambridge, Lensfield Road, Cambridge,CB2 1EW, UK2School of Environmental Sciences, University of East Anglia, Norwich, NR4 7TJ, UK3Malaysian Meteorological Department, Ketua Stesen GAW Lembah Danum, Malaysia4National Centre for Atmospheric Science, NCAS-Climate, UK
Received: 10 August 2009 – Published in Atmos. Meas. Tech. Discuss.: 11 September 2009Revised: 19 March 2010 – Accepted: 5 April 2010 – Published: 29 April 2010
Abstract. We describe a new instrument (µDirac) capableof measuring halocarbons in the atmosphere. Portability,power efficiency and autonomy were critical design require-ments and the resulting instrument can be readily deployedunattended on a range of platforms: long duration balloon,aircraft, ship and ground-based stations. The instrument isa temperature programmed gas chromatograph with elec-tron capture detector (GC-ECD). The design requirementsled to µDirac being built in-house with several novel fea-tures. It currently measures a range of halocarbons (includ-ing short-lived tracers having biogenic and anthropogenicsources) with measurement precision relative standard devi-ations ranging from± 1% (CCl4) to± 9% (CH3I). The pro-totype instrument was first tested in 2005 and the instrumenthas been proved in the field on technically challenging air-craft and ground-based campaigns. Results from an aircraftand a ground-based deployment are described.
1 Introduction
Halocarbons in the atmosphere were first observed by Love-lock (1971) using a gas chromatograph (GC), after his inven-tion of the electron capture detector (ECD – Lovelock andLipsky, 1960; see also Morris and Ettre, 2007). His initialatmospheric use for his GC-ECD was to measure CFC-11and CFC-12, but it was soon also used to measure CH3I andCCl4 in air and water (Lovelock et al., 1973). Since thoseearly beginnings, observations of atmospheric halocarbons
Correspondence to:N. R. P. Harris([email protected])
have proven essential to improving our understanding of theinterplay between different atmospheric processes in manyregions of the atmosphere. Due to the wide range of atmo-spheric lifetime (hours to centuries) and varied sources (nat-ural and anthropogenic; marine and terrestrial), halocarbonsare valuable in tracing air mass origins and understandingdynamical and chemical processes. Observations of short-lived compounds can reveal the presence of biogenic sources(e.g. oceanic, biomass burning).
Measurements of halocarbons have been made primarilywith GC-ECDs or with GC-mass spectrometers (GC-MS –e.g. Miller et al., 2008). These have been operated in thefield or by collecting whole air or adsorbed air samples withsubsequent measurement in the laboratory. Observationshave been made routinely at ground locations for many years(Montzka et al., 1999; Prinn et al., 2000). Measurements atsea are less regular (e.g. Penkett et al., 1985; Class et al.,1986; Butler et al., 2007). Airborne (aircraft and balloon)measurements of long and short-lived halocarbons provideinformation on the extent and composition of the boundarylayer and its impact on the tropopshere (e.g. Blake et al.,2001, Colman et al., 2001). Information about polar ozoneloss (e.g., Proffitt et al., 1990; 1993), the polar vortex chem-ical composition and dynamics (e.g., Schmidt et al., 1994;Ray et al., 2002), the tropical tropopause layer (TTL) andits two-way transport with the stratosphere (e.g., Volk et al.,1996), and about transport in the tropopause region (e.g., Rayet al., 1999) can all be obtained by studying the distributionof halocarbon tracers. In each case the specific techniquesemployed have their own advantages and disadvantages. Ingeneral, the instruments deployed all require a degree of hu-man intervention and none of the instruments can really beconsidered lightweight. Improved ease of use, flexibility and
Published by Copernicus Publications on behalf of the European Geosciences Union.
508 B. Gostlow et al.: An autonomous instrument for halocarbon measurements
Table 1. µDirac target compounds and measurement performance during the Cape Verde ground-based and aircraft campaign.
Compound Formula Atmospheric Conc. in NOAA Scale Ground-based Airborne Limit ofname lifetime cylinder (ppt)a uncertainty (%)b precision (%)c precision (%)d detection (ppt)e
methyliodide CH3I 5 days 3.4 20 9.3 20.2 0.5chloroform CHCl3 5–6 months 9.93 5.0 4.0 8.1 0.5methylchloroform CH3CCl3 5 years 17.84 2.5 2.6 3.3 0.25carbontetrachloride CCl4 26 years 95.0 2.0 1.1 1.9 0.1dibromomethane CH2Br2 3–4 months 4.8 10 5.4 5.7 0.15tetrachloroethene C2Cl4 3–4 months 2.01 10 4.2 8.2 0.05bromoform CHBr3 26 days 9.0 10 4.5 17.3 0.25
a ppt dry air mole fraction, certified at time of filling in Dec 2005;b uncertainty estimate (2 s.d.) of NOAA-ESRL calibration air;c 1 s.d. of 6 calibration chromatograms made in a single day;d 1 s.d. of all airborne calibrations from the Dornier aircraft flight on 1st June 2007;e based on signal to noise ratio of 10.
reliability as well as lower cost are all desirable. These quali-ties are the rationale in the development of micro-GCs (Tien-pont et al., 2009).
Here we present a new micro-GC designed to meet theneed for more flexible, autonomous, low power halocarbonanalysis suited to a range of field deployments. It was orig-inally designed for use on Montgolfier Infra Rouge (MIR)long duration balloons (Pommereau and Hauchecorne, 1979;Pommereau et al., 2002), and so the discussion of the de-sign is based around meeting those challenging require-ments. However, it has proven versatile and has also beenused in aircraft and ground-based deployments. This newinstrument has evolved from our earlier DESCARTES andDIRAC instruments (Danis et al., 2000; Robinson et al.,2000) whose CFC measurements have been used for the es-timation of Arctic ozone loss (Robinson et al., 2005) andits effect on mid-latitudes (Ross et al., 2004), and for satel-lite validation (Urban et al., 2005). The instrument is basedon a GC-ECD system and is capable of making measure-ments of halocarbons with a range of atmospheric lifetimesand sources, including a number of short-lived gases suchas CHCl3, CH2Br2, C2Cl4, CHBr2Cl, CHBr3 and CH3I.These compounds are found in the atmosphere with concen-trations at and below the part-per-trillion (ppt) level (Table 1).The flexible, lightweight and autonomous design ofµDiracmeans that a range of uses can be envisioned, with only rel-atively minor adaptations being required. In this paper wedescribe in Sect. 2 the core GC instrument which is commonto all deployment scenarios. At the end of Sect. 2 we describeinstrument adaptations which are specific to the type of de-ployment: MIR long-duration balloon; lower troposphericaircraft and ground-based campaigns. Section 3 discussesinstrument performance in terms of measurement accuracy,separation ability, precision and sensitivity. Recent deploy-ment results are presented in Sect. 4.
2 Instrument description
µDirac is a gas chromatograph with electron capture detec-tor which makes in situ measurements of halocarbons. Tomeet the exacting requirements of flight on MIR balloons itis lightweight, low power and able to operate autonomouslyfor several weeks; as such it has been almost completely de-signed and made in-house. Section 2.1 describes the instru-ment core which is common to all uses. Specific require-ments for MIR balloon, aircraft and ground-based deploy-ments are presented in Sect. 2.2–2.4.
2.1 Core GC
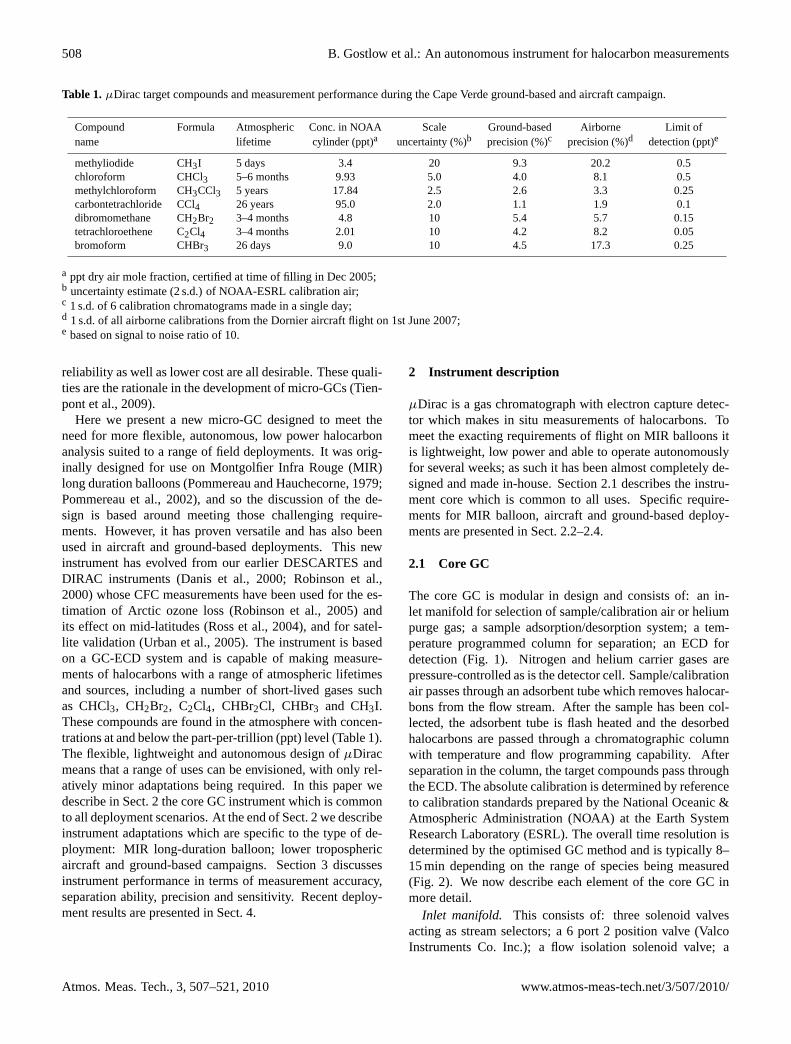
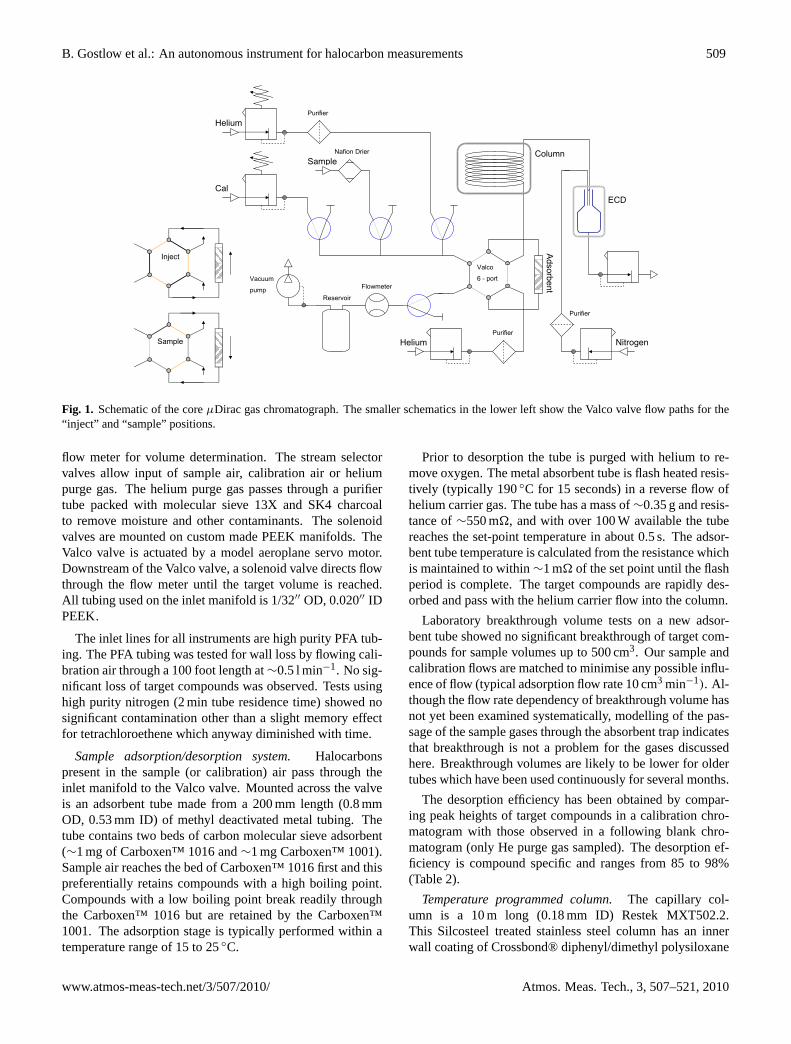
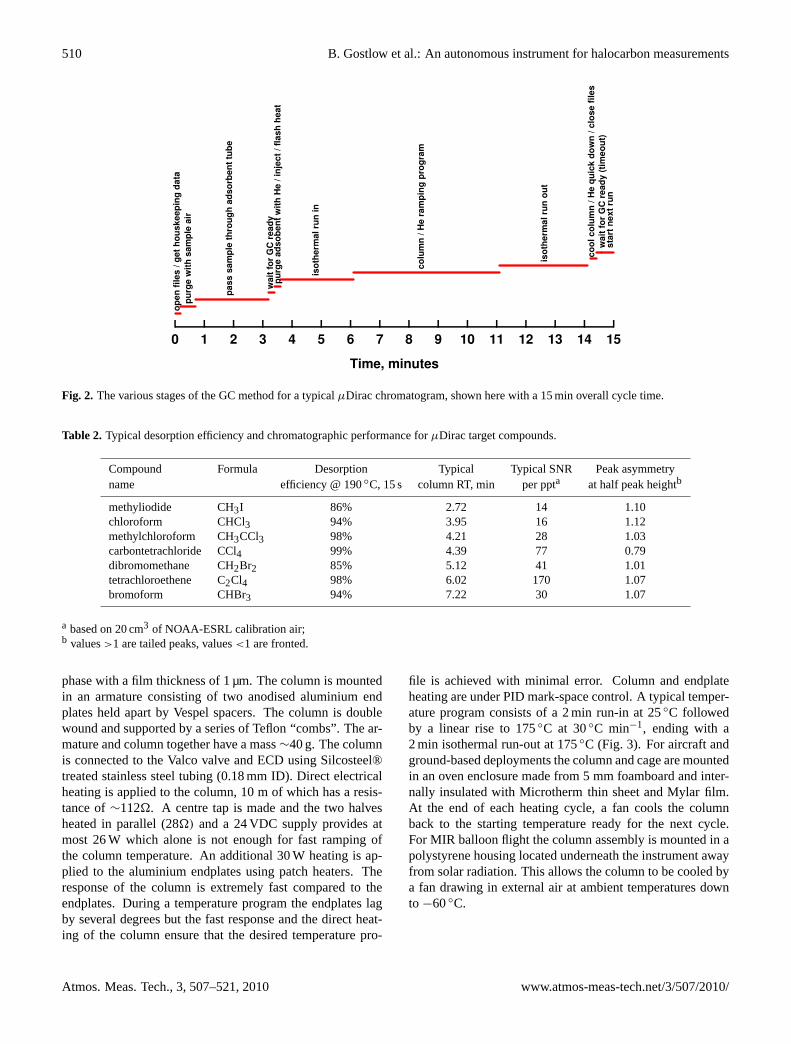
The core GC is modular in design and consists of: an in-let manifold for selection of sample/calibration air or heliumpurge gas; a sample adsorption/desorption system; a tem-perature programmed column for separation; an ECD fordetection (Fig. 1). Nitrogen and helium carrier gases arepressure-controlled as is the detector cell. Sample/calibrationair passes through an adsorbent tube which removes halocar-bons from the flow stream. After the sample has been col-lected, the adsorbent tube is flash heated and the desorbedhalocarbons are passed through a chromatographic columnwith temperature and flow programming capability. Afterseparation in the column, the target compounds pass throughthe ECD. The absolute calibration is determined by referenceto calibration standards prepared by the National Oceanic &Atmospheric Administration (NOAA) at the Earth SystemResearch Laboratory (ESRL). The overall time resolution isdetermined by the optimised GC method and is typically 8–15 min depending on the range of species being measured(Fig. 2). We now describe each element of the core GC inmore detail.
Inlet manifold. This consists of: three solenoid valvesacting as stream selectors; a 6 port 2 position valve (ValcoInstruments Co. Inc.); a flow isolation solenoid valve; a
Atmos. Meas. Tech., 3, 507–521, 2010 www.atmos-meas-tech.net/3/507/2010/
B. Gostlow et al.: An autonomous instrument for halocarbon measurements 509
Helium
Cal
Sample
Flowmeter
Helium
Nafion Drier
Purifier
Valco 6 - port
Adsorbent
Nitrogen
ECD
Column
Purifier
Purifier
Reservoir
Vacuum pump
Sample
Inject
Fig. 1. Schematic of the coreµDirac gas chromatograph. The smaller schematics in the lower left show the Valco valve flow paths for the“inject” and “sample” positions.
flow meter for volume determination. The stream selectorvalves allow input of sample air, calibration air or heliumpurge gas. The helium purge gas passes through a purifiertube packed with molecular sieve 13X and SK4 charcoalto remove moisture and other contaminants. The solenoidvalves are mounted on custom made PEEK manifolds. TheValco valve is actuated by a model aeroplane servo motor.Downstream of the Valco valve, a solenoid valve directs flowthrough the flow meter until the target volume is reached.All tubing used on the inlet manifold is 1/32′′ OD, 0.020′′ IDPEEK.
The inlet lines for all instruments are high purity PFA tub-ing. The PFA tubing was tested for wall loss by flowing cali-bration air through a 100 foot length at∼0.5 l min−1. No sig-nificant loss of target compounds was observed. Tests usinghigh purity nitrogen (2 min tube residence time) showed nosignificant contamination other than a slight memory effectfor tetrachloroethene which anyway diminished with time.
Sample adsorption/desorption system. Halocarbonspresent in the sample (or calibration) air pass through theinlet manifold to the Valco valve. Mounted across the valveis an adsorbent tube made from a 200 mm length (0.8 mmOD, 0.53 mm ID) of methyl deactivated metal tubing. Thetube contains two beds of carbon molecular sieve adsorbent(∼1 mg of Carboxen™ 1016 and∼1 mg Carboxen™ 1001).Sample air reaches the bed of Carboxen™ 1016 first and thispreferentially retains compounds with a high boiling point.Compounds with a low boiling point break readily throughthe Carboxen™ 1016 but are retained by the Carboxen™1001. The adsorption stage is typically performed within atemperature range of 15 to 25◦C.
Prior to desorption the tube is purged with helium to re-move oxygen. The metal absorbent tube is flash heated resis-tively (typically 190◦C for 15 seconds) in a reverse flow ofhelium carrier gas. The tube has a mass of∼0.35 g and resis-tance of∼550 m�, and with over 100 W available the tubereaches the set-point temperature in about 0.5 s. The adsor-bent tube temperature is calculated from the resistance whichis maintained to within∼1 m� of the set point until the flashperiod is complete. The target compounds are rapidly des-orbed and pass with the helium carrier flow into the column.
Laboratory breakthrough volume tests on a new adsor-bent tube showed no significant breakthrough of target com-pounds for sample volumes up to 500 cm3. Our sample andcalibration flows are matched to minimise any possible influ-ence of flow (typical adsorption flow rate 10 cm3 min−1). Al-though the flow rate dependency of breakthrough volume hasnot yet been examined systematically, modelling of the pas-sage of the sample gases through the absorbent trap indicatesthat breakthrough is not a problem for the gases discussedhere. Breakthrough volumes are likely to be lower for oldertubes which have been used continuously for several months.
The desorption efficiency has been obtained by compar-ing peak heights of target compounds in a calibration chro-matogram with those observed in a following blank chro-matogram (only He purge gas sampled). The desorption ef-ficiency is compound specific and ranges from 85 to 98%(Table 2).
Temperature programmed column.The capillary col-umn is a 10 m long (0.18 mm ID) Restek MXT502.2.This Silcosteel treated stainless steel column has an innerwall coating of Crossbond® diphenyl/dimethyl polysiloxane
www.atmos-meas-tech.net/3/507/2010/ Atmos. Meas. Tech., 3, 507–521, 2010
510 B. Gostlow et al.: An autonomous instrument for halocarbon measurements
1514131211109876543210
Time, minutes
op
en
fil
es
/ g
et
ho
us
ke
ep
ing
da
ta
pu
rge
wit
h s
am
ple
air
pa
ss
sa
mp
le t
hro
ug
h a
ds
orb
en
t tu
be
wa
it f
or
GC
re
ad
yp
urg
e a
ds
ob
en
t w
ith
He
/ i
nje
ct
/ fl
as
h h
ea
t
iso
the
rma
l ru
n i
n
co
lum
n /
He
ra
mp
ing
pro
gra
m
iso
the
rma
l ru
n o
ut
co
ol
co
lum
n /
He
qu
ick
do
wn
/ c
los
e f
ile
s
wa
it f
or
GC
re
ad
y (
tim
eo
ut)
sta
rt n
ex
t ru
n
Fig. 2. The various stages of the GC method for a typicalµDirac chromatogram, shown here with a 15 min overall cycle time.
Table 2. Typical desorption efficiency and chromatographic performance forµDirac target compounds.
Compound Formula Desorption Typical Typical SNR Peak asymmetryname efficiency @ 190◦C, 15 s column RT, min per ppta at half peak heightb
methyliodide CH3I 86% 2.72 14 1.10chloroform CHCl3 94% 3.95 16 1.12methylchloroform CH3CCl3 98% 4.21 28 1.03carbontetrachloride CCl4 99% 4.39 77 0.79dibromomethane CH2Br2 85% 5.12 41 1.01tetrachloroethene C2Cl4 98% 6.02 170 1.07bromoform CHBr3 94% 7.22 30 1.07
a based on 20 cm3 of NOAA-ESRL calibration air;b values>1 are tailed peaks, values<1 are fronted.
phase with a film thickness of 1 µm. The column is mountedin an armature consisting of two anodised aluminium endplates held apart by Vespel spacers. The column is doublewound and supported by a series of Teflon “combs”. The ar-mature and column together have a mass∼40 g. The columnis connected to the Valco valve and ECD using Silcosteel®treated stainless steel tubing (0.18 mm ID). Direct electricalheating is applied to the column, 10 m of which has a resis-tance of∼112�. A centre tap is made and the two halvesheated in parallel (28�) and a 24 VDC supply provides atmost 26 W which alone is not enough for fast ramping ofthe column temperature. An additional 30 W heating is ap-plied to the aluminium endplates using patch heaters. Theresponse of the column is extremely fast compared to theendplates. During a temperature program the endplates lagby several degrees but the fast response and the direct heat-ing of the column ensure that the desired temperature pro-
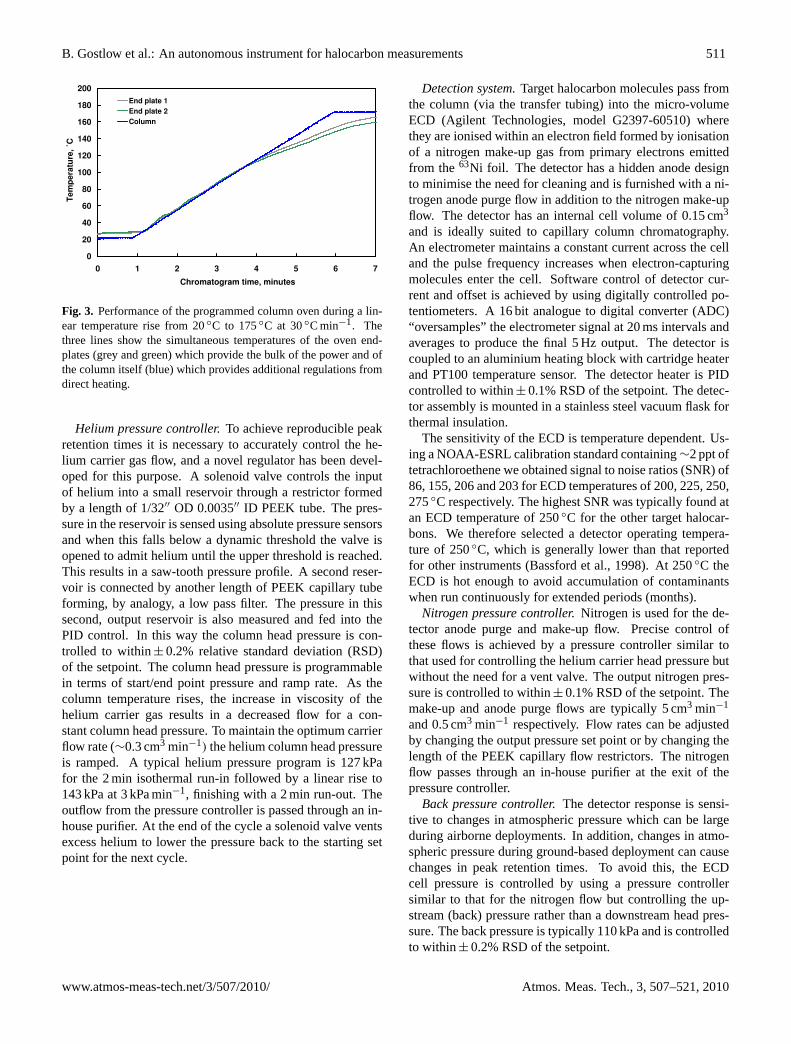
file is achieved with minimal error. Column and endplateheating are under PID mark-space control. A typical temper-ature program consists of a 2 min run-in at 25◦C followedby a linear rise to 175◦C at 30◦C min−1, ending with a2 min isothermal run-out at 175◦C (Fig. 3). For aircraft andground-based deployments the column and cage are mountedin an oven enclosure made from 5 mm foamboard and inter-nally insulated with Microtherm thin sheet and Mylar film.At the end of each heating cycle, a fan cools the columnback to the starting temperature ready for the next cycle.For MIR balloon flight the column assembly is mounted in apolystyrene housing located underneath the instrument awayfrom solar radiation. This allows the column to be cooled bya fan drawing in external air at ambient temperatures downto −60◦C.
Atmos. Meas. Tech., 3, 507–521, 2010 www.atmos-meas-tech.net/3/507/2010/
B. Gostlow et al.: An autonomous instrument for halocarbon measurements 511
0
20
40
60
80
100
120
140
160
180
200
0 1 2 3 4 5 6 7
Chromatogram time, minutes
End plate 1
End plate 2
Column
Te
mp
era
ture
, ˚C
Fig. 3. Performance of the programmed column oven during a lin-ear temperature rise from 20◦C to 175◦C at 30◦C min−1. Thethree lines show the simultaneous temperatures of the oven end-plates (grey and green) which provide the bulk of the power and ofthe column itself (blue) which provides additional regulations fromdirect heating.
Helium pressure controller.To achieve reproducible peakretention times it is necessary to accurately control the he-lium carrier gas flow, and a novel regulator has been devel-oped for this purpose. A solenoid valve controls the inputof helium into a small reservoir through a restrictor formedby a length of 1/32′′ OD 0.0035′′ ID PEEK tube. The pres-sure in the reservoir is sensed using absolute pressure sensorsand when this falls below a dynamic threshold the valve isopened to admit helium until the upper threshold is reached.This results in a saw-tooth pressure profile. A second reser-voir is connected by another length of PEEK capillary tubeforming, by analogy, a low pass filter. The pressure in thissecond, output reservoir is also measured and fed into thePID control. In this way the column head pressure is con-trolled to within± 0.2% relative standard deviation (RSD)of the setpoint. The column head pressure is programmablein terms of start/end point pressure and ramp rate. As thecolumn temperature rises, the increase in viscosity of thehelium carrier gas results in a decreased flow for a con-stant column head pressure. To maintain the optimum carrierflow rate (∼0.3 cm3 min−1) the helium column head pressureis ramped. A typical helium pressure program is 127 kPafor the 2 min isothermal run-in followed by a linear rise to143 kPa at 3 kPa min−1, finishing with a 2 min run-out. Theoutflow from the pressure controller is passed through an in-house purifier. At the end of the cycle a solenoid valve ventsexcess helium to lower the pressure back to the starting setpoint for the next cycle.
Detection system.Target halocarbon molecules pass fromthe column (via the transfer tubing) into the micro-volumeECD (Agilent Technologies, model G2397-60510) wherethey are ionised within an electron field formed by ionisationof a nitrogen make-up gas from primary electrons emittedfrom the63Ni foil. The detector has a hidden anode designto minimise the need for cleaning and is furnished with a ni-trogen anode purge flow in addition to the nitrogen make-upflow. The detector has an internal cell volume of 0.15 cm3
and is ideally suited to capillary column chromatography.An electrometer maintains a constant current across the celland the pulse frequency increases when electron-capturingmolecules enter the cell. Software control of detector cur-rent and offset is achieved by using digitally controlled po-tentiometers. A 16 bit analogue to digital converter (ADC)“oversamples” the electrometer signal at 20 ms intervals andaverages to produce the final 5 Hz output. The detector iscoupled to an aluminium heating block with cartridge heaterand PT100 temperature sensor. The detector heater is PIDcontrolled to within± 0.1% RSD of the setpoint. The detec-tor assembly is mounted in a stainless steel vacuum flask forthermal insulation.
The sensitivity of the ECD is temperature dependent. Us-ing a NOAA-ESRL calibration standard containing∼2 ppt oftetrachloroethene we obtained signal to noise ratios (SNR) of86, 155, 206 and 203 for ECD temperatures of 200, 225, 250,275◦C respectively. The highest SNR was typically found atan ECD temperature of 250◦C for the other target halocar-bons. We therefore selected a detector operating tempera-ture of 250◦C, which is generally lower than that reportedfor other instruments (Bassford et al., 1998). At 250◦C theECD is hot enough to avoid accumulation of contaminantswhen run continuously for extended periods (months).
Nitrogen pressure controller.Nitrogen is used for the de-tector anode purge and make-up flow. Precise control ofthese flows is achieved by a pressure controller similar tothat used for controlling the helium carrier head pressure butwithout the need for a vent valve. The output nitrogen pres-sure is controlled to within± 0.1% RSD of the setpoint. Themake-up and anode purge flows are typically 5 cm3 min−1
and 0.5 cm3 min−1 respectively. Flow rates can be adjustedby changing the output pressure set point or by changing thelength of the PEEK capillary flow restrictors. The nitrogenflow passes through an in-house purifier at the exit of thepressure controller.
Back pressure controller.The detector response is sensi-tive to changes in atmospheric pressure which can be largeduring airborne deployments. In addition, changes in atmo-spheric pressure during ground-based deployment can causechanges in peak retention times. To avoid this, the ECDcell pressure is controlled by using a pressure controllersimilar to that for the nitrogen flow but controlling the up-stream (back) pressure rather than a downstream head pres-sure. The back pressure is typically 110 kPa and is controlledto within± 0.2% RSD of the setpoint.
www.atmos-meas-tech.net/3/507/2010/ Atmos. Meas. Tech., 3, 507–521, 2010
512 B. Gostlow et al.: An autonomous instrument for halocarbon measurements
Electronics backplane.Software control is integral in thedesign ofµDirac. The electronic design is modular and con-sists of a backplane with sockets for nine plug-in boardswhich are linked peer-to-peer by RS485. Each board hasits own PIC microcontroller so that the processing tasks(e.g. flow control, ECD electrometer, column oven ramping)are distributed. The “primary” control board runs the chro-matographic method in flash memory and can store data lo-cally on removable memory card (MMC). The control boardalso handles communication with the PC user interface. Foraircraft and ground-based deployments it is convenient tostore data on the PC using USB flash memory.
Control. A consistent design aim has been to make all pa-rameters configurable and held either in EEPROM or flashmemory. The instrument is either quiescent, where param-eters such as gas pressures are maintained or it is operat-ing in program mode. The chromatographic method is writ-ten as a text file using a spreadsheet before being compiledand passed to the instrument where it is held in flash mem-ory. The user can configure temperatures, pressures, tim-ings and so on. In addition the user can call for parametersto be recorded in a system file at run time for later analy-sis (e.g. sample volume). Once the instrument has been de-ployed, it is possible to remotely view/edit instrument param-eters or download a different chromatographic method.
Power supplies.The core GC is designed to operate from24 VDC for flexibility of deployment. The column and de-tector ovens use this supply directly. DC/DC converters pro-vide regulated power for solenoid valves at 12 VDC with fur-ther regulation to 5 VDC for the electronics. The electrom-eter requires regulated± 15 VDC power which is also pro-vided from a DC/DC converter. The thermal desorption sys-tem requires a 12 VDC high current supply, provided by aNiMH battery pack and maintained by a trickle charge. Theinstrument can be run off 100/240 VAC mains or from 24 Vbatteries.
2.2 Requirements for MIR balloon deployment
The MIR balloon platform has been in development since1977 by the Centre National d’Etudes Spatiales (CNES,Toulouse, France). It is a hot air balloon of 36 000 to45 000 m3 and it is lifted to the stratosphere by helium whichexits from the balloon during the first few days of flight. Theballoon is heated by radiative fluxes from the sun by day-time and upwelling infrared fluxes during the night whichcauses the balloon to rise at dawn and descend at sunset, en-abling vertical profiles to be measured. The night-time airtemperature inside the balloon envelope needs to be at least15◦C above ambient air to keep a balanced float level andfor this reason the envelope is optimized to capture infraredfluxes rising from the earth (about 250 Wm−2 available atflight level). The balloon can carry a maximum payload atits hook of∼50 kg.
This is a technically challenging deployment to deliverscientifically useful measurements at very low atmosphericpressure (5 to 80 hPa) and at very low air temperatures (−20to −60◦C). The gondola (supplied by CNES) provides pro-tection during launch, thermal insulation, power and com-munication throughout the 30 day mission. We now describehow each of the technical requirements for the instrument areachieved.
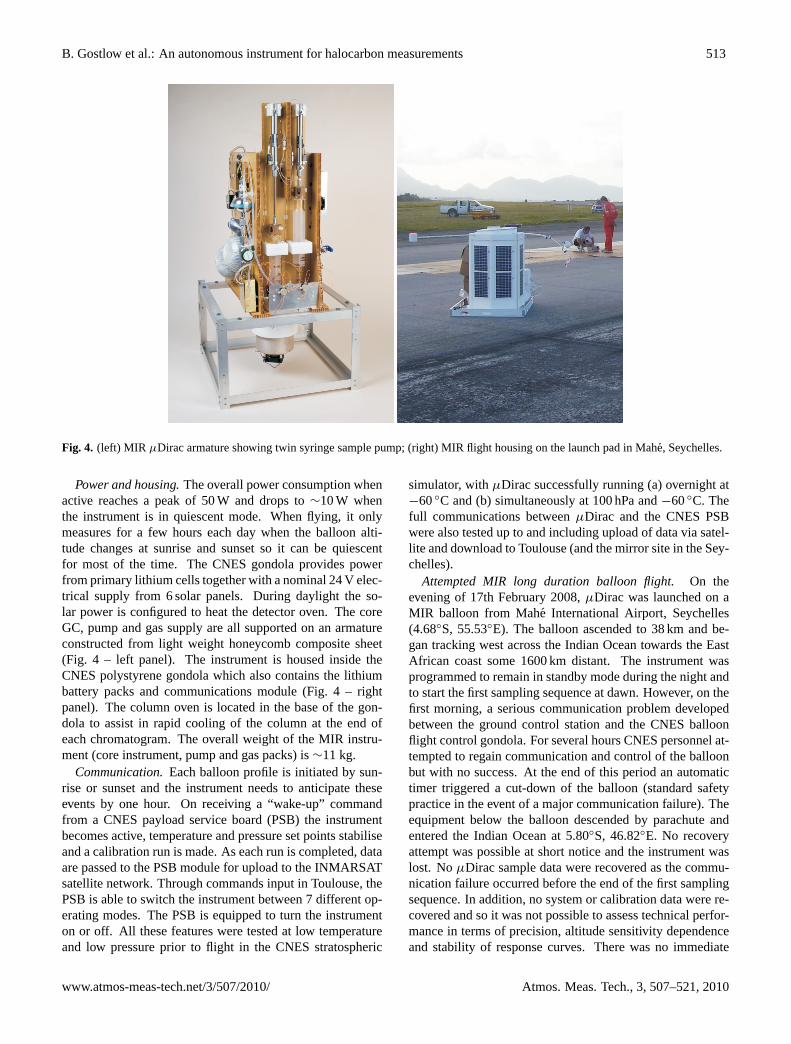
Sampling pump and inlet.The challenge for the pump isto deliver an uncontaminated supply of sample air at highenough pressure to provide flow through the sampling mani-fold including the narrow adsorbent tube. A commercial di-aphragm or metal bellows pump cannot be used due to power,weight and contamination issues. Instead the design is in-house, based on two 100 cm3 glass laboratory syringes eachwith a solenoid valve for flow control. The syringes are eachdriven by a gas actuated cylinder with magnetic/reed switchstroke detection and are operated 180◦ out of phase (Fig. 4– left panel). A differential pressure sensor determines whenthe pump pressure is sufficiently high to be directed into thecore GC. The target sample volume is 5 cm3 at standard tem-perature and pressure (STP) which can be obtained by about3 pump cycles at an ambient pressure of 20 hPa. Each syringeis fitted with a 2 m length of inlet tubing below the gondolato allow sampling of uncontaminated air during descent.
Helium and nitrogen gas supply.The GC requires nitro-gen, helium and calibration gas for the duration of the MIRballoon flight. We assume a duration of 30 days though MIRballoons have previously flown for over 11 weeks. The ni-trogen and helium supplies are held in 1.5 l aluminium/glassfibre composite cylinders, each equipped with a three wayfilling valve. The cylinders are filled to∼200 bar with grade6.0 nitrogen and helium. The helium and pressure controllersin the core GC need an input pressure of 3 to 5 bar absoluteand this is delivered by high purity absolute pressure regu-lators. The sampling pump actuators also need a deliverypressure of 3 to 5 bar which is taken from the output of thehelium regulator.
Calibration gas supply.The instrument requires regularcalibration during the balloon flight. The standard mode, tobe used on all profiles, is for a calibration chromatogram tobe run at the start and end of each vertical profile, giving10 samples between calibrations. To assess the amount ofsensitivity drift during a vertical profile, an operating modeis available which alternates between sample and calibrationchromatograms. There is also a calibration mode which gen-erates a five point calibration response curve to enable cor-rection for instrument non-linearity effects. Calibration gasis stored in a 75 cm3 Sulfinert treated cylinder fitted with astainless steel bellows valve. The cylinder is filled to 68 barbefore flight by decanting from a NOAA-ESRL calibrationcylinder which is linked to NOAA-ESRL halocarbon stan-dard scales (Hall et al., 2001). The calibration gas is sup-plied to the core GC at a pressure of∼2 bar absolute by ahigh purity absolute pressure regulator.
Atmos. Meas. Tech., 3, 507–521, 2010 www.atmos-meas-tech.net/3/507/2010/
B. Gostlow et al.: An autonomous instrument for halocarbon measurements 513
Fig. 4. (left) MIR µDirac armature showing twin syringe sample pump; (right) MIR flight housing on the launch pad in Mahe, Seychelles.
Power and housing.The overall power consumption whenactive reaches a peak of 50 W and drops to∼10 W whenthe instrument is in quiescent mode. When flying, it onlymeasures for a few hours each day when the balloon alti-tude changes at sunrise and sunset so it can be quiescentfor most of the time. The CNES gondola provides powerfrom primary lithium cells together with a nominal 24 V elec-trical supply from 6 solar panels. During daylight the so-lar power is configured to heat the detector oven. The coreGC, pump and gas supply are all supported on an armatureconstructed from light weight honeycomb composite sheet(Fig. 4 – left panel). The instrument is housed inside theCNES polystyrene gondola which also contains the lithiumbattery packs and communications module (Fig. 4 – rightpanel). The column oven is located in the base of the gon-dola to assist in rapid cooling of the column at the end ofeach chromatogram. The overall weight of the MIR instru-ment (core instrument, pump and gas packs) is∼11 kg.
Communication.Each balloon profile is initiated by sun-rise or sunset and the instrument needs to anticipate theseevents by one hour. On receiving a “wake-up” commandfrom a CNES payload service board (PSB) the instrumentbecomes active, temperature and pressure set points stabiliseand a calibration run is made. As each run is completed, dataare passed to the PSB module for upload to the INMARSATsatellite network. Through commands input in Toulouse, thePSB is able to switch the instrument between 7 different op-erating modes. The PSB is equipped to turn the instrumenton or off. All these features were tested at low temperatureand low pressure prior to flight in the CNES stratospheric
simulator, withµDirac successfully running (a) overnight at−60◦C and (b) simultaneously at 100 hPa and−60◦C. Thefull communications betweenµDirac and the CNES PSBwere also tested up to and including upload of data via satel-lite and download to Toulouse (and the mirror site in the Sey-chelles).
Attempted MIR long duration balloon flight.On theevening of 17th February 2008,µDirac was launched on aMIR balloon from Mahe International Airport, Seychelles(4.68◦S, 55.53◦E). The balloon ascended to 38 km and be-gan tracking west across the Indian Ocean towards the EastAfrican coast some 1600 km distant. The instrument wasprogrammed to remain in standby mode during the night andto start the first sampling sequence at dawn. However, on thefirst morning, a serious communication problem developedbetween the ground control station and the CNES balloonflight control gondola. For several hours CNES personnel at-tempted to regain communication and control of the balloonbut with no success. At the end of this period an automatictimer triggered a cut-down of the balloon (standard safetypractice in the event of a major communication failure). Theequipment below the balloon descended by parachute andentered the Indian Ocean at 5.80◦S, 46.82◦E. No recoveryattempt was possible at short notice and the instrument waslost. NoµDirac sample data were recovered as the commu-nication failure occurred before the end of the first samplingsequence. In addition, no system or calibration data were re-covered and so it was not possible to assess technical perfor-mance in terms of precision, altitude sensitivity dependenceand stability of response curves. There was no immediate
www.atmos-meas-tech.net/3/507/2010/ Atmos. Meas. Tech., 3, 507–521, 2010
514 B. Gostlow et al.: An autonomous instrument for halocarbon measurements
flight of the back-up instrument which is being kept in caseof a future flight opportunity.
2.3 Requirements for aircraft deployment
µDirac was deployed on the Natural Environment Re-search Council (NERC) airborne research and survey facil-ity (ARSF) Dornier 228 aircraft for low altitude (<5 km) inthe Cape Verde Islands in May/June 2007. This was techni-cally easier than the MIR balloon flight as aircraft power wasavailable, ambient pressure was higher, the thermal environ-ment was less extreme and the required degree of autonomywas lower (typical aircraft flight was 4 h duration).
Sampling pump and inlet.For low altitude operation thesampling pump is located at the exit of the core GC to reducethe risk of sample contamination. This is possible as the re-quired pressure differential across the inlet manifold can eas-ily be obtained by lowering the sample outlet pressure. Thepump maintains a sub-ambient reservoir of∼16 kPa inside a600 cm3 canister. By adjusting the pressure in this reservoirthe sample flow rate through the core GC can be set (typicallybetween 5 and 20 cm3 min−1). The sample inlet line of thecore GC is connected to a∼10 m of PFA tubing flushed at aflow rate of∼1 l min−1 using a miniature rotary vane pump.The sample flow passing into the core GC is dried using adessicant Nafion membrane drier. Laboratory tests whichpassed calibration air through the Nafion tube showed no lossof target halocarbons and also blank tests (using purified ni-trogen) showed no presence of contaminants co-eluting withtarget peaks.
Helium, nitrogen and calibration gas supply.The core GCrequires sufficient helium, nitrogen and calibration gas forseveral days of operation as refilling the gas cylinders is dif-ficult on an aircraft. For the Dornier deployment, a gas packhousing made from honeycomb composite sheet secures thecylinders. Grade 6.0 helium and nitrogen are stored at upto 120 bar in aluminium cylinders of 300 cm3 and 1200 cm3
volume respectively. The calibration gas system is identi-cal to that for the MIR version except that the cylinder islarger (150 cm3). A full gas pack can run the instrument for∼10 days of continuous operation.
Power, housing and computer.The instrument can runfrom 240 VAC aircraft power. A regulated power supply isused to supply 24 VDC power (maximum∼5 amps) to thecore GC. To provide unbroken power toµDirac during en-gine startup and shutdown a simple uninterruptible powersupply (UPS) is used, made from two 12 V battery packsin series. The need for a strong instrument housing on theDornier is paramount over weight considerations, thereforethe core GC and gas pack are mounted on a slide-out shelfinside a steel 19′′ 9U rack enclosure. The enclosure is fit-ted with fans to remove excess heat from the instrument. Inaddition, air is provided to the column fan at∼5◦C belowambient air temperature by a Peltier heat pump. This venti-lation does not impair the thermal stability of the ECD and
column oven which are well insulated. A single board PCis used to start the instrument before flight and to store datain-flight. This is low power, has in-built UPS protection andsolid state disk drives rather than mechanical drives (whichcan fail at reduced ambient pressure). The PC also runs thecontrol interface and instrument data are stored on USB flashmemory.
2.4 Requirements for ground-based deployment
Here we describe the technical requirements needed to sup-port the core GC for long ground-based or ship deploymentswhere the instrument will be unattended for long periods.The requirements are similar to those required on aircraft de-ployment but with a longer sample inlet, support gases forseveral months and a robust power scheme to handle poweroutages.
Sampling pump and inlet.The PFA inlet tubing can be upto 80 m long. Ingress of rain at the top of the inlet is avoidedby an upturned glass funnel plugged at its inlet by glass woolto exclude insects and large particles. The inlet is flushed bya pump located downstream of the instrument inlet tee. Acounter flow Nafion membrane drier is used to dry the sam-ple flow passing into the core GC using the detector exhaustgas as the drying flow. Laboratory tests using humidifiedair showed the drier could lower the relative humidity from95% at the input to 3% at the output with a counter flow of5 cm3 min−1.
Helium, nitrogen and calibration gas supply.The core GCrequires sufficient helium, nitrogen (6.0 grade) and calibra-tion gas for several months unattended operation. For the he-lium and nitrogen gases, small commercially available 10 lsize cylinders with high purity single stage pressure regula-tors are used. With a fill pressure of 200 bar the nitrogen andhelium last for 9 and 45 months continuous operation respec-tively. The calibration gas system is identical to that for theMIR balloon but with a larger Sulfinert cylinder (500 cm3),giving a capacity of 34 l of calibration gas (sufficient for 4months typical operation). For longer deployments a NOAA-ERSL standard contained in a 34 l stainless steel “Essex”cylinder is used directly.
Power, housing and computer.Where 100/240 VAC mainspower is availableµDirac uses a regulated 24 VDC powersupply backed up by a UPS. In the absence of mains powerthe instrument can be operated outdoors (e.g. on the forestfloor) by employing pairs of 12 V battery packs in series(e.g. NiMH packs or 12 V lead acid car batteries). In thisway the instrument can run for hours to days depending onbattery capacity. The instrument is housed in a lightweight(4 kg) plastic 19′′ 8U rack enclosure which can easily be car-ried between sites. Cooled air is provided to the column fanand adsorbent tube using a Peltier heat pump. A low power,single board PC identical to that used for aircraft deploymentis used to run the user interface and data collection software.
Atmos. Meas. Tech., 3, 507–521, 2010 www.atmos-meas-tech.net/3/507/2010/
B. Gostlow et al.: An autonomous instrument for halocarbon measurements 515
0
500
1000
1500
2000
2500
3000
3500
C2C
l 4 p
ea
k h
eig
ht
0
500
1000
1500
2000
2500
3000
3500
26-Jun 27-Jun 28-Jun 29-Jun 30-Jun 01-Jul 02-Jul 03-Jul
Date
C2C
l 4 p
ea
k h
eig
ht
-150
-100
-50
0
50
100
150
0 10 20 30 40 50
Calibration gas volume, cm3 @STP
De
via
tio
n f
rom
fi
t
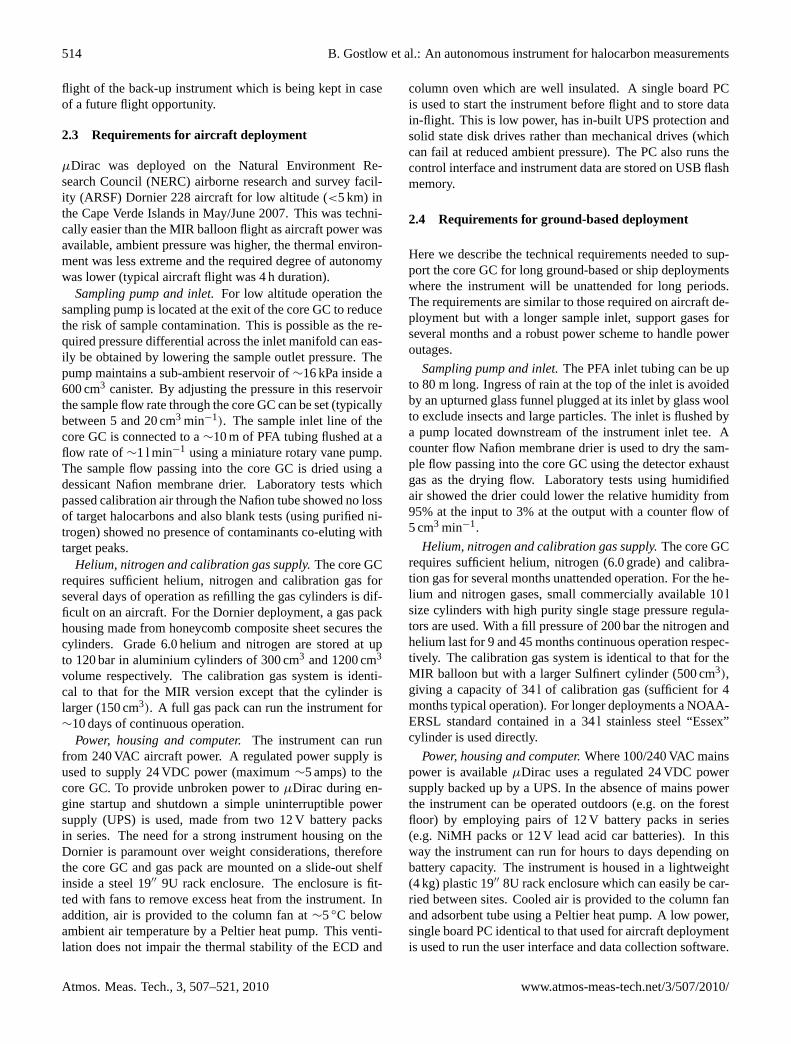
Fig. 5. (left) Typical µDirac calibration / sampling sequence showing raw peak height data for tetrachloroethene (from 26th June to3rd July 2009, during remote operation at Bukit Atur, Malaysia). Sample peak heights are shown as grey circles. Precision calibrations(blue circles) are used to derive measurement precision and to enable correction to sensitivity drift. The response calibrations (red diamonds)are used to make corrections for non-linearity. (right) The response calibration peak heights plotted against volume of calibration gas. Thesolid black line shows the linear fit and the dashed grey line is a 3rd order polynomial fit. The lower panel shows the deviations of theindividual calibrations from the linear fit and more clearly shows any departure from linear behaviour, the dashed black line in this panel isa linear fit through the deviations. Note that we anyway use the 3rd order polynomial fit to correct the samples for non-linearity effects.
A flat panel monitor, keyboard and mouse are added, thoughthese are removed for deployment outdoors.
3 Instrument performance
Here we describe the performance ofµDirac based on labo-ratory tests and on results of recent field deployments. Highquality geophysical data is possible only after detailed at-tention to instrument calibration, accuracy, precision, peakseparation and sensitivity. We now describe each of theseperformance aspects in turn.
3.1 Calibration
Absolute calibrations are determined by reference to aNOAA-ESRL calibration gas standard. This is a pressurised,humdified sample of air from Niwot Ridge (CO, USA)held in a 34 l stainless steel electropolished “Essex” cylin-der (filled to 60 bar in December 2005). Niwot Ridge isa site representative of remote continental background air.The standard was spiked with a few ppt of CH3I, CHBr3and CH2Br2 and compared to NOAA-ESRL working stan-dards using GC-ECD and GC-MS techniques enabling ac-curate ppt (dry air mole fraction) determination for 21 halo-carbons. Typical uncertainty in the calibration gas is± 0.5to± 2% (2 s.d.) for the CFCs and other long-lived halo-carbons and± 5 to± 20% for the shorter-lived halocarbons(B. D. Hall, personal communication, 2010). NOAA-ESRLrecommend re-analysis of the calibration cylinder to assessdrift every 3 years or when the cylinder pressure drops to20 bar.
In Cape Verde (May–June 2007), calibration chro-matograms of the same volume as the samples (∼20 cm3)
were run after typically every 6 sample chromatograms (thecalibration frequency can be changed in the method file). Ablank chromatogram, generated by sampling helium purgegas, was also run just before every calibration as a checkon system impurities and desorption efficiency. The instru-ment method now includes calibration response curves (sev-eral calibrations covering a range of volumes) which en-able the tracking of small changes in detector non-linearity(Fig. 5). Some compounds show a near linear instrument re-sponse (e.g. C2Cl4) whilst others show some degree of non-linearity (Fig. 6). We correct for non-linearity using responsecurves which are continually collected autonomously over afew days.
3.2 Accuracy and precision
Taking into account the various uncertainties such as thoseassociated with preparation of the standard, drift of stan-dard with time, changes due to transfer of standard gas tothe on-board cylinder, we estimate that an accuracy of± 2to± 5% (2 s.d.) can be achieved for the long-lived halo-carbons and± 10 to± 25% for the shorter-lived compounds.The estimated uncertainties of the measurements for individ-ual halocarbons are given in Table 1. These errors are re-viewed as more knowledge is acquired of the various uncer-tainties (e.g. standard drift with time).
The measurement precision cannot be estimated directlyin the samples. One way to assess this is by repeating themeasurement of the gas standard several times consecutively
www.atmos-meas-tech.net/3/507/2010/ Atmos. Meas. Tech., 3, 507–521, 2010

516 B. Gostlow et al.: An autonomous instrument for halocarbon measurements
0
200
400
600
800
1000
1200
1400
1600
1800
2000
CH
Br 3
pe
ak
he
igh
t
-200
-100
0
100
200
0 10 20 30 40 50
Calibration gas volume, cm3 @STP
De
via
tio
n f
rom
fi
t
0
500
1000
1500
2000
2500
3000
CH
2B
r 2 p
ea
k h
eig
ht
-300
-200
-100
0
100
200
300
0 10 20 30 40 50
Calibration gas volume, cm3 @STP
De
via
tio
n f
rom
fi
t
0
200
400
600
800
1000
1200
1400
1600
1800
CH
Cl 3
pe
ak
he
igh
t
-300
-200
-100
0
100
200
300
0 10 20 30 40 50
Calibration gas volume, cm3 @STP
De
via
tio
n f
rom
fi
t
Fig. 6. TypicalµDirac calibration response curves showing raw peak height versus calibration volume for bromoform (left), dibromomethane(centre) and chloroform (right). Individual calibrations are shown as red diamonds, the solid black line is the linear regression and the dashedgrey line is a 3rd order polynomial (used for the non-linearity correction). To highlight any departure from linearity the lower panel for eachcompound shows the standard deviation from the linear fit of the calibration points and the dotted black line in the lower panels is the linearfit through the deviations. The measurements were made in 2009 (26th June to 3rd July) during remote operation at Bukit Atur, Malaysia.
and calculating the RSD of the peak heights for each targetcompound. Using this approach in the laboratory we obtainRSDs for target compounds ranging from± 0.9% (C2Cl4)to± 8.5% (CHCl3), based on a 20 cm3 calibration air volume(Fig. 7 – upper panel). To quantify measurement precision inthe field, we look at the real-time calibration chromatogramsrun typically after every six samples in the Cape Verdeground-based campaign (Fig. 7 – lower panel). The field pre-cisions for 20 cm3 calibration air vary from± 1.1% for CCl4up to± 9.3% for CH3I and are given in Table 1. In-flight(Dornier) RSD measurement precision ranges from± 1.9%for CCl4 up to± 20.2% for CH3I. The laboratory precisiontests were made under more stable thermal conditions thanthose from the field and hence they are better. Environmentalconditions in the field are not usually optimal and so the lab-oratory performance is not always attained. The laboratorybased estimates presented here thus represent the best achiev-able performance and they are approached when instrumentsare run for extended periods in stable surroundings.µDirachas been designed so that its operating conditions are as sta-ble as possible in order to minimise any additional error con-tributions.
3.3 Separation and co-elution
Unlike a mass spectrometer, the ECD is not capable ofdifferentiating between two or more peaks which elute atthe same time from the column. For this reason, opti-mum separation of the target compounds (and from otherunknown compounds) is very important. Fortunately, theECD is selective and in the case of atmospheric samplesit mainly responds to halogenated and oxygenated com-
pounds and shows little response to hydrocarbons for in-stance. The 10 m column used onµDirac allows good sep-aration of target compounds in samples with overall anal-ysis times as short as 10 min (Fig. 8), but there are someco-elution issues. During instrument development we in-troduced individual target halocarbons by preparing crudestatic dilutions (typically 50 to 100 ppt in a nitrogen bal-ance) from single analyte solutions, sourced commercially.This provided retention time information for target com-pounds. We then extended this work by introducing com-pounds which (from the literature) may be found in atmo-spheric samples, even at sub-ppt levels. We identified aco-elution issue with CH2Br2 and CHBrCl2 as this appearsjust before CH2Br2 in our chromatograms but there is novalley between the peaks. Measurements of CH2Br2 asCHBrCl2 reported in the literature indicate that CH2Br2 isusually present at higher mixing ratios than CHBrCl2 (be-tween 3×and 10×higher) at least for marine air (O’Brien etal., 2009). Other compounds which we have investigatedas possible candidates for co-elution with our target com-pounds are 1,1-dichloroethene, bromoethane, iodoethane,n-iodopropane, chloroiodomethane, 2-iodopropane, 2-iodobutane, 1-iodobutane, 1,1,1,2-tetrachloroethane, 1-iodopentane (Fig. 9). There are also some possible co-elution issues with alkylnitrates which can be present at highconcentrations in biomass burning plumes. On-going workhas identified likely compounds (of biomass burning origin)which we will subsequently try to investigate further usingthe µDirac column. Also, we are using longer columns toaddress co-elution issues and are investigating different col-umn types.
Atmos. Meas. Tech., 3, 507–521, 2010 www.atmos-meas-tech.net/3/507/2010/
B. Gostlow et al.: An autonomous instrument for halocarbon measurements 517
Time, minutes0 1 2 3 4 5 6 7 8 9
EC
D s
ign
al
0
5000
10000
15000
20000
25000
30000
5 6 7 8 9
2000
3000
4000
5000
6000CFC-11 (0.2)
CFC-113 (0.8)
CHCl3
(8.5)
Time, minutes0 1 2 3 4 5 6 7 8
EC
D s
ign
al
0
5000
10000
15000
20000
25000
30000
4 5 6 7
2000
3000
4000
5000
6000
CH3I
(9.3)
CH3CCl
3
(2.6)
CHCl3
(4.0)
CHBr3
(4.5)
C2Cl
4
(4.2)CH
2Br
2
(5.4)
CFC-113 (3.9)
CFC-11 (2.6)
CH3CCl
3
(4.1)
CCl4
(1.0)
C2Cl
4
(0.9)
CCl4
(1.1)
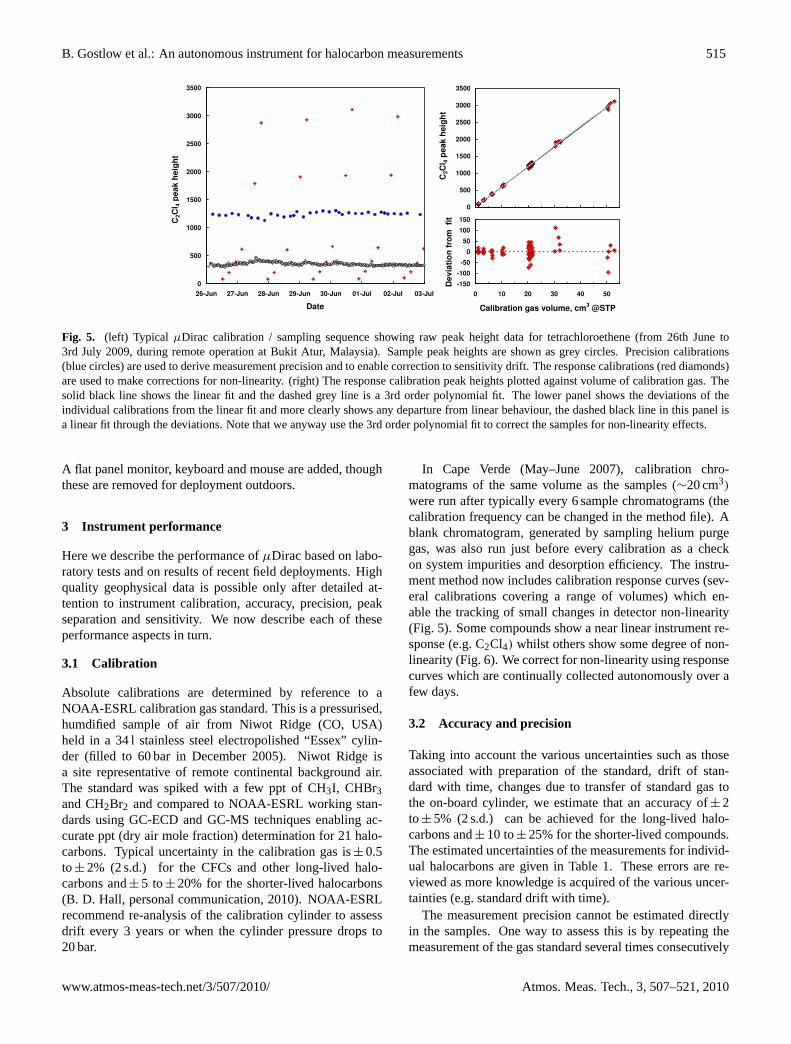
Fig. 7. Overlaid chromatograms of calibration air during opera-tion in the laboratory (upper panel) and in Cape Verde in June2007 (lower panel). The precision of the peak heights (RSD,%)are shown in parentheses, each chromatogram is generated froma 20 cm3 volume of Niwot Ridge air (NOAA-ESRL) spiked withCH3I, CH2Br2 and CHBr3.
Some peak broadening is evident inµDirac chro-matograms despite the use of a narrow bore capillary column.When desorbing it is important that the carrier flow is close tothe optimum for the column (0.3 cm3 min−1). However, thisis below the optimum flow rate for desorption and results innon-instantaneous injection onto the column. We have triedusing a smaller bore adsorption tube (0.25 mm ID) whichwould have a lower optimum flow for desorption. Howeverthis proved too small for the mesh size of adsorbent used andcaused a blockage. Peak broadening in our chromatogramsis also partly due to the dead volume in the ECD and lowmake-up gas flow used, which particularly affects the frontof the chromatogram around CFC-11 and CFC-113.
3.4 Sensitivity
The instrument has been optimised for high sensitivity. Themicro-volume ECD is arguably the most sensitive ECD avail-able commercially and has the lowest internal cell volume.This allows capillary columns to be used with low make-up gas flow (the flushing time of the cell is shorter thana conventional ECD). The nitrogen make-up flow is typ-ically 5 cm3 min−1 in order to further improve sensitivity.
EC
D s
ign
al
0
5000
10000
15000
20000
25000
30000
CFC-113
CFC-11
CCl4
CHBr3C
2Cl
4CHCl3
CH3CCl
3
CH2Br
2
Time, minutes0 1 2 3 4 5 6 7 8
EC
D s
ign
al
1000
2000
3000
4000
5000CFC-11 CFC-113 CCl
4
CHCl3
CH3CCl
3
CH3I
CHBr3
C2Cl
4
CH2Br
2
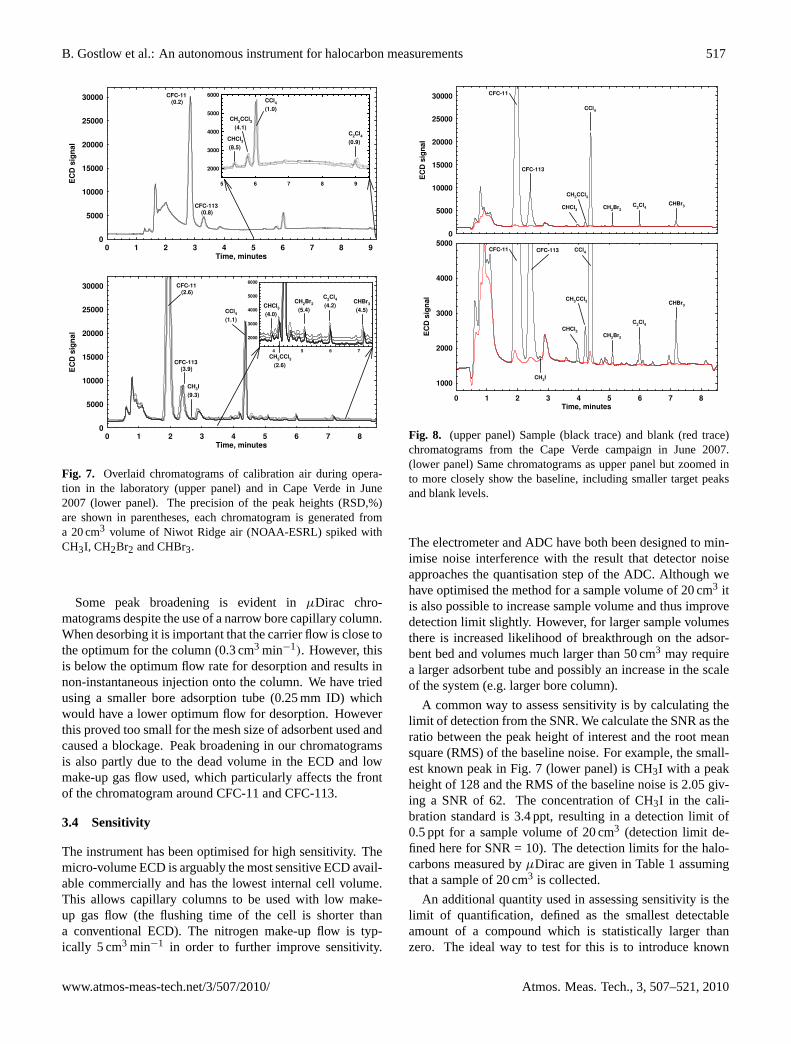
Fig. 8. (upper panel) Sample (black trace) and blank (red trace)chromatograms from the Cape Verde campaign in June 2007.(lower panel) Same chromatograms as upper panel but zoomed into more closely show the baseline, including smaller target peaksand blank levels.
The electrometer and ADC have both been designed to min-imise noise interference with the result that detector noiseapproaches the quantisation step of the ADC. Although wehave optimised the method for a sample volume of 20 cm3 itis also possible to increase sample volume and thus improvedetection limit slightly. However, for larger sample volumesthere is increased likelihood of breakthrough on the adsor-bent bed and volumes much larger than 50 cm3 may requirea larger adsorbent tube and possibly an increase in the scaleof the system (e.g. larger bore column).
A common way to assess sensitivity is by calculating thelimit of detection from the SNR. We calculate the SNR as theratio between the peak height of interest and the root meansquare (RMS) of the baseline noise. For example, the small-est known peak in Fig. 7 (lower panel) is CH3I with a peakheight of 128 and the RMS of the baseline noise is 2.05 giv-ing a SNR of 62. The concentration of CH3I in the cali-bration standard is 3.4 ppt, resulting in a detection limit of0.5 ppt for a sample volume of 20 cm3 (detection limit de-fined here for SNR = 10). The detection limits for the halo-carbons measured byµDirac are given in Table 1 assumingthat a sample of 20 cm3 is collected.
An additional quantity used in assessing sensitivity is thelimit of quantification, defined as the smallest detectableamount of a compound which is statistically larger thanzero. The ideal way to test for this is to introduce known
www.atmos-meas-tech.net/3/507/2010/ Atmos. Meas. Tech., 3, 507–521, 2010
518 B. Gostlow et al.: An autonomous instrument for halocarbon measurements
40x103
30
20
10
0
EC
D s
ign
al
121086420
Time, minutes
1-iodopentaneC5H11I
CH2ClI
CHBr3
C2Cl4
CH3CCl3
1-iodopropaneC3H7I
CHBrCl2 / CH2Br2
1-iodobutaneC4H9I
C2H5I / CHCl3
C2H5Br
2-iodopropaneC3H7I
2-iodobutaneC4H9I
CCl4
CH2BrCl
Fig. 9. Chromatogram of a laboratory air sample fromµDirac af-ter spiking the laboratory air with traces of nine different halocar-bons: bromoethane (C2H5Br), iodoethane (C2H5I), 1-iodopropane(C3H7I), chloroiodomethane (CH2ClI), 2-iodopropane (C3H7I),2-iodobutane (C4H9I), 1-iodobutane (C4H9I), 1-iodopentane(C5H11I). To enable clear retention time identification the halo-carbons were introduced individually and a laboratory air chro-matogram was made before introducing the next compound. Thiswas purely a qualitative exercise; however our latest NOAA-ESRLstandards do include chloroiodomethane on a provisional scale (es-timated accuracy± 10 to± 20%, 2 s.d).
amounts of each halocarbon at a concentration just above thelimit of detection. Then by measuring the RSD of repeatchromatograms we can deduce if the measurement precisionfor peaks with very low SNR is the same as that for high SNRpeaks. We have looked at this for C2Cl4 (using ground-baseddata) and found an RSD of± 2% for samples of 2 ppt (SNR330). The precision degrades to± 5% for samples of 0.3 to0.7 ppt (SNR 50 to 100) and degrades to± 11% for samplesof 0.1 ppt (SNR 10). For CH3I which is the smallest tar-get peak in our chromatograms, the RSD is typically± 4%for samples of 2.5 ppt (SNR 15) but the RSD degrades toaround± 28% for samples of 0.5 to 1.0 ppt (SNR∼10). Thereason for choosing SNR = 10 to define the detection limitis that the integration software used to detect and measurepeaks does not work for SNR lower than 10. Conversely,though, this means thatµDirac can measure compounds attheir detection limits with reasonable precision.
4 Results and Discussion
µDirac has already participated in several deployments:ground-based, aircraft and balloon campaigns. In this sec-tion we demonstrate the field capability of the instrument bypresenting results from an aircraft campaign and a ground-based deployment.
CHBr3
CHBr3 (ppt)
0 2 4 6
Pre
ssu
re level,
mb
750
800
850
900
950
1000
CHCl3
CHCl3 (ppt)
6 8 10 12 14 16 18
Pre
ssu
re level,
mb
750
800
850
900
950
1000
C2Cl4
C2Cl4 (ppt)
1 2 3 4
~2 km
~1 km
~0.5 km
surface surface
27th May30th May
31st May
1st June
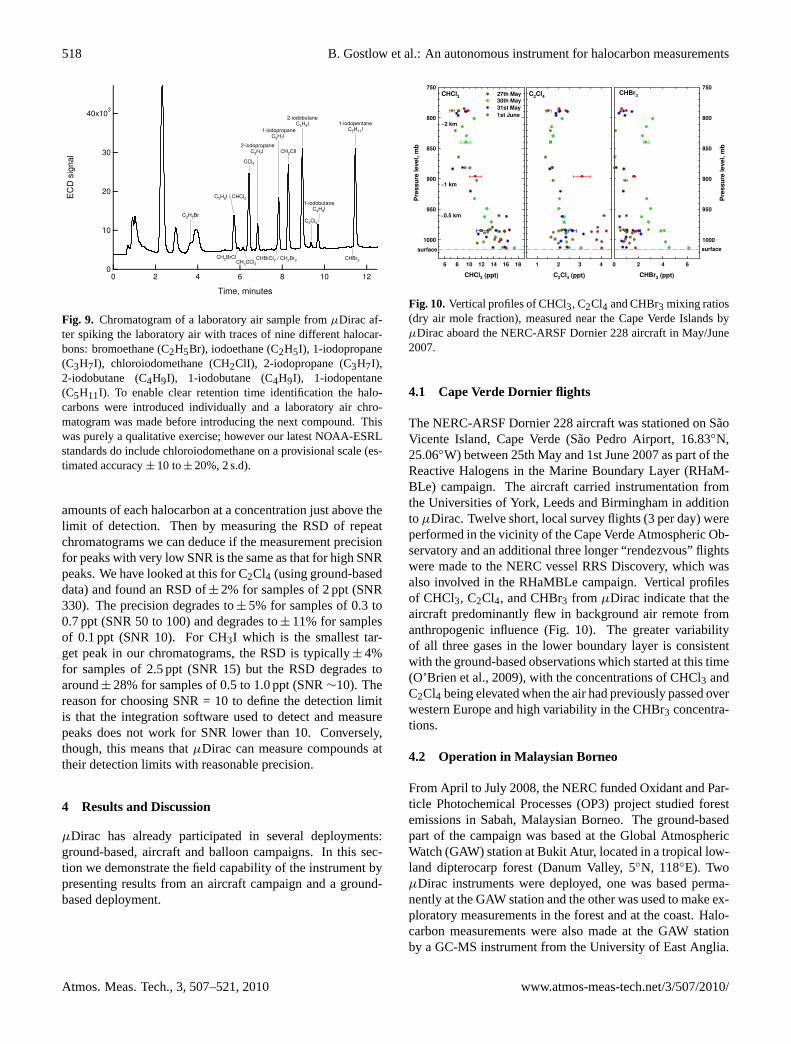
Fig. 10.Vertical profiles of CHCl3, C2Cl4 and CHBr3 mixing ratios(dry air mole fraction), measured near the Cape Verde Islands byµDirac aboard the NERC-ARSF Dornier 228 aircraft in May/June2007.
4.1 Cape Verde Dornier flights
The NERC-ARSF Dornier 228 aircraft was stationed on SaoVicente Island, Cape Verde (Sao Pedro Airport, 16.83◦N,25.06◦W) between 25th May and 1st June 2007 as part of theReactive Halogens in the Marine Boundary Layer (RHaM-BLe) campaign. The aircraft carried instrumentation fromthe Universities of York, Leeds and Birmingham in additionto µDirac. Twelve short, local survey flights (3 per day) wereperformed in the vicinity of the Cape Verde Atmospheric Ob-servatory and an additional three longer “rendezvous” flightswere made to the NERC vessel RRS Discovery, which wasalso involved in the RHaMBLe campaign. Vertical profilesof CHCl3, C2Cl4, and CHBr3 from µDirac indicate that theaircraft predominantly flew in background air remote fromanthropogenic influence (Fig. 10). The greater variabilityof all three gases in the lower boundary layer is consistentwith the ground-based observations which started at this time(O’Brien et al., 2009), with the concentrations of CHCl3 andC2Cl4 being elevated when the air had previously passed overwestern Europe and high variability in the CHBr3 concentra-tions.
4.2 Operation in Malaysian Borneo
From April to July 2008, the NERC funded Oxidant and Par-ticle Photochemical Processes (OP3) project studied forestemissions in Sabah, Malaysian Borneo. The ground-basedpart of the campaign was based at the Global AtmosphericWatch (GAW) station at Bukit Atur, located in a tropical low-land dipterocarp forest (Danum Valley, 5◦N, 118◦E). TwoµDirac instruments were deployed, one was based perma-nently at the GAW station and the other was used to make ex-ploratory measurements in the forest and at the coast. Halo-carbon measurements were also made at the GAW stationby a GC-MS instrument from the University of East Anglia.
Atmos. Meas. Tech., 3, 507–521, 2010 www.atmos-meas-tech.net/3/507/2010/
B. Gostlow et al.: An autonomous instrument for halocarbon measurements 519
3 3
2 2
1 1
0 0
CH
Br 3
(p
pt)
8.Jul.08
8.Jul.08
15.Jul.08
15.Jul.08
22.Jul.08
22.Jul.08
µDirac CHBr3
UEA GC-MS CHBr3
1.5 1.5
1.0 1.0
0.5 0.5
0.0 0.0
CH
2B
r 2 (
pp
t)
8.Jul.08 15.Jul.08 22.Jul.08
Date (ticks = 00:00hr local time)
µDirac CH2Br2
UEA GC-MS CH2Br2
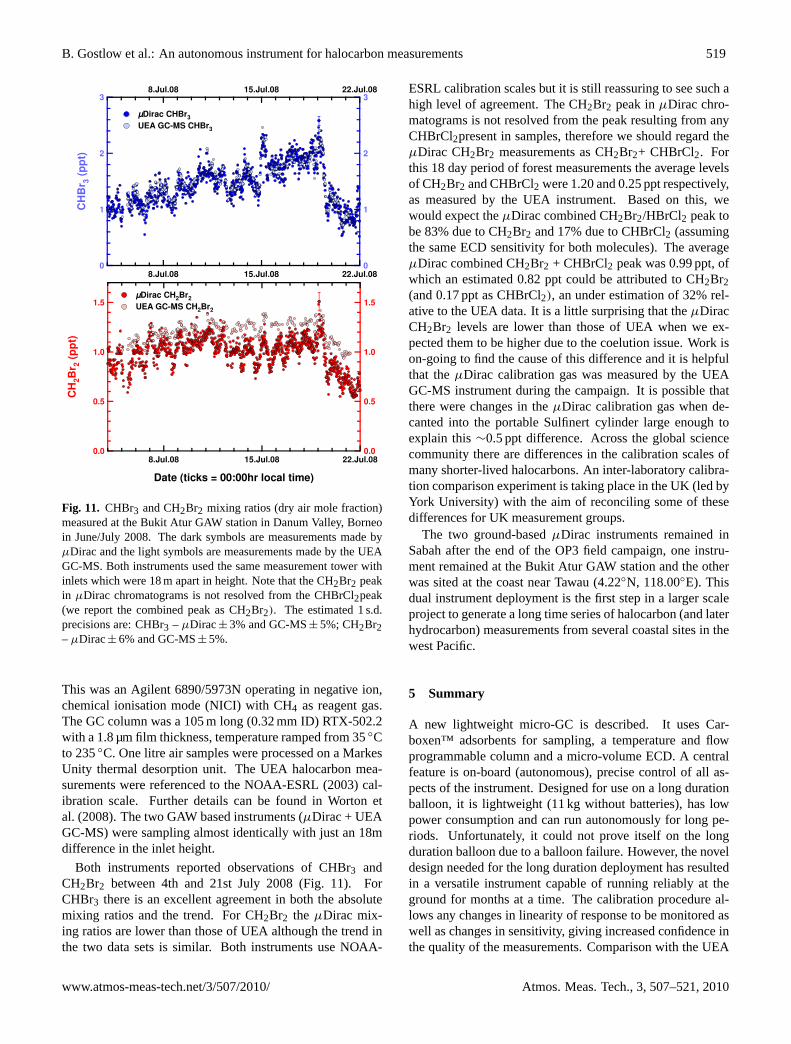
Fig. 11. CHBr3 and CH2Br2 mixing ratios (dry air mole fraction)measured at the Bukit Atur GAW station in Danum Valley, Borneoin June/July 2008. The dark symbols are measurements made byµDirac and the light symbols are measurements made by the UEAGC-MS. Both instruments used the same measurement tower withinlets which were 18 m apart in height. Note that the CH2Br2 peakin µDirac chromatograms is not resolved from the CHBrCl2peak(we report the combined peak as CH2Br2). The estimated 1 s.d.precisions are: CHBr3 – µDirac± 3% and GC-MS± 5%; CH2Br2– µDirac± 6% and GC-MS± 5%.
This was an Agilent 6890/5973N operating in negative ion,chemical ionisation mode (NICI) with CH4 as reagent gas.The GC column was a 105 m long (0.32 mm ID) RTX-502.2with a 1.8 µm film thickness, temperature ramped from 35◦Cto 235◦C. One litre air samples were processed on a MarkesUnity thermal desorption unit. The UEA halocarbon mea-surements were referenced to the NOAA-ESRL (2003) cal-ibration scale. Further details can be found in Worton etal. (2008). The two GAW based instruments (µDirac + UEAGC-MS) were sampling almost identically with just an 18mdifference in the inlet height.
Both instruments reported observations of CHBr3 andCH2Br2 between 4th and 21st July 2008 (Fig. 11). ForCHBr3 there is an excellent agreement in both the absolutemixing ratios and the trend. For CH2Br2 the µDirac mix-ing ratios are lower than those of UEA although the trend inthe two data sets is similar. Both instruments use NOAA-
ESRL calibration scales but it is still reassuring to see such ahigh level of agreement. The CH2Br2 peak inµDirac chro-matograms is not resolved from the peak resulting from anyCHBrCl2present in samples, therefore we should regard theµDirac CH2Br2 measurements as CH2Br2+ CHBrCl2. Forthis 18 day period of forest measurements the average levelsof CH2Br2 and CHBrCl2 were 1.20 and 0.25 ppt respectively,as measured by the UEA instrument. Based on this, wewould expect theµDirac combined CH2Br2/HBrCl2 peak tobe 83% due to CH2Br2 and 17% due to CHBrCl2 (assumingthe same ECD sensitivity for both molecules). The averageµDirac combined CH2Br2 + CHBrCl2 peak was 0.99 ppt, ofwhich an estimated 0.82 ppt could be attributed to CH2Br2(and 0.17 ppt as CHBrCl2), an under estimation of 32% rel-ative to the UEA data. It is a little surprising that theµDiracCH2Br2 levels are lower than those of UEA when we ex-pected them to be higher due to the coelution issue. Work ison-going to find the cause of this difference and it is helpfulthat theµDirac calibration gas was measured by the UEAGC-MS instrument during the campaign. It is possible thatthere were changes in theµDirac calibration gas when de-canted into the portable Sulfinert cylinder large enough toexplain this∼0.5 ppt difference. Across the global sciencecommunity there are differences in the calibration scales ofmany shorter-lived halocarbons. An inter-laboratory calibra-tion comparison experiment is taking place in the UK (led byYork University) with the aim of reconciling some of thesedifferences for UK measurement groups.
The two ground-basedµDirac instruments remained inSabah after the end of the OP3 field campaign, one instru-ment remained at the Bukit Atur GAW station and the otherwas sited at the coast near Tawau (4.22◦N, 118.00◦E). Thisdual instrument deployment is the first step in a larger scaleproject to generate a long time series of halocarbon (and laterhydrocarbon) measurements from several coastal sites in thewest Pacific.
5 Summary
A new lightweight micro-GC is described. It uses Car-boxen™ adsorbents for sampling, a temperature and flowprogrammable column and a micro-volume ECD. A centralfeature is on-board (autonomous), precise control of all as-pects of the instrument. Designed for use on a long durationballoon, it is lightweight (11 kg without batteries), has lowpower consumption and can run autonomously for long pe-riods. Unfortunately, it could not prove itself on the longduration balloon due to a balloon failure. However, the noveldesign needed for the long duration deployment has resultedin a versatile instrument capable of running reliably at theground for months at a time. The calibration procedure al-lows any changes in linearity of response to be monitored aswell as changes in sensitivity, giving increased confidence inthe quality of the measurements. Comparison with the UEA
www.atmos-meas-tech.net/3/507/2010/ Atmos. Meas. Tech., 3, 507–521, 2010
520 B. Gostlow et al.: An autonomous instrument for halocarbon measurements
GC-MS instrument at Bukit Atur shows excellent agreementfor CHBr3 and reasonable agreement for CH2Br2 given thecurrent state-of-the-art. The reliability of the instrument forcontinuous operation has been demonstrated in MalaysianBorneo since September 2008, with near-continuous oper-ation from November 2008 until present.
Acknowledgements.We thank Peter Simmonds for valuableadvice and guidance, particularly in selecting suitable Carboxen™adsorbents. We are grateful to CNES (Philippe = Cocquerez,Jean-Marc Nicot and colleagues) for development and testingassistance during the MIRµDirac development phase and foroperational activities. We thank Selvan Pillay and staff at Sey-chelles National Meteorological Services for hosting the MIRcampaign. We thank Jean-Pierre Pommereau and Anne Garnierfor organizational support on the Seychelles campaign. Fortesting and development phases prior to the Cape Verde andBorneo deployments we thank Cambridge Botanical Gardensfor allowing us to test the instrument in high humidity (tropical)conditions (John Parker, Rob Brett). We thank Bruno Faria andcolleagues at the Instituto de Nacional de Meteorologie e Geofisica(INMG) for their assistance at Cape Verde. We thank Carl Joseph,David Davies and colleagues at NERC-ARSF and Ally Lewis(University of York) for his assistance in the campaign. We thankthe University of Lancaster, Royal Society (SEARRP), DanumValley Field Centre and Malaysian Meteorological Departmentfor their assistance with the measurements in Borneo. Finally,we are grateful for the financial support for (i) the instrumentdevelopment and the MIR deployment provided by NERC (projectsNE/C511248/1 and NE/D008085/1) and by the EC (SCOUT-O3– 505390-GOCE-CF2004); and (ii) the aircraft and ground-baseddeployments by NERC (SOLAS-RHaMBLe, AMMA-UK andOP3 NE/D002117/1 campaigns and NE/F020341/1 project).L. O’Brien thanks NERC for her studentship and J. A. Pyle thanksNERC-NCAS for their support. N. R. P. Harris acknowledges thesupport of a NERC Advanced Research Fellowship.
Edited by: H. Schlager
References
Bassford, M. R., Simmonds, P. G., and Nickless, G.: AnAutomated System for Near-Real-Time Monitoring of TraceAtmospheric Halocarbons, Anal. Chem., 70(5), 958–965,doi:10.1021/ac970861z, 1998.
Blake, N. J., Blake, D. R., Simpson, I. J., Lopez, J. P., Johnston,N. A. C., Swanson, A. L., Katzenstein, A. S., Meinardi, S., Sive,B. C., Colman, J. J., Atlas, E., Flocke, F., Vay, S. A., Avery,M. A., and Rowland, F. S., Large-scale Latitudinal and VerticalDistributions of NMHCs and Selected Halocarbons in the Tro-posphere over the Pacific Ocean during the March–April 1999Pacific Exploratory Mission (PEM-Tropics B), J. Geophys. Res.,106(D23), 32627–32644, 2001.
Butler, J. H., King, D. B., Lobert, J. M., Montzka, S. A., Yvon-Lewis, S. A., Hall, B. D., Warwick, N. J., Mondeel, D. J.,Aydin, M., and Elkins, J. W.: Oceanic distributions and emis-sions of short-lived halocarbons, Global Biogeochem. Cycles.,21, GB1023, doi:10.1029/2006GB002732, 2007.
Class, Th., Kohnle, R., and Ballschmiter K.: Chemistry of organictraces in air VII: Bromo- and bromochloromethanes in air overthe Atlantic Ocean, Chemosphere, 15, 4, 429–436, 1986.
Colman, J. J., Swanson, A. L., Meinardi, S., Sive, B. C., Blake, D.R., and Rowland, F. S.: Description of the Analysis of a WideRange of Volatile Organic Compounds in Whole Air SamplesCollected during PEM-Tropics A and B, Anal. Chem., 73, 3723–3731, 2001.
Danis, F., Harris, N. R. P., Taylor, W. H., McIntyre, J. D., Sim-monds, P. G., and Pyle, J. A.: DESCARTES: A novel lightweightballoon-borne instrument for measurement of Halocarbons, Re-view of Scientific Instruments, 70, 271–280, 2000.
Hall, B. D., Elkins, J. W., Butler, J. H., Montzka, S. A., Thomp-son, T. M., Del Negro, L., Dutton, G. S., Hurst, D. F., King, D.B., Kline, E. S., Lock, L., Mactaggart, D., Mondeel, D., Moore,F. L., Nance, J. D., Ray, E. A., and Romashkin, P. A.: Cli-mate Monitoring and Diagnostics Laboratory Summary ReportNo. 25, 1998–1999, edited by: Schnell, R. C., King, D. B., andRosson, R. M., U.S. Department of Commerce, 154 pp., 2001.
Lovelock, J. E. and Lipsky S. R.: Electron Affinity Spectroscopy– A New Method for the Identification of Functional Groupsin Chemical Compounds Separated by Gas Chromatography, J.Am. Chem. Soc., 82(2), 431–433, 1960.
Lovelock, J. E.: Atmospheric Fluorine Compounds as Indicators ofAir Movements, Nature, 230, 379, 1971.
Lovelock, J. E., Maggs, R. J., and Wade, R. J.: Halogenated Hydro-carbons in and over the Atlantic, Nature, 241, 194–196, 1973.
Miller, B. R., Weiss, R. F., Salameh, P. K., Tanhua, T., Greally,B. R., Muhle, J., and Simmonds, P. G.: Medusa: A Sam-ple Preconcentration and GC/MS Detector System for in SituMeasurements of Atmospheric Trace Halocarbons, Hydrocar-bons, and Sulfur Compounds, Anal. Chem., 80, 1536–1545,doi:10.1021/ac702084k, 2008.
Montzka, S. A., Butler, J. H., Elkins, J. W., Thompson, T. M.,Clarke, A. D., and Lock, L. T.: Present and future trends in theatmospheric burden of ozone-depleting halogens, Nature, 398,690–694, 1999.
Morris, P. J. T. and Ettre, L. S., The Saga of the Electron CaptureDetector, LC/GC-Europe, 20, 473–479, 2007.
O’Brien, L. M., Harris, N. R. P., Robinson, A. D., Gostlow, B.,Warwick, N., Yang, X., and Pyle, J. A.: Bromocarbons in thetropical marine boundary layer at the Cape Verde Observatory -measurements and modelling, Atmos. Chem. Phys. Discuss., 9,4335–4379, 2009,http://www.atmos-chem-phys-discuss.net/9/4335/2009/.
Penkett, S. A., Jones, B. M. R., Rycroft, M. J., and Simmons, D.A.: An interhemispheric comparison of the concentrations ofbromine compounds in the atmosphere, Nature, 318, 550–553,doi:10.1038/318550a0, 1985.
Pommereau, J.-P. and Hauchecorne, A.: A new atmospheric vehi-cle: The Infra-Red Montgolfier, in Scientific Ballooning, pp. 55–58, Pergamon, New York, 1979.
Pommereau, J.-P., Garnier, A., Knudsen, B. M., Letrenne, G., Du-rand, M., Nunes-Pinharanda, M., Denis, L., Vial, F., Hertzog, A.,and Cairo, F., Accuracy of analyzed stratospheric temperatures inthe winter Arctic vortex from infrared Montgolfier long-durationballoon flights 1. Measurements, J. Geophys. Res., 107, 8260,doi:10.1029/2001JD001379, 2002.
Prinn, R. G., Weiss, R. F., Fraser, P. J., Simmonds, P. G., Cunnold,
Atmos. Meas. Tech., 3, 507–521, 2010 www.atmos-meas-tech.net/3/507/2010/
B. Gostlow et al.: An autonomous instrument for halocarbon measurements 521
D. M., Alyea, F. N., O’Doherty, S., Salameh, P., Miller, B. R.,Huang, J., Wang, R. H. J., Hartley, D. E., Harth, C., Steele, L.P., Sturrock, G., Midgley, P. M., and McCulloch, A. J., A his-tory of chemically and radiatively important gases in air deducedfrom ALE/GAGE/AGAGE, J. Geophys. Res., 105(D14), 17751–17792, 2000.
Proffitt, M. H., Margitan, J. J., Kelly, K. K., Lowenstein, M.,Podolske, J. R., and Chan, K.: Ozone loss in the Arctic polarvortex inferred from high-altitude aircraft measurements, Nature,347, 31–36, 1990.
Proffitt, M. H., Aikin, K., Margitan, J. J., Lowenstein, M., Podolske,J. R., Weaver, A., Chan, K. R., Fast, H., and Elkins, J. W.: Ozoneloss inside the northern polar vortex during the 1991–1992 win-ter, Science, 261, 1150–1154, 1993.
Ray, E. A., Moore, F. L., Elkins, J. W., Dutton, G. S., Fahey, D. W.,Vomel, H., Oltmans, S. J., and Rosenlof, K. H., Transport intothe Northern Hemisphere lowermost stratosphere revealed by insitu tracer measurements, J. Geophys. Res., 104, 26565–26580,1999.
Ray, E. A., Moore, F. L., Elkins, J. W., Hurst, D. F., Romashkin,P. A., Dutton, G. S., and Fahey, D. W.: Descent and mix-ing in the 1999–2000 northern polar vortex inferred from insitu tracer measurements, J. Geophys. Res., 107(D20), 8285,doi:10.1029/2001JD000961, 2002.
Robinson, A. D., McIntyre, J., Harris, N. R. P., Pyle, J. A., Sim-monds, P. G., and Danis, F.: A lightweight balloon-borne gaschromatograph for in-situ measurements of atmospheric halocar-bons, Rev. Sci. Instru., 71, 4553–4560, 2000.
Robinson, A. D., Millard, G. A., Danis, F., Guirlet, M., Harris, N.R. P., Lee, A. M., McIntyre, J. D., Pyle, J. A., Arvelius, J., Dag-nesjo, S., Kirkwood, S., Nilsson, H., Toohey, D. W., Deshler, T.,Goutail, F., Pommereau, J.-P., Elkins, J. W., Moore, F., Ray, E.,Schmidt, U., Engel, A., and Muller, M.: Ozone loss derived fromballoon-borne tracer measurements in the 1999/2000 Arctic win-ter, Atmos. Chem. Phys., 5, 1423–1436, 2005,http://www.atmos-chem-phys.net/5/1423/2005/.
Ross, D. E. M., Pyle, J. A., Harris, N. R. P., McIntyre, J. D.,Millard, G. A., Robinson, A. D., and Busen, R.: Investigationof Arctic ozone depletion sampled over midlatitudes during theEgrett campaign of spring/summer 2000, Atmos. Chem. Phys.,4, 1407–1417, 2004,http://www.atmos-chem-phys.net/4/1407/2004/.
Schmidt, U., Bauer, R., Engel, A., Borchers, R., and Lee, J., Thevariation of available chlorine Cly in the arctic polar vortex dur-ing EASOE, Geophys. Res. Lett., 21, 1215–1218, 1994.
Tienpont, B., David, F., Witdouck, W., and Sandra, P., Developmentof a miniature gas chromatograph (µCAD) with sample Enrich-ment, Programmed Temperature GC and Plasma Emission De-tection, LC/GC Europe, 22, 112–124, 2009.
Urban, J., Lautie, N., Le Flochmoen, E., Jimenez, C., Eriksson, P.,de La Noe, J., Dupuy, E., El Amraoui, L., Frisk, U., Jegou, F.,Murtagh, D., Olberg, M., Ricaud, P., Camy-Peyret, C., Dufour,G., Payan, S., Huret, N., Pirre, M., Robinson, A. D., Harris, N. R.P., Bremer, H., Kleinbohl, A., Kullmann, K., Kunzi, K., Kuttip-purath, J., Ejiri, M., Nakajima, H., Sasano, Y., Sugita, T., Yokota,T., Piccolo, C., Raspollini, P., and. Ridolfi, M.: Odin/SMR LimbObservations of Stratospheric Trace Gases: Validation of N2O, J.Geophys. Res., 110, D09301, doi:10.1029/2004JD005394, 2005.
Volk, C. M. Elkins, J. W., Fahey, D. W., Salawitch, R. J.,Dutton, G. S., Gilligan, J. M., Proffitt, M. H., Loewenstein,M., Podolske, J. R., Minschwaner, K., Margitan, J. J., andChan, K. R., Quantifying Transport Between the Tropical andMid-Latitude Lower Stratosphere, Science, 272, 1763–1768,doi:10.1126/science.272.5269.1763, 1996.
Worton, D.R., Mills, G. P., Oram, D. E., and Sturges, W. T.: Gaschromatography negative ion chemical ionisation mass spec-trometry: Application to the detection of alkyl nitrates and halo-carbons in the atmosphere, J. Chromatogr. A, 1201, 112–119,doi:10.1016/j.chroma.2008.06.019, 2008.
www.atmos-meas-tech.net/3/507/2010/ Atmos. Meas. Tech., 3, 507–521, 2010