Embed Size (px)
Citation preview
Translation of the French Interim Financial Report
Six-month period ended December 31, 2013
Contents
Business activity and interim financial statements of the Christian Dior group as of December 31, 2013…………………………………………….. 1
Condensed consolidated financial statements for the six-month period ended December 31, 2013………………………………………………….. 9
Statutory Auditors’ report on the half-year financial information from July 1 to December 31, 2013………………………………………………. 41
Statement of the Company Officer responsible for the Interim Financial Report……………………………………………………………………….. 42
This document is a free translation into English of the original French “Rapport financier semestriel”, hereafter referred to as the “Interim Financial Report”. It is not a binding document. In the event of a conflict in interpretation, reference should be made to the French version, which is the authentic text.
Interim Financial Report as of December 31, 2013 1
This interim financial report presents business activity for the first half of the fiscal year in progress, for which the fiscal year-end date is June 30, 2014.
The business activity as well as the results for the six-month period have been compared to those for the two-month fiscal year ended June 30, 2013 and the 12-month fiscal year ended April 30, 2013. Due to the short duration of the fiscal year ended June 30, 2013 and the seasonality of the Group’s activities, these comparisons are not necessarily representative of changes over a longer period.
Business activity and interim financial statements of the Christian Dior group as of December 31, 2013
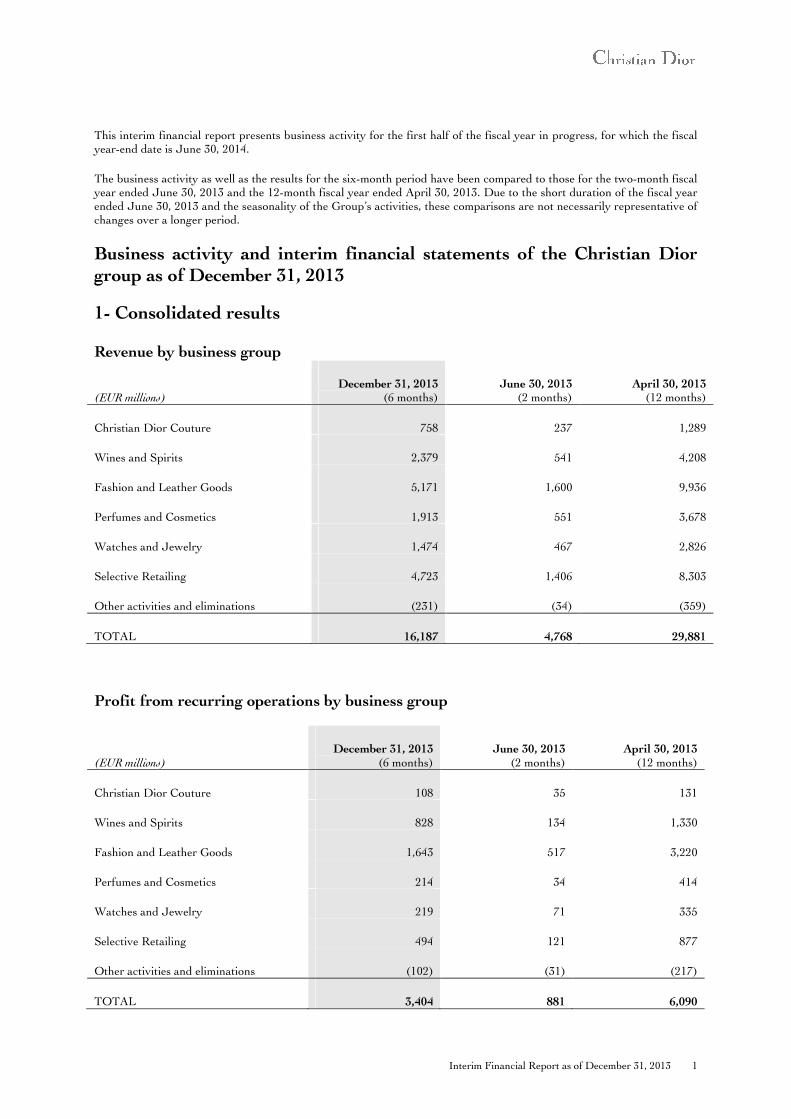
1- Consolidated results Revenue by business group
(EUR millions) December 31, 2013
(6 months) June 30, 2013
(2 months) April 30, 2013
(12 months)
Christian Dior Couture 758 237 1,289
Wines and Spirits 2,379 541 4,208
Fashion and Leather Goods 5,171 1,600 9,936
Perfumes and Cosmetics 1,913 551 3,678
Watches and Jewelry 1,474 467 2,826
Selective Retailing 4,723 1,406 8,303
Other activities and eliminations (231) (34) (359)
TOTAL 16,187 4,768 29,881
Profit from recurring operations by business group
(EUR millions) December 31, 2013
(6 months) June 30, 2013
(2 months) April 30, 2013
(12 months)
Christian Dior Couture 108 35 131
Wines and Spirits 828 134 1,330
Fashion and Leather Goods 1,643 517 3,220
Perfumes and Cosmetics 214 34 414
Watches and Jewelry 219 71 335
Selective Retailing 494 121 877
Other activities and eliminations (102) (31) (217)
TOTAL 3,404 881 6,090
2 Interim Financial Report as of December 31, 2013
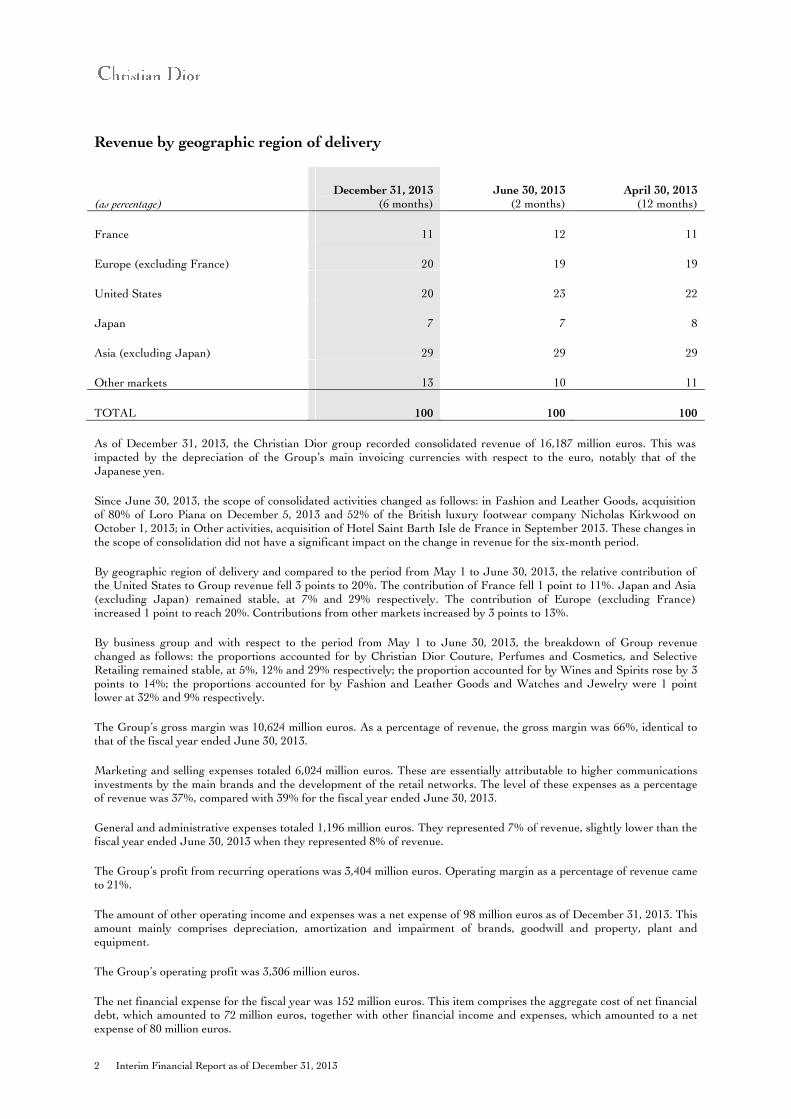
Revenue by geographic region of delivery
(as percentage) December 31, 2013
(6 months) June 30, 2013
(2 months) April 30, 2013
(12 months)
France 11 12 11
Europe (excluding France) 20 19 19
United States 20 23 22
Japan 7 7 8
Asia (excluding Japan) 29 29 29
Other markets 13 10 11
TOTAL 100 100 100
As of December 31, 2013, the Christian Dior group recorded consolidated revenue of 16,187 million euros. This was impacted by the depreciation of the Group’s main invoicing currencies with respect to the euro, notably that of the Japanese yen.
Since June 30, 2013, the scope of consolidated activities changed as follows: in Fashion and Leather Goods, acquisition of 80% of Loro Piana on December 5, 2013 and 52% of the British luxury footwear company Nicholas Kirkwood on October 1, 2013; in Other activities, acquisition of Hotel Saint Barth Isle de France in September 2013. These changes in the scope of consolidation did not have a significant impact on the change in revenue for the six-month period.
By geographic region of delivery and compared to the period from May 1 to June 30, 2013, the relative contribution of the United States to Group revenue fell 3 points to 20%. The contribution of France fell 1 point to 11%. Japan and Asia (excluding Japan) remained stable, at 7% and 29% respectively. The contribution of Europe (excluding France) increased 1 point to reach 20%. Contributions from other markets increased by 3 points to 13%.
By business group and with respect to the period from May 1 to June 30, 2013, the breakdown of Group revenue changed as follows: the proportions accounted for by Christian Dior Couture, Perfumes and Cosmetics, and Selective Retailing remained stable, at 5%, 12% and 29% respectively; the proportion accounted for by Wines and Spirits rose by 3 points to 14%; the proportions accounted for by Fashion and Leather Goods and Watches and Jewelry were 1 point lower at 32% and 9% respectively.
The Group’s gross margin was 10,624 million euros. As a percentage of revenue, the gross margin was 66%, identical to that of the fiscal year ended June 30, 2013.
Marketing and selling expenses totaled 6,024 million euros. These are essentially attributable to higher communications investments by the main brands and the development of the retail networks. The level of these expenses as a percentage of revenue was 37%, compared with 39% for the fiscal year ended June 30, 2013.
General and administrative expenses totaled 1,196 million euros. They represented 7% of revenue, slightly lower than the fiscal year ended June 30, 2013 when they represented 8% of revenue.
The Group’s profit from recurring operations was 3,404 million euros. Operating margin as a percentage of revenue came to 21%.
The amount of other operating income and expenses was a net expense of 98 million euros as of December 31, 2013. This amount mainly comprises depreciation, amortization and impairment of brands, goodwill and property, plant and equipment.
The Group’s operating profit was 3,306 million euros.
The net financial expense for the fiscal year was 152 million euros. This item comprises the aggregate cost of net financial debt, which amounted to 72 million euros, together with other financial income and expenses, which amounted to a net expense of 80 million euros.
Interim Financial Report as of December 31, 2013 3
The Group’s effective tax rate for the period was 31.5%, compared to 31.9% as of June 30, 2013.
After taking into consideration income from investments in associates, representing 2 million euros as of December 31, 2013, net profit for the six-month period was 2,161 million euros.
Minority interests’ share of net profit was 1,367 million euros. This relates mainly to minority interests in the results of LVMH SA, Moët Hennessy and DFS.
As of December 31, 2013, the Group share of net profit was 794 million euros.
4 Interim Financial Report as of December 31, 2013
2- Information by business group
To facilitate understanding of the figures, their change with respect to the pro forma figures from July 1 to December 31, 2012 is also presented (2012 pro forma figures were not subject to limited review procedures).
Compared to the same period in 2012, revenue growth by business group was as follows:
Revenue from Christian Dior Couture was 758 million euros, up 14% at actual exchange rates and 20% at constant exchange rates. The excellent performance of Maison Dior was spurred by the dynamism of Leather Goods, Men’s and Women’s Ready-to-Wear and Accessoires. Profit from recurring operations of Christian Dior Couture amounted to 108 million euros, up 32%.
Revenue for Wines and Spirits was stable at actual exchange rates and increased by 6% on a constant consolidation scope and currency basis. This performance was made possible by higher sales volumes and a sustained policy of price increases in line with the ongoing value-creation strategy. China is still the second largest market for the Wines and Spirits business group. Profit from recurring operations for Wines and Spirits was 828 million euros, up 8% compared to the same period in 2012. This performance was the result of both sales volume growth and a sustained policy of price increases. The operating margin as a percentage of revenue for this business group was 35%.
Fashion and Leather Goods revenue was up 5% on a constant consolidation scope and currency basis and down 2% based on published figures. This business group’s performance continued to benefit from gains made by Louis Vuitton. Céline, Givenchy and Berluti confirmed their potential, delivering double-digit growth over the period. Fashion and Leather Goods posted profit from recurring operations of 1,643 million euros, down 6% compared to the same period in 2012. Louis Vuitton maintained its very high level of profitability, while Céline and Marc Jacobs confirmed their profitable growth momentum. The business group’s operating margin as a percentage of revenue was 32%.
Revenue for Perfumes and Cosmetics increased by 7% on a constant consolidation scope and currency basis, and by 1% based on published figures. This growth confirmed the effectiveness of the value-enhancing strategy resolutely pursued by the Group’s brands in the face of competitive pressures spawned on the markets by the economic crisis. The Perfumes and Cosmetics business group saw appreciable revenue growth in the United States and Asia. Profit from recurring operations for the business group was 214 million euros, up 1% compared to the same period in 2012. This growth was driven notably by Benefit, Fresh and Make Up For Ever, all of which posted improved results thanks to the success of their flagship product lines and strong innovative momentum. The business group’s operating margin as a percentage of revenue was 11%.
Revenue for Watches and Jewelry increased by 6% on a constant consolidation scope and currency basis, and fell 1% based on published figures. Economic uncertainty and an intensely competitive market caused a slowdown in purchases by multibrand watch retailers. For all of the business group’s brands, Japan was the most dynamic region. Profit from recurring operations for the business group was 219 million euros, up 25% compared to the same period in 2012. The business group’s operating margin as a percentage of revenue was 15%.
Based on published figures, revenue for Selective Retailing increased by 10%, and by 16% on a constant consolidation scope and currency basis. The main drivers of this performance were Sephora, which saw very appreciable growth in revenue across all world regions, and DFS, which made excellent progress, spurred by the integration as of end-2012 of three major concessions at the Hong Kong airport, and by the continuing development of Chinese tourism boosting business at its stores in Hong Kong and Macao. Profit from recurring operations for Selective Retailing was 494 million euros, up 3% compared to the same period in 2012. The operating margin as a percentage of revenue was 10%.
Comments on the concepts of constant scope and currency
The impact of exchange rate fluctuations is determined by translating the accounts for the period of subsidiaries having a functional currency other than the euro at the prior comparable period’s exchange rates, to the exclusion of any other restatements. The impact of changes in the scope of consolidation is determined by deducting: • for the six-month period’s acquisitions, revenue generated during the six-month period by the acquired entities, as of their initial consolidation; • for the prior comparable period’s acquisitions, revenue for the six-month period generated over the months of the prior comparable period
during which the acquired entities were not yet consolidated. And by adding: • for the six-month period’s disposals, prior comparable period revenue generated over the months of the current six-month period during
which the entities were no longer consolidated; • for the prior comparable period’s disposals, prior comparable period revenue generated by the entities sold.
Interim Financial Report as of December 31, 2013 5
3- Comments on the consolidated balance sheet
(EUR billions)
December 31, 2013
(6 months)
June 30, 2013
(2 months) Change
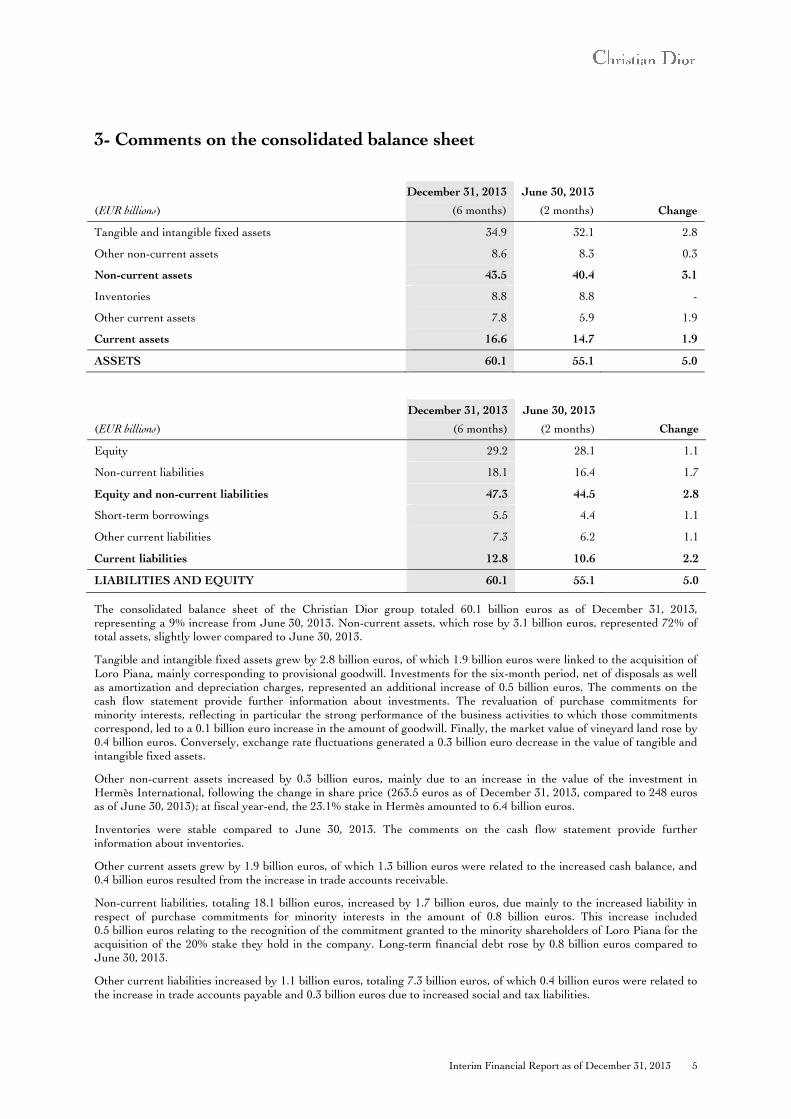
Tangible and intangible fixed assets 34.9 32.1 2.8
Other non-current assets 8.6 8.3 0.3
Non-current assets 43.5 40.4 3.1
Inventories 8.8 8.8 -
Other current assets 7.8 5.9 1.9
Current assets 16.6 14.7 1.9
ASSETS 60.1 55.1 5.0
(EUR billions)
December 31, 2013
(6 months)
June 30, 2013
(2 months) Change
Equity 29.2 28.1 1.1
Non-current liabilities 18.1 16.4 1.7
Equity and non-current liabilities 47.3 44.5 2.8
Short-term borrowings 5.5 4.4 1.1
Other current liabilities 7.3 6.2 1.1
Current liabilities 12.8 10.6 2.2
LIABILITIES AND EQUITY 60.1 55.1 5.0
The consolidated balance sheet of the Christian Dior group totaled 60.1 billion euros as of December 31, 2013, representing a 9% increase from June 30, 2013. Non-current assets, which rose by 3.1 billion euros, represented 72% of total assets, slightly lower compared to June 30, 2013.
Tangible and intangible fixed assets grew by 2.8 billion euros, of which 1.9 billion euros were linked to the acquisition of Loro Piana, mainly corresponding to provisional goodwill. Investments for the six-month period, net of disposals as well as amortization and depreciation charges, represented an additional increase of 0.5 billion euros. The comments on the cash flow statement provide further information about investments. The revaluation of purchase commitments for minority interests, reflecting in particular the strong performance of the business activities to which those commitments correspond, led to a 0.1 billion euro increase in the amount of goodwill. Finally, the market value of vineyard land rose by 0.4 billion euros. Conversely, exchange rate fluctuations generated a 0.3 billion euro decrease in the value of tangible and intangible fixed assets.
Other non-current assets increased by 0.3 billion euros, mainly due to an increase in the value of the investment in Hermès International, following the change in share price (263.5 euros as of December 31, 2013, compared to 248 euros as of June 30, 2013); at fiscal year-end, the 23.1% stake in Hermès amounted to 6.4 billion euros.
Inventories were stable compared to June 30, 2013. The comments on the cash flow statement provide further information about inventories.
Other current assets grew by 1.9 billion euros, of which 1.3 billion euros were related to the increased cash balance, and 0.4 billion euros resulted from the increase in trade accounts receivable.
Non-current liabilities, totaling 18.1 billion euros, increased by 1.7 billion euros, due mainly to the increased liability in respect of purchase commitments for minority interests in the amount of 0.8 billion euros. This increase included 0.5 billion euros relating to the recognition of the commitment granted to the minority shareholders of Loro Piana for the acquisition of the 20% stake they hold in the company. Long-term financial debt rose by 0.8 billion euros compared to June 30, 2013.
Other current liabilities increased by 1.1 billion euros, totaling 7.3 billion euros, of which 0.4 billion euros were related to the increase in trade accounts payable and 0.3 billion euros due to increased social and tax liabilities.
6 Interim Financial Report as of December 31, 2013
Net financial debt and equity
(EUR billions)
December 31, 2013
(6 months)
June 30, 2013
(2 months) Change
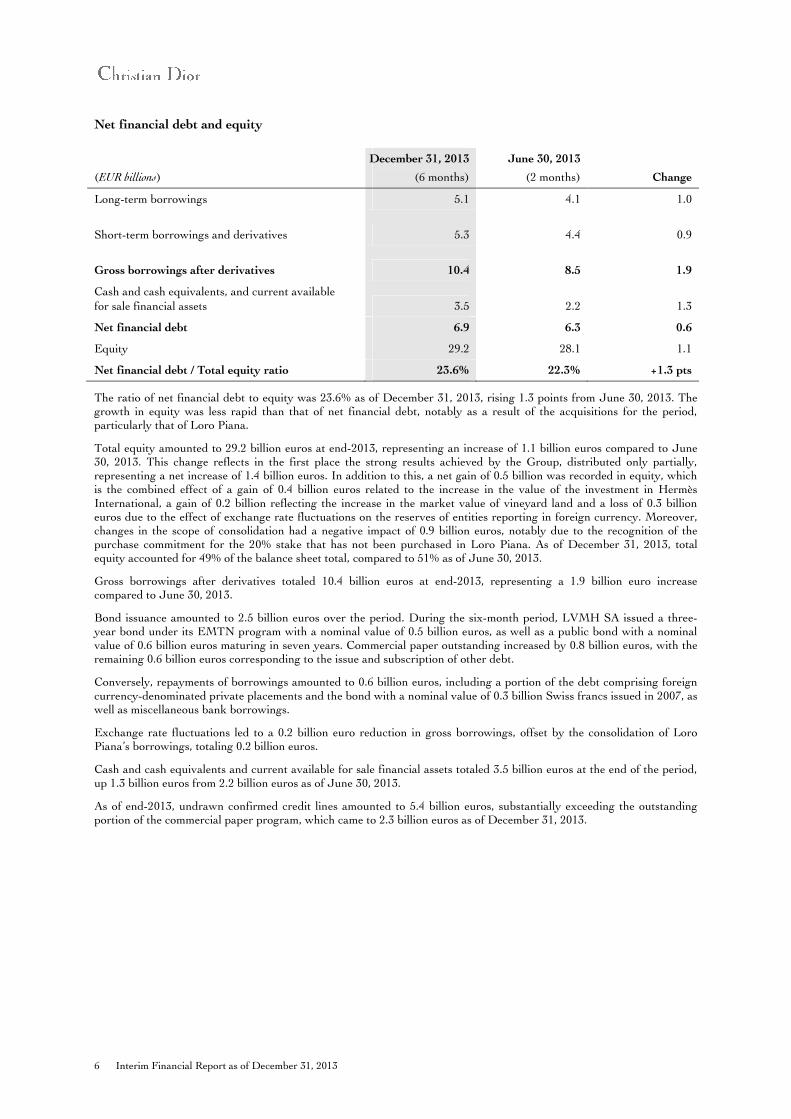
Long-term borrowings 5.1 4.1 1.0
Short-term borrowings and derivatives 5.3 4.4 0.9
Gross borrowings after derivatives 10.4 8.5 1.9
Cash and cash equivalents, and current available
for sale financial assets 3.5 2.2 1.3
Net financial debt 6.9 6.3 0.6
Equity 29.2 28.1 1.1
Net financial debt / Total equity ratio 23.6% 22.3% +1.3 pts
The ratio of net financial debt to equity was 23.6% as of December 31, 2013, rising 1.3 points from June 30, 2013. The growth in equity was less rapid than that of net financial debt, notably as a result of the acquisitions for the period, particularly that of Loro Piana.
Total equity amounted to 29.2 billion euros at end-2013, representing an increase of 1.1 billion euros compared to June 30, 2013. This change reflects in the first place the strong results achieved by the Group, distributed only partially, representing a net increase of 1.4 billion euros. In addition to this, a net gain of 0.5 billion was recorded in equity, which is the combined effect of a gain of 0.4 billion euros related to the increase in the value of the investment in Hermès International, a gain of 0.2 billion reflecting the increase in the market value of vineyard land and a loss of 0.3 billion euros due to the effect of exchange rate fluctuations on the reserves of entities reporting in foreign currency. Moreover, changes in the scope of consolidation had a negative impact of 0.9 billion euros, notably due to the recognition of the purchase commitment for the 20% stake that has not been purchased in Loro Piana. As of December 31, 2013, total equity accounted for 49% of the balance sheet total, compared to 51% as of June 30, 2013.
Gross borrowings after derivatives totaled 10.4 billion euros at end-2013, representing a 1.9 billion euro increase compared to June 30, 2013.
Bond issuance amounted to 2.5 billion euros over the period. During the six-month period, LVMH SA issued a three-year bond under its EMTN program with a nominal value of 0.5 billion euros, as well as a public bond with a nominal value of 0.6 billion euros maturing in seven years. Commercial paper outstanding increased by 0.8 billion euros, with the remaining 0.6 billion euros corresponding to the issue and subscription of other debt.
Conversely, repayments of borrowings amounted to 0.6 billion euros, including a portion of the debt comprising foreign currency-denominated private placements and the bond with a nominal value of 0.3 billion Swiss francs issued in 2007, as well as miscellaneous bank borrowings.
Exchange rate fluctuations led to a 0.2 billion euro reduction in gross borrowings, offset by the consolidation of Loro Piana’s borrowings, totaling 0.2 billion euros.
Cash and cash equivalents and current available for sale financial assets totaled 3.5 billion euros at the end of the period, up 1.3 billion euros from 2.2 billion euros as of June 30, 2013.
As of end-2013, undrawn confirmed credit lines amounted to 5.4 billion euros, substantially exceeding the outstanding portion of the commercial paper program, which came to 2.3 billion euros as of December 31, 2013.
Interim Financial Report as of December 31, 2013 7
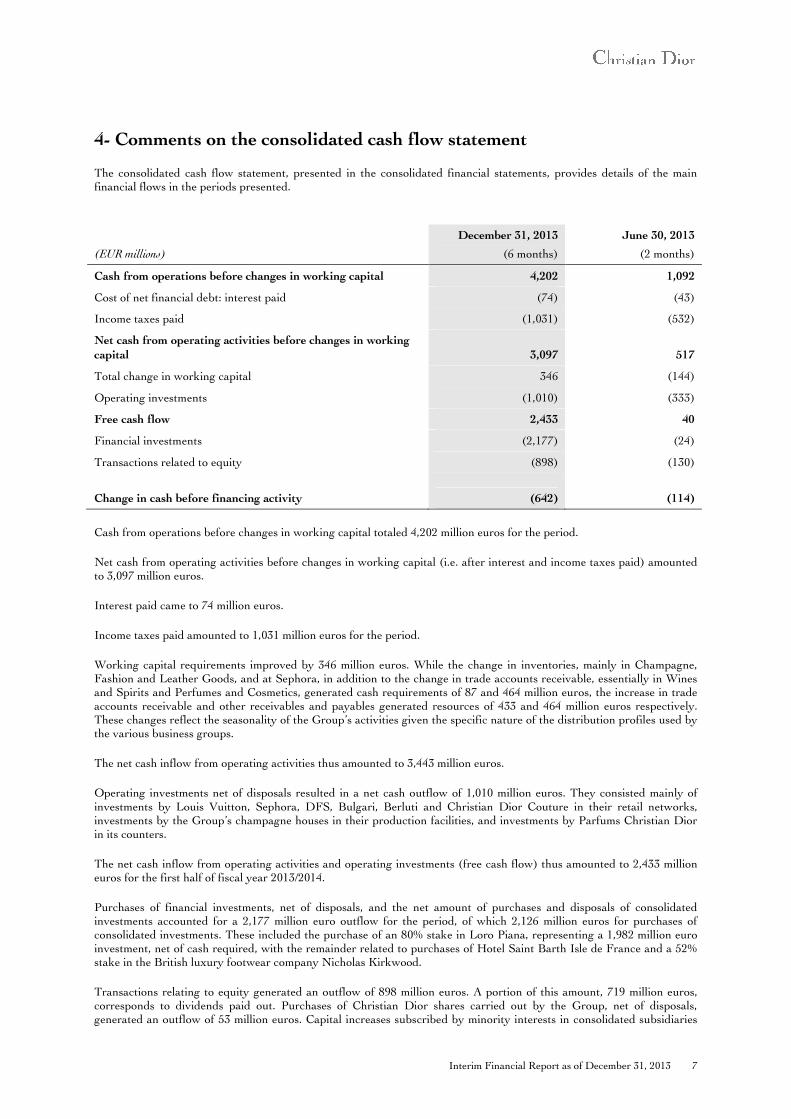
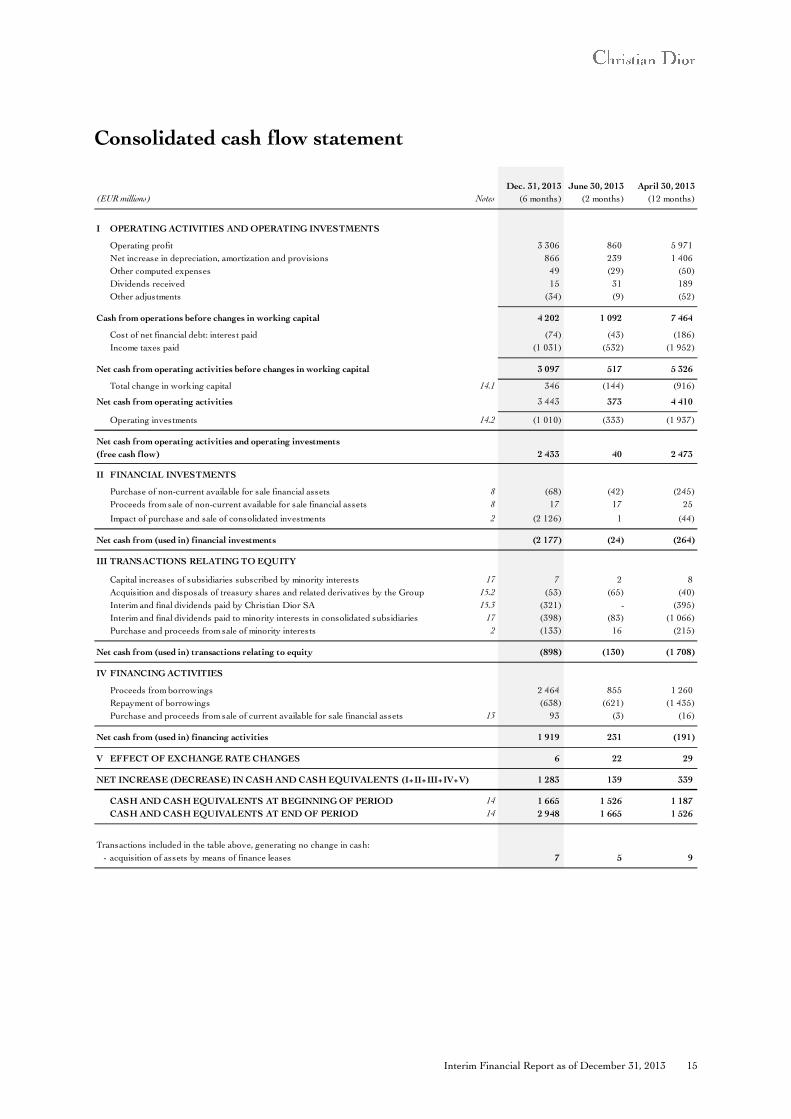
4- Comments on the consolidated cash flow statement
The consolidated cash flow statement, presented in the consolidated financial statements, provides details of the main financial flows in the periods presented.
(EUR millions)
December 31, 2013
(6 months)
June 30, 2013
(2 months)
Cash from operations before changes in working capital 4,202 1,092
Cost of net financial debt: interest paid (74) (43)
Income taxes paid (1,031) (532)
Net cash from operating activities before changes in working
capital 3,097 517
Total change in working capital 346 (144)
Operating investments (1,010) (333)
Free cash flow 2,433 40
Financial investments (2,177) (24)
Transactions related to equity (898) (130)
Change in cash before financing activity (642) (114)
Cash from operations before changes in working capital totaled 4,202 million euros for the period.
Net cash from operating activities before changes in working capital (i.e. after interest and income taxes paid) amounted to 3,097 million euros.
Interest paid came to 74 million euros.
Income taxes paid amounted to 1,031 million euros for the period.
Working capital requirements improved by 346 million euros. While the change in inventories, mainly in Champagne, Fashion and Leather Goods, and at Sephora, in addition to the change in trade accounts receivable, essentially in Wines and Spirits and Perfumes and Cosmetics, generated cash requirements of 87 and 464 million euros, the increase in trade accounts receivable and other receivables and payables generated resources of 433 and 464 million euros respectively. These changes reflect the seasonality of the Group’s activities given the specific nature of the distribution profiles used by the various business groups.
The net cash inflow from operating activities thus amounted to 3,443 million euros.
Operating investments net of disposals resulted in a net cash outflow of 1,010 million euros. They consisted mainly of investments by Louis Vuitton, Sephora, DFS, Bulgari, Berluti and Christian Dior Couture in their retail networks, investments by the Group’s champagne houses in their production facilities, and investments by Parfums Christian Dior in its counters.
The net cash inflow from operating activities and operating investments (free cash flow) thus amounted to 2,433 million euros for the first half of fiscal year 2013/2014.
Purchases of financial investments, net of disposals, and the net amount of purchases and disposals of consolidated investments accounted for a 2,177 million euro outflow for the period, of which 2,126 million euros for purchases of consolidated investments. These included the purchase of an 80% stake in Loro Piana, representing a 1,982 million euro investment, net of cash required, with the remainder related to purchases of Hotel Saint Barth Isle de France and a 52% stake in the British luxury footwear company Nicholas Kirkwood.
Transactions relating to equity generated an outflow of 898 million euros. A portion of this amount, 719 million euros, corresponds to dividends paid out. Purchases of Christian Dior shares carried out by the Group, net of disposals, generated an outflow of 53 million euros. Capital increases subscribed by minority interests in consolidated subsidiaries
8 Interim Financial Report as of December 31, 2013
generated an inflow of 7 million euros, while acquisitions of minority interests led to a net outflow of 133 million euros over the period, corresponding mainly to the acquisition of an additional stake in Marc Jacobs and movements in LVMH treasury shares.
The net cash outflow after all operating, investment, and equity-related activities thus amounted to 642 million euros.
The net cash inflow from financing activities amounted to 1,919 million euros. New issues and subscriptions generated an inflow of 2,464 million euros, while borrowings and financial debt were repaid over the period in the amount of 638 million euros. Disposals of current available for sale financial assets, net of acquisitions, represented a net cash inflow of 93 million euros for the six-month period.
At the close of operations for the six-month period, net cash and cash equivalents totaled 2,948 million euros, up 1,283 million euros compared to June 30, 2013.
Interim Financial Report as of December 31, 2013 9
Condensed consolidated financial statements
for the six-month period ended December 31, 2013
10 Interim Financial Report as of December 31, 2013
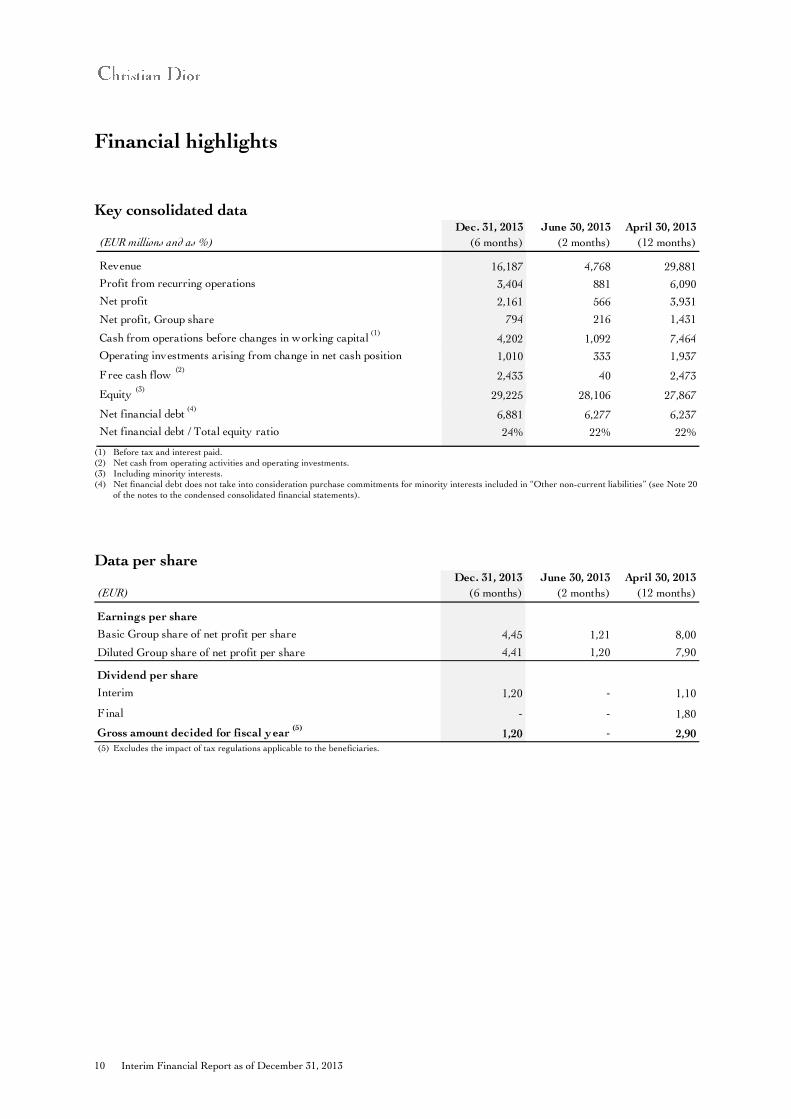
Financial highlights
Key consolidated data
(1) Before tax and interest paid. (2) Net cash from operating activities and operating investments. (3) Including minority interests. (4) Net financial debt does not take into consideration purchase commitments for minority interests included in “Other non-current liabilities” (see Note 20
of the notes to the condensed consolidated financial statements).
Data per share
(5) Excludes the impact of tax regulations applicable to the beneficiaries.
(EUR millions and as %)
Dec. 31, 2013
(6 months)
June 30, 2013
(2 months)
April 30, 2013
(12 months)
Revenue 16,187 4,768 29,881
Profit from recurring operations 3,404 881 6,090
Net profit 2,161 566 3,931
Net profit, Group share 794 216 1,431
Cash from operations before changes in working capital (1)
4,202 1,092 7,464
Operating investments arising from change in net cash position 1,010 333 1,937
Free cash flow (2)
2,433 40 2,473
Equity (3)
29,225 28,106 27,867
Net financial debt (4)
6,881 6,277 6,237
Net financial debt / Total equity ratio 24% 22% 22%
(EUR)
Dec. 31, 2013
(6 months)
June 30, 2013
(2 months)
April 30, 2013
(12 months)
Earnings per share
Basic Group share of net profit per share 4,45 1,21 8,00
Diluted Group share of net profit per share 4,41 1,20 7,90
Dividend per share
Interim 1,20 - 1,10
F inal - - 1,80
Gross amount decided for fiscal year (5)
1,20 - 2,90
Interim Financial Report as of December 31, 2013 11
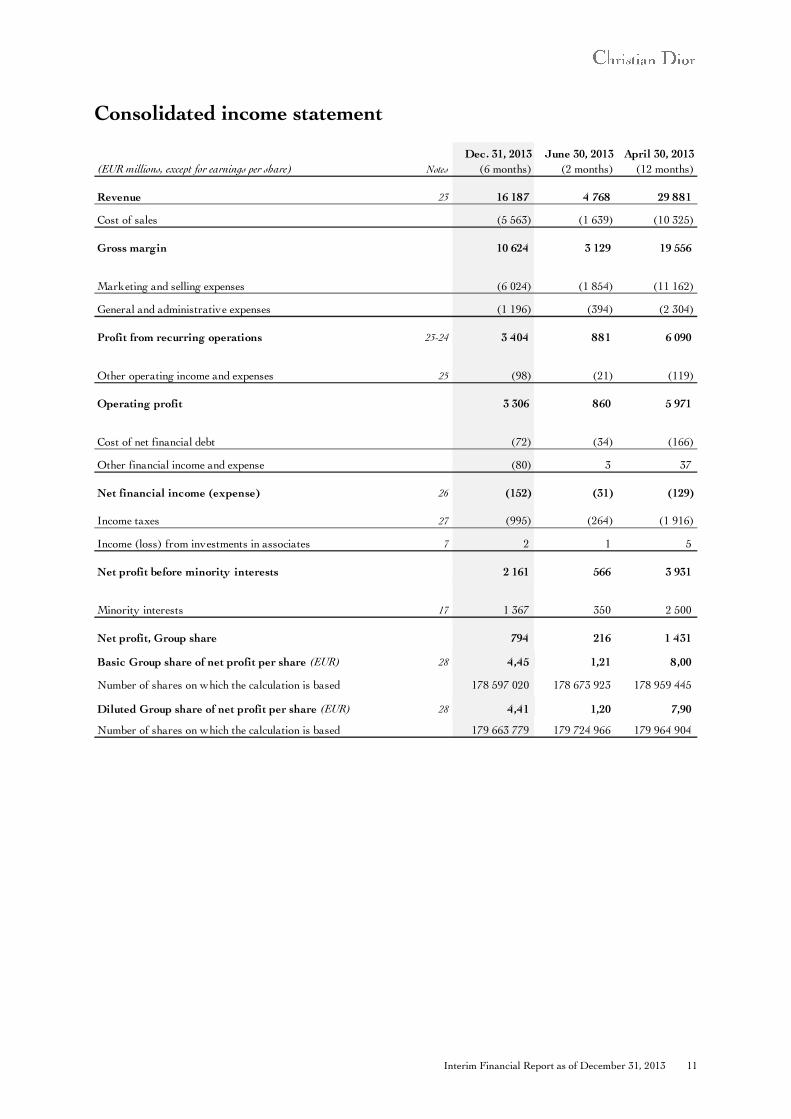
Consolidated income statement
(EUR millions, except for earnings per share) Notes
Dec. 31, 2013
(6 months)
June 30, 2013
(2 months)
April 30, 2013
(12 months)
Revenue 23 16 187 4 768 29 881
Cost of sales (5 563) (1 639) (10 325)
Gross margin 10 624 3 129 19 556
Marketing and selling expenses (6 024) (1 854) (11 162)
General and administrative expenses (1 196) (394) (2 304)
Profit from recurring operations 23-24 3 404 881 6 090
Other operating income and expenses 25 (98) (21) (119)
Operating profit 3 306 860 5 971
Cost of net financial debt (72) (34) (166)
Other financial income and expense (80) 3 37
Net financial income (expense) 26 (152) (31) (129)
Income taxes 27 (995) (264) (1 916)
Income (loss) from investments in associates 7 2 1 5
Net profit before minority interests 2 161 566 3 931
Minority interests 17 1 367 350 2 500
Net profit, Group share 794 216 1 431
Basic Group share of net profit per share (EUR) 28 4,45 1,21 8,00
Number of shares on which the calculation is based 178 597 020 178 673 923 178 959 445
Diluted Group share of net profit per share (EUR) 28 4,41 1,20 7,90
Number of shares on which the calculation is based 179 663 779 179 724 966 179 964 904
12 Interim Financial Report as of December 31, 2013
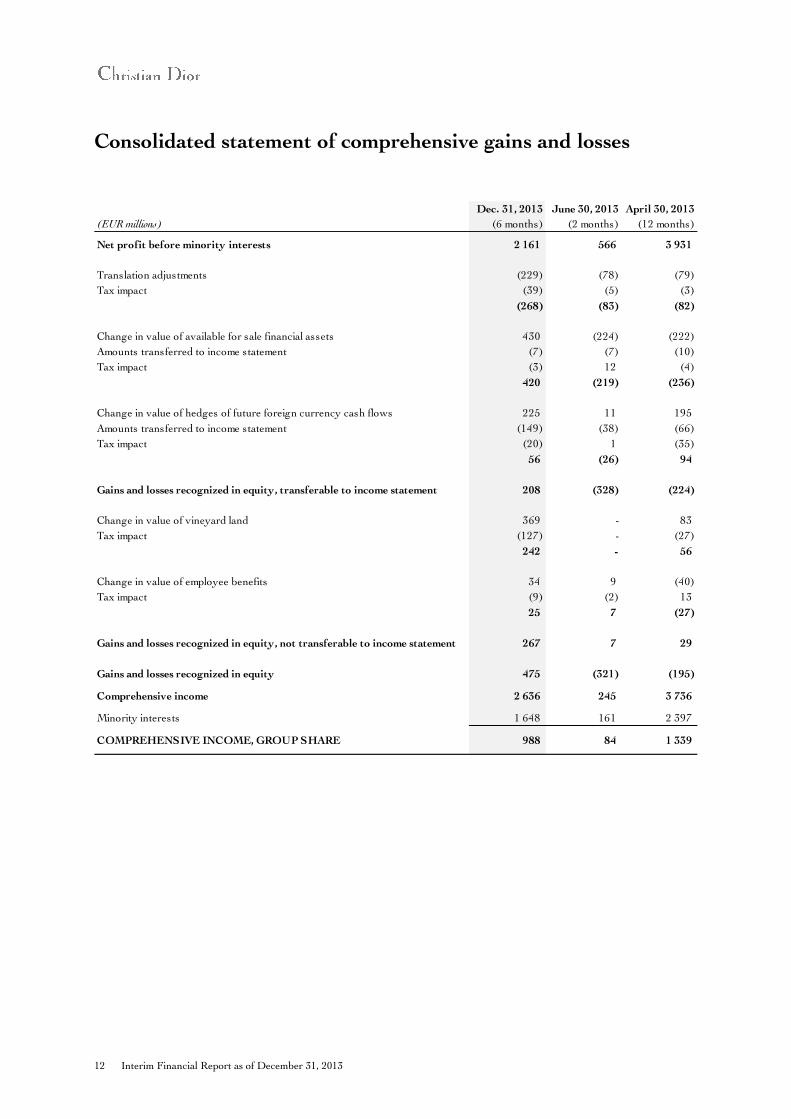
Consolidated statement of comprehensive gains and losses
(EUR millions)
Dec. 31, 2013
(6 months)
June 30, 2013
(2 months)
April 30, 2013
(12 months)
Net profit before minority interests 2 161 566 3 931
Translation adjustments (229) (78) (79)
Tax impact (39) (5) (3)
(268) (83) (82)
Change in value of available for sale financial assets 430 (224) (222)
Amounts transferred to income statement (7) (7) (10)
Tax impact (3) 12 (4)
420 (219) (236)
Change in value of hedges of future foreign currency cash flows 225 11 195
Amounts transferred to income statement (149) (38) (66)
Tax impact (20) 1 (35)
56 (26) 94
Gains and losses recognized in equity, transferable to income statement 208 (328) (224)
Change in value of vineyard land 369 - 83
Tax impact (127) - (27)
242 - 56
Change in value of employee benefits 34 9 (40)
Tax impact (9) (2) 13
25 7 (27)
Gains and losses recognized in equity, not transferable to income statement 267 7 29
Gains and losses recognized in equity 475 (321) (195)
Comprehensive income 2 636 245 3 736
Minority interests 1 648 161 2 397
COMPREHENSIVE INCOME, GROUP SHARE 988 84 1 339
Interim Financial Report as of December 31, 2013 13
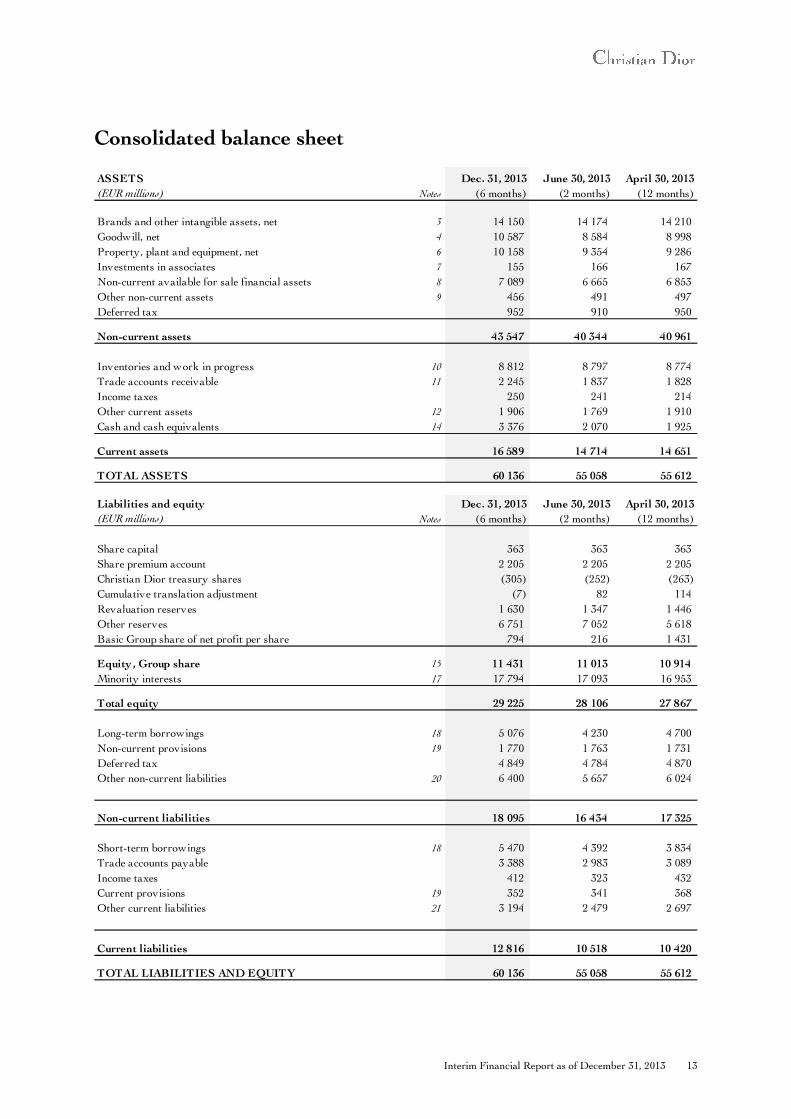
Consolidated balance sheet
ASSETS
(EUR millions) Notes
Dec. 31, 2013
(6 months)
June 30, 2013
(2 months)
April 30, 2013
(12 months)
Brands and other intangible assets, net 3 14 150 14 174 14 210
Goodwill, net 4 10 587 8 584 8 998
Property, plant and equipment, net 6 10 158 9 354 9 286
Investments in associates 7 155 166 167
Non-current available for sale financial assets 8 7 089 6 665 6 853
Other non-current assets 9 456 491 497
Deferred tax 952 910 950
Non-current assets 43 547 40 344 40 961
Inventories and work in progress 10 8 812 8 797 8 774
Trade accounts receivable 11 2 245 1 837 1 828
Income taxes 250 241 214
Other current assets 12 1 906 1 769 1 910
Cash and cash equivalents 14 3 376 2 070 1 925
Current assets 16 589 14 714 14 651
TOTAL ASSETS 60 136 55 058 55 612
Liabilities and equity
(EUR millions) Notes
Dec. 31, 2013
(6 months)
June 30, 2013
(2 months)
April 30, 2013
(12 months)
Share capital 363 363 363
Share premium account 2 205 2 205 2 205
Christian Dior treasury shares (305) (252) (263)
Cumulative translation adjustment (7) 82 114
Revaluation reserves 1 630 1 347 1 446
Other reserves 6 751 7 052 5 618
Basic Group share of net profit per share 794 216 1 431
Equity , Group share 15 11 431 11 013 10 914
Minority interests 17 17 794 17 093 16 953
Total equity 29 225 28 106 27 867
Long-term borrowings 18 5 076 4 230 4 700
Non-current provisions 19 1 770 1 763 1 731
Deferred tax 4 849 4 784 4 870
Other non-current liabilities 20 6 400 5 657 6 024
Non-current liabilities 18 095 16 434 17 325
Short-term borrowings 18 5 470 4 392 3 834
Trade accounts payable 3 388 2 983 3 089
Income taxes 412 323 432
Current provisions 19 352 341 368
Other current liabilities 21 3 194 2 479 2 697
Current liabilities 12 816 10 518 10 420
TOTAL LIABILITIES AND EQUITY 60 136 55 058 55 612
14 Interim Financial Report as of December 31, 2013
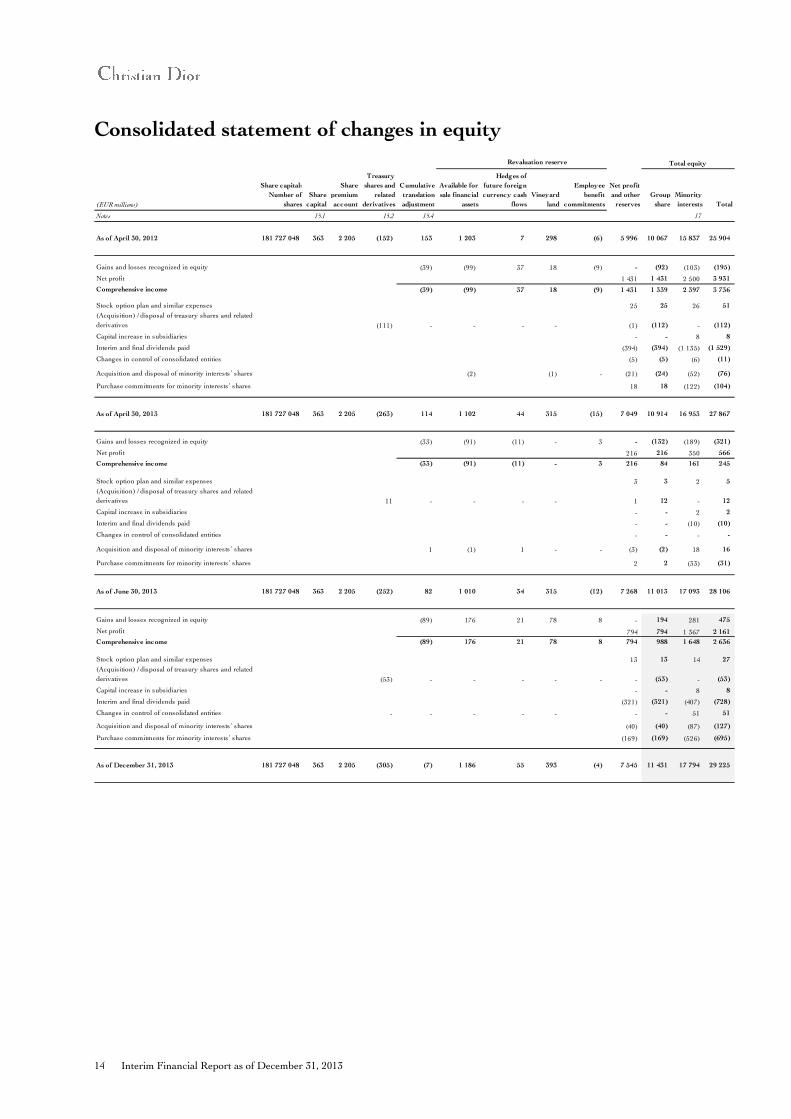
Consolidated statement of changes in equity
Revaluation reserve
(EUR millions)
Share capital:
Number of
shares
Share
capital
Share
premium
account
Treasury
shares and
related
derivatives
Cumulative
translation
adjustment
Available for
sale financial
assets
Hedges of
future foreign
currency cash
flows
Vineyard
land
Employee
benefit
commitments
Net profit
and other
reserves
Group
share
Minority
interests Total
Notes 15.1 15.2 15.4 17
As of April 30, 2012 181 727 048 363 2 205 (152) 153 1 203 7 298 (6) 5 996 10 067 15 837 25 904
Gains and losses recognized in equity (39) (99) 37 18 (9) - (92) (103) (195)
Net profit 1 431 1 431 2 500 3 931
Comprehensive income (39) (99) 37 18 (9) 1 431 1 339 2 397 3 736
Stock option plan and similar expenses 25 25 26 51
(Acquisition) / disposal of treasury shares and related
derivatives (111) - - - - (1) (112) - (112)
Capital increase in subsidiaries - - 8 8
Interim and final dividends paid (394) (394) (1 135) (1 529)
Changes in control of consolidated entities (5) (5) (6) (11)
Acquisition and disposal of minority interests’ shares (2) (1) - (21) (24) (52) (76)
Purchase commitments for minority interests’ shares 18 18 (122) (104)
As of April 30, 2013 181 727 048 363 2 205 (263) 114 1 102 44 315 (15) 7 049 10 914 16 953 27 867
Gains and losses recognized in equity (33) (91) (11) - 3 - (132) (189) (321)
Net profit 216 216 350 566
Comprehensive income (33) (91) (11) - 3 216 84 161 245
Stock option plan and similar expenses 3 3 2 5
(Acquisition) / disposal of treasury shares and related
derivatives 11 - - - - 1 12 - 12
Capital increase in subsidiaries - - 2 2
Interim and final dividends paid - - (10) (10)
Changes in control of consolidated entities - - - -
Acquisition and disposal of minority interests’ shares 1 (1) 1 - - (3) (2) 18 16
Purchase commitments for minority interests’ shares 2 2 (33) (31)
As of June 30, 2013 181 727 048 363 2 205 (252) 82 1 010 34 315 (12) 7 268 11 013 17 093 28 106
Gains and losses recognized in equity (89) 176 21 78 8 - 194 281 475
Net profit 794 794 1 367 2 161
Comprehensive income (89) 176 21 78 8 794 988 1 648 2 636
Stock option plan and similar expenses 13 13 14 27
(Acquisition) / disposal of treasury shares and related
derivatives (53) - - - - - - (53) - (53)
Capital increase in subsidiaries - - 8 8
Interim and final dividends paid (321) (321) (407) (728)
Changes in control of consolidated entities - - - - - - - 51 51
Acquisition and disposal of minority interests’ shares (40) (40) (87) (127)
Purchase commitments for minority interests’ shares (169) (169) (526) (695)
As of December 31, 2013 181 727 048 363 2 205 (305) (7) 1 186 55 393 (4) 7 545 11 431 17 794 29 225
Total equity
Interim Financial Report as of December 31, 2013 15
Consolidated cash flow statement
(EUR millions) Notes
Dec. 31, 2013
(6 months)
June 30, 2013
(2 months)
April 30, 2013
(12 months)
I OPERATING ACTIVITIES AND OPERATING INVESTMENTS
Operating profit 3 306 860 5 971
Net increase in depreciation, amortization and provisions 866 239 1 406
Other computed expenses 49 (29) (50)
Dividends received 15 31 189
Other adjustments (34) (9) (52)
Cash from operations before changes in working capital 4 202 1 092 7 464
Cost of net financial debt: interest paid (74) (43) (186)
Income taxes paid (1 031) (532) (1 952)
Net cash from operating activities before changes in working capital 3 097 517 5 326
Total change in working capital 14.1 346 (144) (916)
Net cash from operating activities 3 443 373 4 410
Operating investments 14.2 (1 010) (333) (1 937)
2 433 40 2 473
II FINANCIAL INVESTMENTS
Purchase of non-current available for sale financial assets 8 (68) (42) (245)
Proceeds from sale of non-current available for sale financial assets 8 17 17 25
Impact of purchase and sale of consolidated investments 2 (2 126) 1 (44)
Net cash from (used in) financial investments (2 177) (24) (264)
III TRANSACTIONS RELATING TO EQUITY
Capital increases of subsidiaries subscribed by minority interests 17 7 2 8
Acquisition and disposals of treasury shares and related derivatives by the Group 15.2 (53) (65) (40)
Interim and final dividends paid by Christian Dior SA 15.3 (321) - (395)
Interim and final dividends paid to minority interests in consolidated subsidiaries 17 (398) (83) (1 066)
Purchase and proceeds from sale of minority interests 2 (133) 16 (215)
Net cash from (used in) transactions relating to equity (898) (130) (1 708)
IV FINANCING ACTIVITIES
Proceeds from borrowings 2 464 855 1 260
Repayment of borrowings (638) (621) (1 435)
Purchase and proceeds from sale of current available for sale financial assets 13 93 (3) (16)
Net cash from (used in) financing activities 1 919 231 (191)
V EFFECT OF EXCHANGE RATE CHANGES 6 22 29
NET INCREASE (DECREASE) IN CASH AND CASH EQUIVALENTS (I+II+III+IV+V) 1 283 139 339
CASH AND CASH EQUIVALENTS AT BEGINNING OF PERIOD 14 1 665 1 526 1 187
CASH AND CASH EQUIVALENTS AT END OF PERIOD 14 2 948 1 665 1 526
- acquisition of assets by means of finance leases 7 5 9
Transactions included in the table above, generating no change in cash:
Net cash from operating activities and operating investments
(free cash flow)
16 Interim Financial Report as of December 31, 2013
Notes to the condensed consolidated financial statements
1. Accounting policies ........................................................................................................................... 17
2. Changes in the percentage interest in consolidated entities ............................................................ 18
3. Brands, trade names and other intangible assets ............................................................................. 19
4. Goodwill ............................................................................................................................................ 20
5. Impairment testing of intangible assets with indefinite useful lives ................................................ 20
6. Property, plant and equipment ......................................................................................................... 20
7. Investments in associates .................................................................................................................. 21
8. Non-current available for sale financial assets ................................................................................. 22
9. Other non-current assets .................................................................................................................. 22
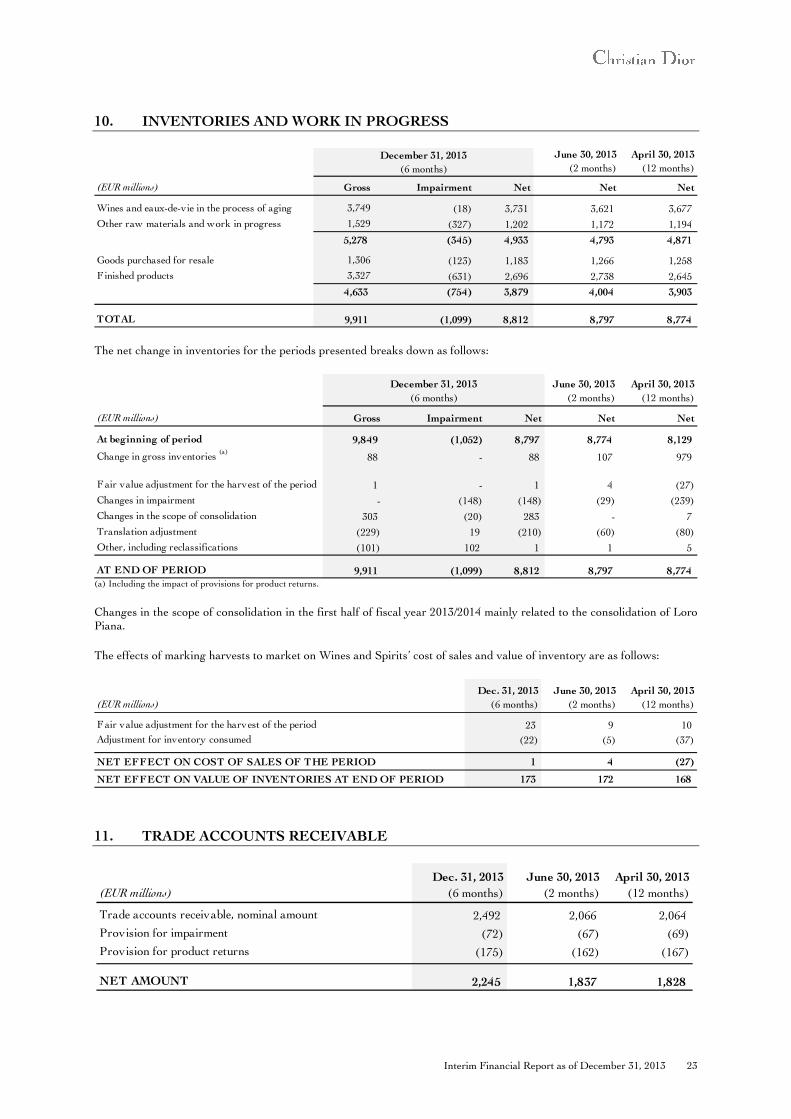
10. Inventories and work in progress ..................................................................................................... 23
11. Trade accounts receivable................................................................................................................. 23
12. Other current assets .......................................................................................................................... 24
13. Current available for sale financial assets ........................................................................................ 25
14. Cash flow statement .......................................................................................................................... 25
15. Equity ................................................................................................................................................ 26
16. Stock option and similar plans.......................................................................................................... 28
17. Minority interests .............................................................................................................................. 29
18. Borrowings ........................................................................................................................................ 30
19. Provisions .......................................................................................................................................... 31
20. Other non-current liabilities ............................................................................................................. 31
21. Other current liabilities..................................................................................................................... 32
22. Financial instruments and market risk management ....................................................................... 32
23. Segment information ......................................................................................................................... 35
24. Expenses by nature ........................................................................................................................... 38
25. Other operating income and expenses ............................................................................................. 38
26. Net financial income (expense) ........................................................................................................ 38
27. Income taxes ...................................................................................................................................... 39
28. Earnings per share ............................................................................................................................ 39
29. Off-balance sheet commitments ....................................................................................................... 40
30. Contingent liabilities and outstanding litigation .............................................................................. 40
31. Subsequent events ............................................................................................................................. 40
Interim Financial Report as of December 31, 2013 17
1. ACCOUNTING POLICIES
1.1. General framework and environment
The condensed consolidated financial statements for the first half-year of fiscal year 2013/2014 covering the period from July 1, 2013 to December 31, 2013 were approved for publication by the Board of Directors on February 13, 2014.
The comparability of this half-year period ended December 31, 2013 with the two fiscal years presented (June 30, 2013 and April 30, 2013) is impacted by the fact that these fiscal years correspond to distinct periods with respective durations of 2 months and 12 months. Business activity is seasonal, with the Group generating a higher volume of business in the second half of the calendar year than that of the first six months.
These financial statements were established in accordance with IAS 34 relating to the preparation of interim financial statements in addition to international accounting standards and interpretations (IAS/IFRS) adopted by the European Union and applicable on December 31, 2013; these standards and interpretations have been applied consistently to the periods presented. The interim financial statements were prepared based on the same policies and methods used for the preparation of the annual financial statements.
1.2. Changes in the accounting framework applicable to the Group
Standards, amendments and interpretations for which application will be mandatory for fiscal years commencing as from January 1, 2014
The main standards, amendments and interpretations applicable to the Group as from July 1, 2014 are IFRS 10, IFRS 11 and IFRS 12 as they relate to consolidation. These standards redefine the concept of the control of entities, eliminating the possibility to use proportional consolidation to consolidate jointly controlled entities which will be accounted for uniquely using the equity method, and introducing additional disclosure requirements in the notes to the consolidated financial statements.
The application of these standards will not have any material impact on the Group’s consolidated financial statements, as proportionately consolidated entities represent only a small portion of the Group’s financial statements. As these entities are fully integrated within the Group’s operating activities, the Christian Dior group will disclose their net profit, as well as that of entities currently accounted for using the equity method (see Note 7), on a specific line within profit from recurring operations.
The consolidation method of distribution subsidiaries jointly owned with the Diageo group will not be impacted.
Other changes in standards and interpretations
The Group receives information on the progress of ongoing discussions held at IFRIC and IASB related to the recognition of purchase commitments for minority interests’ shares and changes in their amount.
The Group also monitors developments with regard to the exposure draft on accounting for lease commitments.
18 Interim Financial Report as of December 31, 2013
2. CHANGES IN THE PERCENTAGE INTEREST IN CONSOLIDATED ENTITIES
2.1. Fashion and Leather Goods
Loro Piana
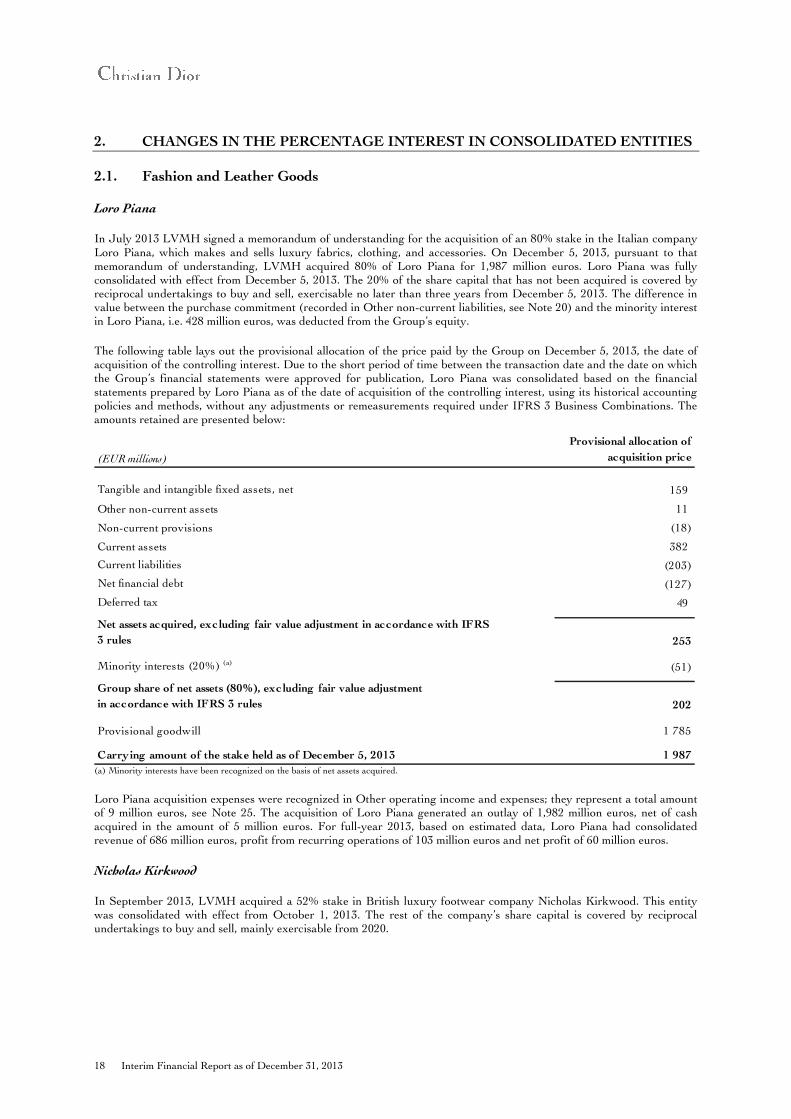
In July 2013 LVMH signed a memorandum of understanding for the acquisition of an 80% stake in the Italian company Loro Piana, which makes and sells luxury fabrics, clothing, and accessories. On December 5, 2013, pursuant to that memorandum of understanding, LVMH acquired 80% of Loro Piana for 1,987 million euros. Loro Piana was fully consolidated with effect from December 5, 2013. The 20% of the share capital that has not been acquired is covered by reciprocal undertakings to buy and sell, exercisable no later than three years from December 5, 2013. The difference in value between the purchase commitment (recorded in Other non-current liabilities, see Note 20) and the minority interest in Loro Piana, i.e. 428 million euros, was deducted from the Group’s equity.
The following table lays out the provisional allocation of the price paid by the Group on December 5, 2013, the date of acquisition of the controlling interest. Due to the short period of time between the transaction date and the date on which the Group’s financial statements were approved for publication, Loro Piana was consolidated based on the financial statements prepared by Loro Piana as of the date of acquisition of the controlling interest, using its historical accounting policies and methods, without any adjustments or remeasurements required under IFRS 3 Business Combinations. The amounts retained are presented below:
(a) Minority interests have been recognized on the basis of net assets acquired.
Loro Piana acquisition expenses were recognized in Other operating income and expenses; they represent a total amount of 9 million euros, see Note 25. The acquisition of Loro Piana generated an outlay of 1,982 million euros, net of cash acquired in the amount of 5 million euros. For full-year 2013, based on estimated data, Loro Piana had consolidated revenue of 686 million euros, profit from recurring operations of 103 million euros and net profit of 60 million euros.
Nicholas Kirkwood
In September 2013, LVMH acquired a 52% stake in British luxury footwear company Nicholas Kirkwood. This entity was consolidated with effect from October 1, 2013. The rest of the company’s share capital is covered by reciprocal undertakings to buy and sell, mainly exercisable from 2020.
(EUR millions)
Provisional allocation of
acquisition price
Tangible and intangible fixed assets, net 159
Other non-current assets 11
Non-current provisions (18)
Current assets 382
Current liabilities (203)
Net financial debt (127)
Deferred tax 49
Net assets acquired, excluding fair value adjustment in accordance with IFRS
3 rules 253
Minority interests (20%) (a) (51)
Group share of net assets (80%), excluding fair value adjustment
in accordance with IFRS 3 rules 202
Provisional goodwill 1 785
Carrying amount of the stake held as of December 5, 2013 1 987
Interim Financial Report as of December 31, 2013 19
2.2. Other activities
In August 2013, the Group acquired 100% of Hotel Saint-Barth Isle de France, which owns and operates a luxury hotel located on the island of Saint-Barthélemy (French West Indies). This entity was consolidated with effect from September 2013.
In June 2013, LVMH acquired a 80% stake in Cova, a patisserie business based in Milan (Italy) which is also present in Asia through its franchisee network. This entity was consolidated with effect from July 1, 2013.
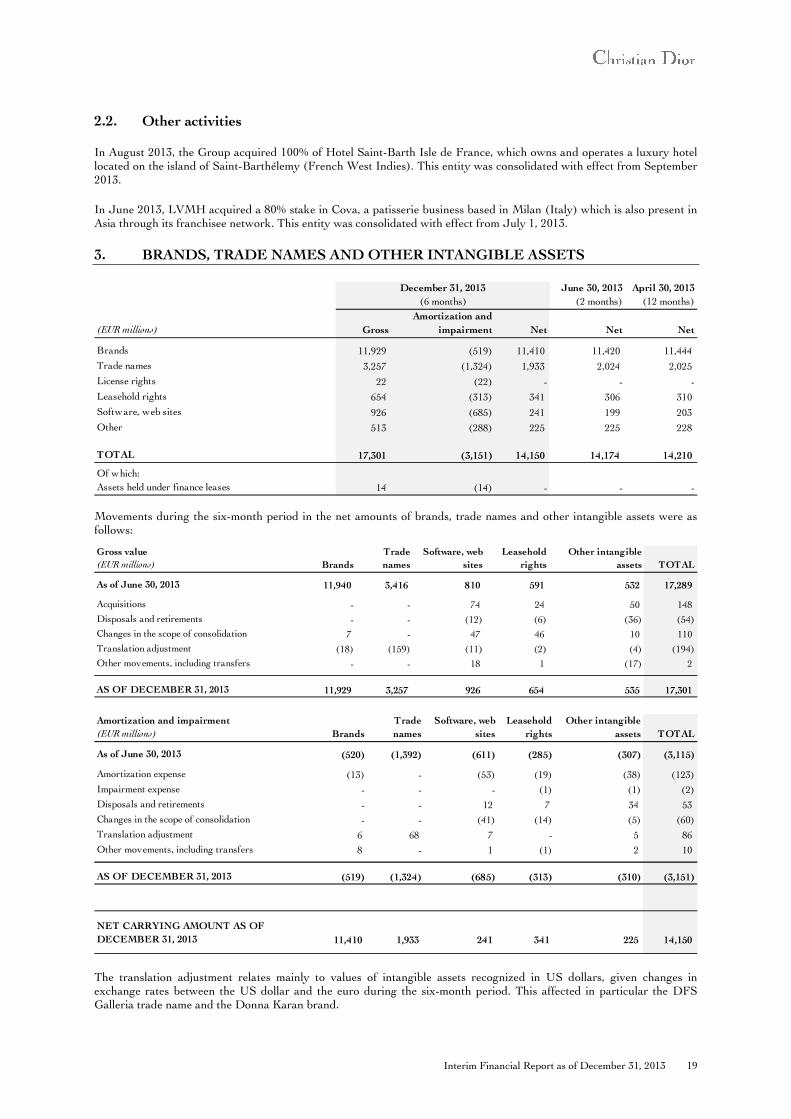
3. BRANDS, TRADE NAMES AND OTHER INTANGIBLE ASSETS
Movements during the six-month period in the net amounts of brands, trade names and other intangible assets were as follows:
The translation adjustment relates mainly to values of intangible assets recognized in US dollars, given changes in exchange rates between the US dollar and the euro during the six-month period. This affected in particular the DFS Galleria trade name and the Donna Karan brand.
December 31, 2013
(6 months)
June 30, 2013
(2 months)
April 30, 2013
(12 months)
(EUR millions) Gross
Amortization and
impairment Net Net Net
Brands 11,929 (519) 11,410 11,420 11,444
Trade names 3,257 (1,324) 1,933 2,024 2,025
License rights 22 (22) - - -
Leasehold rights 654 (313) 341 306 310
Software, web sites 926 (685) 241 199 203
Other 513 (288) 225 225 228 - -
TOTAL 17,301 (3,151) 14,150 14,174 14,210
Of which:
Assets held under finance leases 14 (14) - - -
Gross value
(EUR millions) Brands
Trade
names
Software, web
sites
Leasehold
rights
Other intangible
assets TOTAL
As of June 30, 2013 11,940 3,416 810 591 532 17,289 - - -
Acquisitions - - 74 24 50 148
Disposals and retirements - - (12) (6) (36) (54)
Changes in the scope of consolidation 7 - 47 46 10 110
Translation adjustment (18) (159) (11) (2) (4) (194)
Other movements, including transfers - - 18 1 (17) 2
AS OF DECEMBER 31, 2013 11,929 3,257 926 654 535 17,301
Amortization and impairment
(EUR millions) Brands
Trade
names
Software, web
sites
Leasehold
rights
Other intangible
assets TOTAL
As of June 30, 2013 (520) (1,392) (611) (285) (307) (3,115)
Amortization expense (13) - (53) (19) (38) (123)
Impairment expense - - - (1) (1) (2)
Disposals and retirements - - 12 7 34 53
Changes in the scope of consolidation - - (41) (14) (5) (60)
Translation adjustment 6 68 7 - 5 86
Other movements, including transfers 8 - 1 (1) 2 10
AS OF DECEMBER 31, 2013 (519) (1,324) (685) (313) (310) (3,151)
NET CARRYING AMOUNT AS OF
DECEMBER 31, 2013 11,410 1,933 241 341 225 14,150
20 Interim Financial Report as of December 31, 2013
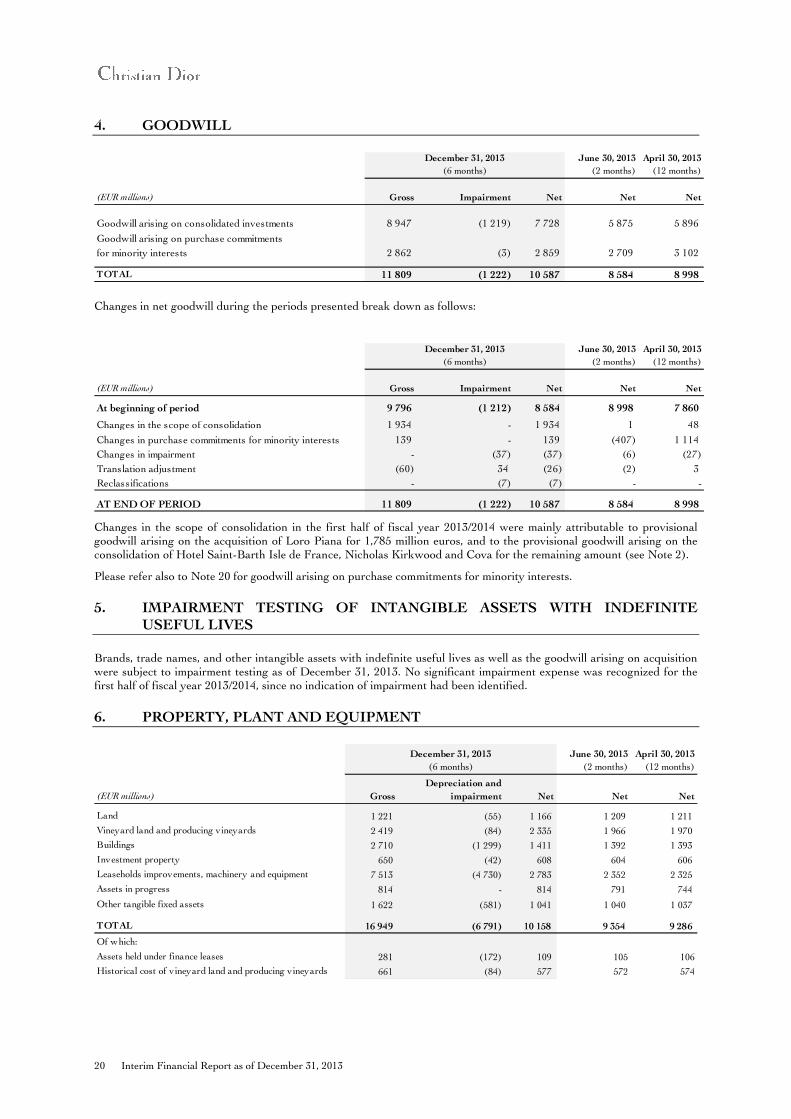
4. GOODWILL
Changes in net goodwill during the periods presented break down as follows:
Changes in the scope of consolidation in the first half of fiscal year 2013/2014 were mainly attributable to provisional goodwill arising on the acquisition of Loro Piana for 1,785 million euros, and to the provisional goodwill arising on the consolidation of Hotel Saint-Barth Isle de France, Nicholas Kirkwood and Cova for the remaining amount (see Note 2).
Please refer also to Note 20 for goodwill arising on purchase commitments for minority interests.
5. IMPAIRMENT TESTING OF INTANGIBLE ASSETS WITH INDEFINITE USEFUL LIVES
Brands, trade names, and other intangible assets with indefinite useful lives as well as the goodwill arising on acquisition were subject to impairment testing as of December 31, 2013. No significant impairment expense was recognized for the first half of fiscal year 2013/2014, since no indication of impairment had been identified.
6. PROPERTY, PLANT AND EQUIPMENT
December 31, 2013
(6 months)
June 30, 2013
(2 months)
April 30, 2013
(12 months)
(EUR millions) Gross Impairment Net Net Net
Goodwill arising on consolidated investments 8 947 (1 219) 7 728 5 875 5 896
Goodwill arising on purchase commitments
for minority interests 2 862 (3) 2 859 2 709 3 102
TOTAL 11 809 (1 222) 10 587 8 584 8 998
December 31, 2013
(6 months)
June 30, 2013
(2 months)
April 30, 2013
(12 months)
(EUR millions) Gross Impairment Net Net Net
At beginning of period 9 796 (1 212) 8 584 8 998 7 860
Changes in the scope of consolidation 1 934 - 1 934 1 48
Changes in purchase commitments for minority interests 139 - 139 (407) 1 114
Changes in impairment - (37) (37) (6) (27)
Translation adjustment (60) 34 (26) (2) 3
Reclassifications - (7) (7) - -
AT END OF PERIOD 11 809 (1 222) 10 587 8 584 8 998
December 31, 2013
(6 months)
June 30, 2013
(2 months)
April 30, 2013
(12 months)
(EUR millions) Gross
Depreciation and
impairment Net Net Net
Land 1 221 (55) 1 166 1 209 1 211
Vineyard land and producing vineyards 2 419 (84) 2 335 1 966 1 970
Buildings 2 710 (1 299) 1 411 1 392 1 393
Investment property 650 (42) 608 604 606
Leaseholds improvements, machinery and equipment 7 513 (4 730) 2 783 2 352 2 325
Assets in progress 814 - 814 791 744
Other tangible fixed assets 1 622 (581) 1 041 1 040 1 037
TOTAL 16 949 (6 791) 10 158 9 354 9 286
Of which:
Assets held under finance leases 281 (172) 109 105 106
Historical cost of vineyard land and producing vineyards 661 (84) 577 572 574
Interim Financial Report as of December 31, 2013 21
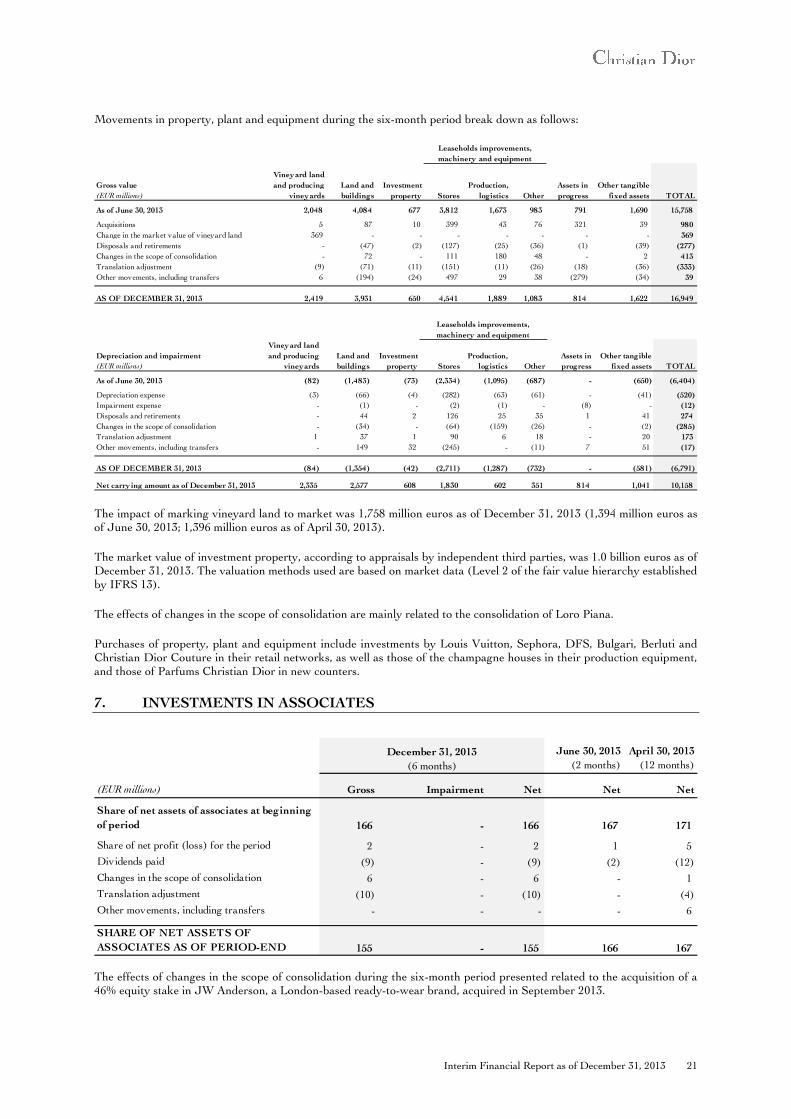
Movements in property, plant and equipment during the six-month period break down as follows:
The impact of marking vineyard land to market was 1,758 million euros as of December 31, 2013 (1,394 million euros as of June 30, 2013; 1,396 million euros as of April 30, 2013).
The market value of investment property, according to appraisals by independent third parties, was 1.0 billion euros as of December 31, 2013. The valuation methods used are based on market data (Level 2 of the fair value hierarchy established by IFRS 13).
The effects of changes in the scope of consolidation are mainly related to the consolidation of Loro Piana.
Purchases of property, plant and equipment include investments by Louis Vuitton, Sephora, DFS, Bulgari, Berluti and Christian Dior Couture in their retail networks, as well as those of the champagne houses in their production equipment, and those of Parfums Christian Dior in new counters.
7. INVESTMENTS IN ASSOCIATES
The effects of changes in the scope of consolidation during the six-month period presented related to the acquisition of a 46% equity stake in JW Anderson, a London-based ready-to-wear brand, acquired in September 2013.
Gross value
(EUR millions)
Vineyard land
and producing
vineyards
Land and
buildings
Investment
property Stores
Production,
logistics Other
Assets in
progress
Other tangible
fixed assets TOTAL
As of June 30, 2013 2,048 4,084 677 3,812 1,673 983 791 1,690 15,758
Acquisitions 5 87 10 399 43 76 321 39 980
Change in the market value of vineyard land 369 - - - - - - - 369
Disposals and retirements - (47) (2) (127) (25) (36) (1) (39) (277)
Changes in the scope of consolidation - 72 - 111 180 48 - 2 413
Translation adjustment (9) (71) (11) (151) (11) (26) (18) (36) (333)
Other movements, including transfers 6 (194) (24) 497 29 38 (279) (34) 39
AS OF DECEMBER 31, 2013 2,419 3,931 650 4,541 1,889 1,083 814 1,622 16,949
Leaseholds improvements,
machinery and equipment
Depreciation and impairment
(EUR millions)
Vineyard land
and producing
vineyards
Land and
buildings
Investment
property Stores
Production,
logistics Other
Assets in
progress
Other tangible
fixed assets TOTAL
As of June 30, 2013 (82) (1,483) (73) (2,334) (1,095) (687) - (650) (6,404)
Depreciation expense (3) (66) (4) (282) (63) (61) - (41) (520)
Impairment expense - (1) - (2) (1) - (8) - (12)
Disposals and retirements - 44 2 126 25 35 1 41 274
Changes in the scope of consolidation - (34) - (64) (159) (26) - (2) (285)
Translation adjustment 1 37 1 90 6 18 - 20 173
Other movements, including transfers - 149 32 (245) - (11) 7 51 (17)
AS OF DECEMBER 31, 2013 (84) (1,354) (42) (2,711) (1,287) (732) - (581) (6,791)
Net carry ing amount as of December 31, 2013 2,335 2,577 608 1,830 602 351 814 1,041 10,158
Leaseholds improvements,
machinery and equipment
June 30, 2013
(2 months)
April 30, 2013
(12 months)
(EUR millions) Gross Impairment Net Net Net
Share of net assets of associates at beginning
of period 166 - 166 167 171
Share of net profit (loss) for the period 2 - 2 1 5
Dividends paid (9) - (9) (2) (12)
Changes in the scope of consolidation 6 - 6 - 1
Translation adjustment (10) - (10) - (4)
Other movements, including transfers - - - - 6
SHARE OF NET ASSETS OF
ASSOCIATES AS OF PERIOD-END 155 - 155 166 167
December 31, 2013
(6 months)
22 Interim Financial Report as of December 31, 2013
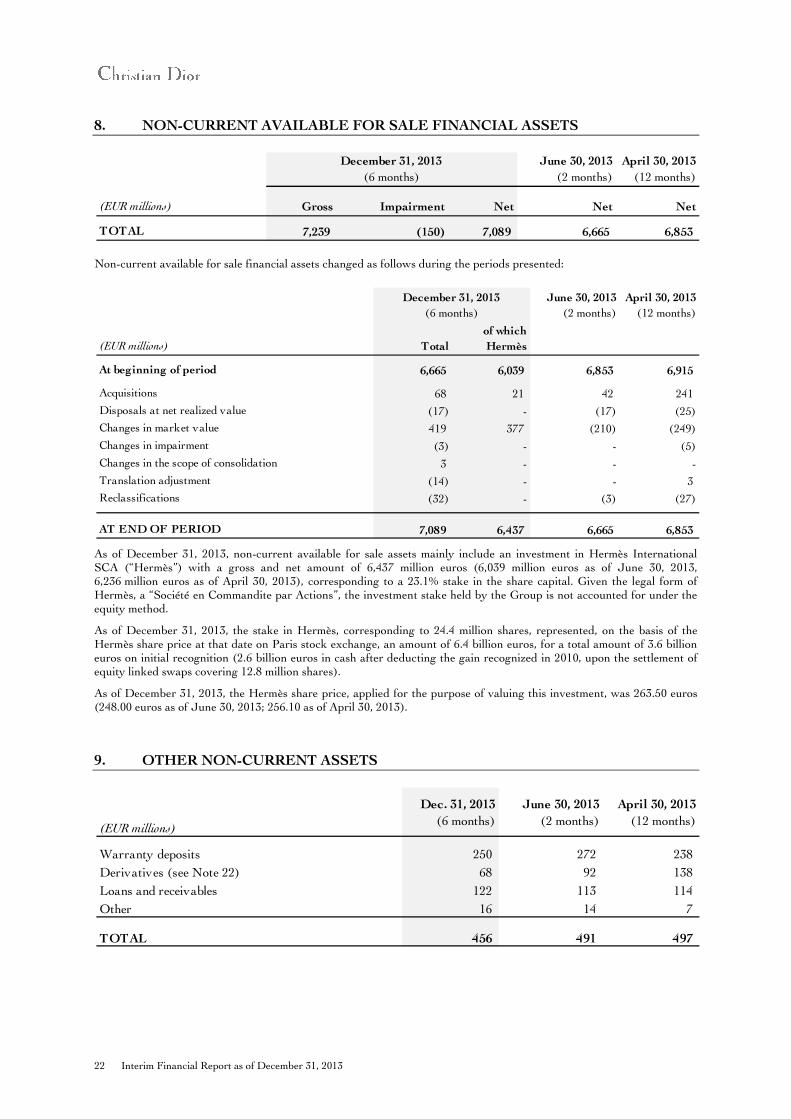
8. NON-CURRENT AVAILABLE FOR SALE FINANCIAL ASSETS
Non-current available for sale financial assets changed as follows during the periods presented:
As of December 31, 2013, non-current available for sale assets mainly include an investment in Hermès International SCA (“Hermès”) with a gross and net amount of 6,437 million euros (6,039 million euros as of June 30, 2013, 6,236 million euros as of April 30, 2013), corresponding to a 23.1% stake in the share capital. Given the legal form of Hermès, a “Société en Commandite par Actions”, the investment stake held by the Group is not accounted for under the equity method.
As of December 31, 2013, the stake in Hermès, corresponding to 24.4 million shares, represented, on the basis of the Hermès share price at that date on Paris stock exchange, an amount of 6.4 billion euros, for a total amount of 3.6 billion euros on initial recognition (2.6 billion euros in cash after deducting the gain recognized in 2010, upon the settlement of equity linked swaps covering 12.8 million shares).
As of December 31, 2013, the Hermès share price, applied for the purpose of valuing this investment, was 263.50 euros (248.00 euros as of June 30, 2013; 256.10 as of April 30, 2013).
9. OTHER NON-CURRENT ASSETS
December 31, 2013
(6 months)
June 30, 2013
(2 months)
April 30, 2013
(12 months)
(EUR millions) Gross Impairment Net Net Net
TOTAL 7,239 (150) 7,089 6,665 6,853
June 30, 2013
(2 months)
April 30, 2013
(12 months)
(EUR millions) Total
of which
Hermès
At beginning of period 6,665 6,039 6,853 6,915 - -
Acquisitions 68 21 42 241
Disposals at net realized value (17) - (17) (25)
Changes in market value 419 377 (210) (249)
Changes in impairment (3) - - (5)
Changes in the scope of consolidation 3 - - -
Translation adjustment (14) - - 3
Reclassifications (32) - (3) (27)
AT END OF PERIOD 7,089 6,437 6,665 6,853
December 31, 2013
(6 months)
(EUR millions)
Dec. 31, 2013
(6 months)
June 30, 2013
(2 months)
April 30, 2013
(12 months)
Warranty deposits 250 272 238
Derivatives (see Note 22) 68 92 138
Loans and receivables 122 113 114
Other 16 14 7
TOTAL 456 491 497
Interim Financial Report as of December 31, 2013 23
10. INVENTORIES AND WORK IN PROGRESS
The net change in inventories for the periods presented breaks down as follows:
(a) Including the impact of provisions for product returns.
Changes in the scope of consolidation in the first half of fiscal year 2013/2014 mainly related to the consolidation of Loro Piana.
The effects of marking harvests to market on Wines and Spirits’ cost of sales and value of inventory are as follows:
11. TRADE ACCOUNTS RECEIVABLE
June 30, 2013
(2 months)
April 30, 2013
(12 months)
(EUR millions) Gross Impairment Net Net Net
Wines and eaux-de-vie in the process of aging 3,749 (18) 3,731 3,621 3,677
Other raw materials and work in progress 1,529 (327) 1,202 1,172 1,194
5,278 (345) 4,933 4,793 4,871
Goods purchased for resale 1,306 (123) 1,183 1,266 1,258
F inished products 3,327 (631) 2,696 2,738 2,645
4,633 (754) 3,879 4,004 3,903
TOTAL 9,911 (1,099) 8,812 8,797 8,774
December 31, 2013
(6 months)
December 31, 2013
(6 months)
June 30, 2013
(2 months)
April 30, 2013
(12 months)
(EUR millions) Gross Impairment Net Net Net
At beginning of period 9,849 (1,052) 8,797 8,774 8,129
Change in gross inventories (a)
88 - 88 107 979
Fair value adjustment for the harvest of the period 1 - 1 4 (27)
Changes in impairment - (148) (148) (29) (239)
Changes in the scope of consolidation 303 (20) 283 - 7
Translation adjustment (229) 19 (210) (60) (80)
Other, including reclassifications (101) 102 1 1 5
AT END OF PERIOD 9,911 (1,099) 8,812 8,797 8,774
(EUR millions)
Dec. 31, 2013
(6 months)
June 30, 2013
(2 months)
April 30, 2013
(12 months)
Fair value adjustment for the harvest of the period 23 9 10
Adjustment for inventory consumed (22) (5) (37)
NET EFFECT ON COST OF SALES OF THE PERIOD 1 4 (27)
NET EFFECT ON VALUE OF INVENTORIES AT END OF PERIOD 173 172 168
(EUR millions)
Dec. 31, 2013
(6 months)
June 30, 2013
(2 months)
April 30, 2013
(12 months)
Trade accounts receivable, nominal amount 2,492 2,066 2,064
Provision for impairment (72) (67) (69)
Provision for product returns (175) (162) (167)-
NET AMOUNT 2,245 1,837 1,828
24 Interim Financial Report as of December 31, 2013
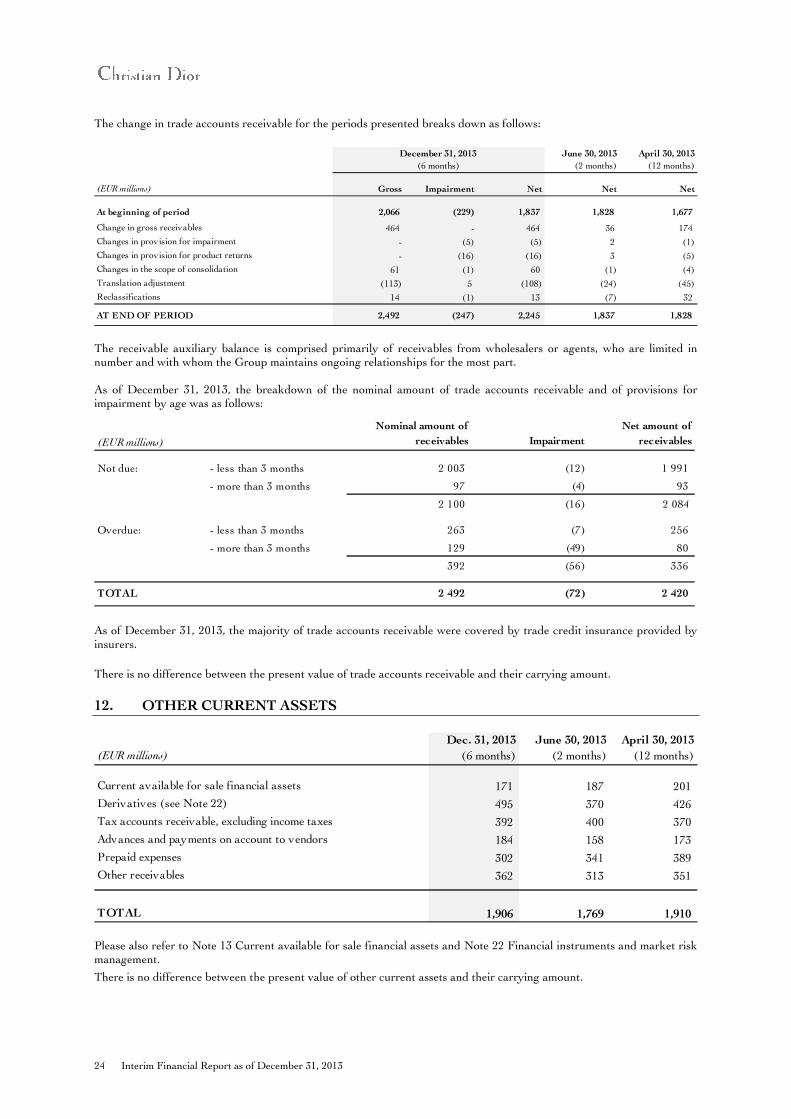
The change in trade accounts receivable for the periods presented breaks down as follows:
The receivable auxiliary balance is comprised primarily of receivables from wholesalers or agents, who are limited in number and with whom the Group maintains ongoing relationships for the most part. As of December 31, 2013, the breakdown of the nominal amount of trade accounts receivable and of provisions for impairment by age was as follows:
As of December 31, 2013, the majority of trade accounts receivable were covered by trade credit insurance provided by insurers.
There is no difference between the present value of trade accounts receivable and their carrying amount.
12. OTHER CURRENT ASSETS
Please also refer to Note 13 Current available for sale financial assets and Note 22 Financial instruments and market risk management.
There is no difference between the present value of other current assets and their carrying amount.
December 31, 2013
(6 months)
June 30, 2013
(2 months)
April 30, 2013
(12 months)
(EUR millions) Gross Impairment Net Net Net
At beginning of period 2,066 (229) 1,837 1,828 1,677
Change in gross receivables 464 - 464 36 174
Changes in provision for impairment - (5) (5) 2 (1)
Changes in provision for product returns - (16) (16) 3 (5)
Changes in the scope of consolidation 61 (1) 60 (1) (4)
Translation adjustment (113) 5 (108) (24) (45)
Reclassifications 14 (1) 13 (7) 32
AT END OF PERIOD 2,492 (247) 2,245 1,837 1,828
(EUR millions)
Nominal amount of
receivables Impairment
Net amount of
receivables
Not due: - less than 3 months 2 003 (12) 1 991
- more than 3 months 97 (4) 93
2 100 (16) 2 084
Overdue: - less than 3 months 263 (7) 256
- more than 3 months 129 (49) 80
392 (56) 336
TOTAL 2 492 (72) 2 420
(EUR millions)
Dec. 31, 2013
(6 months)
June 30, 2013
(2 months)
April 30, 2013
(12 months)
Current available for sale financial assets 171 187 201
Derivatives (see Note 22) 495 370 426
Tax accounts receivable, excluding income taxes 392 400 370
Advances and payments on account to vendors 184 158 173
Prepaid expenses 302 341 389
Other receivables 362 313 351
TOTAL 1,906 1,769 1,910
Interim Financial Report as of December 31, 2013 25
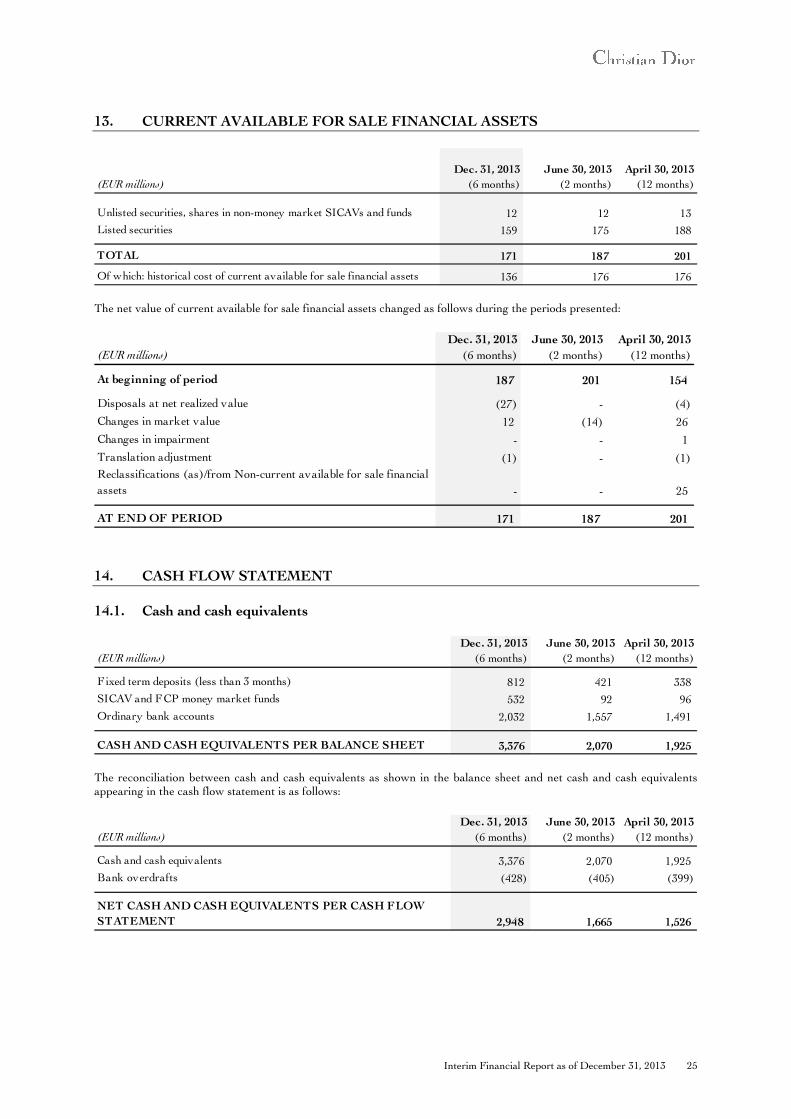
13. CURRENT AVAILABLE FOR SALE FINANCIAL ASSETS
The net value of current available for sale financial assets changed as follows during the periods presented:
14. CASH FLOW STATEMENT
14.1. Cash and cash equivalents
The reconciliation between cash and cash equivalents as shown in the balance sheet and net cash and cash equivalents appearing in the cash flow statement is as follows:
(EUR millions)
Dec. 31, 2013
(6 months)
June 30, 2013
(2 months)
April 30, 2013
(12 months)
Unlisted securities, shares in non-money market SICAVs and funds 12 12 13
Listed securities 159 175 188
TOTAL 171 187 201
Of which: historical cost of current available for sale financial assets 136 176 176
(EUR millions)
Dec. 31, 2013
(6 months)
June 30, 2013
(2 months)
April 30, 2013
(12 months)
At beginning of period 187 201 154
Disposals at net realized value (27) - (4)
Changes in market value 12 (14) 26
Changes in impairment - - 1
Translation adjustment (1) - (1)
Reclassifications (as)/from Non-current available for sale financial
assets - - 25
AT END OF PERIOD 171 187 201
(EUR millions)
Dec. 31, 2013
(6 months)
June 30, 2013
(2 months)
April 30, 2013
(12 months)
Fixed term deposits (less than 3 months) 812 421 338
SICAV and FCP money market funds 532 92 96
Ordinary bank accounts 2,032 1,557 1,491
CASH AND CASH EQUIVALENTS PER BALANCE SHEET 3,376 2,070 1,925
(EUR millions)
Dec. 31, 2013
(6 months)
June 30, 2013
(2 months)
April 30, 2013
(12 months)
Cash and cash equivalents 3,376 2,070 1,925
Bank overdrafts (428) (405) (399)
NET CASH AND CASH EQUIVALENTS PER CASH FLOW
STATEMENT 2,948 1,665 1,526
26 Interim Financial Report as of December 31, 2013
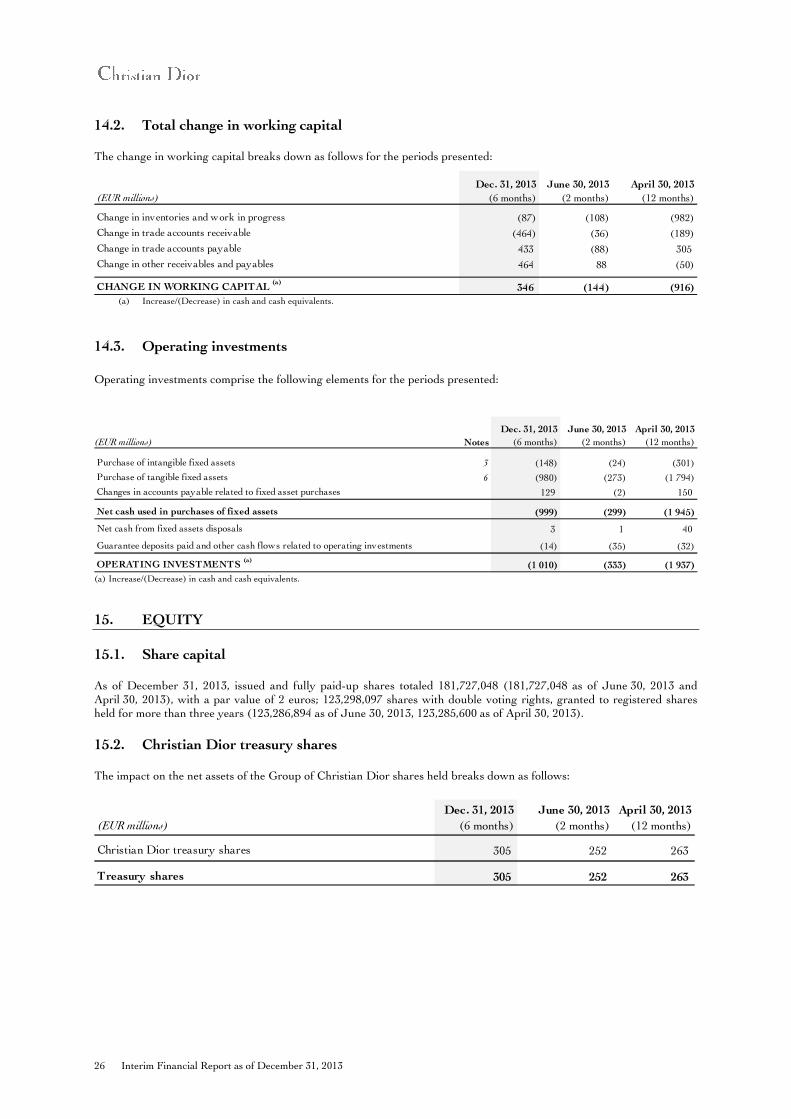
14.2. Total change in working capital
The change in working capital breaks down as follows for the periods presented:
(a) Increase/(Decrease) in cash and cash equivalents.
14.3. Operating investments
Operating investments comprise the following elements for the periods presented:
(a) Increase/(Decrease) in cash and cash equivalents.
15. EQUITY
15.1. Share capital
As of December 31, 2013, issued and fully paid-up shares totaled 181,727,048 (181,727,048 as of June 30, 2013 and April 30, 2013), with a par value of 2 euros; 123,298,097 shares with double voting rights, granted to registered shares held for more than three years (123,286,894 as of June 30, 2013, 123,285,600 as of April 30, 2013).
15.2. Christian Dior treasury shares
The impact on the net assets of the Group of Christian Dior shares held breaks down as follows:
(EUR millions)
Dec. 31, 2013
(6 months)
June 30, 2013
(2 months)
April 30, 2013
(12 months)
Change in inventories and work in progress (87) (108) (982)
Change in trade accounts receivable (464) (36) (189)
Change in trade accounts payable 433 (88) 305
Change in other receivables and payables 464 88 (50)
CHANGE IN WORKING CAPITAL (a)
346 (144) (916)
(EUR millions) Notes
Dec. 31, 2013
(6 months)
June 30, 2013
(2 months)
April 30, 2013
(12 months)
Purchase of intangible fixed assets 3 (148) (24) (301)
Purchase of tangible fixed assets 6 (980) (273) (1 794)
Changes in accounts payable related to fixed asset purchases 129 (2) 150
Net cash used in purchases of fixed assets (999) (299) (1 945)
Net cash from fixed assets disposals 3 1 40
Guarantee deposits paid and other cash flows related to operating investments (14) (35) (32)
OPERATING INVESTMENTS (a)
(1 010) (333) (1 937)
(EUR millions)
Dec. 31, 2013
(6 months)
June 30, 2013
(2 months)
April 30, 2013
(12 months)
Christian Dior treasury shares 305 252 263
Treasury shares 305 252 263
Interim Financial Report as of December 31, 2013 27
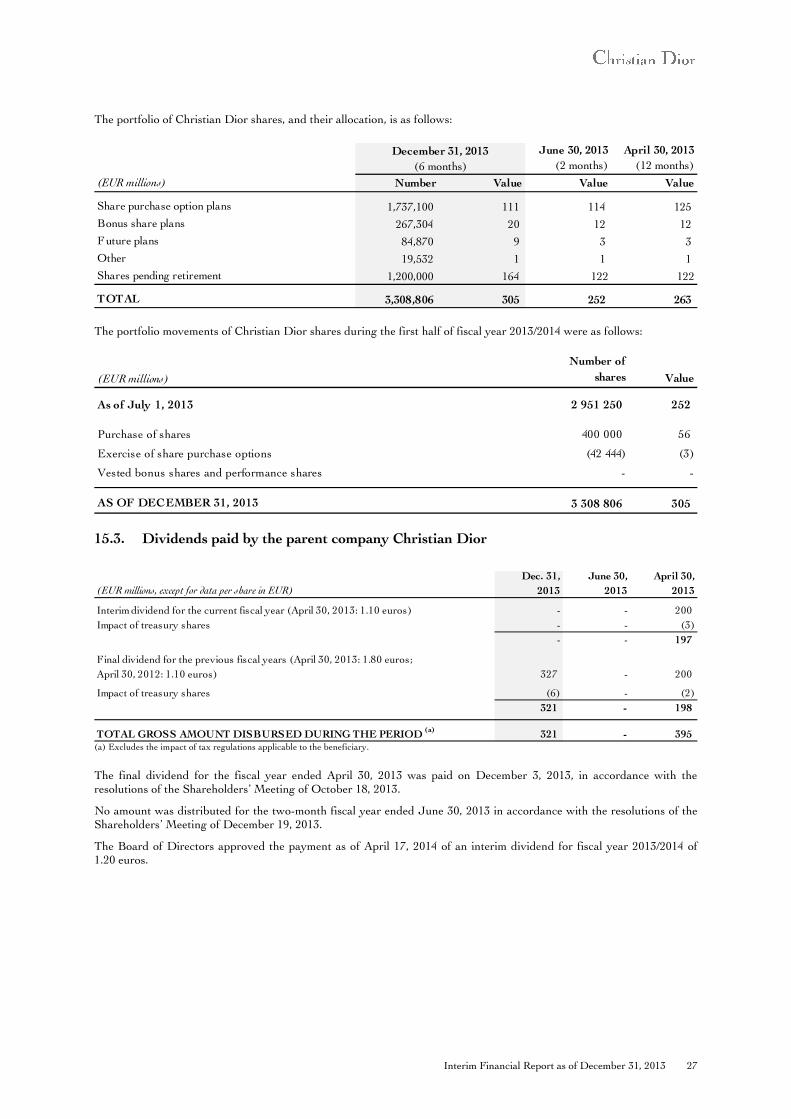
The portfolio of Christian Dior shares, and their allocation, is as follows:
The portfolio movements of Christian Dior shares during the first half of fiscal year 2013/2014 were as follows:
15.3. Dividends paid by the parent company Christian Dior
(a) Excludes the impact of tax regulations applicable to the beneficiary.
The final dividend for the fiscal year ended April 30, 2013 was paid on December 3, 2013, in accordance with the resolutions of the Shareholders’ Meeting of October 18, 2013.
No amount was distributed for the two-month fiscal year ended June 30, 2013 in accordance with the resolutions of the Shareholders’ Meeting of December 19, 2013.
The Board of Directors approved the payment as of April 17, 2014 of an interim dividend for fiscal year 2013/2014 of 1.20 euros.
June 30, 2013
(2 months)
April 30, 2013
(12 months)
(EUR millions) Number Value Value Value
Share purchase option plans 1,737,100 111 114 125
Bonus share plans 267,304 20 12 12
Future plans 84,870 9 3 3
Other 19,532 1 1 1
Shares pending retirement 1,200,000 164 122 122
TOTAL 3,308,806 305 252 263
December 31, 2013
(6 months)
(EUR millions)
Number of
shares Value
As of July 1, 2013 2 951 250 252
Purchase of shares 400 000 56
Exercise of share purchase options (42 444) (3)
Vested bonus shares and performance shares - -
AS OF DECEMBER 31, 2013 3 308 806 305
(EUR millions, except for data per share in EUR)
Dec. 31,
2013
June 30,
2013
April 30,
2013
Interim dividend for the current fiscal year (April 30, 2013: 1.10 euros) - - 200
Impact of treasury shares - - (3)
- - 197
Final dividend for the previous fiscal years (April 30, 2013: 1.80 euros;
April 30, 2012: 1.10 euros) 327 - 200
Impact of treasury shares (6) - (2)
321 - 198
TOTAL GROSS AMOUNT DISBURSED DURING THE PERIOD (a)
321 - 395
28 Interim Financial Report as of December 31, 2013
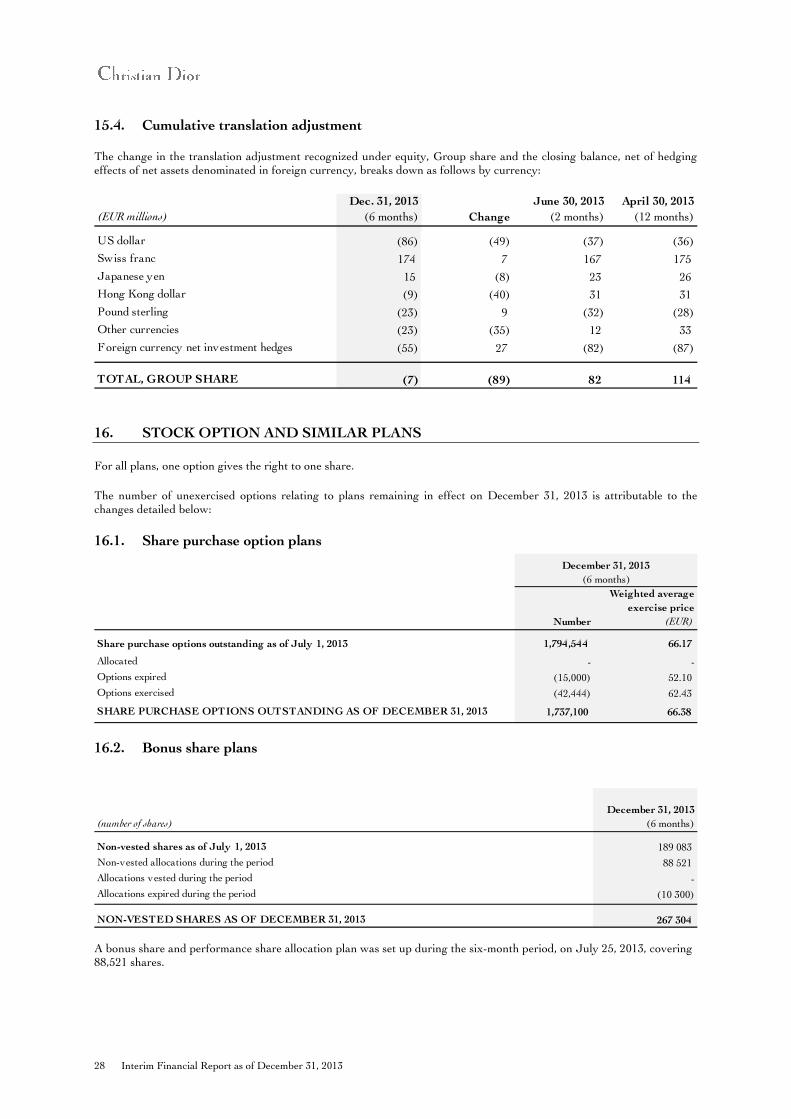
15.4. Cumulative translation adjustment
The change in the translation adjustment recognized under equity, Group share and the closing balance, net of hedging effects of net assets denominated in foreign currency, breaks down as follows by currency:
16. STOCK OPTION AND SIMILAR PLANS
For all plans, one option gives the right to one share.
The number of unexercised options relating to plans remaining in effect on December 31, 2013 is attributable to the changes detailed below:
16.1. Share purchase option plans
16.2. Bonus share plans
A bonus share and performance share allocation plan was set up during the six-month period, on July 25, 2013, covering 88,521 shares.
(EUR millions)
Dec. 31, 2013
(6 months) Change
June 30, 2013
(2 months)
April 30, 2013
(12 months)
US dollar (86) (49) (37) (36)
Swiss franc 174 7 167 175
Japanese yen 15 (8) 23 26
Hong Kong dollar (9) (40) 31 31
Pound sterling (23) 9 (32) (28)
Other currencies (23) (35) 12 33
Foreign currency net investment hedges (55) 27 (82) (87)
TOTAL, GROUP SHARE (7) (89) 82 114
Number
Weighted average
exercise price
(EUR)
Share purchase options outstanding as of July 1, 2013 1,794,544 66.17
Allocated - -
Options expired (15,000) 52.10
Options exercised (42,444) 62.43 - -
SHARE PURCHASE OPTIONS OUTSTANDING AS OF DECEMBER 31, 2013 1,737,100 66.38
December 31, 2013
(6 months)
(number of shares)
December 31, 2013
(6 months)
Non-vested shares as of July 1, 2013 189 083
Non-vested allocations during the period 88 521
Allocations vested during the period -
Allocations expired during the period (10 300)
NON-VESTED SHARES AS OF DECEMBER 31, 2013 267 304
Interim Financial Report as of December 31, 2013 29
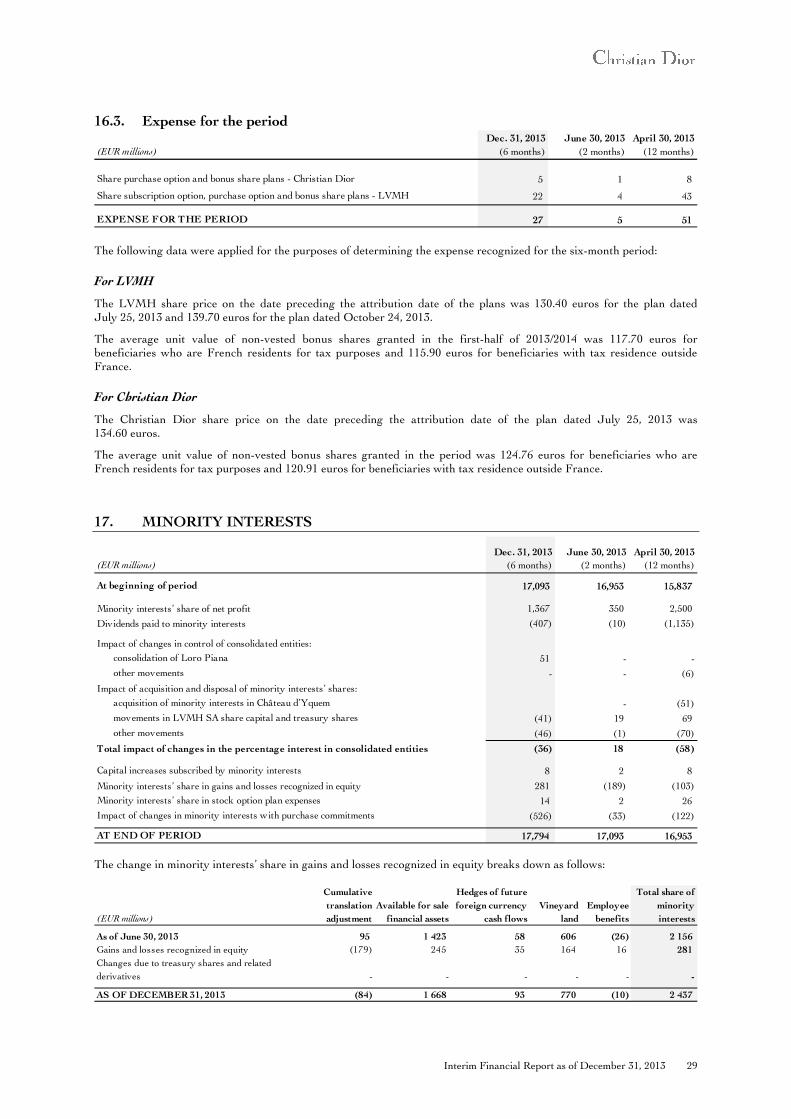
16.3. Expense for the period
The following data were applied for the purposes of determining the expense recognized for the six-month period:
For LVMH
The LVMH share price on the date preceding the attribution date of the plans was 130.40 euros for the plan dated July 25, 2013 and 139.70 euros for the plan dated October 24, 2013.
The average unit value of non-vested bonus shares granted in the first-half of 2013/2014 was 117.70 euros for beneficiaries who are French residents for tax purposes and 115.90 euros for beneficiaries with tax residence outside France.
For Christian Dior
The Christian Dior share price on the date preceding the attribution date of the plan dated July 25, 2013 was 134.60 euros.
The average unit value of non-vested bonus shares granted in the period was 124.76 euros for beneficiaries who are French residents for tax purposes and 120.91 euros for beneficiaries with tax residence outside France.
17. MINORITY INTERESTS
The change in minority interests’ share in gains and losses recognized in equity breaks down as follows:
(EUR millions)
Dec. 31, 2013
(6 months)
June 30, 2013
(2 months)
April 30, 2013
(12 months)
Share purchase option and bonus share plans - Christian Dior 5 1 8
Share subscription option, purchase option and bonus share plans - LVMH 22 4 43
EXPENSE FOR THE PERIOD 27 5 51
(EUR millions)
Dec. 31, 2013
(6 months)
June 30, 2013
(2 months)
April 30, 2013
(12 months)
At beginning of period 17,093 16,953 15,837
1,367 350 2,500
(407) (10) (1,135)
consolidation of Loro Piana 51 - -
other movements - - (6)
acquisition of minority interests in Château d’Yquem - (51)
movements in LVMH SA share capital and treasury shares (41) 19 69
other movements (46) (1) (70)
(36) 18 (58)
Capital increases subscribed by minority interests 8 2 8
281 (189) (103)
Minority interests’ share in stock option plan expenses 14 2 26
Impact of changes in minority interests with purchase commitments (526) (33) (122)
AT END OF PERIOD 17,794 17,093 16,953
Minority interests’ share in gains and losses recognized in equity
Minority interests’ share of net profit
Dividends paid to minority interests
Impact of changes in control of consolidated entities:
Impact of acquisition and disposal of minority interests’ shares:
Total impact of changes in the percentage interest in consolidated entities
(EUR millions)
Cumulative
translation
adjustment
Available for sale
financial assets
Hedges of future
foreign currency
cash flows
Vineyard
land
Employee
benefits
Total share of
minority
interests
As of June 30, 2013 95 1 423 58 606 (26) 2 156
Gains and losses recognized in equity (179) 245 35 164 16 281
Changes due to treasury shares and related
derivatives - - - - - -
AS OF DECEMBER 31, 2013 (84) 1 668 93 770 (10) 2 437
30 Interim Financial Report as of December 31, 2013
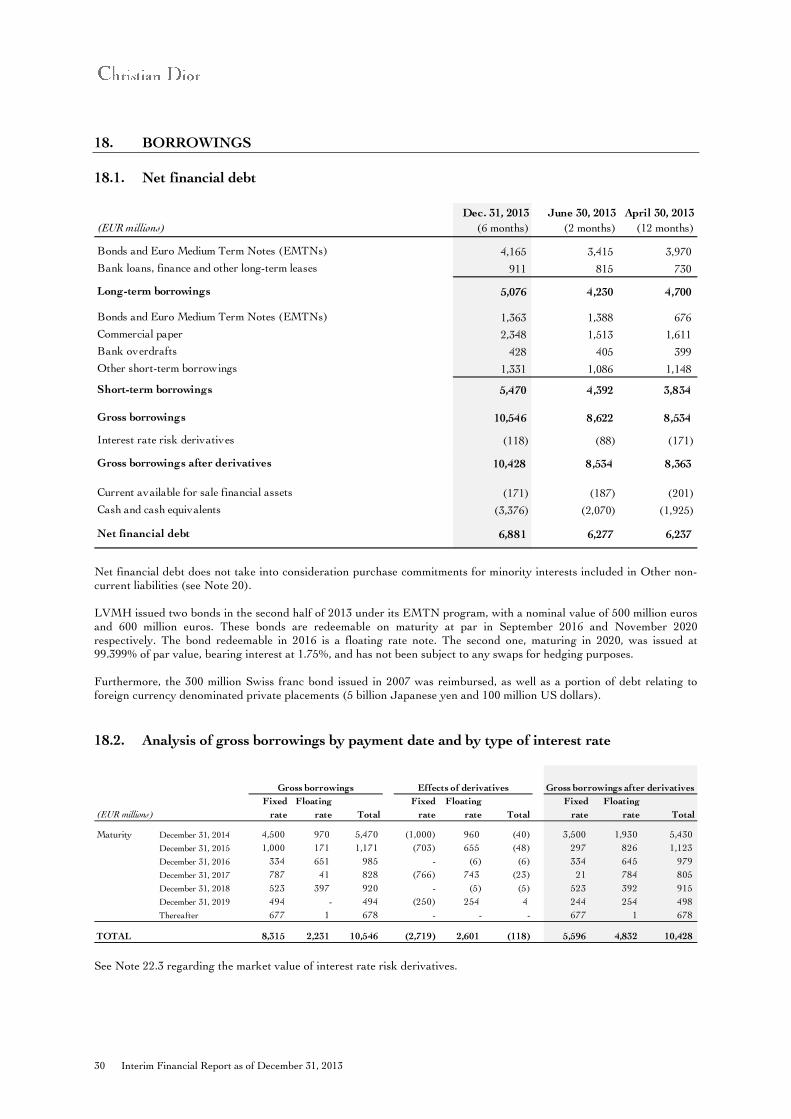
18. BORROWINGS
18.1. Net financial debt
Net financial debt does not take into consideration purchase commitments for minority interests included in Other non-current liabilities (see Note 20). LVMH issued two bonds in the second half of 2013 under its EMTN program, with a nominal value of 500 million euros and 600 million euros. These bonds are redeemable on maturity at par in September 2016 and November 2020 respectively. The bond redeemable in 2016 is a floating rate note. The second one, maturing in 2020, was issued at 99.399% of par value, bearing interest at 1.75%, and has not been subject to any swaps for hedging purposes. Furthermore, the 300 million Swiss franc bond issued in 2007 was reimbursed, as well as a portion of debt relating to foreign currency denominated private placements (5 billion Japanese yen and 100 million US dollars).
18.2. Analysis of gross borrowings by payment date and by type of interest rate
See Note 22.3 regarding the market value of interest rate risk derivatives.
(EUR millions)
Dec. 31, 2013
(6 months)
June 30, 2013
(2 months)
April 30, 2013
(12 months)
Bonds and Euro Medium Term Notes (EMTNs) 4,165 3,415 3,970
Bank loans, finance and other long-term leases 911 815 730
Long-term borrowings 5,076 4,230 4,700
Bonds and Euro Medium Term Notes (EMTNs) 1,363 1,388 676
Commercial paper 2,348 1,513 1,611
Bank overdrafts 428 405 399
Other short-term borrowings 1,331 1,086 1,148
Short-term borrowings 5,470 4,392 3,834
Gross borrowings 10,546 8,622 8,534
Interest rate risk derivatives (118) (88) (171)
Gross borrowings after derivatives 10,428 8,534 8,363
Current available for sale financial assets (171) (187) (201)
Cash and cash equivalents (3,376) (2,070) (1,925)
Net financial debt 6,881 6,277 6,237
(EUR millions)
Fixed
rate
Floating
rate Total
Fixed
rate
Floating
rate Total
Fixed
rate
Floating
rate Total
Maturity December 31, 2014 4,500 970 5,470 (1,000) 960 (40) 3,500 1,930 5,430
December 31, 2015 1,000 171 1,171 (703) 655 (48) 297 826 1,123
December 31, 2016 334 651 985 - (6) (6) 334 645 979
December 31, 2017 787 41 828 (766) 743 (23) 21 784 805
December 31, 2018 523 397 920 - (5) (5) 523 392 915
December 31, 2019 494 - 494 (250) 254 4 244 254 498
Thereafter 677 1 678 - - - 677 1 678
TOTAL 8,315 2,231 10,546 (2,719) 2,601 (118) 5,596 4,832 10,428
Gross borrowings after derivativesGross borrowings Effects of derivatives
Interim Financial Report as of December 31, 2013 31
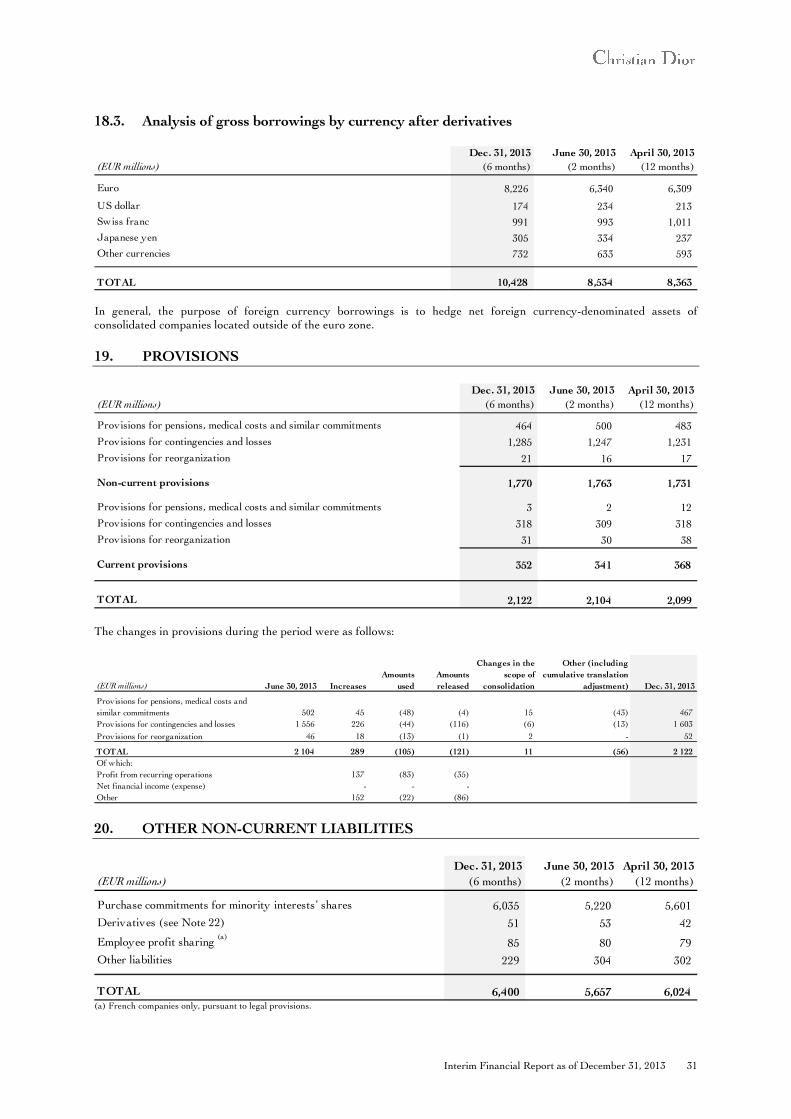
18.3. Analysis of gross borrowings by currency after derivatives
In general, the purpose of foreign currency borrowings is to hedge net foreign currency-denominated assets of consolidated companies located outside of the euro zone.
19. PROVISIONS
The changes in provisions during the period were as follows:
20. OTHER NON-CURRENT LIABILITIES
(a) French companies only, pursuant to legal provisions.
(EUR millions)
Dec. 31, 2013
(6 months)
June 30, 2013
(2 months)
April 30, 2013
(12 months)
Euro 8,226 6,340 6,309
US dollar 174 234 213
Swiss franc 991 993 1,011
Japanese yen 305 334 237
Other currencies 732 633 593
TOTAL 10,428 8,534 8,363
(EUR millions)
Dec. 31, 2013
(6 months)
June 30, 2013
(2 months)
April 30, 2013
(12 months)
Provisions for pensions, medical costs and similar commitments 464 500 483
Provisions for contingencies and losses 1,285 1,247 1,231
Provisions for reorganization 21 16 17
Non-current provisions 1,770 1,763 1,731
Provisions for pensions, medical costs and similar commitments 3 2 12
Provisions for contingencies and losses 318 309 318
Provisions for reorganization 31 30 38
Current provisions 352 341 368
TOTAL 2,122 2,104 2,099
(EUR millions) June 30, 2013 Increases
Amounts
used
Amounts
released
Changes in the
scope of
consolidation
Other (including
cumulative translation
adjustment) Dec. 31, 2013
Provisions for pensions, medical costs and
similar commitments 502 45 (48) (4) 15 (43) 467
Provisions for contingencies and losses 1 556 226 (44) (116) (6) (13) 1 603
Provisions for reorganization 46 18 (13) (1) 2 - 52
TOTAL 2 104 289 (105) (121) 11 (56) 2 122
Of which:
137 (83) (35)
- - -
152 (22) (86)
Profit from recurring operations
Net financial income (expense)
Other
(EUR millions)
Dec. 31, 2013
(6 months)
June 30, 2013
(2 months)
April 30, 2013
(12 months)
Purchase commitments for minority interests’ shares 6,035 5,220 5,601
Derivatives (see Note 22) 51 53 42
Employee profit sharing (a)
85 80 79
Other liabilities 229 304 302
TOTAL 6,400 5,657 6,024
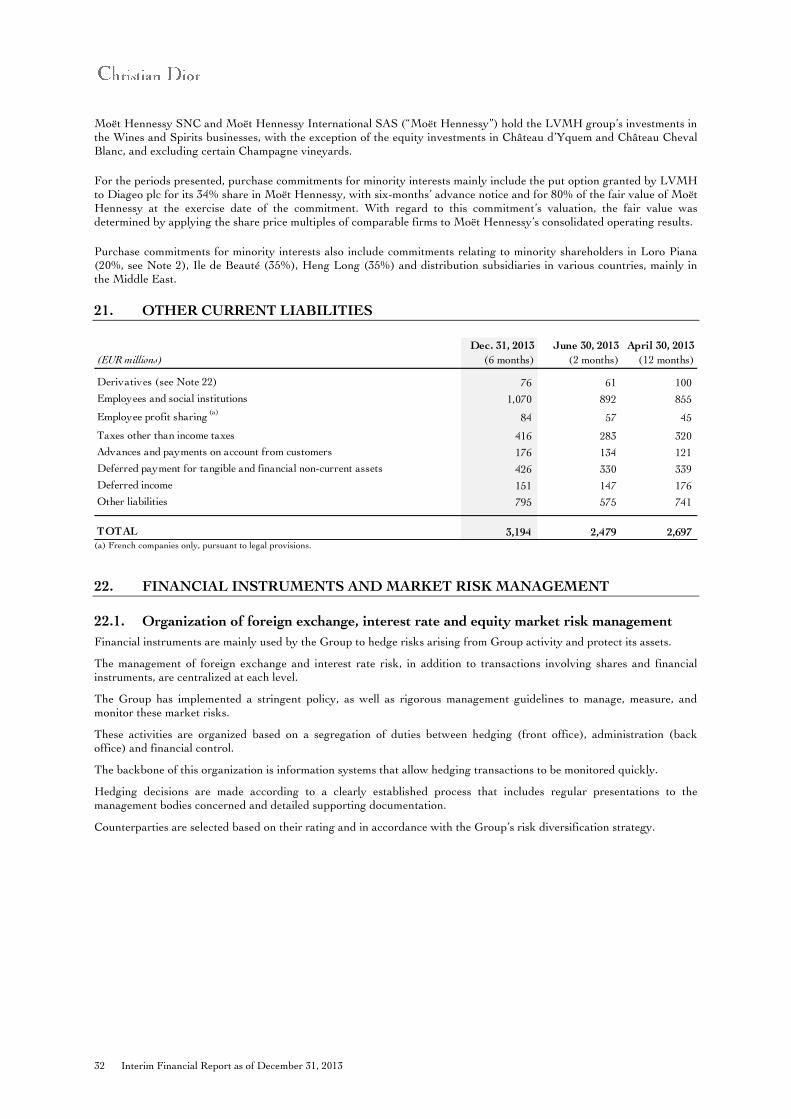
32 Interim Financial Report as of December 31, 2013
Moët Hennessy SNC and Moët Hennessy International SAS (“Moët Hennessy”) hold the LVMH group’s investments in the Wines and Spirits businesses, with the exception of the equity investments in Château d’Yquem and Château Cheval Blanc, and excluding certain Champagne vineyards.
For the periods presented, purchase commitments for minority interests mainly include the put option granted by LVMH to Diageo plc for its 34% share in Moët Hennessy, with six-months’ advance notice and for 80% of the fair value of Moët Hennessy at the exercise date of the commitment. With regard to this commitment’s valuation, the fair value was determined by applying the share price multiples of comparable firms to Moët Hennessy’s consolidated operating results.
Purchase commitments for minority interests also include commitments relating to minority shareholders in Loro Piana (20%, see Note 2), Ile de Beauté (35%), Heng Long (35%) and distribution subsidiaries in various countries, mainly in the Middle East.
21. OTHER CURRENT LIABILITIES
(a) French companies only, pursuant to legal provisions.
22. FINANCIAL INSTRUMENTS AND MARKET RISK MANAGEMENT
22.1. Organization of foreign exchange, interest rate and equity market risk management
Financial instruments are mainly used by the Group to hedge risks arising from Group activity and protect its assets.
The management of foreign exchange and interest rate risk, in addition to transactions involving shares and financial instruments, are centralized at each level.
The Group has implemented a stringent policy, as well as rigorous management guidelines to manage, measure, and monitor these market risks.
These activities are organized based on a segregation of duties between hedging (front office), administration (back office) and financial control.
The backbone of this organization is information systems that allow hedging transactions to be monitored quickly.
Hedging decisions are made according to a clearly established process that includes regular presentations to the management bodies concerned and detailed supporting documentation.
Counterparties are selected based on their rating and in accordance with the Group’s risk diversification strategy.
(EUR millions)
Dec. 31, 2013
(6 months)
June 30, 2013
(2 months)
April 30, 2013
(12 months)
Derivatives (see Note 22) 76 61 100
Employees and social institutions 1,070 892 855
Employee profit sharing (a)
84 57 45
Taxes other than income taxes 416 283 320
Advances and payments on account from customers 176 134 121
Deferred payment for tangible and financial non-current assets 426 330 339
Deferred income 151 147 176
Other liabilities 795 575 741
TOTAL 3,194 2,479 2,697
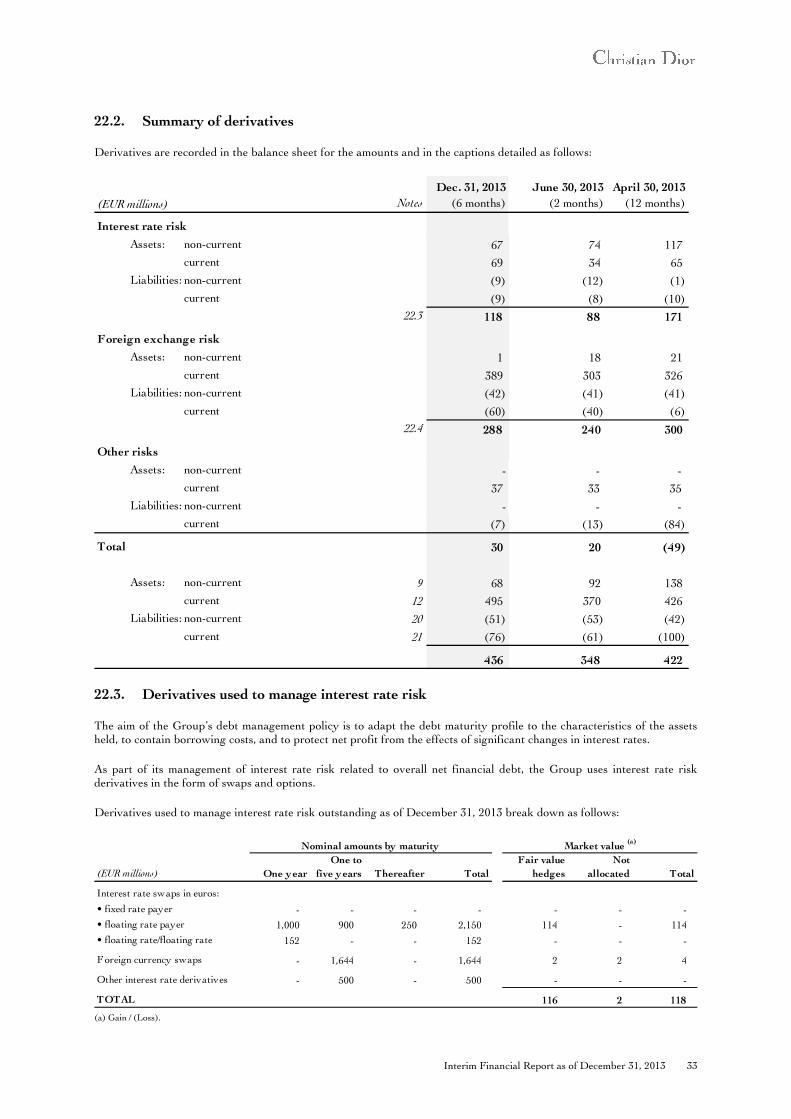
Interim Financial Report as of December 31, 2013 33
22.2. Summary of derivatives
Derivatives are recorded in the balance sheet for the amounts and in the captions detailed as follows:
22.3. Derivatives used to manage interest rate risk
The aim of the Group’s debt management policy is to adapt the debt maturity profile to the characteristics of the assets held, to contain borrowing costs, and to protect net profit from the effects of significant changes in interest rates.
As part of its management of interest rate risk related to overall net financial debt, the Group uses interest rate risk derivatives in the form of swaps and options.
Derivatives used to manage interest rate risk outstanding as of December 31, 2013 break down as follows:
(a) Gain / (Loss).
Notes
Dec. 31, 2013
(6 months)
June 30, 2013
(2 months)
April 30, 2013
(12 months)
Interest rate risk
Assets: non-current 67 74 117
current 69 34 65
Liabilities: non-current (9) (12) (1)
current (9) (8) (10)
22.3 118 88 171
Foreign exchange risk
Assets: non-current 1 18 21
current 389 303 326
Liabilities: non-current (42) (41) (41)
current (60) (40) (6)
22.4 288 240 300
Other risks
Assets: non-current - - -
current 37 33 35
Liabilities: non-current - - -
current (7) (13) (84)
Total 30 20 (49)
Assets: non-current 9 68 92 138
current 12 495 370 426
Liabilities: non-current 20 (51) (53) (42)
current 21 (76) (61) (100)
436 348 422
(EUR millions)
(EUR millions) One year
One to
five y ears Thereafter Total
Fair value
hedges
Not
allocated Total
Interest rate swaps in euros:
• fixed rate payer - - - - - - -
• floating rate payer 1,000 900 250 2,150 114 - 114
• floating rate/floating rate 152 - - 152 - - - - - - - -
Foreign currency swaps - 1,644 - 1,644 2 2 4 -
Other interest rate derivatives - 500 - 500 - - -
TOTAL 116 2 118
Nominal amounts by maturity Market value (a)
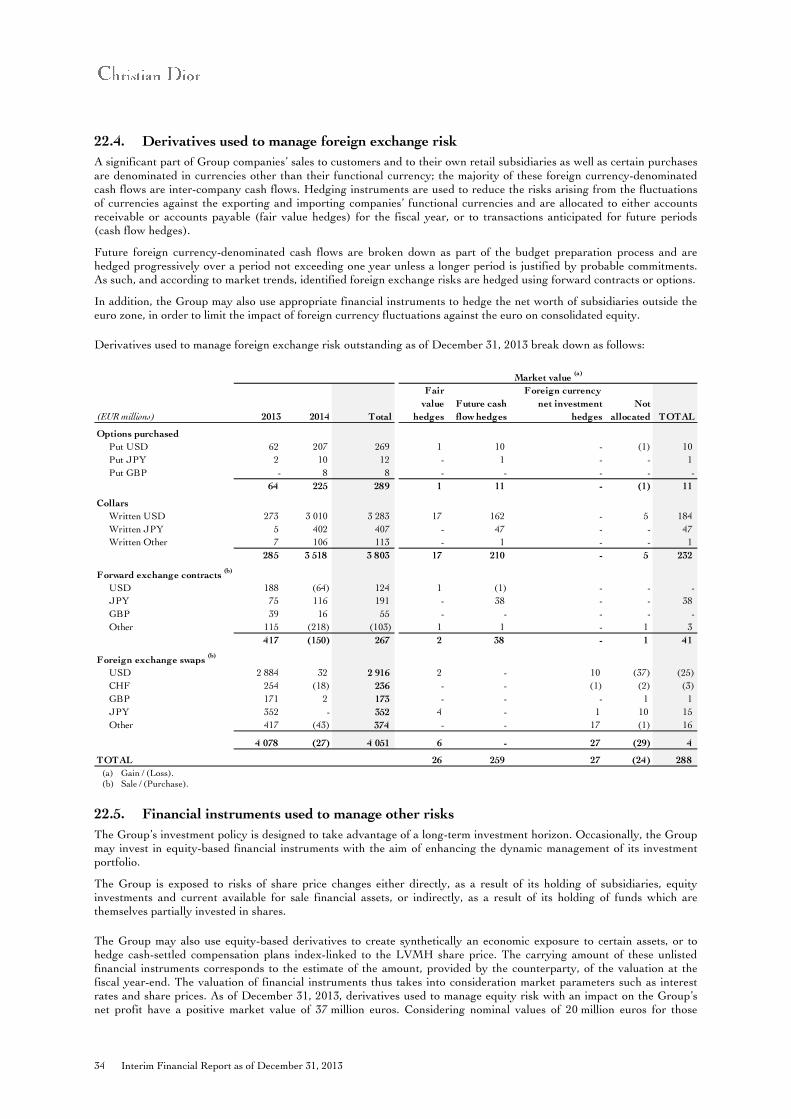
34 Interim Financial Report as of December 31, 2013
22.4. Derivatives used to manage foreign exchange risk
A significant part of Group companies’ sales to customers and to their own retail subsidiaries as well as certain purchases are denominated in currencies other than their functional currency; the majority of these foreign currency-denominated cash flows are inter-company cash flows. Hedging instruments are used to reduce the risks arising from the fluctuations of currencies against the exporting and importing companies’ functional currencies and are allocated to either accounts receivable or accounts payable (fair value hedges) for the fiscal year, or to transactions anticipated for future periods (cash flow hedges).
Future foreign currency-denominated cash flows are broken down as part of the budget preparation process and are hedged progressively over a period not exceeding one year unless a longer period is justified by probable commitments. As such, and according to market trends, identified foreign exchange risks are hedged using forward contracts or options.
In addition, the Group may also use appropriate financial instruments to hedge the net worth of subsidiaries outside the euro zone, in order to limit the impact of foreign currency fluctuations against the euro on consolidated equity.
Derivatives used to manage foreign exchange risk outstanding as of December 31, 2013 break down as follows:
(a) Gain / (Loss). (b) Sale / (Purchase).
22.5. Financial instruments used to manage other risks
The Group’s investment policy is designed to take advantage of a long-term investment horizon. Occasionally, the Group may invest in equity-based financial instruments with the aim of enhancing the dynamic management of its investment portfolio.
The Group is exposed to risks of share price changes either directly, as a result of its holding of subsidiaries, equity investments and current available for sale financial assets, or indirectly, as a result of its holding of funds which are themselves partially invested in shares.
The Group may also use equity-based derivatives to create synthetically an economic exposure to certain assets, or to hedge cash-settled compensation plans index-linked to the LVMH share price. The carrying amount of these unlisted financial instruments corresponds to the estimate of the amount, provided by the counterparty, of the valuation at the fiscal year-end. The valuation of financial instruments thus takes into consideration market parameters such as interest rates and share prices. As of December 31, 2013, derivatives used to manage equity risk with an impact on the Group’s net profit have a positive market value of 37 million euros. Considering nominal values of 20 million euros for those
2013 2014 Total
Fair
value
hedges
Future cash
flow hedges
Foreign currency
net investment
hedges
Not
allocated TOTAL
Options purchased
Put USD 62 207 269 1 10 - (1) 10
Put JPY 2 10 12 - 1 - - 1
Put GBP - 8 8 - - - - -
64 225 289 1 11 - (1) 11
Collars
Written USD 273 3 010 3 283 17 162 - 5 184
Written JPY 5 402 407 - 47 - - 47
Written Other 7 106 113 - 1 - - 1
285 3 518 3 803 17 210 - 5 232
Forward exchange contracts (b)
USD 188 (64) 124 1 (1) - - -
JPY 75 116 191 - 38 - - 38
GBP 39 16 55 - - - - -
Other 115 (218) (103) 1 1 - 1 3
417 (150) 267 2 38 - 1 41
Foreign exchange swaps (b)
USD 2 884 32 2 916 2 - 10 (37) (25)
CHF 254 (18) 236 - - (1) (2) (3)
GBP 171 2 173 - - - 1 1
JPY 352 - 352 4 - 1 10 15
Other 417 (43) 374 - - 17 (1) 16
4 078 (27) 4 051 6 - 27 (29) 4
TOTAL 26 259 27 (24) 288
Market value (a)
(EUR millions)
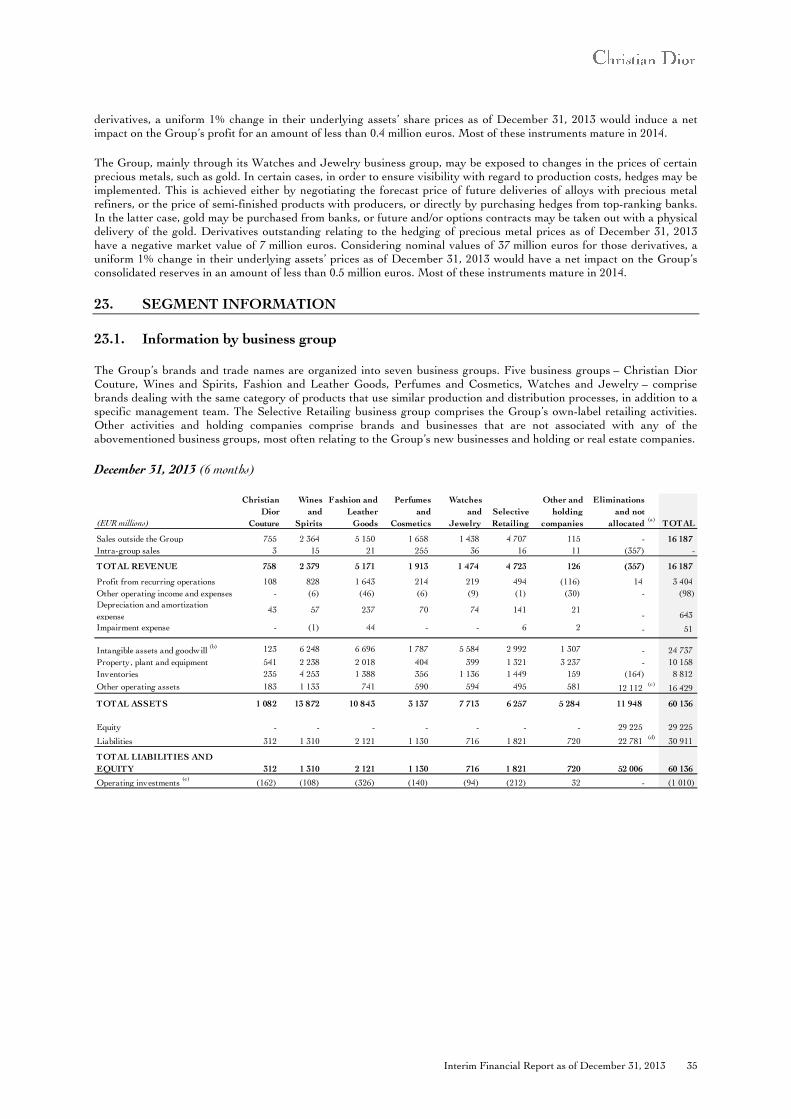
Interim Financial Report as of December 31, 2013 35
derivatives, a uniform 1% change in their underlying assets’ share prices as of December 31, 2013 would induce a net impact on the Group’s profit for an amount of less than 0.4 million euros. Most of these instruments mature in 2014.
The Group, mainly through its Watches and Jewelry business group, may be exposed to changes in the prices of certain precious metals, such as gold. In certain cases, in order to ensure visibility with regard to production costs, hedges may be implemented. This is achieved either by negotiating the forecast price of future deliveries of alloys with precious metal refiners, or the price of semi-finished products with producers, or directly by purchasing hedges from top-ranking banks. In the latter case, gold may be purchased from banks, or future and/or options contracts may be taken out with a physical delivery of the gold. Derivatives outstanding relating to the hedging of precious metal prices as of December 31, 2013 have a negative market value of 7 million euros. Considering nominal values of 37 million euros for those derivatives, a uniform 1% change in their underlying assets’ prices as of December 31, 2013 would have a net impact on the Group’s consolidated reserves in an amount of less than 0.5 million euros. Most of these instruments mature in 2014.
23. SEGMENT INFORMATION
23.1. Information by business group
The Group’s brands and trade names are organized into seven business groups. Five business groups – Christian Dior Couture, Wines and Spirits, Fashion and Leather Goods, Perfumes and Cosmetics, Watches and Jewelry – comprise brands dealing with the same category of products that use similar production and distribution processes, in addition to a specific management team. The Selective Retailing business group comprises the Group’s own-label retailing activities. Other activities and holding companies comprise brands and businesses that are not associated with any of the abovementioned business groups, most often relating to the Group’s new businesses and holding or real estate companies.
December 31, 2013 (6 months)
(EUR millions)
Christian
Dior
Couture
Wines
and
Spirits
Fashion and
Leather
Goods
Perfumes
and
Cosmetics
Watches
and
Jewelry
Selective
Retailing
Other and
holding
companies
Eliminations
and not
allocated(a)
TOTAL
Sales outside the Group 755 2 364 5 150 1 658 1 438 4 707 115 - 16 187
Intra-group sales 3 15 21 255 36 16 11 (357) -
TOTAL REVENUE 758 2 379 5 171 1 913 1 474 4 723 126 (357) 16 187
Profit from recurring operations 108 828 1 643 214 219 494 (116) 14 3 404
Other operating income and expenses - (6) (46) (6) (9) (1) (30) - (98)
Depreciation and amortization
expense43 57 237 70 74 141 21
- 643
Impairment expense - (1) 44 - - 6 2 - 51
Intangible assets and goodwill (b) 123 6 248 6 696 1 787 5 584 2 992 1 307 - 24 737
Property, plant and equipment 541 2 238 2 018 404 399 1 321 3 237 - 10 158
Inventories 235 4 253 1 388 356 1 136 1 449 159 (164) 8 812
Other operating assets 183 1 133 741 590 594 495 581 12 112 (c)
16 429
TOTAL ASSETS 1 082 13 872 10 843 3 137 7 713 6 257 5 284 11 948 60 136
Equity - - - - - - - 29 225 29 225
Liabilities 312 1 310 2 121 1 130 716 1 821 720 22 781 (d)
30 911
TOTAL LIABILITIES AND
EQUITY 312 1 310 2 121 1 130 716 1 821 720 52 006 60 136
Operating investments (e)
(162) (108) (326) (140) (94) (212) 32 - (1 010)
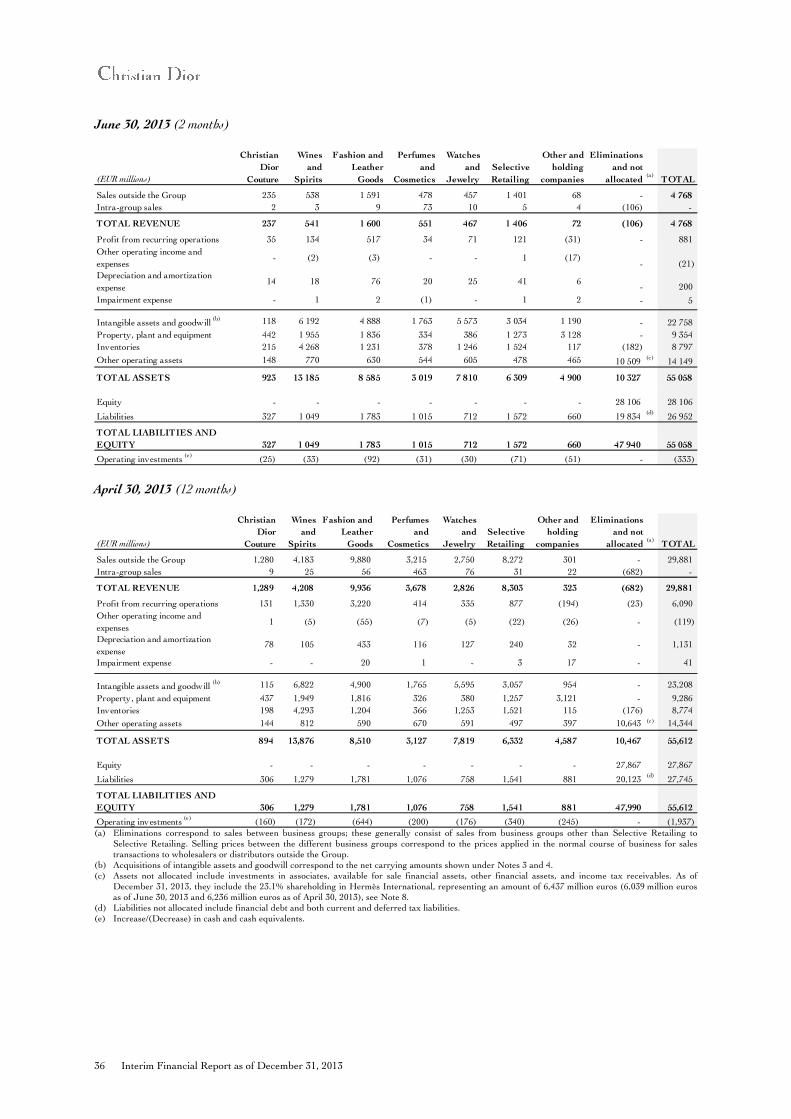
36 Interim Financial Report as of December 31, 2013
June 30, 2013 (2 months)
April 30, 2013 (12 months)
(a) Eliminations correspond to sales between business groups; these generally consist of sales from business groups other than Selective Retailing to Selective Retailing. Selling prices between the different business groups correspond to the prices applied in the normal course of business for sales transactions to wholesalers or distributors outside the Group.
(b) Acquisitions of intangible assets and goodwill correspond to the net carrying amounts shown under Notes 3 and 4. (c) Assets not allocated include investments in associates, available for sale financial assets, other financial assets, and income tax receivables. As of
December 31, 2013, they include the 23.1% shareholding in Hermès International, representing an amount of 6,437 million euros (6,039 million euros as of June 30, 2013 and 6,236 million euros as of April 30, 2013), see Note 8.
(d) Liabilities not allocated include financial debt and both current and deferred tax liabilities. (e) Increase/(Decrease) in cash and cash equivalents.
(EUR millions)
Christian
Dior
Couture
Wines
and
Spirits
Fashion and
Leather
Goods
Perfumes
and
Cosmetics
Watches
and
Jewelry
Selective
Retailing
Other and
holding
companies
Eliminations
and not
allocated(a)
TOTAL
Sales outside the Group 235 538 1 591 478 457 1 401 68 - 4 768
Intra-group sales 2 3 9 73 10 5 4 (106) -
TOTAL REVENUE 237 541 1 600 551 467 1 406 72 (106) 4 768
Profit from recurring operations 35 134 517 34 71 121 (31) - 881
Other operating income and
expenses- (2) (3) - - 1 (17)
- (21)
Depreciation and amortization
expense14 18 76 20 25 41 6
- 200
Impairment expense - 1 2 (1) - 1 2 - 5
Intangible assets and goodwill (b) 118 6 192 4 888 1 763 5 573 3 034 1 190 - 22 758
Property, plant and equipment 442 1 955 1 836 334 386 1 273 3 128 - 9 354
Inventories 215 4 268 1 231 378 1 246 1 524 117 (182) 8 797
Other operating assets 148 770 630 544 605 478 465 10 509 (c)
14 149
TOTAL ASSETS 923 13 185 8 585 3 019 7 810 6 309 4 900 10 327 55 058
Equity - - - - - - - 28 106 28 106
Liabilities 327 1 049 1 783 1 015 712 1 572 660 19 834 (d)
26 952
TOTAL LIABILITIES AND
EQUITY 327 1 049 1 783 1 015 712 1 572 660 47 940 55 058
Operating investments (e)
(25) (33) (92) (31) (30) (71) (51) - (333)
(EUR millions)
Christian
Dior
Couture
Wines
and
Spirits
Fashion and
Leather
Goods
Perfumes
and
Cosmetics
Watches
and
Jewelry
Selective
Retailing
Other and
holding
companies
Eliminations
and not
allocated(a)
TOTAL
Sales outside the Group 1,280 4,183 9,880 3,215 2,750 8,272 301 - 29,881
Intra-group sales 9 25 56 463 76 31 22 (682) -
TOTAL REVENUE 1,289 4,208 9,936 3,678 2,826 8,303 323 (682) 29,881
Profit from recurring operations 131 1,330 3,220 414 335 877 (194) (23) 6,090
Other operating income and
expenses1 (5) (55) (7) (5) (22) (26) - (119)
Depreciation and amortization
expense78 105 433 116 127 240 32 - 1,131
Impairment expense - - 20 1 - 3 17 - 41
Intangible assets and goodwill (b) 115 6,822 4,900 1,765 5,595 3,057 954 - 23,208
Property, plant and equipment 437 1,949 1,816 326 380 1,257 3,121 - 9,286
Inventories 198 4,293 1,204 366 1,253 1,521 115 (176) 8,774
Other operating assets 144 812 590 670 591 497 397 10,643 (c) 14,344
TOTAL ASSETS 894 13,876 8,510 3,127 7,819 6,332 4,587 10,467 55,612
Equity - - - - - - - 27,867 27,867
Liabilities 306 1,279 1,781 1,076 758 1,541 881 20,123(d)
27,745
TOTAL LIABILITIES AND
EQUITY 306 1,279 1,781 1,076 758 1,541 881 47,990 55,612
Operating investments (e)
(160) (172) (644) (200) (176) (340) (245) - (1,937)
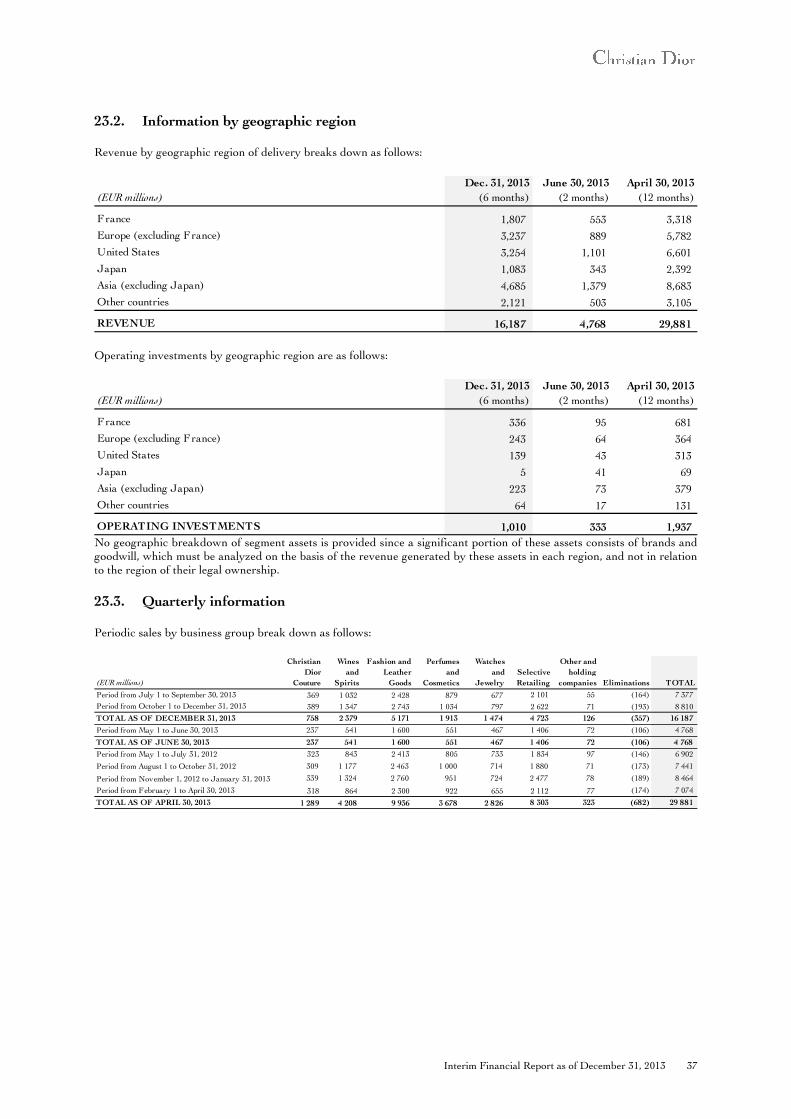
Interim Financial Report as of December 31, 2013 37
23.2. Information by geographic region
Revenue by geographic region of delivery breaks down as follows:
Operating investments by geographic region are as follows:
No geographic breakdown of segment assets is provided since a significant portion of these assets consists of brands and goodwill, which must be analyzed on the basis of the revenue generated by these assets in each region, and not in relation to the region of their legal ownership.
23.3. Quarterly information
Periodic sales by business group break down as follows:
(EUR millions)
Dec. 31, 2013
(6 months)
June 30, 2013
(2 months)
April 30, 2013
(12 months)
France 1,807 553 3,318
Europe (excluding France) 3,237 889 5,782
United States 3,254 1,101 6,601
Japan 1,083 343 2,392
Asia (excluding Japan) 4,685 1,379 8,683
Other countries 2,121 503 3,105
REVENUE 16,187 4,768 29,881
(EUR millions)
Dec. 31, 2013
(6 months)
June 30, 2013
(2 months)
April 30, 2013
(12 months)
France 336 95 681
Europe (excluding France) 243 64 364
United States 139 43 313
Japan 5 41 69
Asia (excluding Japan) 223 73 379
Other countries 64 17 131
OPERATING INVESTMENTS 1,010 333 1,937
(EUR millions)
Christian
Dior
Couture
Wines
and
Spirits
Fashion and
Leather
Goods
Perfumes
and
Cosmetics
Watches
and
Jewelry
Selective
Retailing
Other and
holding
companies Eliminations TOTAL
Period from July 1 to September 30, 2013 369 1 032 2 428 879 677 2 101 55 (164) 7 377
Period from October 1 to December 31, 2013 389 1 347 2 743 1 034 797 2 622 71 (193) 8 810
TOTAL AS OF DECEMBER 31, 2013 758 2 379 5 171 1 913 1 474 4 723 126 (357) 16 187
Period from May 1 to June 30, 2013 237 541 1 600 551 467 1 406 72 (106) 4 768
TOTAL AS OF JUNE 30, 2013 237 541 1 600 551 467 1 406 72 (106) 4 768
Period from May 1 to July 31, 2012 323 843 2 413 805 733 1 834 97 (146) 6 902
Period from August 1 to October 31, 2012 309 1 177 2 463 1 000 714 1 880 71 (173) 7 441
Period from November 1, 2012 to January 31, 2013 339 1 324 2 760 951 724 2 477 78 (189) 8 464
Period from February 1 to April 30, 2013 318 864 2 300 922 655 2 112 77 (174) 7 074
TOTAL AS OF APRIL 30, 2013 1 289 4 208 9 936 3 678 2 826 8 303 323 (682) 29 881
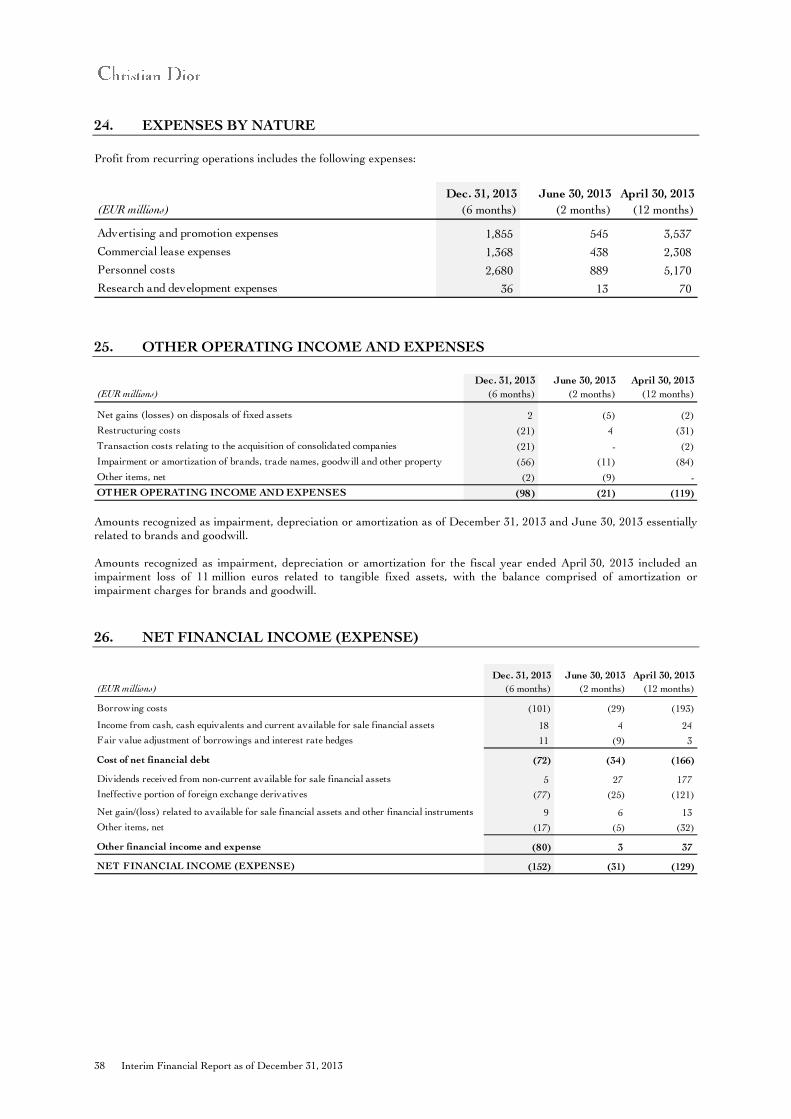
38 Interim Financial Report as of December 31, 2013
24. EXPENSES BY NATURE
Profit from recurring operations includes the following expenses:
25. OTHER OPERATING INCOME AND EXPENSES
Amounts recognized as impairment, depreciation or amortization as of December 31, 2013 and June 30, 2013 essentially related to brands and goodwill. Amounts recognized as impairment, depreciation or amortization for the fiscal year ended April 30, 2013 included an impairment loss of 11 million euros related to tangible fixed assets, with the balance comprised of amortization or impairment charges for brands and goodwill.
26. NET FINANCIAL INCOME (EXPENSE)
(EUR millions)
Dec. 31, 2013
(6 months)
June 30, 2013
(2 months)
April 30, 2013
(12 months)
Advertising and promotion expenses 1,855 545 3,537
Commercial lease expenses 1,368 438 2,308
Personnel costs 2,680 889 5,170
Research and development expenses 36 13 70
(EUR millions)
Dec. 31, 2013
(6 months)
June 30, 2013
(2 months)
April 30, 2013
(12 months)
Net gains (losses) on disposals of fixed assets 2 (5) (2)
Restructuring costs (21) 4 (31)
Transaction costs relating to the acquisition of consolidated companies (21) - (2)
Impairment or amortization of brands, trade names, goodwill and other property (56) (11) (84)
Other items, net (2) (9) -
OTHER OPERATING INCOME AND EXPENSES (98) (21) (119)
(EUR millions)
Dec. 31, 2013
(6 months)
June 30, 2013
(2 months)
April 30, 2013
(12 months)
Borrowing costs (101) (29) (193)
Income from cash, cash equivalents and current available for sale financial assets 18 4 24
Fair value adjustment of borrowings and interest rate hedges 11 (9) 3
Cost of net financial debt (72) (34) (166)
Dividends received from non-current available for sale financial assets 5 27 177
Ineffective portion of foreign exchange derivatives (77) (25) (121)
Net gain/(loss) related to available for sale financial assets and other financial instruments 9 6 13
Other items, net (17) (5) (32)
Other financial income and expense (80) 3 37
NET FINANCIAL INCOME (EXPENSE) (152) (31) (129)
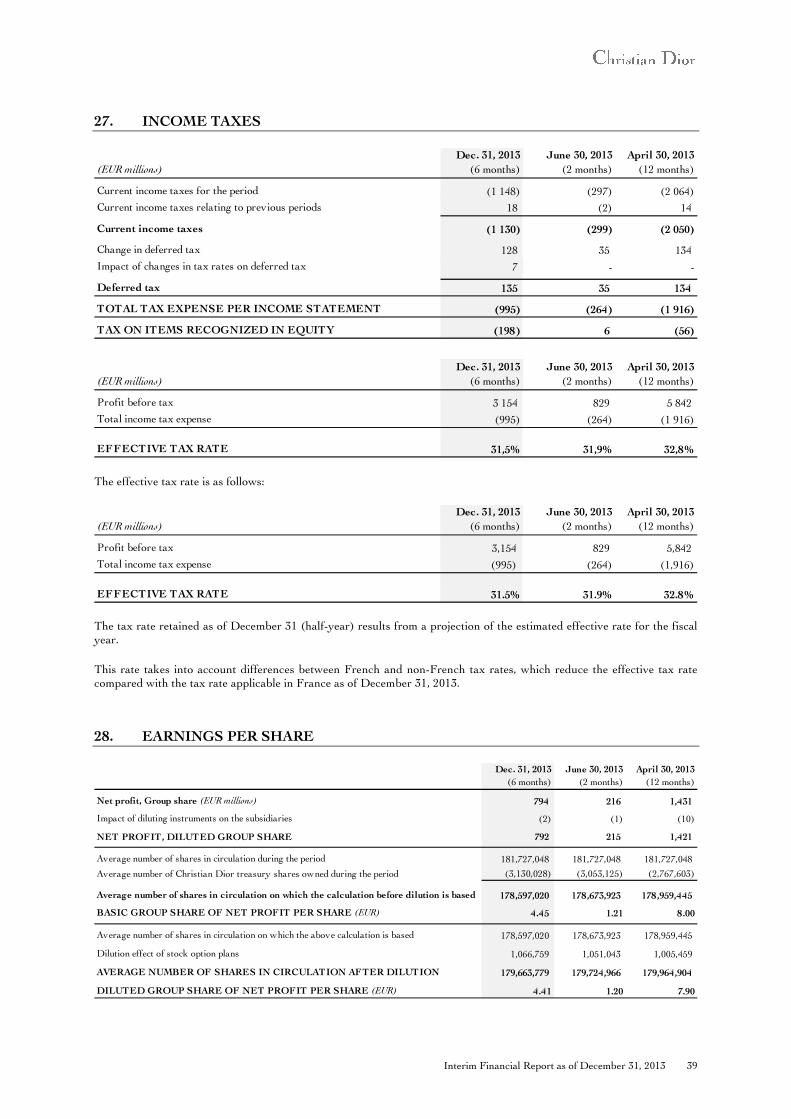
Interim Financial Report as of December 31, 2013 39
27. INCOME TAXES
The effective tax rate is as follows:
The tax rate retained as of December 31 (half-year) results from a projection of the estimated effective rate for the fiscal year.
This rate takes into account differences between French and non-French tax rates, which reduce the effective tax rate compared with the tax rate applicable in France as of December 31, 2013.
28. EARNINGS PER SHARE
(EUR millions)
Dec. 31, 2013
(6 months)
June 30, 2013
(2 months)
April 30, 2013
(12 months)
Current income taxes for the period (1 148) (297) (2 064)
Current income taxes relating to previous periods 18 (2) 14
Current income taxes (1 130) (299) (2 050)
Change in deferred tax 128 35 134
Impact of changes in tax rates on deferred tax 7 - -
Deferred tax 135 35 134
TOTAL TAX EXPENSE PER INCOME STATEMENT (995) (264) (1 916)
TAX ON ITEMS RECOGNIZED IN EQUITY (198) 6 (56)
(EUR millions)
Dec. 31, 2013
(6 months)
June 30, 2013
(2 months)
April 30, 2013
(12 months)
Profit before tax 3 154 829 5 842
Total income tax expense (995) (264) (1 916)
EFFECTIVE TAX RATE 31,5% 31,9% 32,8%
(EUR millions)
Dec. 31, 2013
(6 months)
June 30, 2013
(2 months)
April 30, 2013
(12 months)
Profit before tax 3,154 829 5,842
Total income tax expense (995) (264) (1,916)
EFFECTIVE TAX RATE 31.5% 31.9% 32.8%
Dec. 31, 2013
(6 months)
June 30, 2013
(2 months)
April 30, 2013
(12 months)
Net profit, Group share (EUR millions) 794 216 1,431
Impact of diluting instruments on the subsidiaries (2) (1) (10)
NET PROFIT, DILUTED GROUP SHARE 792 215 1,421
Average number of shares in circulation during the period 181,727,048 181,727,048 181,727,048
Average number of Christian Dior treasury shares owned during the period (3,130,028) (3,053,125) (2,767,603)
Average number of shares in circulation on which the calculation before dilution is based 178,597,020 178,673,923 178,959,445
BASIC GROUP SHARE OF NET PROFIT PER SHARE (EUR) 4.45 1.21 8.00
Average number of shares in circulation on which the above calculation is based 178,597,020 178,673,923 178,959,445
Dilution effect of stock option plans 1,066,759 1,051,043 1,005,459
AVERAGE NUMBER OF SHARES IN CIRCULATION AFTER DILUTION 179,663,779 179,724,966 179,964,904
DILUTED GROUP SHARE OF NET PROFIT PER SHARE (EUR) 4.41 1.20 7.90
40 Interim Financial Report as of December 31, 2013
29. OFF-BALANCE SHEET COMMITMENTS
During the six-month period, the Group’s off-balance sheet commitments increased essentially as a result of commitments given for operating leases and concessions, which increased by approximately 600 million euros.
30. CONTINGENT LIABILITIES AND OUTSTANDING LITIGATION
As part of its day-to-day management, the Group is party to various legal proceedings concerning brand rights, the protection of intellectual property rights, the set-up of selective retailing networks, licensing agreements, employee relations, tax audits and other areas relating to its business. The Group believes that the provisions recorded in the balance sheet in respect of these risks, litigation or disputes, known or outstanding at fiscal year-end, are sufficient to avoid its consolidated financial net worth being materially impacted in the event of an unfavorable outcome.
No significant changes occurred in the first half of fiscal year 2013/2014 with regard to litigation to which the Group is party.
31. SUBSEQUENT EVENTS
No significant events occurred between December 31, 2013 and the date on which the financial statements were approved for publication by the Board of Directors, February 13, 2014.
Interim Financial Report as of December 31, 2013 41
Statutory Auditors’ report on the half-year financial information from July 1 to December 31, 2013
MAZARS Tour Exaltis
61, rue Henri-Regnault F-92400 Courbevoie – Paris-La Défense 1 S.A. with share capital of 8,320,000 euros
Statutory Auditors Member of the
compagnie régionale de Versailles
ERNST & YOUNG et Autres 1/2, place des Saisons
F-92400 Courbevoie – Paris-La Défense 1 S.A.S. with variable share capital
Statutory Auditors Member of the
compagnie régionale de Versailles
To the Shareholders,
In compliance with the assignment entrusted to us by your Shareholders’ Meeting and in accordance with the Article L. 451-1-2 III of the French Monetary and Financial Code (Code monétaire et financier), we hereby report to you on:
• the limited review of the accompanying condensed consolidated half-year financial statements of Christian Dior, for the period from July 1 to December 31, 2013;
• the verification of the information contained in the interim management report.
These condensed consolidated half-year financial statements were prepared under the responsibility of the Board of Directors. Our role is to express our conclusion on these financial statements based on our limited review.
1. Conclusion on the financial statements
We conducted our review in accordance with the professional standards applicable in France. A limited review essentially consists of making inquiries, primarily of members of management responsible for financial and accounting matters, and applying analytical procedures. This work is less extensive than that required for an audit conducted in accordance with the professional standards applicable in France. Therefore, the level of assurance obtained from a limited review that the financial statements, taken as a whole, are free from significant anomalies, is lower than that obtained from an audit.
Based on our limited review, we did not note any significant anomalies that may have called into question the compliance of the condensed consolidated half-year financial statements with IAS 34 – IFRS as adopted by the European Union applicable to half-year financial information.
2. Specific verification
We have also verified the information provided in the interim management report in respect of the condensed consolidated half-year financial statements that were covered by our limited review.
We have no matters to report on the fairness and consistency of this information with the condensed consolidated half-year financial statements.
Paris-La Défense, February 27, 2014
The Statutory Auditors
MAZARS
Denis Grison
ERNST & YOUNG et Autres
Jeanne Boillet Benoit Schumacher
This is a free translation into English of the Statutory Auditors’ report issued in French and is provided solely for the convenience of English-speaking users.
This report should be read in conjunction with, and construed in accordance with, French law and professional standards applicable in France.
42 Interim Financial Report as of December 31, 2013
Statement of the Company Officer responsible for the Interim Financial Report
We declare that, to the best of our knowledge, the condensed consolidated half-year financial statements have been prepared in accordance with applicable accounting standards and provide a true and fair view of the assets, liabilities, financial position and profit or loss of the Company and of all consolidated companies, and that the interim management report presented on page 3 gives a true and fair picture of the significant events during the first six months of the fiscal year and their impact on the financial statements, of the main related party transactions as well as a description of the main risks and uncertainties for the remaining six months of the fiscal year.
Paris, February 27, 2014
Under delegation from the Chief Executive Officer
Florian Ollivier Chief Financial Officer

Interim Financial Report as of December 31, 2013 43

44 Interim Financial Report as of December 31, 2013