Embed Size (px)
Citation preview

Dimensions of Politics in the European Parliament
Simon Hix, London School of Economics and Political Science
Abdul Noury, Université Libre de Bruxelles
Gérard Roland, University of California, Berkeley and CEPR
Abstract
We investigate the dimensionality of politics in the European Parliament by applying a scaling
method to all roll-call votes between 1979 and 2001 in the European Parliament. Contrary to
most existing studies using these methods, we are able to interpret the substantive content of the
observed dimensions using exogenous measures of national party policy positions. We find that
the main dimension of politics in the EU’s only elected institution is the classic left-right
dimension found in domestic politics. A second dimension is also present, although to a lesser
extent, which captures government-opposition conflicts as well as party positions on European
integration.
Acknowledgements
Earlier versions of this paper were presentation at Stanford University, Trinity College Dublin, Amsterdam University, UC Berkeley, UCLA, UC San Diego, and the 2003 conference of the European Consortium for Political Research. We would like to thank Matthew Gabel, Simon Jackman, Simon Hug and Howard Rosenthal for helpful comments.

1
1. Introduction
In less than twenty years the European Parliament has evolved from a consultative body into the
most powerful inter-state assembly in history. The European Parliament now has equal
legislative power with the governments in many key areas, can amend many lines in the
European Union (EU) budget, can veto the governments’ nominee for Commission President,
and can sack the Commission. Nevertheless, outside a small group of experts, the only directly
elected European body remains relatively unknown.
Politics in the EU is different from traditional politics in democratic countries for several
reasons. First, the EU is still more a supranational institution than a federal state. Second, there
is considerable heterogeneity between the cultures, histories, economic conditions and national
institutions of member states. Therefore, politics in the EU is likely to be more complex and
multi-dimensional than national politics. Understanding the dimensionality of politics in the
European Parliament should thus be an important step forward in understanding both the politics
of the EU as well as how politics in other inter-state assemblies may develop.1
One of the main ways of understanding politics inside legislative institutions is to
investigate the shape of the policy space. The number of policy dimensions and the location of
actors on these dimensions determine inter alia which actors are pivotal, the size of the winset,
and hence the possibility and direction of policy change (e.g. Tsebelis, 2002). Not surprisingly, a
fast growing area of political science research in recent years has been the estimation of actors’
ideal points. This has taken a variety of forms and methods, such as scaling of roll-call voting
data (Poole and Rosenthal, 1985; Poole and Rosenthal, 1997 Heckman and Snyder, 1997; Poole,
1 Similar in spirit to what we are doing is the work by Voeten (2000) on the United Nations. Note that the European Parliament has considerably more formal legislative power than the UN General Assembly.

2
2000), hand coding of party manifestos (Budge et al., 2001), surveys of experts’ opinions of
parties’ positions (Laver and Hunt, 1992; Huber and Inglehart, 1995), or computer coding of
political statements (Laver, 2001; Laver, Benoit and Garry, 2003). The collection and
dissemination of these spatial data has transformed several areas of political science and given
them a stronger scientific empirical content.
The European Parliament is an especially interesting object of analysis because of its
unique features. The European legislators are members of national parties but also of European
party groups. Moreover, electoral districts do not transcend national borders, which means that
Members of the European Parliament (MEPs) also represent their country. A legislature with
such characteristics is potentially one with high dimensionality.
A first dimension that comes to mind is support or opposition to further European
integration, a topic that has been the focus of much the literature on the EU (Tsebelis and Garrett,
2001; Marks and Steenbergen, 2002). In this interpretation of EU politics, actors prefer ‘more’ or
‘less’ European integration: with states like the Benelux more pro-European and states like the
United Kingdom more anti-European. The European Parliament is generally seen as a unitary
actor on the pro-European side. However, given that national politicians and national parties are
represented in the European Parliament, the EU integration dimension might also play an
important role in voting in this institution.
However, it has also been argued that as the EU increasingly makes policies in traditional
areas of domestic politics – such as market regulation, social and environmental policies, and
justice and interior affairs – we should expect a ‘left-right’ dimension to emerge in EU politics.
There is dispute, however, as to whether the pro-/anti-Europe conflict will remain orthogonal to a
general left-right dimension (Hix, 1999), will merge with the economic left-right dimension

3
(Hooghe and Marks, 1999; Tsebelis and Garrett, 2000), or will be subsumed within the ‘social’ or
libertarian-authoritarian version of the left-right (Hooghe et al., 2002).
The existence of both an EU integration and a left-right dimension has been confirmed at
the empirical level, in the positions national parties take on Europe (Marks et al., 2001;
Aspinwall, 2002), in the European party federations’ election manifestos (Hix, 1999; Gabel and
Hix, 2002), and in mass attitudes towards the EU (Gabel and Anderson, 2002). These two
dimensions have also been observed in initial research on the policy space inside the European
Parliament (Kreppel and Tsebelis, 1999; Hix, 2001; Noury, 2002) and the EU Council (Mattila
and Lane, 2001; Mattila, 2004). However, existing research on the European Parliament has not
investigated the full history of voting in the parliament since the first direct elections in 1979. As
a result, any change in the number and content of dimensions over time has remained
undocumented. Indeed, the European Parliament is an evolving legislative institution.
Consequently, one may expect some variation in the number and content of dimensions.
We consequently describe the policy space inside the European Parliament by applying an
established scaling method, Poole and Rosenthal’s (1997) NOMINATE algorithm, to all roll-call
votes between 1979 and 2001 – over 12,000 votes by more than 2,000 MEPs. This method
provides not only a measure of the dimensionality of the policy space, but also ideal point
estimates on each policy dimension for every MEP since 1979. One weakness of this and similar
inductive scaling methods is that the identification of the substantive meaning of the dimensions
requires post hoc subjective interpretation. This is usually done by mapping vote divisions that
split members orthogonally to the dimension of interest. Unfortunately, one cannot rely on
existing techniques to confirm these heuristic interpretations. In this paper we seek to overcome
this weakness of inductive scaling methods by explaining the substantive content of the observed
dimensions through exogenous measures of actors’ policy positions, including expert judgments

4
of party placements and the coding of party manifestos. Our regression analysis enables us to
understand what the dimensions of politics actually represent, and what changes in the content of
the dimensions have occurred over time. This use of exogenous measures of actors’ positions is
novel and clearly more reliable.
We find one main dimension of politics in the European Parliament. This dimension is
the classic left-right dimension of democratic politics. A second dimension is also present,
although to a lesser extent. This dimension can be interpreted as the pro-/anti-Europe dimension.
But, closer analysis reveals that the second dimension also captures inter-institutional conflicts
between the political groups and national parties in the parliament and the parties in
‘government’ in the EU Council and Commission. Our analysis is robust to the use of other
scaling methods.
The rest of the paper is organized as follows. Section two provides some background
information on the European Parliament. Section three presents the results of the NOMINATE
algorithm for the five elected parliaments since 1979. Section four presents the substantive
interpretation of the dimensions revealed by this scaling method, using regression analysis.
Section five concludes.
2. Parties and Politics in the European Parliament
Existing research on the European Parliament suggests that national parties are the primary
principals of the Members of the European Parliament (e.g. Hix and Lord, 1997; Raunio, 1997;
Kreppel and Tsebelis, 1999; Kreppel, 2001; Hix, 2002). National parties control the selection of
candidates in European Parliament elections. European elections are fought mainly as separate

5
national, rather than European-wide, electoral contests (van der Eijk and Franklin, 1996). Once
inside the European Parliament, national parties decide which European Parliamentary political
group ‘their’ MEPs will belong to, which key committee positions and parliamentary offices their
MEPs will seek, and which of their MEPs will get these positions.
However, once a national party’s ‘delegation’ has joined a political group, these MEPs
face pressures from another principal: the leadership of the European political group. The
political groups are the key agenda-setters in the European Parliament. They control the
allocation of committee positions, finances, speaking time and the space on the legislative
agenda. The leadership of each political group also controls the allocation of committee positions
and resources between the national party delegations within the European party. The political
groups issue voting instructions to their members, and employ ‘whips’ to ensure that their MEPs
and national parties ‘toe the European party line’.
Nevertheless, the transnational parties are ultimately a product of national parties, who
created and sustain the transnational parties to serve their own policy goals in the European
Parliament. Without a government to support, that can threaten to dissolve the parliament and
force new elections, the incentives for collective party organization in the European Parliament
are weaker than in domestic parliaments (e.g. Huber, 1996; Diermeier and Feddersen, 1998).
Nevertheless, transnational parties in the European Parliament help national parties and MEPs
structure their behavior in much the same way as parties do in the US Congress (cf. Cox and
McCubbins, 1993, and Kiewiet and McCubbins, 1997). Each national party is unlikely to obtain
its policy objectives by acting alone. National parties could negotiate coalitions vote-by-vote.
However, this would be costly in terms of time, and hard to enforce. As a result, national parties
who expect to have similar preferences on a range of future policy issues can reduce the
transaction costs of coalition-formation by establishing a transnational party organization. This

6
party organization constitutes a division-of-labor contract where ‘backbench’ MEPs provide
labor and capital (working out the position of the party and gathering information on the issues
on which they become specialized), and political group ‘leaders’ distribute committee and party
offices, communicate party positions and enforce the terms of the party organization contract.
TABLE 1 ABOUT HERE
Table 1 shows the political parties in the European Parliament and their strengths after
each of the five European elections. As the table shows, most MEPs have been members of
political groups that are genuinely ‘transnational’, with members from most of the EU member
states. These transnational parties broadly represent the policy positions of one of the classic
European ‘party families’. However, throughout the history of the parliament, particular national
parties have deliberately chosen to sit separately from these transnational parties, and to form
what can be described as nationally-dominated groups: such as the groups that have been
dominated by the French Gaullists, the British Conservatives, or the Italian Communists. The
existence of these groups has declined over time. Most of the member parties from these groups
have chosen to join one or other of the larger political groups as the main political groups have
strategically altered the parliament’s Rules of Procedure to make it more difficult for nationally-
based groups to be formed. Nevertheless, the existence of both transnational and national groups
suggests some interesting characteristics about politics in the European Parliament.
First, the fact that most national parties have decided to join transnational political groups
suggests that these aggregate agents expect that on most issues on the EU agenda their policy
preferences will be closer to parties from the same party family from other member states than to
parties from a different party family from their own member state. For example, the French and

7
Swedish Socialists expect to be closer on most issues than they will be to the French and Swedish
Conservatives, respectively. If the opposite were the case, the French Socialists would have an
incentive to form a transnational party organization with the French Conservatives, and likewise
for the Swedish Socialists and Conservatives.
In other words, the predominance of party-based rather than national-based groups in the
European Parliament suggests that the main observable dimension of conflict in the European
Parliament should correlate with the dimension that distinguishes the European party families
from each other in domestic politics: the left-right dimension, in its socio-economic (intervention-
free market) as well as socio-political (liberty-authority) versions.
Second, national parties who established their own political groups expect that their
policy positions will be sufficiently different from any of the transnational political groups to
make it too costly to join any of these organizations. Hence, despite the expected dominance of
party-family based divisions, at least some national parties in the European Parliament expect
issues to split representatives along national rather than transnational lines.
So, the existence of some non-transnational groups in the history of the European
Parliament, and the fact that national political parties remain the primary principals for the MEPs,
suggests that we should also observe national conflicts on issues which are salient to particular
member states, when some of the parties from these states can be expected to vote together rather
than to follow the instructions of their transnational parties.
Existing studies of roll-call voting in the European Parliament find that MEPs are more
likely to vote along transnational party lines than national lines (Attinà, 1990; Brzinski, 1995;
Raunio, 1997; and Hix and Lord, 1997). Also, existing applications of scaling methods to voting
in the European Parliament suggest that the main dimension of conflict is the left-right (Kreppel
and Tsebelis, 1999; Hix, 2001; Noury, 2002; Noury and Roland, 2002). However, these results

8
are derived from samples of votes in particular periods and there are no studies of the evolution
of the conflicts and the relative location of parties and MEPs over time.
It is also worth mentioning the place of the European Parliament in the EU’s legislative
process. The European Commission has exclusive rights to initiate legislative proposals.
However, given the high voting hurdle in the Council (unanimity or a qualified-majority), the
Commission rarely initiates proposals that are not expected to win approval in the Council
(Tsebelis, 1994, 2002). The role of the European Parliament has usually been more passive than
that of the Council. The European Parliament has a lower voting hurdle (mostly simple majority)
and its role was mostly consultative in the early years. The European Parliament therefore had no
real agenda-setting powers. However, reforms of the EU treaties have given the parliament
increased powers to shape the content of legislation.
3. Establishing the Dimensions of Politics in the European Parliament
There are three types of votes in the European Parliament. In the first two types, the ‘show of
hands vote’ and the ‘electronic vote’, how each MEP votes is not recorded. In the third type,
‘roll-call votes’, how each MEP votes (Yes, No, or Abstain) is published in the parliament’s
official minutes. Only certain votes are required to be taken by roll-call, but a political group or
at least thirty-two MEPs can request any vote to be taken by roll-call. Roll-call votes represent
approximately one-third of all votes in the European Parliament and there is evidence that roll-
calls have been held on some issues more than others, at least in the fifth parliament (Carrubba et
al., 2004). Nevertheless, studying roll-call voting behavior allows us to understand how MEPs
vote when votes are held in public. It is worth noting that the number of roll-call votes has

9
increased as the powers of the parliament have increased: from 886 in the first directly-elected
parliament (1979-1984) to 3,739 votes in the fourth parliament (1994-1999), and 2,124 in the first
half of the fifth parliament (July 1999 to December 2001).
We collected and coded all roll-call votes in the European Parliament from the first
plenary session after the first direct elections, in July 1979, to the last plenary session in the first
half of fifth elected parliament, in December 2001. We then applied a standard method for
extracting ideal point estimates from individual vote decisions in roll-calls: the NOMINATE
scaling method (Poole and Rosenthal, 1997: 233-251). This method has been applied with great
success to the U.S. Congress (ibid.), and has recently begun to be applied to other voting
environments with multiple players and multiple decisions, such as the United Nations (Voeten,
2000) and other parliaments (e.g. Rosenthal and Voeten, 2004; Schonhardt-Bailey, 2003).
We include all Members of the European Parliament in this analysis. The number of
MEPs in each parliament changes because the European Parliament expanded from 410 members
in 1979 to 626 members in 1999 with the enlargement of the EU from ten to fifteen member
states in this period. The number of MEPs we can estimate also varies as some parliaments had a
higher replacement rate of sitting members than others. In addition, following the standard
practice in the scaling of legislative votes, we discarded MEPs who voted in fewer than ten roll-
call votes in a given parliament and dropped votes where more than 97 percent of MEPs voted
together. The number of MEPs discarded using this method was actually rather small (ranging
from 9 percent of the 548 MEPs who were present at one time or another in the first parliament to
less than 1 percent of the MEPs in the fourth parliament) and these discarded MEPs did not
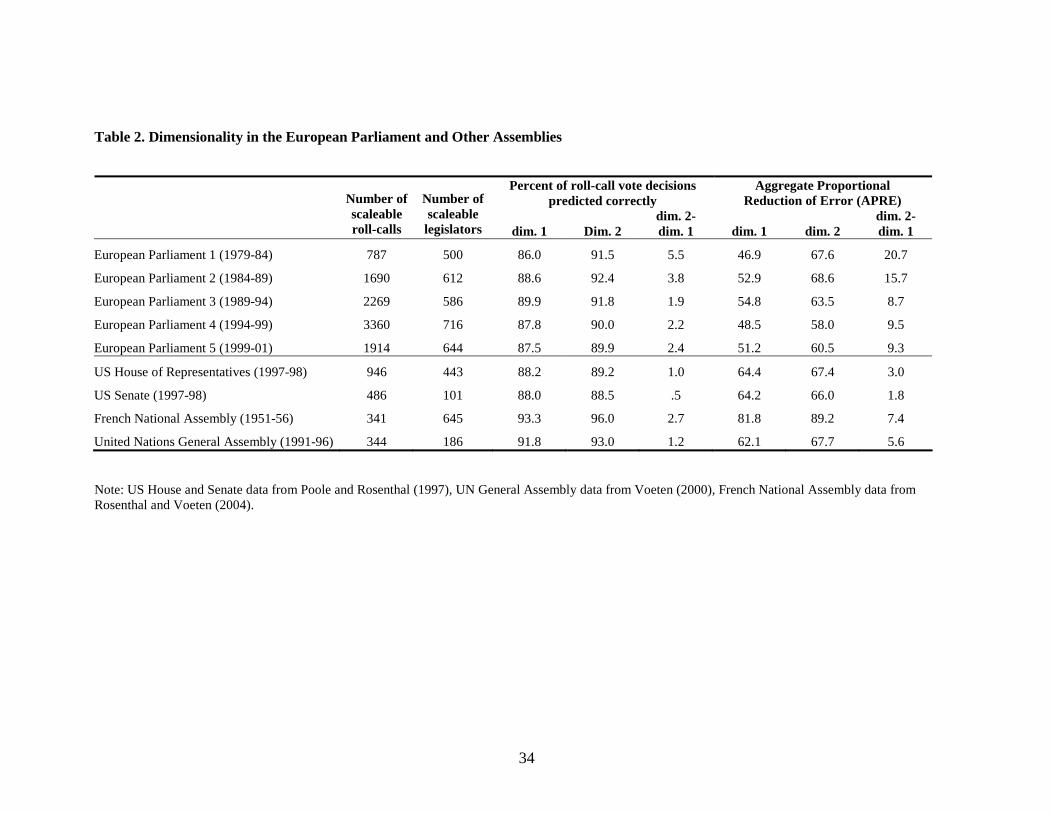
belong to any particular member state or political group. Table 2 lists the number of scaleable
roll-call votes and legislators we were able to estimate in each European Parliament.
10
TABLE 2 ABOUT HERE
Table 2 also compares two goodness-of-fit measures of applying NOMINATE to the
European Parliament with other assemblies. The first measure is the percentage of roll-call vote
decisions correctly predicted by the set of legislator locations on the first and second dimensions.
The second measure is the aggregate proportional reduction in error, which indicates how much
the spatial model improves on a naïve benchmark model, such as everybody voting the same way
in each vote. The first thing to note from these findings is that NOMINATE produces one main
dimension of voting in all these cases. Nevertheless, we find that voting in the European
Parliament is more multidimensional than in other parliaments. This can be seen from the
magnitude of the goodness-of-fit statistics for the second dimension in the European Parliament
compared to the other parliaments. The results also reveal, though, that voting in the European
Parliament has become increasingly one-dimensional.
Figures 1a to 1e show the ‘maps’ produced by NOMINATE, where each dot represents
the estimated location of each MEP on the first two dimensions. Before interpreting these
figures, it is worth bearing in mind that what this scaling method does is ‘discover’ the main
orthogonal dimensions of voting behavior. This method does not provide any substantive
meaning of these dimensions. In fact, as with other scaling techniques, the dimensions
discovered by NOMINATE might capture a mix of underlying issue-based or interest-based
dimensions of conflict.
FIGURES 1a-1e ABOUT HERE

11
The location of the political groups in these figures nevertheless suggests that the two
dimensions of politics in the European Parliament are the left-right and pro-/anti-Europe
dimensions. On the first dimension, in all five parliaments the parties are ordered from left to
right exactly as one would expect with only a cursory knowledge of party politics in Europe: with
the Radical Left and Greens on the furthest left, then the Socialists on the center-left, the Liberals
in the center, the European People’s Party on the center-right, the British Conservatives and allies
and French Gaullists and allies to the right of the European People’s Party, the Extreme Right on
the furthest right, and the Anti-Europeans divided between some MEPs on the extreme left and
some on the extreme right. Also, the figures suggest that the second dimension may be related to
party positions on European integration, with the main pro-European parties (the Socialists,
Liberals and European People’s Party) at the top of the figures, and the main anti-European
parties (the Radical Left, Greens, Gaullists, Extreme Right and Anti-Europeans) at the bottom.
Interestingly, the British Conservatives, who changed position dramatically on the
question of Europe, move from the top of the second dimension in the first and second
parliaments to near the bottom of this dimension in the fifth parliament – as the outlying group of
MEPs in the European People’s Party in the bottom right hand corner of Figure 1e.
These maps also confirm the two main trends in voting behavior in the European
Parliament since 1979 revealed using other methods (e.g. Hix et al., 2005). First, all the political
groups have become more cohesive, as illustrated by the declining dispersion of the positions of
the MEPs in each political group across the five parliaments. In Hix et al. (2005), we had shown,
using forms of agreement indices, that cohesion of European party groups had increased despite
an increase in the ideological diversity among the national parties forming the European party
groups. Second, in terms of the structure of the party system, there is a clear difference between
the first three parliaments and the fourth and fifth parliaments. In the first three parliaments, the

12
party system was split into two blocs: a left bloc (of Socialists, Radical Left and Greens), against
a right bloc (of the European People’s Party, Liberals, French Gaullists and allies, and British
Conservatives and allies). However, the fourth and fifth parliaments reveal a different party
system. In this new system, the Liberals occupy a position between the Socialists and European
People’s Party.
4. Explaining the Dimensions of Politics in the European Parliament
4.1. Variables
Table 3 shows the correlations between the positions on the two dimensions of the individual
MEPs who served in consecutive parliaments. What we observe is that correlations are very high
for the first dimension and somewhat lower, although still high, for the second dimension. The
stability of these dimensions over time suggests that the dimensions capture some substantive
aspects of politics in the European Parliament. Note that the correlation coefficients are higher
than Poole and Rosenthal (1997) report for the US Congress. These coefficients are especially
high considering that the European Parliament has a five-year term whereas the US Congress has
a two-year term.
TABLE 3 ABOUT HERE
To interpret the substantive content of the dimensions we use a series of statistical models
to explain the location of MEPs as a function of exogenous national party positions and other
factors. We define the dependent variables as the mean position of each national party’s group of

13
MEPs on each dimension in each parliament. That is, we treat each national party’s delegation of
MEPs in each parliament as a separate observation. We use national parties as the unit of
analysis for two reasons. First, exogenous measures of policy positions of actors in the European
Parliament only exist for national parties. No comparable measure of the policy preferences of
individual MEPs exist for all five parliaments. Second, as we explained above, national parties
are the main aggregate actors in the European Parliament below the level of the transnational
political groups, and have a powerful influence on the behavior of their MEPs. Individual voting
behavior will thus strongly be determined by national party positions. Despite this aggregation,
we still have enough data to perform a meaningful and serious econometric analysis. There were
57 national parties in the first directly-elected parliament (1979-1984), 73 in the second
parliament, 85 in the third, 103 in the fourth, and 119 in the fifth. Consequently, we have 437
observations in the pooled analysis. However, we do lose a number of observations as a result of
missing data on national party policy positions.
We have three types of independent variables. First, as policy variables, we use
exogenous measures of national party positions on the left-right axis and on the pro-/anti-Europe
axis. We test the hypothesis that the policy space in the European Parliament combines these two
underlying policy dimensions. We use the two most widely applied exogenous measures of
national party positions: from expert judgments of party locations, and from the content analysis
of party manifestos. Both these measures are fully exogenous and therefore lead us to an
independent interpretation of the policy dimensions rather than a purely subjective interpretation.
We use these two measures as complements, since neither method is perfect. The expert
judgments data for party locations before the 1990s are based on retrospective evaluations of
party positions. Meanwhile, the party manifestos-based measures of party positions on EU

14
integration are potentially unreliable because of the small proportion of each manifesto dedicated
to this issue.
The expert judgments data are taken from Marks and Steenbergen’s (2004) dataset of
party positions in 1984, 1988, 1992, 1996, and 1999. These five time-points correspond broadly
with each of the five directly-elected European Parliaments, and so allow us to have parliament
by parliament external measures of party positions. We call these variables Left-Right (Exp) and
EU Integration (Exp).
The party manifestos measures are taken from the Manifestos Research Group dataset.
We use the standard EU integration measure in the dataset, where the percent of statements in
each manifesto that are ‘anti’ European are substracted from the percent of statements that are
‘pro’ European. We use three measures of left-right positions that have been constructed by
Budge et al. (2001): the general left-right scale from the dataset, which combines manifesto
statements on economic as well as social issues (Combined Left-Right (Man)); the scale
constructed from party positions on social issues, such as environmental protection, gender
equality, abortion, gay rights, and peace (Social Left-Right (Man)); and the scale constructed
from party positions on unemployment, public spending, and state intervention in the economy
(Economic Left-Right (Man)). By separating the combined left-right into these two sub-
dimensions, we can test the claims about how economic preferences and social preferences shape
EU politics. Since elections are held in most EU member states every four or five years, we have
independent observations of the manifesto positions of almost all national parties in each of the
five directly-elected parliaments.
We expect exogenous left-right policy positions to explain national party ideal point
estimates on the first dimension, and exogenous pro-/anti-EU policy positions to explain national

15
party ideal point estimates on the second dimension regardless of whether these measures are
based on expert judgments of party positions or the coding of party manifestos.
Second, to capture the effect of government-opposition dynamics at the national and
European levels, we use two measures: (1) whether a national party was in government during
the relevant parliament (which takes the value 1 if the national party was in government for a
majority of the period and 0 otherwise), and (2) whether a national party had a European
Commissioner during the relevant parliament (which takes the value 1 if the national party had a
Commissioner for the whole period of the parliament, .5 if the national party had a Commissioner
for approximately half of the period of the parliament, and 0 otherwise). Following our theory,
we expect these variables to be significant on the second dimension but not on the first.
Third, to examine whether policy positions and government-opposition dynamics explain
differences in voting not only between but also within the political groups, we estimate separate
models with dummy variables for each political group. Likewise, we introduce dummy variables
for each EU country, to analyze whether member state affiliation influences voting in the
European Parliament. Descriptive statistics for all the variables are reported in Table A1 in the
Appendix.
We first assume that there is no change in the content of the dimensions over time and
perform a pooled analysis. The advantage of the pooled analysis is that by having a large number
of observations the estimates of the relationships are more precise. In the pooled analysis we
introduce dummy variables for each parliament (except the first) as control variables. We then
perform parliament by parliament analysis. This allows us to investigate whether the content of
the dimensions has changed over time.
4.2. Results

16
Table 4 shows the results from the pooled analysis for the first dimension. Five noteworthy
findings need to be emphasized. First, as observed in the maps of the parliaments, MEP locations
on the first dimension are explained by left-right policy positions. To evaluate the substantive
effect of left-right policies on this dimension, it is useful to calculate standardized beta
coefficients. The results show that a one standard deviation change along the left-right dimension
(as measured by expert judgments) corresponds with a 78 percent standard deviation change on
the first dimension.2 The relationship between left-right positions and locations on the first
dimension hold regardless of whether left-right positions are measured using expert judgments or
party manifestos data. Moreover, economic as well as social aspects of the left-right dimension
are significant. In other words, the main observed dimension of voting in the European
Parliament is the same as the main dimension of domestic politics in Europe.
TABLE 4 ABOUT HERE
Second, the left-right variable remains highly significant after the inclusion of party
dummy variables. This indicates that left-right policy positions also explain variations in MEP
positions within political groups. In other words, a national party that has a policy position to the
left of the average member of a political group will be revealed to vote slightly to the left of the
average member of this group. Whereas difference between the political groups can be observed
from the spatial maps, these differences within the EU political groups cannot be observed in the
spatial maps but are clearly shown in the statistical results.
2 Using the results in model 1 in Table 4.

17
Third, EU party policies and participation in government are only significant without
party dummies. This means that once one controls for party positions these variables are not
relevant explanatory factors on the first dimension.
Fourth, the magnitude of the coefficients on the political group variables confirms the
intuition from the spatial figures: with the most left-wing parties having the lowest coefficients
and the most right-wing parties having the highest coefficients.
Fifth, country dummies are generally not significant on the first dimension. Voting in the
European Parliament is not driven by national interest.
Turning to the second dimension in Table 5, the main result emerging is that participation
in government is always significant, regardless of the specification. More precisely, parties in
government and who have Commissioners are located towards the ‘top’ of the second dimension.
For example, as the spatial maps show, the Socialists and European People’s Party, who contain
most of the main parties of government and have most of the EU Commissioners, are towards the
top of the figure. The results in models 4-9 (with European party dummies) also show that
participation in government explains positions on the second dimension within the political
groups. Again, this result is not clear from the spatial maps alone.
TABLE 5 ABOUT HERE
The other main result is that the policy content of the second dimension is less clear than
for the first dimension. EU policy positions and left-right positions, as measured by expert
judgments, are significant in all specifications. However, the relationship between EU policy
positions and location on the second dimension is stronger than the relationship between left-right
dimensions and location on this dimension. More precisely, a one standard deviation change

18
along the EU integration dimension (as measured by expert judgments) corresponds with a 37
percent standard deviation change on the second dimension, whereas a one standard deviation
change on the left-right dimension only corresponds with a 13 percent standard deviation change
on this dimension.3 Note that EU policy positions, as measured by the party manifestos, are not
significant in any specification. Moreover, the social and economic measures of left-right are not
significant in any specification.
Third, as with the first dimension, a large proportion of the variance is explained by the
location of the political groups. The magnitude of these coefficients explains their location on
the second dimension: with the most pro-European political groups having the most positive
coefficients, and the most anti-European political groups having the most negative coefficients.
One exception is the Liberal group, which has historically been very pro-European, yet has a
negative coefficient because this group has had lower scores on this dimension than the Socialists
and European People’s Party. Nevertheless, the Liberals are closer to the two largest parties on
this dimension than are the other small parties, except the British Conservatives. The British
Conservatives, however, have a positive coefficient because they were relatively pro-European in
the first and second parliaments when they were a separate political group.
Fourth, member state variables are not significant on the second dimension. In other
words, there are no clear and consistent patterns of voting along national lines on the second
dimension.
TABLE 6 ABOUT HERE
3 Using the results in model 1 in Table 5.

19
These results also hold when we analyze our data parliament by parliament, as Table 6
shows. Here, we use the expert judgements data rather than the party manifesto data as they give
a better fit. The first dimension is explained by left-right policy positions in all parliaments both
with and without political group dummy variables. Regarding the second dimension, the
parliament by parliament results reveal that this dimension is less consistently related to a single
set of policy preferences or institutional interests. The government participation variable is for
example only significant in the fourth parliament on this dimension. This is in part due to the
small number of observations in the parliament by parliament analysis compared to the larger
sample size in the pooled analysis, as can be seen from the higher standard errors in the
parliament by parliament results.
Regarding changes over time, and whether the left-right and EU integration dimensions
have become more independent or merged, the results suggest that while the first dimension has
always been strongly associated with the left-right dimension, the second dimension has become
increasingly associated with pro-/anti-Europe positions. In the first parliament, for example, the
first dimension of voting in the European Parliament was captured by both left-right and EU
policy positions, while the second dimension also seemed to be related to the left-right. This is
not surprising given the fact that in this period, left-right and EU policy positions of parties were
relatively highly correlated (with a coefficient of .350). In no other parliament were these two
sets of policy preferences correlated. Since the third parliament, government participation and
EU policy positions are more clearly associated with voting patterns on the second dimension. In
fact, EU policy positions are significant in the fourth and fifth parliaments both when party
dummy variables are excluded and when they are included. Hence, in the late 1990s, EU policy
positions explain variations between the party groups as well as within the party groups on the
second dimension.

20
Put together with the goodness-of-fit statistics reported above, which show that the first
dimension captures an increasing proportion of voting, the parliament by parliament results
suggest that the second dimension may have declined in significance but has become more
clearly associated with a set of institutional interests (being in government) and policy positions
that are independent of left-right preferences.
As a robustness check, we replicated these statistical models using the Optimal
Classification method of scaling roll-call votes. As Rosenthal and Voeten (2004) show, Optimal
Classification can sometimes produce a quite different set of ideal point estimates to
NOMINATE. However, in the European Parliament, this method produces an almost identical
set of estimates and results to the ones we have described.4 It is not our purpose here to discuss
which of the two methods is the most appropriate for the European Parliament. Our intention is
rather to demonstrate that the analysis of the two main dimensions of politics in the European
Parliament is virtually unchanged, whichever of these two scaling methods are used. We base
our main results on NOMINATE rather than Optimal Classification for two reasons. First,
NOMINATE is the main method currently applied to roll-call voting comparatively. Second, we
find that the explanatory power of the independent variables on the ideal point estimates is
always higher for NOMINATE than for Optimal Classification when using the expert judgements
data.
5. Conclusion
4 The results of using Optimal Classification instead of NOMINATE are available on our website, http://personal.lse.ac.uk/hix.

21
The European Parliament is surprisingly like all other democratic parliaments. The main
dimension of voting behavior both within and between the transnational political parties in the
European Parliament is the classic left-right dimension of democratic politics. Left-right politics
explains an overwhelming proportion of voting in the European Parliament. In contrast, national
interests, independent of national party positions, have very little systematic influence on voting
in the European Parliament. This finding is surprising from the perspective of some of the ‘state
interest’ based theories of EU politics (e.g. Moravcsik, 1998).
There is a second, but considerably less salient and less stable, dimension of politics in the
European Parliament. This dimension partly captures government-opposition dynamics at the
European level, with parties represented in the Council voting one way and parties not
represented voting the other way. By the late 1990s, this dimension also began to reflect pro-
and anti-European integration positions of political parties. The main political families – the
European People’s Party, the Socialists, and the Liberals – are all strongly pro-European and also
dominate the seats in the Council and the Commission. As a result, on this dimension, conflict
between these main political groups and the smaller political groups is explained by party
policies towards European integration as well as party representation in the other EU institutions.
These results provide a new perspective on the existing understanding of the
dimensionality EU politics. The dominance of the left-right conflict across the whole period
supports the view that the dominant socio-economic positions in domestic politics shape actors’
positions in the EU policy process more strongly and more consistently than more general
preferences about the speed and nature of European integration. Nevertheless, the gradual
stabilization of a second dimension around pro-/anti-Europe positions suggests that the question
of the allocation of powers to the center or the states cannot easily be subsumed into the left-right
dimension. In this regard, the EU is similar to most other territorially divided polities.
22
Finally, our results suggest an optimistic conclusion about the accountability and stability
of EU governance. Politics in the European Parliament is very much like politics in other
democratic parliaments, dominated by left-right positions and driven by the traditional party
families of domestic European politics. Put this way, transnational party politics in the European
Parliament counter-balances national-interest based politics in the EU Council.

23
References
Aspinwall, Mark. 2002. Preferring Europe: Ideology and National Preferences on European
Integration. European Union Politics 3:81-112.
Attinà, Fulvio. 1990. The Voting Behaviour of the European Parliament Members and the
Problem of Europarties. European Journal of Political Research 18:557-79.
Brzinski, Joanne Bay. 1995. Political Group Cohesion in the European Parliament, 1989-1994. In
The State of the European Union, Vol. 3, edited by Carolyn Rhodes and Sonia Mazey,
London: Longman.
Budge, Ian, Hans-Dieter Klingemann, Andrea Volkens, Judith Bara and Eric Tanenbaum. 2001.
Mapping Policy Preferences: Estimates for Parties, Electors, and Governments 1945-
1998. Oxford: Oxford University Press.
Carrubba, Clifford J., Matthew Gabel, Lacey Murrah, Ryan Clough, Elizabeth Montgomery and
Rebecca Schambach. 2004. ‘A Second Look at Legislative Behavior in the European
Parliament: Roll-Call Votes and the Party System’, Working Paper, Vienna: Institute for
Advanced Studies.
Cox, Gary W. and Mathew D. McCubbins. 1993. Legislative Leviathan. Berkeley, CA:
University of California Press.
Diermeier, Daniel and Timothy J. Feddersen. 1998. Cohesion in legislatures and the vote of
confidence procedure. American Political Science Review 92:611-21.
van der Eijk, Cees and Mark Franklin. Eds. 1996. Choosing Europe? The European Electorate
and National Politics in the Face of Union. Ann Arbor, MI: University of Michigan Press.
Gabel, Matthew J. and Christopher J. Anderson. 2002. The Structure of Citizen Attitudes and the
European Political Space. Comparative Political Studies 35:893-913.
Gabel, Matthew J. and Simon Hix. 2002. Defining the EU Political Space: An Empirical Study of
the European Elections Manifestos, 1979-1999. Comparative Political Studies 35:934-
964.
Heckman, James J. and James M. Snyder Jr. 1997. Linear Probability Models of the Demand for
Attributes with an Empirical Application to Estimating the Preferences of Legislators.
Rand Journal of Economics 28: S142-S189.

24
Hix, Simon. 1999. Dimensions and Alignments in European Union Politics: Cognitive
Constraints and Partisan Responses. European Journal of Political Research 35:69-106.
Hix, Simon. 2001. Legislative Behaviour and Party Competition in European Parliament: An
Application of Nominate to the EU. Journal of Common Market Studies 39:663-688.
Hix, Simon. 2002. Parliamentary Behavior with Two Principals: Preferences, Parties, and Voting
in the European Parliament. American Journal of Political Science 46:688-698.
Hix, Simon and Christopher Lord. 1997. Political Parties in the European Union. Basingstoke:
Macmillan.
Hix, Simon, Abdul Noury and Gérard Roland. 2005. Power to the Parties: Cohesion and
Competition in the European Parliament, 1979-2001. British Journal of Political Science
35:209-234.
Hooghe, Liesbet and Gary Marks. 1999. The Making of a Polity: The Struggle Over European
Integration. In Continuity and Change in Contemporary Capitalism, edited by Herbert
Kitschelt, Peter Lange, Gary Marks and John Stephens, Cambridge: Cambridge
University Press.
Hooghe, Liesbet, Gary Marks and Carole Wilson. 2002. Does Left/Right Structure Party
Positions on European Integration? Comparative Political Studies 35:965-989.
Huber, John. 1996. The Impact of Confidence Votes on Legislative Politics in Parliamentary
Systems. American Political Science Review 90:269-82.
Huber, John and Ronald Inglehart. 1995. Expert Interpretations of Party Space and Party
Locations in 42 Societies. Party Politics 1:73-111.
Kiewiet, D. Roderick and Mathew D. McCubbins. 1991. The Logic of Delegation: Congressional
Parties and the Appropriations Process. Chicago: University of Chicago Press.
Kreppel, Amie. 2002. The European Parliament and Supranational Party System. Cambridge:
Cambridge University Press.
Kreppel, Amie and George Tsebelis. 1999. Coalition Formation in the European Parliament.
Comparative Political Studies 32:933-966.
Laver, Michael J., ed. 2001. Estimating the Policy Positions of Political Actors. London:
Routledge.
Laver, Michael J., Kenneth R. Benoit and John Garry. 2003. Extracting Policy Positions from
Political Texts Using Words as Data. American Political Science Review 97:311-31.

25
Laver, Michael J. and W. Ben Hunt. 1992. Policy and Party Competition. London: Routledge.
Marks, Gary and Marco Steenbergen. 2002. Introduction: Understanding Political Contestation in
the European Union. Comparative Political Studies 35:879-892.
Marks, Gary and Marco Steenbergen. 2004. Marks/Steenbergen Party Dataset, Chapel Hill, NC:
University of North Carolina Chapel Hill, available at:
http://www.unc.edu/~gwmarks/data.htm.
Marks, Gary, Carole Wilson and Leonard Ray. 2001. National Political Parties and European
Integration. American Journal of Political Science 46:585-94.
Mattila, Miko. 2004. Contested Decisions: Empirical Analysis of Voting in the EU Council of
Ministers. European Journal of Political Research 43: 29-50.
Mattila, Miko and Jan-Eric Lane. 2001. Why Unanimity in the Council? A Roll Call Analysis of
Council Voting. European Union Politics 2:31-52.
Moravcsik, Andrew. 1998. The Choice for Europe: Social Purpose and State Power from
Messina to Maastricht. Ithaca, NY: Cornell University Press.
Noury, Abdul. 2002. Ideology, Nationality and Euro-Parliamentarians. European Union Politics
3:33-58.
Noury, Abdul and Gérard Roland. 2002. ‘More Power to the European Parliament?’, Economic
Policy 34: 279-320.
Poole, Keith T. 2000. Non-Parametric Unfolding of Binary Choice Data. Political Analysis
8:211-32.
Poole, K. T. and H. Rosenthal (1985) `A Spatial Model for Legislative Roll-call Analysis’,
American Journal of Political Science 29: 357-384.
Poole, Keith T. and Howard Rosenthal. 1997. A Political-Economic History of Roll Call Voting.
Oxford: Oxford University Press.
Raunio, Tapio. 1997. The European Perspective: Transnational Party Groups in the 1989-1994
European Parliament. London: Ashgate.
Rosenthal, Howard and Erik Voeten. 2004. “Analyzing Roll Calls with Perfect Spatial Voting:
France 1946-1958”, American Journal of Political Science. 48(3): 620-632.
Schonhardt-Bailey, Cheryl. 2003. Ideology, Party and Interests in the British Parliament of 1841-
1847. British Journal of Political Science (forthcoming).

26
Tsebelis, George. 1994. The Power of the EP as a Conditional Agenda-Setter, American Political
Science Review 88:128-42.
Tsebelis, George. 2002. Veto Players: How Political Institutions Work. Princeton, NJ: Princeton
University Press.
Tsebelis, George and Geoffrey Garrett. 2000. Legislative Politics in the European Union.
European Union Politics 1:9-36.
Tsebelis, George and Geoffrey Garrett. 2001. The Institutional Foundations of
Intergovernmentalism and Supranationalism in the European Union. International
Organization 55:357-90.
Voeten, Erik. 2000. Clashes of The Assembly. International Organization 54:185-214.

27
Figure 1a. MEP Ideal Points in the First European Parliament (1979-1984)
Tokens used in Figures 1a-1e. Political group Abbreviation Token Anti-Europeans ANTI A British Conservatives and allies CON C Christian Democrats and Conservatives EPP E Italian Conservatives FE F French Gaullists and allies GAUL G Liberals LIB L Radical Left LEFT M Non-attached members NA N Italian Communists and Allies LSOC O Regionalists REG R Socialists SOC S Greens GRN V Radical Right RIGHT X

28
Figure 1b. MEP Ideal Points in the Second European Parliament (1984-1989)

29
Figure 1c. MEP Ideal Points in the Third European Parliament (1989-1994)

30
Figure 1d. MEP Ideal Points in the Fourth European Parliament (1994-1999)

31
Figure 1e. MEP Ideal Points in the Fifth European Parliament (1999-2001)


33
Table 1. Political Parties in the European Parliament, 1979-1999
Party Description Abbr. First Parliament (June 1979)
Second Parliament (June 1984)
Third Parliament (June 1989)
Fourth Parliament (June 1994)
Fifth Parliament (June 1999)
Seats % Seats % Seats % Seats % Seats %
Transnational Political Groups
Socialists SOC 113 27.6 130 30.0 180 34.7 198 34.9 180 28.8
Christian Democrats and Conservatives EPP 107 26.1 110 25.3 121 23.4 157 27.7 233 37.2
Liberals LIB 40 9.8 31 7.1 49 9.5 43 7.6 51 8.1
Radical Left LEFT 44 10.7 43 9.9 14 2.7 28 4.9 42 6.7
Regionalists REG 11 2.7 19 4.4 13 2.5 19 3.4
Greens GRN 30 5.8 23 4.1 48 7.7
Extreme Right RIGHT 16 3.7 17 3.3
Non-attached members NA 9 2.2 6 1.4 12 2.3 27 4.8 26 4.2
National Party-Based Groups
French Gaullists and allies GAUL 22 5.4 29 6.7 20 3.9 26 4.6 30 4.8
British Conservatives and allies CON 64 15.6 50 11.5 34 6.6
Italian Communists and allies LSOC 28 5.4
Italian Conservatives FE 27 4.8
Anti-Europeans (mainly French) ANTI 19 3.4 16 2.6
Total MEPs 410 434 518 567 626
No. of Roll-Call Votes 886 2135 2715 3740 2124
34
Table 2. Dimensionality in the European Parliament and Other Assemblies
Percent of roll-call vote decisions
predicted correctly Aggregate Proportional
Reduction of Error (APRE)
Number of scaleable roll-calls
Number of scaleable
legislators dim. 1 Dim. 2 dim. 2- dim. 1 dim. 1 dim. 2
dim. 2- dim. 1
European Parliament 1 (1979-84) 787 500 86.0 91.5 5.5 46.9 67.6 20.7
European Parliament 2 (1984-89) 1690 612 88.6 92.4 3.8 52.9 68.6 15.7
European Parliament 3 (1989-94) 2269 586 89.9 91.8 1.9 54.8 63.5 8.7
European Parliament 4 (1994-99) 3360 716 87.8 90.0 2.2 48.5 58.0 9.5
European Parliament 5 (1999-01) 1914 644 87.5 89.9 2.4 51.2 60.5 9.3
US House of Representatives (1997-98) 946 443 88.2 89.2 1.0 64.4 67.4 3.0
US Senate (1997-98) 486 101 88.0 88.5 .5 64.2 66.0 1.8
French National Assembly (1951-56) 341 645 93.3 96.0 2.7 81.8 89.2 7.4
United Nations General Assembly (1991-96) 344 186 91.8 93.0 1.2 62.1 67.7 5.6 Note: US House and Senate data from Poole and Rosenthal (1997), UN General Assembly data from Voeten (2000), French National Assembly data from Rosenthal and Voeten (2004).

35
Table 3. Correlation Between MEP NOMINATE Scores in Consecutive Parliaments
Correlation Dimension 1 Dimension 2 No. of MEPs
EP1-EP2 .905 .792 243
EP2-EP3 .945 .642 283
EP3-EP4 .948 .813 263
EP4-EP5 .919 .769 295 Note: Pearson correlation coefficients are calculated for all MEPs who served in two consecutive parliaments.

36
Table 4. Interpreting the Dimensions: Pooled Results for Dimension 1
Dependent Variable: Mean national party score on NOMINATE dimension 1
(1) (2) (3) (4) (5) (6) (7) (8) (9)
Left-Right (Exp) 1.611 .859 .890
(.053)*** (.100)*** (.084)***
EU Integration (Exp) .025 -.007 -.005
(.009)*** (.010) (.010)
Combined L-R (Man) .012 .003 .003
(.001)*** (.001)*** (.001)***
EU Integration (Man) .017 .020 .000 .003 .001 .004
(.007)** (.006)*** (.005) (.006) (.005) (.006)
Social L-R (Man) .017 .006 .004
(.003)*** (.002)** (.002)**
Economic L-R (Man) .022 .003 .003
(.002)*** (.002)* (.002)*
In Government .073 .088 .067 .045 .034 .039 .014 .002 -.010
(.033)** (.043)** (.044) (.021)** (.023) (.024) (.020) (.024) (.025)
Commissioner .058 .114 .072 .002 .038 .029 .018 .058 .056
(.036) (.049)** (.049) (.023) (.022)* (.024) (.025) (.027)** (.028)**
SOC -.436 -.606 -.616 -.432 -.619 -.634
(.037)*** (.032)*** (.034)*** (.033)*** (.030)*** (.031)***
LSOC -.386 -.683 -.709 -.488 -.731 -.830
(.061)*** (.049)*** (.051)*** (.050)*** (.059)*** (.052)***
LIB -.212 -.199 -.171 -.216 -.200 -.177
(.031)*** (.034)*** (.036)*** (.030)*** (.031)*** (.033)***
GRN -.867 -1.069 -1.058 -.873 -1.106 -1.103
(.060)*** (.046)*** (.054)*** (.054)*** (.046)*** (.051)***
CON -.007 .036 .103 .021 .086 .137
(.044) (.047) (.048)** (.050) (.062) (.068)**
LEFT -.612 -.866 -.878 -.565 -.853 -.888
(.076)*** (.053)*** (.057)*** (.070)*** (.054)*** (.054)***
GAUL -.086 .026 .035 -.092 .032 .043
(.058) (.072) (.080) (.058) (.068) (.074)
NA -.349 -.355 -.239 -.385 -.377 -.264
(.061)*** (.113)*** (.126)* (.059)*** (.108)*** (.119)**
REG -.685 -.799 -.795 -.723 -.836 -.834
(.062)*** (.066)*** (.090)*** (.059)*** (.074)*** (.094)***
RIGHT .025 .348 .388 -.027 .309 .323
(.078) (.073)*** (.078)*** (.075) (.082)*** (.074)***
ANTI -.472 - - -.487 - -
(.076)*** (.072)***
Constant -.858 .087 -.055 .011 .490 .423 -.015 .480 .417
(.059)*** (.057) (.051) (.096) (.040)*** (.050)*** (.096) (.051)*** (.057)***
Country fixed-effects No No No No No No Yes Yes Yes
Observations 352 288 271 352 288 271 352 288 271
Adj. R-squared .70 .37 .39 .87 .82 .82 .89 .83 .83 Note: Robust standard errors in parentheses. * significant at 10%, ** significant at 5%, * significant at 1%. Dummy variables for the second, third, fourth and fifth European Parliaments are included but not reported. We indicate the level of significance of the coefficients of the member state fixed effects if a majority of these fixed effects are significant at the relevant level. However, almost none of these variables are significant.

37
Table 5. Interpreting the Dimensions: Pooled Results for Dimension 2
Dependent Variable: Mean national party score on NOMINATE dimension 2
(1) (2) (3) (4) (5) (6) (7) (8) (9)
Left-Right (Exp) -.262 -.316 -.240
(.089)*** (.116)*** (.114)**
EU Integration (Exp) .106 .036 .030
(.013)*** (.016)** (.017)*
Combined L-R (Man) -.003 -.002 -.002
(.001)** (.001)* (.001)
EU Integration (Man) .016 .007 -.004 -.012 -.002 -.012
(.010) (.011) (.008) (.008) (.010) (.010)
Social L-R (Man) -.001 -.003 -.002
(.004) (.003) (.003)
Economic L-R (Man) .002 .003 .004
(.003) (.003) (.004)
In Government .165 .258 .260 .072 .086 .089 .087 .094 .093
(.050)*** (.058)*** (.061)*** (.034)** (.037)** (.038)** (.036)** (.040)** (.042)**
Commissioner .265 .286 .281 .022 .012 .007 .007 -.012 -.016
(.059)*** (.066)*** (.067)*** (.043) (.045) (.045) (.044) (.046) (.047)
SOC .291 .318 .350 .310 .335 .385
(.058)*** (.052)*** (.051)*** (.058)*** (.055)*** (.055)***
LSOC .029 .091 .143 .067 .118 .198
(.071) (.053)* (.057)** (.081) (.092) (.094)**
LIB -.306 -.340 -.344 -.328 -.354 -.358
(.044)*** (.047)*** (.048)*** (.046)*** (.053)*** (.055)***
GRN -.636 -.706 -.703 -.626 -.678 -.686
(.063)*** (.057)*** (.062)*** (.064)*** (.067)*** (.070)***
CON .577 .483 .396 .536 .401 .289
(.129)*** (.108)*** (.123)*** (.128)*** (.124)*** (.138)**
LEFT -.512 -.549 -.494 -.468 -.503 -.440
(.095)*** (.091)*** (.095)*** (.104)*** (.099)*** (.099)***
GAUL -.619 -.772 -.759 -.593 -.685 -.636
(.057)*** (.050)*** (.047)*** (.058)*** (.064)*** (.056)***
NA -.423 -.615 -.607 -.457 -.605 -.576
(.087)*** (.088)*** (.109)*** (.087)*** (.091)*** (.106)***
REG -.443 -.465 -.508 -.448 -.452 -.504
(.097)*** (.088)*** (.101)*** (.106)*** (.093)*** (.104)***
RIGHT -.125 -.344 -.372 -.099 -.223 -.219
(.131) (.086)*** (.089)*** (.143) (.103)** (.105)**
ANTI -.672 - - -.671 - -
(.083)*** (.093)***
Constant -.701 -.299 -.280 -.097 -.016 -.010 -.088 .010 .009
(.107)*** (.086)*** (.094)*** (.139) (.085) (.090) (.148) (.103) (.108)
Country fixed-effects No No No No No No Yes Yes Yes
Observations 352 288 271 352 288 271 352 288 271
Adj. R-squared .31 .20 .18 .65 .66 .65 .65 .66 .66
Note: Robust standard errors in parentheses. * significant at 10%, ** significant at 5%, * significant at 1%. Dummy variables for the second, third, fourth and fifth European Parliaments are included but not reported. We indicate the level of significance of the coefficients of the member state fixed effects if a majority of these fixed effects are significant at the relevant level. However, almost none of these variables are significant.

38
Table 6. Interpreting the Dimensions: Parliament by Parliament Results
Dependent Variable: Dimension 1-EP1 Dimension 1-EP2 Dimension 1-EP3 Dimension 1-EP4 Dimension 1-EP5 (1) (2) (3) (4) (5) (6) (7) (8) (9) (10) Left-Right (Exp) 1.172 .482 1.620 .974 1.490 .921 1.787 .454 1.524 .626 (.138)*** (.206)** (.115)*** (.234)*** (.103)*** (.240)*** (.100)*** (.175)** (.133)*** (.173)*** EU Integration (Exp) .061 .029 .004 .003 .020 .006 .021 -.021 .037 -.008 (.020)*** (.025) (.016) (.031) (.019) (.019) (.016) (.010)* (.020)* (.015) In Government .055 .038 .167 .068 .088 .048 .093 .002 -.030 -.012 (.073) (.043) (.070)** (.051) (.078) (.044) (.056) (.031) (.081) (.032) Commissioner .088 -.012 -.067 -.019 .099 .030 .107 .000 .106 .052 (.060) (.041) (.057) (.047) (.072) (.046) (.070) (.031) (.088) (.033) Constant -.834 -.013 -.886 -.296 -.830 -.222 -1.068 .317 -1.123 .030 (.066)*** (.221) (.102)*** (.239) (.144)*** (.218) (.112)*** (.157)** (.107)*** (.151) Party Fixed Effects No Yes*** No Yes*** No Yes*** No Yes*** No Yes*** Observations 44 44 55 55 62 62 83 83 108 108 Adjusted R-squared .70 .90 .80 .91 .72 .91 .76 .95 .54 .88 Dependent Variable: Dimension 2-EP1 Dimension 2-EP2 Dimension 2-EP3 Dimension 2-EP4 Dimension 2-EP5 (11) (12) (13) (14) (15) (16) (17) (18) (19) (20) Left-Right (Exp) -.908 -.675 .192 .281 -.467 -.301 -.034 -.324 -.219 -.313 (.270)*** (.219)*** (.149) (.185) (.236)* (.313) (.180) (.426) (.085)** (.091)*** EU Integration (Exp) .012 .023 .005 -.037 .076 -.077 .166 .031 .149 .062 (.045) (.033) (.028) (.035) (.036)** (.067) (.024)*** (.015)** (.012)*** (.011)*** In Government .111 -.009 .032 -.026 .203 .020 .310 .038 .035 -.023 (.110) (.101) (.102) (.055) (.181) (.060) (.097)*** (.055) (.062) (.036) Commissioner .131 .159 .268 .069 .295 -.012 .363 .017 .231 .021 (.131) (.109) (.112)** (.062) (.201) (.089) (.121)*** (.066) (.078)*** (.047) Constant .200 -.092 -.253 -.031 -.385 .760 -1.078 .407 -.794 -.122 (.242) (.243) (.137)* (.203) (.260) (.555) (.101)*** (.342) (.059)*** (.089) Party Fixed Effects No Yes*** No Yes*** No Yes*** No Yes*** No Yes*** Observations 44 44 55 55 62 62 83 83 108 108 Adjusted R-squared .23 .53 .15 .75 .18 .85 .50 .87 .64 .91 Note: Robust standard errors in parentheses. * significant at 10%, ** significant at 5%, * significant at 1%. We indicate the level of significance of the coefficients of party and member state fixed effects if a majority of these fixed effects are significant at the relevant level. Almost all party fixed effects are significant whenever these variables are entered, whereas almost none of the member state fixed effects are significant.

39
Appendix Table A1. Descriptive Statistics
Variable Observations Mean Standard Deviation
Min Max
Pooled dimension 1 437 .017 .470 -.899 .863 Pooled dimension 2 437 -.098 .471 -.974 .927 EP1-dimension 1 57 .131 .402 -.752 .814 EP1-dimension 2 57 -.079 .380 -.836 .791 EP2-dimension 1 73 .013 .474 -.876 .863 EP2-dimension 2 73 -.061 .274 -.685 .823 EP3-dimension 1 85 .091 .427 -.713 .827 EP3-dimension 2 85 -.173 .578 -.954 .927 EP4-dimension 1 103 .033 .483 -.798 .724 EP4-dimension 2 103 -.067 .551 -.974 .882 EP5-dimension 1 119 -.158 .481 -.899 .862 EP5-dimension 2 119 -.104 .378 -.922 .865 Left-Right (Exp) 352 .503 .229 0 1 EU Integration (Exp) 369 5.275 1.682 1 7 Combined Left-Right (Man) 346 .208 21.721 -40.030 64.710 EU Integration (Man) 289 2.384 3.424 -9.722 25.698 Social Left-Right (Man) 330 5.509 9.813 -17.687 48.400 Economic Left-Right (Man) 337 9.201 9.150 -13.900 53.658 In Government 437 .343 .475 0 1 Commissioner 437 .195 .391 0 1 SOC 437 .192 .394 0 1 EPP 437 .259 .438 0 1 LIB 437 .137 .345 0 1 GRN 437 .078 .268 0 1 LSOC 437 .002 .048 0 1 LEFT 437 .094 .292 0 1 GAUL 437 .043 .204 0 1 CON 437 .016 .126 0 1 NA 437 .071 .257 0 1 REG 437 .073 .261 0 1 RIGHT 437 .011 .106 0 1 ANTI 437 .023 .150 0 1