Embed Size (px)
Citation preview
Trade facilitation and paperless trade implementation in
Latin America and the Caribbean
Regional Report 2017
Trade facilitation and paperless trade implementation in
Latin America and the Caribbean
Regional Report 2017
Digital and sustainable trade facilitation in
Latin America and the Caribbean
Regional Report 2021

ECLACPublications
Thank you for your interest in
this ECLAC publication
Please register if you would like to receive information on our editorial
products and activities. When you register, you may specify your particular
areas of interest and you will gain access to our products in other formats.
www.cepal.org/en/publications
Publicaciones www.cepal.org/apps

This document has been prepared by Sebastian Herreros, Economic Affairs Officer with the International Trade and Integration Division of the Economic Commission for Latin America and the Caribbean (ECLAC).
The views expressed in this document, which has been reproduced without formal editing, are those of the author and do not necessarily reflect the views of the Organization.
United Nations publication LC/TS.2021/126 Distribution: Limited Copyright © United Nations, September 2021. All rights reserved Printed at United Nations, Santiago S.21-00582 This publication should be cited as: S. Herreros, Digital and Sustainable Trade Facilitation in Latin America and the Caribbean. Regional Report 2021 (LC/TS.2021/126), Santiago, Economic Commission for Latin America and the Caribbean (ECLAC), 2021. Applications for authorization to reproduce this work in whole or in part should be sent to the Economic Commission for Latin America and the Caribbean (ECLAC), Documents and Publications Division, [email protected]. Member States and their governmental institutions may reproduce this work without prior authorization, but are requested to mention the source and to inform ECLAC of such reproduction.
3
Contents
List of Acronyms ........................................................................................................................................... 7
Foreword ...................................................................................................................................................... 9
Executive summary .................................................................................................................................... 11
I. Introduction ............................................................................................................................... 13
A. Background and objectives of the Global Survey 2021................................................................ 13
B. Methodology ................................................................................................................................ 14
1. Structure of the Global Survey .................................................................................................... 14
2. Country participation, data collection and data validation ........................................................ 17
II. Global Survey results ................................................................................................................. 19
A. Overview ...................................................................................................................................... 19
B. Transparency measures ............................................................................................................... 25
C. Formalities measures ................................................................................................................... 28
D. Institutional arrangements and cooperation measures .............................................................. 32
E. Paperless trade measures ............................................................................................................ 33
F. Cross-border paperless trade measures ...................................................................................... 36
G. Transit facilitation measures ........................................................................................................ 39
H. Trade facilitation for small and medium enterprises ................................................................... 40
I. Trade facilitation and agricultural trade ...................................................................................... 41
J. Women in trade facilitation ......................................................................................................... 43
K. Trade finance facilitation ............................................................................................................. 44
L. Trade facilitation in times of crisis and pandemic ....................................................................... 45
III. Conclusions and way forward ................................................................................................... 49
Bibliography................................................................................................................................................ 51
Annex .................................................................................................................................................... 53
Tables
Table 1 Measures included in the Global Survey on Digital and Sustainable Trade Facilitation 2021 and correspondence with articles of the WTO Trade Facilitation Agreement (TFA) ..... 15
Table 2 LAC countries participating in the Global Survey on Digital and Sustainable Trade Facilitation 2021 ............................................................................................................ 17
Table 3 Membership of LAC countries in trade agreements including trade facilitation commitments .............................................................................................. 22

4
Table 4 Latin America and the Caribbean (14 countries): Most and least implemented measures in the five core categories of the Global Survey on Digital and Sustainable Trade Facilitation 2021 ............................................................................................................ 24
Table 5 Selected LAC countries: Signed Mutual Recognition Agreements of Authorized Economic Operator programs, as of June 2021 ...................................................................... 31
Table 6 Selected LAC countries: Cross-border exchange of origin and SPS certificates, as of June 2021 ........................................................................................................................ 38
Table 7 Selected LAC countries: Examples of trade facilitation measures adopted since the outbreak of COVID-19 .............................................................................................. 47
Figures
Figure 1 Latin America and the Caribbean and OECD (high income members): Average time and cost to export and import a shipment of goods, 2019a ................................................... 14
Figure 2 World (135 countries) and selected regions: Average implementation rates in the Global Survey on Digital and Sustainable Trade Facilitation 2021 ................................ 19
Figure 3 Latin America and the Caribbean (14 countries): Average implementation rates in the Global Survey on Digital and Sustainable Trade Facilitation 2021 ............................... 20
Figure 4 Latin America and the Caribbean (11 countries): Average implementation rates in the Global Survey on Digital and Sustainable Trade Facilitation 2019 and 2021 ................ 20
Figure 5 Latin America and the Caribbean (7 countries): Average implementation rates in the Global Survey on Digital and Sustainable Trade Facilitation 2019 ................................ 21
Figure 6 Latin America and the Caribbean (14 countries): Minimum, average and maximum implementation rates in the Global Survey on Digital and Sustainable Trade Facilitation 2021 by sub-region .................................................................................................................. 21
Figure 7 Latin America and the Caribbean (11 countries): Average implementation rates of trade facilitation and paperless trade measures by category, 2019 and 2021 .................. 23
Figure 8 Latin America and the Caribbean (11 countries): Largest variations in average implementation rates of trade facilitation and paperless trade measures between 2019 and 2021 .......................................................................................................... 25
Figure 9 Latin America and the Caribbean (14 countries): Implementation of transparency measures, 2021 ....................................................................................................................... 26
Figure 10 Latin America and the Caribbean (14 countries): Average implementation rates of transparency measures by subregion, 2021 ....................................................................... 27
Figure 11 Latin America and the Caribbean (14 countries): Implementation of formalities measures, 2021 ....................................................................................................................... 29
Figure 12 Latin America and the Caribbean (14 countries): Average implementation rates of formalities measures by subregion, 2021 ........................................................................... 29

5
Figure 13 Latin America and the Caribbean (14 countries): Average implementation rates of institutional cooperation and arrangements measures by subregion, 2021 ..................... 33
Figure 14 Latin America and the Caribbean (14 countries): Implementation of paperless trade measures, 2021 ....................................................................................................................... 34
Figure 15 Latin America and the Caribbean (14 countries): Average implementation rates of paperless trade measures by subregion, 2021 ................................................................... 34
Figure 16 Latin America and the Caribbean (14 countries): Implementation of cross-border paperless trade measures, 2021 ............................................................................................. 36
Figure 17 Latin America and the Caribbean (14 countries): Average implementation rates of cross-border paperless trade measures by subregion, 2021 ............................................. 37
Figure 18 Latin America (11 countries): Implementation of transit facilitation measures, 2021 ........... 39
Figure 19 Average implementation rates of transit facilitation measures in South America and in Central America and Mexico, 2021 .............................................................................. 40
Figure 20 Latin America and the Caribbean (14 countries): Implementation of SME-oriented TF measures, 2021 ................................................................................................................... 40
Figure 21 Latin America and the Caribbean (14 countries): Average implementation rates of SME-oriented trade facilitation measures by subregion, 2021 .......................................... 41
Figure 22 Latin America and the Caribbean (14 countries): Implementation of agricultural TF measures, 2021 ................................................................................................................... 42
Figure 23 Latin America and the Caribbean (14 countries): Average implementation rates of agricultural TF measures by subregion, 2021 ..................................................................... 42
Figure 24 Latin America and the Caribbean (14 countries): Implementation of women-oriented trade facilitation measures, 2021 ........................................................................................... 43
Figure 25 Latin America and the Caribbean (14 countries): Implementation of trade finance facilitation measures, 2021 ..................................................................................................... 45
Figure 26 Latin America and the Caribbean (14 countries): Implementation of trade facilitation measures in times of crisis and pandemic, 2021 .................................................................... 46
Figure 27 Latin America and the Caribbean (14 countries): Average implementation rates of trade facilitation measures in times of crisis and pandemic, by subregion, 2021............................ 46

7
List of Acronyms AEO: Authorized economic operator
ALADI: Latin American Integration Association
ASYCUDA: Automated System for Customs Data
ATIT: Agreement on International Land Transport
CAN: Andean Community
CARICOM: Caribbean Community
CPTPP: Comprehensive and Progressive Agreement for Trans-Pacific Partnership
DR-CAFTA: Dominican Republic-Central America-United States Free Trade Agreement ECLAC: United Nations Economic Commission for Latin America and the Caribbean
EPA: Economic Partnership Agreement
ESCAP: United Nations Economic and Social Commission for Asia and the Pacific
ESW: Electronic single window
EU: European Union
FTA: Free trade agreement
GATT: General Agreement on Tariffs and Trade
ICT: Information and communications technology
LAC: Latin America and the Caribbean
MERCOSUR: Common Market of the South
MRA: Mutual recognition agreement
NTFC: National trade facilitation committee
OECD: Organization for Economic Cooperation and Development
SICA: Central American Integration System
SME: Small and medium-sized enterprise
SPS: Sanitary and phytosanitary
TF: Trade facilitation
TFA: Trade Facilitation Agreement
TRS: Time Release Study
USMCA: United States-Mexico-Canada Agreement
WCO: World Customs Organization
WTO: World Trade Organization

9
Foreword This Regional Report presents the results for Latin America and the Caribbean of the fourth Global Survey on Digital and Sustainable Trade Facilitation, jointly conducted by the five United Nations Regional Commissions (UNRC): for Africa (ECA), Asia and the Pacific (ESCAP), Europe (ECE), Latin America and the Caribbean (ECLAC) and West Asia (ESCWA). The Survey, conducted every two years, aims to gather information from countries worldwide on implementation of digital and sustainable trade facilitation measures. Its results enable countries and development partners to better understand and monitor progress on trade facilitation, support evidence-based public policies, share best practices and identify capacity building and technical assistance needs.
The first and second global surveys were conducted in 2015 and 2017 as a key initiative under the Joint UNRC Approach to Trade Facilitation agreed upon in Beirut, Lebanon in 2010 by the Executive Secretaries of all five United Nations Regional Commissions. The joint approach was designed to enable the Regional Commissions to present a joint and global view on trade facilitation issues in the context of the negotiations of the Doha Round at the World Trade Organization (WTO). The third global survey (2019) included new forward-looking modules related to trade digitalization, trade finance facilitation, and sustainable development.
The fourth global survey builds upon the previous three editions by including an expanded module on trade finance facilitation, as well as a new one on trade facilitation in times of crisis. The latter was incorporated to gather information on implementation of both short-term measures in response to the COVID-19 pandemic as well as long-term measures in preparation for future crises and pandemics.
This Regional Report would not have been possible without the contribution of the government officials from participant countries who filled the questionnaires and addressed follow-up questions. Their invaluable support is kindly acknowledged.

11
Executive summary Latin America and the Caribbean (LAC) faces considerable challenges in terms of reducing the non-tariff costs and time requirements in foreign trade operations. High trade costs in the region are a result of multiple factors, including its vast size, complex geography and insufficient stock of transport infrastructure. Nevertheless, inefficiencies in administrative procedures also raise trade costs, both within the region and with extra-regional partners. LAC performs better than lower-income regions such as Sub-Saharan Africa and South Asia in the trading across borders component of the World Bank’s Doing Business ranking; however, it scores considerably worse than the developed countries of the Organisation for Economic Co-operation and Development (see figure 1 in section I). Making progress on the trade facilitation (TF) agenda is thus crucial to improve the region’s international competitiveness and to increase its intraregional trade, which in 2020 stood at 11% of total exports, its lowest level in three decades.
Since red tape at the border disproportionately affects small and medium-sized enterprises (SMEs), TF encourages the internationalization of those firms, the overwhelming majority of which do not export. This may in turn promote export diversification, thus helping to reduce the very high commodity dependence that characterizes the export baskets of many LAC countries. The expeditious movement of goods across borders is also critical for the success of international production networks. Hence progress in TF may help to increase the presence of LAC countries in regional and global value chains, which —with some exceptions— remains very limited. At a more general level, several of the concepts embodied in the TF agenda are important to improve the effectiveness and accountability of the State and to fight corruption. In the context of the current COVID-19 pandemic, TF measures have also proved critical to expedite the cross-border flows of essential goods such as vaccines, medical equipment and food.
Since its first edition in 2015, the biannual Global Survey on Digital and Sustainable Trade Facilitation has
tracked the progress made by countries around the world in the areas of trade facilitation and paperless trade, including the implementation of the World Trade Organization´s Trade Facilitation Agreement (TFA). The scope of the Global Survey has progressively extended beyond the coverage of the TFA. Its 2021 edition covers 58 measures categorized into four groups and 11 categories (see table 1 in Section I). The first group (General Trade Facilitation Measures) comprises four categories (Transparency, Formalities, Institutional Cooperation and Arrangements, and Transit Facilitation) and corresponds almost entirely to TFA provisions. The second group (Digital Trade Facilitation Measures) includes two categories: Paperless Trade and Cross-Border Paperless Trade. The third group (Sustainable Trade Facilitation Measures) includes 3 categories: Trade Facilitation for SMEs, Agricultural Trade Facilitation, and Women in Trade Facilitation. The fourth group (Other Trade Facilitation Measures) includes two categories: Trade Finance Facilitation and Trade Facilitation in times of Crisis and Pandemic. The latter was included in the 2021 edition to gauge country responses to the COVID-19 crisis. For every measure there are five possible answers: (i) Fully implemented (3 points); (ii) Partially implemented (2 points); (iii) Pilot stage (1 point); (iv) Not implemented (0 points); and (v) Don't know (also accorded 0 points).
The current report summarizes the results of the Global Survey 2021 for the 14 participating LAC
countries,1 which together account for 73% of the region´s merchandise exports and 74% of its imports in 2020. All responses were prepared by government agencies, mostly trade ministries in collaboration with
1 Argentina, Colombia, Chile, Costa Rica, Cuba, Dominican Republic, Ecuador, Guatemala, Mexico, Panama, Paraguay, Peru,
Saint Kitts and Nevis, and Uruguay.

12
customs agencies. ECLAC conducted independent desk research in order to confirm or amend the responses provided by countries.
The average implementation rate of the 14 LAC participating countries is 80% (see figure 2 in section II).2
This is 15 percentage points above the average of the 135 countries that responded the Global Survey 2021 worldwide (65%), and is the highest average among all developing regions. Same as in the three previous editions of the Global Survey, Mexico had the highest implementation rate in 2021 at 91%. Argentina, Chile, Colombia, Costa Rica, Ecuador, Peru and Uruguay obtained implementation rates above 80%. Cuba registered the lowest score, at 65% (see figure 3 in section II). The regional average in 2021 is substantially higher than the 67% average obtained by the 18 LAC countries that participated in the Global Survey 2019. This reflects both substantial progress between both editions and important changes in the list of participating countries. In particular, the participation of small Caribbean economies —which usually obtained the lowest scores in previous editions— was much lower in 2021.
The categories of Formalities, Transparency and Paperless Trade register the highest implementation
rates among participating LAC countries, at 91%, 88% and 87%, respectively. Those countries present average implementation rates above 80% in 23 of the 31 core measures included in the Global Survey. These include the establishment of national trade facilitation committees, pre-arrival processing, independent appeal mechanisms for customs decisions, e-payment of customs duties and fees, availability of advance rulings, trade facilitation measures for authorized economic operators (AEO), the separation of release from the final determination of customs duties, the electronic submission of air and cargo manifests, the establishment of an electronic single window and the use of risk management, among others.
Among core TF categories, participating countries registered their lowest score in Cross-border Paperless
Trade (57%). Some of the individual measures with the lowest implementation rates are in this category, including the electronic cross-border exchange of customs declarations (43%), certificates of origin (57%) and sanitary and phytosanitary certificates (45%). All these measures require the support of a sophisticated ICT infrastructure and close cooperation between the relevant agencies of the countries exchanging information. One measure with a very low implementation rate (5%) is the practice, common in developed countries, of border agencies delegating controls to customs authorities. In this particular case, the explanation is probably insufficient inter-agency coordination or trust. Global Survey results show the region also has much room for improvement in areas like TF for SMEs (50%), TF for women (32%) and trade finance facilitation (31%). Concerning responses to the ongoing pandemic, the Global Survey reveals the widespread digitalization of trade documents and procedures to minimize physical contact. Participating countries also scored well in terms of publishing emergency measures, but less so in coordinating these at the regional level.
The considerable progress made by LAC countries in implementing TF measures at the national level would have a greater impact on trade flows and production integration if such advances were coordinated at the regional level. In recent years there have been several promising developments in this regard. Some examples are the conclusion in December 2019 of a TF agreement within MERCOSUR, the mutual recognition agreements of AEO schemes within the Andean Community, MERCOSUR and the Pacific Alliance, and the growing electronic exchange of trade documents within the Pacific Alliance and among Central American countries. Some of these processes have been slowed down by the pandemic, either because of mobility restrictions or due to financial constraints. Thus, if LAC countries manage to speed up vaccine rollout in the coming months, progress on regional TF initiatives should also accelerate.
2 Individual country results can be consulted at the Global Survey´s website: https://www.untfsurvey.org/region?id=ECLAC.

13
I. Introduction
A. Background and objectives of the Global Survey 2021 For over three decades, countries in Latin America and the Caribbean (LAC) have been reducing their import tariffs, both unilaterally and through participation in regional integration agreements and free trade agreements (FTAs) with extra-regional partners. As the relative importance of tariffs has decreased, trade facilitation (TF) —understood as “the simplification, standardization and harmonization of procedures and associated information flows required to move goods from seller to buyer and to make payment”3— has become a critical competitiveness factor in global trade. By cutting red tape at the border, including through the digitalization of documents and processes, trade facilitation reduces the time and cost to trade. The entry into force of the World Trade Organization’s Trade Facilitation Agreement (TFA) in February 2017 propelled this topic to the top of the global and regional trade agenda, and the outbreak of the COVID-19 pandemic in 2020 has further highlighted its relevance. Countries from all regions had to implement several TF measures to minimize physical contact at ports and border crossings and to ease the cross-border flow of essential goods such as food, vaccines, medical devices and personal protective equipment (WTO, 2021).
Despite substantial progress made in recent years, Latin America and the Caribbean still faces
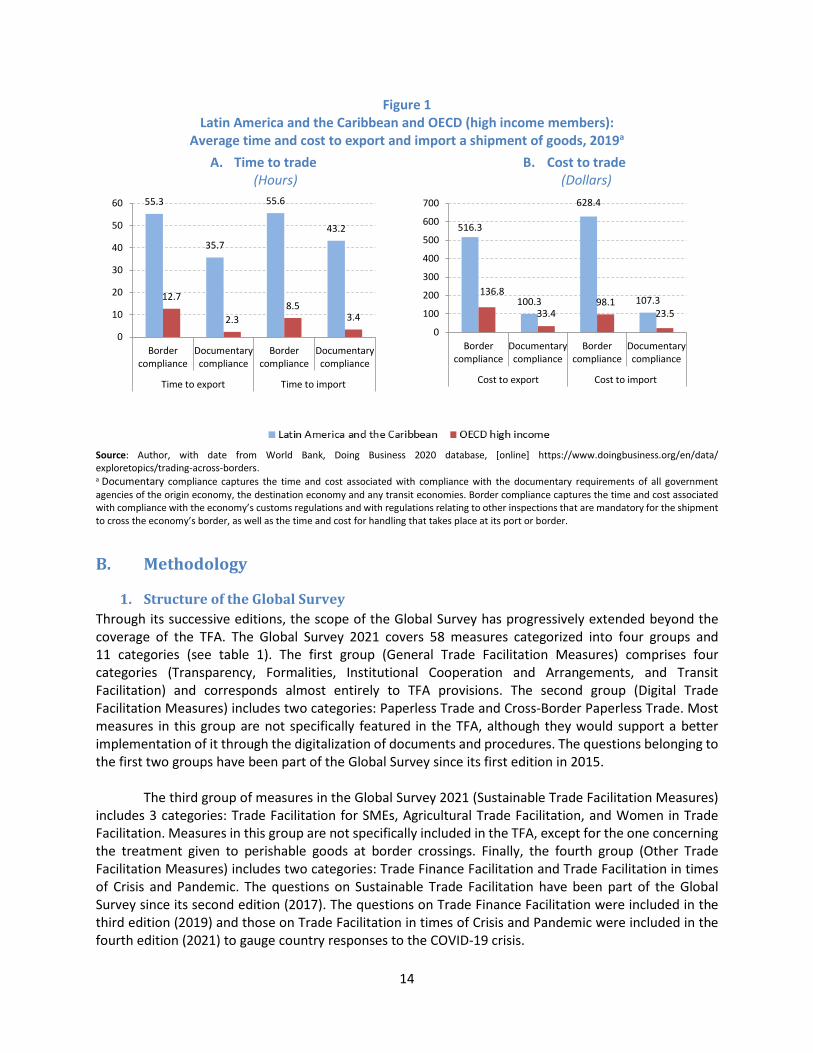
considerable challenges in terms of reducing the non-tariff costs and the time associated with foreign trade. Overall, it performs better than lower-income regions such as Sub-Saharan Africa and South Asia in the Trading across Borders component of the World Bank’s Doing Business ranking. However, it trails the developed countries of the OECD by wide margins (see figure 1).
High trade costs in the region are a result of multiple factors, most notably its vast size (almost
20.5 million square kilometers), complex geography and insufficient stock of transport infrastructure. The region had in 2015 an average of 22.8 kilometers of roads per 100 square kilometers, compared to an average of about 100 in the European members of the OECD; moreover, just 23% of the region’s roads were paved. The density of the railway network is also very low: less than 1 kilometer of railways per 100 square kilometers compared to almost 6 kilometers in the European Union (Sánchez and others, 2017). Nevertheless, inefficiencies in administrative procedures also raise trade costs, both within the region and with extra-regional partners. Against this background, making progress on the trade facilitation agenda is crucial to improve the region’s international competitiveness and to enhance its participation in international production networks.
The rest of this report is structured as follows. The remainder of this first section describes the
structure and methodology of the Global Survey and how the results were tabulated and analyzed. The second section provides an overview of the results for Latin America and the Caribbean and its three sub-regions. The third section examines in greater detail implementation levels for each category of trade facilitation measures. The fourth section concludes.
3 See United Nations Economic Commission for Europe, “Trade Facilitation Implementation Guide”, [online]
https://tfig.unece.org/details.html.
14
Figure 1 Latin America and the Caribbean and OECD (high income members):
Average time and cost to export and import a shipment of goods, 2019a A. Time to trade
(Hours) B. Cost to trade
(Dollars)
Source: Author, with date from World Bank, Doing Business 2020 database, [online] https://www.doingbusiness.org/en/data/ exploretopics/trading-across-borders. a Documentary compliance captures the time and cost associated with compliance with the documentary requirements of all government agencies of the origin economy, the destination economy and any transit economies. Border compliance captures the time and cost associated with compliance with the economy’s customs regulations and with regulations relating to other inspections that are mandatory for the shipment to cross the economy’s border, as well as the time and cost for handling that takes place at its port or border.
B. Methodology
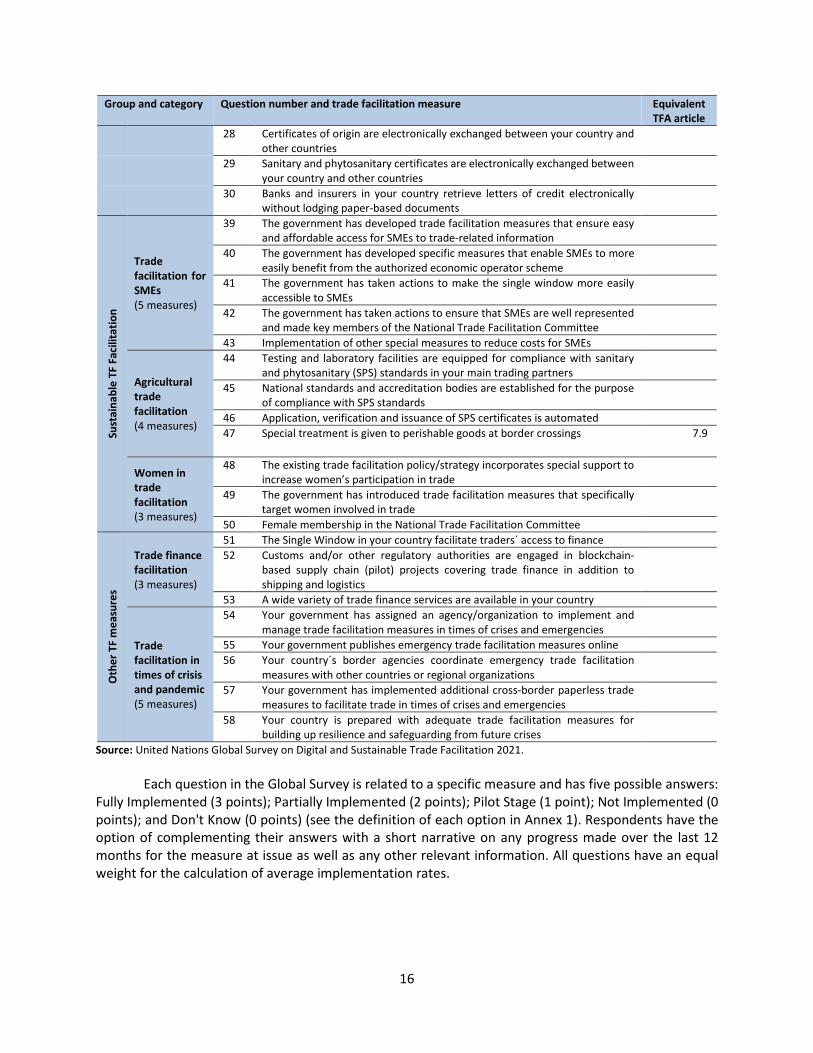
1. Structure of the Global Survey Through its successive editions, the scope of the Global Survey has progressively extended beyond the coverage of the TFA. The Global Survey 2021 covers 58 measures categorized into four groups and 11 categories (see table 1). The first group (General Trade Facilitation Measures) comprises four categories (Transparency, Formalities, Institutional Cooperation and Arrangements, and Transit Facilitation) and corresponds almost entirely to TFA provisions. The second group (Digital Trade Facilitation Measures) includes two categories: Paperless Trade and Cross-Border Paperless Trade. Most measures in this group are not specifically featured in the TFA, although they would support a better implementation of it through the digitalization of documents and procedures. The questions belonging to the first two groups have been part of the Global Survey since its first edition in 2015.
The third group of measures in the Global Survey 2021 (Sustainable Trade Facilitation Measures) includes 3 categories: Trade Facilitation for SMEs, Agricultural Trade Facilitation, and Women in Trade Facilitation. Measures in this group are not specifically included in the TFA, except for the one concerning the treatment given to perishable goods at border crossings. Finally, the fourth group (Other Trade Facilitation Measures) includes two categories: Trade Finance Facilitation and Trade Facilitation in times of Crisis and Pandemic. The questions on Sustainable Trade Facilitation have been part of the Global Survey since its second edition (2017). The questions on Trade Finance Facilitation were included in the third edition (2019) and those on Trade Facilitation in times of Crisis and Pandemic were included in the fourth edition (2021) to gauge country responses to the COVID-19 crisis.
55.3
35.7
55.6
43.2
12.7
2.38.5
3.4
0
10
20
30
40
50
60
Bordercompliance
Documentarycompliance
Bordercompliance
Documentarycompliance
Time to export Time to import
516.3
100.3
628.4
107.3136.8
33.498.1
23.5
0
100
200
300
400
500
600
700
Bordercompliance
Documentarycompliance
Bordercompliance
Documentarycompliance
Cost to export Cost to import

15
Table 1 Measures included in the Global Survey on Digital and Sustainable
Trade Facilitation 2021 and correspondence with articles of the WTO Trade Facilitation Agreement (TFA)
Group and category Question number and trade facilitation measure Equivalent TFA article
Gen
eral
TF
mea
sure
s
Transparency (5 measures)
2 Publication of existing import-export regulations on the Internet 1.1 and 1.2 3 Stakeholder consultation on new draft regulations (prior to their finalization) 2.2 4 Advance publication/notification of new regulations before their implementation 2.1 5 Advance rulings 3 9 Independent appeal mechanism (for traders to appeal customs rulings and
the rulings of other relevant trade control agencies) 4
Formalities (8 measures)
6 Risk management (as a basis for deciding whether a shipment will be physically inspected or not)
7.4
7 Pre-arrival processing 7.1 8 Post-clearance audit 7.5
10 Separation of release from final determination of customs duties, taxes, fees and charges
7.3
11 Establishment and publication of average release times 7.6 12 Trade facilitation measures for authorized operators 7.7 13 Expedited shipments 7.8 14 Acceptance of paper or electronic copies of supporting documents required
for import, export or transit formalities 10.2.1
Institutional cooperation and arrangements (5 measures)
1 Establishment of a national trade facilitation committee or similar body 23 31 Cooperation between agencies on the ground at the national level
8
32 Government agencies delegate controls to customs authorities 33 Alignment of working days and hours with neighboring countries at border
crossings
8.2(a)
34 Alignment of formalities and procedures with neighboring countries at border crossings
8.2(b)
Transit facilitation (4 measures)
35 Transit facilitation agreement(s) with neighboring countries 36 Customs authorities limit the physical inspection of transit goods and use risk
assessment 10.5
37 Pre-arrival processing for transit facilitation 11.9 38 Cooperation between agencies of countries involved in transit 11.16
Digi
tal T
F M
easu
res
Paperless trade (10 measures)
15 Electronic/automated customs system established (e.g., ASYCUDA) 16 Internet connection available to customs and other trade control agencies at
border crossings
17 Electronic single window system 10.4 18 Electronic submission of customs declarations 19 Electronic application and issuance of import and export permits 20 Electronic submission of sea cargo manifests 21 Electronic submission of air cargo manifests 22 Electronic application and issuance of preferential certificates of origin 23 Electronic payment of customs duties and fees 7.2 24 Electronic application for customs refunds
Cross-border paperless trade (6 measures)
25 Laws and regulations for electronic transactions (e.g., e-commerce law, e-transactions law)
26 Recognized certification authorities issue digital certificates to traders to conduct electronic transactions
27 Customs declarations are electronically exchanged between your country and other countries
16
Group and category Question number and trade facilitation measure Equivalent TFA article
28 Certificates of origin are electronically exchanged between your country and other countries
29 Sanitary and phytosanitary certificates are electronically exchanged between your country and other countries
30 Banks and insurers in your country retrieve letters of credit electronically without lodging paper-based documents
Sust
aina
ble
TF F
acili
tatio
n
Trade facilitation for SMEs (5 measures)
39 The government has developed trade facilitation measures that ensure easy and affordable access for SMEs to trade-related information
40 The government has developed specific measures that enable SMEs to more easily benefit from the authorized economic operator scheme
41 The government has taken actions to make the single window more easily accessible to SMEs
42 The government has taken actions to ensure that SMEs are well represented and made key members of the National Trade Facilitation Committee
43 Implementation of other special measures to reduce costs for SMEs
Agricultural trade facilitation (4 measures)
44 Testing and laboratory facilities are equipped for compliance with sanitary and phytosanitary (SPS) standards in your main trading partners
45 National standards and accreditation bodies are established for the purpose of compliance with SPS standards
46 Application, verification and issuance of SPS certificates is automated 47 Special treatment is given to perishable goods at border crossings 7.9
Women in trade facilitation (3 measures)
48 The existing trade facilitation policy/strategy incorporates special support to increase women’s participation in trade
49 The government has introduced trade facilitation measures that specifically target women involved in trade
50 Female membership in the National Trade Facilitation Committee
Oth
er T
F m
easu
res
Trade finance facilitation (3 measures)
51 The Single Window in your country facilitate traders´ access to finance 52 Customs and/or other regulatory authorities are engaged in blockchain-
based supply chain (pilot) projects covering trade finance in addition to shipping and logistics
53 A wide variety of trade finance services are available in your country
Trade facilitation in times of crisis and pandemic (5 measures)
54 Your government has assigned an agency/organization to implement and manage trade facilitation measures in times of crises and emergencies
55 Your government publishes emergency trade facilitation measures online 56 Your country´s border agencies coordinate emergency trade facilitation
measures with other countries or regional organizations
57 Your government has implemented additional cross-border paperless trade measures to facilitate trade in times of crises and emergencies
58 Your country is prepared with adequate trade facilitation measures for building up resilience and safeguarding from future crises
Source: United Nations Global Survey on Digital and Sustainable Trade Facilitation 2021.
Each question in the Global Survey is related to a specific measure and has five possible answers: Fully Implemented (3 points); Partially Implemented (2 points); Pilot Stage (1 point); Not Implemented (0 points); and Don't Know (0 points) (see the definition of each option in Annex 1). Respondents have the option of complementing their answers with a short narrative on any progress made over the last 12 months for the measure at issue as well as any other relevant information. All questions have an equal weight for the calculation of average implementation rates.
17
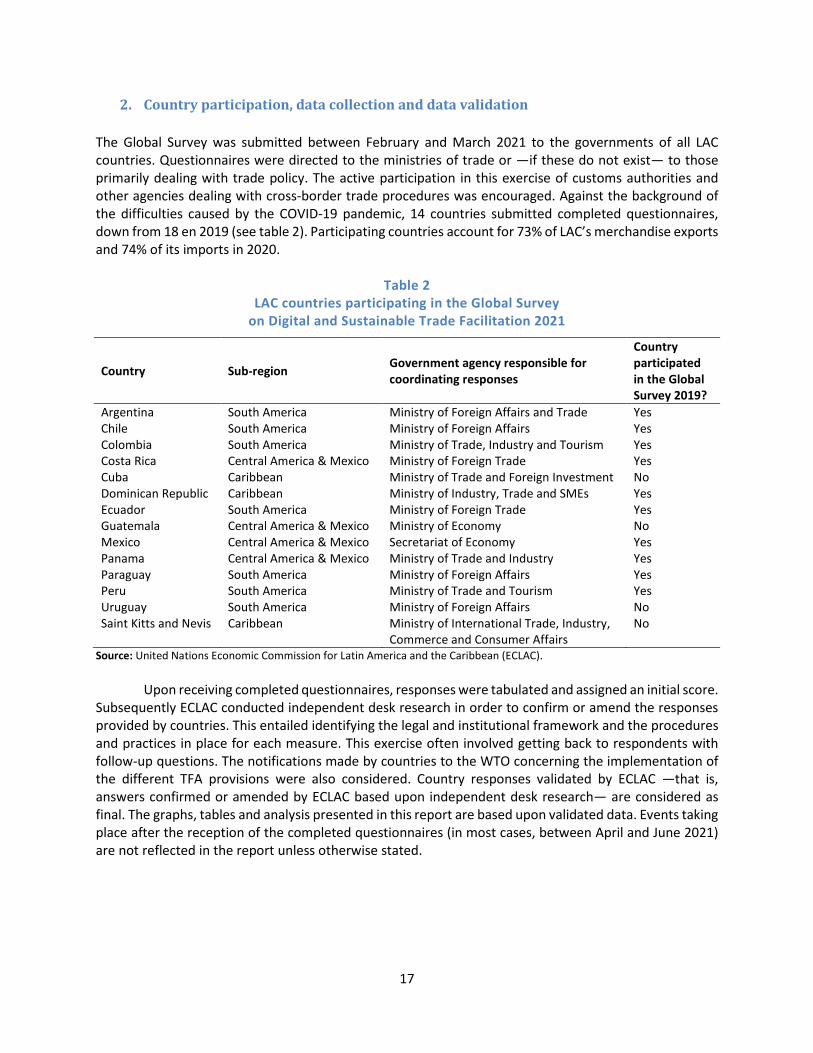
2. Country participation, data collection and data validation The Global Survey was submitted between February and March 2021 to the governments of all LAC countries. Questionnaires were directed to the ministries of trade or —if these do not exist— to those primarily dealing with trade policy. The active participation in this exercise of customs authorities and other agencies dealing with cross-border trade procedures was encouraged. Against the background of the difficulties caused by the COVID-19 pandemic, 14 countries submitted completed questionnaires, down from 18 en 2019 (see table 2). Participating countries account for 73% of LAC’s merchandise exports and 74% of its imports in 2020.
Table 2 LAC countries participating in the Global Survey
on Digital and Sustainable Trade Facilitation 2021
Country Sub-region Government agency responsible for coordinating responses
Country participated in the Global Survey 2019?
Argentina South America Ministry of Foreign Affairs and Trade Yes Chile South America Ministry of Foreign Affairs Yes Colombia South America Ministry of Trade, Industry and Tourism Yes Costa Rica Central America & Mexico Ministry of Foreign Trade Yes Cuba Caribbean Ministry of Trade and Foreign Investment No Dominican Republic Caribbean Ministry of Industry, Trade and SMEs Yes Ecuador South America Ministry of Foreign Trade Yes Guatemala Central America & Mexico Ministry of Economy No Mexico Central America & Mexico Secretariat of Economy Yes Panama Central America & Mexico Ministry of Trade and Industry Yes Paraguay South America Ministry of Foreign Affairs Yes Peru South America Ministry of Trade and Tourism Yes Uruguay South America Ministry of Foreign Affairs No Saint Kitts and Nevis Caribbean Ministry of International Trade, Industry,
Commerce and Consumer Affairs No
Source: United Nations Economic Commission for Latin America and the Caribbean (ECLAC).
Upon receiving completed questionnaires, responses were tabulated and assigned an initial score. Subsequently ECLAC conducted independent desk research in order to confirm or amend the responses provided by countries. This entailed identifying the legal and institutional framework and the procedures and practices in place for each measure. This exercise often involved getting back to respondents with follow-up questions. The notifications made by countries to the WTO concerning the implementation of the different TFA provisions were also considered. Country responses validated by ECLAC —that is, answers confirmed or amended by ECLAC based upon independent desk research— are considered as final. The graphs, tables and analysis presented in this report are based upon validated data. Events taking place after the reception of the completed questionnaires (in most cases, between April and June 2021) are not reflected in the report unless otherwise stated.


19
II. Global Survey results
A. Overview Implementation rates were calculated based on a set of 31 core measures relevant to all countries participating in the Global Survey 2021. Those measures are those in the categories of Transparency, Formalities, Institutional Cooperation and Arrangements, Paperless Trade, and Cross-border Paperless Trade.4 Implementation rates correspond to the sum of the scores obtained by each country divided by the maximum possible score (93 points, corresponding to “Full implementation” in all 31 questions).
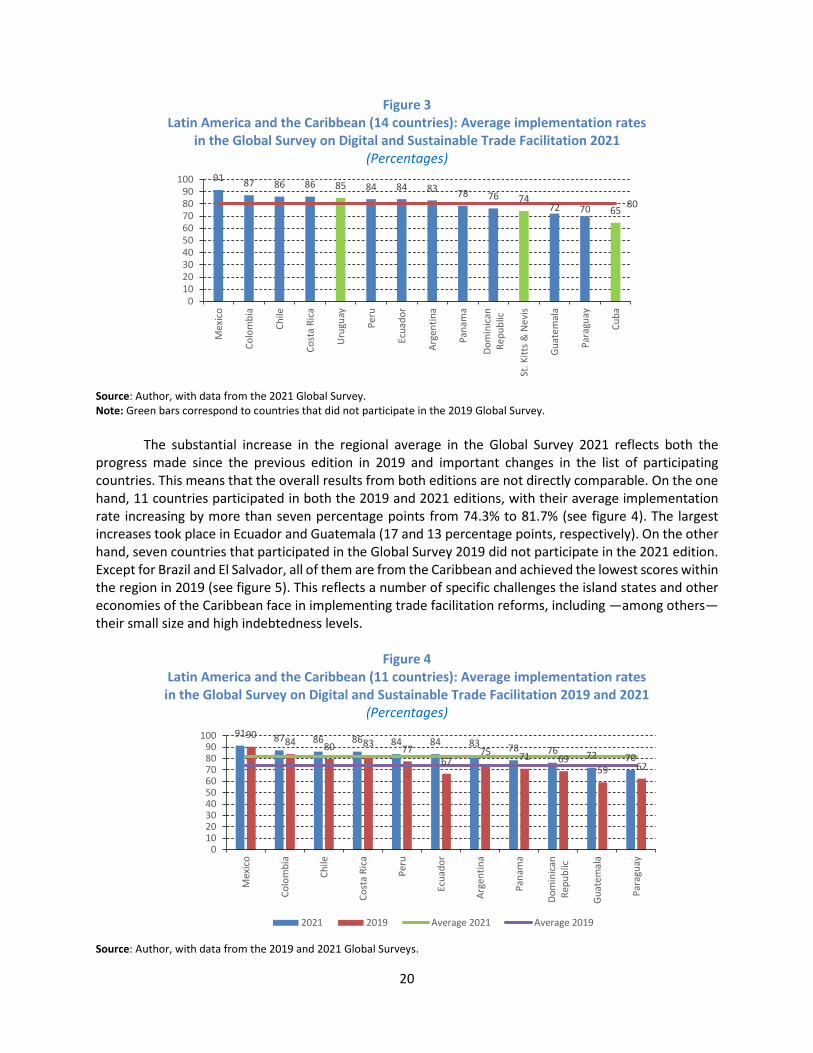
The average implementation rate of the 14 LAC countries participating in the Global Survey 2021 is 80%. This figure is 15 percentage points above the average of the 135 countries that responded the Global Survey 2021 worldwide (65%), and is the highest among all developing regions (see figure 2). The regional average in 2021 is also 13 percentage points higher than the 67% average obtained by the 18 LAC countries that participated in the Global Survey 2019. Same as in the three previous editions of the Global Survey, Mexico achieved the highest implementation rate in 2021 at 91%. Six South American countries obtained implementation rates above 80%, same as Costa Rica in Central America. Cuba registered the lowest score, at 65% (see figure 3).
Figure 2 World (135 countries) and selected regions: Average implementation rates
in the Global Survey on Digital and Sustainable Trade Facilitation 2021 a (Percentages)
Source: Author, based on ESCAP, Digital and Sustainable Trade Facilitation Implementation. Global Report 2021. a The figures in parentheses indicate the number of countries from each region that participated in the survey.
4 The measures corresponding to Electronic Submission of Sea Cargo Manifests, Alignment of Working Days and Hours with
Neighboring Countries at Border Crossings, and Alignment of Formalities and Procedures with Neighboring Countries at Border Crossings were excluded when calculating overall scores as they are not relevant to all countries surveyed. The four Transit Facilitation measures were also excluded for the same reason.
82 8075
69
59 5949
40
0
10
20
30
40
50
60
70
80
90
Developedeconomies
(30)
Latin Americaand the
Caribbean(14)
Southeastand East Asia
(14)
South andEast Europe,Caucasus andCentral Asia
(17)
Middle Eastand NorthAfrica (8)
South Asia(8)
Sub-SaharanAfrica (33)
PacificIslands (11)
World average (65%)
20
Figure 3 Latin America and the Caribbean (14 countries): Average implementation rates
in the Global Survey on Digital and Sustainable Trade Facilitation 2021 (Percentages)
Source: Author, with data from the 2021 Global Survey. Note: Green bars correspond to countries that did not participate in the 2019 Global Survey.
The substantial increase in the regional average in the Global Survey 2021 reflects both the
progress made since the previous edition in 2019 and important changes in the list of participating countries. This means that the overall results from both editions are not directly comparable. On the one hand, 11 countries participated in both the 2019 and 2021 editions, with their average implementation rate increasing by more than seven percentage points from 74.3% to 81.7% (see figure 4). The largest increases took place in Ecuador and Guatemala (17 and 13 percentage points, respectively). On the other hand, seven countries that participated in the Global Survey 2019 did not participate in the 2021 edition. Except for Brazil and El Salvador, all of them are from the Caribbean and achieved the lowest scores within the region in 2019 (see figure 5). This reflects a number of specific challenges the island states and other economies of the Caribbean face in implementing trade facilitation reforms, including —among others— their small size and high indebtedness levels.
Figure 4
Latin America and the Caribbean (11 countries): Average implementation rates in the Global Survey on Digital and Sustainable Trade Facilitation 2019 and 2021
(Percentages)
Source: Author, with data from the 2019 and 2021 Global Surveys.
91 87 86 86 85 84 84 83 78 76 7472 70 65 80
0102030405060708090
100
Mex
ico
Colo
mbi
a
Chile
Cost
a Ri
ca
Uru
guay
Peru
Ecua
dor
Arge
ntin
a
Pana
ma
Dom
inic
anRe
publ
ic
St. K
itts &
Nev
is
Guat
emal
a
Para
guay
Cuba
91 87 86 86 84 84 83 78 76 72 70
9084 80 83 77
6775 71 69
59 62
0102030405060708090
100
Mex
ico
Colo
mbi
a
Chile
Cost
a Ri
ca
Peru
Ecua
dor
Arge
ntin
a
Pana
ma
Dom
inic
anRe
publ
ic
Guat
emal
a
Para
guay
2021 2019 Average 2021 Average 2019

21
Figure 5 Latin America and the Caribbean (7 countries): Average implementation rates
in the Global Survey on Digital and Sustainable Trade Facilitation 2019 (Percentages)
Source: Author, with data from the 2019 Global Survey.
The much smaller representation of the Caribbean in the Global Survey 2021 with respect to 2019 arguably had two main effects: an upward bias in the average implementation rate for the LAC region as a whole and a lower dispersion in country results. In 2019, there was a difference of 47 percentage points between the highest and lowest implementation rates (Mexico and Antigua and Barbuda, respectively) and five countries —all from the Caribbean— had implementation rates below 60%.5 By contrast, in 2021 the difference between the highest and lowest scores (Mexico and Cuba, respectively) was much smaller (27 percentage points) and there were no countries with implementation rates below 60%. Same as in the previous three editions, the subregions of South America and of Central America and Mexico obtained higher scores than the Caribbean (see figure 6). The performance gap was smaller than in previous editions; however, this is partly the result of a much lower participation of small Caribbean economies in the Global Survey 2021 (just one, Saint Kitts and Nevis, versus four in 2019: Antigua and Barbuda, Belize, Guyana and Saint Vincent and the Grenadines).
Figure 6
Latin America and the Caribbean (14 countries): Minimum, average and maximum implementation rates in the Global Survey on Digital and Sustainable Trade Facilitation 2021 by sub-region
(Percentages)
Source: Author, with data from the 2021 Global Survey.
5 Country results for 2019 were reviewed, and in some cases adjusted downwards, in light of the results of the Global Survey
2021. This was done to avoid cases where the implementation level for a certain measure reported by a country in 2019 is higher than that reported in 2021. For this reason, the implementation rates for 2019 mentioned in this report may differ slightly from those in the 2019 regional report (ECLAC, 2019).
8370
55 48 47 45 44
020406080
100
Brazil El Salvador Trinidad &Tobago
Guyana Saint Vicentand the
Grenadines
Belize Antigua andBarbuda
70 72
65
83 82
72
8791
76
6065707580859095
South America (7 countries) Central America and Mexico(4 countries)
The Caribbean (3 countries)
Minimum Average Maximum

22
One factor that has contributed to the good general performance of LAC countries in the Global Survey 2021 is their membership in trade agreements which include trade facilitation commitments. Almost all participating countries are parties to FTAs with developed partners such as the United States and the European Union, which include trade facilitation chapters whose scope often goes beyond that of the TFA. Moreover, they are members of various regional integration agreements which include trade facilitation provisions, although these vary in depth and scope (see table 3).
Table 3 Membership of LAC countries in trade agreements including trade
facilitation commitments a
Participating country
FTAs with developed partners containing trade facilitation commitments
Membership in regional integration agreements containing trade facilitation commitments
Caribbean Cuba None ALADI Dominican Republic EU-CARIFORUM EPA, DR-CAFTA Saint Kitts and Nevis EU-CARIFORUM EPA CARICOM Central America and Mexico Costa Rica EU-Central America FTA, DR-
CAFTA Central American Common Market
Guatemala EU-Central America FTA, DR-CAFTA
Central American Common Market
Mexico European Union, USMCA, CPTPP Pacific Alliance, Mexico- Central America FTA, ALADI
Panama EU-Central America FTA, United States
Central American Common Market (associate member), ALADI
South America Argentina European Union b MERCOSUR, ALADI Chile European Union, United States Pacific Alliance, ALADI Colombia European Union, United States Andean Community, Pacific Alliance,
ALADI Ecuador European Union Andean Community, ALADI Paraguay European Union b MERCOSUR, ALADI Peru European Union, United States,
CPTPP Andean Community, Pacific Alliance, ALADI
Uruguay European Union b MERCOSUR, ALADI Source: Author, with information from Organization of American States, Foreign Trade Information System [online] http://www.sice.oas.org/. a The list is not exhaustive. b An agreement in principle between the four original members of MERCOSUR (Argentina, Brazil, Paraguay and Uruguay) and the European Union was reached on June 28th, 2019 but has not yet been signed. ALADI: Latin American Integration Association. CARICOM: Caribbean Community. CPTPP: Comprehensive and Progressive Agreement for Trans-Pacific Partnership. DR-CAFTA: Dominican Republic-Central America-United States Free Trade Agreement. EPA: Economic Partnership Agreement. EU: European Union. MERCOSUR: Common Market of the South. USMCA: United States-Mexico-Canada Agreement.
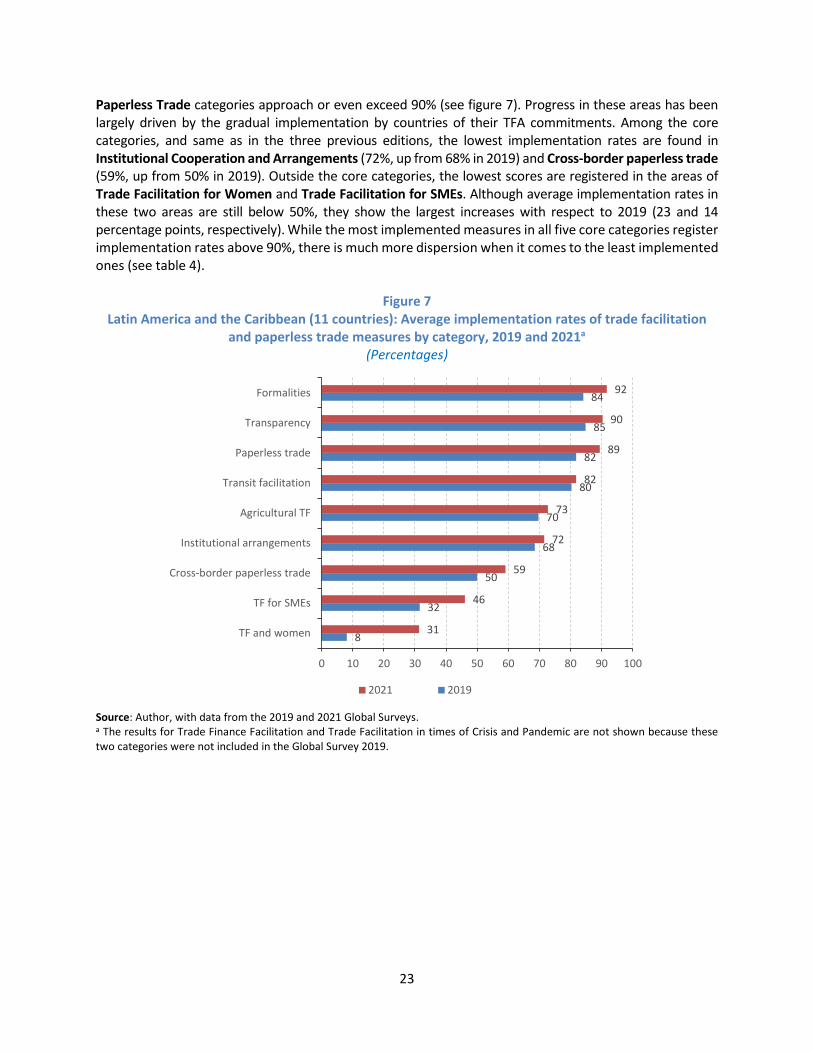
The results of the Global Survey 2021 show an improvement on those achieved in 20196 in all the five core trade facilitation categories. Average implementation rates in the Formalities, Transparency, and
6 This comparative analysis includes only the 11 countries that participated in both the 2019 and 2021 editions of the Global
Survey: Argentina, Chile, Colombia, Costa Rica, Dominican Republic, Ecuador, Guatemala, Mexico, Panama, Paraguay, and Peru.
23
Paperless Trade categories approach or even exceed 90% (see figure 7). Progress in these areas has been largely driven by the gradual implementation by countries of their TFA commitments. Among the core categories, and same as in the three previous editions, the lowest implementation rates are found in Institutional Cooperation and Arrangements (72%, up from 68% in 2019) and Cross-border paperless trade (59%, up from 50% in 2019). Outside the core categories, the lowest scores are registered in the areas of Trade Facilitation for Women and Trade Facilitation for SMEs. Although average implementation rates in these two areas are still below 50%, they show the largest increases with respect to 2019 (23 and 14 percentage points, respectively). While the most implemented measures in all five core categories register implementation rates above 90%, there is much more dispersion when it comes to the least implemented ones (see table 4).
Figure 7 Latin America and the Caribbean (11 countries): Average implementation rates of trade facilitation
and paperless trade measures by category, 2019 and 2021a (Percentages)
Source: Author, with data from the 2019 and 2021 Global Surveys. a The results for Trade Finance Facilitation and Trade Facilitation in times of Crisis and Pandemic are not shown because these two categories were not included in the Global Survey 2019.
8
32
50
68
70
80
82
85
84
31
46
59
72
73
82
89
90
92
0 10 20 30 40 50 60 70 80 90 100
TF and women
TF for SMEs
Cross-border paperless trade
Institutional arrangements
Agricultural TF
Transit facilitation
Paperless trade
Transparency
Formalities
2021 2019

24
Table 4 Latin America and the Caribbean (14 countries): Most and least implemented measures
in the five core categories of the Global Survey on Digital and Sustainable Trade Facilitation 2021
Category Most implemented measures Rate (percentages)
Least implemented measures
Rate (percentages)
Formalities • Post clearance audits 100 • Establishment and publication of average release times
79
• Expedited shipments 95
Transparency • Advance publication/notification of new regulations before their implementation
• Independent appeal mechanism
91
• Publication of existing import-export regulations on the internet
• Advance rulings on tariff classification and origin of imported goods
86
Institutional cooperation and arrangements
• Establishment of National Trade Facilitation Committee
98 • Government agencies delegate border controls to customs authorities
5
• National legislative frameworks or institutional arrangements to ensure border agency cooperation
93
Paperless trade • Electronic submission of air cargo manifests
• Electronic submission of sea cargo manifests
98 • Electronic application for customs refunds
64
Cross-border paperless trade
• Laws and regulations for electronic transactions
91 • Electronic exchange of customs declarations
43
• Recognized certification authorities issue digital certificates to traders to conduct electronic transactions
83 • Exporters collect payment from a documentary letter of credit electronically without lodging paper-based documents
24
Source: Author, with data from the Global Survey on Digital and Sustainable Trade Facilitation 2021.
There are 15 measures whose average implementation rates increased by 9 percentage points or more between the 2019 and 2021 Global Surveys (see figure 8). Within the group of core TF measures, most progress was made on the establishment and publication of average release times, the cross-border

25
electronic exchange of sanitary and phytosanitary (SPS) certificates, the electronic application and issuance of import and export permits, and the advance publication of new regulations. Among the Sustainable TF measures, the biggest gains were made in those targeted at SMEs, such as ensuring their participation in National Trade Facilitation Committees and promoting their use of the Authorized Economic Operator scheme and of the Single Window.
Figure 8 Latin America and the Caribbean (11 countries): Largest variations in average implementation rates of
trade facilitation and paperless trade measures between 2019 and 2021 (Percentage points)
Source: Author, with data from the 2019 and 2021 Global Surveys.
B. Transparency measures7 The five transparency measures included in the Global Survey are based on Articles 1 through 4 of the TFA. They refer to the publication of import and export regulations on the Internet; stakeholder consultation on new draft regulations; advance publication or notification of new regulations prior to their entry into force; the issuance of advance rulings; and the existence of an independent mechanism for
7 The analysis in sections B to L includes the 14 countries that participated in the Global Survey 2021.
9
9
9
12
12
12
12
15
18
18
18
18
21
21
27
0 5 10 15 20 25 30
Pre-arrival processing
Electronic Single Window system
Trade facilitation measures aimed at female traders
Risk management
Paperless collection of payment from a documentary letter of credit
Trade-related information measures for SMEs
National Trade Facilitation Committee (NTFC)
Electronic application for Customs refunds
Measures to ease SME access to single window
Measures to ease SME access to AEO
Advance publication/notification of new trade-related regulationsbefore their implementation
Electronic application and issuance of import and export permits
SME participation in NTFC
Electronic exchange of SPS certificates
Establishment and publication of average release times

26
traders to appeal rulings from customs and other relevant trade control agencies. These measures are based on, and expand upon, the commitments in Article X (Publication and administration of trade regulations) of the General Agreement on Tariffs and Trade (GATT).
The 14 LAC countries that participated in the Global Survey 2021 obtained their second-highest implementation rate in the area of transparency (88%). Its five measures obtained average implementation rates in the 86% to 91% range. In each of them, the majority of countries reported full implementation, while in almost all remaining cases countries reported partial implementation (see figure 9). Subregional differences in performance are small, except concerning advance rulings, where on average Caribbean participants lag the rest of the region by a considerable margin (see figure 10).
Figure 9 Latin America and the Caribbean (14 countries): Implementation of transparency measures, 2021
(Percentages and number of countries at each implementation level)
Source: Author, with data from the Global Survey on Digital and Sustainable Trade Facilitation 2021.
The availability of an independent appeal mechanism (TFA Article 4) achieves a 91% average
implementation rate. Participating countries have taken different approaches to implementation. In some cases, they have established customs and/or tax courts with exclusive jurisdiction; in other cases, countries have expanded the jurisdiction of already existing local and/or national court systems to include customs matters. The only countries that still reported partial implementation of this measure were Ecuador, Panama, Paraguay, and Saint Kitts and Nevis, despite the fact that all notified this measure in Category A of the TFA (implementation upon entry into force of the agreement in February 2017). In the case of Ecuador, it was stated that although its customs agency has published the procedures for lodging appeals, other border control agencies have not done so yet. Panama indicated that it was in the process of appointing the members of its customs tribunal. Paraguay and Saint Kitts and Nevis did not provide further details.
8
10
10
10
10
6
3
4
3
4
1
1
0% 10% 20% 30% 40% 50% 60% 70% 80% 90% 100%
Publication of existing import-export regulations on the Internet
Stakeholder consultation on new draft regulations
Advance publication/notification of new regulations beforeimplementation
Advance rulings
Independent appeal mechanism
Fully implemented Partially implemented Pilot stage Not implemented
27
Figure 10 Latin America and the Caribbean (14 countries): Average implementation rates
of transparency measures by subregion, 2021 (Percentages)
Source: Author, with data from the Global Survey on Digital and Sustainable Trade Facilitation 2021.
The advance publication or notification of new regulations (corresponding to TFA Article 2.1) also scores a 91% average implementation rate. This measure was reported as partially implemented only by Argentina, Ecuador, Guatemala and Paraguay. Argentina reported that this practice is followed in some cases but not as a standard policy. In Guatemala, some government agencies publish or notify new regulations before their entry force, but there is no general rule that requires them to do so. Only technical regulations approved at the Central American level have a period between 30 and 180 days between their approval and entry into force, depending on their nature and the complexity of their implementation. Paraguay indicated that its National Trade Facilitation Committee (NTFC) is working on a presidential decree that will establish a mechanism to publish the drafts of new regulations before their entry into force, as well as to consult interested stakeholders. Ecuador did not provide further details on ongoing work in this area.
The publication of import-export regulations (corresponding to TFA Articles 1.1 and 1.2) obtained
an 88% average implementation rate. This provision commits governments to make import, export and transit laws and procedures available in a non-discriminatory and easily accessible manner to other governments, traders and interested persons. Six countries show partial implementation of this measure: Cuba, Ecuador, Guatemala, Panama, Paraguay, and Saint Kitts and Nevis. Cuba has an online portal with trade regulations and procedures available in multiple languages;8 however, it indicated that there is no legal act or formal policy requiring publication of existing import-export regulations on the Internet. The country has committed to implement TFA Articles 1.1 and 1.2 by 22 February 2022.9 In the case of Ecuador, regulations are published online by its customs agency but are not available in English. Guatemala has a new online foreign trade portal since March 202010 but indicated that is still being completed. Panama reported that it is working towards full implementation of TFA Articles 1.1 and 1.2 by 1 June 2022. Paraguay reported that it currently
8 See (online] https://vuceregulaciones.mincex.gob.cu/. 9 See [online] https://tfadatabase.org/members/cuba/breakdown-by-measure. 10 See [online] https://comercioeinversionguate.gob.gt/.
0
20
40
60
80
100
Publication of existing import-export regulations on the Internet
Stakeholder consultation on newdraft regulations
Advance publication/notificationof new regulations before
implementationAdvance rulings
Independent appeal mechanism
Latin America and the Caribbean South America Central America and Mexico The Caribbean
28
has neither an online portal nor a legal act or formal policy requiring publication of import-export regulations on the Internet; however, it has committed to implement TFA Articles 1.1 and 1.2 by 1 September 2021.11 Finally, Saint Kitts and Nevis notified TFA Article 1.1 in Category B, with 31 December 2021 as its original implementation date, and subsequently obtained an extension until 31 December 2022 due to the COVID-19 pandemic.12
Stakeholder consultations (TFA Article 2.2) also obtained an 88% average implementation rate. This provision requires that border agencies hold regular consultations with traders and other interested parties on trade-related and customs regulations. Only three countries (Argentina, Guatemala and Uruguay) reported partial implementation of this measure. In Argentina, there exists since 2003 a general framework for the participatory elaboration of laws and other norms (Presidential Decree 1,172) which includes procedures for consulting interested parties. However, there are no specific mechanisms for consultations on trade regulations. In Guatemala, the norms subject to public consultation are those referring to Central American technical, sanitary and phytosanitary regulations, which are published on the internet by the Ministry of Economy. Regulations issued by the customs authority are also subject to public consultation on the internet, unlike other trade regulations. In the case of Uruguay, no further details were provided. Stakeholder consultations are still at the pilot stage in Paraguay, in the context of the advance publication project mentioned above.
Advance rulings (TFA Article 3) relate to traders’ right to obtain a binding decision from the authorities of the importing country, prior to the importation, covering at least the tariff classification of the goods being imported and their origin. These rulings may include additional information, such as the tariff treatment accorded to the imported goods. This commitment is also a standard discipline contained in modern FTAs. Participating countries obtained an average implementation rate of 86% in this measure. Only three countries (Cuba, Paraguay and Peru) reported its partial implementation. In the case of Cuba, advance rulings are part of a draft customs law currently under development. The country notified this measure under Category B of the TFA, with 22 February 2022 as its definitive implementation date.13 In the case of Paraguay, it was reported that advance rulings have been implemented but cannot be requested online. That is also the case in Peru, where there is ongoing work to allow advance rulings to be requested and obtained through the single window. Saint Kitts and Nevis reported that this measure was still not being implemented. The country notified it in Category C of the TFA, with 31 December 2021 as its definitive implementation date.14
C. Formalities measures The Global Survey examines eight measures collectively referred to as Formalities: risk management; pre-arrival processing; post-clearance audit; separation of release from final determination of customs duties and fees; establishment and publication of average release times; authorized operators; expedited shipments; and acceptance of paper or electronic copies of supporting documents. These measures are based on Articles 7 and 10 of the TFA which, in turn, build upon GATT Article VIII (Fees and Formalities connected with Importation and Exportation). Together, the eight measures seek to simplify the formalities for importing and exporting (for example, document and information requirements) and
11 See World Trade Organization, Trade Facilitation Agreement Database, [online] https://tfadatabase.org/members/
paraguay/breakdown-by-measure. 12 See [online] https://tfadatabase.org/members/saint-kitts-and-nevis/breakdown-by-measure. 13 See https://tfadatabase.org/members/cuba/breakdown-by-measure/article-3. 14 See [online] https://tfadatabase.org/members/saint-kitts-and-nevis/technical-assistance-projects/article-3.
29
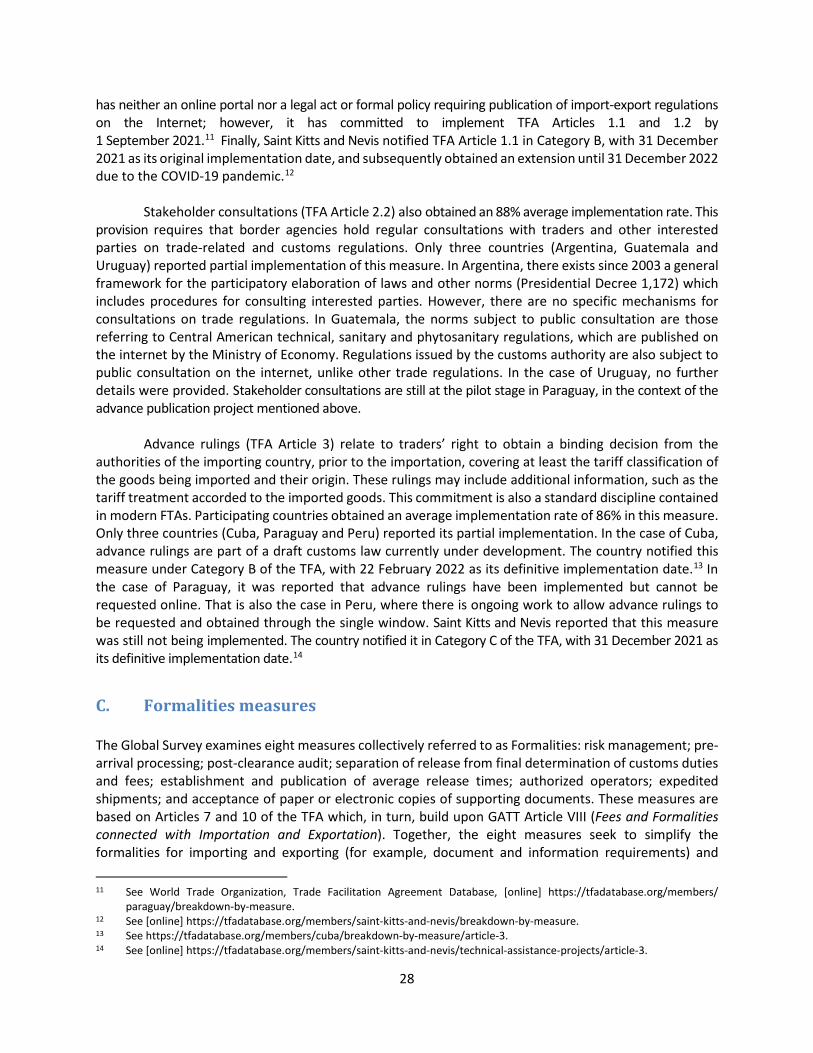
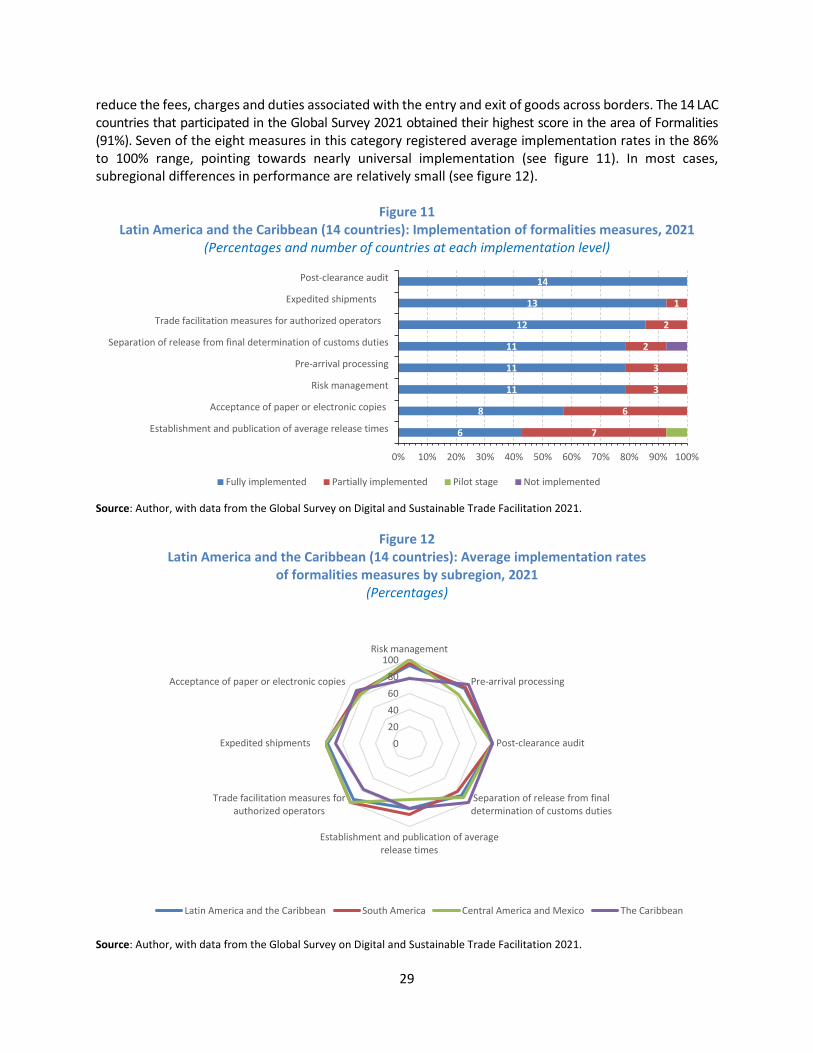
reduce the fees, charges and duties associated with the entry and exit of goods across borders. The 14 LAC countries that participated in the Global Survey 2021 obtained their highest score in the area of Formalities (91%). Seven of the eight measures in this category registered average implementation rates in the 86% to 100% range, pointing towards nearly universal implementation (see figure 11). In most cases, subregional differences in performance are relatively small (see figure 12).
Figure 11 Latin America and the Caribbean (14 countries): Implementation of formalities measures, 2021
(Percentages and number of countries at each implementation level)
Source: Author, with data from the Global Survey on Digital and Sustainable Trade Facilitation 2021.
Figure 12
Latin America and the Caribbean (14 countries): Average implementation rates of formalities measures by subregion, 2021
(Percentages)
Source: Author, with data from the Global Survey on Digital and Sustainable Trade Facilitation 2021.
6
8
11
11
11
12
13
14
7
6
3
3
2
2
1
0% 10% 20% 30% 40% 50% 60% 70% 80% 90% 100%
Establishment and publication of average release times
Acceptance of paper or electronic copies
Risk management
Pre-arrival processing
Separation of release from final determination of customs duties
Trade facilitation measures for authorized operators
Expedited shipments
Post-clearance audit
Fully implemented Partially implemented Pilot stage Not implemented
020406080
100Risk management
Pre-arrival processing
Post-clearance audit
Separation of release from finaldetermination of customs duties
Establishment and publication of averagerelease times
Trade facilitation measures forauthorized operators
Expedited shipments
Acceptance of paper or electronic copies
Latin America and the Caribbean South America Central America and Mexico The Caribbean

30
Post clearance audits (TFA Article 7.5) are fully implemented by all LAC participants in the Global Survey 2021. This measure refers to customs’ verification of compliance with customs regulations through examination of traders’ books and records at the premises following the release of goods. Under the TFA, post-clearance audits must be conducted with a view to expedite the release of goods and, wherever practical, inform risk management. Moreover, audits must be transparent and the persons subject to audit should be notified of the results.
Expedited shipments (TFA Article 7.8) are the second most widely implemented Formalities measure (98%). It refers to trade facilitation procedures allowing for expedited release of at least those goods entered through air cargo facilities to persons or entities (for example, express shipping companies) that apply for such procedure, while maintaining customs control. Besides being part of the TFA, this provision features in all the FTAs signed by LAC countries with the United States since 2000, as well as in the Pacific Alliance (PA) free trade agreement, the Comprehensive and Progressive Agreement for Trans-Pacific Partnership (CPTPP)15 and the United States-Mexico-Canada Agreement (USMCA). The importance of this provision has grown substantially in recent years as a result of the increasing popularity of cross-border e-commerce, which poses the challenge for customs offices of handling an ever-increasing volume of small packages (Herreros, 2019). Among participating countries, only Cuba reported partial implementation of this measure. The country notified it under Category B of the TFA, with February 2022 as its definitive implementation date.16
The establishment of trade facilitation measures for authorized economic operators (AEO) is a commitment contained in TFA Article 7.7. This is the third most implemented Formalities measure among LAC participants (95%). The only two countries that have partially implemented it are Cuba and Saint Kitts and Nevis. Cuba reported that it already has an AEO program in place but the procedures for the submission and review of applications for AEO status are not published online yet. The country notified TFA Article 7.7 in Category B, with 22 February 2022 as its definitive implementation date.17 In the case of Saint Kitts and Nevis, TFA Article 7.7 was notified in Category C, with 31 December 2021 as its original implementation date. The country subsequently obtained an extension until 31 December 2023 on account of the COVID-19 pandemic.18
AEO programs across the region vary in terms of their requisites for certification, the types of
firms that can apply, the benefits conferred and their duration, among other variables. Therefore, Mutual Recognition Agreements (MRA) are important to ensure that a firm that has obtained AEO status in its home country can enjoy the same (or similar) benefits in other countries where it operates. In recent years, LAC countries have concluded several MRAs among themselves (especially within their own regional integration blocs) and increasingly with extra regional partners too (see table 5). A promising development is the initiative, launched in 2019, to conclude a multilateral MRA between the AEO schemes of nine countries (Argentina, Brazil, Chile, Dominican Republic, Colombia, Guatemala, Paraguay, Peru and Uruguay). This process has been delayed by the pandemic, but discussions continue.
15 Chile, Mexico and Peru are parties to the CPTPP, signed in March 2018. Mexico and Peru had ratified it as of July 2021. 16 See [online] https://tfadatabase.org/members/cuba/breakdown-by-measure/article-7-8. 17 See [online] https://tfadatabase.org/members/cuba/breakdown-by-measure/article-7-7. 18 See [online] https://tfadatabase.org/members/saint-kitts-and-nevis/breakdown-by-measure/article-7-7.

31
Table 5 Selected LAC countries: Signed Mutual Recognition Agreements of Authorized Economic
Operator programs, as of June 2021
Country LAC partners Non-LAC partners Argentina Uruguay, MERCOSUR Chile Pacific Alliance Colombia Andean Community, Pacific Alliance, Costa Rica Costa Rica Central America (El Salvador, Guatemala, Panama),
Colombia, Mexico
Ecuador Andean Community Guatemala Central America (Costa Rica, El Salvador, Panama) Mexico Costa Rica, Pacific Alliance Canada, Israel, Republic of Korea,
United States Panama Central America (Costa Rica, El Salvador,
Guatemala)
Paraguay MERCOSUR Peru Andean Community, Pacific Alliance, Brazil,
Uruguay Republic of Korea, United States
Uruguay Argentina, Bolivia (Plurinational State of), Brazil, Peru, MERCOSUR
China, Republic of Korea
Source: Author, with data from the Global Survey on Digital and Sustainable Trade Facilitation 2021.
Pre-arrival processing (TFA Article 7.1) refers to customs and other border agencies allowing importers to submit documentation and other information required for release of imported goods, in electronic format where appropriate, prior to the arrival of the goods in order to expedite their release. Participating countries achieved a 93% average implementation rate for this measure. Only three countries reported partial implementation: Argentina, Guatemala and Panama. Argentina notified this measure in Category A of the TFA, with immediate implementation upon entry into force of the agreement. However, the response to the Global Survey 2021 indicated that some procedures for pre-arrival processing have not been published. In Guatemala, pre-arrival processing is already in place for imports arriving by sea and air, but its implementation for land cargo is in progress. Panama also indicated that it is working towards full implementation of this measure.
Separation of release (TFA Article 7.3) means that the customs agency allows importers to obtain release of their goods —under a guarantee if required— prior to the final determination of applicable customs duties, taxes, fees and charges when such determination is not done prior to, upon arrival, or as rapidly as possible after arrival of the goods. The overall compliance rate for this measure is 88%. Only two countries (Guatemala and Paraguay) reported partial implementation, without providing further details. Uruguay responded that currently it is not implementing this measure but is working towards its implementation by the date indicated in its TFA Category B notification (1 February 2022).
Risk management (TFA Article 7.4) is the methodology or practice that customs and other border control agencies use to determine which transactions or operators should be subject to control, and the type and degree of control to be applied. The TFA requires that customs apply control on high-risk consignments and expedite the release of low-risk goods. In order to do this, appropriate selectivity criteria must be applied. Risk management has a 93% compliance rate among participating countries. Only the Dominican Republic, Ecuador, and Saint Kitts and Nevis register partial implementation. The three countries notified this measure in TFA Category C, with their definitive implementation dates being 1 June 2023, 15 January 2022, and 31 December 2022, respectively.

32
The acceptance of paper or electronic copies of original supporting documents required for import, export or transit formalities (TFA Article 10.2) has an 86% implementation rate among participating countries. Eight of them reported total implementation of this measure, with the remaining six (Argentina, Colombia, Dominican Republic, Guatemala, Panama and Paraguay) reporting partial implementation. Notably, only the Dominican Republic notified this measure in TFA Category C, with an original implementation date of 31 December 2021. The country has requested an extension until 1 June 2023 due to the COVID-19 pandemic and the insufficient assistance received.19
Despite significant progress over recent years, the least implemented measure in the Formalities
group continues to be the establishment and publication of average release times of goods (TFA Article 7.6) at 79%. This is the only measure where the number of countries reporting partial implementation (seven)20 is higher than that of countries indicating full implementation (six).21 Argentina reported that, although its customs agency measures average release times, it still does not do so according to the methodology suggested in the TFA, the Time Release Study (TRS) of the World Customs Organization (WCO). Chile, Cuba, the Dominican Republic, Guatemala and Mexico responded that average release times are still not published regularly, whereas Peru reported that they are published regularly only for imports. All countries indicated that they are working towards full compliance with this measure, although in some cases progress has been slowed down by the COVID-19 pandemic.
D. Institutional arrangements and cooperation measures The five measures in this group are based on Articles 8 and 23 of the TFA and concern the institutional and policy framework necessary for implementation of other trade facilitation and paperless trade measures. The establishment of a national trade facilitation committee (NTFC) refers to a formal institutional arrangement bringing together government actors and the private sector to identify and address challenges to streamline trade procedures. The other four measures try to capture the extent to which customs and other agencies involved in import, export and transit transactions cooperate with each other, both within each country and between neighboring countries. Participating LAC countries obtain an average 72% implementation rate in this category, and four measures register implementation rates above 80% (see figure 13).
Progress in the establishment of NTFCs —a key commitment in the TFA— is especially noteworthy,
with an implementation rate of 98%. Only one country, Argentina, reported partial implementation. It indicated that its NTFC was created by decree in 2019 but is still not operative because the legal document regulating its operation is still pending. The existence of legal and institutional arrangements to ensure cooperation among border agencies within each country also scores highly (93%). The alignment of working days and hours and of formalities and procedures with neighboring countries achieved lower but still high implementation levels, above 80%. These two measures register above average scores in the subregion comprised by Central America and Mexico, owing to the close trade integration achieved among Central American countries.
19 See [online] https://tfadatabase.org/members/dominican-republic/breakdown-by-measure/article-10-2. 20 Argentina, Chile, Cuba, Dominican Republic, Guatemala, Mexico and Peru. Panama indicated it is at the pilot stage. 21 Colombia, Costa Rica, Ecuador, Paraguay, Saint Kitts and Nevis, and Uruguay.

33
Figure 13 Latin America and the Caribbean (14 countries): Average implementation rates of institutional
cooperation and arrangements measures by subregion, 2021a (Percentages)
Source: Author, with data from the Global Survey on Digital and Sustainable Trade Facilitation 2021. a The questions about alignment of working days and hours and of formalities and procedures with neighboring countries are not applicable to Cuba and Saint Kitts and Nevis. Therefore, results are not presented for the Caribbean.
In sharp contrast with the above measures, the delegation of border control functions by other agencies to customs remains almost inexistent among participant countries. It obtained a 5% average implementation rate, the lowest for this measure among all world regions. Only Argentina reported some practices in this regard which point towards partial implementation. This is the highest form of inter-agency collaboration, demanding a high level of trust among all agencies concerned in border controls. Delegation of border control functions is very common in developed countries (80%) and, to a lesser extent, in East and Southeast Asia (ESCAP, 2021). E. Paperless trade measures The Global Survey 2021 examines ten paperless trade measures. These relate to the use of information and communications technology (ICT) to fulfill trade-related formalities. The measures examined in the Global Survey are based, in part, on TFA Articles 7 and 10 as well as on “TFA-plus” commitments contained in the Framework Agreement on Facilitation of Cross-border Paperless Trade in Asia and the Pacific, adopted by ESCAP in May 2016 and which entered into force on 20 February 2021. Article 3(c) of the Framework Agreement defines paperless trade as “trade in goods, including their import, export, transit and related services, taking place on the basis of electronic communications, including exchange of trade-related data and documents in electronic form”.22 Participating LAC countries achieved an 87% average implementation rate within the Paperless Trade category, with eight of its 10 measures showing implementation rates above 80%. Nevertheless, there is considerable variation in implementation levels across individual measures and subregions (see figures 14 and 15).
22 See [online] https://treaties.un.org/doc/Treaties/2016/05/20160519%2012-16%20PM/Ch_X-20.pdf.
98 95 100 10093 90 92 10086 81
9281 81 83
5 10
0
20
40
60
80
100
Latin America and theCaribbean
South America Central America andMexico
The Caribbean
Establishment of National Trade Facilitation CommitteeNational legislative framework and institutional arrangements ensure border agency cooperationAlignment of working days and hours with neighbouring countriesAlignment of formalities and procedures with neighbouring countriesGovernment agencies delegate border controls to customs authorities

34
Figure 14 Latin America and the Caribbean (14 countries): Implementation of paperless trade measures, 2021
(Percentages and number of countries at each implementation level)
Source: Author, with data from the Global Survey on Digital and Sustainable Trade Facilitation 2021.
Figure 15
Latin America and the Caribbean (14 countries): Average implementation rates of paperless trade measures by subregion, 2021
(Percentages)
Source: Author, with data from the Global Survey on Digital and Sustainable Trade Facilitation 2021.
6
7
8
9
10
11
12
12
13
13
7
3
5
4
4
2
2
2
1
1
4
1
1
1
0% 10% 20% 30% 40% 50% 60% 70% 80% 90% 100%
Electronic application and issuance of Preferential Certificates of Origin
Electronic application for Customs refunds
Electronic Single Window System
Electronic application and issuance of import and export permits
Internet connection available at border-crossings
Electronic payment of Customs duties and fees
Automated customs system
Electronic submission of Customs declarations
Electronic Submission of Sea Cargo Manifests
Electronic submission of Air Cargo Manifests
Fully implemented Partially implemented Pilot stage Not implemented
0
20
40
60
80
100
Automated customssystem
Internet connectionavailable at border-
crossings
Electronic SingleWindow System
Electronic submission ofCustoms declarations
Electronic applicationand issuance of import
and export permitsElectronic Submission of
Sea Cargo Manifests
Electronic submission ofAir Cargo Manifests
Electronic applicationand issuance of
Preferential…
Electronic payment ofCustoms duties and fees
Electronic applicationfor Customs refunds
Latin America and the Caribbean South America
Central America and Mexico The Caribbean

35
The establishment of an electronic single window (ESW) plays a crucial role in the Paperless Trade category because it provides the platform that allows implementing most of the remaining measures. According to TFA Article 10.4, a single window refers to a facility that enables parties involved in trade and transport to submit documentation and/or data requirements for importation, exportation, or transit of goods through a single-entry point. When the single window is electronic, ITC is used to allow data and documents to be submitted and exchanged electronically. The ESW is probably one of the most challenging measures in the TFA, in terms of its financial, technological and interagency coordination requirements. Participating countries obtained an 81% implementation rate, with five countries (Argentina, Cuba, Ecuador, Guatemala and Panama) reporting partial implementation. All of them indicated that there were still relevant stakeholders not connected to the ESW. Moreover, in the case of Guatemala, the ESW is operational for exports only, and can be used to request some export permits online but these still have to be collected physically. All five countries reported ongoing work towards full implementation of the ESW. Saint Kitts and Nevis was the only country indicating that currently it is not implementing this measure at all. Except for Cuba, the six countries have definitive dates for implementation of the ESW between 1 January 2022 and 31 December 2023.23
The remaining nine measures examined in this section relate to specific electronic transactions and to the ICT infrastructure and support needed for paperless trade. The two most extensively implemented measures are the electronic submission of air cargo and sea cargo manifests (98%). In both cases, only Cuba reported partial implementation. The electronic submission of customs declarations and the existence of an automated customs system come next (95%). In the first case, only Argentina and Paraguay indicated partial implementation, while in the second it was only Costa Rica and the Dominican Republic. The other measure relating to infrastructure concerns the availability of an Internet connection to all customs and other trade control agencies at border crossings. This measure obtained a 91% implementation rate, with four countries (Argentina, Cuba, Panama and Peru) informing its partial implementation.
The electronic payment of customs duties, taxes, fees and charges (TFA Article 7.2) and the electronic application and issuance of trade permits register relatively high implementation rates among participating countries (88% and 83%, respectively). In both cases, only Cuba reported no implementation at this point. In the four countries where the electronic application and issuance of trade permits is being partially implemented (Chile, Ecuador, Guatemala and Paraguay), this reflects one or more of the following possibilities: (i) not every permit is available electronically; (ii) permits are available either for export or import but not both; (iii) not all relevant public agencies that can issue permits are equipped to do so electronically; or (iv) notwithstanding electronic application and issuance, physical copies must still be exchanged between the trader and the relevant agency. Nevertheless, all countries reported ongoing work towards full digitalization of permits.
Given the large number of FTAs and other preferential trade agreements to which countries in
the region are signatories, the electronic application and issuance of preferential certificates of origin is particularly important. Participating countries achieved a 79% average implementation rate for this measure. Seven countries from all three subregions (Argentina, Dominican Republic, Guatemala, Panama, Paraguay, Saint Kitts and Nevis, and Uruguay) reported partial implementation, with Cuba informing it was at the pilot stage. Finally, the electronic application for customs refunds remains the least implemented measure in the Paperless Trade category (64%), with four countries (Costa Rica, Dominican
23 In the case of Cuba, 23 February 2023 has been provided as an indicative implementation date as per the country´s Category
C notification. See [online] https://tfadatabase.org/members/cuba/breakdown-by-measure/article-10-4.
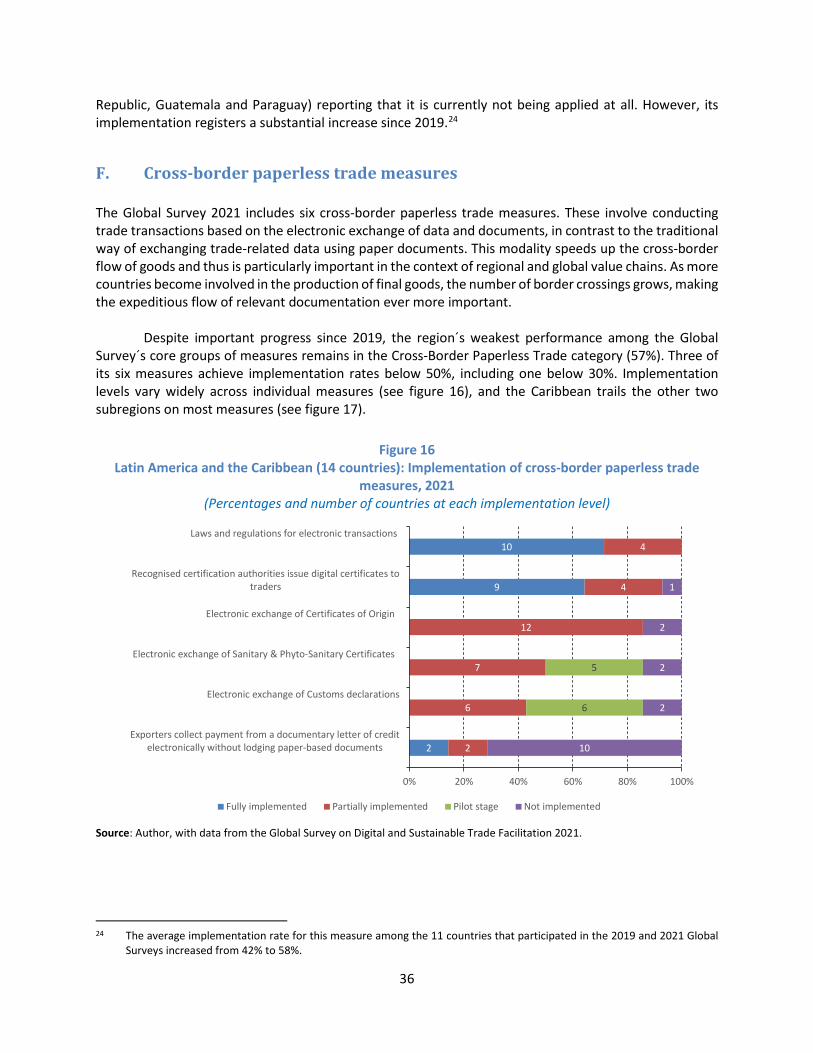
36
Republic, Guatemala and Paraguay) reporting that it is currently not being applied at all. However, its implementation registers a substantial increase since 2019.24
F. Cross-border paperless trade measures The Global Survey 2021 includes six cross-border paperless trade measures. These involve conducting trade transactions based on the electronic exchange of data and documents, in contrast to the traditional way of exchanging trade-related data using paper documents. This modality speeds up the cross-border flow of goods and thus is particularly important in the context of regional and global value chains. As more countries become involved in the production of final goods, the number of border crossings grows, making the expeditious flow of relevant documentation ever more important.
Despite important progress since 2019, the region´s weakest performance among the Global
Survey´s core groups of measures remains in the Cross-Border Paperless Trade category (57%). Three of its six measures achieve implementation rates below 50%, including one below 30%. Implementation levels vary widely across individual measures (see figure 16), and the Caribbean trails the other two subregions on most measures (see figure 17).
Figure 16 Latin America and the Caribbean (14 countries): Implementation of cross-border paperless trade
measures, 2021 (Percentages and number of countries at each implementation level)
Source: Author, with data from the Global Survey on Digital and Sustainable Trade Facilitation 2021.
24 The average implementation rate for this measure among the 11 countries that participated in the 2019 and 2021 Global
Surveys increased from 42% to 58%.
2
9
10
2
6
7
12
4
4
6
5
10
2
2
2
1
0% 20% 40% 60% 80% 100%
Exporters collect payment from a documentary letter of creditelectronically without lodging paper-based documents
Electronic exchange of Customs declarations
Electronic exchange of Sanitary & Phyto-Sanitary Certificates
Electronic exchange of Certificates of Origin
Recognised certification authorities issue digital certificates totraders
Laws and regulations for electronic transactions
Fully implemented Partially implemented Pilot stage Not implemented

37
Figure 17 Latin America and the Caribbean (14 countries): Average implementation rates of cross-border
paperless trade measures by subregion, 2021 (Percentages)
Source: Author, with data from the Global Survey on Digital and Sustainable Trade Facilitation 2021.
Two measures —the existence of laws and regulations for electronic transactions and of recognized certification authorities issuing digital certificates to traders to enable them to conduct electronic transactions25— are considered the “basic building blocks toward enabling the exchange and legal recognition of trade-related data and documents” (ESCAP, 2015). These are precisely the two most implemented measures in the Cross-border Paperless Trade category, with average implementation rates of 91% and 83%, respectively. The majority of countries reported full implementation of both, with only Saint Kitts and Nevis indicating no implementation of the latter.
Cross-border paperless trade involves the electronic exchange of documents that are necessary
to complete an international trade transaction. The Global Survey examines two specific documents: certificates of origin and sanitary and phytosanitary certificates. Certificates of origin serve as sworn declarations by exporters to identify the origin of a product in order to determine if preferential treatment will be granted and/or what duties will be assessed on the product. Sanitary and phytosanitary (SPS) certificates, for their part, are used by exporters to indicate that a product complies with the importing country’s food safety standards as well as its animal and plant health regulations. Participating countries obtain a 79% implementation rate for the electronic application and issuance of certificates of origin to traders within each country (see Section E above); however, their results are much lower for the cross-border electronic exchange of those certificates between countries (57%). The latter
25 For digital signatures to be recognized and accepted (as part of electronic trade transactions), a trusted third party known
as a certification authority is needed to issue digital certificates that serve to verify the electronic identities of users and organizations.
0
20
40
60
80
100
Laws and regulations forelectronic transactions
Recognised certificationauthorities issue digitalcertificates to traders
Electronic exchange ofCustoms declarations
Electronic exchange ofCertificates of Origin
Electronic exchange ofSanitary & Phyto-Sanitary
Certificates
Exporters collectpayment from a
documentary letter ofcredit electronically
without lodging paper-based documents
Latin America and the Caribbean South AmericaCentral America and Mexico The Caribbean
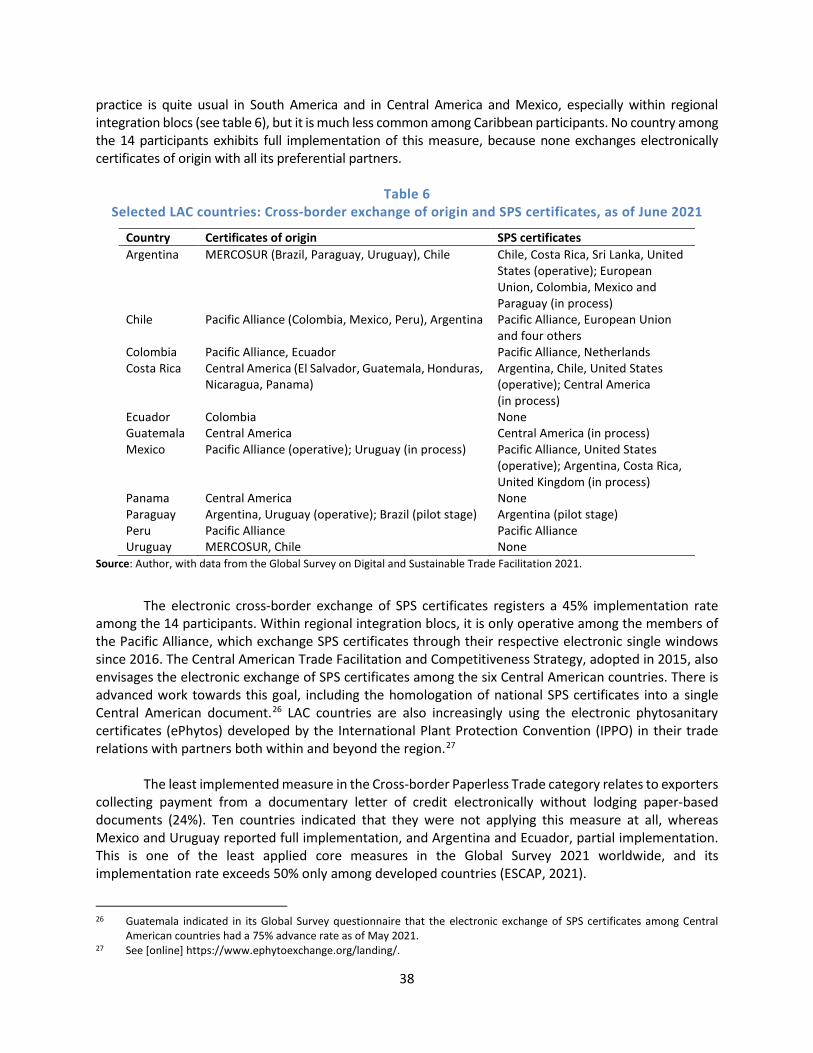
38
practice is quite usual in South America and in Central America and Mexico, especially within regional integration blocs (see table 6), but it is much less common among Caribbean participants. No country among the 14 participants exhibits full implementation of this measure, because none exchanges electronically certificates of origin with all its preferential partners.
Table 6 Selected LAC countries: Cross-border exchange of origin and SPS certificates, as of June 2021
Country Certificates of origin SPS certificates Argentina MERCOSUR (Brazil, Paraguay, Uruguay), Chile Chile, Costa Rica, Sri Lanka, United
States (operative); European Union, Colombia, Mexico and Paraguay (in process)
Chile Pacific Alliance (Colombia, Mexico, Peru), Argentina Pacific Alliance, European Union and four others
Colombia Pacific Alliance, Ecuador Pacific Alliance, Netherlands Costa Rica Central America (El Salvador, Guatemala, Honduras,
Nicaragua, Panama) Argentina, Chile, United States (operative); Central America (in process)
Ecuador Colombia None Guatemala Central America Central America (in process) Mexico Pacific Alliance (operative); Uruguay (in process) Pacific Alliance, United States
(operative); Argentina, Costa Rica, United Kingdom (in process)
Panama Central America None Paraguay Argentina, Uruguay (operative); Brazil (pilot stage) Argentina (pilot stage) Peru Pacific Alliance Pacific Alliance Uruguay MERCOSUR, Chile None
Source: Author, with data from the Global Survey on Digital and Sustainable Trade Facilitation 2021.
The electronic cross-border exchange of SPS certificates registers a 45% implementation rate among the 14 participants. Within regional integration blocs, it is only operative among the members of the Pacific Alliance, which exchange SPS certificates through their respective electronic single windows since 2016. The Central American Trade Facilitation and Competitiveness Strategy, adopted in 2015, also envisages the electronic exchange of SPS certificates among the six Central American countries. There is advanced work towards this goal, including the homologation of national SPS certificates into a single Central American document.26 LAC countries are also increasingly using the electronic phytosanitary certificates (ePhytos) developed by the International Plant Protection Convention (IPPO) in their trade relations with partners both within and beyond the region.27
The least implemented measure in the Cross-border Paperless Trade category relates to exporters collecting payment from a documentary letter of credit electronically without lodging paper-based documents (24%). Ten countries indicated that they were not applying this measure at all, whereas Mexico and Uruguay reported full implementation, and Argentina and Ecuador, partial implementation. This is one of the least applied core measures in the Global Survey 2021 worldwide, and its implementation rate exceeds 50% only among developed countries (ESCAP, 2021).
26 Guatemala indicated in its Global Survey questionnaire that the electronic exchange of SPS certificates among Central
American countries had a 75% advance rate as of May 2021. 27 See [online] https://www.ephytoexchange.org/landing/.
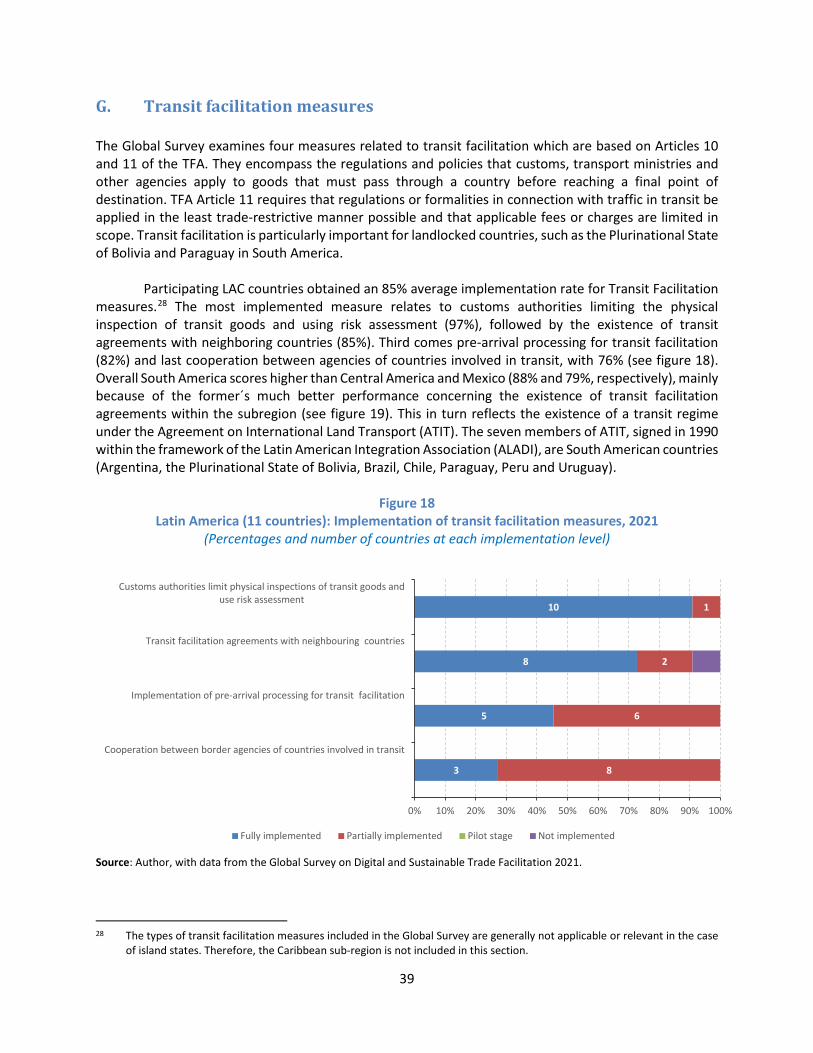
39
G. Transit facilitation measures
The Global Survey examines four measures related to transit facilitation which are based on Articles 10 and 11 of the TFA. They encompass the regulations and policies that customs, transport ministries and other agencies apply to goods that must pass through a country before reaching a final point of destination. TFA Article 11 requires that regulations or formalities in connection with traffic in transit be applied in the least trade-restrictive manner possible and that applicable fees or charges are limited in scope. Transit facilitation is particularly important for landlocked countries, such as the Plurinational State of Bolivia and Paraguay in South America.
Participating LAC countries obtained an 85% average implementation rate for Transit Facilitation measures.28 The most implemented measure relates to customs authorities limiting the physical inspection of transit goods and using risk assessment (97%), followed by the existence of transit agreements with neighboring countries (85%). Third comes pre-arrival processing for transit facilitation (82%) and last cooperation between agencies of countries involved in transit, with 76% (see figure 18). Overall South America scores higher than Central America and Mexico (88% and 79%, respectively), mainly because of the former´s much better performance concerning the existence of transit facilitation agreements within the subregion (see figure 19). This in turn reflects the existence of a transit regime under the Agreement on International Land Transport (ATIT). The seven members of ATIT, signed in 1990 within the framework of the Latin American Integration Association (ALADI), are South American countries (Argentina, the Plurinational State of Bolivia, Brazil, Chile, Paraguay, Peru and Uruguay).
Figure 18
Latin America (11 countries): Implementation of transit facilitation measures, 2021 (Percentages and number of countries at each implementation level)
Source: Author, with data from the Global Survey on Digital and Sustainable Trade Facilitation 2021.
28 The types of transit facilitation measures included in the Global Survey are generally not applicable or relevant in the case
of island states. Therefore, the Caribbean sub-region is not included in this section.
3
5
8
10
8
6
2
1
0% 10% 20% 30% 40% 50% 60% 70% 80% 90% 100%
Cooperation between border agencies of countries involved in transit
Implementation of pre-arrival processing for transit facilitation
Transit facilitation agreements with neighbouring countries
Customs authorities limit physical inspections of transit goods anduse risk assessment
Fully implemented Partially implemented Pilot stage Not implemented

40
Figure 19 Average implementation rates of transit facilitation measures
in South America and in Central America and Mexico, 2021 (Percentages)
Source: Author, with data from the Global Survey on Digital and Sustainable Trade Facilitation 2019.
H. Trade facilitation for small and medium enterprises The Global Survey 2021 includes five questions about trade facilitation measures specifically oriented towards Small and Medium Enterprises (SMEs). Given their limited human and financial resources, these firms tend to be disproportionately affected by complex documentary and procedural requirements, to the extent that these may become insurmountable obstacles to their participation in international trade (WTO, 2016). In Latin America and the Caribbean, the share of exporting firms is below 1% in most countries, and most SMEs do not export (Park et al, 2019). Global Survey results indicate that the region still has much room for improvement in terms of easing documentary and procedural barriers to SME internationalization. Participating countries scored a 50% average implementation rate in this category, although with widely different implementation levels across individual measures (see figure 20).
Figure 20
Latin America and the Caribbean (14 countries): Implementation of SME-oriented TF measures, 2021 (Percentages and number of countries at each implementation level)
Source: Author, with data from the Global Survey on Digital and Sustainable Trade Facilitation 2021.
95 10081 76
67
9283
75
0102030405060708090
100
Transit facilitationagreements with
neighbouring countries
Customs authorities limitphysical inspections of
transit goods and use riskassessment
Implementation of pre-arrival processing for
transit facilitation
Cooperation betweenborder agencies of
countries involved intransit
South America Central America and Mexico
1
2
3
8
4
7
6
8
6
10
6
6
3
0% 10% 20% 30% 40% 50% 60% 70% 80% 90% 100%
Specific measures that enable SMEs to more easily benefit fromthe AEO scheme
Other measures to reduce cost for SMEs of complying with tradeprocedures
Actions to ensure that SMEs are well represented at National TradeFacilitation Committees
Actions to make the single window more easily accessible to SMEs
TF measures to ensure easy and affordable access for SMEs totrade-related information
Fully implemented Partially implemented Pilot stage Not implemented
41
The region performs best in facilitating SME access to trade-related information —arguably the least demanding measure in this category—, with an 86% average implementation rate (see figure 21). All participating countries reported at least partial implementation of this measure. The second area where most progress has been made relates to easing SME access to electronic single windows (60%). Next comes ensuring adequate SME participation in National Trade Facilitation Committees (43%) and other measures to reduce the cost for SMEs of complying with trade procedures (40%). The least implemented measure concerns facilitating SME participation in Authorized Economic Operator (AEO) schemes (19%). Most countries indicated that the criteria to obtain AEO certification are the same regardless of a firm´s size. Across all five measures, South America scores above the regional average (58%), while the three Caribbean participants achieve a 49% implementation rate, almost identical to the regional average, and Central America and Mexico comes last at 35%.
Figure 21 Latin America and the Caribbean (14 countries): Average implementation rates
of SME-oriented trade facilitation measures by subregion, 2021 (Percentages)
Source: Author, with data from the Global Survey on Digital and Sustainable Trade Facilitation 2021.
I. Trade facilitation and agricultural trade Speedy cross-border circulation is very important for agricultural goods, especially those that are highly perishable. Behind the border procedures such as meeting SPS standards and testing methods are also critically important for agricultural products (ESCAP, 2019). Against this background, the Global Survey 2021 includes four questions about trade facilitation and agricultural trade. This is a topic of high relevance for Latin America and the Caribbean, where many countries —specially in South America— are large agricultural exporters. The region’s average implementation rate in this category is 73%. The most implemented measure (81%) is the granting of special treatment to perishable goods at border crossings, a commitment included in Article 7.9 of the TFA (see figure 22). Only the Dominican Republic indicated that currently is not implementing this measure at all. The country notified it under TFA Category C, with 31 December 2021 as its original implementation date. Then it requested an extension until 1 June 2023 due to delays caused by the pandemic.
86 90
7589
60
76
58
22
43 48
25
56
4048
0
78
1929
17
00
20
40
60
80
100
Latin America and the Caribbean South America Central America and Mexico The Caribbean
TF measures to ensure easy and affordable access for SMEs to trade-related information
Actions to make the single window more easily accessible to SMEs
Actions to ensure that SMEs are well represented at National Trade Facilitation Committees
Other measures to reduce cost for SMEs of complying with trade procedures
Specific measures that enable SMEs to more easily benefit from the AEO scheme

42
All participating countries reported having (to some extent) the testing and laboratory facilities, as well as national standards and accreditation bodies, necessary to meet the SPS standards of their trade partners. The least implemented measure is the electronic application and issuance of SPS certificates (57%). South America scores above the regional average in this measure, with all participating South American countries (except Argentina) reporting at least partial implementation. By contrast, implementation in the Caribbean is well below the regional average (see figure 23).
Figure 22 Latin America and the Caribbean (14 countries): Implementation of agricultural TF measures, 2021
(Percentages and number of countries at each implementation level)
Source: Author, with data from the Global Survey on Digital and Sustainable Trade Facilitation 2021.
Figure 23
Latin America and the Caribbean (14 countries): Average implementation rates of agricultural TF measures by subregion, 2021
(Percentages)
Source: Author, with data from the Global Survey on Digital and Sustainable Trade Facilitation 2021.
3
4
5
8
7
10
9
5
1 3
1
0% 10% 20% 30% 40% 50% 60% 70% 80% 90% 100%
SPS certificates applied for and issued electronically
National standards and accreditation bodies to facilitatecompliance with SPS standards
Testing and laboratory facilities available to meet SPSstandards of trading partners
Special treatment to perishable goods at border crossings
Fully implemented Partially implemented Pilot stage Not implemented
81 8192
67
79 7683
7876 76 75 78
5767
58
33
0102030405060708090
100
Latin America and the Caribbean South America Central America and Mexico The Caribbean
Special treatment to perishable goods at border crossings
Testing and laboratory facilities available to meet SPS standards of trading partners
National standards and accreditation bodies to facilitate compliance with SPS standards
SPS certificates applied for and issued electronically
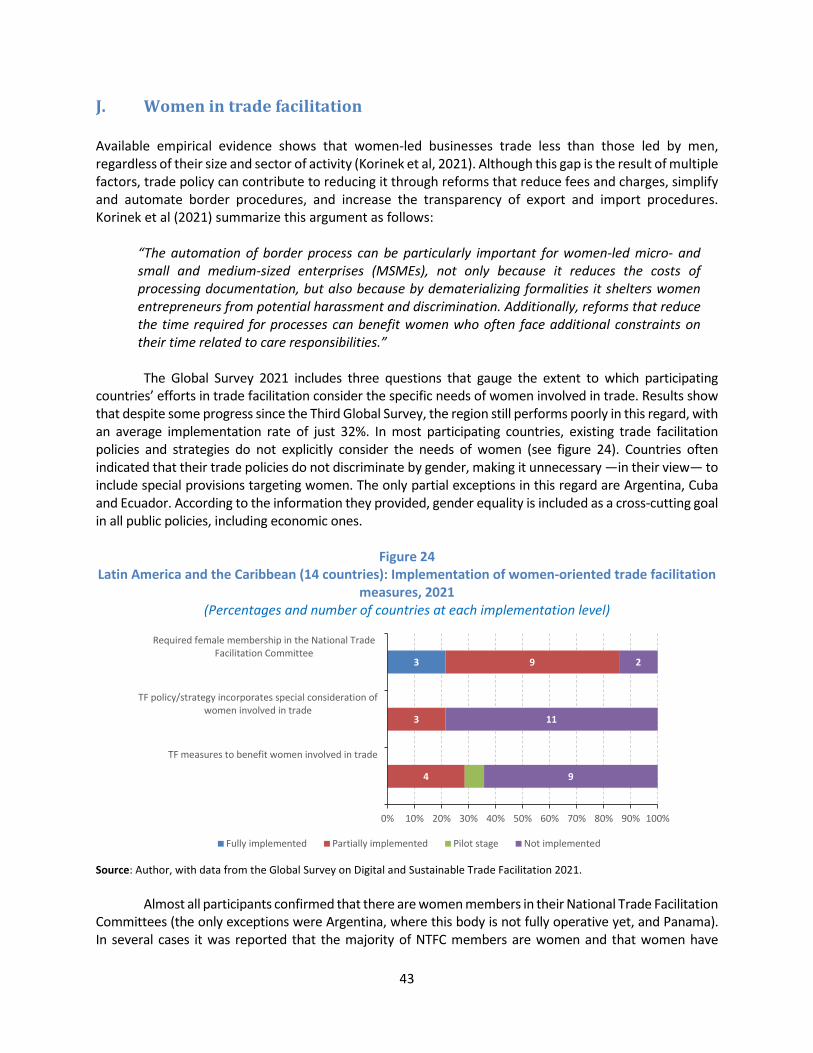
43
J. Women in trade facilitation Available empirical evidence shows that women-led businesses trade less than those led by men, regardless of their size and sector of activity (Korinek et al, 2021). Although this gap is the result of multiple factors, trade policy can contribute to reducing it through reforms that reduce fees and charges, simplify and automate border procedures, and increase the transparency of export and import procedures. Korinek et al (2021) summarize this argument as follows:
“The automation of border process can be particularly important for women-led micro- and small and medium-sized enterprises (MSMEs), not only because it reduces the costs of processing documentation, but also because by dematerializing formalities it shelters women entrepreneurs from potential harassment and discrimination. Additionally, reforms that reduce the time required for processes can benefit women who often face additional constraints on their time related to care responsibilities.”
The Global Survey 2021 includes three questions that gauge the extent to which participating
countries’ efforts in trade facilitation consider the specific needs of women involved in trade. Results show that despite some progress since the Third Global Survey, the region still performs poorly in this regard, with an average implementation rate of just 32%. In most participating countries, existing trade facilitation policies and strategies do not explicitly consider the needs of women (see figure 24). Countries often indicated that their trade policies do not discriminate by gender, making it unnecessary —in their view— to include special provisions targeting women. The only partial exceptions in this regard are Argentina, Cuba and Ecuador. According to the information they provided, gender equality is included as a cross-cutting goal in all public policies, including economic ones.
Figure 24 Latin America and the Caribbean (14 countries): Implementation of women-oriented trade facilitation
measures, 2021 (Percentages and number of countries at each implementation level)
Source: Author, with data from the Global Survey on Digital and Sustainable Trade Facilitation 2021.
Almost all participants confirmed that there are women members in their National Trade Facilitation Committees (the only exceptions were Argentina, where this body is not fully operative yet, and Panama). In several cases it was reported that the majority of NTFC members are women and that women have
3
4
3
9
9
11
2
0% 10% 20% 30% 40% 50% 60% 70% 80% 90% 100%
TF measures to benefit women involved in trade
TF policy/strategy incorporates special consideration ofwomen involved in trade
Required female membership in the National TradeFacilitation Committee
Fully implemented Partially implemented Pilot stage Not implemented

44
chaired it. However, most countries do not explicitly require female membership in the NTFC, and only in three cases (Chile, Mexico and Saint Kitts and Nevis) this body includes a representative of women traders or entrepreneurs.
Only a few countries reported having implemented specific measures targeting women traders. Argentina, Chile, Ecuador and Peru have gender focal points in their ministries of trade or customs agencies. Argentina, Chile, Mexico and Peru have conducted training activities for women involved in trade over the last year. While some of the topics covered relate to the development of general skills (for example, increasing digital literacy), others are more specifically related to trade facilitation (for example, trainings on trade logistics and on using tariff preferences under FTAs). In recent years Chile has also been promoting the inclusion of gender chapters in its FTAs, including the ones with Uruguay (signed in 2016), Argentina (signed in 2017) and Ecuador (signed in 2020), and its revised agreement with Canada (also signed in 2017). These chapters focus on cooperation in areas such as skills enhancement, financial inclusion, entrepreneurship and access to science, technology and innovation.
K. Trade finance facilitation Trade finance is a key enabler of international trade. It allows the flow of money from buyer to seller and the mitigation of associated risks, greatly facilitating the flow of goods in the opposite direction (ESCAP, 2019). Therefore, lack of access to trade finance can be a serious obstacle to trade, especially for SMEs. According to the International Chamber of Commerce (ICC), “over 45% of SMEs see their requests for trade finance rejected and often struggle to find alternative sources of funding.”29 The Asian Development Bank estimated the global trade finance gap -defined as the amount of trade finance requested by importers and exporters, and thus rejected- at around 1.5 trillion dollars annually between 2013 and 2019, and the situation worsened following the outbreak of the pandemic (Auboin, 2021). Against this background, in 2019 a new category on Trade Finance Facilitation was added to the Third Global Survey on a pilot basis (ESCAP, 2019).30 In the case of Latin America and the Caribbean, this category was first included in the Fourth Global Survey in 2021. Two of its measures show extremely low implementation (see figure 25).
29 “ICC Trade Now to connect SMEs to innovative trade finance solutions”. Press release, Paris, 26 May 2021 [online]
https://iccwbo.org/media-wall/news-speeches/icc-trade-now-to-connect-smes-to-innovative-trade-finance-solutions/. 30 Three regional commissions (ESCAP, ESCWA and ECE) included this category in the Third Global Survey, covering 88 countries.
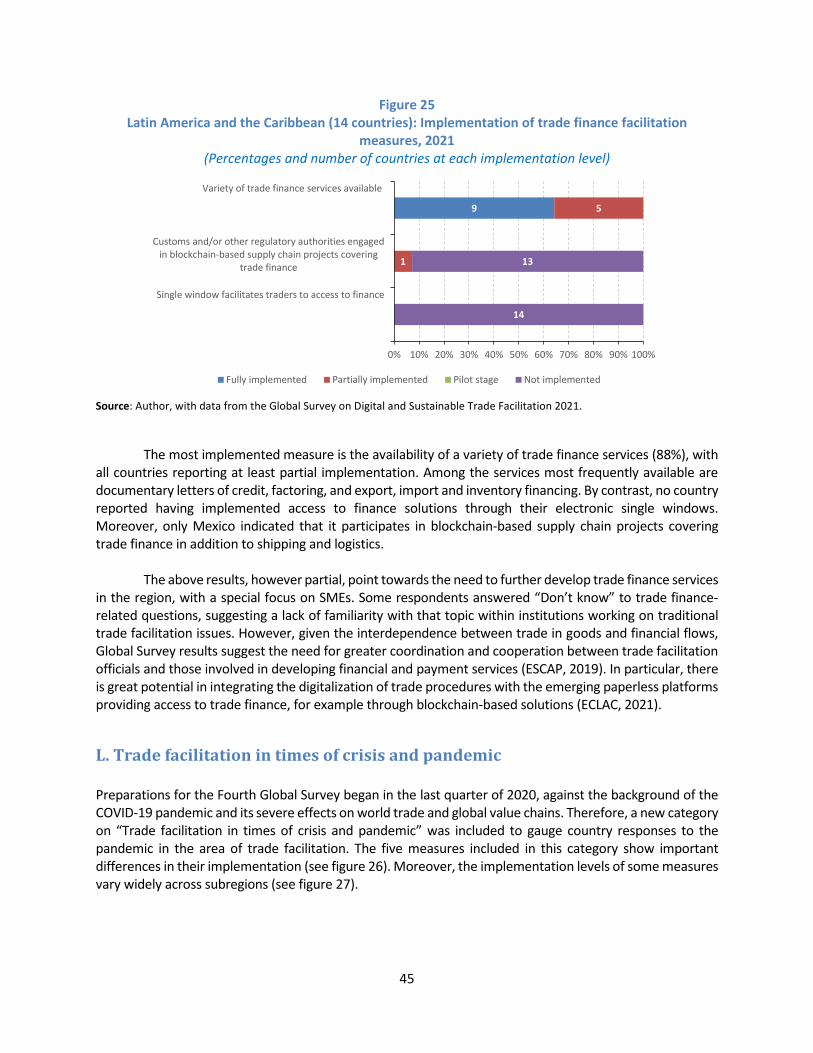
45
Figure 25 Latin America and the Caribbean (14 countries): Implementation of trade finance facilitation
measures, 2021 (Percentages and number of countries at each implementation level)
Source: Author, with data from the Global Survey on Digital and Sustainable Trade Facilitation 2021.
The most implemented measure is the availability of a variety of trade finance services (88%), with all countries reporting at least partial implementation. Among the services most frequently available are documentary letters of credit, factoring, and export, import and inventory financing. By contrast, no country reported having implemented access to finance solutions through their electronic single windows. Moreover, only Mexico indicated that it participates in blockchain-based supply chain projects covering trade finance in addition to shipping and logistics.
The above results, however partial, point towards the need to further develop trade finance services in the region, with a special focus on SMEs. Some respondents answered “Don’t know” to trade finance-related questions, suggesting a lack of familiarity with that topic within institutions working on traditional trade facilitation issues. However, given the interdependence between trade in goods and financial flows, Global Survey results suggest the need for greater coordination and cooperation between trade facilitation officials and those involved in developing financial and payment services (ESCAP, 2019). In particular, there is great potential in integrating the digitalization of trade procedures with the emerging paperless platforms providing access to trade finance, for example through blockchain-based solutions (ECLAC, 2021).
L. Trade facilitation in times of crisis and pandemic Preparations for the Fourth Global Survey began in the last quarter of 2020, against the background of the COVID-19 pandemic and its severe effects on world trade and global value chains. Therefore, a new category on “Trade facilitation in times of crisis and pandemic” was included to gauge country responses to the pandemic in the area of trade facilitation. The five measures included in this category show important differences in their implementation (see figure 26). Moreover, the implementation levels of some measures vary widely across subregions (see figure 27).
9
1
5
14
13
0% 10% 20% 30% 40% 50% 60% 70% 80% 90% 100%
Single window facilitates traders to access to finance
Customs and/or other regulatory authorities engagedin blockchain-based supply chain projects covering
trade finance
Variety of trade finance services available
Fully implemented Partially implemented Pilot stage Not implemented
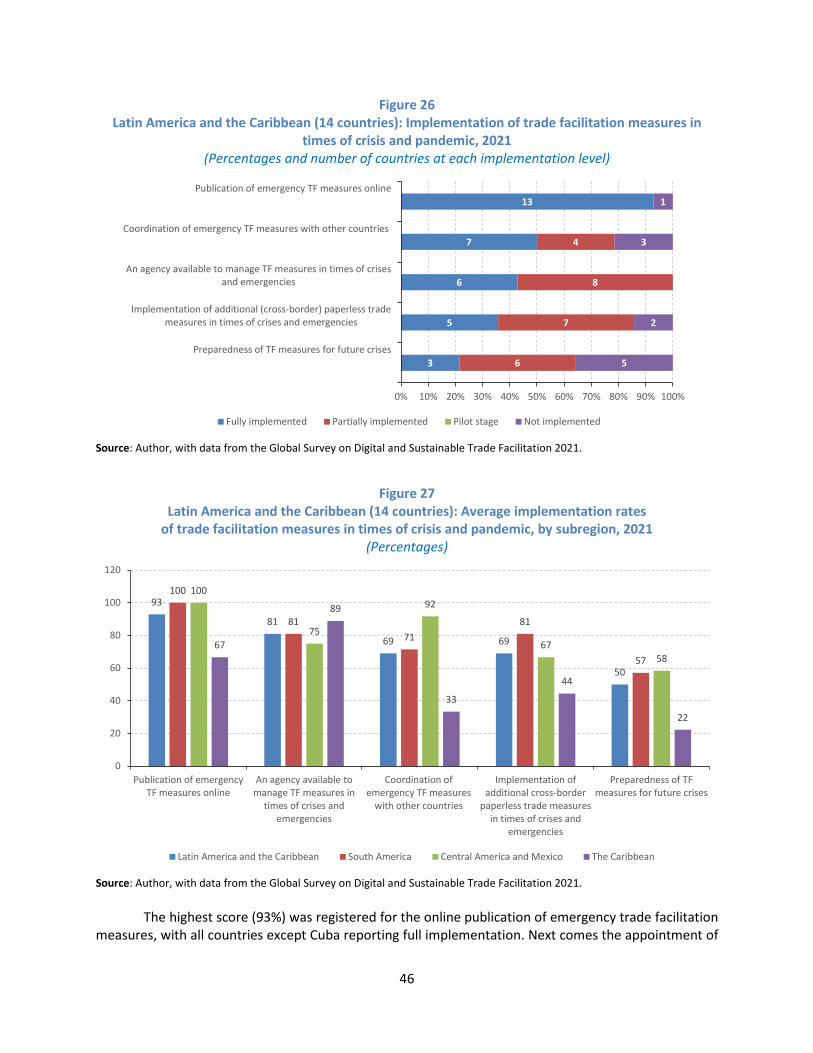
46
Figure 26 Latin America and the Caribbean (14 countries): Implementation of trade facilitation measures in
times of crisis and pandemic, 2021 (Percentages and number of countries at each implementation level)
Source: Author, with data from the Global Survey on Digital and Sustainable Trade Facilitation 2021.
Figure 27 Latin America and the Caribbean (14 countries): Average implementation rates
of trade facilitation measures in times of crisis and pandemic, by subregion, 2021 (Percentages)
Source: Author, with data from the Global Survey on Digital and Sustainable Trade Facilitation 2021.
The highest score (93%) was registered for the online publication of emergency trade facilitation measures, with all countries except Cuba reporting full implementation. Next comes the appointment of
3
5
6
7
13
6
7
8
4
5
2
3
1
0% 10% 20% 30% 40% 50% 60% 70% 80% 90% 100%
Preparedness of TF measures for future crises
Implementation of additional (cross-border) paperless trademeasures in times of crises and emergencies
An agency available to manage TF measures in times of crisesand emergencies
Coordination of emergency TF measures with other countries
Publication of emergency TF measures online
Fully implemented Partially implemented Pilot stage Not implemented
93
81
69 69
50
100
8171
81
57
100
75
92
6758
67
89
33
44
22
0
20
40
60
80
100
120
Publication of emergencyTF measures online
An agency available tomanage TF measures in
times of crises andemergencies
Coordination ofemergency TF measures
with other countries
Implementation ofadditional cross-border
paperless trade measuresin times of crises and
emergencies
Preparedness of TFmeasures for future crises
Latin America and the Caribbean South America Central America and Mexico The Caribbean
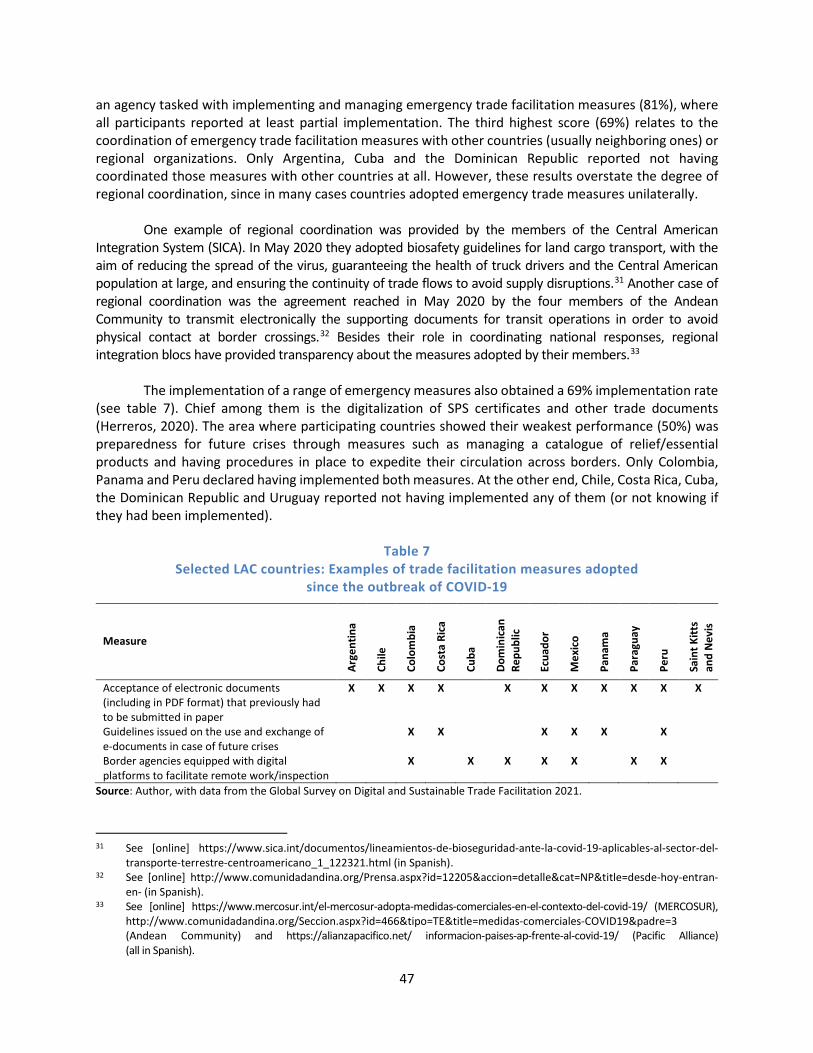
47
an agency tasked with implementing and managing emergency trade facilitation measures (81%), where all participants reported at least partial implementation. The third highest score (69%) relates to the coordination of emergency trade facilitation measures with other countries (usually neighboring ones) or regional organizations. Only Argentina, Cuba and the Dominican Republic reported not having coordinated those measures with other countries at all. However, these results overstate the degree of regional coordination, since in many cases countries adopted emergency trade measures unilaterally.
One example of regional coordination was provided by the members of the Central American
Integration System (SICA). In May 2020 they adopted biosafety guidelines for land cargo transport, with the aim of reducing the spread of the virus, guaranteeing the health of truck drivers and the Central American population at large, and ensuring the continuity of trade flows to avoid supply disruptions.31 Another case of regional coordination was the agreement reached in May 2020 by the four members of the Andean Community to transmit electronically the supporting documents for transit operations in order to avoid physical contact at border crossings.32 Besides their role in coordinating national responses, regional integration blocs have provided transparency about the measures adopted by their members.33
The implementation of a range of emergency measures also obtained a 69% implementation rate
(see table 7). Chief among them is the digitalization of SPS certificates and other trade documents (Herreros, 2020). The area where participating countries showed their weakest performance (50%) was preparedness for future crises through measures such as managing a catalogue of relief/essential products and having procedures in place to expedite their circulation across borders. Only Colombia, Panama and Peru declared having implemented both measures. At the other end, Chile, Costa Rica, Cuba, the Dominican Republic and Uruguay reported not having implemented any of them (or not knowing if they had been implemented).
Table 7
Selected LAC countries: Examples of trade facilitation measures adopted since the outbreak of COVID-19
Measure
Arge
ntin
a
Chile
Colo
mbi
a
Cost
a Ri
ca
Cuba
Dom
inic
an
Repu
blic
Ecua
dor
Mex
ico
Pana
ma
Para
guay
Peru
Sain
t Kitt
s an
d N
evis
Acceptance of electronic documents (including in PDF format) that previously had to be submitted in paper
X X X X X X X X X X X
Guidelines issued on the use and exchange of e-documents in case of future crises
X X X X X X
Border agencies equipped with digital platforms to facilitate remote work/inspection
X X X X X X X
Source: Author, with data from the Global Survey on Digital and Sustainable Trade Facilitation 2021.
31 See [online] https://www.sica.int/documentos/lineamientos-de-bioseguridad-ante-la-covid-19-aplicables-al-sector-del-
transporte-terrestre-centroamericano_1_122321.html (in Spanish). 32 See [online] http://www.comunidadandina.org/Prensa.aspx?id=12205&accion=detalle&cat=NP&title=desde-hoy-entran-
en- (in Spanish). 33 See [online] https://www.mercosur.int/el-mercosur-adopta-medidas-comerciales-en-el-contexto-del-covid-19/ (MERCOSUR),
http://www.comunidadandina.org/Seccion.aspx?id=466&tipo=TE&title=medidas-comerciales-COVID19&padre=3 (Andean Community) and https://alianzapacifico.net/ informacion-paises-ap-frente-al-covid-19/ (Pacific Alliance) (all in Spanish).

49
III. Conclusions and way forward As noted in the previous regional report (ECLAC, 2019), there are several reasons why making progress in the trade facilitation agenda remains crucial for Latin America and the Caribbean. Firstly, by easing cross-border exchanges, trade facilitation can help to raise intraregional trade, which in 2020 stood at its lowest level in three decades (11%). Secondly, trade facilitation removes obstacles to the internationalization of the region´s SMEs, the overwhelming majority of which do not export. This may in turn promote export diversification, thus helping to reduce the very high commodity dependence that characterizes the export baskets of many countries (particularly in South America). Moreover, the expeditious movement of goods across borders is critical for the success of international production networks. Hence progress in trade facilitation may help to increase the presence of Latin America and the Caribbean in regional and global value chains, which —with some exceptions— remains very limited. Finally, several concepts embodied in the trade facilitation agenda are important to improve the effectiveness and accountability of the State and to fight corruption.
The results of the Global Survey 2021 indicate that Latin America and the Caribbean has made considerable progress in trade facilitation over the last two years. For the first time, it is the best performing developing region ahead of East and Southeast Asia. The group of 14 participating countries presents average implementation rates above 80% in 23 of the 31 core measures included in the Global Survey, particularly in the two categories (Transparency and Formalities) that coincide most closely with the provisions of the TFA. At the present rate, and considering country notifications to the WTO, the implementation of the TFA in the region should be essentially complete by the end of 2023.
Despite good overall results, progress remains uneven both geographically and thematically. On
the one hand, the much-reduced participation of the Caribbean in the Global Survey 2021 compared to the 2019 edition may be obscuring the unique challenges small Caribbean economies still face in implementing trade facilitation reforms. On the other hand, Latin America and the Caribbean still has much room for improvement in cross-border paperless trade, in integrating trade facilitation and access to trade finance, and in ensuring that SMEs and women can benefit from trade facilitation. All these are areas where international cooperation efforts, for example through the WTO’s TFA Facility, could make an especially valuable contribution.
The nearly universal establishment of national trade facilitation committees (NTFCs) among LAC participants is a very positive development. NTFCs are crucial to successfully address the institutional challenges deriving from the cross-cutting, multi-agency nature of trade facilitation (including its links to public health, evidenced by the current pandemic). Beyond coordinating the implementation of the TFA, already well advanced in the region, NTFCs should play a critical role in the design and implementation of paperless trade strategies. However, there is no “one size fits all” model for NTFCs. Every country will need to gradually develop the structure, membership and governance best suited to its own needs and circumstances. Therefore, LAC countries will need to regularly monitor and evaluate the functioning of their respective NTFCs in order to introduce the necessary adjustments.
The COVID-19 pandemic has had mixed results on Latin American efforts in the area of trade facilitation. On the one hand, it has slowed down progress in some countries towards full implementation of measures such as the authorized economic operator, the electronic single window, the acceptance of copies and the establishment and publication of average release times. On the other hand, it has accelerated the digitalization of trade documents to minimize physical contact and encouraged countries to streamline procedures for the cross-border flow of essential goods. Many of the digitalization reforms introduced since
50
2020 are supposed to last only until the end of the pandemic; however, it is likely that at least some of them will become permanent because of their associated cost and time savings. The Global Survey highlighted that LAC countries have room for improvement in terms of managing a catalogue of relief/essential products and defining procedures to prevent future shortages. Considering the likelihood of new sanitary crises or other extreme events, including those caused by climate change, LAC countries should step up their preparedness levels, ideally through concerted actions at the regional level.
The considerable progress made by LAC countries in implementing trade facilitation measures at
the national level would have a greater impact on trade flows and production integration if such advances were coordinated at the regional (or at least sub-regional) level. In recent years there have been several promising developments in this regard. Some examples are the conclusion in December 2019 of a trade facilitation agreement among the members of MERCOSUR, the mutual recognition agreements of AEO schemes within the Andean Community, MERCOSUR and the Pacific Alliance, and the growing electronic exchange of trade documents within the Pacific Alliance and among Central American countries. Some of these processes have been slowed down by the pandemic, be it because of mobility restrictions or financial constraints. Thus, if LAC countries manage to speed up vaccine rollout in the coming months, progress on regional trade facilitation initiatives should also gather momentum.

51
Bibliography Auboin, M. (2021), “Trade finance, gaps and the Covid-19 pandemic: A review of events and policy responses
to date”, World Trade Organization Staff Working Paper ERSD-2021-5, [online] https://www.wto.org/english/res_e/reser_e/ersd202105_e.pdf.
ECLAC (Economic Commission for Latin America and the Caribbean) (2021), “Blockchain implementation opportunities and challenges in the Latin American and Caribbean logistics sector”, FAL Bulletin 387. Santiago, ECLAC [online] https://repositorio.cepal.org/bitstream/handle/11362/47165/1/S2100364_ en.pdf.
_____ (2019), Digital and sustainable trade facilitation in Latin America and the Caribbean: Regional Report 2019, LC/TS.2019/77. Santiago: ECLAC [online] https://www.cepal.org/en/publications/44973-digital-and-sustainable-trade-facilitation-latin-america-and-caribbean-regional?ref=untfsurvey.org.
_____ (2017a), Trade Facilitation and Paperless Trade Implementation in Latin America and the Caribbean. Regional Report 2017, LC/TS.2017/74. Santiago: ECLAC [online] https://www.cepal.org/en/ publications/42254-trade-facilitation-and-paperless-trade-implementation-latin-america-and-caribbean?ref=untfsurvey.org.
_____ (2015), Trade Facilitation and Paperless Trade Implementation Survey 2015. Latin America and the Caribbean Report, LC/W.667. Santiago: ECLAC [online] https://www.cepal.org/en/publications/38946-trade-facilitation-and-paperless-trade-implementation-survey-2015?ref=untfsurvey.org.
ESCAP (United Nations Economic Commission for Asia and the Pacific) (2021), Digital and Sustainable Trade Facilitation: Global Report 2021 (forthcoming).
_____ (2019), Digital and Sustainable Trade Facilitation: Global Report 2019. Bangkok, August [online] https://www.unescap.org/sites/default/files/UNtfsurvey%20global%20report%202019%20upload.pdf.
_____ (2015), Trade Facilitation and Paperless Trade Implementation Survey 2015: Asia and the Pacific Report, June, Bangkok [online] http://www.unescap.org/resources/unrcs-trade-facilitation-and-paperless-trade-implementation-survey-2015-asia-and-pacific.
Herreros, S. (2020), “América Latina y el Caribe y la Asociación de Naciones de Asia Sudoriental: experiencias comparadas en el ámbito de la facilitación del comercio”, Serie Documentos de Proyectos, LC/TS.2020/74. Santiago: ECLAC [online] https://www.cepal.org/es/publicaciones/ 45831-america-latina-caribe-la-asociacion-naciones-asia-sudoriental-experiencias.
_____ (2019), “La regulación del comercio electrónico transfronterizo en los acuerdos comerciales. Algunas implicancias de política para América Latina y el Caribe”, Serie Comercio Internacional No 142 (LC/TS.2019/42). Santiago: ECLAC [online] https://www.cepal.org/es/publicaciones/44667-la-regulacion-comercio-electronico-transfronterizo-acuerdos-comerciales-algunas.
Korinek, J., E. Moisë and J. Tange (2021), “Trade and Gender: A Framework of Analysis”, OECD Trade Policy Paper N°246, March 2021, Paris [online] https://www.oecd-ilibrary.org/trade/trade-and-gender_6db59d80-en.
Park, H., R. Urmeneta and N. Mulder (2019), “El desempeño de empresas exportadoras según su tamaño: una guía de indicadores y resultados”, Documentos de Proyectos (LC/TS.2019/41), Santiago, ECLAC (online] https://www.cepal.org/es/publicaciones/44664-desempeno-empresas-exportadoras-segun-su-tamano-guia-indicadores-resultados.
52
Sánchez, R., J. Lardé, P. Chauvet and A. Jaimurzina (2017), “Inversiones en infraestructura en América Latina: tendencias, brechas y oportunidades”, Serie Recursos Naturales e Infraestructura, No 187 (LC/TS.2017/132), Santiago, ECLAC.
World Bank (2019), Doing Business 2019: Training for Reform, [online] https://www.doingbusiness.org/ en/data/exploretopics/trading-across-borders.
WTO (World Trade Organization) (2021), “Indicative list of trade-related bottlenecks and trade-facilitating measures on critical products to combat COVID-19”, Information Note, 20 July [online] https://www.wto.org/english/tratop_e/covid19_e/bottlenecks_report_e.pdf.
_____ (2016), World Trade Report 2016. Levelling the trading field for SMEs. Geneva [online] https://www.wto.org/english/res_e/publications_e/wtr16_e.htm.

53
Annex
Definition of the different stages of implementation used in the Global Survey on Digital and Sustainable Trade Facilitation 2021
Full implementation: the trade facilitation measure implemented is in full compliance with commonly accepted international standards, recommendations and conventions such as the Revised Kyoto Convention, UN/CEFACT Recommendations, or the WTO Trade Facilitation Agreement (TFA); it is implemented in law and in practice; it is available to essentially all relevant stakeholders nationwide, supported by an adequate legal and institutional framework, as well as adequate infrastructure and financial and human resources. A TFA measure included in the Notifications of Category A commitments may generally be considered as a measure which is fully implemented by the country, with a caveat that the measure will be implemented by a least-developed country member within one year after entry into force of the TFA agreement. Partial implementation: a measure is considered to be partially implemented if at least one of the following is true: (1) the trade facilitation measure is in partial —but not in full— compliance with commonly accepted international standards, recommendations and conventions; (2) the country is still in the process of rolling out the implementation of measure; (3) the measure is practiced but on an unsustainable, short-term or ad-hoc basis; (4) the measure is implemented in some —but not all— targeted locations (such as key border crossing stations); or (5) some —but not all— targeted stakeholders are fully involved. Pilot stage of implementation: a measure is considered to be at the pilot stage of implementation if, in addition to meeting the general attributes of partial implementation, it is available only to (or at) a very small portion of the intended stakeholder group (location) and/or is being implemented on a trial basis. When a new trade facilitation measure is under pilot stage of implementation, the old measure is often continuously used in parallel to ensure the service is provided in case of disruption of new measure. This stage of implementation also includes relevant rehearsals and preparation for the full-fledged implementation. Not implemented: a measure has not been implemented at this stage. However, this stage may still include initiatives or efforts towards implementation of the measure. For example, under this stage, (pre)feasibility or planning of implementation can be carried out, and consultation with stakeholders on the implementation may be arranged.

This report presents the results for Latin America and the Caribbean of the fourth Global Survey on Digital and Sustainable Trade Facilitation, conducted in the first half of 2021 against the backdrop of the coronavirus disease (COVID-19) pandemic and with the participation of 135 countries (14 from the region). The survey results indicate that Latin America and the Caribbean has made considerable progress since the previous edition in 2019. For the first time, it is the best performing developing region ahead of East and Southeast Asia, with an average implementation rate of 80%. The region’s results are particularly strong in the categories of transparency and formalities, which coincide closely with the provisions of the Trade Facilitation Agreement of the World Trade Organization. Nevertheless, there is much room for improvement in the area of cross-border paperless trade, as well as in adapting trade facilitation measures to the specific needs of small and medium-sized enterprises and women in trade.