Embed Size (px)
Citation preview

Developing a Policy Model for Resilient City; Implications from Applying Indicators, Status
Report and Scenario Development to Japanese Cities
10. Jun. 2015 @ Bonn
Kenshi Baba (Ph.D., Professor, Hosei University)
1

2
Background Frameworks on Resilient City Measuring Risks, Vulnerabilities and Endpoints
and Integrating the Results A Public Forum of The UN 3rd World
Conference on Disaster Risk Reduction Future Works
Outline

International trend of resilient cityConcerns are not only on disaster but also on major issues of environmental policy such as climate change, energy, biodiversity
Frequent occurrence of disasters that seems to arise from climate change such as flood, heat wave, and crop damage
Great East Japan Earthquake clarified the urgent issues, such as robust energy system, community development aiming at disaster risk reduction
Resilient Resilient City; A vision City; A vision of city for of city for 2121stst Century Century
A definition of ResilienceThe ability of a social or ecological system to absorb disturbances while retaining the same basic structure and ways of functioning, the capacity for self-organization, and the capacity to adapt to stress and change (IPCC, AR4 2007)
National Resilience Promotion Office, Cabinet Secretariat
Major concern is on disaster risk reductionThe Roles of Environmental policy to build resilience has not been clarified
3
Background of Resilient City in Japan
Policy model; A hypothetical flow describing the whole process of policymakingIndicators; Three kinds of indicators to measure the status of each component of the policy model
Status report; Assessing the degree of resilience based on the measuring results with the
indicators
Scenario development; Holding some participatory approaches with the status report to realize
the policy model
A Framework of Policy Model and Indicators
4
Resilient policy
Situation to be avoided (endpoint)
Status reportScenario
development
Policy model
Measuring by urban indicator
Measuring by administrative indicator
Vulnerability
External force risk
Measuring by civil indicator
Realization of policy m
odel
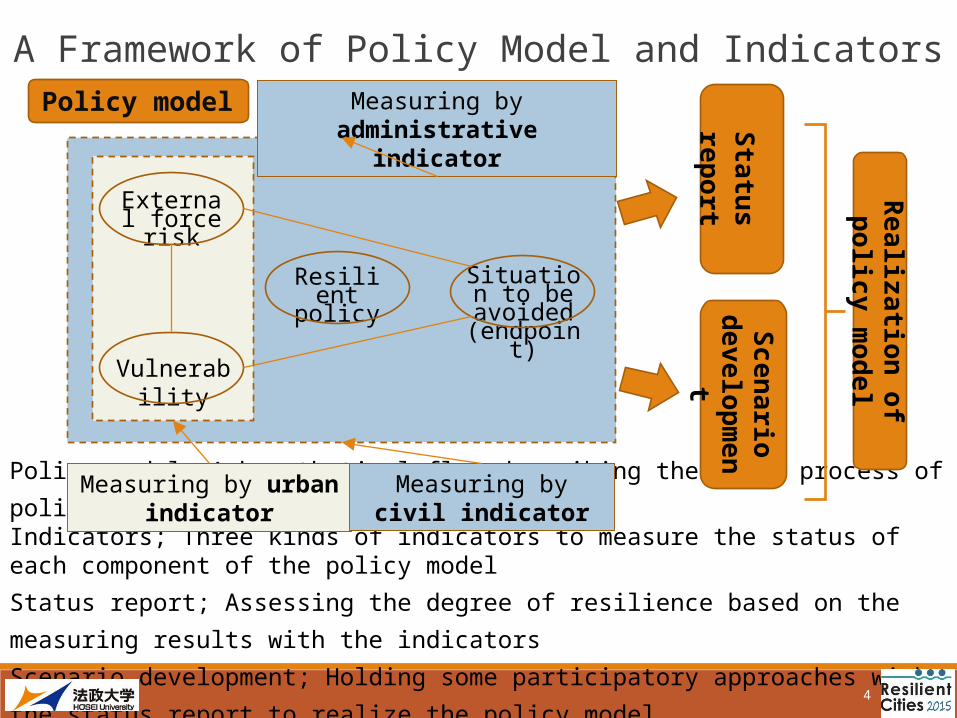
Tolerance / flexibility
Threshold of regime shift occurrence= Situation to be avoided
influence to system
Exposure amount to external force riskRange of
unaffected Range of recoverable Range of regime shift
occurrence
Recovery capacity (adaptive measure)
Learning capacity
(transformation measure)
Resilience
Resistance / robustness
5
Defensive capacity
(precautionary measure)
Vulnerability
A Framework of Three Measures of Resilient Policy

1. Urban Indicator(UI) The experts assess the degree of
resilience objectively for various facets based on some published quantitative data such as the Census
2. Administrative Indicator(AI) Local governments’ officials assess
the degree of resilience subjectively in terms of the situation of progress and preparedness of the existing based on the questionnaire (self-assessment) and scrutiny on the administrative plans
3. Civic Indicator(CI) The general public and stakeholders
assess the degree of resilience subjectively in terms of civic life such as social capital based on the questionnaire (self-assessment)
6
4. Integration of the Assessment ResultsExamining the gaps and common points of the assessment results of the indicators among relevant actors with the integrated “status report” to understand the resilience of the city comprehensively
A Framework of Three Types of Resilient Indicators
Preparedness of policy (AI)
Civic life and activity (CI)
Urban quantitative status (UI)
comprehensive assessment
Expert(scientific evidence)
Public(local knowledge)
Framing gap
Uncertainty ⇒ distrust

7
Dates 17th March – 25th April, 2014
Survey subjectsLocal officials in 109 planning, disaster-prevention, and environmental sections of prefectures, ordinance-designated major cities, and mid-sized cities
Method Sent and collected by mail
Survey topicsRisks (41 indicators), vulnerabilities (28 indicators), anticipated situations that should be avoided (24 indicators), preparation of resilience measures (43 indicators) etc.
Responses (response rate)
148 (45.3%)
Identifying indicators; 41 for risks from natural and social external forces 28 for vulnerabilities inherent to local communities 24 for anticipated situations that to be avoided
(endpoints) 44 for the state of preparation of resilience measures
Questionnaire to local governments across Japan including Sendai to assess risks, vulnerabilities and endpoints with the administrative indicatorsTable Outline of the questionnaire
Measuring Risks, Vulnerabilities and Endpoints with Administrative Indicator(AI)

8
environmental disaster-prevention planning
Measuring Risks, Vulnerabilities and Endpoints with Administrative Indicator(AI); The Result of 41 Indicators
High
⇐
Score
⇒Low

9
Dates 13th February – 14th Fabruary, 2015
Survey subjects The general citizens living in nine cities across Japan which have disaster sites
Method Sent and collected by e-mail and the Internet website
Survey topicsRisks (41 indicators), vulnerabilities (28 indicators), anticipated situations that should be avoided (24 indicators), preparation of resilience measures (16 indicators), trust to local governments and scientists etc.
Responses Approx. 400 for each city (3,953 in total)
Identifying indicators; 41 for risks from natural and social external forces 28 for vulnerabilities inherent to local communities 24 for anticipated situations that to be avoided
(endpoints) 16 for the state of preparation of resilience measures
Questionnaire to the general citizen living in nine cities across Japan which have disaster sites including Sendai to assess risks, vulnerabilities and endpoints with the civic indicators
Table Outline of the questionnaire
Measuring Risks, Vulnerabilities and Endpoints with Civic Indicator(CI)

10
Measuring Risks, Vulnerabilities and Endpoints with Civic Indicator(CI); The Result of 28 Indicators
1
2
3
4
CI (national average) CI (Sendai) AI (national average)
High
⇐
Score
⇒Low

Time and date; 1 - 5 pm, 14th Mar.
Venue; Sendai Civic Centre
Participants; 51 (incl. 18 Sendai citizens who are the respondents of the questionnaire)
Agenda 1 - 3 pm, Information provision Climate change; Sendai Regional Headquarters,
Japan Meteorological Agency Disaster risk reduction and gray infrastructure;
Kyushu University Ecosystems and green infrastructure; Tohoku
University The results of AI and CI; Hosei University
3 -5 pm workshop in three groups What are risks? What are vulnerabilities? What are needed in making Sendai more resilient
11
A Public Forum of The UN 3rd World Conference on Disaster Risk Reduction

12
A Public Forum of The UN 3rd World Conference on Disaster Risk Reduction
Risks Vulnerabilities To be resilient
Gr.1
volcano, aging society, differential between coastal area and mountain area, climate change
weakness of snow removal system, inconvenience of public transportation, weak communities ties
importance of self-help(water and food stock, electricity saving), strengthening communities ties
Gr. 2
destruction of disaster-prevention forest by tsunami, nuclear power plant, volcano, aging society
weak communities ties, financial deficit, bad ground condition, inconvenience of public transportation
importance of self-help(increasing sensitivity for disaster information), strengthening communities ties, utilization of green infrastructure
Gr. 3
existence of petrochemical complex and nuclear power plant, volcano, dilapidated infrastructure, climate change and ecosystem
frequent relocation of residents(weak communities ties), incorrect evacuation center
importance of self-help(understanding evacuation route), strengthening communities ties(publishing community magazine), utilization of green infrastructure

Outcome Volcano and climate change as risks and weak communities ties as vulnerability
are indicated commonly Especially disaster-affected people indicates importance of self-help as well as
mutual aid and propose some specific actions in short term Transdisciplinary approach are required to the experts and local government Raising awareness of the citizen for short and long term risks from the entry
point of two major external forces of natural disaster and climate change and showing a possibility of attitude change
13
A Public Forum of The UN 3rd World Conference on Disaster Risk Reduction

14
⇚ Assessment result of external force risk by AI and CI in Sendai
Status ReportThe Integrated assessment results of three types of indicators of UI, AI, and CI on the four components of the policy model; i) external force risk, ii) vulnerability, iii) situation to be avoided, iv) resilient policy will promote each actor’s understanding of what to do for building resilient city
⇑ Assessment result of external force risk by UI in Sendai (in
comparison with the average of the government-decreed cities)
i) External force riskii) Vulnerabilityiii) Situation to be avoidediv) Resilient policy
Urban indicator Administrative indicator Civil indicator
Future Works
1
2
3
4
CI (national average) CI (Sendai) AI (national average)
High
⇐
Score
⇒Low

ありがとうございました!
Thank you for your kind attention !
If you have any questions, please contact
Acknowledgment;This study was supported by the Environment Research and Technology Development Fund (1-1304) of the Ministry of the Environment, and Grant-in-Aid for Scientific Research(C) No. 26340122, Japan.
15