Embed Size (px)
Citation preview
University of Massachusetts BostonScholarWorks at UMass Boston
Graduate Doctoral Dissertations Doctoral Dissertations and Masters Theses
6-1-2012
Diffusion of the EGFR Assay: The Underutilizationand the Urban/Rural DivideJulie Ann LynchUniversity of Massachusetts Boston
Follow this and additional works at: http://scholarworks.umb.edu/doctoral_dissertations
This Open Access Dissertation is brought to you for free and open access by the Doctoral Dissertations and Masters Theses at ScholarWorks at UMassBoston. It has been accepted for inclusion in Graduate Doctoral Dissertations by an authorized administrator of ScholarWorks at UMass Boston. Formore information, please contact [email protected].
Recommended CitationLynch, Julie Ann, "Diffusion of the EGFR Assay: The Underutilization and the Urban/Rural Divide" (2012). Graduate DoctoralDissertations. Paper 74.
DIFFUSION OF THE EGFR ASSAY: THE UNDERUTILIZATION AND THE
URBAN/RURAL DIVIDE.
A Dissertation Presented
by
JULIE ANN LYNCH
Submitted to the Office of Graduate Studies,
University of Massachusetts Boston,
in partial fulfillment of the requirements for the degree of
DOCTOR OF PHILOSOPHY
June 2012
Nursing & Health Policy Program

© 2012 by Julie A. Lynch
All rights reserved
DIFFUSION OF THE EGFR ASSAY: THE UNDERUTILIZATION AND THE
URBAN/RURAL DIVIDE.
A Dissertation Presented
by
JULIE ANN LYNCH
Approved as to style and content by:
_______________________________
Jerry Cromwell, PhD
Lecturer, UMass Boston and Senior Fellow in Health Economics at RTI
International
Chairperson of Committee
________________________________
Christopher Lathan, MD, MS, MPH
Faculty Director for Cancer Care Equity and Instructor in Medicine at Harvard
Medical School
Member
_______________________________
Patricia Reid Ponte, RN, DNSc, FAAN, NEA-BC
Senior Vice President for Patient Care Services and Chief Nurse at Dana-Farber
Cancer Institute
Member
______________________________
Glenn Miller, PhD
Vice President and Head of Strategy, Portfolio and Alliances for Personalized
Healthcare & Biomarkers at AstraZeneca Pharmaceuticals, LP (formerly at
Genzyme Genetics)
Member
_____________________________
Laura Hayman, PhD, RN, FAAN, FAHA
Director of the PhD Program and Associate Dean for Research at UMass Boston
Member
_____________________________
Marion E. Winfrey, EdD, RN
Associate Dean in the College of Nursing and Health Sciences at UMass Boston
iv
ABSTRACT
DIFFUSION OF THE EGFR ASSAY: THE UNDERUTILIZATION AND THE
URBAN/RURAL DIVIDE
June 2012
Julie A. Lynch, B.S., University of Massachusetts Boston
PhD., University of Massachusetts Boston
Directed by Professor Jerry Cromwell
Purpose: The EGFR assay is a molecular diagnostic test which identifies a
targetable mutation in lung tumors. Guidelines call for EGFR testing for non-small cell
lung cancer patients to direct first line treatment. I explored institutional and regional
factors predicting the likelihood acute care hospitals ordered the assay. Methods: This
was a retrospective study which analyzed US acute care hospitals (n=4780). I linked
proprietary industry data for orders of the EGFR assay to public datasets that provided
hospital and regional characteristics. I conducted logistic regression to identify significant
characteristics that predict likelihood a hospital ordered the assay. Results: Of acute care
hospitals in the US, 12% (n=592) ordered the EGFR assay. In 49 counties with an NCI
designated cancer center (NCI CC), 19% of hospitals ordered the assay. Hospital and
regional characteristics had the hypothesized effect on likelihood a hospital would order
the EGFR assay. Significant institutional predictors of ordering the assay included:
Participation in an NCI clinical research cooperative group (odds ratio [OR], 2.06, 95%
CI 1.66 to 2.55), Cardiothoracic Surgery (OR, 1.90; 95% CI, 1.52 to 2.37), PET Scan
services (OR, 1.44, CI, 1.07 to 1.94), and affiliation with academic medical center (OR,
v
1.48; 95% CI, 1.20 to 1.83). Inpatient chemotherapy services were not statistically
significant once all other institutional characteristics were stepped in. Significant regional
predictors included: metropolitan county (OR, 2.08; 95% CI, 1.48 to 2.91), education
above the mean (OR, 1.46; 95% CI, 1.09 to 1.96), and income above the mean (OR, 1.46;
95% CI, 1.09 to 1.96). Negative predictors were distance from an NCI CC (OR, .996,
95% CI, .995 to .998), a 34% decrease in likelihood for every 100 miles further from an
NCI CC.
vi
TABLE OF CONTENTS
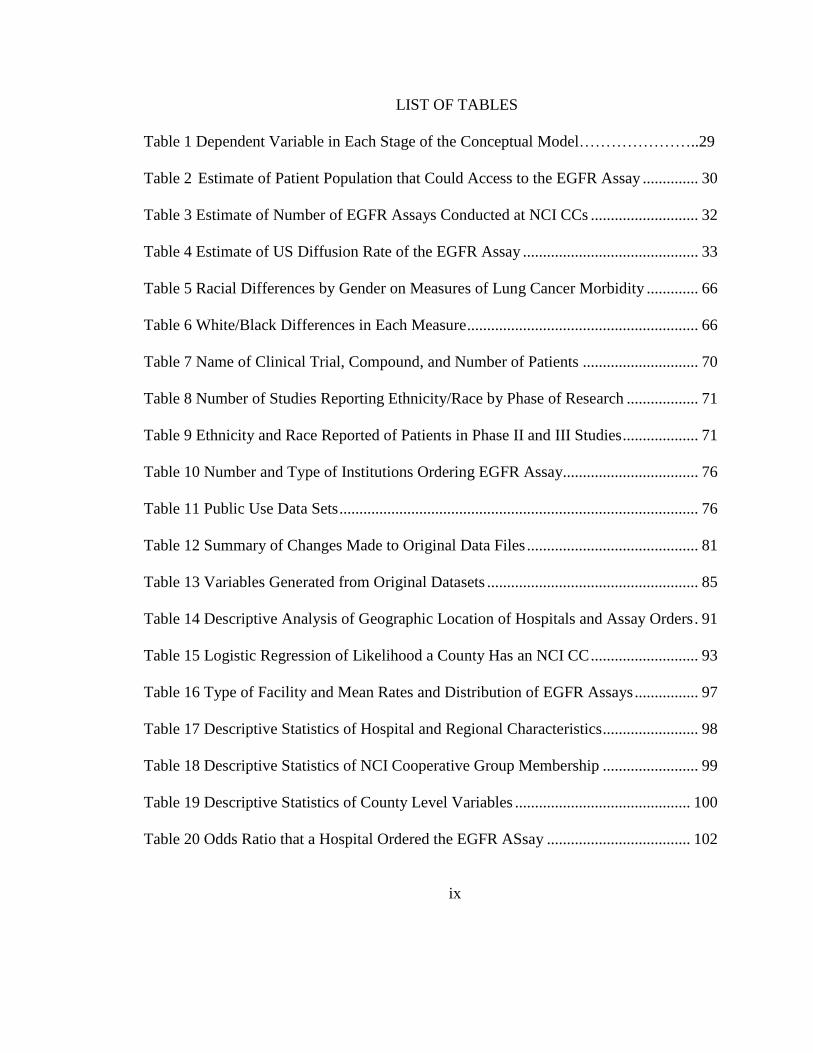
LIST OF TABLES……………………………………………………………………...viii
LIST OF FIGURES……………………………………………………………………...ix
CHAPTER Page
1 .............................................................................................................................. 1 Purpose ........................................................................................................ 1
Aims ............................................................................................................ 4 Conceptual Modeling .................................................................................. 6
Clinical processes and guidelines for diagnosis and treatment of
NSCLC ...................................................................................... 6
Disparities in lung cancer treatment and EGFR TKI clinical trials
................................................................................................. 10
Diffusion of innovation ................................................................. 11
Assumptions of the conceptual model ...................................................... 27
Illustration of the Conceptual Model ........................................................ 33 Hypotheses ................................................................................................ 36
Equation 1 hypotheses – Analysis of location of NCI CC ............ 36
Equation 2 hypotheses – Likelihood any U.S hospital ordered
EGFR assay ............................................................................. 37
Equation 3 hypotheses – Regional factors influencing EGFR
utilization rate ......................................................................... 38
Significance............................................................................................... 39 Contexts .................................................................................................... 40
Background on development of the research question ................. 40
Development, commercialization, and licensing of the EGFR assay
................................................................................................. 41
Federal government’s sponsorship of cancer clinical research..... 43
Definition of terms .................................................................................... 48
2 ............................................................................................................................ 53
Diffusion of innovation of healthcare services and technologies research 53 Lung cancer clinical outcomes research ................................................... 59
Lung cancer disparities research ............................................................... 63 Clinical trials of EGFR mutations and EGFR TKIs ................................. 67
vii
CHAPTER Page
3 ............................................................................................................................ 73
Methods..................................................................................................... 73 Description of proprietary dataset ................................................. 75
Description of public datasets ....................................................... 76
Creating the analytical file ............................................................ 79
Refining the Public Data Sets ....................................................... 79
Statistical Methods ........................................................................ 86
Methodological challenges ........................................................... 87
4 ............................................................................................................................ 90 Equation 1 Results .................................................................................... 90
Equation 2 Results .................................................................................... 95 Sensitivity Testing of Equation 2 Results ................................... 106
Equation 3 Results .................................................................................. 113
5 .......................................................................................................................... 118
Conclusions and implications ................................................................. 118
REFERENCES ................................................................................................... 122
viii
LIST OF FIGURES
Figure 1 Proposed Categories of Adoption by Types of Acute Care Hospital.............22
Figure 2 Diffusion of EGFR Testing Based on Genzyme Genetics Claims ………....25
Figure 3 Compounding Effect of Differential Rates of Diffusion………………...….27
Figure 4 Steps in the Conceptual Model……………………………………………...34
Figure 5 Flowchart of Process for Linking Datasets to Create Analytic File…...……74
ix
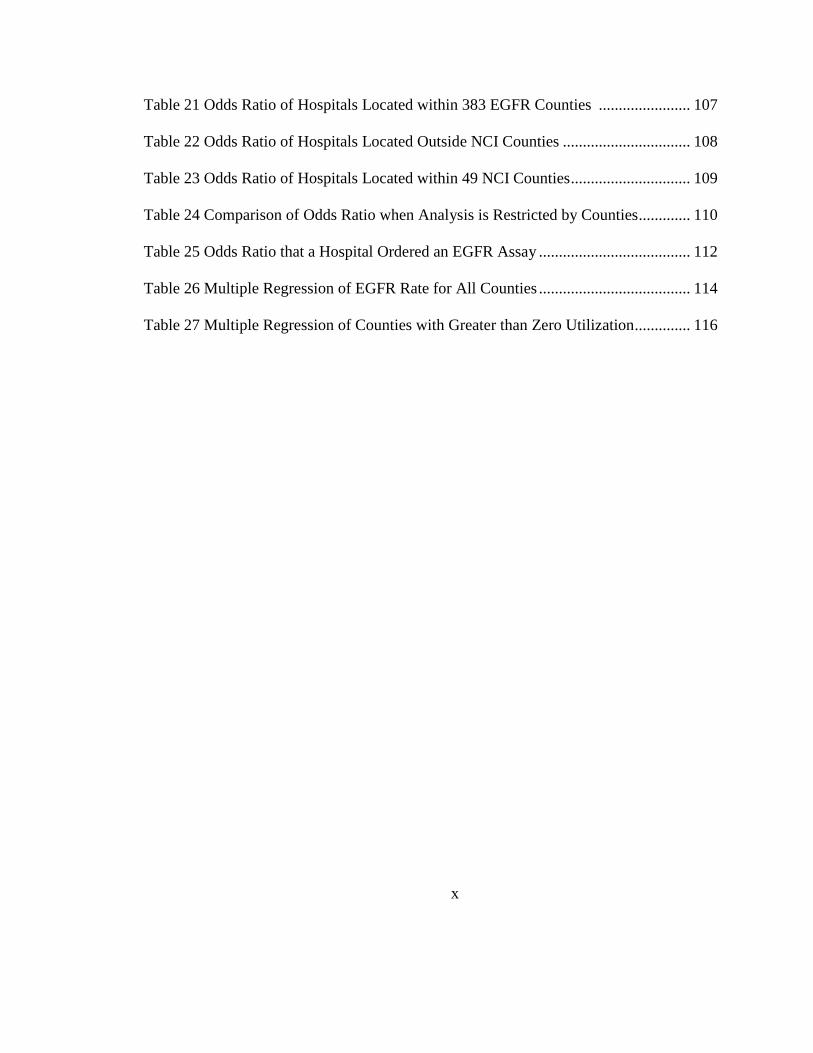
LIST OF TABLES
Table 1 Dependent Variable in Each Stage of the Conceptual Model…………………..29
Table 2 Estimate of Patient Population that Could Access to the EGFR Assay .............. 30
Table 3 Estimate of Number of EGFR Assays Conducted at NCI CCs ........................... 32
Table 4 Estimate of US Diffusion Rate of the EGFR Assay ............................................ 33
Table 5 Racial Differences by Gender on Measures of Lung Cancer Morbidity ............. 66
Table 6 White/Black Differences in Each Measure .......................................................... 66
Table 7 Name of Clinical Trial, Compound, and Number of Patients ............................. 70
Table 8 Number of Studies Reporting Ethnicity/Race by Phase of Research .................. 71
Table 9 Ethnicity and Race Reported of Patients in Phase II and III Studies ................... 71
Table 10 Number and Type of Institutions Ordering EGFR Assay.................................. 76
Table 11 Public Use Data Sets .......................................................................................... 76
Table 12 Summary of Changes Made to Original Data Files ........................................... 81
Table 13 Variables Generated from Original Datasets ..................................................... 85
Table 14 Descriptive Analysis of Geographic Location of Hospitals and Assay Orders . 91
Table 15 Logistic Regression of Likelihood a County Has an NCI CC ........................... 93
Table 16 Type of Facility and Mean Rates and Distribution of EGFR Assays ................ 97
Table 17 Descriptive Statistics of Hospital and Regional Characteristics ........................ 98
Table 18 Descriptive Statistics of NCI Cooperative Group Membership ........................ 99
Table 19 Descriptive Statistics of County Level Variables ............................................ 100
Table 20 Odds Ratio that a Hospital Ordered the EGFR ASsay .................................... 102
x
Table 21 Odds Ratio of Hospitals Located within 383 EGFR Counties ....................... 107
Table 22 Odds Ratio of Hospitals Located Outside NCI Counties ................................ 108
Table 23 Odds Ratio of Hospitals Located within 49 NCI Counties .............................. 109
Table 24 Comparison of Odds Ratio when Analysis is Restricted by Counties ............. 110
Table 25 Odds Ratio that a Hospital Ordered an EGFR Assay ...................................... 112
Table 26 Multiple Regression of EGFR Rate for All Counties ...................................... 114
Table 27 Multiple Regression of Counties with Greater than Zero Utilization .............. 116
1
CHAPTER 1
Purpose
The purpose of this thesis was to conduct an analysis of the diffusion of the epidermal
growth factor receptor (EGFR) assay, a molecular diagnostic test designed to identify a
specific somatic mutation in lung tumor tissue. The EGFR assay is an important
innovation in the diagnosis and treatment of patients with non small cell lung cancer
(NSCLC). Early identification of EGFR mutations in patients’ lung tumors can improve
the treatment and outcome for many such patients. The primary objectives of this analysis
was to: 1) Identify institutional and regional factors that contributed to the adoption and
utilization of the EGFR assay; 2) Elucidate structural factors that may contribute to
differences in access to this technology; 3) Examine potential implications that
differential rates of adoption have for poor patients living in rural counties; 4) Consider
the role of nursing in administration, education, research, policy, and as patient advocate,
to improve equity in access and utilization to advanced molecular diagnostic tests and to
ensure implementation of evidence based clinical practice guidelines.
This was a retrospective, observational study using secondary data analysis
research methods. The research was conducted on a national proprietary data set provided
by Genzyme Genetics which identified institutions that ordered the EGFR assay for their
patients in 2010. The proprietary dataset was merged with national, publicly available
data sets including: Census Bureau Population Data (Census), National Institute of
2
Standards and Technology (NIST) county identification and location data, The National
Program of Cancer Registries and Centers for Disease Control and Prevention
(NPCR/CDC) State Cancer Profiles data, the 2009 Center for Medicare and Medicaid
Services (CMS) and National Cancer Institute (NCI) Provider of Services institutional
characteristics data (CMS/NCI POS).
The conceptual model that guided this research was based on four distinct bodies of
literature:
(1) Clinical processes and guidelines for diagnosis and treatment of non small cell
lung cancer
(2) Lung cancer disparities research
(3) Clinical trials of EGFR tyrosine kinase inhibitors (TKIs) and the EGFR assay
(4) Diffusion of innovation of healthcare services and technologies research
This literature helped generate the overall hypotheses that NCI designated cancer centers
(CCs) serve as hubs from which diffusion of the EGFR assay emanates. The conceptual
model was a two stage model. Stage one was a regional analysis with two dependent
variables. The first dependent variable was the likelihood a county has an AMC that
obtains designation from the NCI as a cancer center. The second dependent variable was
the county utilization rate of the EGFR assay. Stage two of the conceptual model
analyzed the likelihood individual institutions ordered at least one EGFR during the year
2010. The conceptual model proposes and tests two different measures of diffusion. One
measure of diffusion was the county rate of utilization of the EGFR assay. It measured
3
the number of tests ordered within the county relative to the number of lung cancer cases
in that county for which guidelines recommend testing. Throughout the thesis, this
regional measure of diffusion will be called the utilization rate. The second measure of
diffusion was the adoption of the EGFR assay by acute care hospitals within counties. In
this paper, a hospital is considered to have adopted the EGFR assay if it ordered just one
EGFR assay for a patient.
One of the limitations of this study was the lack of comprehensive information
about the number of EGFR assays conducted by sixty clinical care NCI CCs. There were
orders from twenty seven NCI CCs. However, many of these NCI CCs also conduct the
EGFR assay independently. Therefore, all orders from NCI CCs were removed from the
database. Given that limitation, the overall research hypothesis was utilization rate of the
EGFR assay will be highest in counties in close proximity to NCI CCs, with the lack of
information about NCI CC orders artificially suppressing the utilization rate within NCI
CC counties, as well as for the entire United States (US).
The adoption of the EGFR assay, as measured by an institution ordering the
assay, should be greatest among institutions that are either in close proximity to NCI
CCs or that interact with NCI CCs through participation in cooperative clinical research
groups. These institutions are also more likely to be affiliated with AMCs, early adopters
of technology with the capabilities and equipment to offer advanced cancer care services,
and located in metropolitan counties where the patient population has high income,
education, and socioeconomic status. Institutions that are located in counties distant from
4
NCI CCs or are in rural counties that lack an NCI CC should be less likely to adopt the
EGFR assay.
It was hoped that this analysis would shed light upon whether regional differences
in access to molecular cancer diagnostics was a significant factor in the widening gap in
quality and outcomes of healthcare services. Findings of this study will be used to inform
a follow-up study which will examine patient level variables associated with access,
adoption, and utilization of this healthcare innovation to determine whether barriers
impact specific ethnic or racial groups.
Aims
The specific aims of this proposed study were:
(1) Create a dataset that links proprietary data provided by Genzyme Genetics, which
identified institutions that ordered the EGFR assay for their patients in 2010, to
several public use data sets. To achieve this aim, the following processes were
conducted:
a. Aggregated the individual orders for the EGFR assay to the institution and
county level.
b. Matched the institutional name listed in the Genzyme Genetics dataset to
the name in the CMS/NCI POS datasets.
c. Obtained CMS Oscar number for each institution that uniquely identified
it.
5
d. Used the institution’s zip code and county code to link and import
proprietary and public datasets, which provide information about:
i. Characteristics of the acute care hospitals operating within the
county.
(i) Annual lung cancer incidence and average annual number of lung
cancer cases.
(ii) Population socioeconomic and demographic data of the county in
which these hospitals are located.
(iii) Locational data that allows for geocoding and mapping of the
institutions ordering the EGFR assay.
(2) Conducted exploratory analysis of the data to identify characteristics of the
institutions and regions ordering the EGFR assays.
(3) Conduct descriptive and inferential statistical analysis of data.
a. Use descriptive statistics to summarize the independent variables that are
associated with diffusion of the EGFR assay innovation.
b. Identify factors within specific counties that lead to healthcare institutions
receiving the NCI designation.
c. Use logistic regression to analyze the odds ratio that a specific institution
or county will have adopted the EGFR assay.
6
d. Use multiple regression analysis to calculate the strength of the causal
relationship between the independent institutional and regional variables
and EGFR assay utilization rate.
(4) Conclusions and implications that inform policy
Conceptual Modeling
The conceptual model that guides this research is based on four distinct bodies of
literature:
(1) Clinical processes and guidelines for diagnosis and treatment of non small cell
lung cancer
(2) Lung cancer disparities research
(3) Clinical trials of EGFR TKIs and the EGFR assay
(4) Diffusion of innovation of healthcare services and technologies research
A thorough review of the literature in each of these areas is conducted in Chapter 2. The
discussion in this chapter is limited to a summary of the significant findings that informed
the conceptual model and causal hypotheses.
Clinical processes and guidelines for diagnosis and treatment of NSCLC
Lung cancer treatment options are determined by stage of disease, performance
status, tumor histology and presence of oncogenic mutations. NSCLC accounts for 85%
of all lung cancers and adenocarcinomas represents 40% of NSCLC cases (Ettinger et al.,
2010). Lung cancer is initially a silent disease which does not cause obvious signs or
symptoms. In a small percentage of patients, early stage lung cancer may be discovered
7
accidentally through a chest x-ray related to another medical procedure or due to a
coincidental, co-occurring respiratory infection. However, the majority of patients do not
experience signs or symptoms of the disease until it has spread beyond the lungs and they
are in the late stages of the disease process. For approximately 100,000 patients who have
lung cancer, they will first experience vague respiratory symptoms which they, as well as
their primary care provider, may suspect is either a viral or bacterial upper respiratory
infection. Often, these symptoms are simply tolerated or treated with over the counter
cough expectorants or suppressants. If symptoms persist, become worse, if a patient is
coughing up blood (experiencing hemoptysis), or is in pain, these symptoms will
encourage them to visit a hospital emergency room or their primary care physician. In
both cases, the patient will likely have a chest x-ray. If a patient has respiratory
symptoms and a suspicious mass is visible on a chest x-ray, clinical practice guidelines
recommend the patient be referred to further imaging studies such as computerized
tomography (CT) scan, magnetic resonance imaging (MRI), or positron emission
tomography (PET) (Alberg, Ford, Samet, & American College of Chest Physicians,
2007). However, depending upon patient, institutional, and regional factors, the patient
may or may not benefit from clinical practice guidelines. Patient factors that limit access
to certain procedures include clinical symptoms, comorbid conditions, and
sociodemographic factors. Institutional factors that may limit access are capabilities of
the hospital or site of care and knowledge/expertise of providers. Regional factors that
may limit access are physician practice patterns, availability and concentration of
8
healthcare providers and technologies, and population characteristics. All these are
discussed in detail in Chapter 2 in the section of disparities in lung cancer treatment and
outcomes.
Many patients die from lung cancer having only received a chest x-ray or an
imaging study. Yet, conclusive diagnosis of lung cancer requires tumor tissue analysis.
Health services researchers are discovering that clinical practice guidelines, like the
EGFR assay, are a form of innovation that have differential rates of diffusion and which
impact whether patients benefit from these guidelines. Assuming the patient benefits
from clinical practice guidelines, when there is a suspicious finding on an imaging study,
the patient should then be referred to an invasive procedure to extract tumor tissue. It is
important to emphasize that conclusive diagnosis of NSCLC requires a pathologist to
examine lung tissue under a microscope. Therefore, in theory, of the 222,000 patients
who were diagnosed with lung cancer in the U.S. in 2010, approximately 68% (those
with histology of non squamous cell NSCLC) should potentially have had access to the
EGFR assay. However, the reality is that at any point in the clinical decision making
process, large segments of the patient population are either denied access due to clinical
reasons, institutional, or regional characteristics. Chapter 4 provides an analysis of the
expected patient population that would have access to and utilize the EGFR assay.
Stage drives prognosis, treatment, and outcomes for patients with lung cancer.
Although a detailed discussion of the treatment options in each stage are beyond the
scope of this paper, it is important to understand the potential number of patients for
9
which tumor tissue extraction was realistically advisable and feasible. Generally, patients
are eligible for surgical resection if they are diagnosed prior to stage IIIB when the cancer
has spread to distant lung tissue or lymph nodes. Therefore, for approximately 100,000
patients in 2010 (those with Stage I to IIIA), surgical resection of the cancer may have
been possible. Yet regardless of whether a patient is eligible for surgery, clinical practice
guidelines recommend a tissue biopsy.
Depending upon location and accessibility of the suspicious mass, tissue biopsy
could be performed by either bronchoscopy with transbronchial needle aspiration
(TBNA), mediastinoscopy, endobronchial ultrasound-needle aspiration (EBUS-NA),
endoscopic ultrasound-needle aspiration (EUS-NA), or transthoracic needle aspiration
(TTNA) (Alberg et al., 2007). These guidelines recommend which procedure is best
given clinical presentation, location of the tumor, and patient preferences. If a physician
does not refer a patient to a procedure to conclusively diagnose lung cancer, that
physician has impeded access to biopsy, surgery and the EGFR assay technology. In a
few rare cases, the lack of referral may be clinically warranted due to debilitating
coexisting medical conditions. If that physician refers the patient to surgery but the
copayment prevents the patient from undergoing the procedure, health disparity
researchers contend that socioeconomic factors have impeded access to both the surgery
as well as the EGFR assay. If, on the other hand, the physician makes the referral and
there are no financial or other structural barriers that impede access, yet the patient
chooses non-treatment, then the patient had access but lacked utilization. The importance
10
of distinguishing between access and utilization may be unique to diffusion of healthcare
services. It is particularly important to distinguish between these issues to elucidate
causes of lung cancer disparities.
Disparities in lung cancer treatment and EGFR TKI clinical trials
Two decades of lung cancer disparities research illustrate racial, regional, and
socioeconomic differences in access and utilization of bronchoscopy, surgical
procedures, radiation therapy, chemotherapy clinical trials, and standard care
(Greenwald, Polissar, Borgatta, McCorkle, & Goodman, 1998, Bach, Cramer, Warren, &
Begg, 1999, Lathan, Neville, & Earle, 2006, Newman et al., 2004, Gross, Smith, Wolf, &
Andersen, 2008). These finding were further reinforced by a systematic review conducted
by the author of more than thirty-seven multicenter EGFR TKI and biomarker clinical
trials that took place from 2001 until 2010. This review revealed that, of nearly 10,000
patients who participated in phase II and phase III EGFR TKI clinical trials, only 247
(3%) of patients who self identify as Black were enrolled in these studies. Similarly,
there were only 219 (2%) patients who self identify as Hispanic. Institutions and patient
groups that are most likely to utilize the EGFR assay are those who participated in and
benefited from initial research studies to test the efficacy of this treatment relative to the
standard of care. There is some overlap between findings in the EGFR TKI systematic
review and the lung cancer disparities research. Both demonstrate a lack of participation
among minority patient groups in standard care and clinical trial research.
11
Recent research by the Dartmouth Atlas Project indicate that geographic variation
in the use of evidence-based medicine (EBM) is often even larger than racial disparities
in care (Welch, Sharp, Gottlieb, Skinner, & Wennberg, 2011, Onega, Duell, Shi,
Demidenko, & Goodman, 2010). Elucidating whether differences in access, utilization,
and outcomes are caused by patient, providers, or structural factors is difficult. However,
understanding these differences is fundamental to developing conclusive, clinically
informed hypotheses about diffusion of the EGFR assay. Conclusions drawn from this
research suggest that while socioeconomic and demographic variables such as race,
income, and education, might be considered exogenous variables in empirical non-health
services related research, these results call for their inclusion as endogenous variables in
this causal model.
Diffusion of innovation
Roger’s diffusion of innovation framework (1962) proposed three categories of
variables that influence adoption and dissemination of new technologies: Characteristics
of the social network; Attributes of the innovation; Aspects of the decision process
(Rogers, 1962). Applying this framework to the EGFR assay informed the conceptual
model in the following manner:
Characteristics of the social network
According to Rogers, healthcare providers’ decision to use new products or
change their practice patterns is strongly influenced by aspects of the professional social
network in which they operate. He characterized the social network by existence of
12
opinion leaders, connectedness the members of the social network, their need for
communication and their tolerance of risk. Analyzed in the context of adoption of the
EGFR assay:
(1) Opinion leaders - Both the institution and healthcare providers that operate
within the NCI CC serve as key opinion leaders with respect to the process of
diffusion of the EGFR assay. Other institutions and healthcare providers that
are within NCI CC network/communication channels are likely to be exposed
to information about new technologies which are being developed and
implemented in patient care at NCI CCs. Therefore these institutions adopt
this technology sooner than healthcare providers operating at institutions
distant to the NCI CC.
(2) Connectedness - The greater the number of NCI CCs and other hospitals
affiliated with AMCs, the more network connectedness these oncologists have
with oncologists operating in smaller community hospitals nearby.
(3) Members need for communication – Hospitals with an academic affiliation
have a large number of young, transient medical staff and fellows working in
their institutions who are linked by weaker social ties. When members of a
group are transient, as occurs in AMCs with short term presence of residents,
fellow, visiting faculty and physicians, there is a need to share information
more frequently between members, which positively influences diffusion.
13
(4) Tolerance for risk - Healthcare providers working at hospitals with an
academic affiliation and NCI CCs may be more tolerant of risk relative to
their counterparts operating at small community hospitals that are distant from
a population density. Tolerance of risk is influenced by age of residents and
fellows, linkage to key opinion leaders, and knowledge about the science of
the EGFR assay. Attendings and fellows operating within larger AMCs may
be more insulated or protected from the risk of lack of financial
reimbursement than permanent MDs operating within smaller community
hospitals. The perception of lack of reimbursement may contribute to
providers at community hospitals being more risk averse to adopting new
technologies due to concern or lack of knowledge about reimbursement.
Attributes of the innovation
The ease and speed with which an innovation is taken up in the market is
influenced by characteristics of the innovation and features of the product or service used
in conjunction with, or in lieu of, the innovation. Rogers described these attributes as:
relative advantage, compatibility, complexity, trialability, and observability (Rogers,
1962).
(1) Relative Advantage - When oncologists order the EGFR assay for a patient
and an EGFR mutation is detected, the patient is often treated with an EGFR
TKI in a first line setting. The oncologist then observes the benefit of knowing
the mutational status. If the assay is not utilized, the patient may still receive
14
an EGFR TKI in the second or third line setting. Experience with an EGFR
TKI has a positive influence on the diffusion of the EGFR assay. Oncologists
who have not experienced (either directly or through their social network) the
relative advantage of the EGFR assay to guide treatment, may perceive the
relative advantage of the EGFR assay as less than their colleagues who have
had experience with the assay. Therefore, both institutional and regional
characteristics of the social network in which oncologists operate impact their
perception of relative advantage of the EGFR assay. Oncologists who operate
within a social network, in which opinion leaders have participated in the
EGFR TKI clinical trials, will have directly or indirectly been exposed to the
relative advantage of the EGFR assay. Experience with the EGFR assay and
experience prescribing EGFR TKIs will increase the perception of the relative
advantage and will increase adoption.
(2) Compatibility - Genetic analysis of tumor tissue began entering oncology
practice in the mid 1990s with the treatment of Her2 positive breast cancers.
For oncologists who operate within institutions that have the capability to
provide advanced cancer care, adoption of the EGFR assay to identify the
molecular biology of lung tumors will be consistent and compatible with other
types of cancer care. One marker of an institution’s capability to provide
advanced cancer care may be utilization of other established cancer care
technologies such as positron emission tomography (PET) scans technology.
15
(3) Complexity or simplicity - Genetic analysis of tumor tissue is a complex
technology. However, the process of ordering the laboratory test from
Genzyme Genetics is simple and routine. Institutions that participate in
clinical research, offer advanced cancer care, and are classified as AMCs
routinely send tumor tissue to outside labs for analysis. These institutions will
perceive the EGFR assay as having less complexity. This will lead to faster
adoption and diffusion of the technology within those institutions.
(4) Trialability - Institutional participation in clinical research provides MDs with
the opportunity to trial the technology. Institutions that participate in an NCI
clinical research cooperative group, or are identified as having an affiliation
with an academic center are more likely to have trialed the EGFR assay and
therefore adopt the technology.
(5) Observability - Although observability is not applicable to the EGFR assay,
one might substitute whether the technology is easily identifiable to patient
and physician groups. One barrier to diffusion of the EGFR assay is that lung
cancer patients tend to be older and diagnosed at later stages. Therefore, the
number of patients that can communicate about the technology to create
visibility for the technology is limited compared to an assay used in diagnosis
of cancers which are more chronic and less terminal, such as breast cancer.
Although this attribute of the innovation certainly influences diffusion, there
is no variable in our data that would measure observability.
16
Characteristics of the decision
Rogers also proposed that aspects of the decision to adopt innovation influenced
diffusion. If the decision is optional, made by an individual rather than as a collective or
in response to some authority or policy dictating it’s use, then adoption is less likely to
occur. These are discussed in the context of the characteristics of ordering the EGFR
assay:
(1) Optional innovation decision - The decision to order the EGFR assay for a
specific patient remains at the discretion of the individual physician, often an
oncologist, surgeon, or pathologist.
(2) Collective innovation decision – Beginning in April 2010, the National
Comprehensive Cancer Network (NCCN) and the American Society of
Clinical Oncology (ASCO) called for use of the EGFR assay for diagnosis and
treatment of specific lung cancer patients. Although clinical practice
guidelines seek to improve translation of new technology into practice, the
decision to follow the guidelines remains in the purview of the individual
physician.
(3) Authority innovation decision - In countries with publicly funded health
service systems, such as the United Kingdom, a government agency may issue
guidelines for care or reimbursement that may essentially mimic an authority
innovation-decision process. In the United States (US), such guidelines more
often restrict the diffusion of a new medical technology rather than promote it.
17
Currently, Medicare pays for reimbursement of the EGFR assay. However,
Medicare policy does not ensure the physician has knowledge of that
coverage. While reimbursement is not a significant barrier, particularly
because the majority of patients diagnosed with lung cancer are over age sixty
five and qualify for Medicare. Reimbursement did not result in the automatic
adoption which might be observed in an authority-innovation decision
process.
While the process of diffusion of innovation has been well researched in other markets,
particularly consumer markets, only recently has it been applied to the healthcare services
market. Few health disparity researchers applied the framework to analyze differences in
access, utilization, and outcomes in healthcare. Roger’s framework (1962) was a useful
tool for articulating and categorizing variables within a causal model of diffusion. Yet,
there are some important limitations worth noting. Rogers’s model does not adequately
address the barriers to diffusion that a complex regulatory and reimbursement
environment can impose. Reimbursement of the EGFR assay is likely restricted by
physician and institutional knowledge of how to bill for the assay. For institutions to
receive adequate reimbursement, administrative billing or coding staff must have the
knowledge and skills to accurately bill using several correct procedural terminal (CPT)
codes. Frequently, billing and coding expertise is restricted by size and location of the
institution. Although such expertise likely resides within large NCI CC or medical
18
centers with an academic affiliation, smaller community hospitals that have not been
routinely obtaining genetic analysis of patient tumor tissue, might lack this expertise.
Roger’s framework does not include cost in his discussion of attributes of the
innovation. Particularly in the US healthcare system, there has been increased emphasis
on the need to control the rising costs of healthcare. Providers are becoming increasingly
aware of the cost of innovations and this may impede adoption and diffusion of the
innovation.
Roger’s framework also does not consider the timing and role of professional
associations such as National Cancer Center Network (NCCN) or American Society of
Clinical Oncology (ASCO) in their issuance of clinical practice guidelines. When there
is a delay in the issuance of guidelines by such organizations, or when there is vacillation
or uncertainty in the clinical utility of a health innovation, this confusion and uncertainty
may significantly delay diffusion. The EGFR assay experienced both types of delays.
There was confusion around the methodology for testing and whether patients lacking an
EGFR mutation also benefited from and EGFR TKI. These were a factor in the pace of
diffusion. In some cases, delays in diffusion may benefit patients by allowing better
evidence to develop which may contradict the enthusiasm often generated from early
results of innovation.
A recent review by Soleimani & Zenios (2011), suggested that the regulatory and
reimbursement systems of the US contribute to incremental rather than disruptive
approaches to innovation. They suggested that in some cases disruptive innovations may
19
have a greater impact on patient care. The framework by Christensen and Raynor
(Christensen & Raynor, 2003) emphasized that while provider markets have seen
disruptive innovation, patient markets have not. The example provided is the invention of
cardiac stents, which essentially allowed interventional radiologists to compete with
cardiac surgeons (Soleimani & Zenios, 2011). The innovation in the provider market
increased competition for patients by two separate groups of providers competing for
patients.
Lacking in the Soleimani & Zenios (2011) analysis is a discussion about the role
principal-agent theory may have in the feasibility of disruptive innovations in patient
markets. Principal-agent theory is an economic and legal concept in which a principal
(the patient) delegates, either by choice or by necessity, authority to an agent (the
physician) to make decisions about which healthcare services will be performed. This
principal-agent theory is very applicable and relevant to the conceptual model of studying
diffusion of the EGFR assay. As long as a physician referral/prescription is required to
obtain access to and reimbursement for the EGFR assay, the physician and third party
payer serve as gatekeepers to adoption, utilization, and successful diffusion of the EGFR
assay. Whether physicians need to recommend patient access to the EGFR assay is in
important consideration, one which will be taken up in the conclusion and implications
section of this paper.
Given that diffusion of the EGFR assay is restricted by both patient choice and
physician referral, which may be further restricted by institutional characteristics,
20
knowledge about reimbursement, or policies for implementing clinical practice
guidelines, there are a few ways to measure successful diffusion of the EGFR assay. One
measure of diffusion is the number of institutions that have adopted the assay. For
purposes of this analysis, whether an institution has placed a single order for the EGFR
assay for a patient in 2010 will be considered what Roger’s diffusion theory calls
adoption of that innovation (Rogers, 1962). Continued utilization and dissemination of
the innovation is measured as the aggregated usage rate across institutions within each
county relative to the annual number of lung cancer cases in that county that guidelines
recommend receive the assay. That is defined as the utilization rate. For purposes of this
analysis, the primary measures of diffusion are: whether institutions ordering the assay,
the aggregated county level utilization rate, and the penetration rate, defined as the ratio
of institutions ordering the assay relative to number of hospitals within county. These are
defined in detail in Chapter 4.
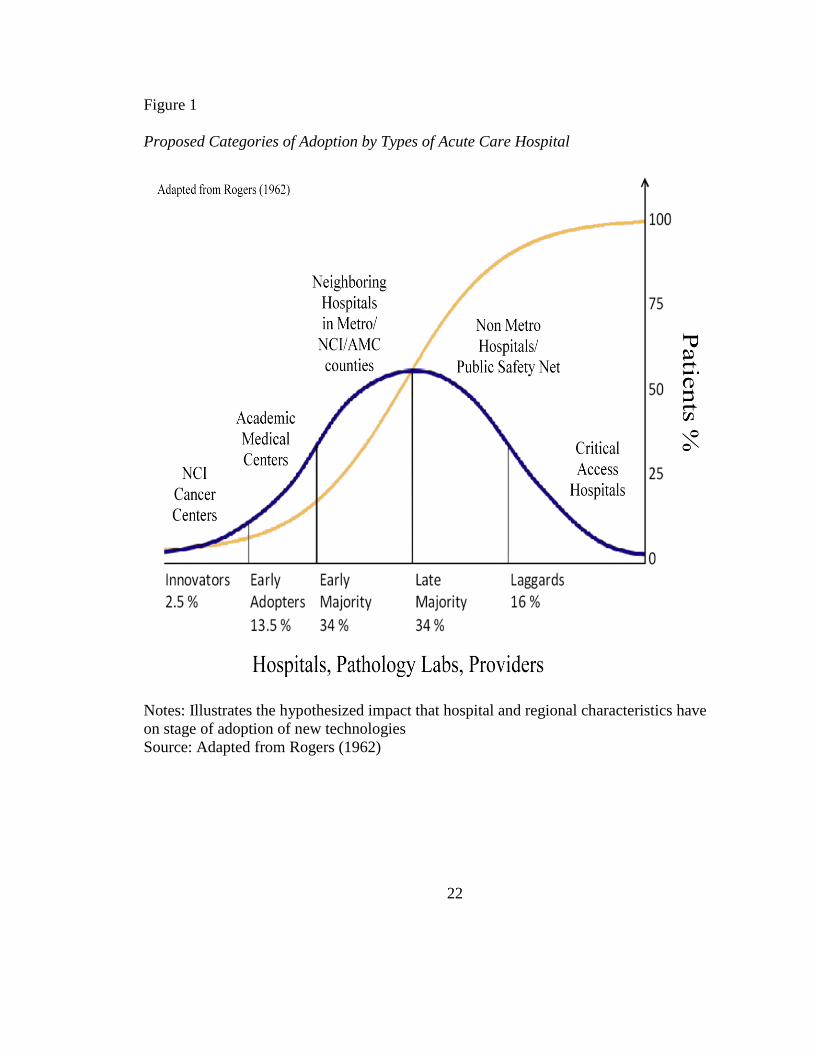
Figures 1, 2, and 3 illustrate how significant findings of the literature were
incorporated into Roger’s diffusion of innovation theory. Figure 1 is the normal curve of
distribution with adopters of innovation categorized according to Roger’s theory. It
illustrates my hypothesis of where in the process of diffusion hospitals fall based on
institutional and regional characteristics. Consistent with the theory, the EGFR assay was
developed by an NCI CC. Therefore, NCI CCs are in the innovator category. The
academic medical centers (AMCs) which do not necessarily have NCI designation but
participate in similar types of clinical cancer research are likely to be early adopters of
21
innovation. Neighboring hospitals in well educated, high income metropolitan counties
surrounding the NCI CCs and large AMCs are likely to be in the early majority.
Hospitals distant to the NCI CCs, located in non metropolitan counties, and categorized
as critical access hospitals are expected to be within the late majority or laggards in
adoption of innovation.
22
Figure 1
Proposed Categories of Adoption by Types of Acute Care Hospital
Notes: Illustrates the hypothesized impact that hospital and regional characteristics have
on stage of adoption of new technologies
Source: Adapted from Rogers (1962)
23
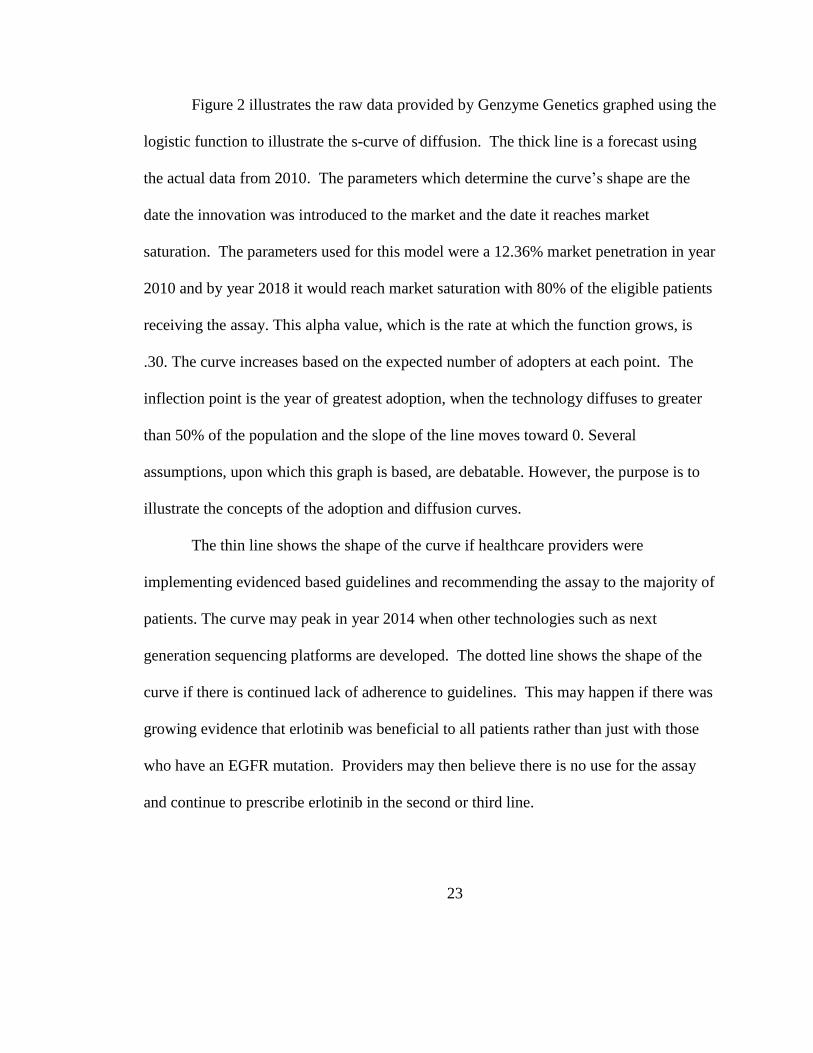
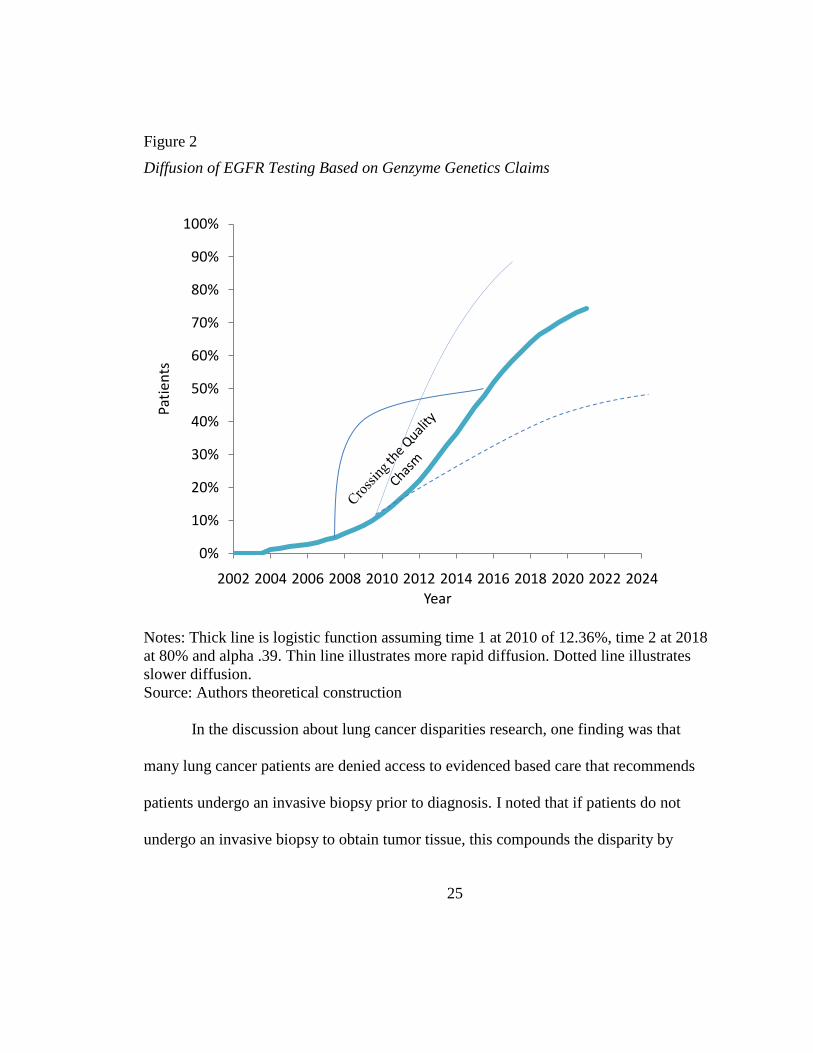
Figure 2 illustrates the raw data provided by Genzyme Genetics graphed using the
logistic function to illustrate the s-curve of diffusion. The thick line is a forecast using
the actual data from 2010. The parameters which determine the curve’s shape are the
date the innovation was introduced to the market and the date it reaches market
saturation. The parameters used for this model were a 12.36% market penetration in year
2010 and by year 2018 it would reach market saturation with 80% of the eligible patients
receiving the assay. This alpha value, which is the rate at which the function grows, is
.30. The curve increases based on the expected number of adopters at each point. The
inflection point is the year of greatest adoption, when the technology diffuses to greater
than 50% of the population and the slope of the line moves toward 0. Several
assumptions, upon which this graph is based, are debatable. However, the purpose is to
illustrate the concepts of the adoption and diffusion curves.
The thin line shows the shape of the curve if healthcare providers were
implementing evidenced based guidelines and recommending the assay to the majority of
patients. The curve may peak in year 2014 when other technologies such as next
generation sequencing platforms are developed. The dotted line shows the shape of the
curve if there is continued lack of adherence to guidelines. This may happen if there was
growing evidence that erlotinib was beneficial to all patients rather than just with those
who have an EGFR mutation. Providers may then believe there is no use for the assay
and continue to prescribe erlotinib in the second or third line.
24
Rogers often gets credit for the s-curve of diffusion but it was actually economist
Ayers (1989) who illustrated that diffusion of innovation follows a logistic function S-
curve. Rogers (1962) framework proposed that adopters of innovation fall along a
normal distribution, which he categorized as innovators, early adopters, early majority,
late majority and laggards. This curve also illustrates a concept which was popularized in
healthcare by the Institute of Medicine (IOM) but which was originally proposed by
Geoffrey A. Moore in his 1991 book entitled Crossing the Chasm (Moore, 1991). Moore
analyzed adoption of information technology products. The IOM applied Moore’s
theories to analyze differences in the delivery of quality healthcare services. The IOM
proposed that differences in quality exist due to delay in implementation of innovation
and evidence based medicine to the overall population. The chasm refers to the time
period between when the innovation is used by early adopters (which in my model would
be the NCI CC and large AMCs) to when it is disseminated to the early majority. This
time period coincides with the inflection point, which is halfway to market saturation.
The number of adoptions per year peak at the inflection point and the slope of the
diffusion curve moves toward 0. An important point is that Moore viewed this s-shaped
curve as applicable to disruptive technologies which result in a significant change of
behavior. There are many researchers which believe regulatory, reimbursement, and
physician practices make disruptive innovations in healthcare difficult.
25
Figure 2
Diffusion of EGFR Testing Based on Genzyme Genetics Claims
Notes: Thick line is logistic function assuming time 1 at 2010 of 12.36%, time 2 at 2018
at 80% and alpha .39. Thin line illustrates more rapid diffusion. Dotted line illustrates
slower diffusion.
Source: Authors theoretical construction
In the discussion about lung cancer disparities research, one finding was that
many lung cancer patients are denied access to evidenced based care that recommends
patients undergo an invasive biopsy prior to diagnosis. I noted that if patients do not
undergo an invasive biopsy to obtain tumor tissue, this compounds the disparity by
0%
10%
20%
30%
40%
50%
60%
70%
80%
90%
100%
2002 2004 2006 2008 2010 2012 2014 2016 2018 2020 2022 2024
Pati
ents
Year
26
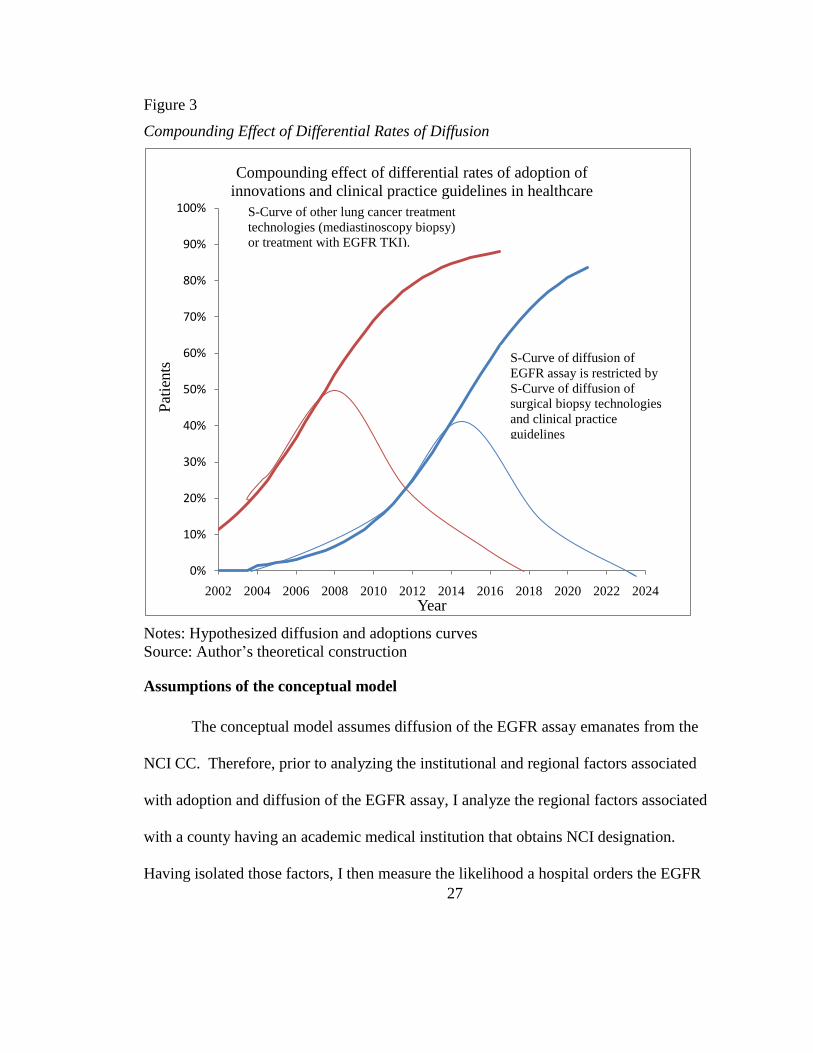
additionally preventing access to the EGFR assay. Figure 3 illustrates two hypothesized
pairs of curves. The s-curves of diffusion that crosses the y axis at year 2002 with the
adoption curve at 10% are for diffusion of the guideline recommending invasive biopsy
to diagnosis lung cancer. The diffusion and adoptions curves to the right are for the
EGFR assay. This illustration is meant to show how diffusion and adoption curves of the
EGFR assay are restricted by the adoption and diffusion curves of invasive biopsies.
According to these hypothesized curves, in 2010 only 70% of lung cancer patients
underwent invasive biopsy. Therefore, only those patients would have access to the
EGFR assay.
27
Figure 3
Compounding Effect of Differential Rates of Diffusion
Notes: Hypothesized diffusion and adoptions curves
Source: Author’s theoretical construction
Assumptions of the conceptual model
The conceptual model assumes diffusion of the EGFR assay emanates from the
NCI CC. Therefore, prior to analyzing the institutional and regional factors associated
with adoption and diffusion of the EGFR assay, I analyze the regional factors associated
with a county having an academic medical institution that obtains NCI designation.
Having isolated those factors, I then measure the likelihood a hospital orders the EGFR
0%
10%
20%
30%
40%
50%
60%
70%
80%
90%
100%
2002 2004 2006 2008 2010 2012 2014 2016 2018 2020 2022 2024
Pat
ients
Year
Compounding effect of differential rates of adoption of
innovations and clinical practice guidelines in healthcare
S-Curve of diffusion of
EGFR assay is restricted by
S-Curve of diffusion of
surgical biopsy technologies
and clinical practice
guidelines
S-Curve of other lung cancer treatment
technologies (mediastinoscopy biopsy)
or treatment with EGFR TKI).
28
assay given its institutional and regional characteristics. Finally, I analyze the rate of use
of the EGFR assay, calculated as the number of assays ordered in the county divided by
the annual number of guidelines directed lung cancer cases in that county. Adoption is
defined in this study as a hospital having ordered at least one EGFR assay from Genzyme
Genetics. This analysis will be conducted at the institutional level and by whether the
institution is located within the same county as an NCI CC. The county rate of utilization
of the EGFR assay refers to the number of EGFR assays ordered relative to the number of
lung cancer cases within the county. This analysis will also be conducted by whether
there is an NCI CC within the county or not.
It is worth noting that county characteristics that positively influence the
utilization rate in counties without an NCI CC, may, in some cases have the opposite
effect in counties with an NCI CC. For example, the average age of diagnosis of lung
cancer is age 71. Although patients under the age 45 can be diagnosed with lung cancer,
the vast majority of patients are diagnosed after age 45. The lung cancer disparities
research has revealed that patient populations most likely to undergo an invasive
procedure to obtain tumor tissue or surgical resection are nonminority patients, with
higher education and incomes. Therefore, metropolitan counties with urban centers have
a high percentage of young minorities which positively influence the location of an NCI
CC. Yet, those same characteristics may contribute to a lower utilization rate because
young minorities are not often diagnosed with cancer.
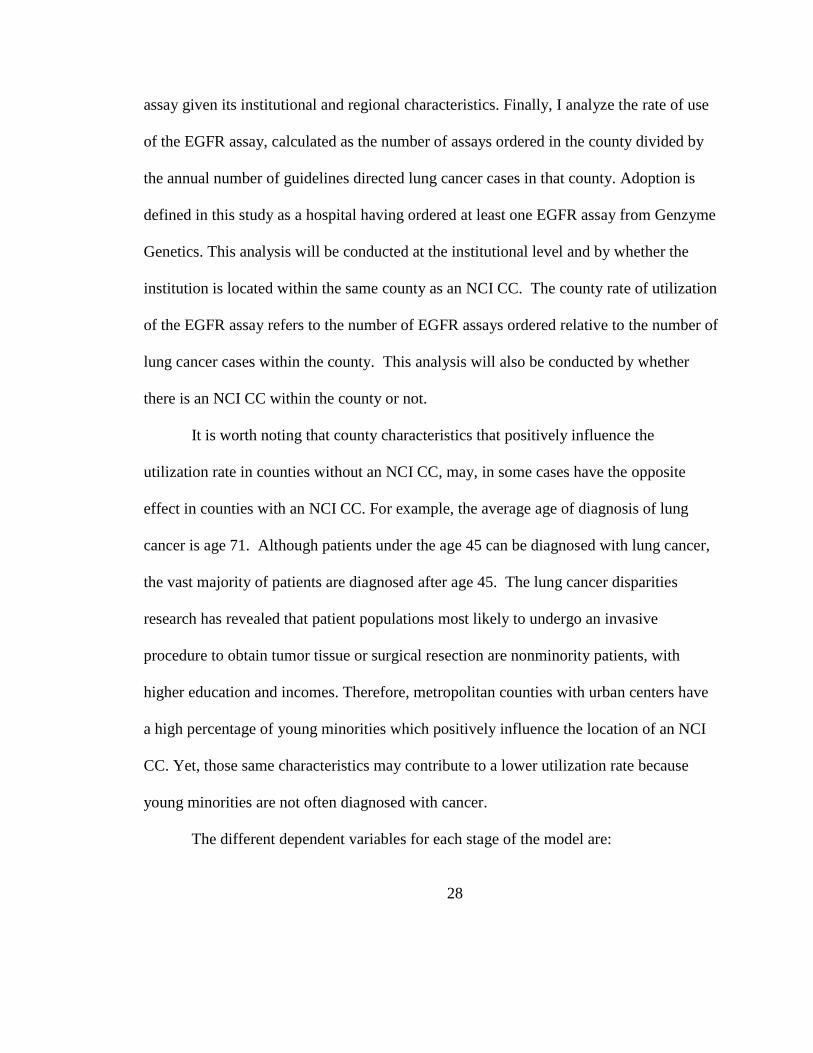
The different dependent variables for each stage of the model are:
29
Table 1
Dependent Variable in Each Stage of the Conceptual Model
Equation Dependent Variable Measured
1 Is there an NCI CC in the county 0/1 - No/Yes
2 Did the hospital order the EGFR assay 0/1 - No/Yes
3 County EGFR adjusted utilization rate 0-1*
Notes: * Presumes assay is conducted during initial diagnosis rather than reflexive testing
of patients diagnosed in prior years. Further presumes cross county utilization is limited.
Source: Author’s construction
It is also necessary to explain that, although this study analyzes diffusion of the EGFR
assay, the literature reviewed suggests persistent institutional and regional differences in
patient access and utilization of older innovations and clinical practice guidelines in the
treatment of lung cancer. These persistent differences in older technologies will also
contribute to a slower rate of diffusion for the EGFR assay.
In the US healthcare system, current policy does not consider the cost benefit
analysis of medical interventions. Therefore, in theory, all patients diagnosed with
NSCLC, for whom guidelines recommend lung tumor genotyping, should have access to
the EGFR assay. However, as described in Figures 2 and 3, if patients are not provided
access to advanced technologies for conducting lung tumor tissue biopsy, such as
mediastinoscopy, access to and diffusion of the EGFR assay is restricted. Further, if
institutions have not been exposed to the benefits of treating patients with an EGFR TKI,
they are less likely to understand the importance of conducting lung tumor genotyping.
So, although in theory all guideline recommended NSCLC patients should have access to
30
the EGFR assay, the reality is that a large segments of the population will be denied
access because they live in remote parts of the country that do not have acute care
hospitals or because they obtain care at critical access hospitals (CAHs) that may not
provide advanced cancer care services. Further, as many as 10% of the lung cancer
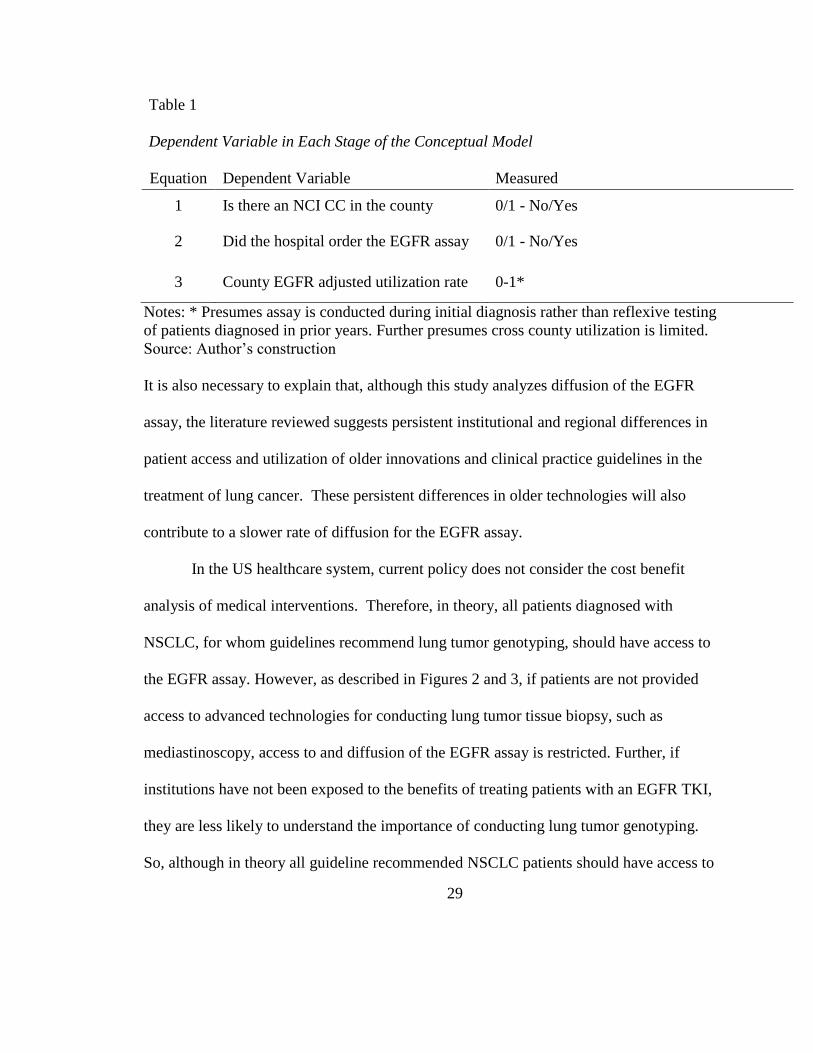
patients offered biopsy or surgery refuse to undergo these invasive procedures. Table 2
provides a reasonable estimate of the 2010 population that could have had access to the
EGFR assay.
Table 2
Estimate of Patient Population that Could Access to the EGFR Assay
CDC/NPCR
Number of incident lung cancer cases in 2010 208,603
NSCLC is 85% of lung cancers 177,313
Routine testing for squamous cell not recommended (35,463)
Guideline recommended testable population 141,850
Patients in 503 counties that have no acute care hospitals (7,403)
10% of patients offered biopsy or surgery for lung cancer refuse (20,860)
Estimate of 2010 testable population 113,587
Notes: Incidence number derived from the National Program of Cancer Registries
(NPCR) and Centers for Disease Control and Prevention (CDC) State Cancer Profiles in
2011.
Source: Author’s construction
With a testable population of 113,587 and Medicare paying between $622.58 and
$836.01 per test, it would cost the country approximately $70 million dollars a year to
test all guideline directed lung cancer patients for an EGFR mutation. Most of these
patients are over age 65, which generates debate about whether genomic analysis of all
these patients is a cost effective intervention. In countries with publicly funded national
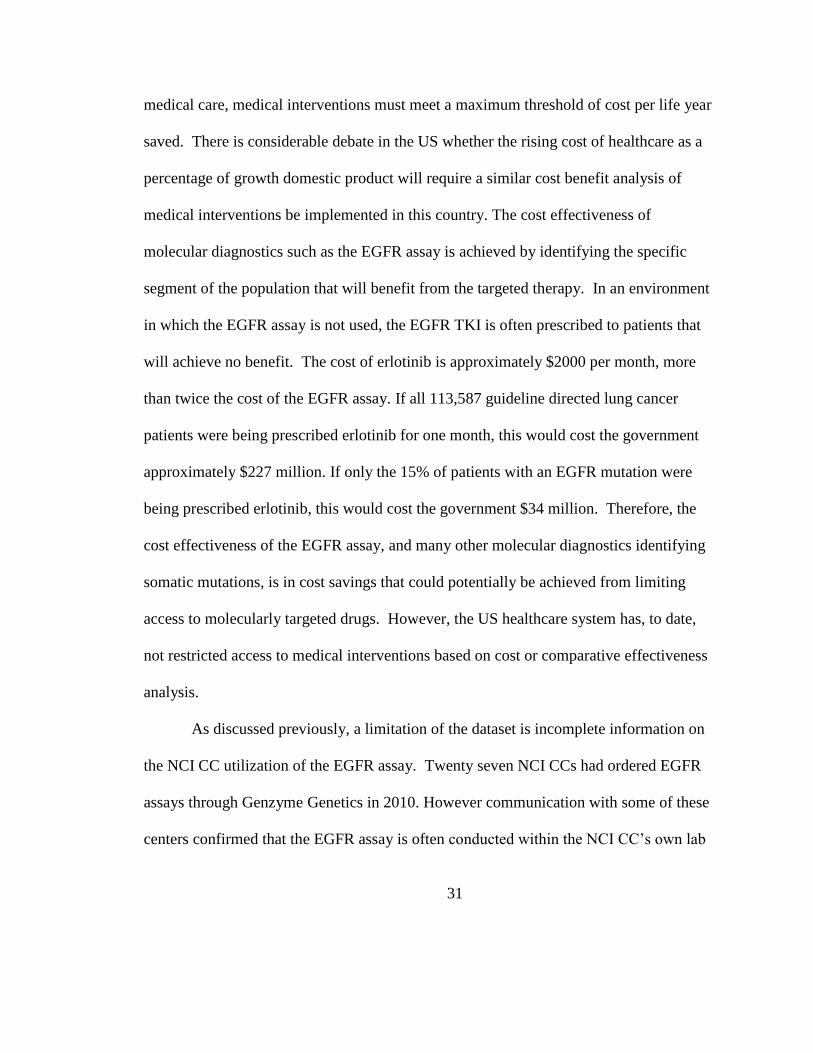
31
medical care, medical interventions must meet a maximum threshold of cost per life year
saved. There is considerable debate in the US whether the rising cost of healthcare as a
percentage of growth domestic product will require a similar cost benefit analysis of
medical interventions be implemented in this country. The cost effectiveness of
molecular diagnostics such as the EGFR assay is achieved by identifying the specific
segment of the population that will benefit from the targeted therapy. In an environment
in which the EGFR assay is not used, the EGFR TKI is often prescribed to patients that
will achieve no benefit. The cost of erlotinib is approximately $2000 per month, more
than twice the cost of the EGFR assay. If all 113,587 guideline directed lung cancer
patients were being prescribed erlotinib for one month, this would cost the government
approximately $227 million. If only the 15% of patients with an EGFR mutation were
being prescribed erlotinib, this would cost the government $34 million. Therefore, the
cost effectiveness of the EGFR assay, and many other molecular diagnostics identifying
somatic mutations, is in cost savings that could potentially be achieved from limiting
access to molecularly targeted drugs. However, the US healthcare system has, to date,
not restricted access to medical interventions based on cost or comparative effectiveness
analysis.
As discussed previously, a limitation of the dataset is incomplete information on
the NCI CC utilization of the EGFR assay. Twenty seven NCI CCs had ordered EGFR
assays through Genzyme Genetics in 2010. However communication with some of these
centers confirmed that the EGFR assay is often conducted within the NCI CC’s own lab
32
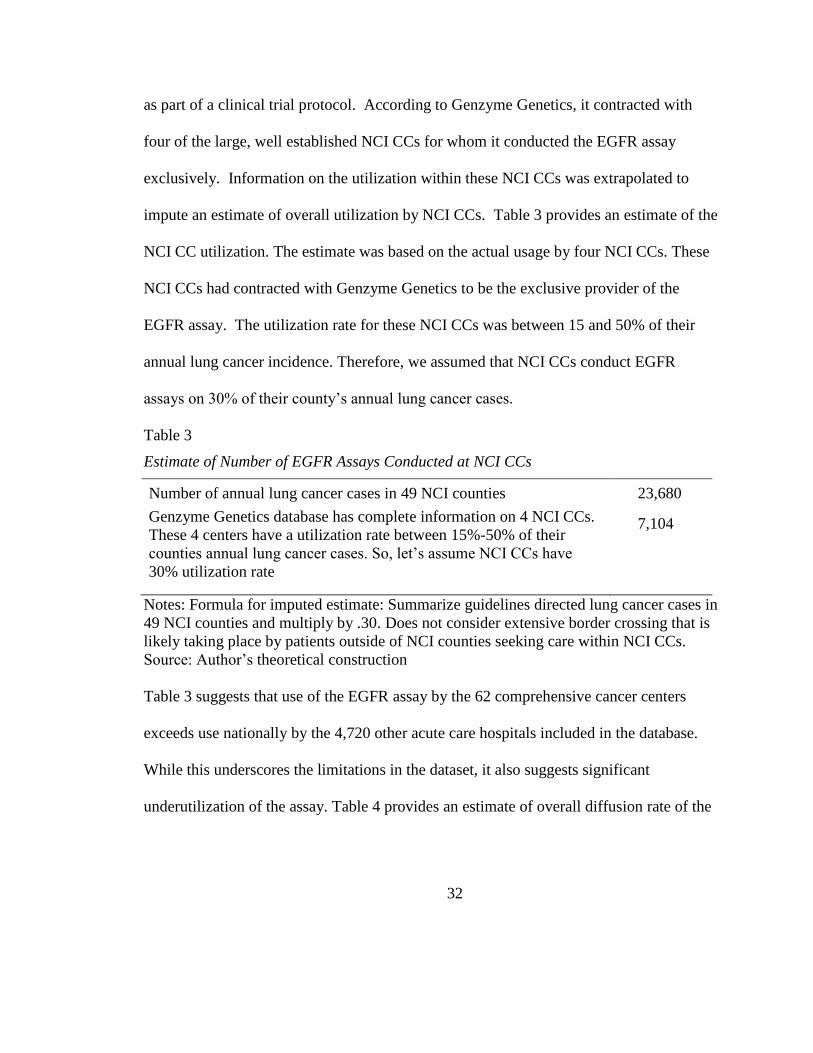
as part of a clinical trial protocol. According to Genzyme Genetics, it contracted with
four of the large, well established NCI CCs for whom it conducted the EGFR assay
exclusively. Information on the utilization within these NCI CCs was extrapolated to
impute an estimate of overall utilization by NCI CCs. Table 3 provides an estimate of the
NCI CC utilization. The estimate was based on the actual usage by four NCI CCs. These
NCI CCs had contracted with Genzyme Genetics to be the exclusive provider of the
EGFR assay. The utilization rate for these NCI CCs was between 15 and 50% of their
annual lung cancer incidence. Therefore, we assumed that NCI CCs conduct EGFR
assays on 30% of their county’s annual lung cancer cases.
Table 3
Estimate of Number of EGFR Assays Conducted at NCI CCs
Number of annual lung cancer cases in 49 NCI counties 23,680
Genzyme Genetics database has complete information on 4 NCI CCs.
These 4 centers have a utilization rate between 15%-50% of their
counties annual lung cancer cases. So, let’s assume NCI CCs have
30% utilization rate
7,104
Notes: Formula for imputed estimate: Summarize guidelines directed lung cancer cases in
49 NCI counties and multiply by .30. Does not consider extensive border crossing that is
likely taking place by patients outside of NCI counties seeking care within NCI CCs.
Source: Author’s theoretical construction
Table 3 suggests that use of the EGFR assay by the 62 comprehensive cancer centers
exceeds use nationally by the 4,720 other acute care hospitals included in the database.
While this underscores the limitations in the dataset, it also suggests significant
underutilization of the assay. Table 4 provides an estimate of overall diffusion rate of the
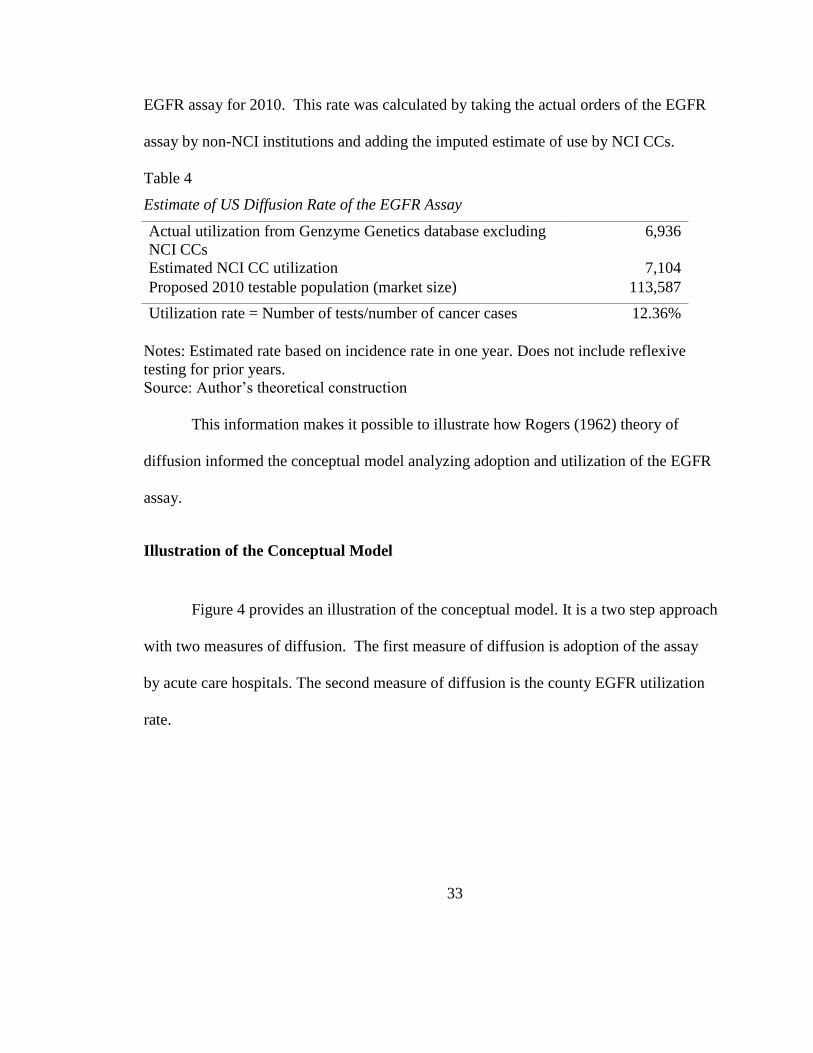
33
EGFR assay for 2010. This rate was calculated by taking the actual orders of the EGFR
assay by non-NCI institutions and adding the imputed estimate of use by NCI CCs.
Table 4
Estimate of US Diffusion Rate of the EGFR Assay
Actual utilization from Genzyme Genetics database excluding
NCI CCs
6,936
Estimated NCI CC utilization 7,104
Proposed 2010 testable population (market size) 113,587
Utilization rate = Number of tests/number of cancer cases 12.36%
Notes: Estimated rate based on incidence rate in one year. Does not include reflexive
testing for prior years.
Source: Author’s theoretical construction
This information makes it possible to illustrate how Rogers (1962) theory of
diffusion informed the conceptual model analyzing adoption and utilization of the EGFR
assay.
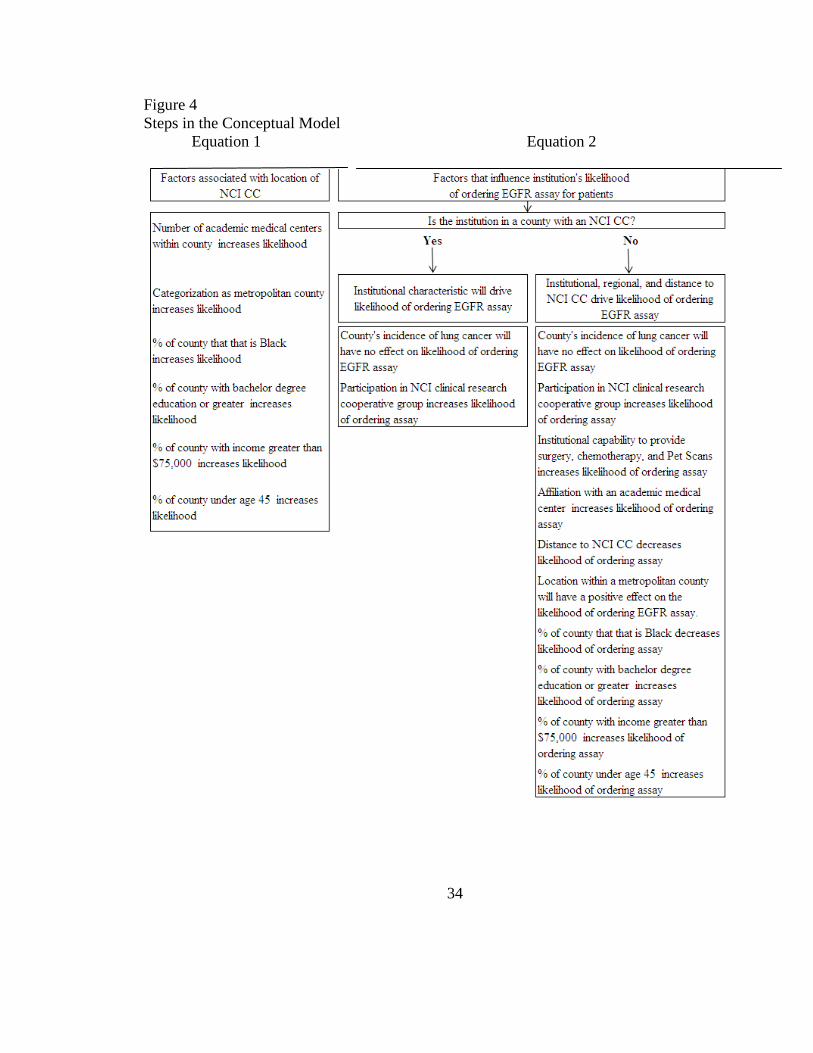
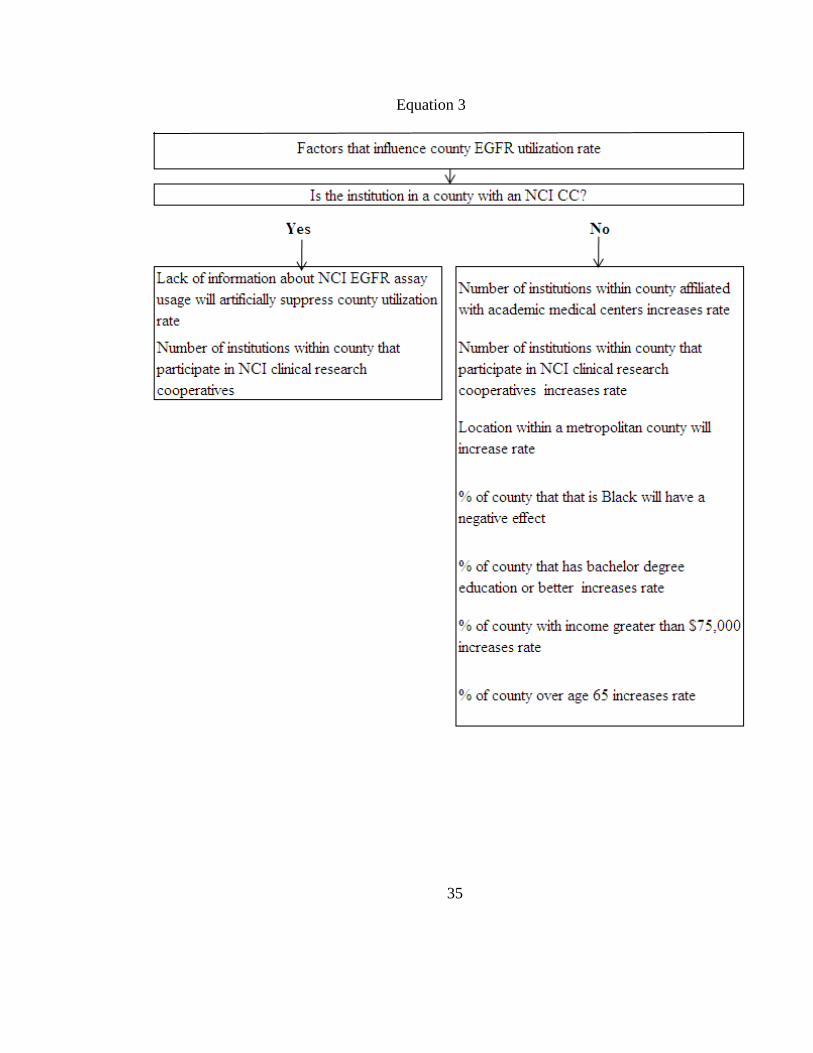
Illustration of the Conceptual Model
Figure 4 provides an illustration of the conceptual model. It is a two step approach
with two measures of diffusion. The first measure of diffusion is adoption of the assay
by acute care hospitals. The second measure of diffusion is the county EGFR utilization
rate.
34
Figure 4
Steps in the Conceptual Model
Equation 1 Equation 2
35
Equation 3
36
Hypotheses
Most patients diagnosed with NSCLC are over age 65. Therefore, in a rational, equitable
healthcare system, in which Medicare coverage reduces reimbursement barriers, the
majority of NSCLC patients should receive quality medical care that is guided by the
evidence reflected in clinical practice guidelines. Only a patient’s inability or
unwillingness to pay the coinsurance or undergo an invasive tumor biopsy should restrict
access to the EGFR assay. A review of the literature discussed within Chapter 2 suggests
that whatever the research hypotheses listed below, the probability that the null
hypothesis is correct is very low.
Equation 1 hypotheses – Analysis of location of NCI CC
As mentioned earlier, a key assumption of this conceptual model is that diffusion
of the EGFR assay emanates from the NCI CCs. Therefore, it is important to understand
the regional factors associated with an academic medical center obtaining NCI
designation.
(1) Number of institutions within county affiliated with AMCs will have a
positive effect on the likelihood there is an NCI CC within the county.
(2) Metropolitan categorization will have a positive effect on the likelihood there
is an NCI CC within the county.
(3) Percentage of the county population that self identify as Black will have a
positive effect on the likelihood there is an NCI CC within the county.
37
(4) Percentage of the county population with education of a bachelor’s degree or
greater will have a positive effect on the likelihood there is an NCI CC within
the county.
(5) Percentage of the county population with income greater than $75,000 will
have a positive effect on the likelihood there is an NCI CC within the county.
(6) Percentage of the county population under age 45 will have a positive effect
on the likelihood there is an NCI CC within the county.
Equation 2 hypotheses – Likelihood any U.S hospital ordered EGFR assay
As discussed in the introductory pages, it is believed that presence of an NCI CC
in the county has a significant influence on the likelihood an institution will order an
EGFR assay. Therefore, the institutional and regional analysis will be conducted with
NCI county as one causal factor. It should also be noted that the 60 clinical care NCI CCs
are located within 49 counties. Institutional hypotheses are:
(1) Annual cases of lung cancer within the county will raise the likelihood of
institutions ordering an EGFR assay.
(2) Whether an NCI CC is present in the county or not, participation in an NCI
clinical research cooperative group has a positive influence on the likelihood
it orders the EGFR assay.
(3) Institutional capabilities to provide cardiothoracic surgery, chemotherapy and
advanced imaging (Pet Scan) increase the likelihood it orders the EGFR assay.
38
(4) Affiliation with an AMC has a positive influence on likelihood it orders the
EGFR assay.
(5) Distance between the hospital and NCI CC will have an inverse relationship to
the likelihood the institution orders the EGFR assay.
(6) Location within a metropolitan county will have a positive effect on the
likelihood of ordering EGFR assay.
(7) Within non NCI CC counties, the percentage of the population that is Black
will have a negative effect on the likelihood the institution adopts the EGFR
assay.
(8) Institutions located in counties in which there is a large percentage of the
population with education of a bachelor’s degree or greater, will have a
positive effect on the likelihood it orders the EGFR assay.
(9) Institutions located in counties in which there is a large percentage of the
population with income above $75K will have a higher likelihood it ordered
the EGFR assay.
Equation 3 hypotheses – Regional factors influencing EGFR utilization rate
(1) NCI CC within county will suppress EGFR Presence of NCI CC in county
will suppress EGFR utilization rate due to lack of NCI CC data
(2) Whether an NCI CC is present in the county or not, number of institutions
within a county participating in NCI cooperative clinical research groups will
have a positive effect on the rate of EGFR assay utilization.
39
(3) Number of institutions within county affiliated with AMCs will increase rate
of EGFR assay utilization
(4) In non NCI counties, location within a metropolitan county will increase rate
of EGFR assay utilization.
(5) In non NCI counties, the percentage of the population that is Black will have a
negative effect on the rate of EGFR assay utilization.
(6) In non NCI counties, the percentage of the population with education of a
bachelor or greater will have a positive effect on the rate of EGFR assay
utilization.
(7) In non NCI counties, the percentage of the population with Income greater
than $75,000 will have a positive effect on the rate of EGFR assay utilization.
(8) In non NCI counties, the percentage of the population that is under 45 will
have a positive effect on the rate of EGFR assay utilization.
Significance
This dissertation research is significant from a number of different perspectives:
Studying differential rates of access to lung tumor genotyping may elucidate factors that
have contributed to persistent socioeconomic and structural differences in diagnosis,
treatment, and outcomes in lung cancer. Identifying barriers that exist in access to the
EGFR assay may help inform the implementation of evidence based clinical practice
guidelines and translational research in other areas of health innovation. Nurses, as
administrators, clinicians, educators, policy analysts, and researchers, are on the forefront
40
of implementing healthcare innovations. Understanding the process of diffusion is a
critical component to successful dissemination of innovation. Further, the nursing
discipline itself is currently undergoing significant change and innovation within its own
professional practice. Analyzing diffusion of a cancer diagnostic technology will inform
nurse researchers of the tools required to successfully implement, measure, and monitor
the dissemination of innovations within the nursing discipline.
Contexts
This section establishes the background in which this research question was
generated. It provides a brief overview of the development, commercialization, and
licensing of the EGFR assay. Further, it provides the traditional health policy framework
analysis of the historical, political, sociological, economic perspectives of the federal
government’s role in the development and funding of cancer diagnostic and treatment
technologies clinical trials.
Background on development of the research question
The impetus for this research study was generated in 2007 when the Director of
Equity at Dana Farber Cancer Institution and Harvard Comprehensive Cancer Center
(DF/HCC) described a growing perception among thoracic oncologists that erlotinib was
not as effective in Blacks as it was in Whites due to a lower incidence of EGFR
mutations in Black lung cancer patients. At the time, there was one paper published
which had oversampled Blacks to get 50 patients in study who self identified as Black. It
reported an incidence rate of EGFR mutations in Blacks as 2.4% or 1 patient (Yang et al.,
41
2005). Being familiar with the well established research documenting the problems of
under representation of minorities in cancer clinical trials and at NCI CCs, I questioned
whether there was enough evidence in the EGFR TKI clinical trials to substantiate the
belief that EGFR mutations in Blacks is rare. In effort to investigate this, I contacted
several leading thoracic oncology principal investigators at NCI CCs to request
information about the number of Blacks enrolled in EGFR TKI clinical trials and
biomarker studies. Five of the country’s leading thoracic oncologists, who were also
active principal investigators in the EGFR TKI clinical trials, reported that few Blacks
were enrolled in the EGFR TKI treatment or biomarker clinical trials. The student
researcher then questioned whether there was also under representation of lung tumor
tissue from Blacks in tissue banks. Pathologists responsible for overseeing large NCI
funded lung tumor tissue banks reported that only recently had tissue banks begun to
record ethnicity and race of patients’ tumor tissue in their anonymous tissue bank. From
this limited qualitative/investigational approach, the student developed her main research
interest which was investigating whether the patterns of enrollment of patients in lung
cancer clinical trials contributes to growing gap in lung cancer outcomes among poor and
minority patients.
Development, commercialization, and licensing of the EGFR assay
In April 2004, two research groups at the federally funded NCI CC, DF/HCC,
proved the link between clinical responsiveness to an EGFR TKI and a mutation in the
EGFR receptor (Lynch et al., 2004; Paez et al., 2004). This discovery lead to the
42
development of the EGFR assay. By September 2005, DF/HCC and its investigators sold
the worldwide rights to market and distribute the EGFR assay to Genzyme Genetics
(Genzyme Genetics, 2005). In February 2008, Genzyme Genetics sublicensed the
worldwide rights, with the exception of North America and Hong Kong, to DxS, a
company based in the UK. This company, in collaboration with Astra Zeneca, had
developed and was marketing its own version of the EGFR assay (Genzyme Genetics,
2008) and was marketing it in Europe for use as a companion diagnostic in combination
with Astra Zeneca’s EGFR TKI gefitinib. In 2009, Genzyme Genetics expanded the
license with DxS to include the US market. However, during this time, DxS was in a
dispute with Roche Diagnostics over the rights to its EGFR mutation detection kid.
Further, DxS was in the process of being acquired by a larger UK based company,
Qiagen. Therefore, DxS’s focus on the marketing and distribution of the EGFR assay in
US was minimal. According to Genzyme Genetics, the agreement with DxS did not
make any meaningful contribution to the number of EGFR assays sold in the US market.
By late November 2010, Roche Diagnostics, one of the largest, publically traded
diagnostic and pharmaceutical companies in the world, also sublicensed from Genzyme
Genetics, the worldwide rights to market and distribute the EGFR assay. Following this
transaction, LabCorp, a large, publically traded clinical research organization, announced
its intention to acquire Genzyme Genetics.
Frequent licensing, acquisitions, and merger activity is common for companies
and technologies that are early in the s-shaped diffusion curve, particularly when there is
43
a belief or perception that the slope of the curve is about to increase rapidly. Such
commercialization may also lead to better access for poor and minority patients because
diffusion of the innovation may become disruptive rather than the slower, incremental
approach that takes place in the initial stages of federally funded translational research.
An important question health service researchers need to consider is, given that
many innovations in cancer treatment are developed by institutions supported by federal
taxpayer funds, whose responsibility is it to ensure that: 1) Development of health
innovations are informed by diverse patient populations. 2) Minority and poor patients
achieve the same timely benefit from health innovations as patients who routinely seek
care at the institutions developing these innovations. The following section discussed the
federal government’s investment and commitment to these issues.
Federal government’s sponsorship of cancer clinical research
Historically, the federal government has provided substantial financial and
political support for cancer research and care. This support began with the 1930 passage
of the Ransdell Act creating the National Institute of Health (NIH), authorizing the
establishment of fellowships for research into basic biological and medical problems, and
regulating new drug development (Starr, 1982). In 1937, Congress authorized the
creation of the NCI along with Public Health Service, which funded cancer research in
both its own labs as well as outside labs. Ten years later, NCI reorganized to provide an
expanded program of intramural cancer research, grants, and cancer control activities
with appropriations to the states and AMCs for their support of cancer control activities.
44
The investment and coordination from the Federal Government in clinical
research catapulted clinical trials to a new level. Indeed some researchers cite the 1940s
through the 1960s as the golden years of clinical research (Swazey & Fox, 2004).
Involvement by the federal government enabled the development of large scale clinical
trials across geographically diverse populations. By 1954, NCI established a full-scale
clinical research program through sponsorship of multicenter clinical trials cooperative
groups, of which the leading academic research centers were members. The following
year, NCI organized the first solid cancer cooperative group, the Easter Cooperative
Oncology Group (ECOG), which became the largest cooperative group consisting of
4000 members. By 1960, most phase II and phase III clinical cancer trials were devised
and administered by the NCI. By 2000, there were more than 10,000 investigators and
3,000 institutions registered with NCI (Keating & Cambrosio, 2002).
The rise of evidenced based medicine (EBM) has elevated the recognition and use
of clinical research to a prominent level in healthcare. Randomized control trials (RCT)
are now considered the gold standard in the hierarchical evaluation of clinical evidence.
Despite the significant federal investment and rapid expansion of clinical
research, throughout the 1980s and 1990s, there was a lack of minority and elderly
participation in cancer clinical trials. In 1993, the NIH, recognizing failures in the
healthcare system to provide access for women and minorities to clinical research,
established the Revitalization Act of 1993. This Act was mandated by Congress in
Section 492B of Public Law 103-43. Congress sought to establish an ethical principal of
45
justice, emphasizing the importance of balancing the burden of research with its benefits
(NIH, 2008). Prior to enactment of the NIH inclusion policy, several incidents of
unethical treatment of patients in clinical research, most notably the Tuskegee syphilis
trials that took place from 1932 until 1972, and the 1977 thalidomide trials in pregnant
women, resulted in researchers becoming overly cautious about recruiting minorities and
women in clinical research (Killien et al., 2000).
Despite the passage of the 1993 Revitalization Act, lack of enrollment of
minorities and elderly persisted. Uncertain coverage by third party payers, including
Medicare, was believed to be the primary reason for lack of participation. To address this
problem, on June 7th
, 2000, President Clinton announced that Medicare would begin to
pay for the routine costs of care for beneficiaries enrolled in federally sponsored clinical
trials (Iltis, 2005). This announcement further expanded the federal government’s
investment in cancer clinical trials. This commitment was reinforced with the Center for
Medicare & Medicaid Service’s (CMS) October 17th
, 2007 announcement that it would
continue coverage of clinical trials. In 2007, cancer represented the largest portion of
NIH’s investment equaling $4.754 billion or 16.6% of the budget (OMB, 2007). While
great strides have been achieved in the enrollment of women and elderly in cancer
clinical research, the lack of enrollment of minorities persists. Some researchers cite the
federal government’s role in the Tuskegee Syphilis experiments as a significant factor
influencing Black patients trust of the medical establishment overall, especially with
participation in clinical research (Shavers, Lynch, & Burmeister, 2002). However, other
46
researchers have demonstrated that racial differences are less significant when access to
treatment is adjusted by socioeconomic factors (Gross et al., 2008).
A paradigm shift in the approach to cancer clinical trial research and drug
development began to take place in the late 1990s with the approval of trastuzumab for
patients with Her2+ breast cancer in 1998. This is generally recognized as the beginning
of the era of personalized medicine in which academic researchers and drug companies
began considering whether subgroups of patients may obtain more benefit from treatment
than others. In 2001, gefitinib, an EGFR TKI, began to show anti tumor activity in
advanced NSCLC. By 2003, gefitinib was approved by the FDA for advanced NSCLC
and there were some indications that response rate varied based on patient ethnicity
(Fukuoka et al., 2003). One of the significant limitations to research that took place from
2001 through about 2008 was that lung tumor tissue analysis was conducted
retrospectively often after patients had already begun participating in the treatment
clinical trial. In many cases, a second research study was conducted subsequent to the
termination of the treatment clinical trial. Nearly all researchers recognized the
limitations to this research approach. There was growing support for biomarker research
to be conducted concurrent with the treatment trial or prospectively in the lab.
The epidemiologic approach of enrolling large cohorts of patients into treatment
clinical trials fails to account for genomic variations in tumor tissue. The hope and
promise of personalized medicine is that patients will be treated based upon the
molecular profile of their specific tumor tissue. However, such an approach increases the
47
burden of accruing the right numbers of patients into the various arms of a clinical trial.
Further, it places increased urgency on the need to recruit a diversity of patients.
Recently, the leaders of NIH and the Food and Drug Administration (FDA)
discussed their vision to makes changes to their regulatory and funding structures to
prioritize a personalized approach to medicine (Hamburg & Collins, 2010). As part of
this approach, the NIH and the FDA will:
1) Invest in advancing translational and regulatory science
2) Define regulatory pathways for coordinated approval of codeveloped
diagnostics and therapeutics
3) Develop risk-based approaches for appropriate review of diagnostics to more
accurately assess their validity and clinical utility, and make information
about tests readily available.
Hamburg and Collins (2010) also emphasized that for personalized medicine to succeed,
it will require the FDA and NIH to expand their efforts to develop tissue banks
containing specimens that will allow for broader assessment of the clinical importance of
genetic variation across a range of conditions along with information linking them to
clinical outcomes. They emphasized that this may require public–private partnerships to
help move candidate compounds into commercial development.
Some researchers have cited the importance of companion diagnostics, which are
packaged diagnostic kits such as the DxS kit described above. Companion diagnostics
require FDA approval, as opposed to diagnostic assays like the one developed at
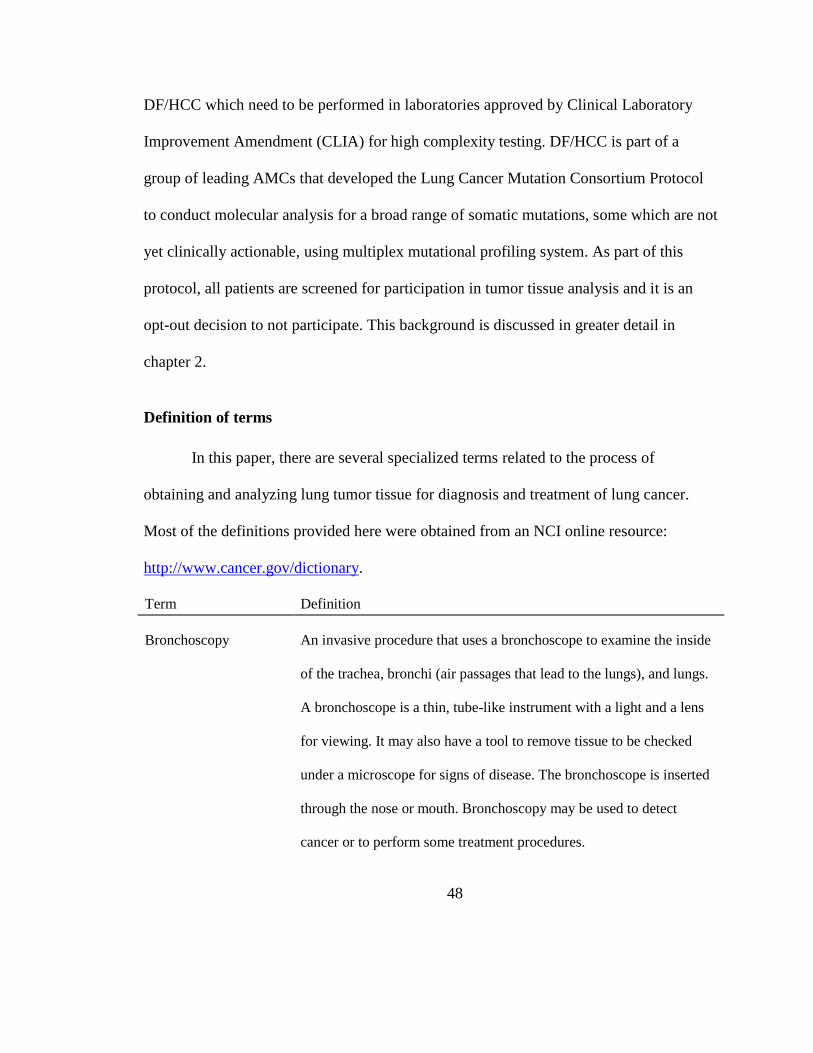
48
DF/HCC which need to be performed in laboratories approved by Clinical Laboratory
Improvement Amendment (CLIA) for high complexity testing. DF/HCC is part of a
group of leading AMCs that developed the Lung Cancer Mutation Consortium Protocol
to conduct molecular analysis for a broad range of somatic mutations, some which are not
yet clinically actionable, using multiplex mutational profiling system. As part of this
protocol, all patients are screened for participation in tumor tissue analysis and it is an
opt-out decision to not participate. This background is discussed in greater detail in
chapter 2.
Definition of terms
In this paper, there are several specialized terms related to the process of
obtaining and analyzing lung tumor tissue for diagnosis and treatment of lung cancer.
Most of the definitions provided here were obtained from an NCI online resource:
http://www.cancer.gov/dictionary.
Term Definition
Bronchoscopy An invasive procedure that uses a bronchoscope to examine the inside
of the trachea, bronchi (air passages that lead to the lungs), and lungs.
A bronchoscope is a thin, tube-like instrument with a light and a lens
for viewing. It may also have a tool to remove tissue to be checked
under a microscope for signs of disease. The bronchoscope is inserted
through the nose or mouth. Bronchoscopy may be used to detect
cancer or to perform some treatment procedures.
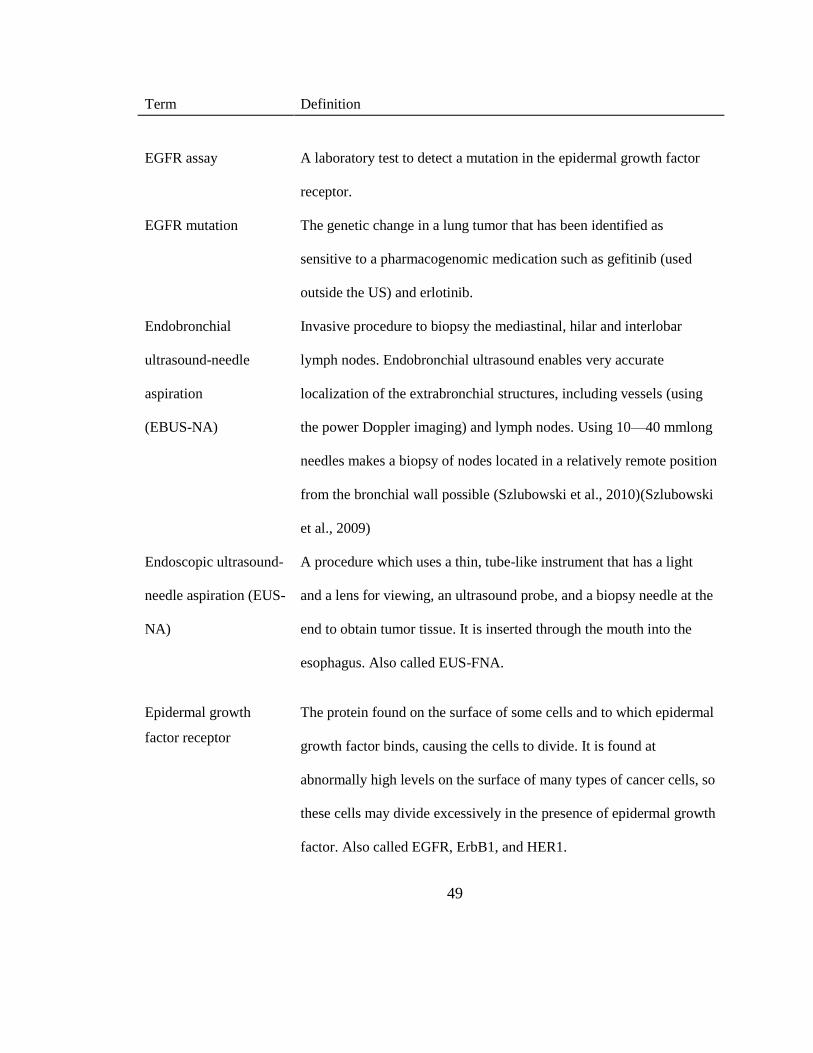
49
Term Definition
EGFR assay
A laboratory test to detect a mutation in the epidermal growth factor
receptor.
EGFR mutation The genetic change in a lung tumor that has been identified as
sensitive to a pharmacogenomic medication such as gefitinib (used
outside the US) and erlotinib.
Endobronchial
ultrasound-needle
aspiration
(EBUS-NA)
Endoscopic ultrasound-
needle aspiration (EUS-
NA)
Invasive procedure to biopsy the mediastinal, hilar and interlobar
lymph nodes. Endobronchial ultrasound enables very accurate
localization of the extrabronchial structures, including vessels (using
the power Doppler imaging) and lymph nodes. Using 10—40 mmlong
needles makes a biopsy of nodes located in a relatively remote position
from the bronchial wall possible (Szlubowski et al., 2010)(Szlubowski
et al., 2009)
A procedure which uses a thin, tube-like instrument that has a light
and a lens for viewing, an ultrasound probe, and a biopsy needle at the
end to obtain tumor tissue. It is inserted through the mouth into the
esophagus. Also called EUS-FNA.
Epidermal growth
factor receptor
The protein found on the surface of some cells and to which epidermal
growth factor binds, causing the cells to divide. It is found at
abnormally high levels on the surface of many types of cancer cells, so
these cells may divide excessively in the presence of epidermal growth
factor. Also called EGFR, ErbB1, and HER1.
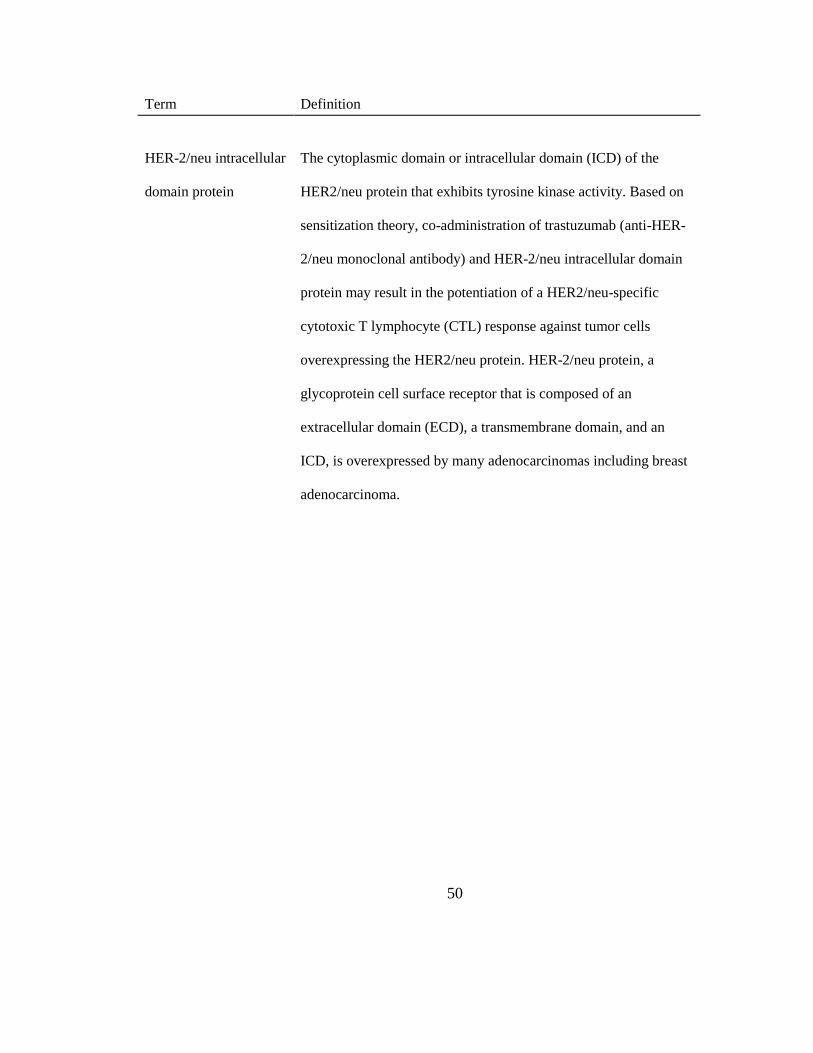
50
Term Definition
HER-2/neu intracellular
domain protein
The cytoplasmic domain or intracellular domain (ICD) of the
HER2/neu protein that exhibits tyrosine kinase activity. Based on
sensitization theory, co-administration of trastuzumab (anti-HER-
2/neu monoclonal antibody) and HER-2/neu intracellular domain
protein may result in the potentiation of a HER2/neu-specific
cytotoxic T lymphocyte (CTL) response against tumor cells
overexpressing the HER2/neu protein. HER-2/neu protein, a
glycoprotein cell surface receptor that is composed of an
extracellular domain (ECD), a transmembrane domain, and an
ICD, is overexpressed by many adenocarcinomas including breast
adenocarcinoma.
51
Molecular diagnosis
Mediastinoscopy
Molecular marker
The process of identifying a disease by studying molecules, such
as proteins, DNA, and RNA, in a tissue or fluid.
A procedure in which a thin, tube-like instrument with a light, lens
for viewing, and tool for removing tissues is inserted into the chest
through an incision above the breastbone. It is used to examine the
organs in the area between the lungs and nearby lymph nodes and
to get tissue sample from the lymph nodes on the right side of the
chest. It is considered the gold standard for staging the
mediastinum.
A biological molecule found in blood, other body fluids, or tissues
that is a sign of a normal or abnormal process. A molecular marker
or biomarker may be used to evaluate body’s response to a
disease.
Personalized medicine A form of medicine that uses information about a person’s
genes, proteins, and environment to prevent, diagnose, and
treat disease
Pharmacogenomics The process by which drug companies develop medications
that target specific genetic changes in the tumor. In
pharmacogenomic drug development, clinical trials often
require the medical institution to analyze tumor tissue.
52
Somatic mutation An alteration in DNA that occurs after conception. Somatic
mutations can occur in any of the cells of the body except
the germ cells (sperm and egg) and therefore are not passed
on to children. These alterations can (but do not always)
cause cancer or other diseases.
Translational research A term used to describe the process by which the results of
research done in the laboratory are used to develop new
ways to diagnose and treat disease.
Transbronchial needle
aspiration (TBNA)
A minimally invasive bronchoscopic technique that
provides a nonsurgical means to diagnose and stage lung
cancer by sampling the mediastinal and hilar lymph nodes
through insertions of needle during a bronchoscopy.
Transthoracic needle
aspiration (TTNA)
An invasive procedure in which a needle is inserted under the guide
of a CT scan through the skin into a lung lesion to diagnose and
stage lung cancer.
Tyrosine kinase
inhibitor
A substance being studied in the treatment of some types of cancer.
Tyrosine kinase inhibitor BIBF 1120 blocks enzymes needed for
cells to grow, and may prevent the growth of new blood vessels that
tumors need to grow. It is a type of tyrosine kinase inhibitor and a
type of antiangiogenesis agent. Also called BIBF 1120.
53
CHAPTER 2
As discussed in Chapter 1, four distinct bodies of literature informed the conceptual
model that guided this research and hypotheses tested. This chapter provides a critical
review of each of these bodies of literature.
Diffusion of innovation of healthcare services and technologies research
Diffusion of innovation is the process by which a new idea, knowledge, or
technology is adopted, communicated through the social network, and either
implemented broadly to the point of market saturation, or until diffusion fails and the
innovation is shelved or taken off the market. Although one of the earliest studies of
diffusion was conducted in the 1950s and analyzed prescriptions of tetracycline by
physicians (Coleman, JS. Katz, E. Menzel, H., 1966), most of the subsequent research
involves applications to business or consumer technology markets rather than healthcare
services (Soleimani & Zenios, 2011). Over the past decade, there has been increased
attention to the relationship between diffusion of innovation in healthcare and differences
in access and outcomes of healthcare services. This attention was generated by the 2001
IOM publication, Crossing the Quality Chasm: A New Health System for the 21st
Century, a title that is adapted from Geoffrey Moore’s analysis of Roger’s diffusion
theory in the sentinel book Crossing the Chasm (Moore, 1991). Since its publication, this
book has been considered required reading for business school students, particularly
those who focus on entrepreneurship or marketing of products in the information
54
technology products. Like Roger’s theory, it is a useful framework to consider.
However, it lacks the complexities encountered when analyzing diffusion of healthcare
services. The complexities of diffusion of innovation in healthcare services are discussed
in a comprehensive review, commissioned by the National Health System in the United
Kingdom (Greenhalgh, Robert, & Bate, 2008). One chapter in this publication discusses
the fact that healthcare services are deeply rooted in an epidemiologic model of research
and innovation. Such an approach relies heavily on rationalist and experimental
approaches to evaluation of innovation with randomized clinical trials considered the
gold standard (Greenhalgh et al., 2008). The epidemiologic approach takes a linear
approach to the adoption of innovation. It presumes that once the evidence is established
through RCTs, new scientific knowledge, which could include a change in clinical
practice, new drug or device, among other innovations, would be implemented into
practice (Greenhalgh et al., 2008). The limitation of an epidemiologic mindset to
diffusion is discussed by researchers who have evaluated the delays, and in some cases
complete failures, of translational research to be incorporated into patient care.
The term translational research has historically been used to describe the transfer
of knowledge from basic sciences (bench) to produce new drugs, devices, and treatment
options to improve patient care (bedside). It refers to the development and testing of new
compounds, devices, treatment algorithms to establish an evidence base for regulatory
approval, commercialization, and justification for reimbursement. Recognizing that
historically many advances in basic sciences have been slow to become integrated into
55
improved clinical care, Dr. Zerhouni, the former Director of NIH, undertook an effort to
reduce the silos that exist in academic medicine between laboratory and clinical
scientists. In the seminal 2005 interview, Dr. Zerhouni described the funding of a new
program entitled the Clinical and Translational Science Awards (CTSAs), a grant
program to encourage academic medical institutions to improve collaboration between
the lab and clinical research personnel (Zerhouni, 2005). Initially, academic clinical
scientists were very excited about this initiative, hopeful that it would result in more rapid
utilization of improvements in patient care. Just a few years later, in 2008, a commentary
entitled, ―The Meaning of Translational Research and Why It Matters,‖ by Dr. Steven
Woolf described the failures of a product driven approach of bench to bedside
translational research, stating that the historical definitions of translational research are
incomplete and a premature endpoint in the bench to bedside paradigm shift. Only half
the patients in the US benefit from translational advances (McGlynn et al., 2003).
Practice-oriented translational research, which is now being called T2 or TRIP
(Translating Research to Practice), focuses on analyzing and overcoming barriers to the
diffusion, dissemination, and adoption of clinical practice guidelines that incorporate T1
advances to the community.
In the case of the EGFR assay, T1 represents the period between 2004, linking the
EGFR mutation to clinical responsiveness of the EGFR TKI, and the commercialization
of the EGFR assay by Genzyme Genetics. T2 is the establishment of evidence based
guidelines linking technological advances to improvements in patient care with
56
regulatory and reimbursement approvals. T3 is implementation of those guidelines and
knowledge for reimbursement by the clinicians at the bedside and by the administrative
and coding staff at the hospitals. T4 would be communicating information from
successful diffusion back to researchers and those who conduct research that becomes the
basis of clinical practice guidelines to inform prevention.
As has already been discussed in the review of the conceptual model, there are
multiple levels of barriers to diffusion of innovation in healthcare services, including, but
not limited to: 1) Complex and uncertain regulatory and reimbursement structure. 2) Role
of principal/agent relationship in the physician referral to the innovation. 3) Delays in
evidence being incorporated in clinical practice guidelines and lack of implementation of
those guidelines at both an institutional and physician level.
The IOM recognized that some of these barriers were interfering with
applications, developed as a result of sequencing the human genome, being incorporated
into improvements in medical care, community and public health prevention, and
treatment (Hernandez, Rapporteur, 2008). The IOM convened a workshop to discuss the
issue and published a report of its findings. This report cited the work by Burke and
colleagues (2006) who found that few promising genomic discoveries had resulted in
actual applications in medicine. This report also included comments from Dr. Annetine
Gelijns, who emphasized that the diffusion of genomic interventions is likely to be
powerfully shaped by sociocultural factors, whereby even if genomic interventions are
covered by insurers, patients may decide to pay out of pocket because of concerns about
57
confidentiality and the potential for discrimination by employers and insurance
companies. This, in turn, raises concerns about equity—for example, about lack of
access to these technologies for those who do not have the means to pay (Hernandez et
al., 2008).
Also presenting at this workshop was Brad Gray, who was then vice president of
product and business development at Genzyme Genetics. He described the specific
problems that Genzyme Genetics had with diffusion of the EGFR assay.
―There is a new paradigm for personalized medicine, however, one in which
complex testing (some of which is genomic, some of which is proteomic, and
some of which is other technologies) plays a central role in linking observation to
tests and therapy. In such a paradigm, observation s followed by a test that
provides specific information for better decision making. This, in turn, is followed
by the action, which would be the therapeutic choice or regimen that leads to a
predictable response, thereby breaking the cycle of trial and error‖
Referring directly to the experience Genzyme Genetics had with the EGFR assay,
he wrote,
―The company paid more than it had ever paid for an intellectual-property license
and quickly drove a test to market. Soon afterward publications emerged that
seemed to question the utility of EGFR mutation testing for driving dosing. Since
that time there has been disagreement about which is the correct biomarker to
predict response to this class of drugs. In July 2006 the C-Path Institute
announced an effort to try to resolve the question of biomarkers in NSCLC
cancer, but results are not yet available. When this product was taken to market,
only a small minority of NSCLC patients who received TKIs—probably less than
5 percent—actually received the test, Gray said. The penetration is highest in the
leading academic centers, where there is willingness and an ability to navigate the
nuances of the emerging evidence. Community physicians, on the other hand,
have generally been reluctant to adopt this approach. They are confused about the
multiple-testing options, and they use what they consider clinical information
(e.g., patient’s race, smoking habits) as a proxy for the mutation status.
Furthermore, because TKIs are most often used as the last line of treatment in
these patients, there is a reluctance to do a test that would suggest that certain
patients will not respond. The company learned several things from this
58
experience. First, the connection between genetics and treatment is not always
clear. Community physicians need education and assistance in understanding
conflicting evidence. Robust clinical-utility data will be required to drive adoption
by community physicians, who will continue to substitute work-around solutions
when they are modestly effective. Furthermore, community physicians are not
inclined, in general, to deselect patients from treatment. A test that selects patients
in is much easier to sell than one that selects out, especially when there are few
alternatives for those patients, Gray said. The adoption curve for EGFR testing is
still heading upward. While the EGFR mutation test has not been adopted as
rapidly as a new drug therapy typically would be, the indicators are moving in the
right direction. The National Comprehensive Cancer Network (NCCN) guidelines
for non-small-cell lung cancer include the test, a point which Genzyme Genetics
believes will help community physicians gain comfort with the utility of the test.
Based on past experience, then, Genzyme Genetics has revised its criteria for
bringing new personalized medicine tests to market. First, for the company to
invest in a test, the test needs to represent the only reliable way. Third, because
reimbursement in the testing sector of the health care system has traditionally not
been based on value but on activity-based costing, the economics must support
investment in clinical and market development. The reimbursement path must be
attractive, either by virtue of its intrinsic coding or because there is the possibility
of making a compelling case to be reimbursed on a different basis than activity-
based costs. Furthermore, the company will look for places to invest where
intellectual property and know-how is available on an exclusive basis. In
situations where only a non-exclusive product is offered, the company will not be
able to justify the investment required to perform clinical research or to navigate
the regulatory system. (Hernandez et al., 2008).
While Gray acknowledged the problem conflicting evidence poses for physicians when
considering the adoption of new technologies, his analysis neglected to consider the role
patients play in pulling an innovation through the market – even when there is conflicting
evidence. It appears that Genzyme Genetics relied on a strategy of pushing the
innovation through the market, viewing oncologists as their customers.
Although this is beyond the scope of this paper, an analysis of the breast cancer
molecular diagnostic tests may illustrate an effort by the companies to market directly to
breast cancer patients and survivors. Cancer patients, survivors, and caregivers can play a
59
powerful role in pulling innovations through the complex hurdles of regulatory and
reimbursement barriers, getting physicians, who are slow to adapt to change, to adopt a
new technologies.
When a diagnostic test is covered by Medicare and there are clinical practice
guidelines that recommend its use, if a patient asks their oncologist or surgeon to order a
test, it becomes much more difficult for that provider to decline the request. Gray’s view
of the problem will be discussed in much greater detail in Chapter 4.
Lung cancer clinical outcomes research
Lung cancer is the leading cause of cancer-related mortality for both women and
men in the U.S. and worldwide. There are 1.35 million new cases and 1.2 million deaths
yearly worldwide due to lung cancer (Parkin, Bray, Ferlay, & Pisani, 2005). In the US in
2010, there were 222,520 new cases of lung cancer and 157,300 people died as a result of
lung cancer (Jemal, Siegel, Xu, & Ward, 2010). Lung cancer represents 14.5% of cancer
incidence and 29% of cancer deaths in the US.
Platinum-based chemotherapy doublet is the standard care for most patients who
present with late stage disease. This treatment offers patients modest improvements in
survival (Schiller et al., 2002). However, in the past two decades, there have been
significant advances in the understanding of lung tumor biology and molecular changes at
the genetic level that contribute to oncogenesis. Although this understanding has not yet
lead to significant increases in overall survival, for patients with specific genetic
mutations or translocations, it has increased progression free survival. Continued
60
advances in the understanding of lung tumor oncogenesis will increase personalization
and treatment of lung cancer with targeted drugs based on specific genetic abnormalities.
In 1981, it was discovered that the EGFR receptor was overexpressed in several
cancers, including lung cancer (Kawamoto et al., 1983). By 1990, the class of drugs
known as EGFR TKIs was discovered. In 2002, oncologists and researchers began
publishing information about their growing knowledge of the molecular biology of lung
tumors and the significant role of EGFR mutations in the development and progression of
NSCLC. This same year, the first EGFR TKI, gefitinib, was approved in Japan. By 2004,
international clinical trials of EGFR TKIs established a link between improvements in
progression free survival and presence of an EGFR mutation in patients’ lung tumors.
Retrospective molecular tissue analysis of these clinical trials contributed to the
development of the EGFR assay. Patients who had EGFR mutations had a higher
response rate and longer progression-free survival when their treatment paradigm
included erlotinib or gefitinib (Lynch et al., 2004; Paez et al., 2004; Shepherd et al.,
2005). However, patients without EGFR mutations responded poorly to erlotinib and
gefitinib (Mok et al., 2009). Mutations in the tumor suppressor gene (p53) and activation
of the Kirsten-Rous sarcoma virus (K-ras) oncogene were associated with poorer
prognosis (Eberhard et al., 2005; W. Pao & Miller, 2005; Tol et al., 2009). KRAS
incidence rate is thought to be between 20-30% in NSCLC patients and there are
currently no targeted treatment options for KRAS mutations.
61
Although previous studies provided evidence that incidence of EGFR mutations
varies with patient ethnicity, gender, and smoking status (Fukuoka et al., 2003; Jackman
et al., 2007; W. Pao & Miller, 2005), more recent studies indicate that clinical
characteristics are limited predictors of mutational status. If only women who were never
smokers were tested for EGFR mutations, 57% of all EGFR mutations would be missed
(D'Angelo et al., 2011). EGFR mutations have often been reported to be approximately
15% in Whites, 2-3% in Blacks, and 20-30% in Asians living in the US (Calvo &
Baselga, 2006; Leidner et al., 2009; Mok et al., 2009; Yang et al., 2005). However, the
recent evidence weakening the relationship between smoking status and incidence of
mutation, underscores the importance of including a large and diverse patient population
in biomarker clinical trials. Clinical practice should not be based on incomplete or
inaccurate anecdotal assumptions developed by a limited patient population enrolled in
clinical trials. It also emphasizes the importance of providing access to lung tumor
genotyping for all patients with adenocarcinoma of the lung.
More recently, there was a discovery that patients with a translocation in the
echinoderm microtubule-associated protein-like 4 and anaplastic lymphoma kinase
(EML4-ALK) have a 52% response rate to an ALK inhibitor crizotinib (Kwak et al.,
2010). According to Ding et al. (2008) and Pao & Girard (2011), as of January 2010, the
following mutations were known in NSCLC: HER2, PIK3CA, MET, BRAF, MAP2KI,
and AKT1, which are thought to have a less than 5% incidence rate each, ALK and
62
EGFR which are thought to have between 5-15% incidence rate each, KRAS and yet to
be discovered mutations have a 30% rate each.
Even with these promising advances, the prognosis for patients with lung cancer
is dismal, complicated by the fact that the disease is most often diagnosed in late stages
when the cancer has spread beyond the lungs. This is illustrated by the fact that over
60% of lung cancer patients are diagnosed with advanced disease at stage III or stage IV
(Ries et al, 2008).
While there have been improvements in the rate of short-term survival, according
to the NCI Surveillance, Epidemiology, and End Results (SEER) Program (2008), these
have not been translated into significant improvements in long-term survival. In 1975,
36.7% of patients survived 1 year. By 2004, this rate improved to 43.3%. The five and
ten year survival rates have not seen significant improvements. In 1975, 13% of patient
survived 5 years. By 2004, this rate only improved by 3.2% to 16.2% of lung cancer
patients living to 5 years. When this analysis is extended to 10 year survival, there has
only been a .8% improvement with 9.2% of patients in 1975 surviving 10 years and 10%
of patients in 2004 surviving ten years.
The five-year survival rate for patients diagnosed with lung cancer is even worse
worldwide. It is 15% for those living in the US, 10% in Europe and 8% in the developing
world (Parkin et al., 2005). Beyond differences in outcomes worldwide, several studies
have documented differences in incidences rates, treatment, and outcomes in the US
between minorities and Whites.
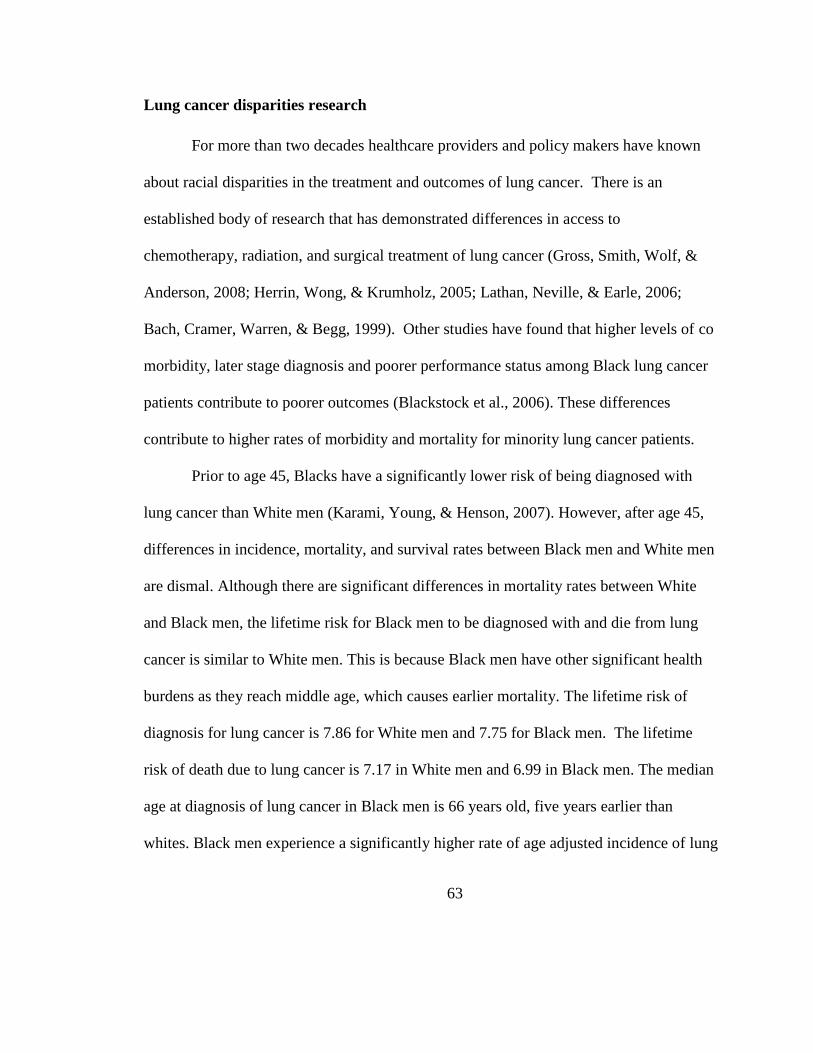
63
Lung cancer disparities research
For more than two decades healthcare providers and policy makers have known
about racial disparities in the treatment and outcomes of lung cancer. There is an
established body of research that has demonstrated differences in access to
chemotherapy, radiation, and surgical treatment of lung cancer (Gross, Smith, Wolf, &
Anderson, 2008; Herrin, Wong, & Krumholz, 2005; Lathan, Neville, & Earle, 2006;
Bach, Cramer, Warren, & Begg, 1999). Other studies have found that higher levels of co
morbidity, later stage diagnosis and poorer performance status among Black lung cancer
patients contribute to poorer outcomes (Blackstock et al., 2006). These differences
contribute to higher rates of morbidity and mortality for minority lung cancer patients.
Prior to age 45, Blacks have a significantly lower risk of being diagnosed with
lung cancer than White men (Karami, Young, & Henson, 2007). However, after age 45,
differences in incidence, mortality, and survival rates between Black men and White men
are dismal. Although there are significant differences in mortality rates between White
and Black men, the lifetime risk for Black men to be diagnosed with and die from lung
cancer is similar to White men. This is because Black men have other significant health
burdens as they reach middle age, which causes earlier mortality. The lifetime risk of
diagnosis for lung cancer is 7.86 for White men and 7.75 for Black men. The lifetime
risk of death due to lung cancer is 7.17 in White men and 6.99 in Black men. The median
age at diagnosis of lung cancer in Black men is 66 years old, five years earlier than
whites. Black men experience a significantly higher rate of age adjusted incidence of lung
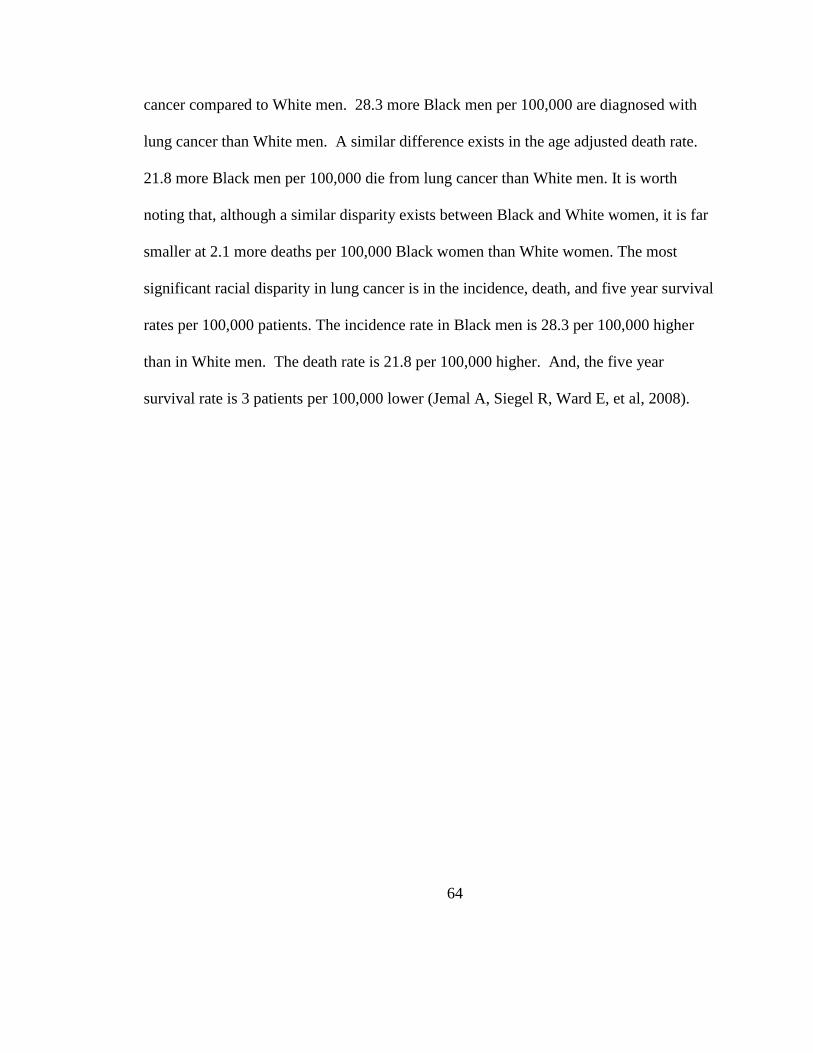
64
cancer compared to White men. 28.3 more Black men per 100,000 are diagnosed with
lung cancer than White men. A similar difference exists in the age adjusted death rate.
21.8 more Black men per 100,000 die from lung cancer than White men. It is worth
noting that, although a similar disparity exists between Black and White women, it is far
smaller at 2.1 more deaths per 100,000 Black women than White women. The most
significant racial disparity in lung cancer is in the incidence, death, and five year survival
rates per 100,000 patients. The incidence rate in Black men is 28.3 per 100,000 higher
than in White men. The death rate is 21.8 per 100,000 higher. And, the five year
survival rate is 3 patients per 100,000 lower (Jemal A, Siegel R, Ward E, et al, 2008).

65
Table 5 summarizes the racial disparities in outcomes for lung cancer patients. These
statistics clearly illustrate that Blacks, men in particular, bear a disproportionate share of
the lung cancer burden.
66
Table 5
Racial Differences by Gender on Measures of Lung Cancer Morbidity and Mortality
Table 6
White/Black difference in each measure
The lack of minority enrollment in lung cancer clinical trials and under representation of
minorities at NCI cancer centers may contribute to some of the existing disparities in lung
cancer outcomes. Lack of representation in lung cancer clinical trials may also be
67
contributing to limited information about the actual incidence and significance of racial
differences in lung tumor molecular biology. Given the growing approach to personalized
cancer care, in which the knowledge of tumor biology informs drug development
research, under representation of patients from specific ethnicities or race in biomarker
clinical trials research may be widening the gap in cancer outcomes.
The reasons for differences in enrollment of ethnic and racial minorities are
mutlifactorial. Several studies illustrate the relationship between likelihood to enroll in
clinical research and age, race, socioeconomic status, rural/suburban residence, proximity
to comprehensive cancer centers, availability of transportation, comorbid conditions, type
of cancer diagnosis, and religious/spiritual beliefs (Adams-Campbell et al., 2004, Advani,
Goldstein, & Musen, 2002, Murthy, Krumholz, & Gross, 2004).
More recent medical research illustrates that healthcare provider and market
factors also influence enrollment in clinical research (Gross & Krumholz, 2005).
Implications for lower minority enrollment in lung cancer clinical trials are best
illustrated by an analysis of the knowledge about incidence of EGFR mutations in blacks.
Clinical trials of EGFR mutations and EGFR TKIs
The incidence rate of EGFR mutations in Blacks is derived from two studies
(Leidner et al., 2009; Yang et al., 2005). These studies analyzed a total of 94 patients who
self identified as Black. Both studies sought to confirm information that has generally
become believed by thoracic oncologists, despite limited published evidence with small
sample sizes, that EGFR mutation in Blacks is rare. Most Black patients that participated
68
in Yang’s study were from the University of Maryland Medical Center. One Black
patient was from Mayo Clinic in Minnesota. All patients that participated in the trial by
Leidner et al. (2009) were from University Hospitals Case Medical Center in Cleveland,
Ohio. The incidence rate of EGFR mutations in the Yang study was 2.4% or 1 patient.
Similarly, Leidner and colleagues reported 1 patient (2%) among their 53 Black patients
tested positive for EGFR mutations.
The limited published evidence about the incidence of EGFR mutations in Blacks
prompted the author to conduct a systematic review to determine whether sufficient
numbers of Black patients were included in these studies to establish evidence on
incidence rate of EGFR mutations in Blacks. This review analyzed thirty six multi
institutional domestic and international EGFR TKI clinical trials and retrospective
molecular tissue studies which took place between 2001and 2010.

69
Table 7 lists the studies analyzed
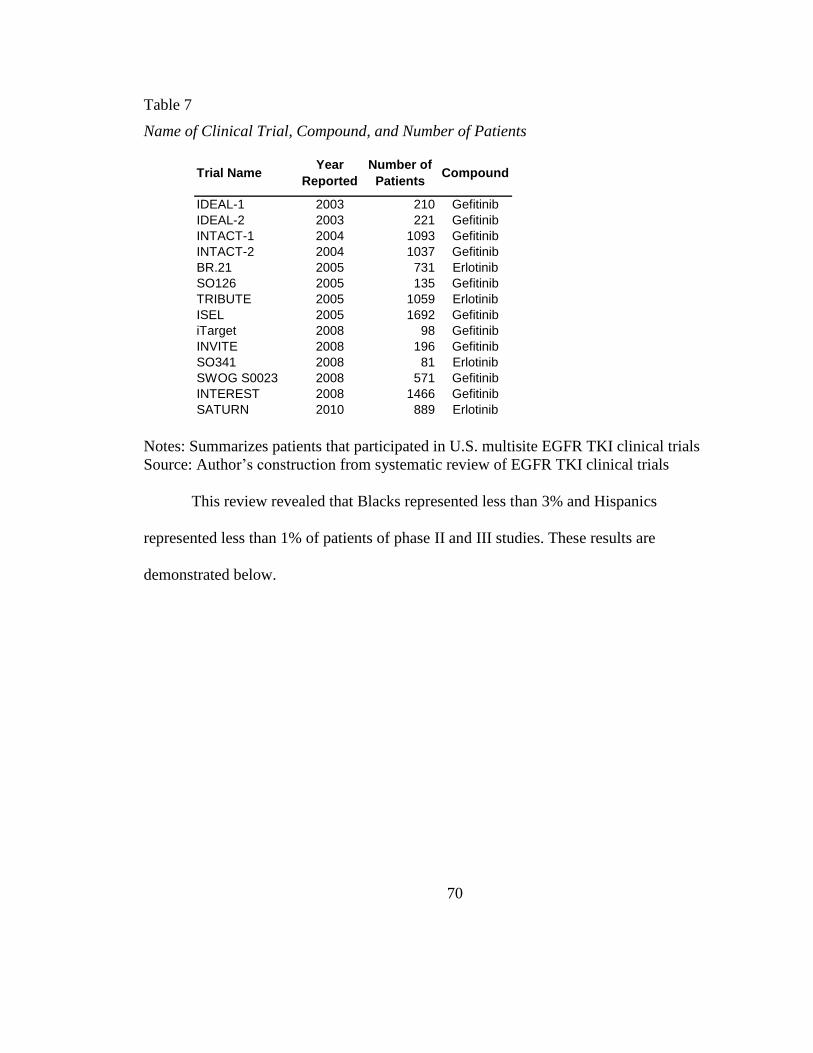
70
Table 7
Name of Clinical Trial, Compound, and Number of Patients
Notes: Summarizes patients that participated in U.S. multisite EGFR TKI clinical trials
Source: Author’s construction from systematic review of EGFR TKI clinical trials
This review revealed that Blacks represented less than 3% and Hispanics
represented less than 1% of patients of phase II and III studies. These results are
demonstrated below.
Trial NameYear
Reported
Number of
PatientsCompound
IDEAL-1 2003 210 Gefitinib
IDEAL-2 2003 221 Gefitinib
INTACT-1 2004 1093 Gefitinib
INTACT-2 2004 1037 Gefitinib
BR.21 2005 731 Erlotinib
SO126 2005 135 Gefitinib
TRIBUTE 2005 1059 Erlotinib
ISEL 2005 1692 Gefitinib
iTarget 2008 98 Gefitinib
INVITE 2008 196 Gefitinib
SO341 2008 81 Erlotinib
SWOG S0023 2008 571 Gefitinib
INTEREST 2008 1466 Gefitinib
SATURN 2010 889 Erlotinib
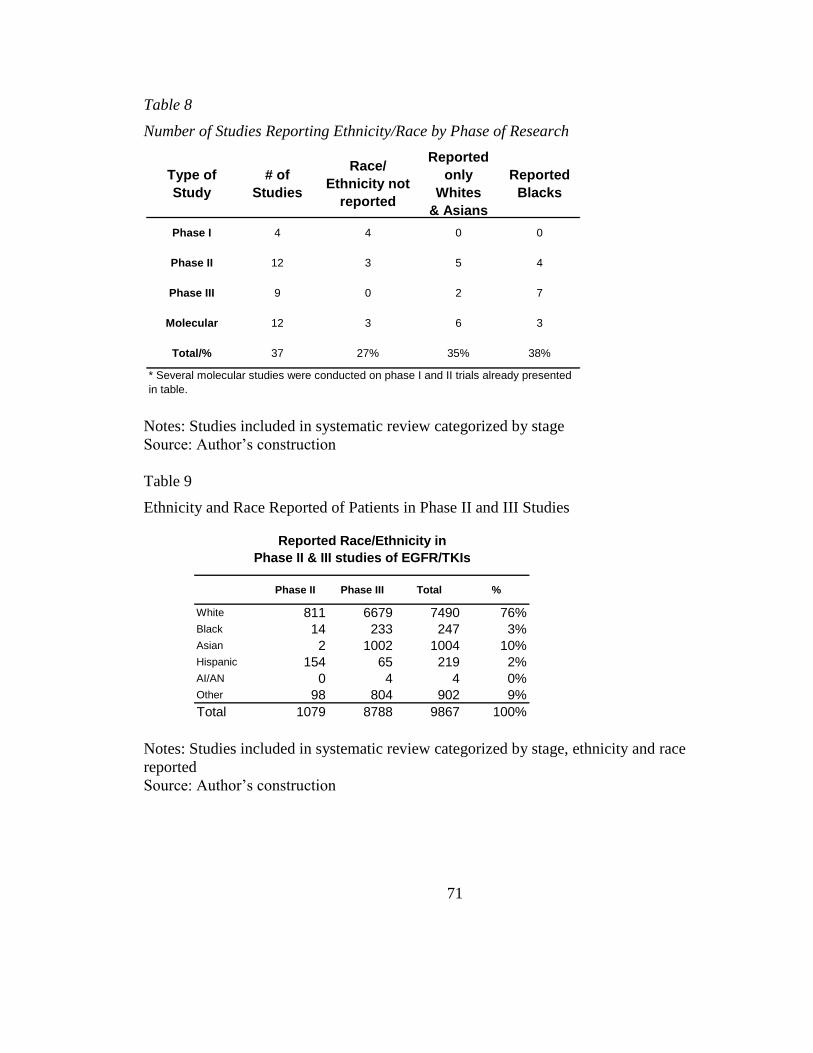
71
Table 8
Number of Studies Reporting Ethnicity/Race by Phase of Research
Notes: Studies included in systematic review categorized by stage
Source: Author’s construction
Table 9
Ethnicity and Race Reported of Patients in Phase II and III Studies
Notes: Studies included in systematic review categorized by stage, ethnicity and race
reported
Source: Author’s construction
Type of
Study
# of
Studies
Race/
Ethnicity not
reported
Reported
only
Whites
& Asians
Reported
Blacks
Phase I 4 4 0 0
Phase II 12 3 5 4
Phase III 9 0 2 7
Molecular 12 3 6 3
Total/% 37 27% 35% 38%
* Several molecular studies were conducted on phase I and II trials already presented
in table.
Phase II Phase III Total %
White 811 6679 7490 76%Black 14 233 247 3%Asian 2 1002 1004 10%Hispanic 154 65 219 2%AI/AN 0 4 4 0%Other 98 804 902 9%
Total 1079 8788 9867 100%
Reported Race/Ethnicity in
Phase II & III studies of EGFR/TKIs
72
Many studies analyzed were conducted after the 2003, 2004, and 2005 regulatory
approval and commercialization of EGFR TKIs and the EGFR assay. Yet, this systematic
review of EGFR TKI studies clearly indicated barriers exist in access to these important
advances in diagnosis and treatment among minority populations. No studies to date
have analyzed whether institutional and regional differences in the diffusion of lung
tumor genotyping technologies contributes to a lack of access and hence a lack of
understanding about lung tumor biology in minority populations. This background and
summary clearly demonstrate the urgency of understanding barriers to the diffusion and
utilization of molecular diagnostic technologies for minority populations. These
technologies have become an important tool in the discovery of genetic alterations that
lead to carcinogenic pathways in lung cancer. These studies are also a tool in the
development of new treatments.
73
CHAPTER 3
Methods
This is a cross sectional, retrospective, observational study, which uses secondary
data analysis research methods to analyze seven datasets which were merged into two
separate analytic files. One analytic file has institutions as the unit of analysis. The other
analytic file has county as the unit of analysis. Of the datasets merged, one was
proprietary. It contained the key dependent variable, number of orders placed for the
EGFR assay from Genzyme Genetics for the calendar year 2010. The independent
variables analyzed were obtained from seven publically available datasets which were
merged with the EGFR data warehouse to create two analytic files. The unit of
observation in the principal analytic file was acute care hospitals and institutions in the
US that ordered the EGFR assay. The unit of observation in the second analytic file, a
contracted version of the first, was counties in the US in which acute care hospitals are
located. The study involved less than minimal risk to human subjects because it used
existing administrative billing data that was de-identified. A description and source for
the public datasets is listed in Table 11. A flowchart illustrating the process for joining
these datasets is provided below.
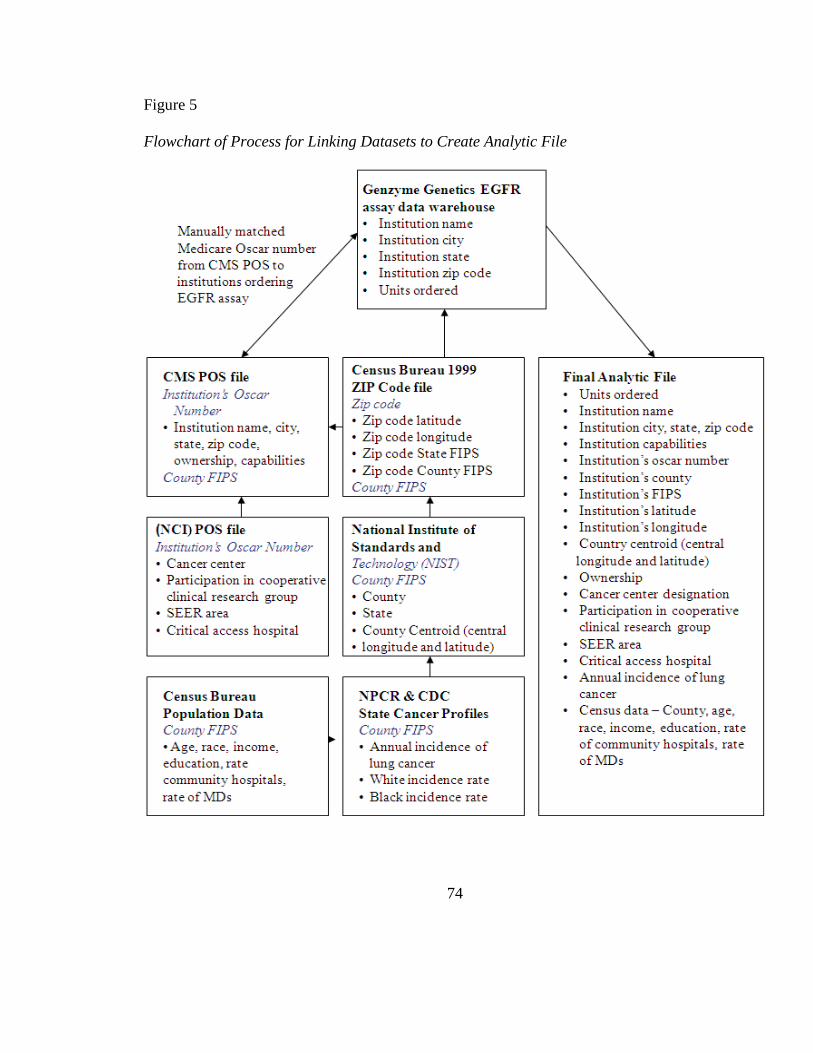
74
Figure 5
Flowchart of Process for Linking Datasets to Create Analytic File
75
Description of proprietary dataset
On April 15, 2011, Genzyme Genetics, the company which owned the rights to
distribute the EGFR assay, extracted all the orders for the EGFR assay in US territories
for the calendar year 2010 from their data warehouse. This dataset was emailed to the
researcher on April 22, 2011. It included variables about the name, city, state, zip code,
and number of units sold to each hospital or lab requesting EGFR analysis. It also
included the gender and payer of the patient. According to Genzyme Genetics, this data
set represents approximately 98% of the EGFR assays conducted on behalf of community
hospitals within the United States. However, this dataset is not a comprehensive
representation of EGFR assays conducted at NCI CCs.
NCI CCs, particularly those that are characterized as comprehensive centers, often
have their own CLIA certified labs and the capability to conduct EGFR assay alone or as
part of a multiplex of mutations sequenced independent of Genzyme Genetics. The
researcher contacted a few NCI CCs to corroborate this information. Although the EGFR
assay warehouse does not represent a comprehensive picture of NCI CC utilization, there
is some information about the NCI CCs. For example, Moffit Cancer Center in Tampa,
Florida and Mayo Cancer Center in Rochester, Minnesota have contracts with Genzyme
Genetics to conduct EGFR analysis at a special contracted rate. Therefore, information
about these two centers is likely complete. Additionally, there were a large number of
tests ordered from Johns Hopkins and Duke University, which suggest that these
institutions are also sending all their requests for an EGFR assay to Genzyme Genetics,
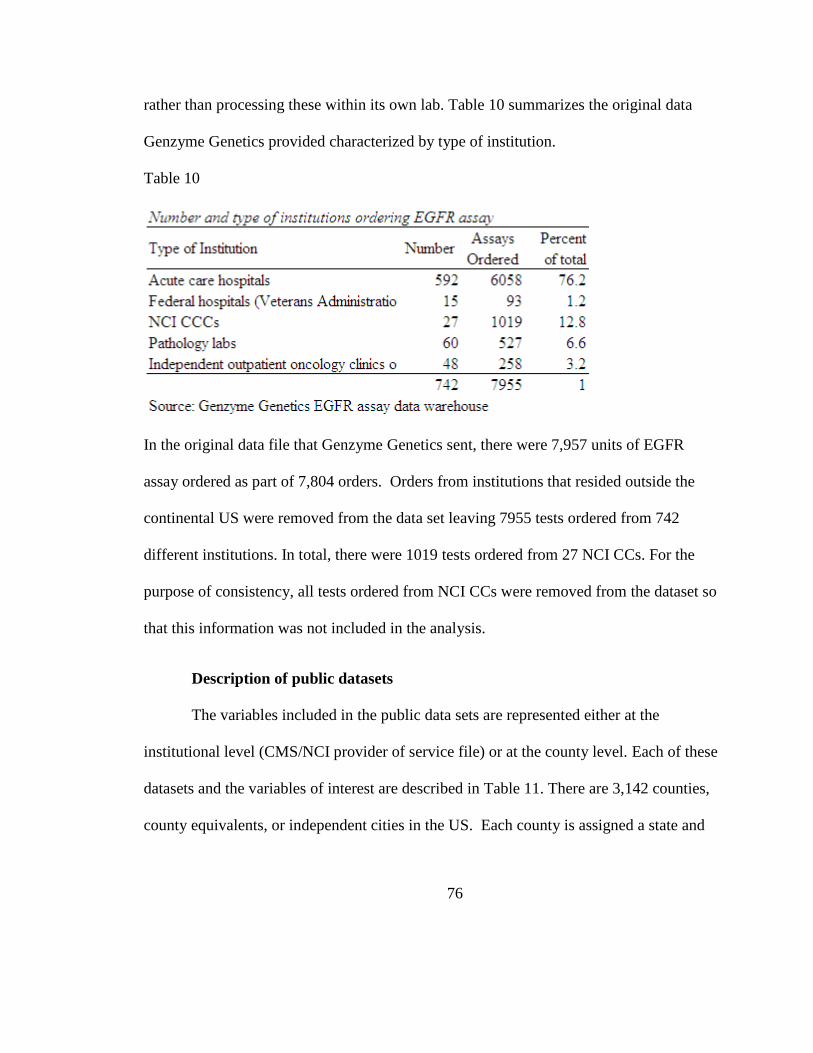
76
rather than processing these within its own lab. Table 10 summarizes the original data
Genzyme Genetics provided characterized by type of institution.
Table 10
In the original data file that Genzyme Genetics sent, there were 7,957 units of EGFR
assay ordered as part of 7,804 orders. Orders from institutions that resided outside the
continental US were removed from the data set leaving 7955 tests ordered from 742
different institutions. In total, there were 1019 tests ordered from 27 NCI CCs. For the
purpose of consistency, all tests ordered from NCI CCs were removed from the dataset so
that this information was not included in the analysis.
Description of public datasets
The variables included in the public data sets are represented either at the
institutional level (CMS/NCI provider of service file) or at the county level. Each of these
datasets and the variables of interest are described in Table 11. There are 3,142 counties,
county equivalents, or independent cities in the US. Each county is assigned a state and
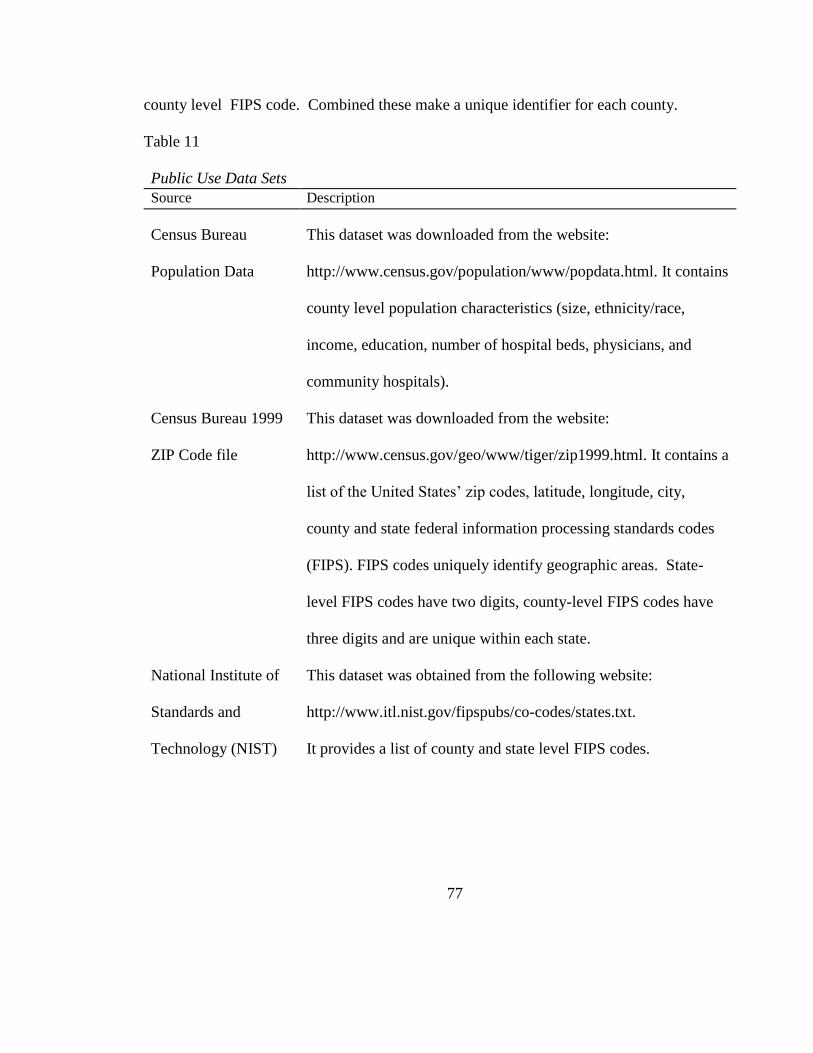
77
county level FIPS code. Combined these make a unique identifier for each county.
Table 11
Public Use Data Sets
Source Description
Census Bureau
Population Data
This dataset was downloaded from the website:
http://www.census.gov/population/www/popdata.html. It contains
county level population characteristics (size, ethnicity/race,
income, education, number of hospital beds, physicians, and
community hospitals).
Census Bureau 1999
ZIP Code file
This dataset was downloaded from the website:
http://www.census.gov/geo/www/tiger/zip1999.html. It contains a
list of the United States’ zip codes, latitude, longitude, city,
county and state federal information processing standards codes
(FIPS). FIPS codes uniquely identify geographic areas. State-
level FIPS codes have two digits, county-level FIPS codes have
three digits and are unique within each state.
National Institute of
Standards and
Technology (NIST)
This dataset was obtained from the following website:
http://www.itl.nist.gov/fipspubs/co-codes/states.txt.
It provides a list of county and state level FIPS codes.
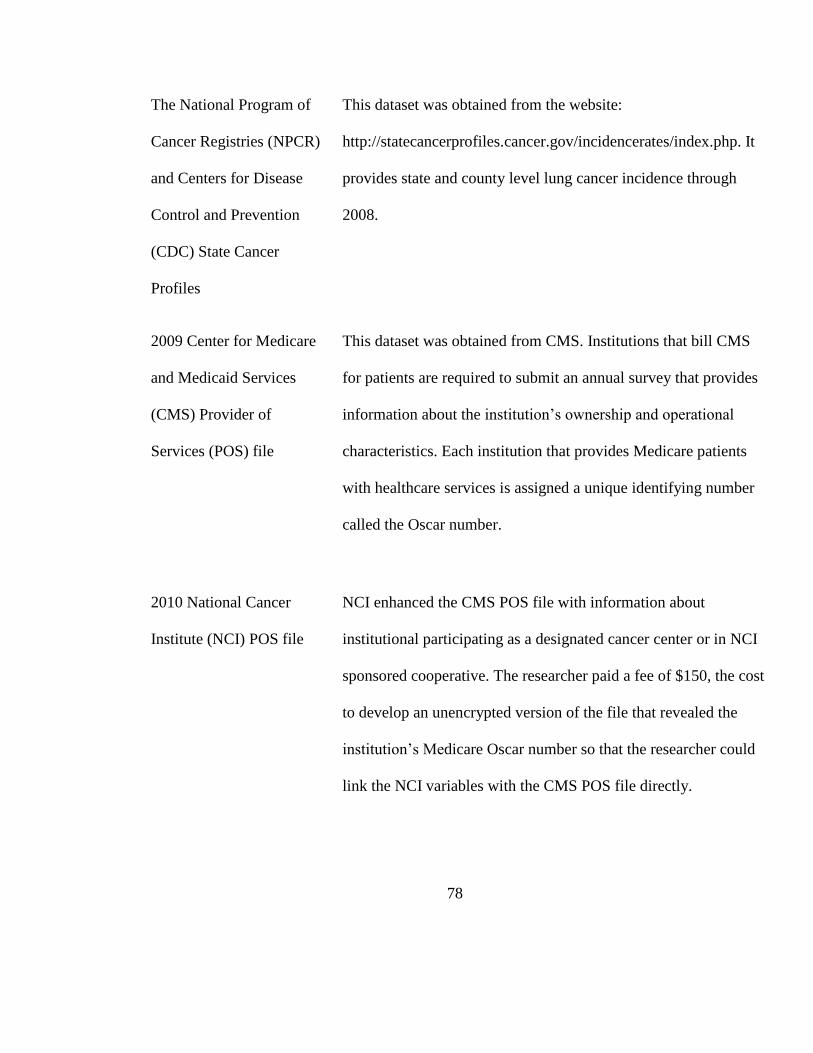
78
The National Program of
Cancer Registries (NPCR)
and Centers for Disease
Control and Prevention
(CDC) State Cancer
Profiles
This dataset was obtained from the website:
http://statecancerprofiles.cancer.gov/incidencerates/index.php. It
provides state and county level lung cancer incidence through
2008.
2009 Center for Medicare
and Medicaid Services
(CMS) Provider of
Services (POS) file
This dataset was obtained from CMS. Institutions that bill CMS
for patients are required to submit an annual survey that provides
information about the institution’s ownership and operational
characteristics. Each institution that provides Medicare patients
with healthcare services is assigned a unique identifying number
called the Oscar number.
2010 National Cancer
Institute (NCI) POS file
NCI enhanced the CMS POS file with information about
institutional participating as a designated cancer center or in NCI
sponsored cooperative. The researcher paid a fee of $150, the cost
to develop an unencrypted version of the file that revealed the
institution’s Medicare Oscar number so that the researcher could
link the NCI variables with the CMS POS file directly.
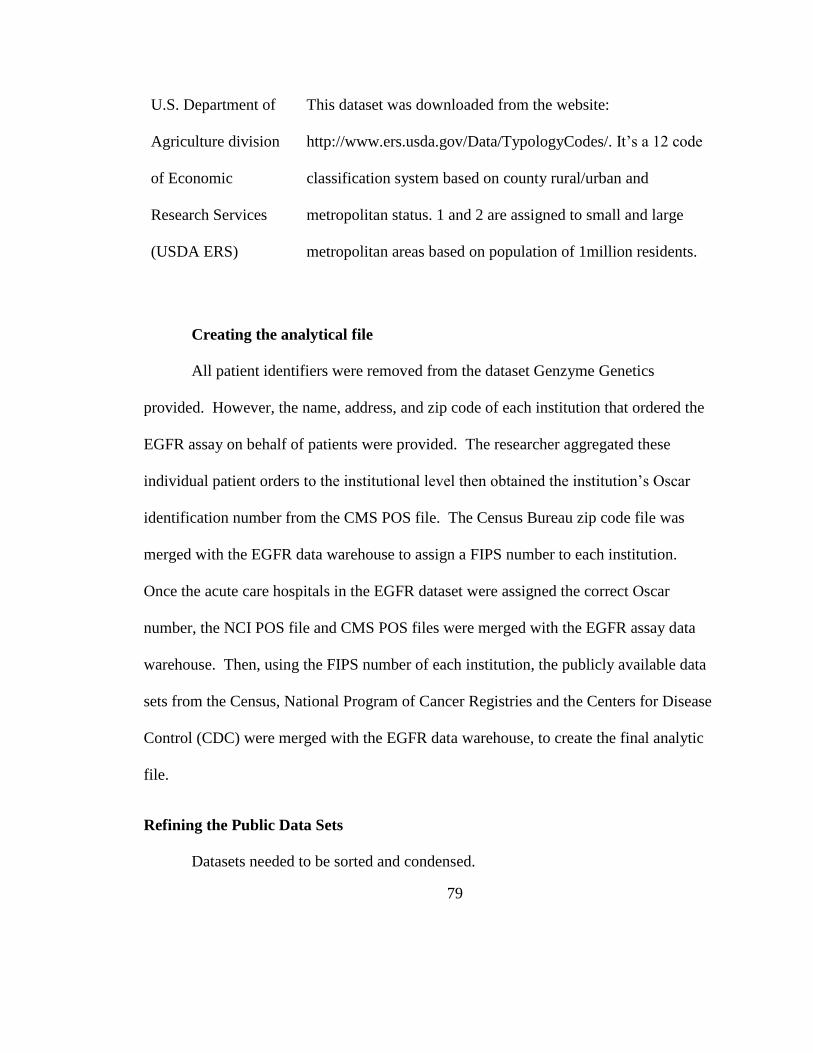
79
U.S. Department of
Agriculture division
of Economic
Research Services
(USDA ERS)
This dataset was downloaded from the website:
http://www.ers.usda.gov/Data/TypologyCodes/. It’s a 12 code
classification system based on county rural/urban and
metropolitan status. 1 and 2 are assigned to small and large
metropolitan areas based on population of 1million residents.
Creating the analytical file
All patient identifiers were removed from the dataset Genzyme Genetics
provided. However, the name, address, and zip code of each institution that ordered the
EGFR assay on behalf of patients were provided. The researcher aggregated these
individual patient orders to the institutional level then obtained the institution’s Oscar
identification number from the CMS POS file. The Census Bureau zip code file was
merged with the EGFR data warehouse to assign a FIPS number to each institution.
Once the acute care hospitals in the EGFR dataset were assigned the correct Oscar
number, the NCI POS file and CMS POS files were merged with the EGFR assay data
warehouse. Then, using the FIPS number of each institution, the publicly available data
sets from the Census, National Program of Cancer Registries and the Centers for Disease
Control (CDC) were merged with the EGFR data warehouse, to create the final analytic
file.
Refining the Public Data Sets
Datasets needed to be sorted and condensed.

80
Table 12 summarizes those changes.
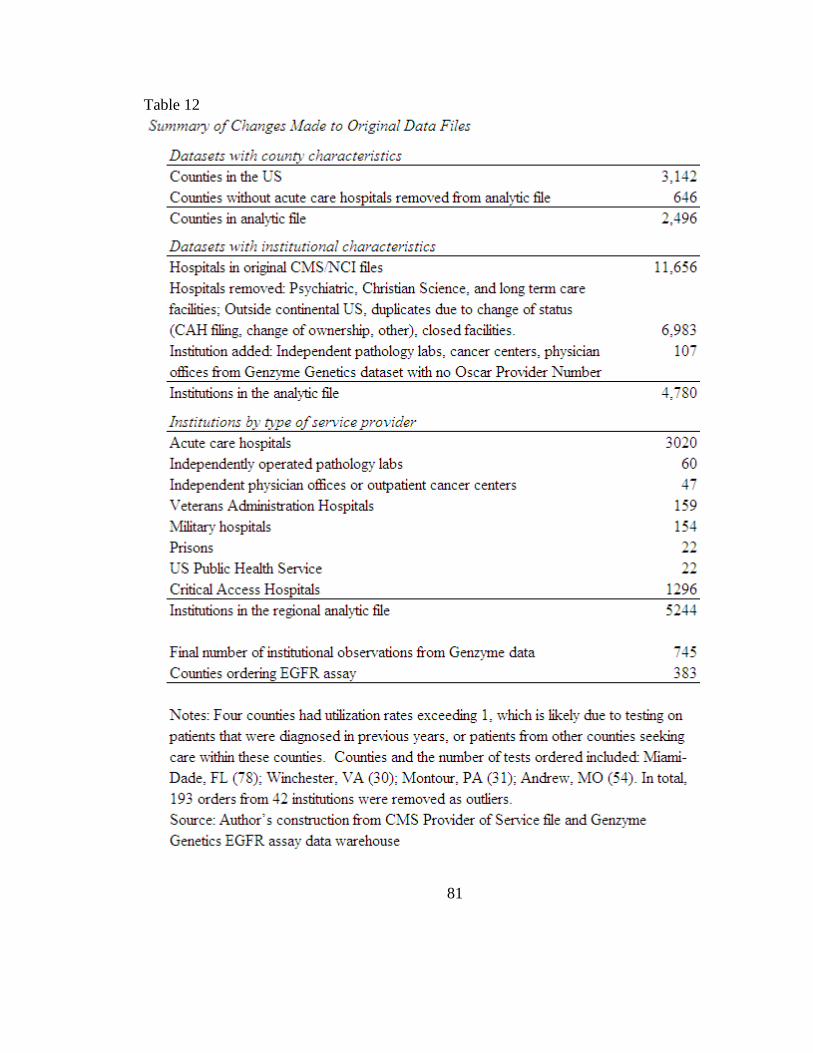
81
Table 12
82
Counties without acute care hospitals were removed from the final county
analytic files. Hospitals that were unlikely to be treating lung cancer patients were
removed. These included psychiatric, Christian Science and long term care facilities.
Analysis was limited to diffusion of the EGFR assay within continental US. Therefore
institutions operating outside the US were removed.
The most time consuming process of refining the data was culling out duplicates
or inactive hospitals from the CMS/NCI POS files. Most research that analyzes the
relationship between quality of care and institutional characteristics licenses the
American Hospital Association (AHA) database for approximately $5000. The cost to
license this was beyond the resources available to the researcher. Therefore it required
significant investment of time identifying and deleting dated, duplicated, or closed
facilities that continue to have an active provider (Oscar) numbers in the CMS database.
It should also be noted that the AHA database does not include the required variables
from the NCI. Although NCI dataset is public, most researchers use it through SEER and
the institution’s identification is encrypted.
Effort was invested in matching the name and address of the institution as listed in
the Genzyme Genetics Warehouse to their names in the CMS/NCI POS file. In some
cases it was exactly the same name. In other cases one dataset used the university name
while the other used the hospital name. There were no cases where the matching was not
apparent. However, in several observations, independent pathology laboratories were
operating within, or on behalf of, an acute care hospital. When this relationship could be
83
conclusively established, the order was assigned to that acute care hospital. However,
there were 108 institutions (60 pathology labs and 47 physician offices or outpatient
cancer centers) that were included in the analytic file but whose affiliation could not be
directly linked to an acute care hospital. These observations had institutional
characteristics listed as missing and will be dropped from any regressions that use
institutional capabilities, or participation in NCI cooperative group variables. A similar
dynamic existed with the institutions owned by the Federal government. Federal
institutions are exempt from filing the requisite updates to the CMS POS file. Yet, some
of the Veterans Health Administration hospitals (VA) participate in NCI cooperative
groups and see Medicare patients. Therefore, in some VA observations, the institutional
characteristics are listed whereas in other observations these are missing. The researcher
could identify no timely and accurate way to impute the missing data. Therefore, for
those observations that are missing institutional characteristics, the observations will be
dropped from any regressions that use these variables. However, these observations are
included in the regional analysis. These limitations in the dataset will be discussed in the
results and conclusions.
In the CDC/NPCR datasets, data on annual number of lung cancer cases and lung
cancer incidence are based on the year 2008. These data were submitted via the states
cancer registries to the CDC/NPCR in January 2010 and made available to the public and
researchers in August 2011. These data was for the most part comprehensive and
84
complete. However, there were some counties in which data was suppressed. The basis
for imputing data for these counties is discussed below.
For all counties in the states of Kansas and Minnesota, state policy prohibits
releasing data outside the county. For counties in Kansas and Minnesota, the average
annual lung cancer cases and incidence for male and female from years 2002 – 2006 were
provided on state web sites. From these numbers, total annual number of cases and
incidence per county were imputed using the same age and population adjustment
methodology SEER uses.
In 221 counties that had fewer than 3 lung cancer cases per year, data was
suppressed due to confidentiality. For these counties the number 1 was imputed. For
these same counties, if the average annual incidence was below 16, these numbers were
suppressed due to confidentiality. In these 221 counties, I assumed the lung cancer cases
on average were 8. For 62 counties and parishes in Alabama, Mississippi, Louisiana, and
Texas, data was suppressed due to population shifts that resulted after hurricane Katrina.
The average annual number of cases in these counties was imputed from the year prior to
hurricane Katrina.
Once the final analytic file was created, several additional derivative variables
were calculated and generated. The county age, education, and income data was
originally included as a continuous variable, percent of the county population. However,
when incorporating these variables into stage 1 and stage 2 logistic regression models, the
collinearity between these variables caused the model to fail. Transforming these
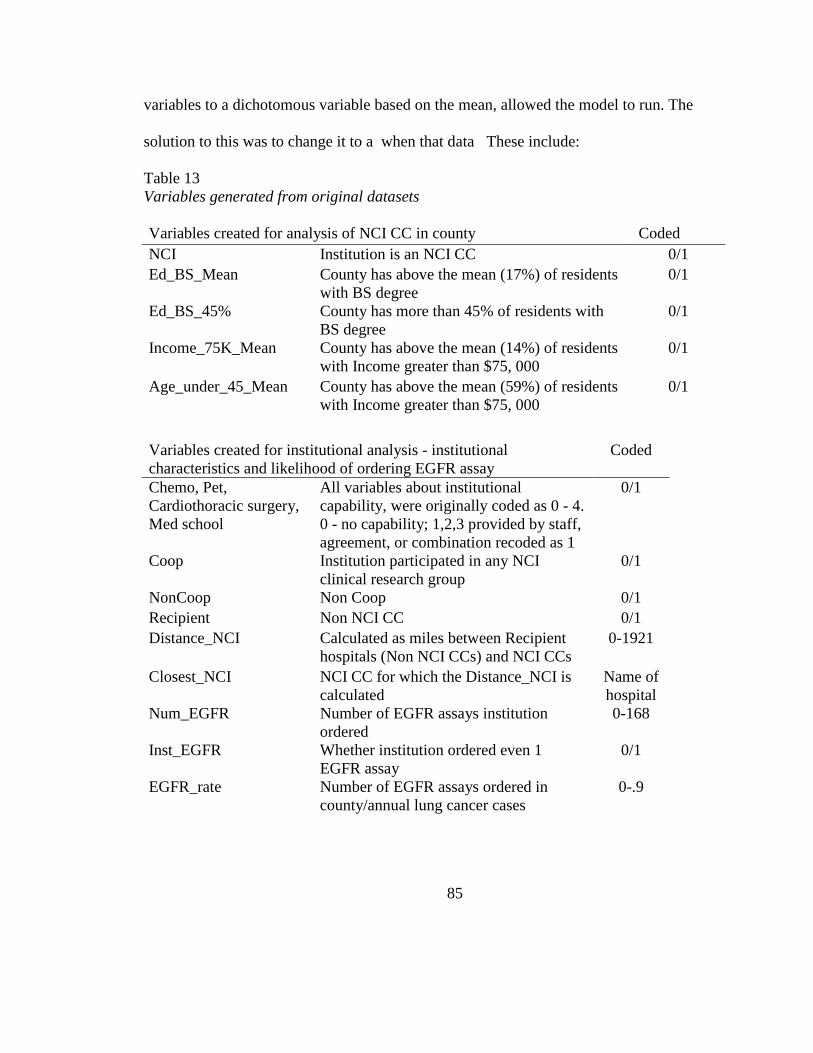
85
variables to a dichotomous variable based on the mean, allowed the model to run. The
solution to this was to change it to a when that data These include:
Table 13
Variables generated from original datasets
Variables created for analysis of NCI CC in county Coded
NCI Institution is an NCI CC 0/1
Ed_BS_Mean County has above the mean (17%) of residents
with BS degree
0/1
Ed_BS_45% County has more than 45% of residents with
BS degree
0/1
Income_75K_Mean County has above the mean (14%) of residents
with Income greater than $75, 000
0/1
Age_under_45_Mean County has above the mean (59%) of residents
with Income greater than $75, 000
0/1
Variables created for institutional analysis - institutional
characteristics and likelihood of ordering EGFR assay
Coded
Chemo, Pet,
Cardiothoracic surgery,
Med school
All variables about institutional
capability, were originally coded as 0 - 4.
0 - no capability; 1,2,3 provided by staff,
agreement, or combination recoded as 1
0/1
Coop Institution participated in any NCI
clinical research group
0/1
NonCoop Non Coop 0/1
Recipient Non NCI CC 0/1
Distance_NCI Calculated as miles between Recipient
hospitals (Non NCI CCs) and NCI CCs
0-1921
Closest_NCI NCI CC for which the Distance_NCI is
calculated
Name of
hospital
Num_EGFR Number of EGFR assays institution
ordered
0-168
Inst_EGFR Whether institution ordered even 1
EGFR assay
0/1
EGFR_rate Number of EGFR assays ordered in
county/annual lung cancer cases
0-.9
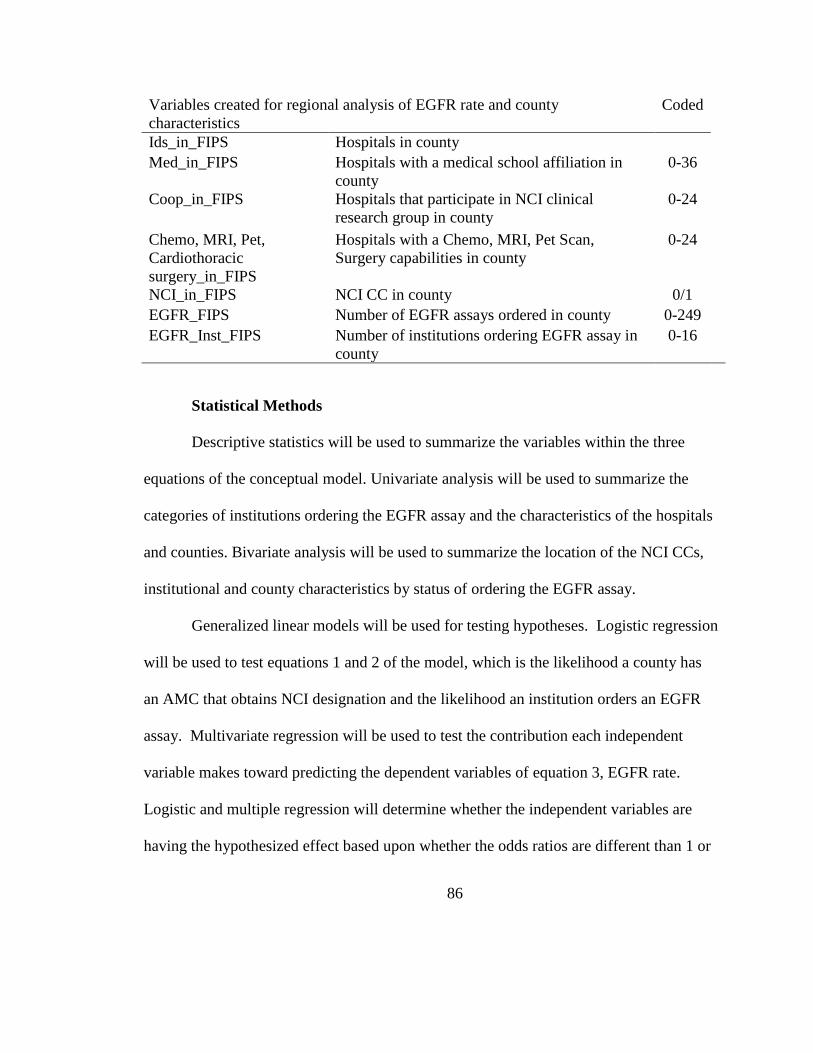
86
Variables created for regional analysis of EGFR rate and county
characteristics
Coded
Ids_in_FIPS Hospitals in county
Med_in_FIPS Hospitals with a medical school affiliation in
county
0-36
Coop_in_FIPS Hospitals that participate in NCI clinical
research group in county
0-24
Chemo, MRI, Pet,
Cardiothoracic
surgery_in_FIPS
Hospitals with a Chemo, MRI, Pet Scan,
Surgery capabilities in county
0-24
NCI_in_FIPS NCI CC in county 0/1
EGFR_FIPS Number of EGFR assays ordered in county 0-249
EGFR_Inst_FIPS Number of institutions ordering EGFR assay in
county
0-16
Statistical Methods
Descriptive statistics will be used to summarize the variables within the three
equations of the conceptual model. Univariate analysis will be used to summarize the
categories of institutions ordering the EGFR assay and the characteristics of the hospitals
and counties. Bivariate analysis will be used to summarize the location of the NCI CCs,
institutional and county characteristics by status of ordering the EGFR assay.
Generalized linear models will be used for testing hypotheses. Logistic regression
will be used to test equations 1 and 2 of the model, which is the likelihood a county has
an AMC that obtains NCI designation and the likelihood an institution orders an EGFR
assay. Multivariate regression will be used to test the contribution each independent
variable makes toward predicting the dependent variables of equation 3, EGFR rate.
Logistic and multiple regression will determine whether the independent variables are
having the hypothesized effect based upon whether the odds ratios are different than 1 or
87
the coefficients are greater than 0. Both the logistic and multivariate regressions will be
conducted by manually stepping in each independent variable to analyze the correlation
between the independent variables and the subsequent impact on the odds ratios or
coefficients.
Methodological challenges
There were several challenges working with these datasets. A major drawback to
this dataset is that it lacks patient level data. As has been demonstrated in Chapters 2 and
3, the driving motivation behind this study was to determine whether racial disparities in
access to the EGFR assay contribute to lack of knowledge about the incidence of EGFR
mutations in Blacks. It was hoped that regional analysis of diffusion might explain the
hypothesized racial difference in access to the EGFR assay. Yet, for two reasons, regional
analysis failed to establish a racial disparity in access to the EGFR assay. The fact that
NCI CCs locate in metropolitan counties which have dense Black populations suggests
that there are not regional barriers to access for the EGFR assay. However, regional
analysis fails to consider the age of the minority populations in communities close to the
NCI CC. Minority populations living close to NCI CCs tend to be younger than the
population of patients who get cancer, therefore they may not be seeking care at the NCI
CCs. Further, there are a large percentage of whites living in rural, non metro counties
that are not being provided access to the EGFR assay. Therefore, even when the patient
level data is analyzed, the hypothesized racial disparity may not be significant given the
equivalent disparities among White populations. Without the patient level data from the
88
Medicare claims files, it is not possible to prove that Black patients are not accessing the
assays that the NCI CCs are conducting. Therefore, this dataset does not allow that
question of racial disparities to be analyzed.
The lack of comprehensive data on NCI CC testing is also a drawback in the
dataset. Table 3 suggests that the number of EGFR assays conducted by NCI CCs may
exceed the number of assays conducted nationally. The absence of this data from the
analysis weakens the explanatory power of any model to determine regional causes that
drive the EGFR diffusion rate (equation 3). If this data were included, there would likely
be very high utilization rates in counties which have an NCI CC, or those in close
proximity to these counties, with low or zero utilization in distant counties.
There are several other factors that may both strengthen and weaken the
explanatory effect of the model. 503 counties in the US have no acute care hospitals
located within their boundaries. These counties were removed from the dataset on the
premise that patients would not have access to the required medical procedure to obtain
tumor tissue. However, some of these patients are likely traveling to other counties to
obtain care. It is difficult to capture the impact border crossing has on the regional EGFR
rate without having access to the patient data. The challenge that border crossing poses
to regional analysis of healthcare utilization applies even when there is are acute care
facilities located within the counties. Cancer patients may be more likely to travel to seek
care in specialty hospitals. This may have been one of the factors contributing to 4
counties within the US having utilization rates above the number of annual lung cases for
89
that county. If this happened with other counties, this may be giving greater weight to the
sociodemographic variables of the counties in which patients are seeking care and
weaken the effect of the distance to NCI CC variable.
Logistic regression tends to systematically overestimate odds ratios or beta
coefficients when the sample size is less than about 500 (Nemes et. al, 2009). Although
the sample size of both the institutions and counties is greater than 500, the outcome of
counties ordering the EGFR assay is only 379 of the 2,359 counties analyzed. Similarly,
once NCI CCs and outliers were removed from the dataset, there were only 708
institutions of the 7007 institutions analyzed. This may result in an overestimation of the
odds ratios and beta coefficients. Therefore, sensitivity testing will be conducted on the
model and it will be run in several different ways, eliminating counties that have no acute
care facilities from the analysis as well as running the regression only on those counties
which have at least 1 institution that has ordered an EGFR assay.
These methodological problems underscore the importance of conducting an
analysis of patient access to lung tumor genotyping using the Medicare claims data on
individual patients. The vast majority of lung cancer patients are Medicare patients.
Therefore, analysis of the 331,000 lung cancer patients Medicare claims file will provide
a comprehensive analysis of quality of lung cancer care and variable driving access to
personalized cancer care.

90
CHAPTER 4
Equation 1 Results
The first step in the conceptual model was to determine the likelihood a county has a
hospital that obtained NCI designation.
91
Table 14 is an analysis of the county typology, as defined the US Department of
Agriculture Economic Research Services (USDA ERS), with the location of NCI CCs,
acute care and critical access hospitals, institutions ordering the EGFR assay, number of
assays ordered, percentage of the US population, percentage that is black, and lung
cancer incidence.
Sixty of the sixty two NCI CCs are located within large or small metropolitan
counties which also have a higher percentage of residents that self identify as Black.
However, to test this when considering the other independent variables, a logistic
regression is required.
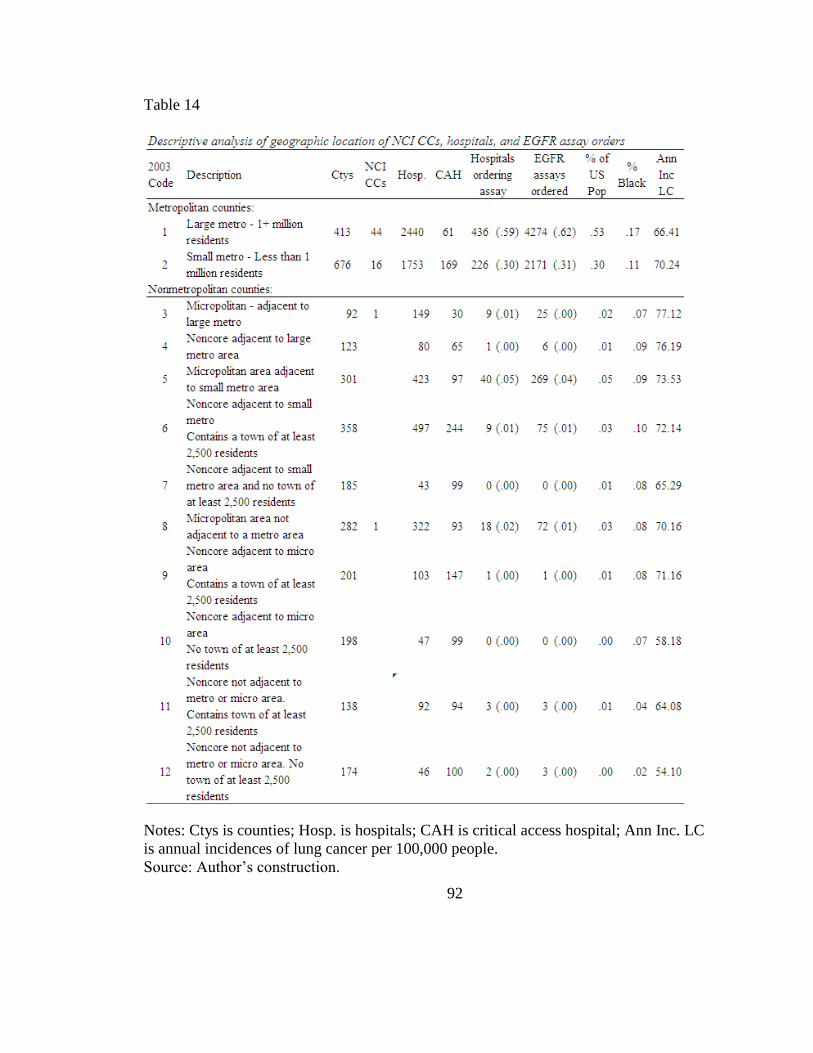
92
Table 14
Notes: Ctys is counties; Hosp. is hospitals; CAH is critical access hospital; Ann Inc. LC
is annual incidences of lung cancer per 100,000 people.
Source: Author’s construction.
93
Table 15 illustrates the results of the logistic regression analyzing the likelihood a
county has a hospital which obtained NCI designation. It illustrates the progressive effect
each independent variable added to the model has on the odds ratios of the other
variables. The chi-square of .0000 indicates that there is essentially no possibility of the
null hypothesis that the independent variables proposed, operating together, are unrelated
to the dependent variable, location of hospitals which obtain NCI designation within a
county
The first variable stepped into the model was number of hospitals in the county
affiliated with an AMC. This was chosen because, although patient care is an important
component of an NCI CC, generating research funding through collaboration with
academic medical institutions is likely a critical factor to obtain NCI designation. This
model illustrates that hypothesis 1 of stage 1 is supported; even when all other
independent variables are added to the model, concentration of hospitals associated with
a academic institutions is a strong predictor of a county having an NCI CC located within
its bounds.
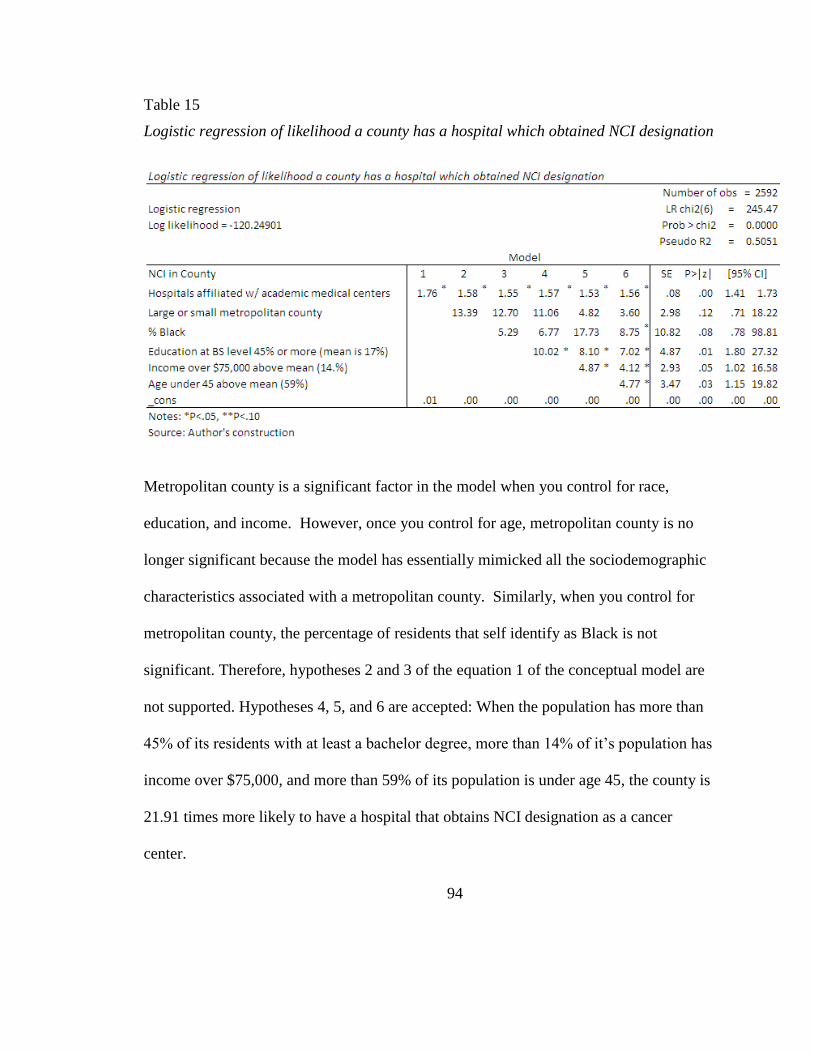
94
Table 15
Logistic regression of likelihood a county has a hospital which obtained NCI designation
Metropolitan county is a significant factor in the model when you control for race,
education, and income. However, once you control for age, metropolitan county is no
longer significant because the model has essentially mimicked all the sociodemographic
characteristics associated with a metropolitan county. Similarly, when you control for
metropolitan county, the percentage of residents that self identify as Black is not
significant. Therefore, hypotheses 2 and 3 of the equation 1 of the conceptual model are
not supported. Hypotheses 4, 5, and 6 are accepted: When the population has more than
45% of its residents with at least a bachelor degree, more than 14% of it’s population has
income over $75,000, and more than 59% of its population is under age 45, the county is
21.91 times more likely to have a hospital that obtains NCI designation as a cancer
center.
95
Census socio demographic variables are continuous variables between 0-100
percent. However, these variables are highly intercorrelated. When the logistic regression
analysis was conducted, the model became unstable and unreasonable odds ratios were
generated. Therefore, these variables were recoded to 0/1 variables to run the model. The
0/1 transformation works because it limits the number of cells in the model. These
variables were constructed by obtaining the mean level of the population that had the
specific characteristic. The counties which had greater than the mean were coded as 1.
For example, for all the counties analyzed, 14% of the population had Income over
$75,000. Therefore, this variable was initially recoded as 0/1 with a 1 representing that
the county with more than 14% of its population having income greater than $75,000.
The same process was applied to age.
I handled the transformation of the education variable differently. Initially, I
transformed it to a 0/1 variable based on the mean of 17%. However, the odds ratio
remained very high which indicated designation of an NCI cancer center was highly
sensitive to education level. To test the sensitivity of this variable, I increased it to as high
as 45% of the population. At this level, BS education maintained a statistically
significant odds ratio. Therefore, in the NCI analysis, counties with at least 45% of its
population with a BS level education, are indicated with a 1. These counties are 7 times
more likely to have an NCI CC located within it.
There is some debate about which variable came first. Did high level of education
in the county increase the likelihood that an academic medical center obtained NCI
96
designation or does having an NCI designated cancer center in the county increase the
level of education? It is not possible to test it within this study. However, it is
worthwhile testing the sensitivity of the education variable.
The final variables that have statistically significant odds ratios are highlighted
with a single asterisk for a p-value of less than .05 and a double asterisk for a p-value less
than .10. When all the variables are included, model 6, the odds ratios for each significant
independent variable can be interpreted in the following manner: For each additional
hospital that is affiliated with an AMC, holding all other variables constant, that county
has a 56% greater chance of having a hospital that obtained NCI designation. If the
county has 45% or more of its population with at least a bachelor degree education,
holding all other variables constant, it is 7 times more likely to have a hospital that
obtained NCI designation. If the county has more than 14% of its population with income
above $75,000, holding all other variables constant, it is 4.12 times more likely to have a
hospital that obtained NCI designation. If the county has 59% or more of its population
under age 45 years, holding all other variables constant, it is 4.12 times more likely to
have a hospital that obtained NCI designation.
Equation 2 Results
Equation 2 tests the likelihood an institution orders the EGFR assay. Of acute care
hospitals in the US, 12% (n=592) ordered the EGFR assay. In 49 counties with an NCI
designated cancer center (NCI CC), 19% of hospitals ordered the assay, whereas only
11% of hospitals in non NCI counties ordered the assay.
97
Table 14 illustrates that, as with the NCI CCs, 89% of hospitals ordering the
EGFR assay were located within metropolitan counties. These hospitals accounted for
93% of total EGFR assays ordered. 83% of the US population lives within these
counties. However, within the large metropolitan counties, the annual incidence of lung
cancer is lower than the national mean of 68.75 cases per 100,000 or 158,799 annual
cases of lung cancer. There are very few assays ordered in non metropolitan counties,
454 or 7% of total assays. Further, there are 42,550 annual cases of lung cancer in these
counties (21% of the lung cancer population), who appear to have little access to the
EGFR assay. Table 14 strongly indicates that the disparity that exists in access to the
EGFR assay is location within a rural county.
Table 16 summarizes the type of facility, mean rates and distribution of EGFR
assays ordered. The mean number of assays ordered from the laboratories and physician
offices should be interpreted with caution. The mean for this type of facility is overstated
because it does not include all the laboratories and physician offices in the country that
did not order the test. However, all acute care, critical access, and federal hospitals are
included in the analysis. Therefore, the mean for these types of facilities is accurate.
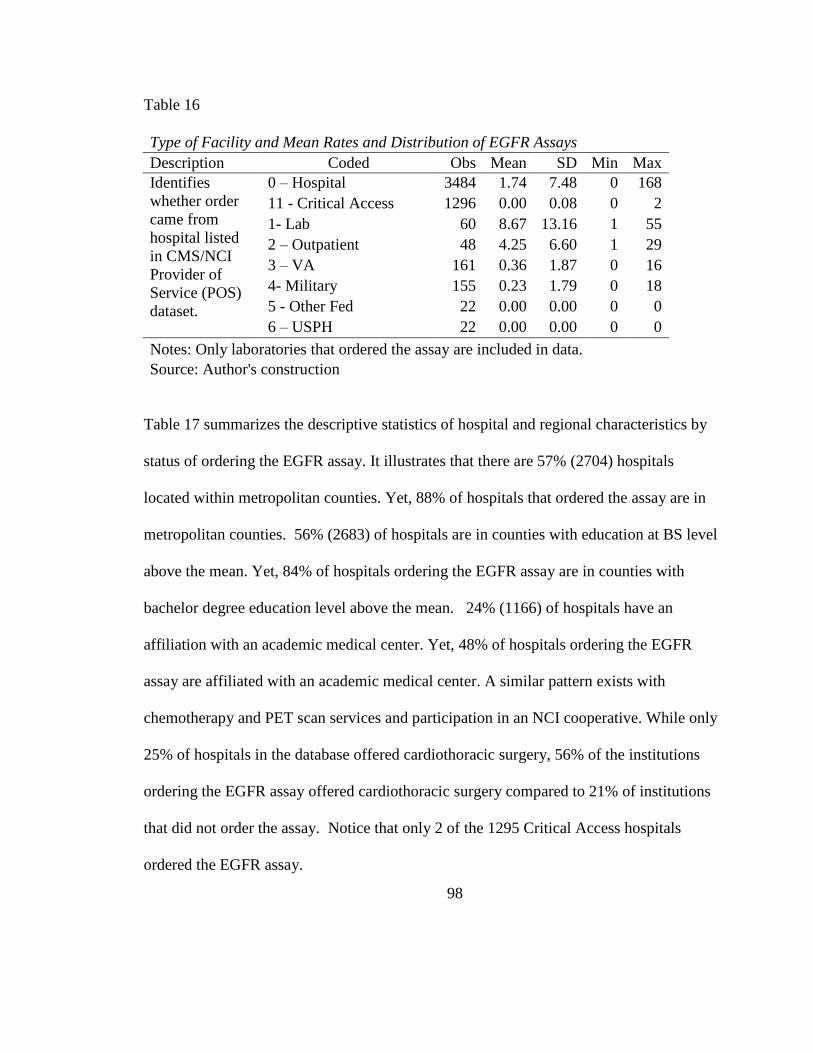
98
Table 16
Type of Facility and Mean Rates and Distribution of EGFR Assays
Description Coded Obs Mean SD Min Max
Identifies
whether order
came from
hospital listed
in CMS/NCI
Provider of
Service (POS)
dataset.
0 – Hospital 3484 1.74 7.48 0 168
11 - Critical Access 1296 0.00 0.08 0 2
1- Lab 60 8.67 13.16 1 55
2 – Outpatient 48 4.25 6.60 1 29
3 – VA 161 0.36 1.87 0 16
4- Military 155 0.23 1.79 0 18
5 - Other Fed 22 0.00 0.00 0 0
6 – USPH 22 0.00 0.00 0 0
Notes: Only laboratories that ordered the assay are included in data.
Source: Author's construction
Table 17 summarizes the descriptive statistics of hospital and regional characteristics by
status of ordering the EGFR assay. It illustrates that there are 57% (2704) hospitals
located within metropolitan counties. Yet, 88% of hospitals that ordered the assay are in
metropolitan counties. 56% (2683) of hospitals are in counties with education at BS level
above the mean. Yet, 84% of hospitals ordering the EGFR assay are in counties with
bachelor degree education level above the mean. 24% (1166) of hospitals have an
affiliation with an academic medical center. Yet, 48% of hospitals ordering the EGFR
assay are affiliated with an academic medical center. A similar pattern exists with
chemotherapy and PET scan services and participation in an NCI cooperative. While only
25% of hospitals in the database offered cardiothoracic surgery, 56% of the institutions
ordering the EGFR assay offered cardiothoracic surgery compared to 21% of institutions
that did not order the assay. Notice that only 2 of the 1295 Critical Access hospitals
ordered the EGFR assay.
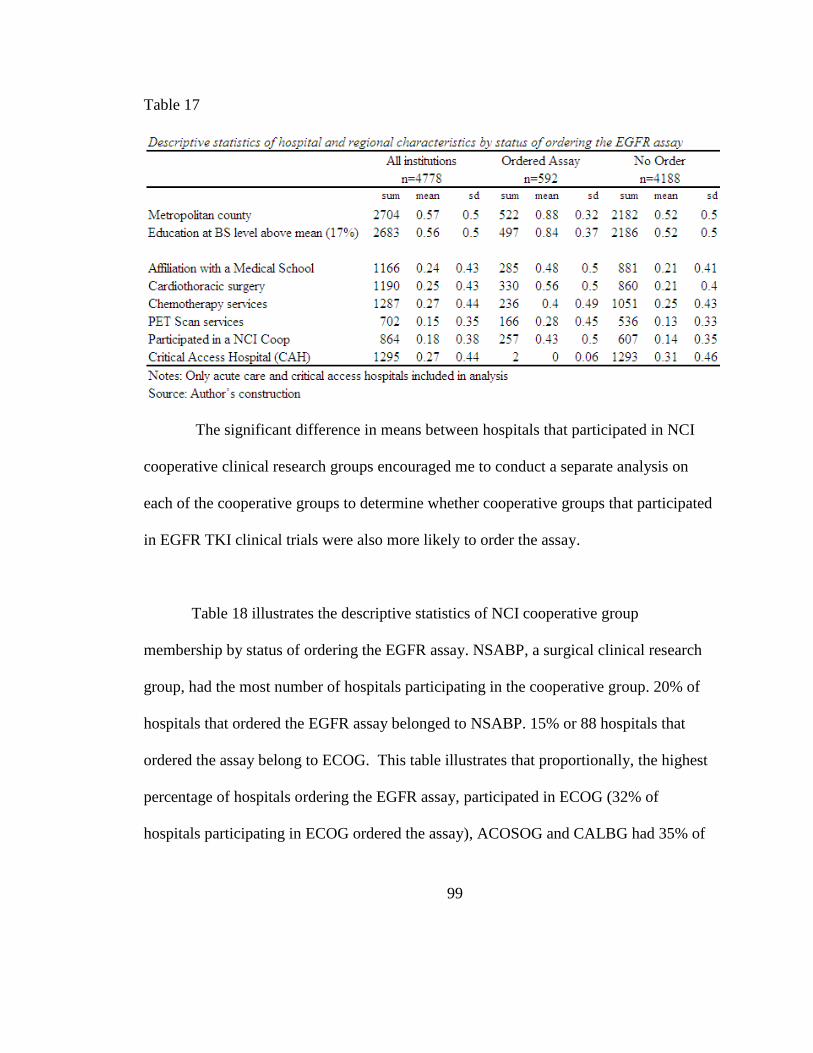
99
Table 17
The significant difference in means between hospitals that participated in NCI
cooperative clinical research groups encouraged me to conduct a separate analysis on
each of the cooperative groups to determine whether cooperative groups that participated
in EGFR TKI clinical trials were also more likely to order the assay.
Table 18 illustrates the descriptive statistics of NCI cooperative group
membership by status of ordering the EGFR assay. NSABP, a surgical clinical research
group, had the most number of hospitals participating in the cooperative group. 20% of
hospitals that ordered the EGFR assay belonged to NSABP. 15% or 88 hospitals that
ordered the assay belong to ECOG. This table illustrates that proportionally, the highest
percentage of hospitals ordering the EGFR assay, participated in ECOG (32% of
hospitals participating in ECOG ordered the assay), ACOSOG and CALBG had 35% of
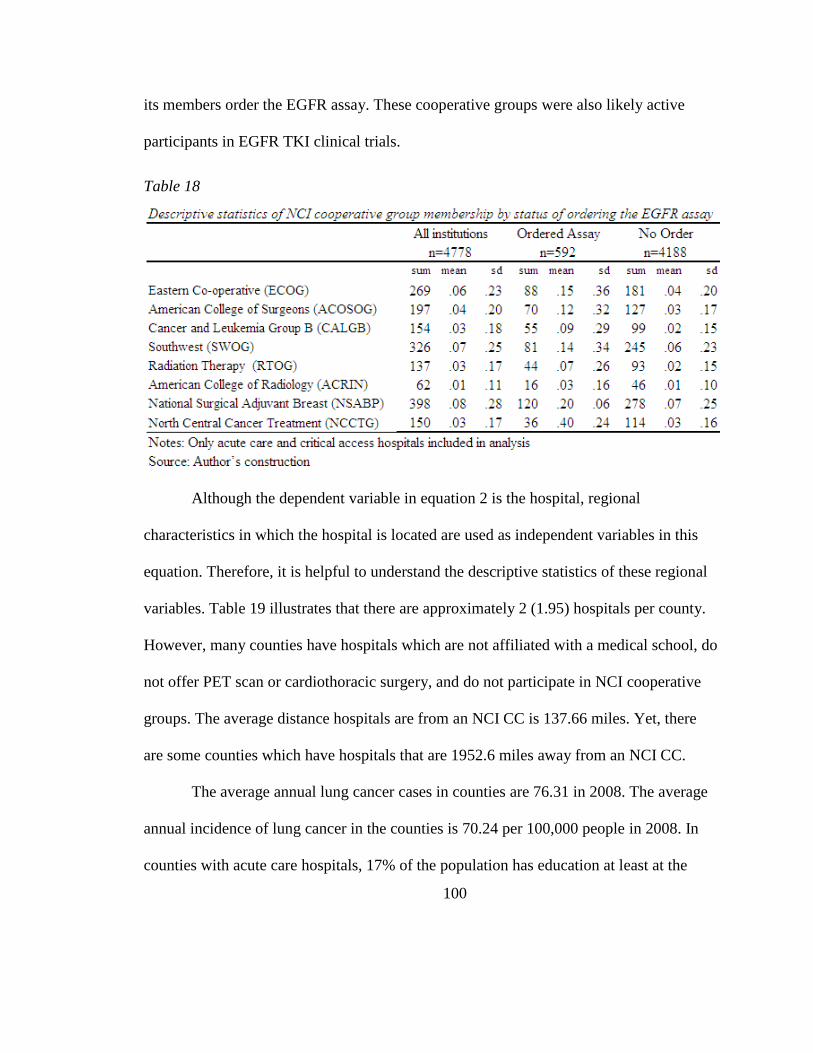
100
its members order the EGFR assay. These cooperative groups were also likely active
participants in EGFR TKI clinical trials.
Table 18
Although the dependent variable in equation 2 is the hospital, regional
characteristics in which the hospital is located are used as independent variables in this
equation. Therefore, it is helpful to understand the descriptive statistics of these regional
variables. Table 19 illustrates that there are approximately 2 (1.95) hospitals per county.
However, many counties have hospitals which are not affiliated with a medical school, do
not offer PET scan or cardiothoracic surgery, and do not participate in NCI cooperative
groups. The average distance hospitals are from an NCI CC is 137.66 miles. Yet, there
are some counties which have hospitals that are 1952.6 miles away from an NCI CC.
The average annual lung cancer cases in counties are 76.31 in 2008. The average
annual incidence of lung cancer in the counties is 70.24 per 100,000 people in 2008. In
counties with acute care hospitals, 17% of the population has education at least at the
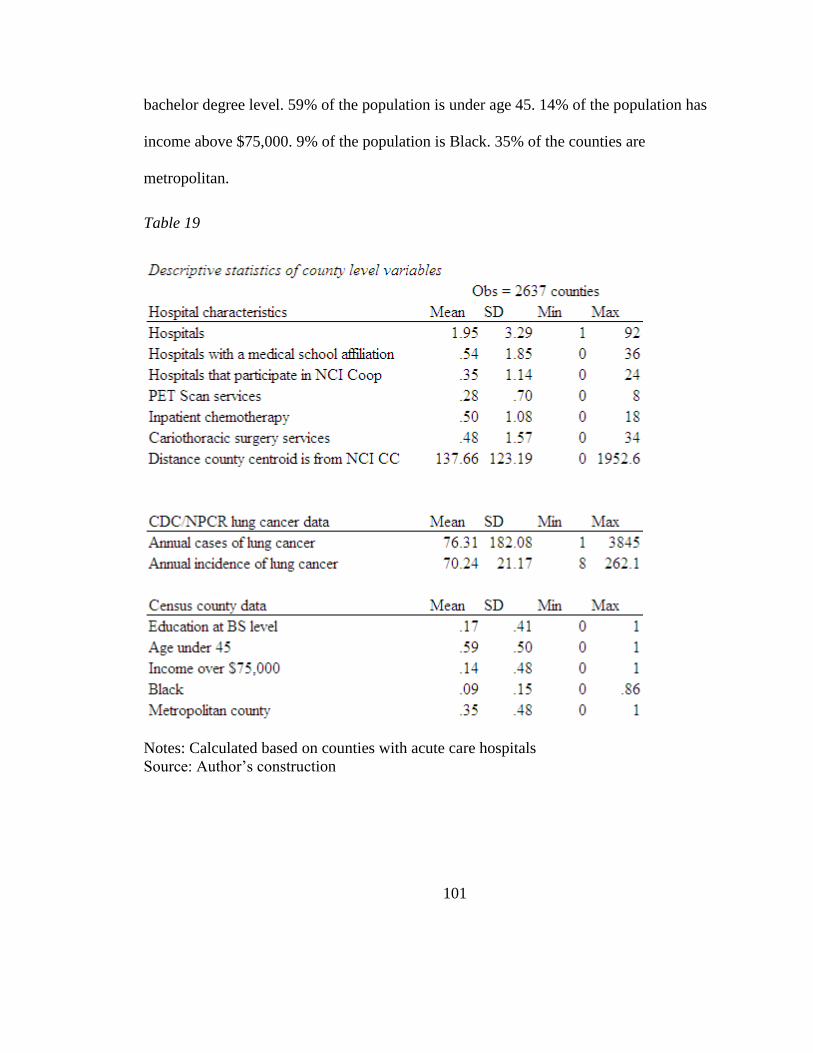
101
bachelor degree level. 59% of the population is under age 45. 14% of the population has
income above $75,000. 9% of the population is Black. 35% of the counties are
metropolitan.
Table 19
Notes: Calculated based on counties with acute care hospitals
Source: Author’s construction
102
Error! Reference source not found. illustrates the logistic regression model.
ach variable was stepped into the equation manually to demonstrate the correlation
between these variables and the subsequent effect on the dependent model. In model 1,
distance to the NCI CC was the first variable stepped in because the central hypothesis
was diffusion of the EGFR assay emanates from the NCI cancer centers. The odds rate
.991 was generated with a p-value of .00 indicating that for each mile a hospital is away
from an NCI, the lower the likelihood it will order the EGFR assay. Next, affiliation with
a medical school was stepped in because I hypothesized that these types of hospitals
would be early adopters of innovations. Model 2 illustrates that hospitals affiliated with a
medical school are 3.12 times more likely to order the EGFR assay, even when
controlling for distance to the NCI CC. In model 3, participating in a NCI clinical
research cooperative group (Coops) was the third variable stepped in because these
hospitals are more likely to have been exposed to the EGFR assay through participation
in an EGFR TKI clinical trial. Model 3 illustrates that Coops are 3.13 more likely to
order the EGFR assay. However, by stepping in this variable, it decreases the impact
affiliating with a medical school has on the dependent variable because many Coops are
also likely to be affiliated with a medical school. In model 4, PET scan services was
stepped in. Although PET scans are not widely used in treatment of lung cancer, this
variable is a proxy for hospitals that are early adopters of technology. Hospitals that offer
PET Scan services are 1.89 times more likely to order an EGFR assay.
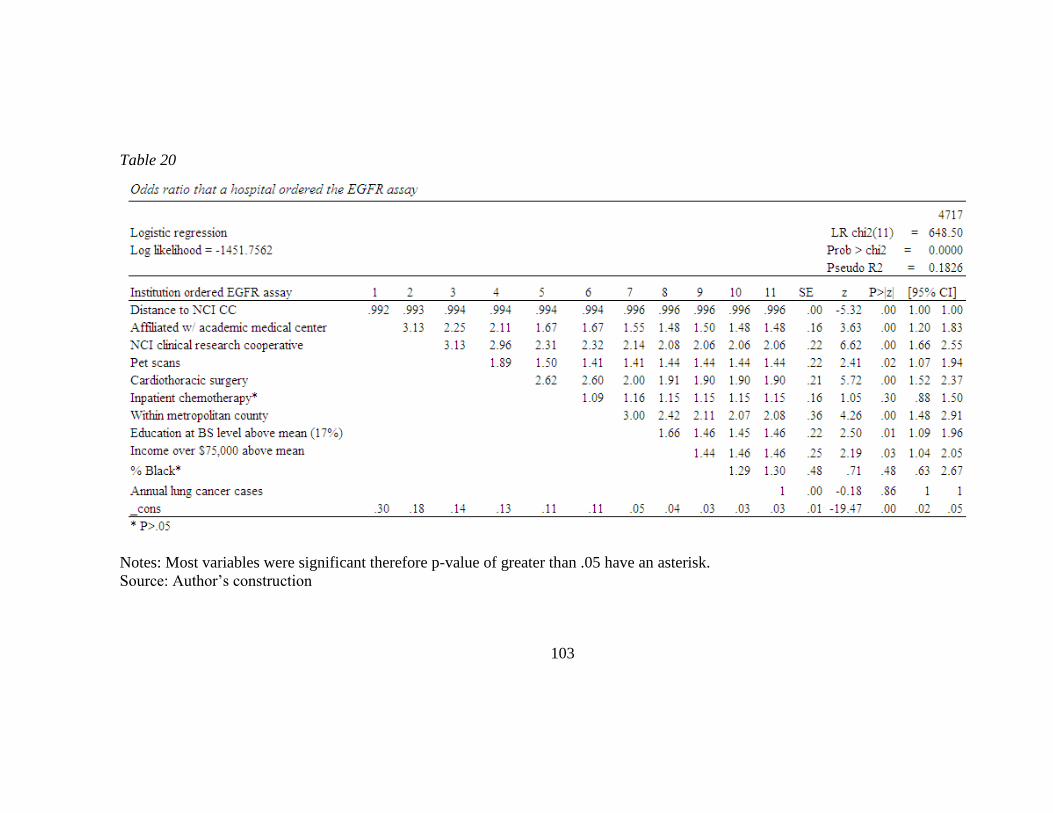
103
Table 20
Notes: Most variables were significant therefore p-value of greater than .05 have an asterisk.
Source: Author’s construction
104
PET Scan services also decreased the impact medical school affiliation and participation
in a cooperative group had but did not change the influence distance had on the
likelihood of ordering the EGFR assay. Model 5 stepped in the variable cardiothoracic
surgery services. Hospitals that offer cardiothoracic surgery are most likely to conduct
lung cancer surgery and therefore likely to have more lung tumor tissue available for
conducting the EGFR assay. This hypothesis was supported. Hospitals that offer
cardiothoracic surgery are 2.61 times more likely to order the assay. However, there is
clearly some correlations between these hospital characteristics because the influence of
medical school affiliation, participating in an NCI cooperative group, and offering PET
scan services decreases when cardiothoracic surgery is added. All hospital characteristics
except chemotherapy services remain significant predictors of ordering the EGFR assay.
Model 6 steps in inpatient chemotherapy services. This variable is not statistically
significant. Although inpatient chemotherapy services is an indicator of offering
advanced cancer care services, the effect of this variable is likely being captured by the
previous characteristics. Hospitals that affiliate with a medical school, participate in NCI
cooperative groups, offer PET scan and cardiothoracic surgery, are also likely to offer
chemotherapy services. In model 7, I stepped in the regional variable of location within a
metropolitan county. As illustrated, when controlling for all other variables, location
within a metropolitan county is a significant predictor of ordering the EGFR assay.
Model 8 steps in the education level of the county. When controlling for distance to the
NCI CC, all the institutional characteristics, and location within a metropolitan county,
105
hospitals located within counties that have more than 17% of their population educated at
least the bachelor’s degree level, are more likely to order the EGFR assay. Model 9
illustrates that the percentage of Blacks within a county is not a significant predictor of
whether the hospital orders the EGFR assay. As was illustrated in equation 1, hospitals
that order the EGFR assay may be located in urban metropolitan communities that have a
high minority population. Therefore, hypothesis 7 is not supported. Model 10 tests
hypothesis 9, whether, controlling for distance, institutional characteristics, and other
regional characteristics, a hospital located in a high income county is more likely to order
the EGFR assay. This hypothesis is supported. Controlling for all other variables,
hospitals located in counties that have more than 14% of its population with income
above $75,000 are 1.46 times more likely to order the EGFR assay.
Model 11 stepped in the annual number of lung cancer cases in the county. In an
equitable and rational healthcare system, this variable would be the biggest causative
factor driving both the number of EGFR assays ordered as well as the number of
hospitals ordering the assay. However, as model 11 illustrates, this is not a statistically
significant factor in whether a hospital orders the EGFR assay.
Other than hypotheses 1 and 7, all hypotheses in equation 2 are supported. Neither
number of lung cancer cases or percentage of Blacks living in a county had a statistically
significant effect on whether a hospital ordered the EGFR assay.
Hospital and regional characteristics had the hypothesized effect on likelihood a
hospital would order the EGFR assay. Significant institutional predictors of ordering the
106
assay included: Participation in an NCI clinical research cooperative group (odds ratio
[OR], 2.06, 95% CI 1.66 to 2.55), Cardiothoracic Surgery (OR, 1.90; 95% CI, 1.52 to
2.37), PET Scan services (OR, 1.44, CI, 1.07 to 1.94), and affiliation with academic
medical center (OR, 1.48; 95% CI, 1.20 to 1.83). Inpatient chemotherapy services were
not statistically significant once all other institutional characteristics were stepped in.
Significant regional predictors included: metropolitan county (OR, 2.08; 95% CI, 1.48 to
2.91), education above the mean (OR, 1.46; 95% CI, 1.09 to 1.96), and income above the
mean (OR, 1.46; 95% CI, 1.09 to 1.96). Negative predictors were distance from an NCI
CC (OR, .996, 95% CI, .995 to .998), a 34% decrease in likelihood for every 100 miles
further from an NCI CC.
It is worth discussing hypothesis 5, distance to a comprehensive cancer center, in
greater depth. The hypothesis was that distance between the hospital and an NCI CC will
have an inverse relationship to the likelihood the institution ordered the EGFR assay.
When this variable is initially stepped in, the odds ratio is lower than 1 and the p value is
statistically significant. However, once other variables are stepped in, the odds ration
gets closer and closer to 1 yet remains statistically significant. This is explained by the
fact that distance is a continuous variable measured as each mile the hospital is from the
NCI CC. With the exception of percentage Black, all other variables are measured as
categorical 0/1 variables.
The model was rerun in logit to obtain a coefficient for distance rather than an
odds ratio. The logit coefficient generated was -.00411 when the model was run on
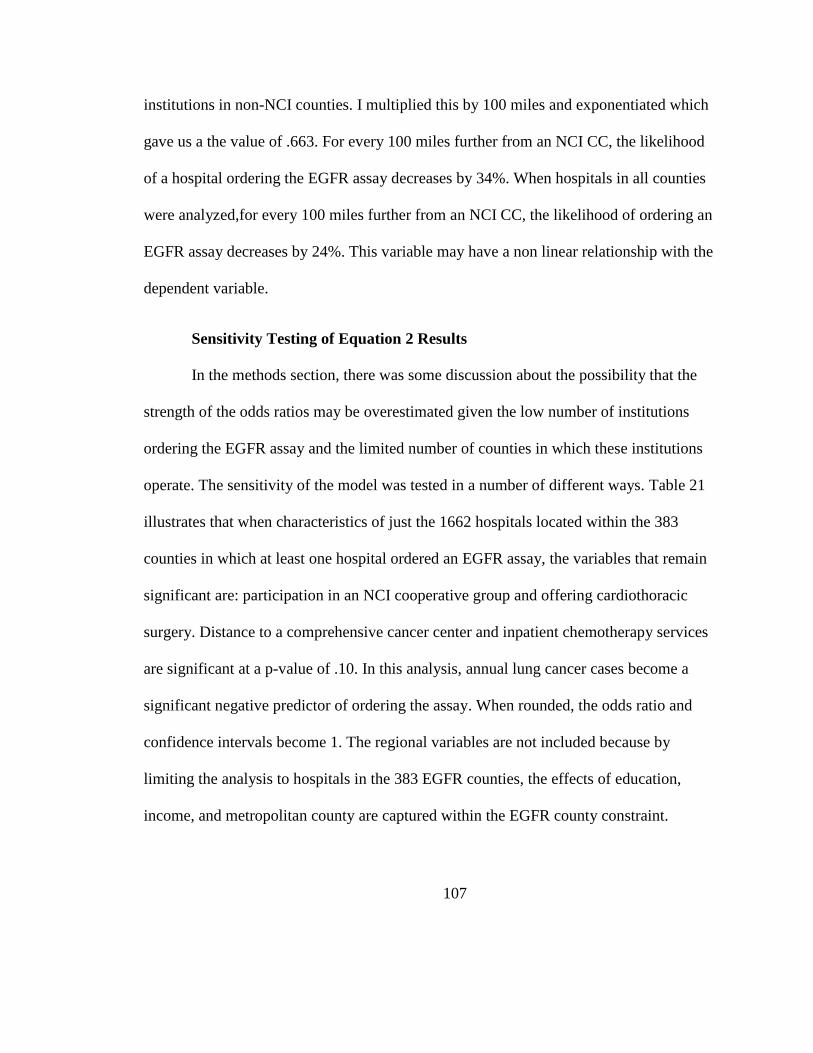
107
institutions in non-NCI counties. I multiplied this by 100 miles and exponentiated which
gave us a the value of .663. For every 100 miles further from an NCI CC, the likelihood
of a hospital ordering the EGFR assay decreases by 34%. When hospitals in all counties
were analyzed,for every 100 miles further from an NCI CC, the likelihood of ordering an
EGFR assay decreases by 24%. This variable may have a non linear relationship with the
dependent variable.
Sensitivity Testing of Equation 2 Results
In the methods section, there was some discussion about the possibility that the
strength of the odds ratios may be overestimated given the low number of institutions
ordering the EGFR assay and the limited number of counties in which these institutions
operate. The sensitivity of the model was tested in a number of different ways. Table 21
illustrates that when characteristics of just the 1662 hospitals located within the 383
counties in which at least one hospital ordered an EGFR assay, the variables that remain
significant are: participation in an NCI cooperative group and offering cardiothoracic
surgery. Distance to a comprehensive cancer center and inpatient chemotherapy services
are significant at a p-value of .10. In this analysis, annual lung cancer cases become a
significant negative predictor of ordering the assay. When rounded, the odds ratio and
confidence intervals become 1. The regional variables are not included because by
limiting the analysis to hospitals in the 383 EGFR counties, the effects of education,
income, and metropolitan county are captured within the EGFR county constraint.
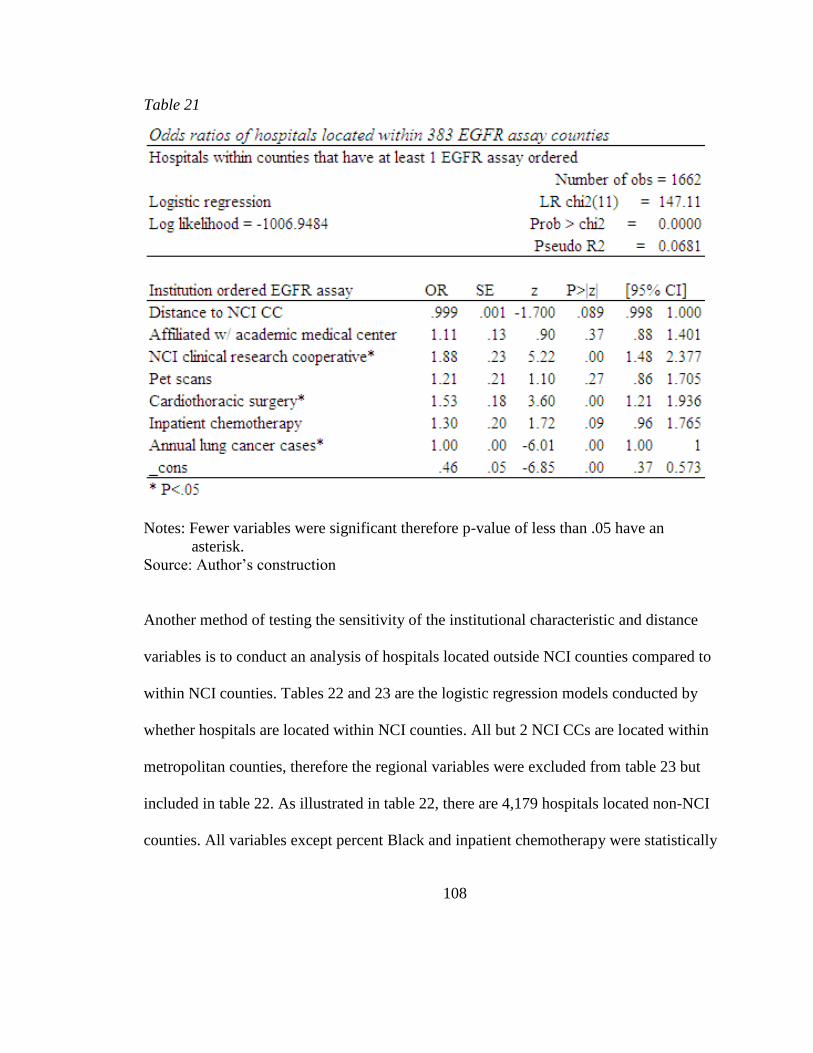
108
Table 21
Notes: Fewer variables were significant therefore p-value of less than .05 have an
asterisk.
Source: Author’s construction
Another method of testing the sensitivity of the institutional characteristic and distance
variables is to conduct an analysis of hospitals located outside NCI counties compared to
within NCI counties. Tables 22 and 23 are the logistic regression models conducted by
whether hospitals are located within NCI counties. All but 2 NCI CCs are located within
metropolitan counties, therefore the regional variables were excluded from table 23 but
included in table 22. As illustrated in table 22, there are 4,179 hospitals located non-NCI
counties. All variables except percent Black and inpatient chemotherapy were statistically
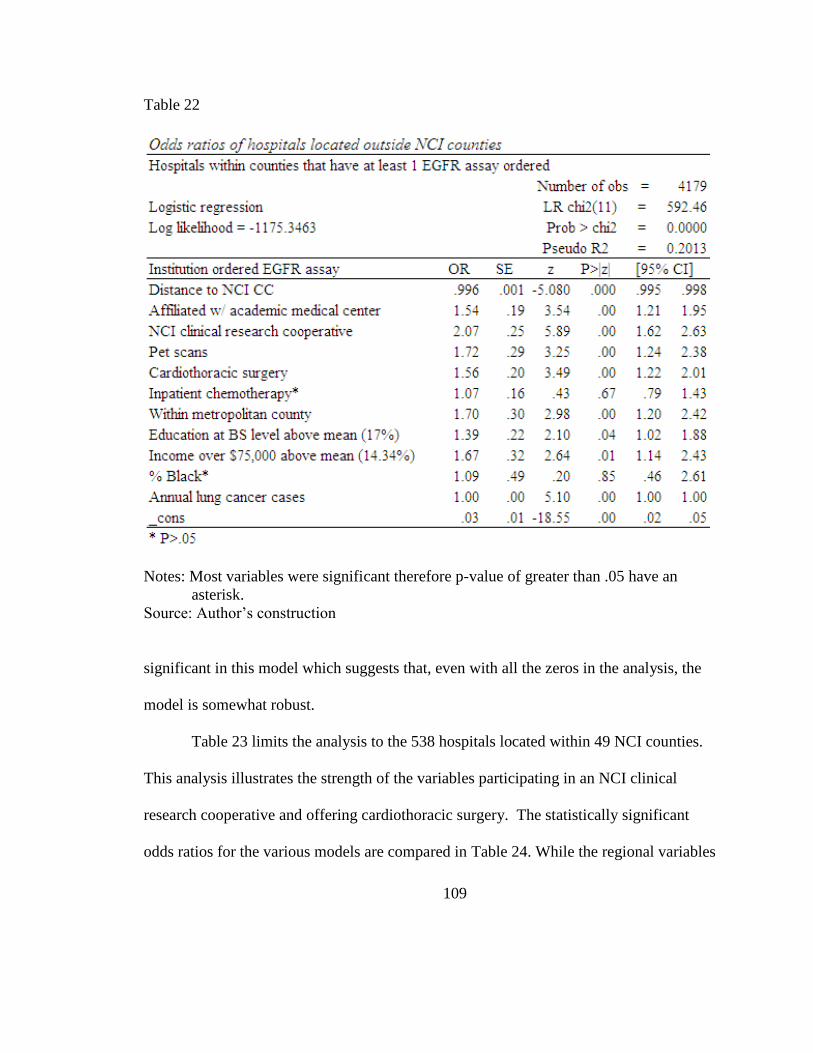
109
Table 22
Notes: Most variables were significant therefore p-value of greater than .05 have an
asterisk.
Source: Author’s construction
significant in this model which suggests that, even with all the zeros in the analysis, the
model is somewhat robust.
Table 23 limits the analysis to the 538 hospitals located within 49 NCI counties.
This analysis illustrates the strength of the variables participating in an NCI clinical
research cooperative and offering cardiothoracic surgery. The statistically significant
odds ratios for the various models are compared in Table 24. While the regional variables
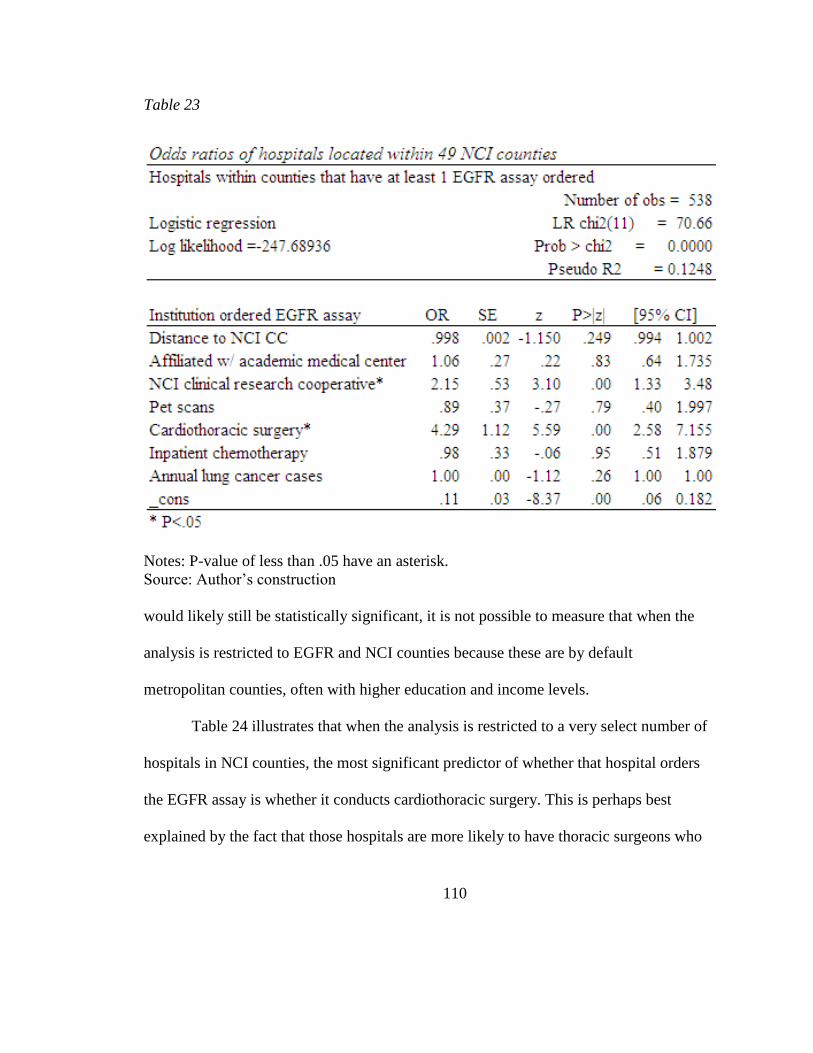
110
Table 23
Notes: P-value of less than .05 have an asterisk.
Source: Author’s construction
would likely still be statistically significant, it is not possible to measure that when the
analysis is restricted to EGFR and NCI counties because these are by default
metropolitan counties, often with higher education and income levels.
Table 24 illustrates that when the analysis is restricted to a very select number of
hospitals in NCI counties, the most significant predictor of whether that hospital orders
the EGFR assay is whether it conducts cardiothoracic surgery. This is perhaps best
explained by the fact that those hospitals are more likely to have thoracic surgeons who
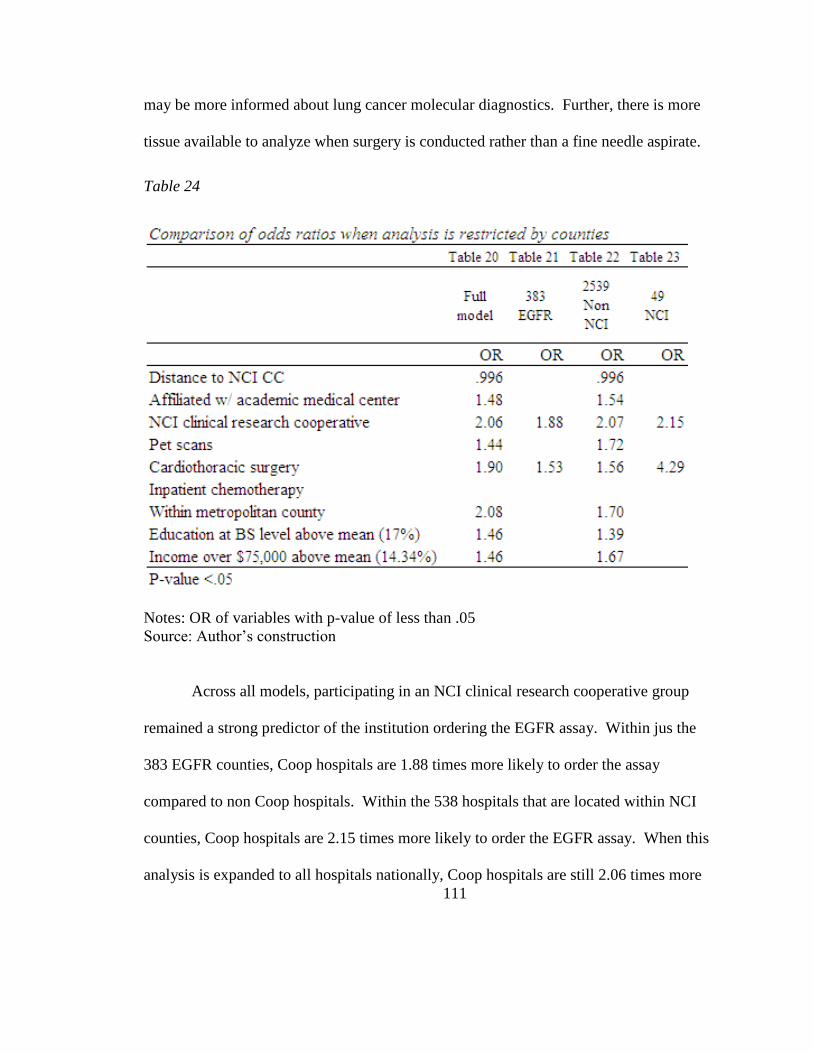
111
may be more informed about lung cancer molecular diagnostics. Further, there is more
tissue available to analyze when surgery is conducted rather than a fine needle aspirate.
Table 24
Notes: OR of variables with p-value of less than .05
Source: Author’s construction
Across all models, participating in an NCI clinical research cooperative group
remained a strong predictor of the institution ordering the EGFR assay. Within jus the
383 EGFR counties, Coop hospitals are 1.88 times more likely to order the assay
compared to non Coop hospitals. Within the 538 hospitals that are located within NCI
counties, Coop hospitals are 2.15 times more likely to order the EGFR assay. When this
analysis is expanded to all hospitals nationally, Coop hospitals are still 2.06 times more
112
likely to order the assay. The strength of this variable is explained by the fact that these
hospitals are more likely to have participated in EGFR TKI clinical trials. Therefore,
their providers have experience ordering the assay for patients. Or, hospitals that
participate in NCI clinical research cooperatives may have oncologists that are more
informed about the diagnosis and treatment of cancer patients based on the molecular
biology of the tumor.
Another sensitivity test distinguishes the influence of different NCI clinical
research cooperative groups. Does participation in specific groups increase the likelihood
the hospital ordered the EGFR assay? Error! Reference source not found. illustrates
hat cooperative groups that offer lung cancer clinical trials (ECOG, CALGB, ACOSOG)
were statistically significant with odds ratios between 1.70 to 2.11.
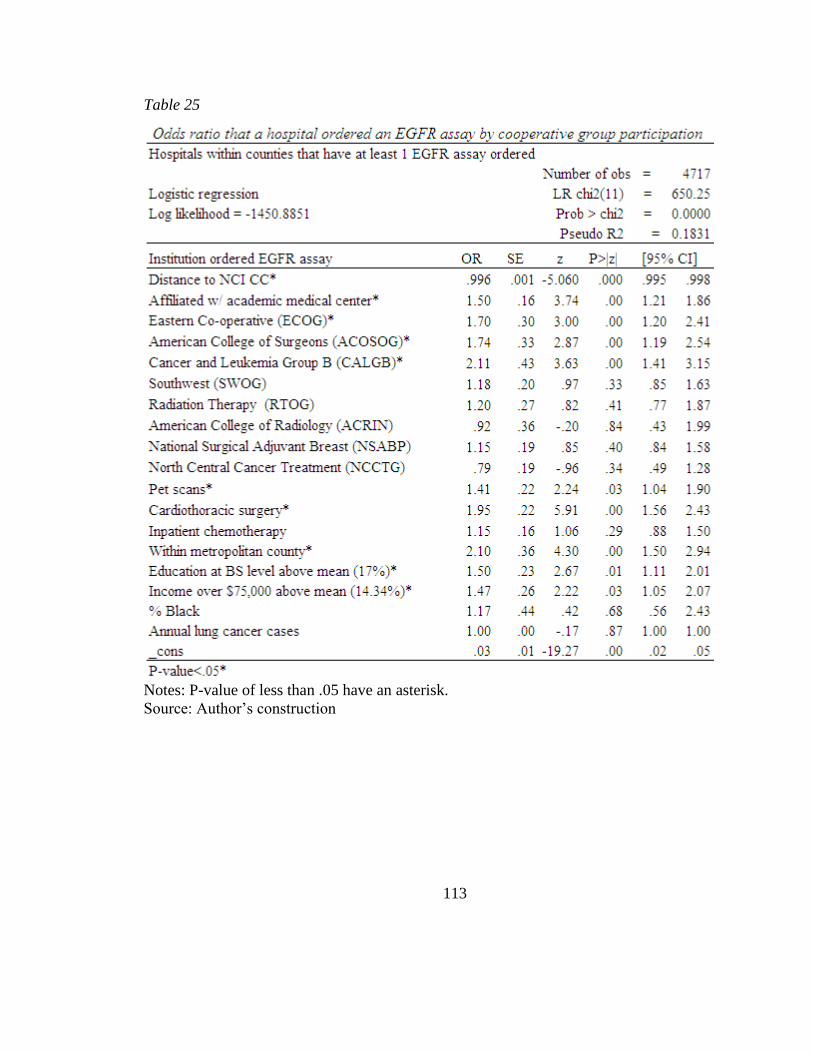
113
Table 25
Notes: P-value of less than .05 have an asterisk.
Source: Author’s construction
114
Equation 3 Results
There are several differences between equation 2 and equation 3. The most
significant difference is the dependent variable. In equation 2, the dependent variable
was a dichotomous variable (0 or 1) which measured the likelihood a hospital ordered an
EGFR assay. The model used logistic regression analysis. The independent variables
were regional and hospital characteristics. In equation 3, the dependent variable is the
number of EGFR assays ordered by hospitals within a county divided by the number of
guideline directed lung cancer cases in that county. It is calculated as a rate between 0
and 1, with 0 indicating that no hospitals within the county ordered the assay and 1
indicating that that the number of assays ordered by all hospitals in the county was equal
to the number of guideline directed lung cancer cases. Because the EGFR rate is a
continuous variable, the model will use multiple regression to analyze the independent
variables rather than logistic regression. Independent variables in the model are county
level sociodemographics and county level hospital characteristics. The first thing to note
about the model is that there are a large number of counties that have zero utilization.
There are 2496 counties in the dataset. 383 counties had an EGFR rate greater than 0 and
2,113 counties that had a utilization rate of 0. The large number of counties with 0
utilization will cause the effect size of any of the regression coefficients to be small. It
will also decrease the slope of the linear regression.
It is worth noting that by excluding data from NCI CCs, the utilization rate
nationally and within the counties in which the NCI CC is located, will be artificially
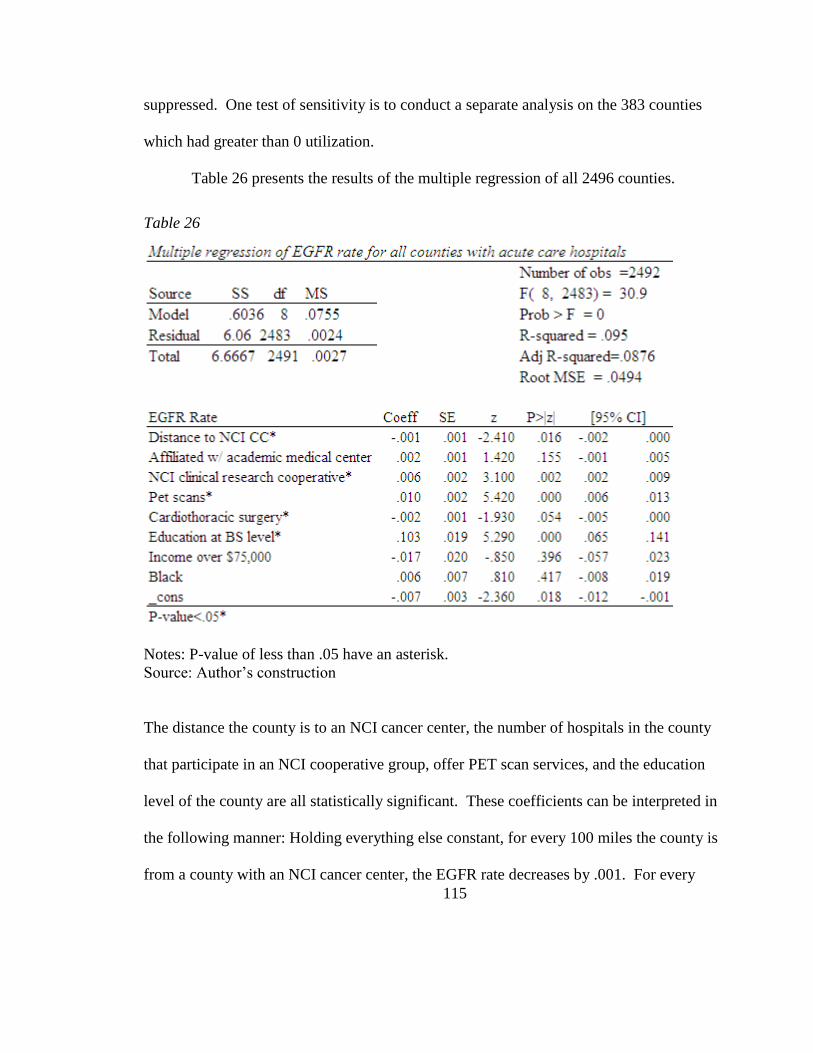
115
suppressed. One test of sensitivity is to conduct a separate analysis on the 383 counties
which had greater than 0 utilization.
Table 26 presents the results of the multiple regression of all 2496 counties.
Table 26
Notes: P-value of less than .05 have an asterisk.
Source: Author’s construction
The distance the county is to an NCI cancer center, the number of hospitals in the county
that participate in an NCI cooperative group, offer PET scan services, and the education
level of the county are all statistically significant. These coefficients can be interpreted in
the following manner: Holding everything else constant, for every 100 miles the county is
from a county with an NCI cancer center, the EGFR rate decreases by .001. For every
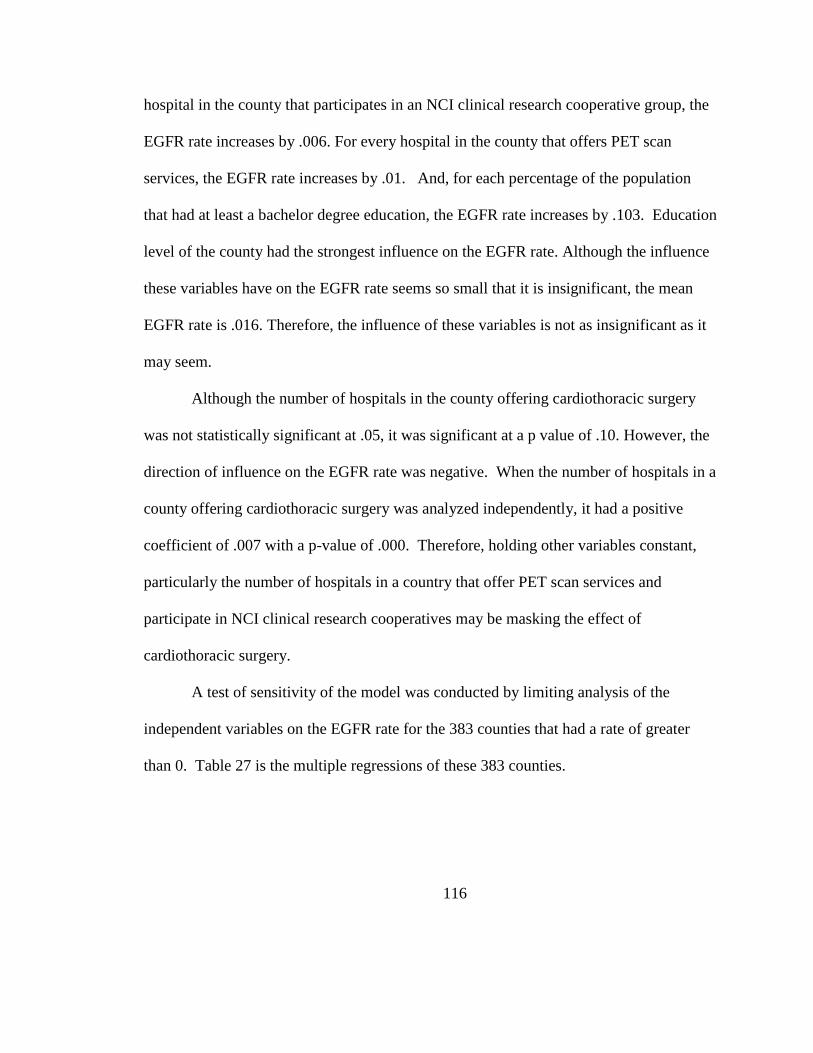
116
hospital in the county that participates in an NCI clinical research cooperative group, the
EGFR rate increases by .006. For every hospital in the county that offers PET scan
services, the EGFR rate increases by .01. And, for each percentage of the population
that had at least a bachelor degree education, the EGFR rate increases by .103. Education
level of the county had the strongest influence on the EGFR rate. Although the influence
these variables have on the EGFR rate seems so small that it is insignificant, the mean
EGFR rate is .016. Therefore, the influence of these variables is not as insignificant as it
may seem.
Although the number of hospitals in the county offering cardiothoracic surgery
was not statistically significant at .05, it was significant at a p value of .10. However, the
direction of influence on the EGFR rate was negative. When the number of hospitals in a
county offering cardiothoracic surgery was analyzed independently, it had a positive
coefficient of .007 with a p-value of .000. Therefore, holding other variables constant,
particularly the number of hospitals in a country that offer PET scan services and
participate in NCI clinical research cooperatives may be masking the effect of
cardiothoracic surgery.
A test of sensitivity of the model was conducted by limiting analysis of the
independent variables on the EGFR rate for the 383 counties that had a rate of greater
than 0. Table 27 is the multiple regressions of these 383 counties.
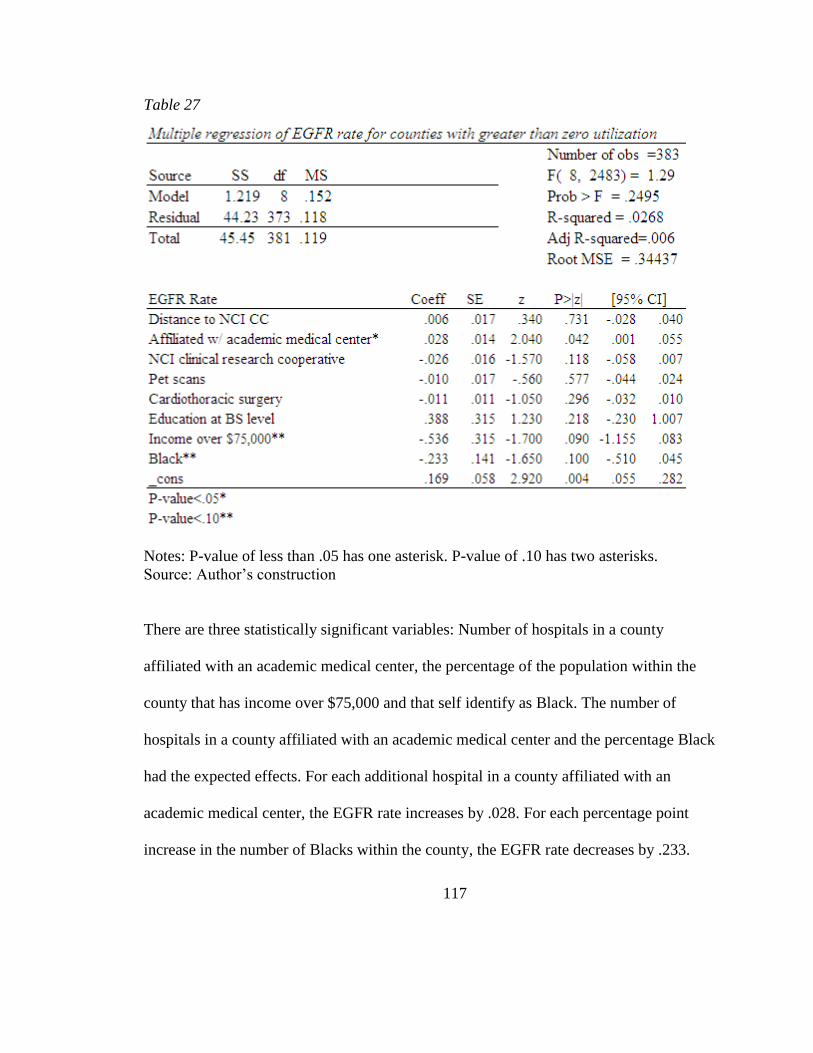
117
Table 27
Notes: P-value of less than .05 has one asterisk. P-value of .10 has two asterisks.
Source: Author’s construction
There are three statistically significant variables: Number of hospitals in a county
affiliated with an academic medical center, the percentage of the population within the
county that has income over $75,000 and that self identify as Black. The number of
hospitals in a county affiliated with an academic medical center and the percentage Black
had the expected effects. For each additional hospital in a county affiliated with an
academic medical center, the EGFR rate increases by .028. For each percentage point
increase in the number of Blacks within the county, the EGFR rate decreases by .233.
118
However, for each percentage increase in the number of people reporting income over
$75,000, had a decrease in the EGFR rate by .536. This variable may indicating that lung
cancer patients that live in counties which have high incomes may be more likely to
travel outside their county to obtain care at an NCI cancer center, where the EGFR assay
utilization rate is not captured in this model. Alternatively, it could indicate that counties
with high income also have lower smoking rates and lower numbers of lung cancer cases.
However, this should be capturing in the EGFR rate.
There are several factors that need to be noted about this model. The R-squared is
very low in both analyses. The model in Table 26, all counties with acute care hospitals,
explains .095% of the EGFR utilization rate. Table 27, the model analyzing just the
counties with greater than 0 utilization rate, explained approximately 3% of the model.
This indicates that the independent variables taken together are a weak predictor of the
EGFR utilization rate, despite having a statistically significant p values. This is not
entirely unexpected given the lack of data from NCI CCs, the underutilization of the
assay overall, and the fact that lung cancer incidence, which should be the most
significant causal factor, was not statistically significant.
119
CHAPTER 5
Conclusions and implications
The primary objectives of this analysis were to:
1) Identify institutional and regional factors that contributed to the adoption and
utilization of the EGFR assay. Equation 2 of the model measured adoption of the
EGFR assay. It was the most successful model demonstrating that several
hypothesized institutional characteristics were predictors of the EGFR assay. These
include an institution participating in an NCI clinical research cooperative group,
offering cardiothoracic surgery, chemotherapy, and PET scan services, and affiliation
with an academic medical center. Distance to an NCI CC was a statistically
significant variable but the negative effect it had on likelihood the institution ordered
the EGFR assay was not as strong as originally hypothesized. From a policy
perspective, the most interesting finding related to this objective was the success that
the NCI clinical research cooperative groups appear to have in diffusion knowledge
from the NCI CC to the surrounding communities.
2) Elucidate structural factors that may contribute to differences in access to this
technology. This analysis clearly illustrated that institutions operating within non
metropolitan counties are unlikely to order the EGFR assay. This finding should be
investigated when patient level data is analyzed to determine whether patients with
lung cancer who live in non metropolitan counties are obtaining lower quality lung
120
cancer care. Another structural factor illustrated in this analysis is that counties with a
higher percentage of residents with college education are more likely to have an NCI
CC located within their boundaries and are also more likely to have an institution that
has ordered the EGFR assay, even when all other variables are factored in the model.
These findings are consistent with many of the recent findings by the Dartmouth
Atlas group discussed in the background and systematic review.
3) Examine potential implications that differential rates of adoption have for poor and
minority NSCLC patients. As mentioned in the methodological challenges, one of the
challenges in conducting any geographic analysis of healthcare utilization is that
patients, particularly those with serious illnesses, may cross geographic boundaries to
seek better care. Furthermore, when the data is at the institutional and county level, it
is not really possible to draw conclusions about patient level variables. Given that
NCI CCs locate in metropolitan counties that have large minority populations living
in the urban centers, without analyzing patient level data, it is impossible to prove that
Blacks are not getting access to the EGFR assay, even if there is a strong indication in
the clinical trials literature. These methodological problems underscore the
importance of conducting an analysis of patient access to lung tumor genotyping
using the Medicare claims data. The vast majority of lung cancer patients are
Medicare patients. Therefore, analysis of the 331,000 lung cancer patients Medicare
claims file will provide a comprehensive analysis of quality of lung cancer care and
variable driving access to personalized cancer care.
121
4) One of the most significant findings of this analysis was that the low utilization rate
of the EGFR assay indicates a lack of implementation of evidenced based guidelines.
ASCO and NCCN guidelines recommend tumors of certain lung cancer patients to be
analyzed for an EGFR mutation. Nursing, as administrators, educators, researchers,
policy analysts, and patient advocates play an important role in encouraging
institutions in which they work to implement and follow evidence based clinical
practice guidelines. The increasing complexity of cancer genomics and the pace of
changes make it difficult for oncologists, who are already overburdened and facing a
shortage, to be adequately and fully informed about the most recent changes in
guidelines surrounding molecular diagnostic tests. Advanced practice and oncology
nurses will be playing an increasingly important role in helping patients get the
highest quality care possible. Care that is based on evidence not anecdotal beliefs.
By understanding the process of diffusion, nursing will be in a unique position to
benefit patients and the profession by considering innovations in the profession that
will solve some of the problems associated a shortage of oncologists, particularly in
non metropolitan counties.
It appears as though Genzyme Genetics took a traditional approach toward
marketing the EGFR assay through physician channels. Given the role of physicians as
agent to the patient, this was probably the path most companies would have taken.
However, when physicians are reluctant to change practice patterns, even in the face of
evidence based guidelines encouraging them to do so, incrementalism may stop being the
122
most effective approach. When patients and their advocates are educated and informed
about innovations, it may result in faster, more disruptive innovation – particularly if
there are strong patient advocate groups like the breast cancer advocate groups.
There are no regulatory or reimbursement barriers that explain the slow and
inadequate diffusion of the EGFR assay. There appears to be either a lack of knowledge
about the innovation, among oncologists and surgeons, in addition to a lack of adherence
to clinical practice guidelines outlining the best steps to diagnosis and treat lung cancer
patients. This analysis suggests that only 15% of lung cancer patients are benefitting from
this important advance in the diagnosis and treatment of lung cancer.
123
REFERENCES
Adams-Campbell, L. L., Ahaghotu, C., Gaskins, M., Dawkins, F. W., Smoot, D., Polk, O.
DeWitty, R. L. (2004). Enrollment of African Americans onto clinical treatment
trials: study design barriers. Journal of Clinical Oncology : Official Journal of the
American Society of Clinical Oncology, 22(4), 730-734.
doi:10.1200/JCO.2004.03.160
Advani, A., Goldstein, M., & Musen, M. A. (2002). A framework for evidence-adaptive
quality assessment that unifies guideline-based and performance-indicator
approaches. Proceedings / AMIA ...Annual Symposium.AMIA Symposium, , 2-6.
Alberg, A. J., Ford, J. G., Samet, J. M., & American College of Chest Physicians. (2007).
Epidemiology of lung cancer: ACCP evidence-based clinical practice guidelines
(2nd edition). Chest, 132(3 Suppl), 29S-55S. doi:10.1378/chest.07-1347
Bach, P. B., Cramer, L. D., Warren, J. L., & Begg, C. B. (1999). Racial differences in the
treatment of early-stage lung cancer. The New England Journal of Medicine,
341(16), 1198-1205. doi:10.1056/NEJM199910143411606 [doi]
Blackstock, A. W., Herndon, J. E.,2nd, Paskett, E. D., Miller, A. A., Lathan, C., Niell, H.
B., . . . Cancer and Leukemia Group B. (2006). Similar outcomes between African
American and non-African American patients with extensive-stage small-cell lung
carcinoma: report from the Cancer and Leukemia Group B. Journal of Clinical
Oncology : Official Journal of the American Society of Clinical Oncology, 24(3),
407-412. doi:JCO.2005.02.1436 [pii]; 10.1200/JCO.2005.02.1436 [doi]
Calvo, E., & Baselga, J. (2006). Ethnic Differences in Response to Epidermal Growth
Factor Receptor Tyrosine Kinase Inhibitors. Journal of Clinical Oncology, 24(14),
2158-2163. doi:10.1200/JCO.2006.06.5961
Christensen, C. M., & Raynor, M. E. (2003). The innovator's solution: creating and
sustaining successful growth. Boston, Massachusetts: Harvard Business School
Press.
Coleman, JS. Katz, E. Menzel, H. (1966). Medical Innovation. A Diffusion Study.
Indianapolis, IN: The Bobbs-Merrill Company, Inc.
124
Company press release.Genzyme announces sublicense agreement with DxS. Retrieved
September 20, 2011, from
http://www.laboratorytalk.com/news/dxs/dxs111.html#ixzz1fCm7JKpI
D'Angelo, S. P., Pietanza, M. C., Johnson, M. L., Riely, G. J., Miller, V. A., Sima, C. S., .
. . Kris, M. G. (2011). Incidence of EGFR Exon 19 Deletions and L858R in Tumor
Specimens From Men and Cigarette Smokers With Lung Adenocarcinomas. Journal
of Clinical Oncology, 29(15), 2066-2070. doi:10.1200/JCO.2010.32.6181
Eberhard, D. A., Johnson, B. E., Amler, L. C., Goddard, A. D., Heldens, S. L., Herbst, R.
S., . . . Hillan, K. J. (2005). Mutations in the Epidermal Growth Factor Receptor and
in KRAS Are Predictive and Prognostic Indicators in Patients With Non-Small-Cell
Lung Cancer Treated With Chemotherapy Alone and in Combination With Erlotinib.
Journal of Clinical Oncology, 23(25), 5900-5909. doi:10.1200/JCO.2005.02.857
Ettinger, D. S., Akerley, W., Bepler, G., Blum, M. G., Chang, A., Cheney, R. T., . . .
NCCN Non-Small Cell Lung Cancer Panel Members. (2010). Non-small cell lung
cancer. J.Natl.Compr.Canc Netw., 8(7), 740-801. doi:8/7/740 [pii]
Fukuoka, M., Yano, S., Giaccone, G., Tamura, T., Nakagawa, K., Douillard, J., . . .
Baselga, J. (2003). Multi-Institutional Randomized Phase II Trial of Gefitinib for
Previously Treated Patients With Advanced Non–Small-Cell Lung Cancer. Journal
of Clinical Oncology, 21(12), 2237-2246. doi:10.1200/JCO.2003.10.038
Genzyme Genetics.Genzyme Launches Exclusive Lung Cancer Test. Retrieved 12/4,
2011, from http://www.genzyme.com/corp/investors/GENZ%20PR-092705.asp
Greenhalgh, T., Robert, G., & Bate, P. (2008). Diffusion of Innovations in Health Service
Organisations : A Systematic Literature Review. Chichester, , GBR: Wiley.
Greenwald, H. P., Polissar, N. L., Borgatta, E. F., McCorkle, R., & Goodman, G. (1998).
Social factors, treatment, and survival in early-stage non-small cell lung cancer.
American Journal of Public Health, 88(11), 1681-1684.
Gross, C. P., Herrin, J., Wong, N., & Krumholz, H. M. (2005). Enrolling older persons in
cancer trials: the effect of sociodemographic, protocol, and recruitment center
characteristics. Journal of Clinical Oncology : Official Journal of the American
Society of Clinical Oncology, 23(21), 4755-4763. doi:10.1200/JCO.2005.14.365
Gross, C. P., Smith, B. D., Wolf, E., & Andersen, M. (2008). Racial disparities in cancer
therapy: did the gap narrow between 1992 and 2002? Cancer, 112(4), 900-908.
doi:10.1002/cncr.23228 [doi]
125
Hamburg, M. A., & Collins, F. S. (2010). The path to personalized medicine. The New
England Journal of Medicine, 363(4), 301-304. doi:10.1056/NEJMp1006304
Hernandez, L. M., Institute of Medicine (U.S.). Roundtable on Translating Genomic-
Based Research for Health. & Institute of Medicine (U.S.). Board on Health
Sciences Policy. (2008). Diffusion and use of genomic innovations in health and
medicine workshop summary. Retrieved
Iltis, A. S. (2005). Third-party payers and the cost of biomedical research. Kennedy
Institute of Ethics Journal, 15(2), 135-160.
Jackman, D. M., Yeap, B. Y., Lindeman, N. I., Fidias, P., Rabin, M. S., Temel, J., . . .
Janne, P. A. (2007). Phase II Clinical Trial of Chemotherapy-Naive Patients >= 70
Years of Age Treated With Erlotinib for Advanced Non-Small-Cell Lung Cancer.
Journal of Clinical Oncology, 25(7), 760-766. doi:10.1200/JCO.2007.15.6695
Jemal, A., Thun, M. J., Ries, L. A., Howe, H. L., Weir, H. K., Center, M. M., . . .
Edwards, B. K. (2008). Annual report to the nation on the status of cancer, 1975-
2005, featuring trends in lung cancer, tobacco use, and tobacco control. Journal of
the National Cancer Institute, 100(23), 1672-1694. doi:10.1093/jnci/djn389
Jemal, A., Siegel, R., Xu, J., & Ward, E. (2010). Cancer Statistics, 2010. CA: A Cancer
Journal for Clinicians, doi:10.3322/caac.20073
Karami, S., Young, H. A., & Henson, D. E. (2007). Earlier age at diagnosis: another
dimension in cancer disparity? Cancer Detection and Prevention, 31(1), 29-34.
doi:S0361-090X(06)00228-5 [pii]; 10.1016/j.cdp.2006.11.004 [doi]
Kawamoto, T., Sato, J. D., Le, A., Polikoff, J., Sato, G. H., & Mendelsohn, J. (1983).
Growth stimulation of A431 cells by epidermal growth factor: identification of high-
affinity receptors for epidermal growth factor by an anti-receptor monoclonal
antibody. Proceedings of the National Academy of Sciences of the United States of
America, 80(5), 1337-1341.
Keating, P., & Cambrosio, A. (2002). From screening to clinical research: the cure of
leukemia and the early development of the cooperative oncology groups, 1955-1966.
Bulletin of the History of Medicine, 76(2), 299-334.
126
Killien, M., Bigby, J. A., Champion, V., Fernandez-Repollet, E., Jackson, R. D.,
Kagawa-Singer, M., . . . Prout, M. (2000). Involving minority and underrepresented
women in clinical trials: the National Centers of Excellence in Women's Health.
Journal of Women's Health & Gender-Based Medicine, 9(10), 1061-1070.
doi:10.1089/152460900445974
Kwak, E. L., Bang, Y. J., Camidge, D. R., Shaw, A. T., Solomon, B., Maki, R. G., . . .
Iafrate, A. J. (2010). Anaplastic lymphoma kinase inhibition in non-small-cell lung
cancer. The New England Journal of Medicine, 363(18), 1693-1703.
doi:10.1056/NEJMoa1006448 [doi]
Lathan, C. S., Neville, B. A., & Earle, C. C. (2006). The effect of race on invasive
staging and surgery in non-small-cell lung cancer. Journal of Clinical Oncology :
Official Journal of the American Society of Clinical Oncology, 24(3), 413-418.
doi:JCO.2005.02.1758 [pii]; 10.1200/JCO.2005.02.1758 [doi]
Leidner, R. S., Fu, P., Clifford, B., Hamdan, A., Jin, C., Eisenberg, R., . . . Halmos, B.
(2009). Genetic Abnormalities of the EGFR Pathway in African American Patients
With Non-Small-Cell Lung Cancer. Journal of Clinical Oncology, 27(33), 5620-
5626. doi:10.1200/JCO.2007.15.6695
Lynch, T. J., Bell, D. W., Sordella, R., Gurubhagavatula, S., Okimoto, R. A., Brannigan,
B. W., . . . Haber, D. A. (2004). Activating mutations in the epidermal growth factor
receptor underlying responsiveness of non-small-cell lung cancer to gefitinib. The
New England Journal of Medicine, 350(21), 2129-2139.
doi:10.1056/NEJMoa040938
McGlynn, E. A., Asch, S. M., Adams, J., Keesey, J., Hicks, J., DeCristofaro, A., & Kerr,
E. A. (2003). The quality of health care delivered to adults in the United States. The
New England Journal of Medicine, 348(26), 2635-2645.
doi:10.1056/NEJMsa022615
Mok, T. S. K., Wu, Y., Yu, C., Zhou, C., Chen, Y., Zhang, L., . . . Lee, J. (2009).
Randomized, Placebo-Controlled, Phase II Study of Sequential Erlotinib and
Chemotherapy As First-Line Treatment for Advanced Non-Small-Cell Lung Cancer.
Journal of Clinical Oncology, 27(30), 5080-5087. doi:10.1200/JCO.2007.15.6695
Moore, G. A. (1991). Crossing the Chasm. New York: New York: Harper Collins.
127
Murthy, V. H., Krumholz, H. M., & Gross, C. P. (2004). Participation in cancer clinical
trials: race-, sex-, and age-based disparities. JAMA : The Journal of the American
Medical Association, 291(22), 2720-2726. doi:10.1001/jama.291.22.2720 [doi];
291/22/2720 [pii]
Newman, L. A., Hurd, T., Leitch, M., Kuerer, H. M., Diehl, K., Lucci, A., . . . Wells, S.
A. (2004). A report on accrual rates for elderly and minority-ethnicity cancer
patients to clinical trials of the American College of Surgeons Oncology Group.
Journal of the American College of Surgeons, 199(4), 644-651.
doi:10.1016/j.jamcollsurg.2004.05.282 [doi]; S1072-7515(04)00943-3 [pii]
Onega, T., Duell, E. J., Shi, X., Demidenko, E., & Goodman, D. C. (2010). Race versus
place of service in mortality among medicare beneficiaries with cancer. Cancer,
116(11), 2698-2706. doi:10.1002/cncr.25097
Paez, J. G., Janne, P. A., Lee, J. C., Tracy, S., Greulich, H., Gabriel, S., . . . Meyerson, M.
(2004). EGFR mutations in lung cancer: correlation with clinical response to
gefitinib therapy. Science (New York, N.Y.), 304(5676), 1497-1500.
doi:10.1126/science.1099314
Pao, W., & Girard, N. (2011). New driver mutations in non-small-cell lung cancer. The
Lancet Oncology, 12(2), 175-180. doi:10.1016/S1470-2045(10)70087-5
Pao, W., & Miller, V. A. (2005). Epidermal Growth Factor Receptor Mutations, Small-
Molecule Kinase Inhibitors, and Non–Small-Cell Lung Cancer: Current Knowledge
and Future Directions. Journal of Clinical Oncology, 23(11), 2556-2568.
doi:10.1200/JCO.2005.07.799
Parkin, D. M., Bray, F., Ferlay, J., & Pisani, P. (2005). Global cancer statistics, 2002. CA:
A Cancer Journal for Clinicians, 55(2), 74-108. doi:55/2/74 [pii]
Ries LAG, Melbert D, Krapcho M, Stinchcomb DG, Howlader N, Horner MJ, Mariotto
A, Miller BA, Feuer EJ, Altekruse SF, Lewis DR, Clegg L, Eisner MP, Reichman
M, Edwards BK. (2008). SEER Cancer Statistics Review, 1975–2005.
Rogers, E. M. (1962). Diffusion of Innovations. New York, NY: Basic Books
Schiller, J. H., Harrington, D., Belani, C. P., Langer, C., Sandler, A., Krook, J., . . .
Eastern Cooperative Oncology Group. (2002). Comparison of four chemotherapy
regimens for advanced non-small-cell lung cancer. The New England Journal of
Medicine, 346(2), 92-98. doi:10.1056/NEJMoa011954 [doi]; 346/2/92 [pii]
128
Shavers, V. L., Lynch, C. F., & Burmeister, L. F. (2002). Racial differences in factors
that influence the willingness to participate in medical research studies. Annals of
Epidemiology, 12(4), 248-256.
Shepherd, F. A., Rodrigues Pereira, J., Ciuleanu, T., Tan, E. H., Hirsh, V., Thongprasert,
S., . . . National Cancer Institute of Canada Clinical Trials Group. (2005). Erlotinib
in previously treated non-small-cell lung cancer. The New England Journal of
Medicine, 353(2), 123-132. doi:10.1056/NEJMoa050753
Soleimani, F., & Zenios, S. (2011). Disrupting incrementalism in health care innovation.
Annals of Surgery, 254(2), 203-208. doi:10.1097/SLA.0b013e3182251538
Starr, P. (1982). The Social Transformation of American Medicine. New York, NY: Basic
Books.
Swazey, J. P., & Fox, R. C. (2004). Remembering the "golden years" of patient-oriented
clinical research: a collective conversation. Perspectives in Biology and Medicine,
47(4), 487-504.
Szlubowski, A., Zielinski, M., Soja, J., Annema, J. T., Sosnicki, W., Jakubiak, M., . . .
Cmiel, A. (2010). A combined approach of endobronchial and endoscopic
ultrasound-guided needle aspiration in the radiologically normal mediastinum in
non-small-cell lung cancer staging--a prospective trial. European Journal of Cardio-
Thoracic Surgery : Official Journal of the European Association for Cardio-
Thoracic Surgery, 37(5), 1175-1179. doi:10.1016/j.ejcts.2009.11.015
Tol, J., Koopman, M., Cats, A., Rodenburg, C. J., Creemers, G. J., Schrama, J. G., . . .
Punt, C. J. (2009). Chemotherapy, bevacizumab, and cetuximab in metastatic
colorectal cancer. The New England Journal of Medicine, 360(6), 563-572.
doi:360/6/563 [pii]; 10.1056/NEJMoa0808268 [doi]
Welch, H. G., Sharp, S. M., Gottlieb, D. J., Skinner, J. S., & Wennberg, J. E. (2011).
Geographic variation in diagnosis frequency and risk of death among Medicare
beneficiaries. JAMA : The Journal of the American Medical Association, 305(11),
1113-1118. doi:10.1001/jama.2011.307
Yang, S. H., Mechanic, L. E., Yang, P., Landi, M. T., Bowman, E. D., Wampfler, J., . . .
Jen, J. (2005). Mutations in the tyrosine kinase domain of the epidermal growth
factor receptor in non-small cell lung cancer. Clinical Cancer Research : An Official
Journal of the American Association for Cancer Research, 11(6), 2106-2110.
doi:11/6/2106 [pii]; 10.1158/1078-0432.CCR-04-1853 [doi]

129
Zerhouni, E. A. (2005). Translational and Clinical Science — Time for a New Vision. N
Engl J Med, 353(15), 1621-1623. doi:10.1056/NEJMsb053723