Embed Size (px)
Citation preview

Int. J. Peptide hotein Res. 24, 1984, 168-179
Differential equation model to study dynamic behaviour of globular proteins
P.K. PONNUSWAMY and R. BHASKARAN
Department of Physics, Bharathidasan University, Tiruchirapalli, Tamilnadu, India
Received 16 September, accepted for publication 21 December 1983
By regarding the globular proteins as spheroidal shaped bodies of uniform density, a differential equation model to study their low amplitude fluctuations was developed. It was then applied to the crystal structures of pancreatic trypsin inhibitor and ferrocytochrome c. The results were tested by comparing them with those of the dynamic simulation and temperature factor studies on the same proteins. Key words: bovine pancreatic trypsin inhibitor; dynamics; globular proteins; low frequency
fluctuations; tuna ferrocytochrome c
One remarkable property of biomacromolecules is their capacity to form a good number of secondary bonds strong enough to fuc different conformations but weak enough to allow configurational and conformational transitions in the presence of slight perturbations. This ability of motion with a participation of specific spatial parts enables the globular proteins to perform a variety of functional phenomena such as ligand binding, enzyme-substrate com- plexing and electron transfer. Atomic positions determined by X-ray diffraction studies rep- resent only the average equilibrium geometry of the molecule and information as to the extent of positional fluctuations of the atoms (groups) must be extracted from other kinds of studies. Only recently, studies have been directed toward the dynamic aspects of globular protein structures (ref. 1 for review). Potential sur- face (2-3), vibrational ( 4 4 , and molecular dynamics calculations(7-11) are the three main kinds of theoretical approaches applied rigor- ously in this direction. The temperature factors of the atoms in the crystals of the protein
168
molecules also provide information (12-16). These studies, although they have added con- siderable knowledge about the dynamic behaviour of a few globular proteins, are time consuming and we need simpler models to make a comprehensive study of a variety of globular proteins so as quantitatively to inter- pret the amplitudes of fluctuation in atomic- or residue-positions with reference to the native conformational states. As a part of our ongoing programmes to investigate the conformational and folding characteristics of globular pro- teins (17-20) we have recently directed our attention towards the development of a simpler procedure to study the dynamic aspect, the preliminary results of which were reported elsewhere (21). In this procedure we treat the globular protein as a spheroidal structure, set up dynamic differential equations for it, and solve them to find out the nature of the space and time parts of the local fluctuations, This method provides valuable results, consuming only very little computer time compared to other protein dynamics study techniques used

Dynamics of globular proteins
body located at the point (x, y, z) along the radial direction r could be given as
at present, In this article we describe our model in detail and apply it to two proteins, bovine pancreatic trypsin inhibitor (BPTI), and tuna ferrocytochrome c (CYTC). These two proteins have already been studied by molecular dynamics (7, 10) and temperature factor approaches (15, 22). We compare our results with those and verify our method.
GLOBULAR PROTEINS-ELASTIC DEFORM ABLE ISOTROPIC BODIES
A globular protein, as determined by X-ray diffraction study, exhibits a well-defined, densely packed average structure. As stated in the above section, the protein also exhibits a certain amount of flexibility in its normal func- tional state, thus being not entirely rigid, but 'breathing' a little about its equilibrium state. We shall confine ourselves here to the fluctu- ations which affect the relative distances between various parts of the protein in such a way that the topological connection between them is maintained, but the parts fluctuate in a manner slightly deviating from their original positions and then return to the original positions from the new ones. Such a behaviour permits us to regard the globular protein as a continuous body with a definite shape and elastic properties (4, 6). For such an elastic deformable isotropic body, we can set up dynamic differential equations of motion in accordance with the classical theoretical con- siderations and study their solutions so as to bring out the variations of the fluctuation quantitatively, both in the space-plane and in the phase-plane dimensions.
The frequency of the fundamental mode of a class of fluctuations similar to the ones described above was calculated by Suezaki & Gij (4) to be 26cm-', which was in good agreement with the laser Raman peaks observed (23) for native achymotrypsin and pepsin at the low frequency region around 30 cm-' .
DYNAMIC DIFFERENTIAL EQUATIONS
According to the classical theory, the differ- ential equation of motion of an elementary mass pdxdydz of an elastic deformable isotropic
where X and p are the Lame's constants (related to Poisson's ratio and Young's modulus of the material), A the sum of the longitudinal strain components along the three directions, p the density of the body, R the body force, and Ur the displacement along the radial direction (24). When the protein is considered in a prolate spheroidal shape, the above equation transforms to
(A + 2p) sinh E cosh f (8 UE/aEz)
+ (X + 2p) cosh't (aUt/ag) + [X sinh f cosh 6 - (A + 2p) coth 6 coshzt
- 2(h + p) tanh sinh't] U f
+ pR = p(az UE/atz) (2)
after converting the Cartesian coordinates to prolate spheroidal coordinates by the relations,
x = asinhf sinv cos@,
y = a sinh [ sin q sin 4, and
z = acoshEcosq
for a situation a = 1 and q = 90' (along the radial direction).
A possibie solution U[ for eqn. 2 may be assumed to be in two parts, one the time part specified by a cosine term, and the other the space part specified by a function u(U, which depends only on the radial component 5 of the prolate spheroidal body of the protein; let the solution be of the form
UE = A cos ( a t + €0) u([) (3)
Substituting eqn. 3 in eqn, 2 and simplifying, we obtain the differential equation,
dZ u du - + coth [ - dEZ d t
169

P.K. Ponnuswamy and R. Bhaskaran
+ [B - coth' 5 - C tanh' f
f D sech f cosech t ] u = 0 (4)
where
B = h/(X + 2 p )
c = 2(ji + X)/(X + 2p)
D = p a z /(A + 2p)
Here w is the angular frequency of the oscil- latory fluctuation mentioned already. The above equation was solved numerically by the Runge-Kutta method for two simultaneous first order equations. For this purpose, eqn. 4 was split into
and
* = - p c o t h f - [B-cothZf-CtanhZE d t
+ D sech C: cosechf] u = Fz(5, u, p)
( 6 ) Eqn. 5 indicates that the differential coef- ficient of displacement of an elementary mass with respect to its position from the centroid of the protein is equal to the slope of the space- displacement relation and eqn. 6 defines the differential coefficient of the slope of the space- displacement relation of an element in protein with respect to its radial position.
SELECTION OF PARAMETERS
In selecting the Lame's constants X and p for our present study, Poisson's ratio and Young's modulus of the globular proteins were taken (4) to be 0.33 and 1.0 x 10" dyneslcm', respec- tively. The density of the proteins p was taken to be 1.0. For these values of the above pa- rameters, the constants B, C and the value of D were calculated for a frequency of vibration corresponding to the wave number 26 cm-I .
This value of the frequency of vibration corresponds to the fundamental mode of the protein, achymotrypsin. As no experimental or theoretical information is available for the
frequencies of the fundamental modes in BPTI and CYTC, we took the value of a- chymotrypsin for these proteins also as the best approximation. We performed our calcu- lations with wave numbers 20cm-' and 30 cm-' , but found no significant variations in our results. This supported our view that the frequencies of fundamental modes in globular proteins of approximately the same size will be within a narrow range. Our major aim in this work is to compare our results with those of molecular dynamic (7, 10) and temperature factor studies (15, 22). So far, unfortunately, the latter kind of study has not been carried out on a-chymotrypsin, and hence we took BPTI and CYTC, for which such studies have been performed.
The initial values of the functions F1 and F2 of eqns. 5 and 6 were calculated by considering a set of initial values for the variables f , u and p; the initial values of t and u characterise the fluctuational condition of the centroid of the protein, whereas the initial value of p charac- terises the fluctuational condition of the outermost residue on the surface of the protein. Subsequent values of F1 and Fz were computed by considering values of [ at regular intervals of 0.2A upto the maximum value of the radius vector r, from which we calculate the follow-up values of u and p, respectively. After obtaining a set of u and p values for different values o f t upto the maximum of r, graphs were drawn ( f vs u and u vs p) in the space-plane and in the phase-plane for analysis (the phase-plane plots are not relevant for the present purpose and hence they will not be described in this article; for a discussion on these plots see ref. 21).
The boundary values of the radius vector r (hence t ) and the displacement u were deter- mined as follows: From the X-ray determined atomic coordinates, the centroids of the amino acid residues and the centroid of the protein mass were calculated. The distance of the farthest residue-centroid from the protein- centroid was taken to be the length of the radius vector r. Under ordinary temperatures, the molecular parts in the neighbourhood of the protein-centroid and those on the surface of the protein are expected to fluctuate, respect- ively, by very small and large amplitudes; hence we assumed that the part of the protein-
170

Dynamics of globular proteins
centroid would experience no fluctuation and the parts on the surface would have fluctuations 10% of the maximum r value in the protein. The outer limit of u(= r/lOA) was the value suggested by McCammon et al. (7). Thus, at [ = O , u = O and at [ = r, u = r / l O were the fluctuational boundary conditions adopted in evaluating F I and F2 .
Here, to meet the condition that the protein centroid fluctuates minimally, the initial value of u was taken to be zero; however, in reality we cannot have the ideal situation in zero dis- placement, and hence a displacement value close to zero was assumed when fixing the initial p value: the initial value of p was tried with a starting value of 0.1 and then with increments of 0.1. Then the expected displacement range between the proteincentroid and the centroid of the farthest residue in the protein was arrived at by trial and error by changing the initial values of u and p. The particular initial value of p is obtained for a protein in this kind of iter- ative process, with which we get displacements upto one tenth of the maximum radius-vector values. This initial p value thus becomes a characteristic parameter for the protein.
RESULTS AND DISCUSSION
From the above-mentioned iterative process, the specific initial p values for the two proteins BPTI and CYTC were obtained. Using these p values, the displacements could be obtained along the length of the radius vectors for the proteins and the space-plane plots [ (position from the centroid) YS u (displacement) for them could be constructed. A plot of this kind will vary with the initial value of the slope ‘p’, which in turn is unique for a protein of specific size and internal distribution of amino acid residues, as stated earlier.
The curves in Fig. 1 are the space-plane plots computed for BPTI and CYTC, when they are treated as prolate spheroidal bodies. We note from these curves that the displacement value increases slowly upto the mid value of r , and increases rapidly afterwards. This means that the displacement varies in a nonlinear way going from the centroid to the surface of the protein. Now, by taking the magnitudes of the position vector for the individual residues in
POSTION VECTOR, 5 ( A 1 - FIGURE 1 Space-plane plots for bovine pancreatic trypsin inhibitor and tuna ferrocytochrome c. Points on a curve indicate the extent of displacement (vertical axis) of elements of the protein at their respective radial positions (horizontal axis) from the centroid of the respective protein.
the crystal structures of BPTI and CYTC, the actual displacements for the residues could be obtained from their respective space-plane curves.
Fluctuation plots connecting the sequence numbers and the respective residue displace- ments for the two proteins were then con- structed and they are shown in Fig. 2 (a, b). These plots are comparable to the dynamic plots reported by McCammon et al. (7) for BPTI and by Northrup et al. (10, 11, 15) for CYTC.
FLUCTUATIONS IN BPTI
The unambiguous observation of the fluctu- ational plot for BPTI (Fig. 2a) is the large amplitude fluctuation experienced by the tail (N- and C-) ends of the molecule, because of their obvious freedom for motion, the amino- end lagging behind the carboxyl-end. Secondly, the large peaks observed at and around the residues Leu 6 , Arg 17, Arg 39, Glu 49, Arg 53, Gly 57 and Ala 58 reveal clearly their highly exposed nature.
171

P.K. Ponnuswamy and R. Bhaskaran
v 0 . 2
O P 04[ CYTC
SEQUENCE NUMBER- SEQUENCE NUMBER - FIGURE 2 Residuedisplacement plots for (a) bovine pancreatic trypsin inhibitor and (b) tuna ferrocytochrome c.
As a general pattern, larger displacements are noted for prolines and glycines, which intrinsi- cally appear in bends and loops on the surface. But smaller displacements are observed for Pro 8 and Pro 9, which may be expected due to their involvement in the association with the &sheet structural residues 28-36, by which they get stability via hydrogen bonding and other intra- and inter-chain interactions. The loop region (residue 25-28) connecting the two &sheets exhibits higher displacement peaks. The P-sheet segments show small magnitude fluctuations, the segment 43-46 showing the smallest average displacement because of its buried nature. The displacements of &-helical segments (residues 2-7, 47-56) indicate a
172
moderate fluctuation. A comparison of the fluctuations of 0-sheets and a-helical residues reveals that the &sheets fluctuate less than the a-helices; the interg-chain interaction may be the reason for this behaviour. The lower dis- placement troughs noted for residues Cys 5, Arg20,Phe22,Phe 33, Tyr 35, Asn 44,CysSI and Arg 53 clearly indicate their buriedness. The Cys residues of the disulphide linkages (the pairs 5-55, 14-38, and 30-51) fluctuate only slightly; of these, the exposed pair 14-38 shows higher displacement.
In total, about 60% of the polar residues, with an average displacement of 1.006 A, indi- cate their exposed nature (having contact with aqueous environment) by way of their higher

displacements, and about 70% of the nonpolar residues, with an average displacement of 0.736 A, indicate their appreciable buriedness. The remaining polar and non-polar residues devi- ate from the hydrophilic-exterior/hydrophobic- interior behaviour.
1.0
I @ -
I*
1 - .a 1 . t - a
0 10- 2
P 5
01
p o a -
0 4 -
O R -
COMPARISONS WITH OTHER STUDIES
A comparison was made between the fluctu- ational displacements of the residues in BFTI as computed in the present study and those presented by McCammon et al. (7) through the molecular dynamics method. A scatter diagram was constructed by connecting these two sets of data (Fig. 3a). For this purpose Fig. 2 of the article by McCammon et al. (7) was enlarged and the displacement values were read out. The above scatter plot indicates a good correlation
-
-
-
-
.LVS In
Am n
0 4 0.6 0 0 k 0 1.t k4
MOLECULAR DYNAMICS RESULTS, u ( )-
Dynamics of globular proteins
between the two sets of values, the correlation coefficient, r , being 0.8036. We observe notice- able differences in four places, namely, around residues 14-17, 39, 44 -45 , and 58. The mol- ecular dynamics method yields large displace- ments for Asn 44, Phe 45 and Ala 58, whereas our method yields larger values for Cys 14, Lys 15, Ala 16, Arg 17 and Arg 39. When these deviant residues were omitted from the com- parison, we found the correlation highly significant, with r = 0.9234. The deviant behaviour of the above residues may be due to the following reasons: i) in the molecular dynamics study, only a-carbon positions were
0.2 0.3 0-4 0.8
THERMAL FLUCTUATION RESULTS, -zb < A X > (A)-
FIGURE 3 Scatter plots indicating the agreement between the displacements found for bovine pancreatic trypsin inhibitor in our study and those found by other methods. (a) Molecular dynamics method. (b) Thermal fluctuation method.
173
P.K. Ponnuswamy and R. Bhaskaran
considered whereas in our study the centroids of the residues were used; and ii) the particular picosecond dynamic simulation state of the protein may be somewhat different from the state of the fundamental mode considered by
Next we compared our results for BPTI with those of the rms displacement values calculated from the X-ray crystallographic ‘B’ factors by G6 et al. (22); here again, we found a correlation of r = 0.7030. As in the previous case, when the few deviant residues were excluded, r increased to 0.7908. The scatter plot of these data (Fig. 3b) indicates that there are not many deviating points (residues) with reference to the least squares fitted line, except the point corresponding to the residue 58 (which falls beyond the boundary of the plot and hence isnot shown). In this comparison, it is observed that though the magnitudes of the fluctuation are different, their variations are of a similar nature in both methods.
us.
FLUCTUATIONS IN CYTC
In this protein (fluctuational plot shown in Fig. 2b) all the five turn-segments, 21-24, 32-35,35-38,43-46 and 75-78 show higher displacement peaks, clearly specifying their exposures. In contrast to the above behaviour, all the five a-helical segments show moderate and low fluctuations, Among them, the segment 49-55 shows an average higher displacement in which the peaks found for Asp 50 and Ser 54 clearly indicate their exposed nature. Similarly, all the exposed residues Asp 2, Lys 5 , Lys 25, Lys 39, Lys 73 and Lys 87 show higher displace- ment peaks. The residues Cys 14, Cys 17, His 18, and Met 80 have lower displacements. As pointed out by Northrup et ul. (10, 1 1 , 15) these lower displacements may be due to the linkage of the heam group to the polypeptide chain.
Both the amino and the carboxyl-end residues exhibit higher fluctuations, but in contrast to BF’TI, the aminoend-displacement exceeds that of the carboxyl-end. As for BPTI, about 70% of the polar residues, with an average displacement of 130 A, indicate their exposure, while about 80% of the nonpolar residues, with an average displacement of
174
0.790 A, indicate their buriedness. Thus, it is clear that the deviations from the hydrophobic interior/hydrophilic-exterior concept are less for the interior residues than for the exterior residues.
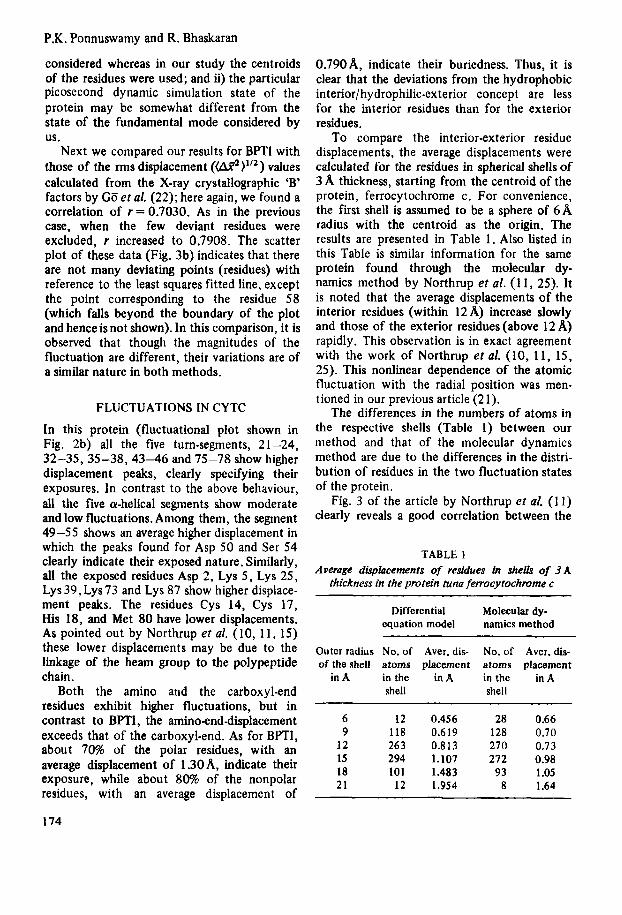
To compare the interior-exterior residue displacements, the average displacements were calculated for the residues in spherical shells of 3 A thickness, starting from the centroid of the protein, ferrocytochrome c. For convenience, the first shell is assumed to be a sphere of 6 A radius with the centroid as the origin. The results are presented in Table 1. Also listed in this Table is similar information for the same protein found through the molecular dy- namics method by Northrup e? al. (1 1 , 25). It is noted that the average displacements of the interior residues (within 12 A) increase slowly and those of the exterior residues (above 12 A) rapidly. This observation is in exact agreement with the work of Northrup e ta l . (10, 11, 15, 25). This nonlinear dependence of the atomic fluctuation with the radial position was men- tioned in our previous article (2 1).
The differences in the numbers of atoms in the respective shells (Table 1) between our method and that of the molecular dynamics method are due to the differences in the distri- bution of residues in the two fluctuation states of the protein.
Fig. 3 of the article by Northrup et al. (1 1) clearly reveals a good correlation between the
TABLE 1 Average displacements of residues in shells of 3 A
thickness in the protein tuna ferrocytochmme c
Differential Molecular dy- equation model namics method
Outer radius No. of Aver. dis- No. of Aver. dis- of the shell atoms placement atoms placement
in A in the in A in the in A shell shell
6 12 0.456 28 0.66 9 118 0.619 128 0.70
12 263 0.813 210 0.13 15 294 1.101 272 0.98 18 101 1.483 93 1.05 21 12 1.954 8 1.64
Dynamics of globular proteins
rapid change for the exterior ones. For example, deviations are noted with reference to the least squares fitted line for the polar residues Lys 25, Glu 44, Lys 72, and Lys 87, and for the residue Gly 7. These residues were omitted in this scatter plot since they fall outside the boundary of the plot. The behaviour of these residues is assumed due to the hydration free space available for the residues to move freely. When these four residues were excluded, the correlation coefficient r was raised to 0.8725. On the other hand, the residues Ala 4 , Lys 5 , Thr 49, Ala 5 1 , Gly 89 and Ser 103 show higher displacements in our study but lower displacements in the molecular dynamics method. This can be explained on the basis of atomic packing effects. The above residues, in the molecular dynamics method, at a particular picosecond dynamic simulation state, might be placed tightly, having buried themselves inside, and hence lower fluctuations might have resulted. But in our case, at the fundamental mode fluctuational state, these residues are observed to be packed by 161, 151, 169, 206 and 174 atomswith the respective average residue-displacements 1.7 15, 1.736, 1.271, 1.267 and 1.403A. Actually, the average number of atoms packing a polar residue is 169, with an average displacement of 1.30A. This clearly shows that the above residues behave like the polar residues. Thus, these comparisons clearly demonstrate the agreement of the results of these two dynamic study techniques.
residue-averaged position fluctuations and the distances of the residues from the protein centroid (or with the nature of the atomic packing in the concentric shells). These authors conclude that the fluctuations of the surface atoms are increased by the reduced atomic packing at the surface and restricted by the covalent linkages that bind the atoms (11). Thus, the results of our study clearly reveal an agreeable trend as far as this protein’s dynamics is concerned.
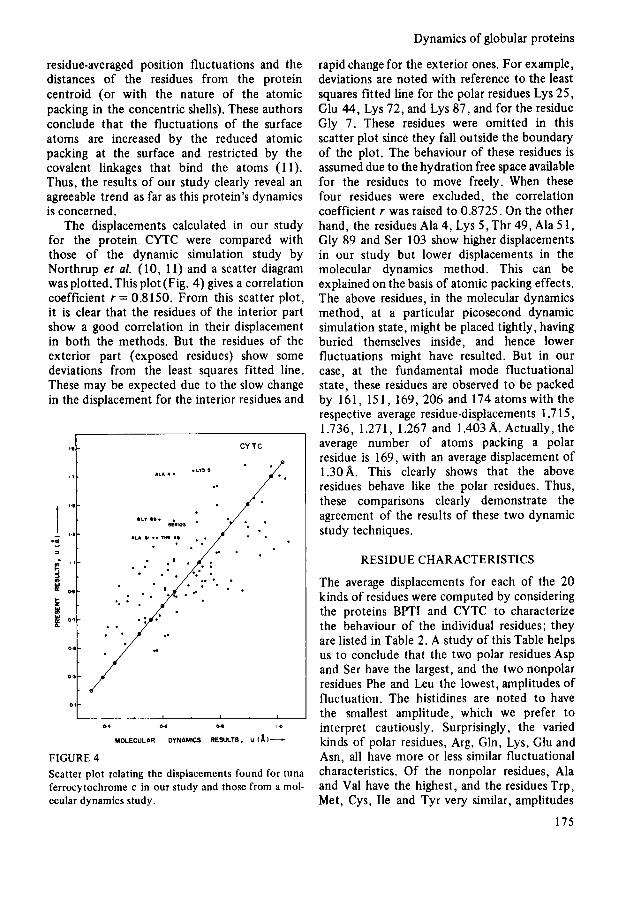
The displacements calculated in our study for the protein CYTC were compared with those of the dynamic simulation study by Northrup et al. (10, 11) and a scatter diagram was plotted. This plot (Fig. 4) gives a correlation coefficient r = 0.8150. From this scatter plot, it is clear that the residues of the interior part show a good correlation in their displacement in both the methods. But the residues of the exterior part (exposed residues) show some deviations from the least squares fitted line. These may be expected due to the slow change in the displacement for the interior residues and
CY TC
L
- 1 “I I..
‘4 .
5 * I - ’ 0 9 -
k . I g 0.1-
0 4 0.. 0- 1.0
MOLECULAR DYNAMICS RESULTS. u tA1-
FIGURE 4 Scatter plot relating the displacements found for tuna ferrocytochrome c in our study and those from a mol- ecular dynamics study.
RESIDUE CHARACTERISTICS
The average displacements for each of the 20 kinds of residues were computed by considering the proteins BPTI and CYTC to characterize the behaviour of the individual residues; they are listed in Table 2. A study of this Table helps us to conclude that the two polar residues Asp and Ser have the largest, and the two nonpolar residues Phe and Leu the lowest, amplitudes of fluctuation. The histidines are noted to have the smallest amplitude, which we prefer to interpret cautiously. Surprisingly, the varied kinds of polar residues, Arg, Gln, Lys, Glu and Asn, all have more or less similar fluctuational characteristics. Of the nonpolar residues, Ala and Val have the highest, and the residues Trp, Met, Cys, Ile and Tyr very similar, amplitudes
175

P.K. Ponnuswamy and R. Bhaskaran
TABLE 2 Average dispbcements of amino acid residues as found
in BPTI and CYTC
Nonpolar residues
Phe Leu Tyr CY s Met ‘b Ile Val Ala
Displace- Polar ments (A) residues
0.605 His 0.679 Asn 0.798 Thr
0.871 C In 0.8 76 Glu 0.940 LY s 1.043 Ser 1.159 ASP
0.844 Arg
Displace- ments (A)
~~
0.849 0.86 1 0.907 1.023 1.109 1.126 1.233 1.262 1.315
Special kinds Pro 0.963 GlY 1.224
of fluctuation. Since we have considered only two small proteins, conclusions about these observations should await further results (see ref. 26, following article).
VALIDITY OF THE PRESENT MODEL
The validity of our model rests on the agreement noted between our results and those obtained by two other dynamic study methods on proteins BPTI and CYTC: i) the radial depen- dence of the fluctuation is clearly evident from Table 1, where we see a slow increase in the fluctuation for the interior atoms and a rapid increase for the exterior atoms of CYTC; this trend has also been observed in the molecular dynamics method (1 1); ii) agreement is noted between our results and those of the tempera- ture factor study (12-16) and molecular dynamics method (7-1 1) regarding the higher displacements observed for the loop regions connecting the secondary structures, the polar, and the exposed residues; iii) agreement is also observed as regards the lower displacements observed for &-helical, p-sheet, buried and nonpolar residues among the different dynamic methods. In this context, it is of importance to distinguish the differential equation approach from the molecular dynamics approach so as to appreciate the results of the present study fully. In the mol- ecular dynamics approach, the equations of
motion for all of the atoms in an assembly are solved simultaneously for a suitable time period, and information is abstracted by analysing the resulting atomic displacements. In the differential equation model, we treat the assembly of the protein molecule in the globular mass-spheroidal-uniform density-approximation and solve the equation to extract information concerning the motion of amino acid residues as per their location from the centroid; thus, it is essentially an analytic type of study rather than a true interatomic potential treatment. Accordingly, while the molecular dynamics study, because of the inclusion of the energy aspect, is applicable even if the protein is highly asymmetric (the protein may be made up of ‘soft’ and ‘hard’ areas with respect to motion), the differential equation method, as it assigns a nonlinear radially centered amplitude of motion, may look as though it does not reflect the true dynamics of the asymmetric protein, since it sees mainly motions of larger amplitude at the large r values and smaller amplitude at and around the core. But this picture of the latter model is not correct and we will show below that the r vs amplitude relation in this model is very realistic under the fluctuating globular mass conditions. In the following section, we test critically the depen- dence of the displacement of the residue on its spatial position and prove that the results of our analytic approach really reflect the behaviour of the protein molecule in all its radial parts.
SPATIAL POSITION VS AMPLITUDE OF FLUCTUATION
To study the dependence of the displacement of a residue on its spatial position in the protein BPTI (20), a correlation analysis was aimed at. Actually a slow change in the displacement for the interior residues and a rapid change for the exterior residues (with respect to the radial position) are noted (Table 1). Thus, the vari- ation in the displacement with respect to the spatial position depends on both the slow and the rapid changes. Due to this dual behaviour, we undertook a curvilinear correlation analysis rather than the linear correlation study. I t is observed from this analysis that the displace-
176

Dynamics of globular proteins
ment varies approximately by the 3/5th power of the spatial position. Least squares analysis (correlation coefficient, r = 0.8754) of the logarithm of the displacement (log u) as a function of the logarithm of the spatial position (log Sp) yielded 0.571 as the slope, indicating a 315 exponent for Sp; the curvilinear equation was u = 1.309(Sp)0."1. A scatter diagram was plotted between the two variables and a least squares line fitted (Fig. 5a) by the equation log u = 0.1 117 + 0.571 log Sp. From this equation, we get a displacement of 0.095 A (in the neighbourhood of zero) for a residue whose spatial position coincides with the protein centroid and thus our assumption of the initial condition is justified. Similarly, for a residue to be positioned on the surface where the spatial position is unity, the displacement is found to be 1.3 1 A as against our boundary condition value for this displacement of 1.94 A. But the average of the displacements of the residues with the largest spatial position (0.99) is found to be 1.25 A, closely agreeing with the value 1.31 A read out from the plot. It is also seen from the plot that there are not many points which deviate from the least squares fitted line (Fig. 5a).
From the above analysis, the deviation from linearity in the variation of the displacement with respect to the spatial position is clearly evident. The same behaviour was noted in the variation of the displacement, with respect to the radial positions of residues, and it was mentioned in our previous article (2 1).
SOLVENT ACCESSIBILITY VS AMPLITUDE OF FLUCTUATION
Since it was observed that the spatial position and the solvent accessibility for a residue correlate well with each other we carried out an investigation on the dependence of the magni- tude of displacement of a residue on its solvent exposure level. A correlation analysis was made between the water accessible surface areas (4) of the amino acid residues in BPTI and their displacement (u) computed in the present study (correlation coefficient, r = 0.6920). A least squares line was fitted by the equation u = 0.0128A, + 0.4748 (Fig. 5b). The line plot implies that the larger the contact area of a
0". :
I O ~ W o y 1 ~ M 0 1 0
ACCESSIBLE SURFACE AREA, A, (;'I - FIGURE 5 Least squares lines fitted for variables (a) logarithm of displacement and logarithm of the spatial position, and (b) displacement and accessible surface area.
residue with the solvent medium, the larger the fluctuation. An analysis also reveals that there is about a 30% possibility of a deviation from the linear relationship, i.e. for a residue possess- ing higher accessible surface area to have a smaller fluctuation and vice versa. This may be expected due to the asymmetry in the shape of the protein. For example, in BPTI, the polar residues, Lys 41, Arg 42, Lys 46 and Asp 53 are found to exhibit lower displacements even though they are positioned on the surface with more highly accessible surface areas.
From the above correlation analysis, it is observed that though there is a non-linear dependence in the variation of the displacement with respect to the spatial position, the variables correlate well. But in the case of the dependence of the displacement with respect to their
177

P.K. Ponnuswamy and R. Bhaskaran
solvent accessibility we observe some deviations (residues mentioned before), due to which they exhibit a reduced correlation. These deviations may occur mainly in kinks and turns in a protein and also in some ‘L’ shaped proteins. Thus our model is more valid for the globular proteins of nearly spherical or spheroidal shapes.
However, in the present form of our model, we have not taken into account the surface atoms’ hydrogen bonding and other kinds of interactions with the solvent medium. This limitation could be overcome by the inclusion of a frictional term for the viscous forces in our calculation. Also, at present we have considered only the state of the fluctuating protein corre- sponding to the fundamental mode. The neighbouring modes may also contribute to the extent of fluctuation of the residues. This aspect is now under investigation.
CONCLUSIONS
We were able to treat a globular protein mol- ecule as a best fitted prolate spheroidal body of specific internal composition for which the classical dynamic differential equation could be set up and solved. The solutions for the funda- mental mode yielded elegant space-plane diagrams for the proteins BPTI and CYTC. From these plots the magnitudes of fluctu- ational displacement for the constituent amino acid residues were obtained with reference to the X-ray determined crystal states. The analysis of the residue displacements provided many facts about the dynamic behaviour of the two proteins. Specifically, we obtained information on
1) the dependence of the fluctuational dis- placement of a residue on its radial position,
2) the higher displacements for the loop regions, polar residues, prolines and glycines, and
3) the smaller displacements for nonpolar residues and residues in the a-helical and &sheet segments.
These results are in good agreement with the conclusions arrived at by McCammon and Karplus groups for BPTI and CYTC by dynamic simulation studies.
The results of the application of this model
for 19 proteins are presented in the accom- panying article.
Work is in progress to deal with different frequencies of modes other than the funda- mental, density variation, and solvent effect in the form of hydration free space (packing effect).
ACKNOWLEDGEMENT
This work was supported by a grant from the Depart- ment of Science and Technology, Government of India to the principal author P.K.P.
1.
2.
3.
4 .
5 .
6 . 7.
8 .
9.
10.
1 1 .
12.
13.
14.
15.
16.
17.
18.
REFERENCES
Karplus, M. & McCammon, J.A. (1981) CRC Crit. Rev. Biochem. 9, 293-349 Noguti, T., G6, N., Ooi, T. & Nishikawa, T. ( 1 98 I ) Biochim. Biophys. Acfa 61 1,93-98 Noguti, T. & G6, N. (1982) Nature 296, 716- 178 Suezaki, Y . & G 6 , N. (1975) fnr. J . Pepride Protein Res. 7, 333-334 Peticolas, W.L. (1978) Merhods Enzymol. 61,
G6, N. (1980) Proc. Japan Acad. 56B, 414-419 McCammon, J.A., Gelin, B.R. & Karplus, M. (1917)Nature 261,585-590 Karplus, M . & McCammon, J.A. (1979) Nature 211,578 Levitt, M. (1980) in Protein Folding (Jaenicke, R., ed.), pp. 17-39, Elsevier/North Holland Biomedical Press, Amsterdam Northrup, S.H., Pear, M.R., McCammon, J.A. & Karplus, M . (1980) Nature 286, 304-305 Northrup, S.H., Pear, M.R., Morgan, J.D., McCammon, J.A. & Karplus, M. (1981) J. Mol. Biol. 153,1087-1109 Frauenfelder, H. , Petsko, G.A. & Tsernoglou, D. (1979) Nature 280,558-563 Artymiuk, P.J., Blake, C.C.F., Grace, D.E.P., Oatley, S.J., Philips, D.C. & Sternberg, M.J.E. (1979) Nature 280,563-568 Sternberg, M.J.E., Grace, D.E.P. & Philips, D.C. (1979)J.Mol. Biol. 130, 251-253 Northrup, S.H., Pear, M.R., McCammon, J.A., Karplus, M. & Takano, J. (1980) Nature 281, 65 9 -660 van Gunsteren, W.F. & Karplus, M . (1981) Nature 293,677-678 Manavalan, P. & Ponnuswamy, P.K. (1978) Nature 275,673-674 Prabhakaran, M. & Ponnuswamy, P.K. (1980) J . Theor. Biol. 80.485 -504
425 -458
178

19. Ponnuswamy, P.K., Prabhakaran, M. & Manavalan, P. (1980) Eiochim. Biophys. Act0
20. Prabhakaran, M. & Ponnuswamy, P.K. (1980) J. Theor. Biol. 87,623-637
21. Ponnuswamy, P.K. & Bhaskaran, R. (1982) Znt. J. Peptidehotein Res. 19,549-555
22. (313, N., Noguti, T. & Nishikawa, T. (1983) Proc. Natl. Acad. Sci. US 80,3696-3700
23. Brown, K.C., Erfurth, S.C., Small, E.W. & Peticolas, W.L. (1972) Proc. Natl. Acad. Sci.
24. Love, A.E.H. (1929) Treatise on the Mathematical Theory of EQsticity, 4th edn. Cambridge University Press, Cambridge
623,301-316
US69, 1467-1469
Dynamics of globular proteins
25. Mao, B., Pear, M.R., McCammon, J.A. & Northrup, S.H. (1982) Eiopolymers 21, 1979- 1989
26. Bhaskaran, R. & Ponnuswamy, P.K. (1984) Znt. J. PeptideProtein Res. 24,180-191
Address:
Dr. P.K. Ponnuswamy Department of Physics Bharathidasan University Tiruchirapalli 620 023 Tamilnadu India
179


![Differential Regulation of Clathrin and Its Adaptor Proteins during … · Differential Regulation of Clathrin and Its Adaptor Proteins during Membrane Recruitment for Endocytosis1[OPEN]](https://img.pdfslide.us/doc/110x75/5edaa53945e36b503a7c8bfb/differential-regulation-of-clathrin-and-its-adaptor-proteins-during-differential.jpg)

![PIG - enzymes. What are enzymes? [3] 3 of the following: Biological catalysts Globular proteins Increase the rate of (chemical) reaction Complimentary](https://img.pdfslide.us/doc/110x75/551456535503466d1a8b6238/pig-enzymes-what-are-enzymes-3-3-of-the-following-biological-catalysts-globular-proteins-increase-the-rate-of-chemical-reaction-complimentary.jpg)