Embed Size (px)
Citation preview
482 Asia Pac J Clin Nutr 2013;22 (3):482-491
Original Article Dietary intakes consistent with the DASH dietary pattern reduce blood pressure increase with age and risk for stroke in a Chinese population Pao-Hwa Lin PhD1, Wen-Ting Yeh MS2, Laura P Svetkey MHS, PhD1,3, Shao-Yuan Chuang PhD4, Yuan-Chin Chang PhD5, Christine Wang BS1, Wen-Harn Pan PhD2,4 1Division of Nephrology, Department of Medicine, Duke University Medical Center, Durham, NC, USA 2Institute of Biomedical Sciences, Academia Sinica, Taipei, Taiwan, ROC 3Sarah W. Stedman Nutrition and Metabolism Center, Duke University Medical Center, Durham, NC, USA 4Nutrition Medicine Research Program, Division of Preventive Medicine and Health Services Research, Institute of Population Health Sciences, National Health Research Institutes, Taiwan, ROC 5Institute of Statistical Sciences, Academia Sinica, Taipei, Taiwan, ROC
The Dietary Approaches to Stop Hypertension (DASH) diet has been proven to effectively lower blood pressure (BP), and associate with a lower cardiovascular disease and stroke risk in mainly non-Asians. Further, it is un-clear if adhering to the DASH target nutrients has similar BP impact as adhering to the recommended DASH food groups. Associations between adherence to DASH foods or nutrients and BP or stroke risk were assessed in 1420 and 2061 Taiwanese adults from 1989 to 2002, respectively. The DASH food score (p=0.053), dairy (p=0.030) and calcium (p=0.020) intake were significantly and inversely associated with follow up systolic BP change in univariate analyses. Both dairy (p=0.020) and calcium (p=0.001) also showed a consistent inverse as-sociation with systolic BP change in multivariate analysis. None of the factors examined was associated with di-astolic BP change. Both DASH nutrient score and magnesium intakes were significantly associated with the haz-ard ratio (HR) for total stroke in an inverse relationship. The HR of total stroke comparing the highest to the lowest tertile was 0.63 (95% CI: 0.41-0.98, p=0.037) for the DASH nutrient score, and 0.62 (95% CI: 0.40-0.97, p=0.030) for magnesium intake. Similar findings were observed for DASH nutrient score (p=0.011) and magne-sium intake (p=0.043) with the HR for ischemic stroke. The HR for total and ischemic stroke for calcium intake also showed a borderline trend (p=0.071 and 0.051, respectively). In conclusion, adhering to the DASH diet is beneficial for long term BP control and reduction of stroke risk in this Chinese population.
Key Words: dietary pattern, diet, blood pressure, hypertension, stroke INTRODUCTION Hypertension, a major risk factor for cardiovascular dis-ease (CVD) and stroke, is very prevalent in both develop-ing and developed countries alike.1 In 2002, prevalence of hypertension in Taiwan was reported to be approximately 25% in men and 18% in women.2 Although lifestyle in-tervention can be very effective in controlling blood pres-sure (BP), few studies have tested their effectiveness in Asian populations. The Dietary Approaches to Stop Hy-pertension (DASH) dietary pattern has been proven to lower BP in controlled feeding and lifestyle intervention studies in non-Asian populations.3-9 Although no random-ized outcome trials have been conducted, there is some evidence with non-Asian participants that adherence to the DASH dietary pattern is associated with reduced risk of coronary heart disease (CHD) and stroke.10-11 It is un-clear if the BP impact of the DASH dietary pattern differs in Asians living in Asia from Americans living in the United States, as those in Asia have dietary patterns that may differ substantially from that of their Western coun-terparts. Thus, the purpose of this project was to examine
the association between an adherence to the DASH die-tary pattern and future BP change and stroke risk in a prospective cohort of Chinese adults living in Taiwan. Since the original DASH dietary pattern was designed with the goal of reaching certain target nutrients, this pat-tern was later translated into food groups for the public to follow.3 It is unclear if reaching the food group recom-mendation will yield the same BP impact as reaching the nutrient targets. Thus, adherence was assessed in three formats in this study: 1) adherence to the target nutrients Corresponding Authors: Dr Pao-Hwa Lin, Box 3487 DUMC, Durham, NC 27712, USA. Tel: 919-660-6685; Fax: 919-660-8802 Email: [email protected] Dr Wen-Harn Pan, National Health Research Institutes, 35 Key-an Rd., Zhunan, Miaoli 350, Taiwan. Tel: 886-2-037246166-36300; Fax: 886-2-037586261. Email: [email protected] Manuscript received 8 December 2012. Initial review completed 21 January 2013. Revision accepted 13 April 2013. doi: 10.6133/apjcn.2013.22.3.05
DASH Adherence reduces blood pressure and stroke 483
that were based on the original DASH dietary pattern; 2) adherence to the recommended DASH food groups; and 3) adherence to the individual food group or nutrient. METHOD Study design This is a secondary analysis of prospective data collected from the CardioVascular Disease risk FACtor Two-township Study (CVDFACTS). Data collection was con-ducted in Taiwan from 1989 to 2002. Detailed design and main results of the CVDFACTS have been published elsewhere.12-15 In brief, lifestyle, CVD risk factors, medi-cation usage and medical history related to CVD were assessed repeatedly in 3326 participants from five villag-es which were randomly chosen from Chu-Dong town-ship (north-west Taiwan) and Pu-Tzu township (south-west Taiwan). Data collection took place in 5 cycles (1989 to 1990, 1990 to 1993, 1994 to 1997, 1997 to 1999 and 2000 to 2002). Blood and urine samples were also collected. Cycle 1 (1989 to 1990) was considered a pilot and thus cycle 2 (1990 to 1993) was considered the base-line. At the time when CVDFACTS was initiated, Institu-tional Review Board review was not required in Taiwan, however, the study was reviewed and approved by the Department of Health, Executive Yuan and Academia Sinica in Taiwan and followed all the human subject re-quirement issued by the Taiwan government. At the time of cycle 5, the Taiwanese government started to request informed consent, and all participants who participated in cycle 5 provided informed consent. Dietary intake assessment An FFQ was designed for the CVDFACTS to assess die-tary intakes for the previous year. The reproducibility and validity of this FFQ have been examined by comparing results to three 5-day food records.16 The FFQ contained 49 items within eight food groups (milk and dairy, vege-tables, fruits, meats and eggs, grains, legumes and soy-bean products, seafood, beverages/alcohols). Food mod-els for a standard portion size for items on the FFQ were used during assessment to help participants with portion estimation. This FFQ was administered at cycle 2 (base-line) only. The participants rarely took supplements, and if they did, the amount of nutrients provided by supple-ments to the total nutrient intakes was minimal. Inclusion of supplement intake in the analysis did not change over-all results; therefore, nutrient intake from supplements was excluded from the analysis. The estimated intake data was adjusted to 2000 kcal. Calculation of the DASH composite scores Two composite adherence scores were estimated based on the adherence to food groups and nutrients listed in Table 1. The first score was the DASH Food score which com-bines the adherence scores for each of the seven food groups featured in the DASH dietary pattern (Dairy, Fruit, Vegetable, Whole grain, Meat, Sweets, and Nuts/seeds/ legumes). Examples of foods included in each food group include: dairy (milk of any kind, cheese, yogurt), fruit (fresh, frozen, canned, or dried), vegetable (fresh, canned, frozen, roots, peas), whole grain (brown rice, millet, oat-meal), meat (poultry, pork, beef, seafood, fish), sweets
(all sugared snacks and desserts), and nuts/seeds/legumes (nuts, seeds, legume, soy & soy products). The DASH nutrient score combines adherence scores for the five key nutrients targeted in the DASH dietary pattern: saturated fat, dietary fiber, calcium (Ca), potassium (K), and mag-nesium (Mg). The adherence scores for food groups/nutrients that may provide a greater benefit when taken in higher than recommended levels were calculated as: (A – lower target)/(upper target – lower target), where A is the actual consumption level in servings (for food groups) or amounts (for nutrients). Positive foods includ-ed fruits, vegetables, dairy, whole grains, and nuts/seeds/legumes; positive nutrients included dietary fiber, calcium, potassium, and magnesium.
The adherence scores for food groups/nutrients that may not convey a negative impact when taken in higher than recommended levels was calculated as: (lower target - A)/(upper target – lower target). Negative food groups included meat and sweets; negative nutrients included saturated fat.
The lower and upper targets of the nutrients were de-rived from the 1600 and 2000 kcal menu in the original DASH study, respectively.3,17 The lower and upper tar-gets of the food groups were derived from the lower and upper values of the NHLBI recommended ranges.18 For example, the lower and upper targets for dairy was cho-sen to be 2 and 3, respectively, because 2-3 serving per day is the DASH recommended consumption level for someone consuming approximately 2000 kcal/d. The lower and upper targets for calcium were chosen to be 1040 and 1200 mg based on the estimates for 1600 and 2000 kcal in the original DASH study. Thus, meeting the upper target for the positive foods/nutrients or meeting the lower target for the negative foods/nutrients is consid-ered meeting the recommendation level and would yield an adherence score of one. Intakes within the two targets receive proportionally partial points and intakes outside the target ranges may receive negative points or points greater than one. The main rationale for setting the lower and upper targets was not to penalize the participants that reached close to the target levels without meeting the tar-
Table 1. Lower and upper targets of the nutrients and food groups used in the calculation of adherence scores Nutrient or food group Lower target† Upper target Saturated fat, % kcal 4 6 Fiber, g/d 26 30 Potassium, mg/d 4100 4567 Magnesium, mg/d 430 483 Calcium, mg/d 1040 1200 Fruits and juices, serving/d 4 5 Vegetables, serving/d 4 5 Whole grain, serving/d 4 5 Dairy, serving/d 2 3 Meat, serving/d 0 2 Sweets, serving/d 0 0.7 Nuts, seeds & legumes, serving/d 0.6 0.7 †The lower and upper targets of the nutrients were derived from the 1600 and 2000 kcal menu in the original DASH study, re-spectively. The lower and upper targets of the food groups were derived from the lower and higher values of the NHLBI recom-mended ranges.
484 PH Lin, WT Yeh, LP Svetkey, SY Chuang, YC Chang, C Wang and WH Pan
gets exactly. Since it is unclear the degree of adherence that is required to show the same BP impact as observed in the original DASH study, the formula described above allows calculation of relative adherence to the original targets. Further, the calculated scores for each food and nutrient allow estimation of a standardized composite score across all the foods and nutrients. Other measurements Height and weight were measured using standard proce-dures with calibrated statiometer and scale. Blood pres-sure was measured three times after participants were in a seated position for 5 minutes with a standardized sphyg-momanometer for cycles 2 and 3, and with an automatic device for cycle 5 (Omega 1400, Invivo Research Inc, Orlando, Florida, USA). Although BP data collected in cycle 5 with the automatic device was cross-validated with data collected using the standardized sphygmoma-nometer at time of cycle 5 and no significant difference was observed (unpublished data), cycle 5 BP data were not included in this report. At each visit, the mean of the last two measurements were used for this analysis. De-mographic data, lifestyle factors (smoking, alcohol drink-ing status, and physical activity), medical history and medication usage were assessed by questionnaire admin-istered by staff during an interview. An overnight urine specimen was collected from each participant who was instructed to void before going to bed the day prior to the visit. Urine specimens were processed, frozen and later analyzed for creatinine and electrolytes including sodium and potassium by ion selective electrodes using Hitachi
autoanalyzer (Hitachi 7170, Japan). Stroke event ascertainment The incidence of stroke was ascertained from baseline through cycle 5 (December of 2002) and the ascertain-ment protocol was published in a previous report.15 Stroke events occurring before 1996 were self-reported and cross-confirmed by medical records or death certifi-cate. Three sources of information were used to determine the first-ever stroke status and the onset time after 1996. These three sources included death certificate data, insur-ance claim records of the National Health Insurance (NHI) database, and the participant’s self-reported disease histo-ry collected in medical records. A total of 99.5% of the study participants were covered by NHI. A first-ever stroke was defined by any one of the following conditions with codes 430 to 438 from the International Classifica-tion of Diseases, 9th Revision, Clinical Modification (ICD-9-CM): (1) hospitalization claim for ≥ one day; or (2) more than three consecutive outpatient visits to hospi-tals, followed either by claims for various neurological imaging technology (computed tomography, MRI, tran-scranial or carotid Doppler sonography) and long-term prescriptions used for stroke or by claims for rehabilita-tion and the long-term stroke prescriptions. A separate hospital-based case-control study showed that sensitivity and specificity for the rules used above were 100% and 95%, respectively, using data from 508 Ischemic Stroke (IS) patients.19 A total of 123 cases of stroke (97 IS) was identified during the study follow up period. There was a very small number of Hemorrhagic Stroke (HS) cases
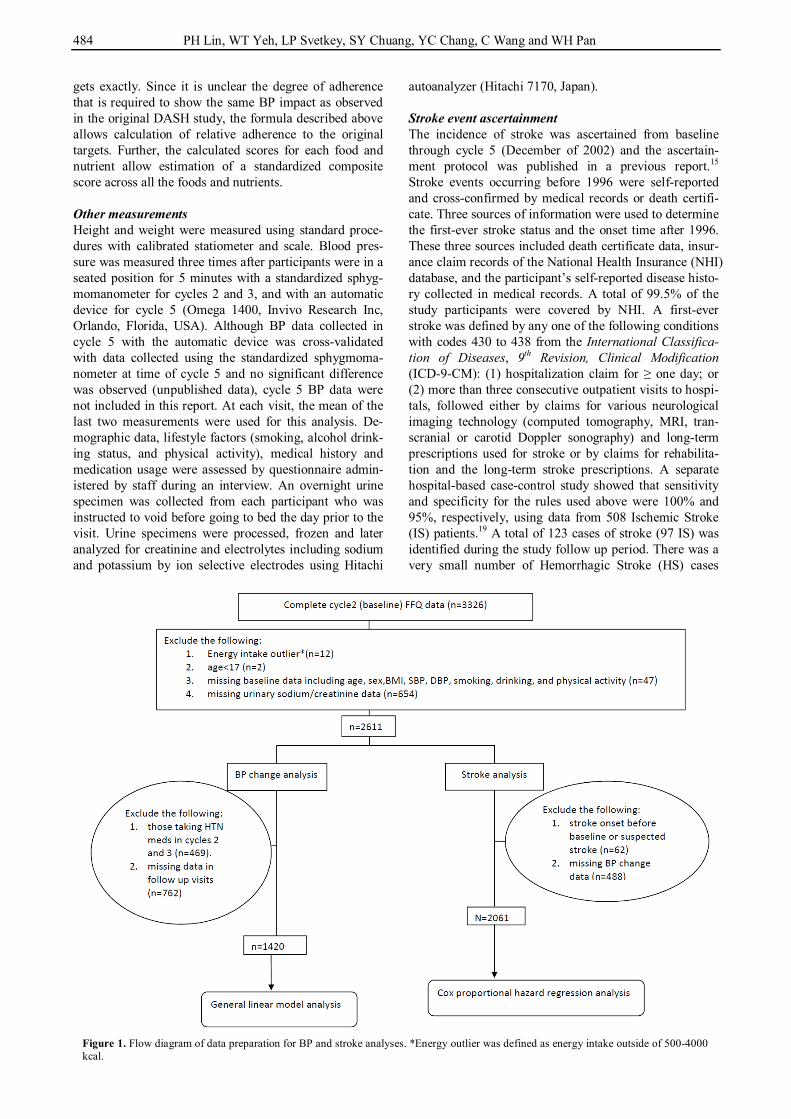
Figure 1. Flow diagram of data preparation for BP and stroke analyses. *Energy outlier was defined as energy intake outside of 500-4000 kcal.
DASH Adherence reduces blood pressure and stroke 485
(n=15), thus HS was not analyzed by itself in this report. Statistical analysis The association of baseline dietary intakes with future BP changes was estimated with general linear models.20 All models included both baseline covariates and potential confounders and were adjusted for sex, follow-up time, weight change, baseline BP, age, BMI, urinary sodi-um/creatinine, smoking status, drinking status, and physi-cal activity. In this report, univariate models were re-ferred to as models where outcome variables were includ-ed one at a time. Multivariable models were models where all the food variables or nutrient variables were included simultaneously in the same model. The associa-tion of baseline dietary intakes with future risk for stroke was analyzed by calculating hazard ratio (HR) using Cox proportional-hazards regression analysis.21 The stroke analysis models were adjusted for sex, baseline age, BMI, urinary sodium/creatinine, smoking status, drinking status,
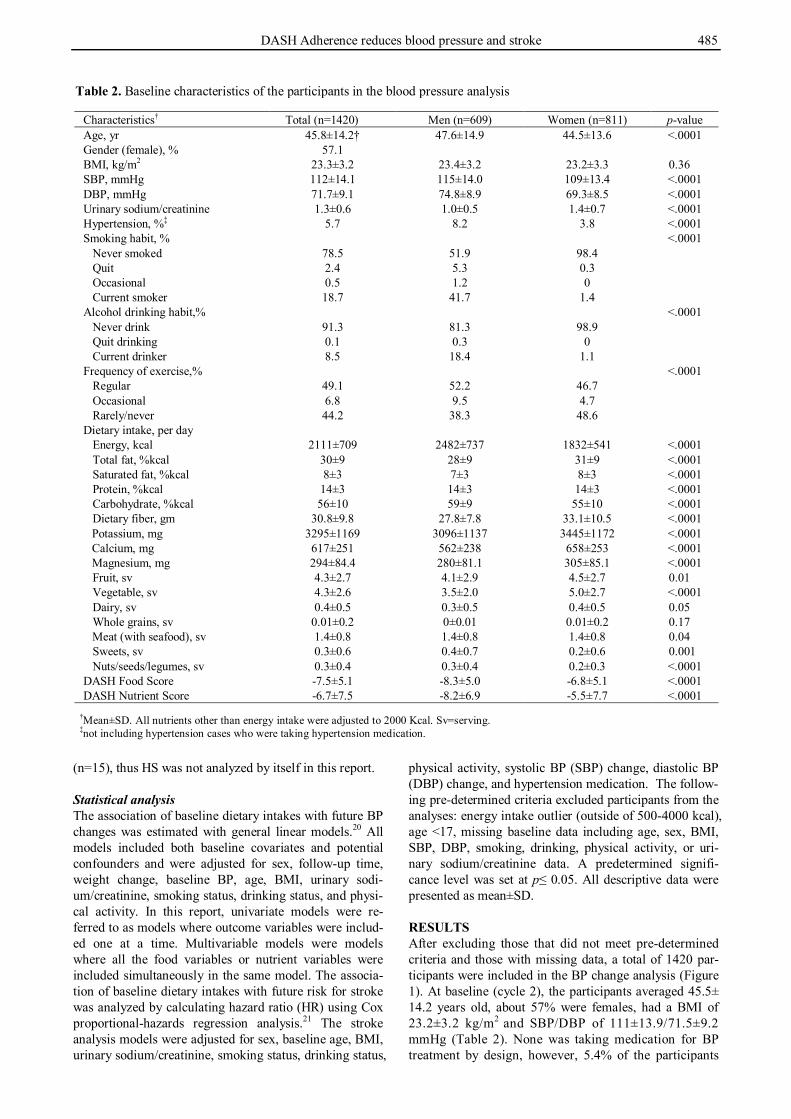
physical activity, systolic BP (SBP) change, diastolic BP (DBP) change, and hypertension medication. The follow-ing pre-determined criteria excluded participants from the analyses: energy intake outlier (outside of 500-4000 kcal), age <17, missing baseline data including age, sex, BMI, SBP, DBP, smoking, drinking, physical activity, or uri-nary sodium/creatinine data. A predetermined signifi-cance level was set at p≤ 0.05. All descriptive data were presented as mean±SD. RESULTS After excluding those that did not meet pre-determined criteria and those with missing data, a total of 1420 par-ticipants were included in the BP change analysis (Figure 1). At baseline (cycle 2), the participants averaged 45.5± 14.2 years old, about 57% were females, had a BMI of 23.2±3.2 kg/m2 and SBP/DBP of 111±13.9/71.5±9.2 mmHg (Table 2). None was taking medication for BP treatment by design, however, 5.4% of the participants
Table 2. Baseline characteristics of the participants in the blood pressure analysis
Characteristics† Total (n=1420) Men (n=609) Women (n=811) p-value Age, yr 45.8±14.2† 47.6±14.9 44.5±13.6 <.0001 Gender (female), % 57.1 BMI, kg/m2 23.3±3.2 23.4±3.2 23.2±3.3 0.36 SBP, mmHg 112±14.1 115±14.0 109±13.4 <.0001 DBP, mmHg 71.7±9.1 74.8±8.9 69.3±8.5 <.0001 Urinary sodium/creatinine 1.3±0.6 1.0±0.5 1.4±0.7 <.0001 Hypertension, %‡ 5.7 8.2 3.8 <.0001 Smoking habit, % <.0001 Never smoked 78.5 51.9 98.4 Quit 2.4 5.3 0.3 Occasional 0.5 1.2 0 Current smoker 18.7 41.7 1.4 Alcohol drinking habit,% <.0001 Never drink 91.3 81.3 98.9 Quit drinking 0.1 0.3 0 Current drinker 8.5 18.4 1.1 Frequency of exercise,% <.0001 Regular 49.1 52.2 46.7 Occasional 6.8 9.5 4.7 Rarely/never 44.2 38.3 48.6 Dietary intake, per day Energy, kcal 2111±709 2482±737 1832±541 <.0001 Total fat, %kcal 30±9 28±9 31±9 <.0001 Saturated fat, %kcal 8±3 7±3 8±3 <.0001 Protein, %kcal 14±3 14±3 14±3 <.0001 Carbohydrate, %kcal 56±10 59±9 55±10 <.0001 Dietary fiber, gm 30.8±9.8 27.8±7.8 33.1±10.5 <.0001
Potassium, mg 3295±1169 3096±1137 3445±1172 <.0001 Calcium, mg 617±251 562±238 658±253 <.0001 Magnesium, mg 294±84.4 280±81.1 305±85.1 <.0001
Fruit, sv 4.3±2.7 4.1±2.9 4.5±2.7 0.01 Vegetable, sv 4.3±2.6 3.5±2.0 5.0±2.7 <.0001 Dairy, sv 0.4±0.5 0.3±0.5 0.4±0.5 0.05 Whole grains, sv 0.01±0.2 0±0.01 0.01±0.2 0.17 Meat (with seafood), sv 1.4±0.8 1.4±0.8 1.4±0.8 0.04 Sweets, sv 0.3±0.6 0.4±0.7 0.2±0.6 0.001 Nuts/seeds/legumes, sv 0.3±0.4 0.3±0.4 0.2±0.3 <.0001 DASH Food Score -7.5±5.1 -8.3±5.0 -6.8±5.1 <.0001 DASH Nutrient Score -6.7±7.5 -8.2±6.9 -5.5±7.7 <.0001
†Mean±SD. All nutrients other than energy intake were adjusted to 2000 Kcal. Sv=serving. ‡not including hypertension cases who were taking hypertension medication.
486 PH Lin, WT Yeh, LP Svetkey, SY Chuang, YC Chang, C Wang and WH Pan
were considered hypertensive. Most of the female partici-pants and half of the males never smoked and most did not drink alcohol regularly. Nearly half of them never or rarely exercised. At baseline, the average dietary intakes of these participants did not meet the DASH recommen-dations for most nutrients and food groups, and, the two composite scores revealed that the participants had vary-ing adherence to the DASH dietary pattern.
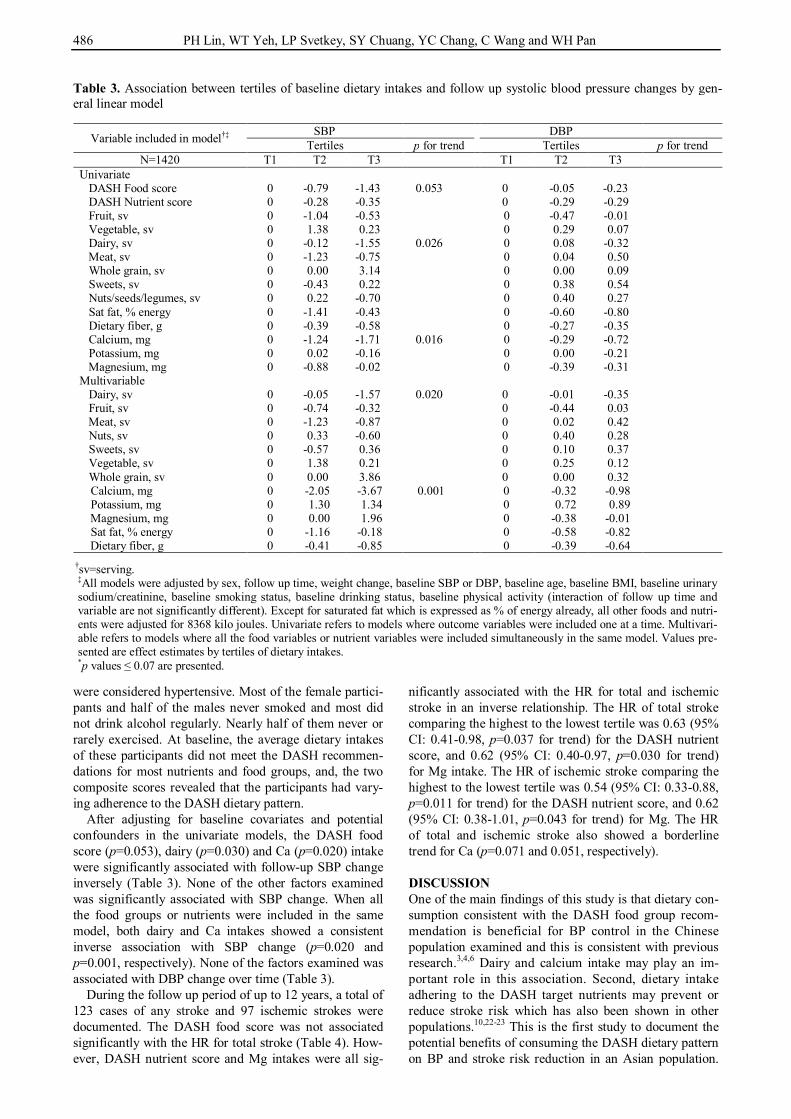
After adjusting for baseline covariates and potential confounders in the univariate models, the DASH food score (p=0.053), dairy (p=0.030) and Ca (p=0.020) intake were significantly associated with follow-up SBP change inversely (Table 3). None of the other factors examined was significantly associated with SBP change. When all the food groups or nutrients were included in the same model, both dairy and Ca intakes showed a consistent inverse association with SBP change (p=0.020 and p=0.001, respectively). None of the factors examined was associated with DBP change over time (Table 3).
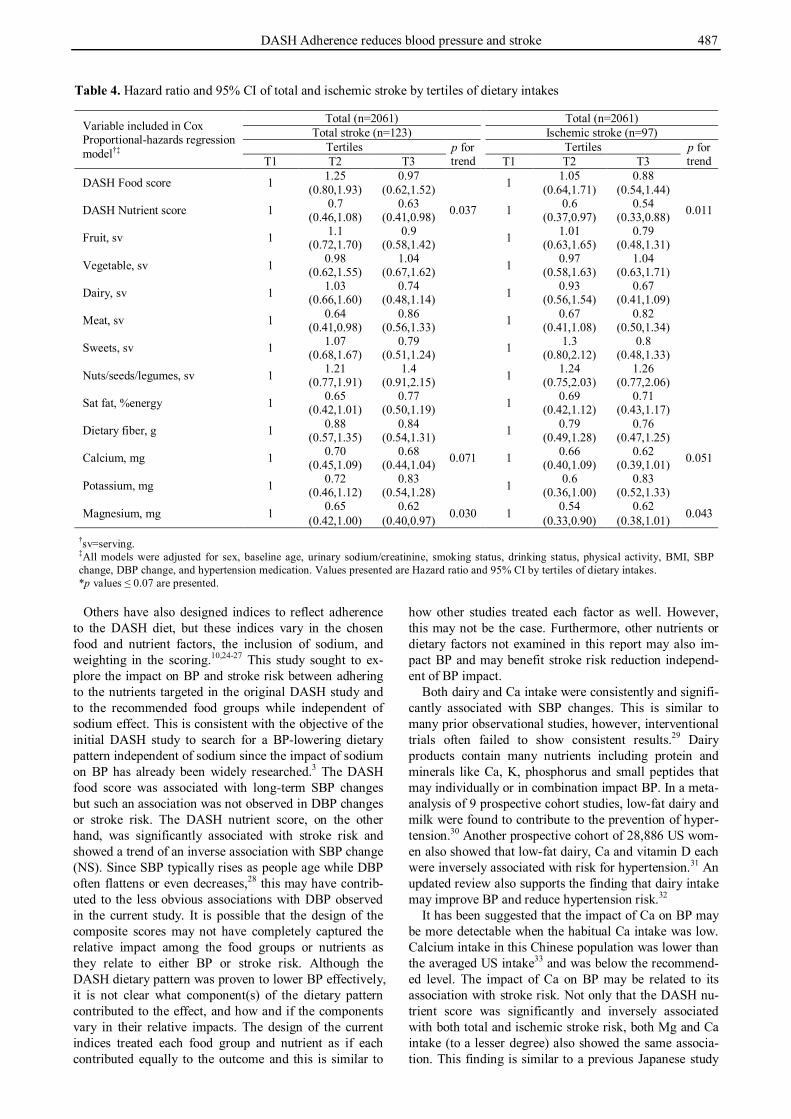
During the follow up period of up to 12 years, a total of 123 cases of any stroke and 97 ischemic strokes were documented. The DASH food score was not associated significantly with the HR for total stroke (Table 4). How-ever, DASH nutrient score and Mg intakes were all sig-
nificantly associated with the HR for total and ischemic stroke in an inverse relationship. The HR of total stroke comparing the highest to the lowest tertile was 0.63 (95% CI: 0.41-0.98, p=0.037 for trend) for the DASH nutrient score, and 0.62 (95% CI: 0.40-0.97, p=0.030 for trend) for Mg intake. The HR of ischemic stroke comparing the highest to the lowest tertile was 0.54 (95% CI: 0.33-0.88, p=0.011 for trend) for the DASH nutrient score, and 0.62 (95% CI: 0.38-1.01, p=0.043 for trend) for Mg. The HR of total and ischemic stroke also showed a borderline trend for Ca (p=0.071 and 0.051, respectively). DISCUSSION One of the main findings of this study is that dietary con-sumption consistent with the DASH food group recom-mendation is beneficial for BP control in the Chinese population examined and this is consistent with previous research.3,4,6 Dairy and calcium intake may play an im-portant role in this association. Second, dietary intake adhering to the DASH target nutrients may prevent or reduce stroke risk which has also been shown in other populations.10,22-23 This is the first study to document the potential benefits of consuming the DASH dietary pattern on BP and stroke risk reduction in an Asian population.
Table 3. Association between tertiles of baseline dietary intakes and follow up systolic blood pressure changes by gen-eral linear model
Variable included in model†‡ SBP DBP Tertiles p for trend Tertiles p for trend
N=1420 T1 T2 T3 T1 T2 T3 Univariate DASH Food score 0 -0.79 -1.43 0.053 0 -0.05 -0.23 DASH Nutrient score 0 -0.28 -0.35 0 -0.29 -0.29 Fruit, sv 0 -1.04 -0.53 0 -0.47 -0.01 Vegetable, sv 0 1.38 0.23 0 0.29 0.07 Dairy, sv 0 -0.12 -1.55 0.026 0 0.08 -0.32 Meat, sv 0 -1.23 -0.75 0 0.04 0.50 Whole grain, sv 0 0.00 3.14 0 0.00 0.09 Sweets, sv 0 -0.43 0.22 0 0.38 0.54 Nuts/seeds/legumes, sv 0 0.22 -0.70 0 0.40 0.27 Sat fat, % energy 0 -1.41 -0.43 0 -0.60 -0.80 Dietary fiber, g 0 -0.39 -0.58 0 -0.27 -0.35 Calcium, mg 0 -1.24 -1.71 0.016 0 -0.29 -0.72 Potassium, mg 0 0.02 -0.16 0 0.00 -0.21 Magnesium, mg 0 -0.88 -0.02 0 -0.39 -0.31 Multivariable Dairy, sv 0 -0.05 -1.57 0.020 0 -0.01 -0.35 Fruit, sv 0 -0.74 -0.32 0 -0.44 0.03 Meat, sv 0 -1.23 -0.87 0 0.02 0.42 Nuts, sv 0 0.33 -0.60 0 0.40 0.28 Sweets, sv 0 -0.57 0.36 0 0.10 0.37 Vegetable, sv 0 1.38 0.21 0 0.25 0.12 Whole grain, sv 0 0.00 3.86 0 0.00 0.32 Calcium, mg 0 -2.05 -3.67 0.001 0 -0.32 -0.98 Potassium, mg 0 1.30 1.34 0 0.72 0.89 Magnesium, mg 0 0.00 1.96 0 -0.38 -0.01 Sat fat, % energy 0 -1.16 -0.18 0 -0.58 -0.82
Dietary fiber, g 0 -0.41 -0.85 0 -0.39 -0.64
†sv=serving. ‡All models were adjusted by sex, follow up time, weight change, baseline SBP or DBP, baseline age, baseline BMI, baseline urinary sodium/creatinine, baseline smoking status, baseline drinking status, baseline physical activity (interaction of follow up time and variable are not significantly different). Except for saturated fat which is expressed as % of energy already, all other foods and nutri-ents were adjusted for 8368 kilo joules. Univariate refers to models where outcome variables were included one at a time. Multivari-able refers to models where all the food variables or nutrient variables were included simultaneously in the same model. Values pre-sented are effect estimates by tertiles of dietary intakes. *p values ≤ 0.07 are presented.
DASH Adherence reduces blood pressure and stroke 487
Others have also designed indices to reflect adherence to the DASH diet, but these indices vary in the chosen food and nutrient factors, the inclusion of sodium, and weighting in the scoring.10,24-27 This study sought to ex-plore the impact on BP and stroke risk between adhering to the nutrients targeted in the original DASH study and to the recommended food groups while independent of sodium effect. This is consistent with the objective of the initial DASH study to search for a BP-lowering dietary pattern independent of sodium since the impact of sodium on BP has already been widely researched.3 The DASH food score was associated with long-term SBP changes but such an association was not observed in DBP changes or stroke risk. The DASH nutrient score, on the other hand, was significantly associated with stroke risk and showed a trend of an inverse association with SBP change (NS). Since SBP typically rises as people age while DBP often flattens or even decreases,28 this may have contrib-uted to the less obvious associations with DBP observed in the current study. It is possible that the design of the composite scores may not have completely captured the relative impact among the food groups or nutrients as they relate to either BP or stroke risk. Although the DASH dietary pattern was proven to lower BP effectively, it is not clear what component(s) of the dietary pattern contributed to the effect, and how and if the components vary in their relative impacts. The design of the current indices treated each food group and nutrient as if each contributed equally to the outcome and this is similar to
how other studies treated each factor as well. However, this may not be the case. Furthermore, other nutrients or dietary factors not examined in this report may also im-pact BP and may benefit stroke risk reduction independ-ent of BP impact.
Both dairy and Ca intake were consistently and signifi-cantly associated with SBP changes. This is similar to many prior observational studies, however, interventional trials often failed to show consistent results.29 Dairy products contain many nutrients including protein and minerals like Ca, K, phosphorus and small peptides that may individually or in combination impact BP. In a meta-analysis of 9 prospective cohort studies, low-fat dairy and milk were found to contribute to the prevention of hyper-tension.30 Another prospective cohort of 28,886 US wom-en also showed that low-fat dairy, Ca and vitamin D each were inversely associated with risk for hypertension.31 An updated review also supports the finding that dairy intake may improve BP and reduce hypertension risk.32
It has been suggested that the impact of Ca on BP may be more detectable when the habitual Ca intake was low. Calcium intake in this Chinese population was lower than the averaged US intake33 and was below the recommend-ed level. The impact of Ca on BP may be related to its association with stroke risk. Not only that the DASH nu-trient score was significantly and inversely associated with both total and ischemic stroke risk, both Mg and Ca intake (to a lesser degree) also showed the same associa-tion. This finding is similar to a previous Japanese study
Table 4. Hazard ratio and 95% CI of total and ischemic stroke by tertiles of dietary intakes
Variable included in Cox Proportional-hazards regression model†‡
Total (n=2061) Total (n=2061) Total stroke (n=123) Ischemic stroke (n=97)
Tertiles p for trend
Tertiles p for trend T1 T2 T3 T1 T2 T3
DASH Food score 1 1.25 0.97 1 1.05 0.88 (0.80,1.93) (0.62,1.52) (0.64,1.71) (0.54,1.44)
DASH Nutrient score 1 0.7 0.63 0.037 1 0.6 0.54 0.011 (0.46,1.08) (0.41,0.98) (0.37,0.97) (0.33,0.88)
Fruit, sv 1 1.1 0.9 1 1.01 0.79 (0.72,1.70) (0.58,1.42) (0.63,1.65) (0.48,1.31)
Vegetable, sv 1 0.98 1.04 1 0.97 1.04 (0.62,1.55) (0.67,1.62) (0.58,1.63) (0.63,1.71)
Dairy, sv 1 1.03 0.74 1 0.93 0.67 (0.66,1.60) (0.48,1.14) (0.56,1.54) (0.41,1.09)
Meat, sv 1 0.64 0.86 1 0.67 0.82 (0.41,0.98) (0.56,1.33) (0.41,1.08) (0.50,1.34)
Sweets, sv 1 1.07 0.79 1 1.3 0.8 (0.68,1.67) (0.51,1.24) (0.80,2.12) (0.48,1.33)
Nuts/seeds/legumes, sv 1 1.21 1.4 1 1.24 1.26 (0.77,1.91) (0.91,2.15) (0.75,2.03) (0.77,2.06)
Sat fat, %energy 1 0.65 0.77 1 0.69 0.71 (0.42,1.01) (0.50,1.19) (0.42,1.12) (0.43,1.17)
Dietary fiber, g 1 0.88 0.84 1 0.79 0.76 (0.57,1.35) (0.54,1.31) (0.49,1.28) (0.47,1.25)
Calcium, mg 1 0.70 0.68 0.071 1 0.66 0.62 0.051 (0.45,1.09) (0.44,1.04) (0.40,1.09) (0.39,1.01)
Potassium, mg 1 0.72 0.83 1 0.6 0.83 (0.46,1.12) (0.54,1.28) (0.36,1.00) (0.52,1.33)
Magnesium, mg 1 0.65 0.62 0.030 1 0.54 0.62 0.043 (0.42,1.00) (0.40,0.97) (0.33,0.90) (0.38,1.01)
†sv=serving. ‡All models were adjusted for sex, baseline age, urinary sodium/creatinine, smoking status, drinking status, physical activity, BMI, SBP change, DBP change, and hypertension medication. Values presented are Hazard ratio and 95% CI by tertiles of dietary intakes. *p values ≤ 0.07 are presented.
488 PH Lin, WT Yeh, LP Svetkey, SY Chuang, YC Chang, C Wang and WH Pan
and may suggest a distinctive impact of Ca on BP and stroke risk in the Asian population.34 A possible explana-tion for this association is the hypotensive effect of Ca34-
36 and/or the potential impact of Ca in reducing plasma cholesterol.37
In addition to Ca, phosphorus from dairy products may have also contributed to the observed relationship be-tween dairy and SBP change. A prospective study with 13,444 participants from the Atherosclerosis Risk in Communities cohort and the Multi-Ethnic Study of Ath-erosclerosis discovered that phosphorus from dairy but not from other sources was significantly associated with lower BP and reduced risk for hypertension.38 However, the potential mechanism of phosphorus in BP regulation is unclear. It is possible that phosphorus may be a surro-gate marker for other factors from dairy that relate to BP but they were not measured.
Although many intervention trials failed to show that Mg supplement reduce BP, several observational studies found Mg intake to be inversely associated with risk for hypertension.29 Serum and dietary Mg were also found to be associated with stroke risk,39,40 but the relationship is not conclusive. It is possible that Mg may benefit stroke risk reduction independent of its potential impact on BP. Animal studies showed that Mg is required for the Na/K-ATPase pump which regulates intracellular Ca, one of the critical determinants of vascular smooth-muscle contrac-tion, and a deficiency of Mg may increase oxidative stress.41 Thus, the relationship between Mg, BP and stroke awaits further studies.
Other nutrients or dietary factors not examined in this study may also have contributed to the stroke risk reduc-tion.40 Dietary fiber,42 folate,15 fruit intake,43 plasma ca-rotenoids, a marker of fruit and vegetable intake,44 and dietary β-carotene and flavonol,45,46 have all been shown to benefit stroke risk reduction. One of the limitations of the current study is that the dietary assessment was con-ducted at baseline only and may not represent intakes over the entire follow up period. It is possible, but unlike-ly, that the majority of participants changed their eating pattern substantially during follow up. In fact, national survey in this country showed no improvement in several nutrients examined in this report during the first few years of follow up from 1993-1996 (total fat, fiber, Ca).47,48 Error in estimating dietary intake with FFQ is another limitation that accompanies with any study using this methodology. However, non-differential misclassifica-tion may underestimate the estimated associations be-tween dietary intakes and BP or stroke risk. Conclusion This study supports that the DASH dietary pattern can be applied in the Chinese population whose typical food selection is very different from that of the US adults. Although this study cannot establish a causal relationship for the nutrients and dietary factors examined with either BP or stroke risk, the current findings are consistent with previous research that dietary intakes consistent with the DASH food group pattern can prevent the rise in BP with age and implies the long term BP benefit of this eating pattern. Furthermore, BP benefit from consuming the DASH pattern, consumption of the target nutrients or
other dietary factors associated with adhering to this pat-tern may benefit the reduction of stroke risk. ACKNOWLEDGEMENT Data collection was supported by the Department of Health in Taiwan (DOH80-27, DOH81-021, DOH8202-1027, DOH83-TD-015, and DOH84-TD-006). AUTHOR DISCLOSURES None. REFERENCES 1. Kearney PM, Whelton M, Reynolds K, Whelton PK, He J.
Worldwide prevalence of hypertension: a systematic review. J Hypertens. 2004;22:11-9. doi: 10.1097/00004872-2004010 00-00003
2. Su TC, Bai CH, Chang HY, You SL, Chien KL, Chen MF et al. Evidence for improved control of hypertension in Taiwan: 1993-2002. J Hypertens. 2008;26:600-6. doi: 10.1097/HJH. 0b013e3282f3b352
3. Appel L, Moore T, Obarzanek E, Vollmer WM. Svetkey LP, Sacks FM et al. A clinical trial of the effects of dietary patterns on blood pressure. N Engl J Med 1997;336:1117-24. doi: 10.1056/NEJM199704173361601
4. Appel LJ, Sacks FM, Carey VJ, Obarzanek, E. Swain JF, Miller ER, 3rd et al. Effects of protein, monounsaturated fat, and carbohydrate intake on blood pressure and serum lipids: results of the OmniHeart randomized trial. JAMA. 2005; 294:2455-64. doi: 10.1001/jama.294.19.2455
5. Conlin PR, Erlinger TP, Bohannon A, Miller ER, III, Appel LJ, Svetkey LP et al. The DASH diet enhances the blood pressure response to losartan in hypertensive patients. Am J Hypertens. 2003;16:337-42. doi: 10.1016/S0895-7061(03)00 056-6
6. Sacks FM, Svetkey LP, Vollmer WM, Appel LJ, Bray GA, Harsha D et al. Effects on blood pressure of reduced dietary sodium and the Dietary Approaches to Stop Hypertension (DASH) diet. DASH-Sodium Collaborative Research Group. N Engl J Med. 2001;344:3-10. doi: 10.1056/NEJM20010104 3440101
7. Blumenthal JA, Babyak MA, Hinderliter A, Watkins LL, Craighead L, Lin PH et al. Effects of the DASH diet alone and in combination with exercise and weight loss on blood pressure and cardiovascular biomarkers in men and women with high blood pressure: the ENCORE study. Arch Intern Med. 2010;170:126-35. doi: 10.1001/archinternmed.2009.4 70
8. Appel LJ, Champagne CM, Harsha DW, Cooper LS, Obarzanek E, Elmer PJ et al. Effects of comprehensive lifestyle modification on blood pressure control: main results of the PREMIER clinical trial. JAMA. 2003;289:2083-93. doi: 10.1001/jama.289.16.2083
9. Svetkey LP, Pollak KI, Yancy WS, Jr, Dolor RJ, Batch BC, Samsa G et al. Hypertension improvement project: randomized trial of quality improvement for physicians and lifestyle modification for patients. Hypertension. 2009;54: 1226-33. doi: 10.1161/HYPERTENSIONAHA.109.134874
10. Fung TT, Chiuve SE, McCullough ML, Rexrode KM, Logroscino G, Hu FB. Adherence to a DASH-style diet and risk of coronary heart disease and stroke in women. Arch Intern Med. 2008;168:713-20. doi: 10.1001/archinte.168.7. 713
11. Chen ST, Maruthur NM, Appel LJ. The effect of dietary patterns on estimated coronary heart disease risk: results from the Dietary Approaches to Stop Hypertension (DASH) trial. Circ Cardiovasc Qual Outcomes. 2010;3:484-9. doi: 10. 1161/CIRCOUTCOMES.109.930685
DASH Adherence reduces blood pressure and stroke 489
12. Yeh CJ, Pan WH, Jong YS, Kuo YY, Lo CH. Incidence and predictors of isolated systolic hypertension and isolated diastolic hypertension in Taiwan. J Formos Med Assoc. 2001;100:668-75.
13. Chen HJ, Bai CH, Yeh WT, Chiu HC, Pan WH. Influence of metabolic syndrome and general obesity on the risk of ischemic stroke. Stroke. 2006;37:1060-4. doi: 10.1161/01. STR.0000206458.58142.f3
14. Chuang SY, Bai CH, Chen WH, Lien LM, Pan WH. Fibrinogen independently predicts the development of ischemic stroke in a Taiwanese population: CVDFACTS study. Stroke. 2009;40:1578-84. doi: 10.1161/STROKEAH A.108.540492
15. Weng LC, Yeh WT, Bai CH, Chen HJ, Chuang SY, Chang HY, Lin BF, Chen KJ, Pan WH. Is ischemic stroke risk related to folate status or other nutrients correlated with folate intake? Stroke. 2008;39:3152-8. doi: 10.1161/STROK EAHA.108.524934
16. Lee MS, Pan WH, Liu KL, Yu MS. Reproducibility and validity of a Chinese food frequency questionnaire used in Taiwan. Asia Pac J Clin Nutr. 2006;15:161-9.
17. Lin PH, Windhauser MM, Plaisted C, Hoben KP, McCullough M, Obarzanek E. The linear index model for establishing nutrient goals in the DASH feeding study. J Am Diet Assoc.1999;99:s40-s4.
18. U.S. Department of Health and Human Services. The DASH Diet. National Institute of health publication No. 98-4082. Bethesda, MD, September 1998.
19. Bai CH, Chen JR, Chiu HC, Pan WH. Lower blood flow velocity, higher resistance index, and larger diameter of extracranial carotid arteries are associated with ischemic stroke independently of carotid atherosclerosis and cardiovascular risk factors. J Clin Ultrasound. 2007;35:322-30. doi: 10.1002/jcu.20351
20. Kleinbaum DG, Kupper LL, Muller KE, Nizam A. Duxbury Press. Applied regression analysis and multivariate methods. 3rd. 1998. ISBN-10: 0534209106, ISBN-13: 978-0534209100
21. Cox D. Regression models and life tables. J R Stat Soc B. 1972;34:187-220.
22. Dauchet L, Kesse-Guyot E, Czernichow S, Bertrais S; Estaquio C; Peneau S et al. Dietary patterns and blood pressure change over 5-y follow-up in the SU.VI.MAX cohort. Am J Clin Nutr. 2007;85:1650-6.
23. Schulze MB, Hoffmann K, Kroke A, Boeing H. Risk of hypertension among women in the EPIC-Potsdam Study: comparison of relative risk estimates for exploratory and hypothesis-oriented dietary patterns. Am J Epidemiol. 2003; 158:365-73. doi: 10.1093/aje/kwg156
24. Obarzanek E, Proschan MA, Vollmer WM, Moore TJ, Sacks FM, Appel LJ, et al. Individual blood pressure responses to changes in salt intake: results from the DASH-Sodium trial. Hypertension. 2003;42:459-67. doi: 10.1161/01.HYP.00000 91267.39066.72
25. Folsom AR, Parker ED, Harnack LJ. Degree of concordance with DASH diet guidelines and incidence of hypertension and fatal cardiovascular disease. Am J Hypertens. 2007;20: 225-32. doi: 10.1016/j.amjhyper.2006.09.003
26. Levitan EB, Wolk A, Mittleman MA. Consistency With the DASH Diet and Incidence of Heart Failure. Arch Intern Med. 2009;169:851-7. doi: 10.1001/archinternmed.2009.56
27. Berz JP, Singer MR, Guo X, Daniels SR, Moore LL. Use of a DASH food group score to predict excess weight gain in adolescent girls in the National Growth and Health Study. Arch Pediatr Adolesc Med. 2011;165:540-6. doi: 10.1001/ archpediatrics.2011.71
28. Wright JD, Hughes JP, Ostchega Y, Yoon SS, Nwankwo T. Mean systolic and diastolic blood pressure in adults aged 18 and over in the United States, 2001–2008. National health statistics reports; no 35. Hyattsville, MD: National Center for Health Statistics; 2011.
29. Lin PH, Batch B, Svetkey LP. Nutrition, lifestyle and hypertension. In: Nutrition in the Prevention and Treatment of Disease. Edited by Coulston AM, Boushey CJ, 2nd ed. San Diego, CA: Academic Press; 2008. pp 551-74.
30. Soedamah-Muthu SS, Verberne LDM, Ding EL, Engberink MF, Geleijnse JM. Dairy consumption and incidence of hypertension. A dose-response meta-analysis of prospective cohort studies. Hypertension. 2012;60:1131-7. doi: 10.1161/ HYPERTENSIONAHA.112.195206
31. Wang L, Manson JE, Buring JE, Lee IM, Sesso HD. Dietary intake of dairy products, calcium, and vitamin D and the risk fo hypertension in middle-aged and older women. Hypertension. 2008;51:1073-9. doi: 10.1161/HYPERTENSI ONAHA.107.107821
32. McGrane MM, Essery E, Obbagy J, Lyon J, MacNeil P, Spahn J, Van Horn L. Dairy Consumption, Blood Pressure, and Risk of Hypertension: An Evidence-Based Review of Recent Literature. Curr Cardiovasc Risk Rep. 2011; 5:287-298. doi: 10.1007/s12170-011-0181-5
33. U.S. Department of Agriculture. Agricultural Research Service. 2012. Total Nutrient Intakes: Percent Reporting and Mean Amounts of Selected Vitamins and Minerals from Food and Dietary Supplements, by Family Income (as% of Federal Poverty Threshold) and Age, What We Eat in America, NHANES 2009-2010. [cited 2013/6/5]Available: www.ars.usda. gov/ba/bhnrc/fsrg.
34. Umesawa M, Iso H, Ishihara J, Saito I, Kokubo Y, Inoue M, Tsugane S, JPHC Study Group. Dietary calcium intake and risks of stroke, its subtypes, and coronary heart disease in Japanese: the JPHC Study Cohort I. Stroke. 2008;39:2449-56. doi: 10.1161/STROKEAHA.107.512236
35. Allender PS, Cutler JA, Follmann D, Cappuccio FP, Pryer J, Elliott P. Dietary calcium and blood pressure: a meta-analysis of randomized clinical trials. Ann Intern Med. 1996; 124:825-31.
36. Iso H, Terao A, Kitamura A, Sato S, Naito Y, Kiyama M et al. Calcium intake and blood pressure in seven Japanese populations. Am J Epidemiol. 1991;133:776-83.
37. Jolma P, Koobi P, Kalliovalkama J, Kahonen M, Fan M, Saha H, Helin H, Lehtimaki T, Porsti I. Increased calcium intake reduces plasma cholesterol and improves vasorelaxation in experimental renal failure. Am J Physiol Heart Circ Physiol. 2003;285:H1882-9.
38. Alonso A, Nettleton JA, Ix JH, de Boer IH, Folsom AR, Bidulescu A, Kestenbaum BR, Chambless LE, Jacobs DR, Jr. Dietary phosphorus, blood pressure, and incidence of hypertension in the atherosclerosis risk in communities study and the Multi-Ethnic Study of Atherosclerosis. Hypertension. 2010;55:776-84. doi: 10.1161/HYPERTENSI ONAHA.109.143461
39. Ohira T, Peacock JM, Iso H, Chambless LE, Rosamond WD, Folsom AR. Serum and dietary magnesium and risk of ischemic stroke: the Atherosclerosis Risk in Communities Study. Am J Epidemiol. 2009;169:1437-44. doi: 10.1093/ aje/kwp071
40. Ascherio A, Rimm EB, Hernan MA, Giovannucci EL, Kawachi I, Stampfer MJ et al. Intake of potassium, magnesium, calcium, and fiber and risk of stroke among US men. Circulation. 1998;98:1198-204. doi: 10.1161/01.CIR. 98.12.1198
41. Touyz RM, Pu Q, He G, Chen X, Yao G, Neves MF, Viel E. Effects of low dietary magnesium intake on development of
490 PH Lin, WT Yeh, LP Svetkey, SY Chuang, YC Chang, C Wang and WH Pan
hypertension in stroke-prone spontaneously hypertensive rats: role of reactive oxygen species. J Hypertens. 2002;20: 2221-32. doi: 10.1097/00004872-200211000-00022
42. Streppel MT, Arends LR, van’t Veer P, Grobbee DE, Geleijnse JM. Dietary fiber and blood pressure: a meta-analysis of randomized placebo-controlled trials. Arch Intern Med. 2005;165:150-6. doi: 10.1001/archinte.165.2.150
43. Johnsen SP, Overvad K, Stripp C, Tjonneland A, Husted SE, Sorensen HT. Intake of fruit and vegetables and the risk of ischemic stroke in a cohort of Danish men and women. Am J Clin Nutr. 2003;78:57-64.
44. Hak AE, Ma J, Powell CB, Campos H, Gaziano JM, Willett WC, Stampfer MJ. Prospective study of plasma carotenoids and tocopherols in relation to risk of ischemic stroke. Stroke. 2004;35:1584-8. doi: 10.1161/01.STR.0000132197.67350. bd
45. Hirvonen T, Virtamo J, Korhonen P, Albanes D, Pietinen P. Intake of flavonoids, carotenoids, vitamins C and E, and risk of stroke in male smokers. Stroke. 2000;31:2301-6. doi: 10. 1161/01.STR.31.10.2301
46. Hollman PC, Geelen A, Kromhout D. Dietary flavonol intake may lower stroke risk in men and women. J Nutr. 2010;140:600-4. doi: 10.3945/jn.109.116632
47. Pan WH, Wu SJ, Yeh CJ, Chuang SY, Chang HY, Yeh NH, Hsieh YT. Diet and health trends in Taiwan: comparison of two nutrition and health surveys from 1993-1996 and 2005-2008. Asia Pac J Clin Nutr. 2011;20:238-50.
48. Wu SJ, Pan WH, Yeh NH, Chang HY. Trends in nnutrient and dietary intake among adults and the elderly: from NAHSIT 1993-1996 to 2005-2008. Asia Pac J Clin Nutr. 2011;20:251-65.
DASH Adherence reduces blood pressure and stroke 491
Original Article Dietary intakes consistent with the DASH dietary pattern reduce blood pressure increase with age and risk for stroke in a Chinese population Pao-Hwa Lin PhD1, Wen-Ting Yeh MS2, Laura P Svetkey MHS, PhD1,3, Shao-Yuan Chuang PhD4, Yuan-Chin Chang PhD5, Christine Wang BS1, Wen-Harn Pan PhD2,4 1Division of Nephrology, Department of Medicine, Duke University Medical Center, Durham, NC, USA 2Institute of Biomedical Sciences, Academia Sinica, Taipei, Taiwan, ROC 3Sarah W. Stedman Nutrition and Metabolism Center, Duke University Medical Center, Durham, NC, USA 4Nutrition Medicine Research Program, Division of Preventive Medicine and Health Services Research, Institute of Population Health Sciences, National Health Research Institutes, Taiwan, ROC 5Institute of Statistical Sciences, Academia Sinica, Taipei, Taiwan, ROC
遵循 DASH 飲食型態降低隨年龄而上升的血壓和中風風
險 DASH 飲食型態(Dietary Approaches to Stop Hypertension)已在非亞裔人群中被證
實能有效降低血壓,並且能減低心血管疾病和腦中風的機率。然而,目前的研
究對於遵循 DASH 飲食型態所建議的食物群或遵循 DASH 營養素是否能達到相
似的降血壓效果尚無結論。本課题分别研究在 1420 和 2061 位台灣成人裏,從
1989 到 2002 年間,有關 DASH 飲食型態的食物群或營養素的依從度與血壓和
中風機率的相關性。依據單一回歸分析,DASH 食物評分(p=0.053),乳製品
(p=0.030)和鈣質(p=0.020)的攝取顯著地和追踪的收缩壓呈負相關。在多元回歸
分析裏,乳製品(p=0.020)和鈣質(p=0.001)也一致地與收缩壓呈現顯著的負相
關。没有任何一種食物或營養素與舒張壓呈顯著關係。DASH 營養素評分和鎂
的攝取與總中風機率呈顯著的負相關。以 DASH 營養素評分而言,與最低的
DASH 營養素評分三分位組別相比,最高組的總中風的風險比率是 0.63(95%CI: 0.41-0.98 ; p=0.037) ,而對鎂攝取量而言則是 0.62(95% CI: 0.40-0.97 ;
p=0.030)。DASH 營養素評分(p=0.011)和鎂攝取(p=0.043)與缺血性中風也有類似
的關係。總中風和缺血性中風與鈣攝取亦呈现邊際的顯著關係(p 值各為 0.071 和
0.051)。總之,對這個華人族羣而言,依從 DASH 飲食型態有助於長期血壓控制
和降低中風的機率。 關鍵字:飲食型態、飲食、血壓、高血壓、中風